
final energy - 2011 -...
12
ENERGY STATISTICS - 2011 CENTRAL STATISTICS OFFICE 23 HIGHLIGHTS 3. Production of Primary sources of Conventional Energy. 3.1 Production of Coal, lignite, crude petroleum, natural gas, & electricity Coal production in the country during the year 2009-10 was 532 million tones(MTs) as compared to 493 MTs during 2008-09, registering a growth of 8%(Table 3.1). The Lignite production during the same period increased by 5%. Considering the trend of production from 1970-71 to 2009-10, it is observed that coal production in India was about 73 MTs during 1970-71, which increased to 532 MTs during 2009- 10, with a CAGR of 5%. During the same period the CAGR of Lignite was about 6%, with production increasing from 3.39 MTs in 1970-71 to 34.07 MTs in 2009-10. Production of crude petroleum increased from 6.82 MTs during 1970-71 to 33.69 MTs during 2009-10, a CAGR of about 4%. The CAGRs for natural gas and electricity were 9.12% and 3.85%, respectively. Natural gas has experienced the highest CAGR among all the conventional sources of energy. For more meaningful comparison in the trends and patterns of growth of different energy resources, it is desirable to convert all the resources to their energy equivalents by applying appropriate conversion factors and express them in energy units (Joules/peta Joules/ Terra joules). The production of energy in peta Joules by primary sources (Table 3.2) shows that Coal and Lignite were the major sources of energy, accounting for about 62% of the total production during 2009-10. Electricity was second (27%), while Natural Gas (11%) was third. The total production of energy from conventional sources increased from 16,046 peta joules during 2008-09 to 16,640 peta joules during 2009-10, showing an increase of 3.7%. 3.2 Production of petroleum products In the year 2009-10, the production of Petroleum Products in the country was 149.65 MTs as against 150.52 MTs during 2008-09, a decline of about 0.6% (Table 3.5). Out of the total domestic production of 149.65 MTs of all types of petroleum products, high speed diesel oil accounted for the maximum share (41%), followed by Fuel Oil (12%), Motor Gasoline (11%), Naphtha (10%). Kerosene (6%) and Aviation Turbine Fuel (5%). Production of Natural Gas increased from 31.75 billion cubic meters (BCM) in 2008- 09 to 46.49 BCM in 2009-10 registering a growth of 46.4% and a CAGR of 11.3% from 1970-71 to 2009-10 (Table 3.6).
-
Upload
hoangxuyen -
Category
Documents
-
view
214 -
download
0
Transcript of final energy - 2011 -...

ENERGY STATISTICS - 2011
C E N T R A L S T A T I S T I C S O F F I C E 23
HIGHLIGHTS
3. Production of Primary sources of Conventional Energy.
3.1 Production of Coal, lignite, crude petroleum, natural gas, & electricity Coal production in the country during the year 2009-10 was 532 million tones(MTs) as compared to 493 MTs during 2008-09, registering a growth of 8%(Table 3.1). The Lignite production during the same period increased by 5%. Considering the trend of production from 1970-71 to 2009-10, it is observed that coal production in India was about 73 MTs during 1970-71, which increased to 532 MTs during 2009-10, with a CAGR of 5%. During the same period the CAGR of Lignite was about 6%, with production increasing from 3.39 MTs in 1970-71 to 34.07 MTs in 2009-10. Production of crude petroleum increased from 6.82 MTs during 1970-71 to 33.69 MTs during 2009-10, a CAGR of about 4%. The CAGRs for natural gas and electricity were 9.12% and 3.85%, respectively. Natural gas has experienced the highest CAGR among all the conventional sources of energy.
For more meaningful comparison in the trends and patterns of growth of different energy resources, it is desirable to convert all the resources to their energy equivalents by applying appropriate conversion factors and express them in energy units (Joules/peta Joules/ Terra joules). The production of energy in peta Joules by primary sources (Table 3.2) shows that Coal and Lignite were the major sources of energy, accounting for about 62% of the total production during 2009-10. Electricity was second (27%), while Natural Gas (11%) was third. The total production of energy from conventional sources increased from 16,046 peta joules during 2008-09 to 16,640 peta joules during 2009-10, showing an increase of 3.7%.
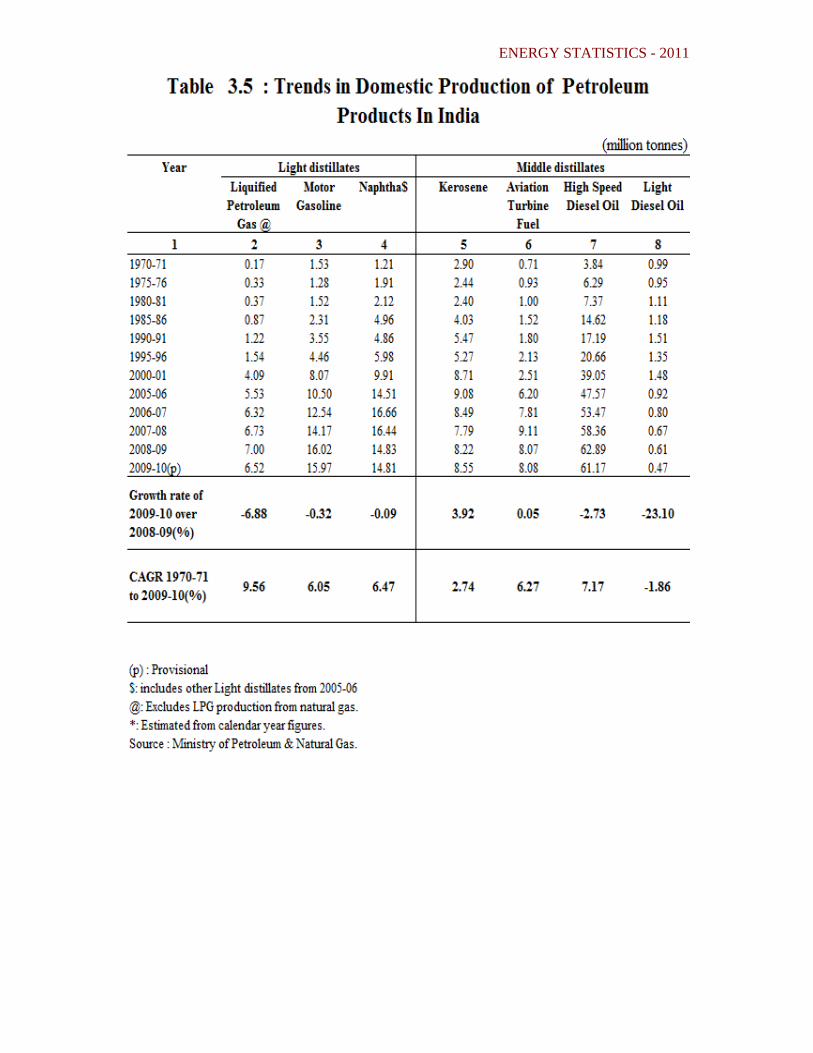
3.2 Production of petroleum products
In the year 2009-10, the production of Petroleum Products in the country was 149.65 MTs as against 150.52 MTs during 2008-09, a decline of about 0.6% (Table 3.5). Out of the total domestic production of 149.65 MTs of all types of petroleum products, high speed diesel oil accounted for the maximum share (41%), followed by Fuel Oil (12%), Motor Gasoline (11%), Naphtha (10%). Kerosene (6%) and Aviation Turbine Fuel (5%).
Production of Natural Gas increased from 31.75 billion cubic meters (BCM) in 2008-09 to 46.49 BCM in 2009-10 registering a growth of 46.4% and a CAGR of 11.3% from 1970-71 to 2009-10 (Table 3.6).

ENERGY STATISTICS - 2011
C E N T R A L S T A T I S T I C S O F F I C E 24
3.3 Generation of electricity
The all India gross electricity generation from utilities, excluding that from the captive generating plants, was 55,828 Giga Watt-Hours (GWh) during 1970-71(Table 3.7). It rose to 1,10,844 GWh during 1980-81, to 2,64,329 GWh during 1990-91 and to 7,96,281 during 2009-10. The CAGR during the period from 1970-71 to 2009-10, has been an impressive 6.9%. The production of electricity from utilities has increased from 7,45,626 MWh during 2008-09 to 7,96,281 MWh during 2009-10, registering an annual growth rate of about 6.8%.
Total Electricity generation in the country, from utilities and non-utilities, during 2009-10 was 9,05,974 GWh. Out of this 6,70,965 GWh was generated from thermal and 1,06,680 GWh was from hydro and 18,636 GWh was generated from nuclear sources. Total output from non-utilities was 1,09,693 GWh.

ENERGY STATISTICS - 2011
C E N T R A L S T A T I S T I C S O F F I C E 25

ENERGY STATISTICS - 2011
C E N T R A L S T A T I S T I C S O F F I C E 26

ENERGY STATISTICS - 2011
C E N T R A L S T A T I S T I C S O F F I C E 27
Figure 3.2
Figure 3.2(A)
1,59
8 2,49
3
4,06
3
5,72
7 7,00
9 8,24
5 8,888
286
440
1,38
3
1,35
8
1,34
8
1,40
3
1,41
1
56
91 69
3 1,13
5
1,24
0
1,26
5
1,83
0
996 1,
784 2,80
0
3,28
6
4,76
3
5,133
4,51
1
‐
1,000
2,000
3,000
4,000
5,000
6,000
7,000
8,000
9,000
10,000
1970‐71 1980‐81 1990‐91 2000‐01 2005‐06 2008‐09 2009‐10(p)
Petajoules
Trends in Production of Energy in India by Primary Sources from 1970‐71 to 2009‐10
Coal & Lignite Crude Petroleum Natural Gas Electricity (Hydro & Nuclear)
4.38 4.07
9.11
3.85
012345678910
Coal & Lignite Crude Petroleum Natural Gas Electricity (Hydro & Nuclear)
Percen
tages
Compound Annual Growth Rate of Production of Energy in India by Primary Sources from 1970‐71 to 2009‐10

ENERGY STATISTICS - 2011
C E N T R A L S T A T I S T I C S O F F I C E 28

ENERGY STATISTICS - 2011
C E N T R A L S T A T I S T I C S O F F I C E 29
ENERGY STATISTICS - 2011
C E N T R A L S T A T I S T I C S O F F I C E 30

ENERGY STATISTICS - 2011
C E N T R A L S T A T I S T I C S O F F I C E 31

Liquified
Petroleum2%
d Petroleum Gas 4%
Fuel oil12%
m Coke%
Bitumen3%
Distrib
Others6%
ution of D
To
Fig
Mot
High S
omestic Pin India d
otal Productio
gure 3.5
tor Gasoline11%
Speed Diesel Oil41%
roduction during 200
on = 149.66 M
ENER
Naphtha10%
Ke
of Petrole09‐10
Million Tonne
RGY STATI
rosene 6%
Av
eum Produ
STICS - 201
viation TurbineFuel5%
ucts
11
e

ENERGY STATISTICS - 2011
C E N T R A L S T A T I S T I C S O F F I C E 33

ENERGY STATISTICS - 2011
C E N T R A L S T A T I S T I C S O F F I C E 34


![®É−]ÅÉÒªÉãÉäJÉɺÉÉÆÉÎJªÉBÉEÉÒmospi.nic.in/sites/default/files/reports_and_publication/cso... · ii FOREWORD This issue of National Accounts Statistics (NAS),](https://static.fdocuments.net/doc/165x107/5ace71087f8b9ac1478bb392/-foreword-this-issue-of-national-accounts-statistics-nas-presents-the-estimates.jpg)


