Final Director Reports 2017-2018 9 6 18 · RA M S VENKA AKANKSHA BIJAWAT STATE BANK OF INDIA ERNST...
92
Transcript of Final Director Reports 2017-2018 9 6 18 · RA M S VENKA AKANKSHA BIJAWAT STATE BANK OF INDIA ERNST...


4 5
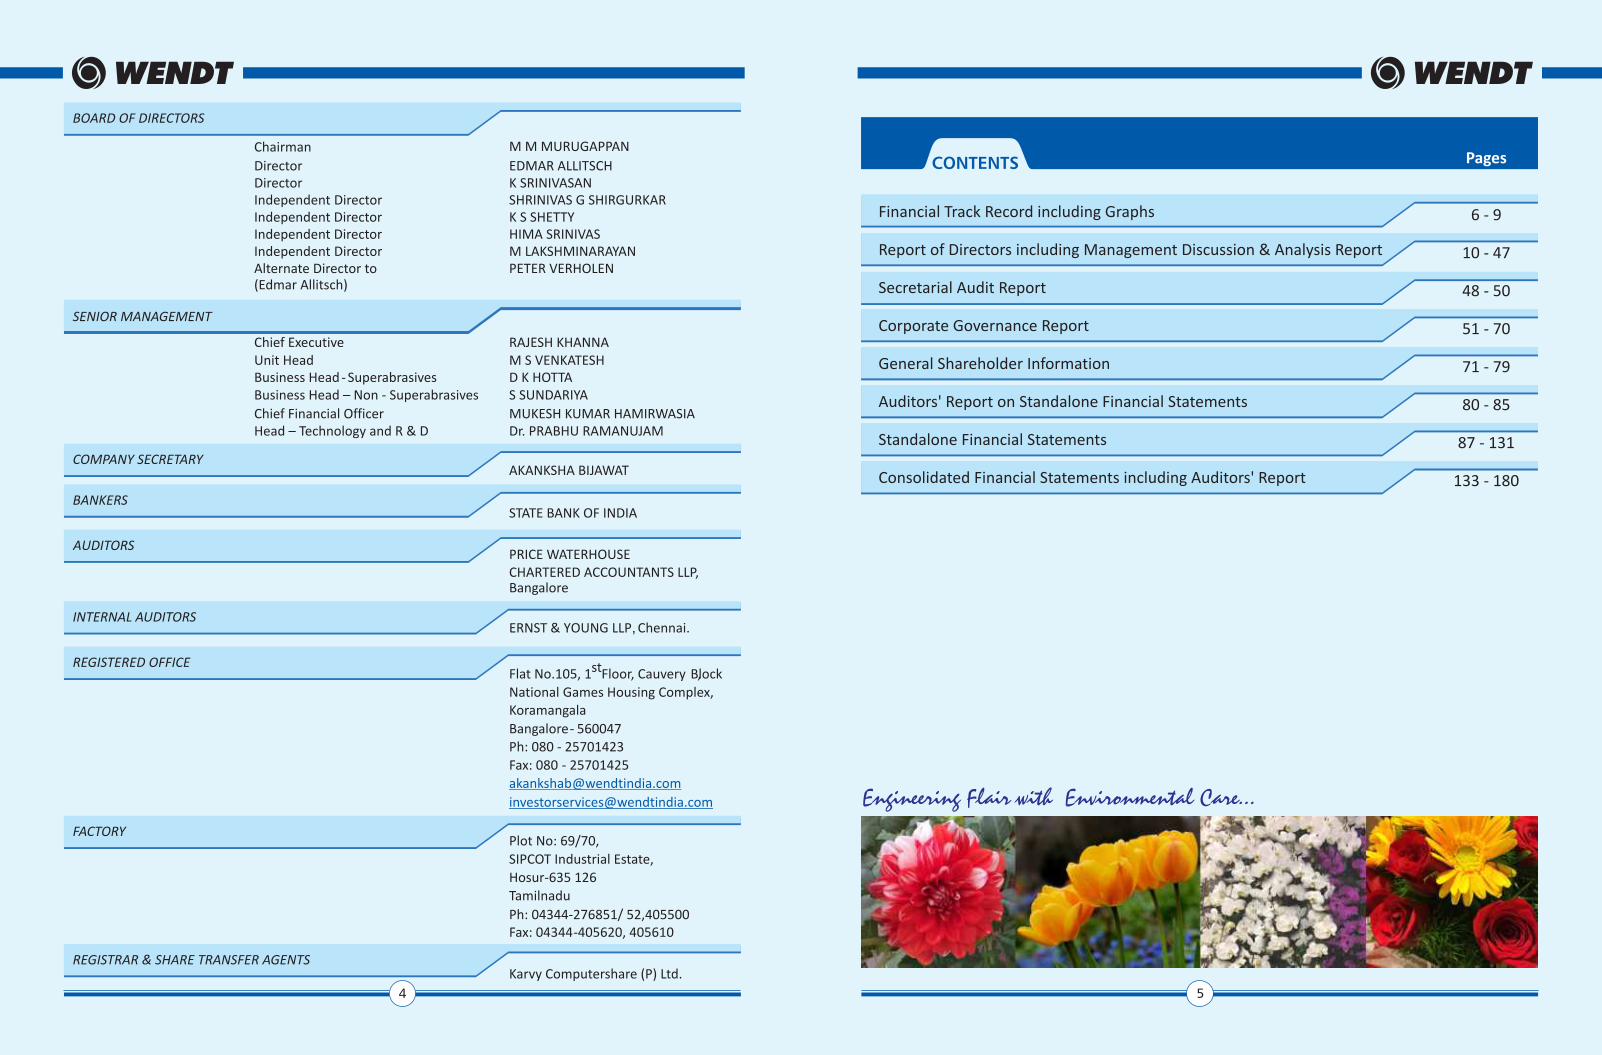
CONTENTS
Financial Track Record including Graphs 6 - 9
Report of Directors including Management Discussion & Analysis Report 10 - 47
Secretarial Audit Report 48 - 50
Corporate Governance Report 51 - 70
General Shareholder Information 71 - 79
Auditors' Report on Standalone Financial Statements 80 - 85
Standalone Financial Statements 87 - 131
Consolidated Financial Statements including Auditors' Report 133 - 180
Pages
INTERNAL AUDITORS
AUDITORS
Bangalore
PRICE WATERHOUSECHARTERED ACCOUNTANTS LLP,
M M MURUGAPPAN
EDMAR ALLITSCH K SRINIVASANSHRINIVAS G SHIRGURKAR K S SHETTYHIMA SRINIVASM LAKSHMINARAYANPETER VERHOLEN
AKANKSHA BIJAWAT
STATE BANK OF INDIA
ERNST & YOUNG LLP, Chennai.
Flat No.105, 1st Floor, Cauvery Block, National Games Housing Complex, Koramangala
Bangalore - 560047 Ph: 080 - 25701423
Fax: 080 - 25701425 [email protected]
Plot No: 69/70,
SIPCOT Industrial Estate, Hosur-635 126 Tamilnadu Ph: 04344-276851/ 52,405500 Fax: 04344-405620, 405610
Karvy Computershare (P) Ltd.
BOARD OF DIRECTORS
SENIOR MANAGEMENT
RAJESH KHANNAM S VENKATESHD K HOTTABusiness Head - Superabrasives
Chief Executive
(Edmar Allitsch)
Independent Director
Chairman
Director Director Independent Director Independent DirectorIndependent Director
Alternate Director to
Unit Head
COMPANY SECRETARY
BANKERS
REGISTERED OFFICE
FACTORY
REGISTRAR & SHARE TRANSFER AGENTS
S SUNDARIYABusiness Head – Non - Superabrasives
MUKESH KUMAR HAMIRWASIAChief Financial OfficerDr. PRABHU RAMANUJAMHead – Technology and R & D

76
Rs. in Lakhs
Year ending 31st March 2009 2010 2011 2012 2013 2014 2015 2016 2017 2018
Net sales 5136 5609 8173 10001 8895 9449 10560 11655 12779 12685
Domestic sales 3389 4368 6727 8055 7176 7110 7890 8354 9760 8828
Export sales 1747 1241 1446 1946 1719 2339 2670 3301 3019 3857
Other Income 309 222 299 278 225 611 800 648 543 685
Profit before depreciation 1517 1714 2654 2888 1930 2098 2556 2335 2534 2668
Profit before tax 1297 1455 2356 2552 1528 1640 1764 1499 1570 1651
Profit after tax 884 983 1595 1729 1012 1187 1485 1041 1169 1230
Dividend % 200 250 250 250 150 250 250 250 250 250
EPS (Rs.) 44.21 49.12 79.76 86.45 50.59 59.34 74.24 52.06 58.47 61.49
Fixed assets 2610 2950 3264 4363 5027 5510 5608 6060 6078 5595
Investments 1200 1672 2257 1370 1496 1703 1866 1360 1502 2229
Net current assets 858 413 531 1532 1485 1505* 2047* 1505* 3077* 3233*
Non- current assets - - - - - - - 470 339 338
Total assets 4668 5035 6052 7265 8008 8718 9521 9395 10996 11395
Paid up share capital 200 200 200 200 200 200 200 200 200 200
Reserves 4203 4602 5614 6762 7425 8031 8790 9544 10043 10707
Loan funds 36 - - - - - - - - -
Non- current liability - - - - - - - 127 187 91
Deferred tax liability 229 233 238 303 383 487 531 553 566 397
Total funds 4668 5035 6052 7265 8008 8718 9521 10424 10996 11395
* Net current assets is arrived after reducing current liabilities, long term liabilities and provisions from current assets(excluding current investments) and long term loans and advances for 2013, 2014 and 2015
Note : 2016, 2017 and 2018 figures are as per IND AS
REVENUE
PROFITABILITY
ASSETS EMPLOYED
CAPITAL STRUCTURE
DOMESTIC SALES EXPORT SALESNET SALES
Year
0
2000
4000
6000
8000
10000
14000
12000
SALES GRAPH
15 16 172014 2018
944910560
7110
23392670
7890
12779
9760
3019
11655
8354
3301
12685
8828
3857
Sale
s R
s in
Lakh
s
PBT
0
1000
1200
1400
1800
1600
2000 40 30 4
800
200
600
400
Year
PBT as a % to Sales PAT as a % to SalesPAT
2014 1615 17 2018
10
20
25
30
35
0
15
5
Dividend / Share
Year
Dividend Yield %
5
10
15
20
25
0
1
2
3
02014 15 16 17 2018
Div
iden
d Y
ield
%
Div
iden
d R
s / s
hare 25
2
25 25 25 251640
9
1413
1187
1570
11691041
17
1499
1764
1485
17
9
12
10
1651
1230
1313
PROFITABILITY GRAPH DIVIDEND PAYOUT AND YIELD
(Rs in
Lakh
s)
1 1 1 1
0%
5%
10%
15%
20%
25%
ROCE & ROE %
ROEYear
2014 15 16 17
EMPLOYEE & SALES PER EMPLOYEE
No of Employees
Year
Nu
mb
er
of
Em
plo
yees
Sales / Employee (Rs. in lakhs)
350
450
400
0
50
100
150
Sale
s/E
mp
( R
s in
Lakh
s)
10
15
20
40
50
45
2014 15 16 20182018 17
5
0
ROCE
250
300
20025
30
35296314
338370
33.63 34.48 34.54
21%21%
14%
17%
11%
16%
11% 11%
31.92
399
31.79
%
16% 16%
CAGR
Net Sales - 8%
Domestic sales - 6%
Export Sales - 13%

98
Raw Material Consumed 31% Employees Cost 19% Depreciation 8% Other Operating Expenses 30%
Income Tax 3% Dividend 4% Retained Earnings 5%
DISTRIBUTION OF REVENUE 2017 - 18
Raw Material Consumed 31%
Employees Cost 19%Depreciation 8%
Other Operating.Expenses 30%
Income Tax 3% Retained Earning 5% Dividend 4%
Raw Material Consumed 33% Employees Cost 18% Depreciation 7% Other Operating Expenses 31%
Income Tax 3% Dividend 4%Retained Earnings 4%
DISTRIBUTION OF REVENUE 2016 - 17
Raw Material Consumed 33%
Employees Cost 18%Depreciation 7%
Other Operating.Expenses 31%
Income Tax 3% Retained Earning 4% Dividend 4%
INVENTORY TURNOVER (DAYS)
Average Inventory (Rs. in lakhs)
Year
Avera
ge In
ven
tory
(R
s. In
lakh
s)
Inventory Turnover (Days)
Inven
tory
Tu
rno
ver
(Days)
2014 15 16 201817
1000
1400
2000
2200
1800
1600
1200
0
200
400600
800
20
10
30
40
50
60
70
80
90
100
0
1860
57
15991716
1469
57 54
1816
5255 54
FIXED ASSET TURNOVER (TIMES)
Average Fixed Assets
Year
Avera
ge F
ixed
Assets
(R
s. In
lakh
s)
Fixed Assets Turnover (Times)
Fix
ed
Asset
Tu
rno
ver
(Tim
es)
2014 15 16 2018170
1000
2000
3000
4000
5000
6000
7000
3
4
5
22 2 2
52695559
58306069
2
1
2
0
RECEIVABLE TURNOVER (DAYS)
Average Receivables
Year
Average Receivables Turnover (Days)
Avera
ge R
eceiv
ab
le T
urn
over
(Days)
2014 15 16 201817
20
10
30
40
50
60
70
80
100
90
0
672000
2500
325030002750
2250
0
10001250
250500750
15001750
19692066
2509
64
75
2890
8390
3128
Avera
ge R
eceiv
ab
les (
Rs. In
lakh
s)
5837
MARKET CAPITALIZATION (Rs.CRORES)
Market Price (In Rs.)
Year
Market Capitalization (In Crores)
Mark
et
Cap
italiza
tio
n (
Rs.in
Cro
res)
2014 15 16 201817
100
300
600
700
0
200
400
500
0200
1000800
12001400160018002000
2600
22002400
Mark
et
Pri
ce (I
n R
s.)
400600
1123
1702
225
340 348
17401900
380
2433
487
EARNINGS PER SHARE (In. Rs.)
Earnings Per Share (in Rs.)
Year
2014 15 16 201817
50
70
100
90
80
60
0
10
20
30
40
Earn
ing
s p
er
sh
are
(I
n R
s.)
59.34 58.47
74.24
52.0661.49
CAGR MarketCapitalization-21%

COMPANY PERFORMANCE OVERVIEW
RESULTS OF OPERATIONS
Your company achieved a Top line of Rs.12685 Lakhs, compared to Rs.12779 Lakhs (net) during the previous year. While On the export front, we have achieved an appreciable growth of 28%, with increase in demand from major countries like China, UK, Russia, Thailand, Korea, Indonesia, Singapore, etc. However, the domestic business has seen a de-growth because of shrinkage in demand in some of the markets. The major contributory industry segments in the domestic business which had their adverse impact on your company's sales are Defense, Steel, Cutting Tools, Engineering Sector.
Your Company continued its efforts on pursuing business in its major verticals namely Super abrasives and Machines and Components. The current slowdown being considered temporary and in keeping with your Company's long-term growth, would continue to commit the required investments and resources in identified growth areas.
The Super Abrasives business vertical consisting of Diamond/CBN grinding Wheels in various bonding systems, Rotary Dressers, Stationary Dressers, Hones and Segmented products witnessed a growth of 4% over the last year mirroring the growth of the key industrial segments. This has been possible due to continued focus by your Company on the development of new products and new applications. Your company successfully launched new products such as Glass grinding wheel for Structural, Solar and Automotive Glass, Resin Bond Spiral CBN Wheels for Razor Blade grinding, Double Disc Fine grinding Wheels for certain Ceramic, Automotive and Engineering applications. During the year company launched Standard products under Star Brand.
The Machines and Components business performance was lower than previous year mainly due to softening of demand on
Components from certain Auto Component manufacturers. While Machine sales in the export market achieved an impressive growth of 63%. The domestic sector faced brunt of Capex postponement/ Capex freeze resulting in lower machine sales during the year. However, your company continued to develop & launch new models / variants like Twin Spindle Honing Machine (E3500), Straight Wheel Head Cylindrical Grinding Machine (Precigrind) and CNC Profile Dressing Machine (PDM 400). These Machines have been received well by the customers, and the company expects to get good business in coming years.
On the Precision Components front, your Company has successfully
REPORT OF THE DIRECTORS
(Including Management Discussion and
Analysis)
TO THE MEMBERS OF WENDT INDIA LTD
The Board of Directors have pleasure in
presenting the 36th Annual Report of the
Company together with the Audited
Financial Statements for the year ended
31st March 2018. The Management
Discussion & Analysis Report which is
required to be furnished as per SEBI (Listing Obligations and Disclosure Requirements) Regulations 2015 has been
included in the Directors Report to avoid duplication and
repetition.
According to the International Monetary Fund (IMF), the
global economy is experiencing a near synchronous recovery.
Roughly three-quarters of the countries experienced
improvements in their growth rates. The recovery is driven by
improvement in world trade in goods and services, upswing
in commodity prices, accommodative monetary policies in
advanced regions, buoyant demand conditions, etc.
However, there are geopolitical and geo-economics risks due
to war in the Korean peninsula; political upheaval in the
Middle East; aggressive output cuts by Saudi Arabia (and Russia) which
could force oil prices even higher; China's unprecedented credit surge in
the form of capital controls, and trade tension.
India can be rated as among the best performing economies in the world
as the average growth during the last three years being around 4
percentage points higher than global growth and nearly 3 percentage
points higher than that of Emerging Market and Developing Economies.
The Indian Government underlines that due to the launch of
transformational Goods and Services Tax (GST) reform on July 1, 2017,
resolution of the long-festering Twin Balance Sheet (TBS) problem by
sending the major
stressed companies for
resolution under the new Indian Bankruptcy Code, implementing a
major recapitalization package to strengthen the public sector
banks, further liberalization of FDI and the export uplift from the
global recovery, the economy began to accelerate in the second
half of the year. The Central Statistics Office (CSO) has estimated
the GDP growth to be 6.5% in 2017-18. Also, India improved its
ranking by 30 spots on the World Bank's Ease of Doing Business
rankings.
ECONOMIC OVERVIEW
1110
(Rs in Lakhs)
FY 2017- 2018 FY 2016- 2017
Sales
Other Income
Profit Before Tax
Profit After Tax 1,230 1,
Earnings per Share - Rs
12,685 12,779
685 543
1,651 1,570
169
61.49 58.47
GST Go Live

completed and added new components for both existing and new customers. These components have received the final approval for the bulk supplies during the fourth quarter. Your company also focused on de-risking & enhancing the product basket by adding components for Non-Auto Industry, and Non – Ferrous components. These initiatives have started yielding results and is expected to contribute exponentially to the overall precision component business in coming years.
Your company continues to drive Lean Practices in both Manufacturing and Support functions for improving
operational efficiency. This initiative has benefitted in addressing some of the key areas like Productivity & Process improvement, Effective planning & Scheduling, improving Reliability of Delivery, maintaining outsourcing cost, controlling cost on Consumables, WIP and Raw material inventory.
One of the key focus of your company has also been on Sweating of the assets and thereby ensuring effective utilization, reducing dependency on sub-contracting for core processes and working round the clock or 3 Shifts basis for major product group. Your company has taken special initiative to reduce overall cost in value chain by re-allocating common machines and facilities of all product cells and doing all precision machining internally, while outsourcing only Non-Precision machining. This also helped in having a control on capex spend.
Super Abrasive Tooling Industry and Grinding & Honing Machine Industry performance is driven by GDP growth, with major demand primarily coming from Auto, Engineering sector, Steel, Glass and Cutting Tools industry. Besides this with the emergence of Aerospace, Defence and Infrastructure sector, Tooling & Machine Tool Industry is expected to benefit this industry immensely.
Further, The Make in India initiative, too is expected to propel requisite growth in coming years.
Your company continues its focus on product and process innovation for delivering superior performances and sustainable growth. Adoption and deployment of appropriate technologies for indigenous Bond development, streamlining processes, introducing automation in critical areas and working on industry 4.0 would also be the key focus areas for the year to address the growth for your Company.
The Company would continue to seize new business opportunities in new growing industrial segments by
FOCUS ON PROCESS EFFICIENCY
FUTURE PROSPECTS
12 13
addressing New Products for existing & new Markets and geographies.
Future growth of your company lies in constantly watching and monitoring changes in the external environment and customer needs that are emerging. Accordingly, your company has been tracking the Mega trends and underlying new opportunities that unfolds. The company accordingly, would continue focusing on new products for industry segments such as Construction, Aerospace, Defense, Infrastructure and allied industries. Your company would fully complement these efforts and maximize the benefits by participation in major national and international exhibitions, trade shows, including digital initiatives and collaborations.
The acquisition of Winterthur Technology Group (WTG) by the US multinational 3M Corporation and resultant indirect acquisition of 40% equity shareholding in your Company continues to be a matter of contention while not being an issue. The matter has been moved to The National Company Law Tribunal (NCLT), Bangalore and matter remains sub-judice.
Wendt Grinding Technologies Limited, Thailand
Your company's 100% owned Thailand subsidiary, Wendt Grinding Technologies Limited, has yet again delivered sustained results in line with the plan both in terms of sales and profitability, despite continued industry slowdown, falling export and political issues and all odds. It is a demonstration of its strong resolve and business acumen challenging the unfavorable conditions.
During the year, your subsidiary achieved sales of Thai Baht 946 Lakhs (Rs.1844 Lakhs), 12% growth over last year. Profit After Tax of Thai Baht 141 Lakhs (Rs.283 Lakhs), a creditable
growth of 32% over last year.
Your subsidiary maintained its dominant position in re-profiling business in Thailand for glass industry with its 70% share of business, where it operates. The subsidiary, during the year, focused on exploring new opportunities in Indonesia market. The focus on enhancing the product basket, new customer additions, etc. have yielded good results.
Your subsidiary continues to participate in the important Industrial and Trade Exhibitions & prospecting for new businesses, while strengthening networking with industry leaders for business promotion and development.
Wendt Middle East FZE, Sharjah, the other wholly owned
subsidiary of your company, has clocked an annual sale of
AED 23 Lakhs (Rs.412 Lakhs) which is 8% lower than the
previous year. The lower topline is attributable to the
continuing oil crisis, political disturbance and a slowdown
in new projects in the region. Also, due to the worsening
credit situation in the Middle East, the subsidiary has been
cautious in growing the topline. Accordingly, the Profits
have also been lower at AED 0.4 Lakhs (Rs.7 Lakhs).
SUBSIDIARY COMPANIES
Wendt Middle East FZE, Sharjah

During the year, your subsidiary has embarked on strategic initiatives to consolidate and grow its business with
focus on industrial ceramic products and non-standard abrasive and super abrasive products. The subsidiary's
increased focus on these strategic initiatives with robust receivables management is expected to deliver results in the
coming year.
Inclusive growth and Sustainable Community development are strong pillars of your Company's responsible corporate citizenship. Your Company being a part of the Murugappa Group has been upholding this tradition by allocating a part of its income for carrying out its social responsibilities.
Your company's Skill Development Program has been a major initiative towards addressing the social responsibility. The main objective being to provide high quality vocational and technical training towards uplifting the lives of young children from underprivileged community and weaker sections of the society. This training program is designed based on the coaching methodology defined by Government of India, Ministry of Skill Development and Entrepreneurship. This program also includes stipend payment along with free meals and providing boarding facilities to the enrolled students, ensuring that they earn while they learn. Not only does this initiative help in imparting formal education, but also helps them in honing them to become a valuable citizen &
while help them in seeking gainful employment upon successful completion of the course.
The company continues to make contributions to the society extending to communities in its vicinity like to local schools, orphanages, homes for destitute, etc. This is based on your company's firm belief that an organization's true value lies beyond its business and is reflected by the services it extends to the society. Your company also gives importance to green environment and tree plantation in the nearby communities by holding seminars, educating and distributing and planting free saplings every year.
The company employees are encouraged to participate in activities
APPROPRIATIONS
CORPORATE SOCIAL RESPONSIBILITY
like blood donation camps, taking classes on computer education in municipality schools, bring awareness on road safety, nominating employees with RTO as traffic warden, 5S campaigns towards the cleaner environment, imparting special education to the school children to name a few.
In accordance with requirements of the Companies Act 2013, your Company has a CSR policy incorporating the requirements therein which is also available on Company's website at the following link
Your company, during the year 2017-18 has spent of Rs 32.36 Lakhs towards the CSR activities in line with the provisions of the Companies Act, 2013.
The Annual Report on CSR activities in the prescribed format is annexed herewith as ANNEXURE C.
The Company has voluntarily adopted the Dividend Distribution Policy as approved by the Board in line with the SEBI (Listing Obligations and Disclosure Requirements) Regulations 2015 and the same is available on Company's website viz. .
In line with the policy, the Board of Directors has recommended a Final Dividend of Rs 15/- per equity share of face value Rs 10/- each (150%) for the year ended 31st March 2018. This is in addition to the Interim Dividend of Rs 10/- per equity share of face value of Rs 10/- each which was paid on 19th February 2018.
The Final Dividend, is subject to approval of members at the 36th Annual General Meeting & will be paid to those shareholders whose names appear on the register of members of the company as on 1st August 2018. If approved, the total Dividend for the financial year, including the interim dividend, amounts to Rs 25/- per equity share and will absorb Rs 602 lakhs including dividend distribution tax of Rs 102 Lakhs.
Your Company proposes to transfer Rs. 130 lakhs to the General Reserve. An amount of Rs. 4941 Lakhs is proposed to be retained in the Statement of Profit & Loss.
During the year, the Company has not accepted deposits from the public falling within the ambit of Section 73 of the Companies Act, 2013 and the rules framed thereunder.
Details of investments covered under section 186 of the Companies Act 2013 are given in the note no. 6 to the financial statements.
In terms of Section 124 (5) of the Companies Act, 2013, an amount of Rs. 3.78 lakhs being unclaimed dividend during the year, pertaining to the financial year 2009-10 was transferred to IEPF after sending due reminders to the shareholders.
http://www.wendtindia.com/pdf/csrpolicy.pdf
www.wendtindia.com
DIVIDEND
TRANSFER TO RESERVES
FIXED DEPOSITS
INVESTMENTS
TRANSFER TO THE INVESTOR EDUCATION & PROTECTION FUND
1514
Available for appropriation (Rs in Lakhs)Profit After Tax 1230Add: Other Comprehensive Income 36Add: Balance brought forward from previous year 4326Total 5592Recommended appropriationsTransfer to General Reserve 130Dividend-Interim Rs 10/-per share 200-Final (Dividend paid for 2016-17 Rs 15/- per share of face value of Rs 10/- each) 300Dividend Tax-Interim 41-Final (for 2016-17) 61Balance carried forward 4860Total 5592

CONSOLIDATED FINANCIAL RESULTS
KEY CONSOLIDATED FINANCIAL SUMMARY
QUALITY
The Consolidated Financial Statements of the company (incorporating the operations of the Company and its two wholly owned overseas subsidiaries), for the financial year 2017-18 are prepared in compliance with the applicable provisions of the Companies Act, Accounting Standards as prescribed by Regulation 33 of the Securities and Exchange Board of India (SEBI) (Listing Obligations and Disclosure Requirements) Regulations, 2015. The Consolidated Financial Statements have been prepared based on the audited financial statements of the company, its subsidiaries, as
approved by their respective Board of Directors.
Pursuant to provisions of Section 136 of the Act, the Financial Statements of the Company, the Consolidated Financial Statements, along with the relevant documents and the Auditors' Report thereon form part of this Annual Report. A statement of summarized financials of all subsidiaries of your company including capital, reserves, total assets, total liabilities, details of investment, turnover etc. pursuant to General Circular issued by MCA forms part of this report. The audited annual accounts and related information of the subsidiaries is available in our website-
.
The key financial data for the consolidated operations are as follows: -
(Rs in Lakhs)
FY 2017-2018 FY 2016-2017
Sales 14,432 14,466
Other Income 492 313
Profit Before Tax 1,804 1,657
Profit After Tax 1,312 1,205
Earnings per share-Rs. 65.62 60.26
Your Company manufactures products that embed a high level of precision and accuracy as demanded by the customers of various industry segments. While the Super Abrasives Product range consists of Diamond & CBN Grinding Wheels and Special Tools; the Machines includes customized range of high precision machines such as CNC Grinding, Notch Milling, TC Ring Grinding, Honing and Accessories fulfilling the requirements of international standards and including CE certifications. Precision Components are manufactured with significant degree of precision and very precise, close tolerances necessitating them to passing through the stringent quality standards and measurements through the stringent production process and control.
To ensure that your company meet this requirement, Quality Management standards are put in place such as ISO 9001 and TS 16949. TS 16949 pertains to manufacturing of precision components. Further, in order to comply with the safety norms and requirements of overseas customers, your company has also successfully implemented EN 13236 Standards. Quality being the uncompromised differentiator for your Company, the company attempts hard to ensure that final product quality is built by deployment and embracing effective quality control management, process robustness, quality assurance and discipline at every stage of material flow.
www.wendtindia.com
16 17
The Company continues to place higher emphasis on training in latest trends besides investment in high-end equipment, machineries & application software and modern tools.
Your company accords high importance towards safety and health of employees and ensures that the work environment is conducive for smooth operations. Towards this, the top management stays ever committed for maintaining high standards for safety, health and environment management by being fully compliant to applicable statutory requirements as per OHSAS 18001 and ISO 14001 EMS standards and guideline.
During this year, the company has upgraded to new standard on Social accountability SA 8000:2014 and adopted a new Standard on product safety EN-13236:2010+A1:2015 for meeting Safety requirements of the European standard of Super Abrasive products. Every year, Wendt observes a Safety Week with sprawling events spread over the week to emphasize on importance of safety to the employees. This year it was held on 5th March 2018 which included competitions on slogans, posters, skits, and mock drills.
Recognizing that the employees are the most valuable assets of your company and that the Safety and Health of each employee is of utmost importance. The company continues to undertake initiatives and pursue programs, including Annual health check-up for employees and their family, special medical attention for employees working in special process & sensitive areas. The company conducted special awareness program on use of personal protection equipment (PPEs), zero discharge of ETP/STP and hazardous waste handling, so that the employees and their family maintain good health and overall wellness.
Your company continues to periodically conduct safety mock drill and various training programs to educate and prepare towards chemical, electrical and medical urgencies.
The employees are encouraged to participate in customer audits, group competitions, various national and international events & competitions. Your Company continues to get accolades and awards from its customers and other prestigious domestic/international forums. Some of the awards and recognitions your Company received during the year under review:
“Regional Award for Export Excellence”
Conferred with “Star Performer – Large Enterprises” for outstanding export performance during year 2015-16 by Engineering Export and Promotion Council
Lean Management Practices
Conferred with Silver Award for Lean Management Practices from ABK AOTS
Quality Circle Awards
Your Company's employees continued to exhibit their skills in various Quality Circle competitions as below
International Level: Organized by QCFI, Philippines
- “Gold” Award in ICQCC for Kaizen- 1 team
National Level: Organized by QCFI, Hosur
- “Gold” Award for Kaizen in CCQC - 4 teams
- “Gold Award” for SGA (Small group Activity) in CCQC: 2 teams.
SAFETY, HEALTH AND ENVIRONMENT (SHE)
RECOGNITIONS AND AWARDS
l
l
l

19
greater certainty to the investment climate. The reform
measures undertaken in 2017-18 are expected to strengthen
further in 2018-19 and will reinforce growth momentum.
However, downside risk to higher growth emanate from
higher crude oil prices, protectionist tendencies in some of
the countries, and possibility of tightening of monetary
conditions in the developed countries which could lead to
lower capital inflows and financial stress.
The increasing usage of CNC machines and better
performance of super abrasives tools are the main factors that are expected to drive the super abrasives market. The
main drivers for the super abrasives market is the growing trend on the usage of tough to grind & exotic materials
super alloys, closer tolerances on component, which necessitates the use of super abrasives in the automobile sector,
where the demand has increased at higher rate with more usage in grinding wheels, cutting tools, files, dressing
tools, gears, bearing and so on. These super abrasive materials (diamond, CBN) are used for better finishing and
addressing higher exacting component requirements, as they surface in automotive sector with the increase in
demand for Electrical and fuel-efficient vehicles.
As a major supplier of the most comprehensive range of
Super abrasive products and Total Grinding Solution
Provider, your company enjoys single- source supplier
status with many customers for a wide spectrum of
industry. A major contribution to your company's top line in
the coming year is expected to come from sector such as
Automobile, Engineering, Cutting Tools, Refractory,
Aerospace, Defense, Steel, Ceramics and Construction.
Therefore, your company's performance will also be in
congruence with the performance levels of these industry
in coming years.
In order to minimize dependency on certain industry segment, your company will strive to focus on exploring new
opportunities and has added some new products to enhance the products basket especially in the precision grinding
area. The effect of this endeavor is evident from the fact that your company has developed many new products for
the precision application for industries like Automobile, Aerospace, Defense, Glass, Bearing, Paint, Razor Blade,
Ceramics and Precision components.
Particulars 2017-18 2016-17 % change
Domestic Sales 8,828 9,760 (10)
Export Sales 3,857 3,019 28
Total Sales 12,685 12,779 (1)
Operating Profit before Finance cost 1,243 1,209 3
Capital Employed 10,908 10,243 6
INDUSTRY STRUCTURE & DEVELOPMENTS
PERFORMANCE OVERVIEW
Key Financial Summary
18
l
l MGTC Women Sports Tournament
l
MGTC Volley Ball Tournament
Your company's employees participated in the Group Level Volley
Ball tournament and won the “Winners” Trophy during the year.
Your company's women employees participated in the Group level
sports competition and won awards in Carom, Chess and Relay
competitions.
Cufest 2017 Awards
Your Company's employees participated in Group-level Quality
competition “Cufest 2017” (Quality Festival of CUMI), and won
awards for 5S, Poster, Innovation, Idea King, SGA and Theme Video
In the sections that follow, the information required to be given in the Management Discussion and Analysis
Report have been provided
The year 2017-18 just ended with positive sentiments resulting in
a modest growth among various industry segments. Your
company started the year with many bright prospects & many
hopes, but as we progressed over the year, it had many ups and
downs resulting in a rather moderate growth for most industrial
sectors, except a few.
Further on the Domestic front, the demonetization effect & the roll
out of GST by the Government during the first half of the year
resulted in the unpredictability in the demand & a resultant
reduction in order inflow.
During the year, your company continued to focus on the new initiatives, be it building new machine models,
pursuing projects in precision components, Lean Management, new product developments, research &
development and strengthening our export business. In addition to this, your company worked closely with
customers for new opportunities including import substitutions to maintain its leading position in the domestic
market.
If macro-economic stability is kept under control, the ongoing
reforms are stabilized, and the world economy remains
buoyant, growth could start recovering towards its medium
term economic potential of at least 8 percent.
Improvement in Economy will be supported by an increase in
global growth in 2018 which will further boost India's exports.
Remittances are expected to increase, owing to the rising
trend in oil prices. Stable policy rates along with the favorable
interest rate regime in the global markets could provide
MANAGEMENT DISCUSSION AND ANALYSIS REPORT
GENERAL PERFORMANCE REVIEW
ECONOMIC OUTLOOK
(Rs. in Lakhs)

OPPORTUNITIES & THREATS
Opportunities:
Threats
Despite the recent announcement of a slew of reforms, policy measures and fiscal consolidation by the Government, the Indian growth is expected to remain modest in the near term. However, the medium and the long-term expectation from the economy is bullish. After suffering from a temporary setback following the de-monetization and GST implementation reforms, the economy is bouncing back.
As for your company, the confidence levels would continue to be positive because of the spread of its business across varied industrial segments and not dependent only on few industry segments.
Your company would continue to leverage upon its vast experience and technical expertise team, deep understanding of customer requirements, comprehensive product range, superior technology and the resultant competitive edge emerging out of its two complementary business verticals namely Super Abrasives and Machine Tools and Precision Component.
With the Make in India initiative, liberalization of civil aviation policy, Aerospace and Defense industry too is likely to grow at high pace. Your company provides state of art innovative solution to meet the customers Grinding, Dressing and Honing requirements. Developing products and aligning the business with strong signals of Mega trends would be another area of focus going forward.
To address the huge price sensitive market of Standard and mass consumed Super Abrasives product, your company has also started promoting and selling the standard products under STAR Brand which it had acquired during the previous year. This is expected to help your company to acquire the untapped market of the price sensitive range of products.
The Domestic Super Abrasives Tool market is
characterized by presence of both organized as well
as unorganized players. At the one end we have many
2120
unorganized, regional propriety-run entities that are smaller in size and operation with limited offering, which
address customers' requirements in specific region and compromise with lower price and often unhealthy business
practices. On the other end, the presence of well-established players with high brand value across the globe focusing
on technology, application engineering and product development. The investment in R&D activities by major players
to innovate the existing products and to develop new technologies to sustain competition in the market is very high.
This has been a unique challenge for your company. To address this, your company continues to adopt its distinctive
method of offering low cost mass products for the low end. Enhancing standard range of products under Star Brand
is one of the initiative to cater to the mass market, and for the high-end segment, company focuses on its
technological solutions, application engineering and product development by offering import substitutes and value
additions. For addressing the high performance, quality conscious segment, your company is working with foreign
Research Institutes and is on lookout for product specific, niche manufacturers for acquiring state of the art
technology.
The Central Statistics Office has estimated the GDP growth in 2017-18 to be 6.5 per cent. However, the growth
during 2018-19 could be higher depending on several factors.
Taking advantage of the emerging opportunities, your
company is fully geared up to retain its leadership position by
offering its comprehensive range of products, increased
market reach & penetration and adding new products in
baskets.
In the Superabrasive Business, your company continues to
focus on building capability / capacity in identified products
cells including enhancing self-sufficiency. Development of new
products, Research and Development will continue be our
focus in the coming year. Your company have enhanced the
existing product basket by adding more standard products to
be offered under STAR Brand through the distribution
channel, which is expected to make significant contribution to
the overall growth of your company.
On Machines and Precision components, your company will continue to work towards strengthening our Machine
Tool business by consolidating various machine models / range to increase the customer / industry base and overall
offering.
The precision Component business is being strengthened and enhanced by adding new components and new
customers. The initial test and approval for new projects have been encouraging and we expect to benefit from this
during coming year.
Your Company's 100% owned Subsidiary, Wendt Grinding
Technologies Ltd, Thailand, continues to show creditable
performance year on year albeit Thailand being affected by
slowdown specially in export depended countries, political
disturbances, falling demand, shifting of base by many Japanese
companies. It demonstrates enough confidence for even better
performance in the coming year. Certainly, this has been possible
due to continuous efforts in exploring newer opportunities,
scanning new industry segments, enhancing product basket as well
BUSINESS OUTLOOK

as delivering superior value propositions to the customers
in Thailand and adjoining countries.
Your second subsidiary, Wendt Middle East FZE, Sharjah
has been consistent in its performance over the last few
years. For the last two years, the business environment in
the region has been very challenging in items of political
issues, war, down slide in oil price, stalled projects and very
few new investments and project expansions. Despite these
difficulties and hardships, your subsidiary continues to put
all its efforts on certain markets and industries that have
given good results during these tough times. Your
subsidiary would continue to operate as the Product
Availability Point (PAP) for the entire GCC region with focus
on General Engineering, Aerospace, Steel, Ceramics, Auto
component & associated industry segments and holds enough promise for better performance in the coming year.
Your Company has a robust risk management process to
identify, evaluate and mitigate risks impacting business
including those which may threaten the existence of the
company. This framework seeks to create transparency,
minimize adverse impact on the business objectives and
enhance the company's competitive advantage. This
framework also defines the risk management approach
across the enterprise across various levels including
documentation and reporting. The framework has different
risk models which help in identifying risk trends, exposure
and potential impact analysis at a company level as also
RISK & CONCERN
2322
separately for the business segments. Risk Management
forms an integral part of the Company's Business Plan.
The Senior Management of your Company analyze the
potential areas of risks and on the current business portfolio
and decide which business should receive more focus, where
to invest, what needs to be added or discontinued from the
product portfolio etc. to mitigate the risks.
The Risk management process for your Company
encompasses the following sequence:
Identify, that might affect
project or its outcomes
Understanding nature of risk and its potential to affect project goal and objectives.
Evaluate or rank the risk by determining the risk magnitude.
Development of risk mitigation plans.
Periodic monitoring and review of risk mitigation plans
These are routinely tested and certified by the Statutory as well as Internal Auditors. Significant audit observations
and follow up actions thereon are reported to the Audit Committee.
We could be adversely impacted by our significant exposure to selected few sectors like auto and auto ancillaries
We could be adversely impacted by the loss of any of our significant customers, changes in their requirements for our products or change in ownership
Failure to sustain a continuing economic recovery could have a substantial adverse effect on our business
We could be adversely impacted by new laws, regulations or policies of governmental organizations
Rebranding of products and the resultant delay in brand establishment
Disruptive innovation & process changes
Mitigation Plan / Counter Measure to address
Widening the customer base / new industry segment & new geographies thereby De-risking the business
l
l
l
l
l
l
l
l
l
l
l
l
recognize and describe risks
Why is it considered as a Risk?
Risk Factors Related to the Markets/Industry We Serve
ENTERPRISE VALUE ADDITION (EVA)
Particulars 2017-18 2016-17 2015-16 2014-15 2013-14
Generation of Gross Value added 5272 4902 4417 4373 3868
Breakup on Application of Value added
Payment to Employees 2588 2363 2077 1812 1768
Payment to Shareholders (on payment basis) 500 500 500 500 500
Payment to Government 692 490 539 270 431
Payment to Directors 16 5 5 5 2
Towards replacement and expansion 1476 1544 1296 1787 1167
Total 5272 4902 4417 4373 3868
l Gross Value Added is Revenue less Expenditure (excluding depreciation, expenditure on employee & directors service)
l Payment to Government is Current tax + Dividend distribution tax
l Replacement and expansion is Retained earnings + Depreciation + Deferred tax
Payment to Employees grew at a CAGR of 10% over the last 5 years. Payment to Government grew at 13% CAGR over the similar period. The Company had been constantly investing towards replacement and expansion expenditure at a CAGR of 6% to ensure fulfilment of market demand.
(Rs. in Lakhs)

24
l
l
l
l
l
l
l
l
l
l
l
l
l
l
l
l
l
l
l
l
l
l
Access to New Alternate technology following the expiry & Non- renewal of technical collaboration agreement with Wendt GmbH post Sept 2012.
Adoption of Disruptive technologies like 3D printing.
Technology gap in certain products range as a result of product upgradation by global competitors.
Mitigation Plan / Counter Measure to address
Indigenous development of Bonds with external consultant support and working with Research Institutes.
Collaboration with external consultants
Established DSIR approved R&D center and build on self-sufficiency in technology
Association with external Research laboratories / Technical institutes for technology upgradation.
Working on Product and Process Innovations
Why is it considered as a Risk?
Attrition of skilled / trained manpower leading to disruption of operations or knowledge gap
Contractual liability, e.g. Product liability
Mitigation Plan / Mitigation Plan / Counter Measure to address
Succession planning
Career Development
Knowledge Management Portal whereby all major established applications are safely documented for reference and trail
CCSD (CUMI Centre for Skill Development) providing employable technicians
Market linked revision in Compensation
Focus on multi skilling & skill upgradation.
All contracts cleared by the Legal team
Why is it considered as a Risk?
Data breach leading to loss and critical information infrastructure breakdown
Mitigation Plan / Counter Measure to address
Policy in place for Technical Controls
Disaster Recovery Strategy & Business Continuity Plan in place.
Data center access limited to authorized personnel
Crisis Management Group in Place.
One of the key success factors for your company's sustainability
HR & Legal Risk
Online Data & Information Security Risk
INFORMATION TECHNOLOGY
25
l
l
l
l
l
l
l
l
l
l
l
l
l
l
l
l
l
l
l
l
Identify alternate Industrial Focus segment like Aerospace, Bearing, Razor Blade, Glass, etc., based on Mega Trends.
Aligning strategy towards delighting most significant customers both in domestic and as well as overseas market.
Leveraging relationship and Engagement with the customer - e.g. WOW initiative / Exhibitions like IMTEX, participation in international exhibitions like GRINDTEC – Germany, MAC – United Kingdom, IMTS – USA, CIMT - China, CRM & Knowledge Management application
Setting up of In-house DSIR approved R&D centre. Also, thrust on innovation with focus on New Product Development, is now well embraced at Wendt to yield long term results.
Branding, promoting and selling Standard range of products under STAR Brand.
Why is it considered as a Risk?
Direct Imports through OEM route
Cheaper Imports from countries like China and Taiwan.
Presence of many unorganized regional players often adopting Low pricing strategy, free samples, higher credit days etc.
New Organized Players entry by setting up manufacturing base in India consequent to Make in India Drive.
Mitigation Plan / Counter Measure to address
Offer sustained competitive advantage to customer `through operational efficiencies
Focus on Lean & Address QCD – Superior Quality, Cost competitive products & Reliable, Faster Delivery
Internal Efficiency Measures/ process automation/ Reduce throughput time
Creating entry barriers for competition / exit barriers for customers - key account management
Increased focus on New product development
Enhancing value added services
Increasing the product basket & offerings
Building agile Supply chain by capitalizing on CUMI dealer network
Explore E-Commerce and online sales
Automation and Robotization to address Lowermanufacturing cost and enhance Competitiveness
Why is it considered as a Risk?
The rapid changes taking place in the fields of grinding / honing technology and material science.
Competition Risk
Technology Risk

26 27
and consistent operations has been the use of technology and SAP ERP system. During the year, configuration has
been made within SAP modules to meet GST Compliance, thus leveraging on the benefits for smooth functioning
and steady flow of information across various functions. Your company could smoothly implement GST with the
modification in SAP in record time.
Your company has implemented SIEM (Security Information and Event Management) for identifying,
monitoring, recording and analyzing security events or incidents in a real-time IT environment and Document
Management System for Management Standards, which supports in retrieval of documents during Audit and
provides alert mechanism for legal / statutory / calibrations / MRM / NC / Compliance along with action plans as per
timelines.
The Company has put in place adequate system of internal controls commensurate with its size and the nature of its
operations. The Company's internal control system covers the following aspects:
Financial proprietary of business transactions.
Safeguarding the assets of the Company.Compliance with prevalent statues, regulations, policies and procedures.
The Internal Audit team evaluates the effectiveness and adequacy of internal controls, compliance with operating
systems, policies and procedures of the Company and recommends improvements, if any. The Audit Committee of
the Board periodically reviews audit plans, observations and recommendations of the internal and external auditors,
with reference to the significant risk areas and adequacy of internal controls and keeps the Board of Directors
informed of its observations, if any, from time to time.
During the year, there were no changes in internal control over financial reporting that have materially affected or
are likely to have any financial reporting lapse.
As per Section 134 of the Companies Act'2013, the term 'Internal Financial Control '(IFC) means the policies and the
procedures adopted by the Company for ensuring:
a) Orderly and efficient conduct of its business, including adherence to accounting policies,
b) Safeguarding of its assets,
c) Prevention and detection of frauds and errors,
d) Accuracy and completeness of accounting records, and
e) Timely preparation of reliable financial information.
The key components of IFC followed by the Company are:
1. Entity Level Controls (ELC) that the management relies on to establish appropriate -Code of Conduct, Hiring and
Retention practices, Whistle Blower mechanism, Delegation of Authority and other policies and procedure.
2. Process Level Controls (PLC) to ensure process are stable, predictable and consistently operating at targeted level
of performance classified into Manual or Automated Controls.
3. General IT Controls to ensure appropriate functioning of IT applications and systems built by company to enable
accurate and timely processing of financial data are -User Access rights Management and Logical Access,
Change Management controls; password policies and practices, Patch management and License management;
backup and recovery of data.
The adequacy of IFC is ensured by:
Documentation of risks and controls associated with major processes.
INTERNAL CONTROL SYSTEM & ADEQUACY
l
l
l
l
Internal Financial Controls
l
l
l
l
l
Validation of existing Controls to mitigate risks.
Identification of improvements and upgradation of the controls
Improving the effectiveness of controls through data analytics
Performing testing of controls by Independent Internal Audit firm.
Implementation of sustainable solutions to Audit observations.
During the year, your company achieved total sales of Rs.12685 Lakhs, similar to previous year. While the domestic
sales were lower by 10% over the last year at Rs.8828 Lakhs, the export sales were higher by 28% compared to the
previous year at Rs.3857 Lakhs. As briefed earlier, the major industry segments which contributed to the de-growth
of the domestic business are steel, auto ancillaries, engineering, trading etc. The higher export was due to higher
sales to 10 focus countries like Russia, China, Singapore, UK, Thailand, Indonesia, Korea etc. during the year.
The profit before tax is higher by 5% at Rs.1651 Lakhs compared to Rs.1570 Lakhs in 2016-17. The higher profit is
because of the improved product and process efficiency measures taken by the Company and control over the fixed
cost.
The profit after tax is higher by 5%, at Rs.1230 Lakhs, compared to Rs.1169 Lakhs in 2016-17.
Your company continues to be debt free company, maintaining sufficient cash and cash equivalents to meet its
futuristic strategic initiatives. This is achieved by being prudent in its investment policy over the years, maintaining a
reasonably high level of cash and cash equivalents which enable the company to completely eliminate short and
medium-term liquidity risks.
The Company has a robust Cash Management Policy whereby it:
a. Conserves sufficient cash as reserves that will aid the company in venturing into meaningful business
opportunities that unfold during the year.
b. Use cash to provide sufficient working capital to address business objectives of the company & to add value to all
stakeholders by continued enhancement.
c. Prudently Invest surplus funds that the business generates in debt schemes of mutual funds as per Group norms
and prior approval from the Board. This ensures availability, safety and liquidity of Company's funds while
allowing reasonable yield as per the prevailing market rates. The surplus funds are generated through stringent
control on working capital.
During the year, your company's investment in mutual funds increased from Rs.1072 Lakhs to Rs.1799 Lakhs as on
31st March'2018 i.e. a growth of 68%.
As the earnings are ploughed back, the capital expenditure need of your company for the year was met entirely from
the mutual funds investment.
Your Company has done judicious cost control whereby the fixed cost excluding depreciation as percentage of sales has been controlled at 33% similar to last year's level.
The variable costs have been controlled during the year through indigenization of raw material and other input costs
FINANCIAL REVIEW
Earnings
Revenues
Profit before Tax
Profit after Tax
Liquidity and Cash Equivalents
Costs

28 29
which has helped in improving the margins of the company. The Lean Management Initiative undertaken by your company has also helped in significant savings during the year. Your company's price correction initiative from both customers domestic and exports and key suppliers has improved its profitability in the current year.
The paid-up equity share capital as on March 31, 2018 was Rs.200 Lakhs. During the year under review, the Company
has not issued shares with differential voting rights nor granted stock options nor sweat equity.
The shareholders fund as on 31.03.2018 was Rs.10908 Lakhs against Rs.10243 Lakhs of previous year, an increase of
6%. Accordingly, the book value of the share stands at Rs.545/- as compared to Rs.512/- during the previous year.
Your Company continues to utilize its cash credit limit with State Bank of India to bridge the short-term fund requirement and for meeting the temporary mismatches in its cash flow. Your Company does not have any interest- bearing term loan.
During current year too, the working capital limits of your Company continues to be rated by ICRA as AA- (pronounced ICRA double A minus) rating assigned to the Rs.2 crore Long-term Fund facilities of your Company which signifies low credit risk and stable. The short-term Rating assigned to the Rs 6 crore Non-Fund Based working capital limit also continued to be reaffirmed as A1+ (pronounced ICRA A one plus). Overall your Company's rating continues to be stable and low credit risk.
Your company continues with the policy of being prudent in its capex spend. During the current year, the capital expenditure was Rs.547 Lakhs. The major capex spent was on addition of new plant & machinery towards capability building in fast growing products and new products capacity enhancements, which are critical for the future growth of the company. Company follows the policy of funding all the capex through the internal accruals.
The Company follows rigorous Working Capital Management, based on a well-organized process of continuous monitoring and control on Receivables, Inventories and other parameters. The overall inventory levels as on 31st Mar'2018 is Rs. 1876 Lakhs, similar to last year.
Receivables (Gross) as on 31st March'2018, were at Rs. 3421 Lakhs against last year's figure of Rs.2902 Lakhs. Despite the tough liquidity position, your Company has been able to maintain the receivable average credit days at 79 days similar to previous year. This is possible through aggressive receivable management system including close follow ups and credit lock through the SAP system to ensure that receivables are kept under control and payments received in time.
Your Company, being a net exporter, continues to follow the policy of natural hedging of foreign exchange earnings
and outflow and hence it does not take any forward covers. The net forex gain during the year has been Rs.115 lakhs
(Previous Year Rs.20 Lakhs).
Your Company kept its Operating profit and Contribution better than the industry average by adopting stringent control measures for improved operational efficiency led by the LEAN Initiative. This was aided by accurate information & customer data, centralized drawing management system, better planning & scheduling through SAP
Financial Position
Share Capital
Share-holders Funds
Loan Funds
ASSETS
FIXED ASSETS
Inventories and Sundry Debtors
Foreign Exchange Hedging
Financial Performance with respect to Operational Performance
ERP System and effective vendor management. Your Company's improved MIS reporting and ability to respond to customer with real time information helped in giving rich experience to the customers there by providing value addition to the customer.
As in the past, your company continued its adequate care in providing required insurance cover for company's assets - buildings, plant and machinery including inventories, and for liabilities under legislative enactments. Besides, adequate Group Personnel Accident (GPA), Group Mediclaim (GMC) insurance coverage is taken for the employees and their dependents to cover the risk arising out of accidents or sickness.
The human capital is the most precious asset in any organization. Your Company is determined to accelerate its growth story by consistently changing the needs of diverse workgroup by fostering an engaging work environment, to constantly build the unique capabilities and skills of the people. The company has a strong and diverse workforce where every employee is involved as “partners” in the progress. The intangible asset comprises all the competencies of the people within the organization in terms of education, experience, potential and capacity. For High Potential Individuals, company encourages them to undergo mentoring and personality development programs, to prepare them for leadership roles and bigger business challenges in future.
The Company is proud to deliver value to its customers, investors and society at large. The unmatched employee commitment and ownership that employees have towards the organization has translated in growth of the company over the years.
Talent recruitment and retention is something that Wendt focuses on. Proper and step by step induction is given to all new employees to familiarize them with the group norms. The company's GET batch of 2017-18, were part of a blended learning initiative called YOLO (You Only Learn Once), to manage their transition into a workplace in a systematic and effective manner.
The company encourages the employees to enhance their knowledge, skills & competencies in respective field, by way of their pursuing higher education while continuing his job. Your company sponsors such of the befitting employees by partially sharing the course / education fee. This helps the employee to enhance his knowledge and skill to address his growth and the required changing job competency.
Your Company also lays emphasis on developing its existing manpower through training and development programs carried out at regular intervals. Skill management is stressed upon and is an ongoing process at all levels. The organization takes interest in nurturing talent through mentorship & process specific trainings & modules. For development of Supervisor, company has taken initiative - “Unnatham” and “Super Appu” for Personality Development and Team Building. The organization ensures all-round development of an individual through regular synergy activities along with festival celebrations which are organized at regular intervals. This helps in engaging the employees and provides them a level playing field to interact with fellow colleagues and their families.
Your company focuses on Business Excellence and continual improvement journey (TQM) in its quest to improve the quality of products, processes and systems. All this requires ongoing learning, job enrichment, aligning rewards and recognition with performance, high engagement levels, conducive work environment and a cordial industrial relationship.
Employee relations continue to be smooth and cordial and the work atmosphere remained congenial throughout the year. The manpower strength of confirmed employees of your company as on 31st March 2018 was 399.
All related party Transactions that were entered during the financial year were on arm's length basis and were in the ordinary course of business. During the year, there were no materially significant related party transactions made by the Company with Promoters, Directors, key Managerial Personnel or other designated persons which may have a potential conflict with the interest of the Company at large.
In line with the provisions of Section 177 of the Companies Act, 2013 read with the Companies (Meetings of the Board and its Powers) Rules, 2014, prior omnibus approval for the estimated value of transactions with the related parties for the financial year is obtained from the Audit Committee. The transactions with the related parties are
INSURANCE
HUMAN RESOURCE
RELATED PARTY TRANSACTIONS

30 31
routine and repetitive in nature. The summary statement of transactions entered into with the related parties pursuant to the omnibus approval so granted are reviewed and approved by the Audit Committee and the Board of Directors on a quarterly basis.
The Policy on Related Party Transactions as approved by the Board is uploaded on the Company's website.
None of the Directors has any pecuniary relationships or transactions vis-à-vis the Company.
The Board of Directors have appointed Mr. M Lakshminarayan as an Additional Director on the Board of the Company with effect from 20th March 2018 and he holds office till the date of the ensuing Annual General meeting. The Company is proposing to appoint him as an Independent Director under section 149 of the Companies Act, 2013 for a term of 5 years. Mr. Lakshminarayan has offered himself for this appointment. The Company has received a notice from a shareholder proposing his candidature as Director in the ensuing Annual General Meeting.
In accordance with the provisions of the Companies Act, 2013 and the Articles of Association of the Company, Mr. K Srinivasan, Director retires by rotation at the forthcoming Annual General Meeting and being eligible, offers himself for re-appointment. The necessary Resolution is being placed before the shareholders for approval. The Board of Directors of your company believes that his continued association with the Board will be beneficial to the company and recommends his re-election.
All the Directors of the company have confirmed that they are not disqualified from being appointed as directors in terms of Section 164 of the Companies Act, 2013. All the independent Directors have given a declaration under section 149(6) of the Companies Act 2013, confirming their independence.
Mr. Rajesh Khanna, Chief Executive, Mr. Mukesh Kumar Hamirwasia, Chief Financial Officer and Ms. Akanksha Bijawat, Company Secretary continue to be the Key Managerial Personnel of the Company as per Section 203 of the Companies Act, 2013 and there were no changes during the year.
A calendar of Board Meetings is prepared and circulated in advance to the Directors.
During the year, five Board Meetings were convened and held in accordance with the provisions of the Act. The date(s) of the Board Meeting, attendance by the directors are given in the Corporate Governance Report forming an integral part of this report.
In compliance with the provisions of Sections 135, 177, 178 of the Companies Act, 2013, the Board constituted Corporate Social Responsibility Committee, Audit Committee, Nomination and Remuneration Committee and Stakeholder Relationship Committee (Committees). The details of composition of the Committees, their meeting and attendance of the members are given in the Corporate Governance Report forming an integral part of this report.
Pursuant to the provision of the Companies Act, 2013 and Regulation 17 of SEBI (Listing Obligations and Disclosure Requirements) Regulations, 2015, the Board had carried out an annual evaluation of its own performance, the Directors individually and the Committees of the Board. Structured assessment forms which were duly reviewed were used in the overall Board evaluation process comprising various aspects.
The manner in which evaluation has been carried out has been explained in the Corporate Governance Report.
The Board has framed a policy for selection and appointment of Directors, Senior Management and their remuneration. The Remuneration policy is stated in the Corporate Governance Report.
GOVERNANCE
BOARD OF DIRECTORS
KEY MANAGERIAL PERSONNEL
BOARD MEETINGS
COMMITTEES OF THE BOARD
BOARD EVALUATION
REMUNERATION POLICY
PARTICULARS OF REMUNERATION
STATUTORY AUDITORS AND AUDITORS' REPORT
SECRETARIAL AUDIT
CORPORATE GOVERNANCE
CEO/CFO CERTIFICATE
VIGIL MECHANISM UNDER WHISTLE BLOWER POLICY
EXTRACT OF ANNUAL RETURN
The information required pursuant to Section 197(12) of the Act read with Rule 5 of The Companies (Appointment and Remuneration of Managerial Personnel) Rules, 2014 as amended by the Companies (Appointment and Remuneration of Managerial Personnel) Amendment Rules, 2016 and forming part of Directors report for the year ended 31st March 2018 is annexed in Annexure D.
Pursuant to the provisions of Section 139 of the Companies Act 2013 and the rules framed thereafter, M/s Price Waterhouse, Chartered Accountants LLP, were appointed as Statutory Auditors for a term of 5 consecutive years at the 35th Annual General Meeting of the Company held on July 24, 2017, subject to ratification of their appointment at every AGM.
M/s Price Waterhouse, Chartered Accountants LLP, have furnished a certificate of their eligibility as per Section 141 of the Companies Act, 2013.
The Report given by M/s Price Waterhouse, Chartered Accountants LLP on the Financial Statements of the Company for the year ended 31st March 2018 is provided in the financial section of the Annual Report. There are no qualifications, reservations, adverse remarks or disclaimers given by the Auditors in their report. The notes on the accounts referred to in the Auditors' Report are self- explanatory and do not call for any further comments.
Pursuant to the provisions of Section 204 of the Act, and the Rules framed thereunder, the Company has appointed Ms. Apeksha Nagori, Practicing Company Secretary to undertake the secretarial audit for the financial year 2017-18. The Report of the Secretarial Auditor confirming compliance with the applicable provisions of the Companies Act 2013 and other rules and regulations issued by SEBI/other regulatory authorities forms part of the Annual Report.
The Company also adheres to the various Secretarial Standards issued by the Institute of Companies Secretaries of India.
Your Company has inculcated strong culture of values, ethics and integrity living with the Five Lights- The Spirit of Murugappa Group. The Governance Philosophy of your Company is firmed up on a bedrock of ethical values and professionalism which in more than 3 decades of the Company's existence has become a part of its culture. Wendt (India) Limited, looks upon good Corporate Governance practices as a key driver of sustainable corporate growth and long-term stakeholder value creation.
The Company practices and policies reflect true spirit of Corporate Governance initiatives.
In terms of Regulation 34(3) read with Schedule V of the Listing Regulations, a separate section on Corporate Governance including the certificate from a Practicing Company Secretary confirming compliance is annexed to and forms an integral part of this Report.
The Chief Executive and the Chief Financial Officer have submitted a certificate to the Board on the integrity of the financial statements and other matters as required under Regulation 17(8) of the Listing Regulations.
The Company has a well-established whistle blower policy as part of vigil mechanism for Directors and employees to report concerns about unethical behavior, actual or suspected fraud or violation of the Company's Code of conduct or ethics policy. This mechanism also provides for adequate safeguards against victimization of Director(s)/employee(s) who avail of the mechanism and also provides for direct access to the Chairman of the Audit Committee in exceptional cases.
The extract of the Annual Return in form MGT 9 as required under Section 92(3) of the Act and the Rules framed thereafter is annexed to and forms part of this report. (FORMAT IN ANNEXURE B).

32 33
DIRECTORS RESPONSIBILITY STATEMENT
ENERGY CONSERVATION, TECHNOLOGY ABSORPTION AND FOREIGN EXCHANGE EARNINGS & OUTGO
ACKNOWLEDGEMENTS
Pursuant to the provisions of Section 134(3) (c) of the Companies Act, 2013, the Board of Directors of your Company, make the following statements, to the best of their knowledge and belief and according to the information furnished and explanations obtained by them:
That in the preparation of the annual financial statements for the year ended 31st March 2018, the applicable accounting standards have been followed and there have been no material departures therefrom.
That they have selected appropriate accounting policies and applied them consistently and made judgments and estimates that are reasonable and prudent, so as to give a true and fair view of the state of affairs of the Company as at the end of accounting year and of the profits of the Company for the year ended 31st March 2018.
That proper and sufficient care has been taken for the maintenance of adequate accounting records in accordance with the provisions of the Companies Act, 2013 for safeguarding the assets of the Company and for preventing and detecting fraud and other irregularities.
That the annual financial statements have been prepared on a going concern basis.
That proper internal financial controls have been laid down to be followed by the company and that such internal financial controls are adequate and were operating effectively.
That proper systems have been devised to ensure compliance with the provisions of all applicable laws and that such systems were adequate and operating effectively.
The information on energy conservation, technology absorption, expenditure incurred on Research & Development and forex earnings/outgo as required under Section 134(3)(m) of the Companies Act, 2013 read with Rule 8 of the Companies (Accounts) Rules, 2014 is annexed to and forms part of this Report (refer Annexure A).
Your Board of Directors would like to place on record their sincere appreciation for the cooperation received from various stakeholders of the Company viz., customers, suppliers, bankers, investors, government and other statutory authorities, auditors, business associates and shareholders. Your Directors extend their gratitude to all the regulatory agencies like SEBI, Registrar of Companies, stock exchanges and other Central and state Government authorities/agencies, vendors and sub-contracting partners for their support. The Board also acknowledges the unstinted co-operation, commitment and dedication made by all the employees of the Company.
The Directors also wish to place on record their gratitude to the members of the Company for their unrelenting support & confidence.
l
l
l
l
l
l
By order of the Board
M M Murugappan
Chairman
For Wendt (India) Limited
Place: Bengaluru
Date: 25th April 2018
Annexure to the Directors Report
RESEARCH & DEVELOPMENT
A) Information under section 134(3)(m) of the Companies Act,2013, read with Rules 8(3) of The Companies (Accounts) Rules 2014 and forming part of Director's Report.
a) Conservation of Energy
Your company pursued energy conservation efforts relentlessly during the year, although company does not fall under the category of power intensive industries. The organization is an ISO 14001 certified company which is an International Management System Standard. The environmental policy of your Company focuses on conservation of natural resources and minimization of pollution. The following energy conservation measures were considered by your Company during the year:
Installation of LED and Induction Lights, replacing the conventional high energy consumption lightening.
Introduction of LDR (Light Dependent Resistance), for switch OFF the loads, based on daylight's intensity by employing a light sensor.
Introduction of Natural Turbo Ventilation, which reckoned as a perfect and natural air exhausting options for your industries.
Installing Solar Heater in Canteen Area, to wash vessels and Utensils.
Installation of APFC (Automatic Power Factor Controllers) to improve/stabilize Power factor.
Installation of occupancy sensors in washrooms & lavatories.
Optimum utilization of energy through process redesigning as well as maximum utilization of equipment that offers improved energy efficiency.
Time switches installed at various places for automatic control of street lights.
Your company has taken measures to save water whereby 100% of the domestic effluent and the trade effluent are treated and used for gardening and electroplating processes (Zero discharge).
b) Technology Absorption, Adaptation and Innovation
Your company is pioneer in the field of Super Abrasives, Machines and Precision Components in India and quickly
adopts latest technologies in its applications to sustain the front line for the business development. Few years back,
the techno-commercial agreement between Wendt GmbH and Wendt India Ltd had come to an end and the R&D
had put in efforts and indigenized the bonding systems suitable for different verticals in Super abrasives.
Today R&D has taken initiatives to develop our own technologies and patent novel concepts/designs to become the
front-line runners in the Super-abrasives technology. It has established collaborations with the world-renowned
Universities and research Institutes to gain more insights into the abrasive products and corroboratively developing
new products in India to the world standards. Consequently, your company developed customized products and
extended its boundaries in Aerospace, Automotive, Refractories, Construction, Cutting Tools and Textile & Paper
industries.
Your Company has also recognized and started some more areas for bond development for industries such as Rotary
Tools, CAM/Crank shaft and Flat glass with the help of a well-qualified and experienced external consultants.
As you are aware that your Company also work closely with the other R&Ds units of their Indian Joint venture partner
Carborundum Universal, who are the pioneers in the field on conventional abrasive & material science for some of
the application growths for specific areas. One of the primary objective of your Company is to work on cost effective
alternate raw materials to improve operational efficiency, thereby reducing costs and waste elimination. Based on
your company's requirements for modern technology and growth prospect, strategic acquisitions/collaborations in
related areas are being explored.
With the advancement of science and technologies at a greater extent in automobile, aerospace and in electronic sectors, the need of manufacturing solutions with modern technologies are vital to sustain in the current market. In
l
l
l
l
l
l
l
l
l

34
such industries, Research & Development plays a crucial role for innovation and development of new competitive technology to maintain the pace with the rapid changing needs of the Market. At your company, the Research & Development involved in the advancement of Materials Science & Machining Techniques towards providing the “Complete Grinding Solutions” to its Customers & related Market accordingly. Your Company's in-house R&D Centre is certified by DSIR under the Ministry of Department of Science and Technology, Government of India, valid up to 31st March'18, which has been renewed for another two years till March 31, 2020.
Your R & D venture continues to carry out indigenous Bond development in a major way and to help the organization to be ahead of competition with launch of newer products. Being DSIR approved, your company gets a new recognition amongst the peers and the customers. It ensures that the products developed in-house are up to the standards. Your Company's R&D is equipped with advanced testing equipment and qualified competent employees to carry out requisite product research on Super abrasives. The focus is to develop new products to the Indian market to facilitate import substitutions along with increased share of export market. One of the major achievements of R&D is the self-indigenization of the bonding material for super abrasive products. In the fast-growing technologies, moving targets are the big challenges for sustainability; your Company's R&D team has been putting a lot of effort to develop new products with superior performance. Projects such as glass grinding, Camshaft/Crankshaft grinding, and double disc fine grinding requires high competency and efforts to develop & standardize against benchmark products.
The DSIR recognized R&D also provides opportunities to form consortiums with research laboratories in India and abroad to develop next generation smart grinding solutions. Few projects have already been initiated to accomplish nano-finishing with CMMRF (Chemical Mechanical Magneto Rheological Finishing) fluids with BARC-Mumbai, nano-machining using single crystal diamonds, light weight grinding wheels for high speed grinding applications, self-dressing & self-lubricating grinding wheels and Modelling & Simulation of different grinding applications to understand their underlying mechanisms and to gain insights into the working conditions required for effective grinding solutions.
Your company's R&D is equipped with state-of-the-art research facilities for the development of Technology/Product/Process/Validation and is very well supported by a highly qualified, experienced and dedicated team. Being fully equipped, company's R&D has taken initiatives to work on most expedient objectives of the company with a view to add key features to the grinding & finishing applications by the advancement of the new/existing products with technology up-gradation. Research on cost-effective grits and alternative raw materials are carried out in-house with a view to offer a better value proposition to its customers.
Apart from product development, your company is also addressing process improvement/process development such as hot pressing, induction heating, vacuum brazing and electroplating & electroless plating process. These processes substantially improved the quality of the products being manufactured in an economical way and offers high productivity without sacrificing the quality of products.
Your company's R&D is more focused on filing patents and publishes papers in the peer reviewed SCI journals. They are having their network around the world attending national & international conferences and continuously developing & upgrading skills by undertaking essential training and workshops.
Projects completed in R&D: -
Create state-of-the-art testing and R&D infrastructure for internal validation.
Development and manufacture of high performance vitrified Diamond grinding wheels for Bruiting applications.
Indigenization of Resin Bond for CBN/ Diamond Wheel.
Development of indigenized Polyamide Bonds.
Development and manufacture of various types of vitrified CBN general purpose cylindrical grinding wheels for grinding steel rolls/ pipes of 55 HRC and above.
Development of vitrified superfinishing honing sticks.
Development and manufacture of Dicing and slicing blades.
Development of Bonding material for Resin bonded wheel.
l
l
l
l
l
l
l
l
35
Following projects are under progress in R&D: -
Development of Vitrified bond for Crankshaft and Camshaft applications.
Development of glass grinding wheels for Auto, Solar and Structural applications.
Development of CFRP super abrasive wheels for high speed grinding applications.
Development of Carbide Insert grinding wheels
Developing nanometric surface finishing of optical lenses, electro ceramics and bio-implants using Chemo-Mechanical Magneto-Rheological Finishing (CMMRF).
Development of Electroplated wheels to enhance the life by using secondary grits.
Development of super abrasive (SA) grits / modified SA grits.
Development of Double disc fine grinding wheel for the thickness grinding of sintered ceramic & metal parts.
Development of Bonds for Razor blade grinding.
Development of Hybrid bonding system for Fluting applications.
Benefits derived as a result of the above R & D
Business organization gain considerable benefit through investing in research and development. Furthermore,
ongoing research in your company's R&D brings new opportunities in the market.
Following are the benefits accruing out of R&D activities:
Development of bonds & self sufficiency
Indigenization of Bonding Materials for super abrasives as an import Substitute.
Grinding Solutions for New application
Upgrading Manufacturing Technologies with current Needs
Development of Futuristic products in Super abrasives
Development of new body materials for our products machine parts & components
Since the company's R&D facility has got the recognition and approval from DSIR, your company gets tax benefit on the R&D capital & revenue expenditure.
Your Company's continued investment in research and development has resulted in development of some of the
new products with special features for the grinding and finishing applications in the previous year.
Some of the new products and processes developed by your company last year are –
Double disc fine grinding wheels for thickness grinding of ceramics and sintered metal parts
Vitrified bonded CBN ID grinding wheels for fuel injection nozzle bore and seat face grinding applications.
Glass grinding wheels for Structural and Solar applications.
CFRP grinding wheels for high speed grinding applications.
Development of metal bonded wheels using hot pressing system.
Firing of Alumina dressing sticks using Microwave system.
Adopted bi-axial pressing of vitrified segments.
Benefits derived: Your Company mainly caters to niche market where majority of customers are OEMs and look for
technologically superior products with consistent performance. With majority of the customers considering your
Company as a One-Stop Shop for Complete Grinding and Honing Solutions offering technologically superior
products with reliable performance. Your company can address the ever-changing needs & expectations of the
customers, by virtue of its strong focus on R&D and focus on customer centricity. This facilitates your Company to
retain its dominant position in the market and also enable to justify the due premium for its product reflecting on
your company's profitability.
l
l
l
l
l
l
l
l
l
l
l
l
l
l
l
l
l
l
l
l
l
l
l
l

36 37
Safe HarborThis communication contains statements relating to future business developments and economic performance that could constitute 'forward looking statements'. While these forward-looking statements represent the Company's judgments and future expectations, several factors could cause actual developments and results to differ materially from expectations. Your Company undertakes no obligation to publicly revise any forward-looking statements to reflect future events or circumstances. Further investors are requested to exercise their own judgment in assessing various risks associated with the Company and the effectiveness of the measures being taken by the Company in tackling them as those enumerated in this report are only as perceived by the management.
(i) Expenditure on R&D (Rs. In Lakhs)
Sl. No Particulars 2017-18 2016-17
a) Capital Expenditure 64 42
b) Recurring (revenue expenditure) 163 202
c) Total Expenditure 227 243
d) Total R&D Expenditure as a percentage of turnover 1.79% 1.90%
(net of excise duty)
(ii) Foreign Exchange Earnings and Outgo (Rs. In Lakhs)
Sl. No Particulars 2017-18 2016-17
a) Foreign Exchange Used 2804 3025
b) Foreign Exchange Earned 4061 3321
By order of the Board
M M Murugappan
For Wendt (India) Limited
Place: Bengaluru
ChairmanDate: 25th April 2018
ANNEXURE B
EXTRACT OF ANNUAL RETURNas on the financial year ended 31/03/2018
Form No. MGT - 9
[Pursuant to section 92(3) of the Companies Act, 2013 and rule 12(1) of the Companies Management and Administration) Rules, 2014]
I. REGISTRATION AND OTHER DETAILS:
II. PRINCIPAL BUSINESS ACTIVITIES OF THE COMPANY:
All the business activities contributing 10 % or more of the total turnover of the company shall be stated:-
III. PARTICULARS OF HOLDING, SUBSIDIARY AND ASSOCIATE COMPANIES :
CIN
Registration Date
Name of the Company
Category / Sub -Category of the Company
Address of the Registered office and contact
details
Whether listed company
Name, Address and Contact details of
Registrar and Transfer Agent, if any
L85110KA1980PLC003913
21/08/1980
Wendt (India) Limited
Company having Share Capital
Flat No.105, 1st Floor, Cauvery Block, National Games
Housing Complex, Kormangala, Bangalore - 560047
Telephone No.: 080 25701423
Yes
Karvy Computershare Private LimitedKarvy Selenium Tower B, Plot 31-32, Gachibowli, Financial District, Nanakramguda, Hyderabad – 500 032Tel: +91 40 67162222-1510-1512Fax:+91 40 23001153
S.No Name and Description of
main products / services
NIC Code of the
Product
% to total turnover
of the Company
1 Grinding Wheels and Abrasives 23993 51.17 2 Grinding, Dressing, Lapping, Honing & Polishing 23993 27.24
3 Special Purpose Machine, Components & Accessories
3590 9.91
4 Machine Tools & Accessories 3570 9.83
S.No Name and address of
the company CIN/GLN
Holding/
Subsidiary/
Associate
% of shares held
Applicable
Section
1 Wendt Middle East FZE, UAE
Foreign Company
UIN:
BGWAZ20080859
Subsidiary 100% 2 (46)
Warehouse No. W3 - 8
PO Box No.50732,
Hamriyah Free Zone - Sharjah,
United Arab Emirates
2 Wendt Grinding
Technologies Limited, Thailand
Foreign Company
UIN:
BGWAZ20060179
Subsidiary 99.99% 2 (46)
109/21 Moo.4, Tambon
Pluakdaeng Aumpur
Pluakdaeng Rayong 21140

IV. SHARE HOLDING PATTERN (Equity Share Capital Breakup as percentage of Total Equity)
i) Category-wise Share Holding:
Category
of
Shareholders
No. of Shares held at the beginning of the year (1st April 2017)
No. of Shares held at the end of the
year (31st March 2018)
% of
Change during
the Year
Demat
Physical
Total
% of Total
Shares
Demat
Physical
Total
% of Total
Shares
7,97,352
-
7,97,352
39.87
7,97,352
-
7,97,352
39.87
-
(b) Central Govt -
-
-
-
-
-
-
-
-
-
-
-
-
-
-
(c) State Govt (s)
-
-
-
-
-
-
-
-
-
(d) Bodies Corp. - - -
(e) Banks / FI - - - - - - - - -
(f) Any Other…. - - - - - - - - -
Sub-Total (A) (1) 7,97,352 - 7,97,352 39.87 7,97,352 - 7,97,352 39.87 -
(2) Foreign (a) NRIs -
Individuals
7,97,352
-
7,97,352
39.87
7,97,352
-
7,97,352
39.87
-
(b) Other -
Individuals
-
-
-
-
-
-
-
-
-
-
-
-
-
-
-
(c) Bodies Corp.
-
-
-
(d) Banks / FI
-
-
-
-
-
-
-
-
-
(e) Any Other….
-
-
-
-
-
-
-
-
-
Sub-Total (A) (2) 7,97,352 - 7,97,352 39.87 7,97,352 - 7,97,352 39.87 -
Total Shareholding of Promoter (A) = (A) (1) + (A) (2)
15,94,704
-
15,94,704
79.74
15,94,704
-
15,94,704
79.74
-
(A) Promoters
(1) Indian
(a) Individual/HUF
Category
of
Shareholders
No. of Shares held at the beginning of the year (1st April 2017)
No. of Shares held at the end of the year (31st March 2018)
% of
Change during
the Year
Demat
Physical
Total
% of Total
Shares
Demat
Physical
Total
% of Total
Shares
(B) Public Shareholding
(1) Institutions
(a) Mutual Funds
-
-
-
-
-
-
-
-
-
(b) Banks/FI
1850
-
1850
0.09
2514
-
2514
0.13
0.04
(c) Central Govt
-
-
-
-
-
-
-
-
-
(d) State Govt
(s)
-
-
-
-
-
-
-
-
-
(e) Venture Capital funds
-
-
-
-
-
-
-
-
-
(f) Insurance Companies
-
-
-
-
-
-
-
-
-
(g) FIIs
-
-
-
-
-
-
-
-
-
(h) Foreign Venture Capital Funds
-
-
-
-
-
-
-
-
-
(i) Others (Specify)
-
-
-
-
-
-
-
-
-
Sub-Total (B)(1)
1850
-
1850
0.09
2514
-
2514
0.13 0.04
38 39
(2) Non-
Institutions
(a) Bodies Corp 15281 200 15481 0.77 15627 200 15827 0.79 0.02
i. Indian - - - - - - - - -
ii. Overseas - - - - - - - - -
(b) individuals i. Individual
shareholders holding nominal share capital up to Rs. 2 lakh
337171 44600 381771 19.09 339473 34233 373706 18.69 (0.4)
ii. Individual shareholders holding nominalshare capital in
excess of Rs 2 lakh
-
-
-
-
-
-
-
- -
(C) Others (Specify)
i) Trust
-
-
-
-
-
-
-
-
-
iii) Clearing Members
v) IEPF
ii) NBFC Registered with RBI
351
-
100
-
-
-
351
-
100
0.02
-
0.01
427
8050
25
-
-
-
427
8050
25
0.02
0.04
0.001
-
-
(0.009)
iv) Non Resident Indians
5743
-
5743
0.29
4747
-
4747
0.24
(0.05)
Sub-Total (B)(2)
358646
44800
403446
20.17
368349
34433
402782
20.14
(0.03)
Total Public Shareholding
= (B) (1) + (B) (2)
360496
44800
405296
20.26
370863
34433
405296
20.26
-
C. Shares held by custodian for GDRs & ADRs
-
-
-
-
-
-
-
-
-
Grand Total (A+B+C) 1955200 44800 2000000 100 1965567 34433 2000000 100 -
(ii) Shareholding of Promoters:
S.No
Shareholders’
Name
Shareholding at the beginning of year (1st April 2017)
the
Shareholding at the end of the year(31st March 2018)
% of Change during
the Year
% of % of
total Shares total Shares
of the
companyof the
company
%of Shares %of Shares
Pledged / Pledged /
encumbered encumberedto total shares to total shares
No. ofShares
No. ofShares
1 Carborundum Universal Limited
7,97,352 39.87 - 7,97,352 39.87 - -
2 Wendt Gmbh
7,97,352
39.87
-
7,97,352
39.87
-
-
Total 15,94,704 79.74 - 15,94,704 79.74 - -
Category
of
Shareholders
No. of Shares held at the end of the year (31st March 2018)
% of
Change during
the Year
Demat
Physical
Total
% of Total
Shares
No. of Shares held at the beginning of the year (1st April 2017)
Demat
Physical
Total
% of Total
Shares

41
S.No For Each of the Top 10
Shareholders
Shareholding at the beginning of the year (1st April 2017)
Shareholding at the beginning of the year (1st April 2018)
No. of shares % of total
shares of the company
No. of shares % of total
shares of the company
1 RAM KRISHAN
KHANDELWAL
14075 0.70 14075 0.70
2 TARA CHAND JAIN 4811 0.24 4811 0.24
3 BHUMESH KUMAR GAUR 4016 0.20 4016 0.20
4 RAM KRISHAN
KHANDELWAL
4000 0.20 3800 0.20
5 PAYAL PREM RAHEJA 1581 0.08 3300 0.17
6 ANITA KHANDELWAL 3253 0.16 3100 0.16
7 OM PRAKASH RAWAT 2400 0.12 3000 0.15
8 KIRIT MODI 2818 0.14 2818 0.14
10 SHAILESH BHAGVATIPRASAD DAVE
2000 0.10 2000 0.10
9 HAFEEZ SORAB CONTRACTOR 2354 0.12 2500 0.13
(iv) Shareholding Pattern of top ten Shareholders (other than Directors, Promoters and Holders of GDRs and ADRs):
(v) Shareholding of Directors and Key Managerial Personnel:
S.No
For Each of the Directors
and KMP
Shareholding at the beginning of the year (1st April 2017)
Cumulative Shareholding during the year
No. of shares
% of total
shares of
% of totalshares of
the company the company
No. of shares
Directors
1.
Mr. M M Murugappan
At the beginning of the year
-
-
-
-
Date wise Increase /Decrease in PromotersShare holding during theyear specifying the reasonsfor increase / decrease(e.g.allotment / transfer /bonus/ sweat equity etc):
- - - -
At the End of the year - - - -
(iii) Change in Promoters' Shareholding (please specify, if there is no change):
Particulars
Shareholding at the beginning of the year (1st April 2017)
Cumulative Shareholding during the year
No. of
shares
% of total shares of the company No. of shares
At the beginning of the year No change during the year
Date wise Increase / Decrease in PromotersShare holding during the year specifying thereasons for increase / decrease (e.g.allotment /transfer / bonus/ sweat equity etc):
No change during the year
At the End of the year No change during the year
% of total shares of the company
3.
Mr. Shrinivas G Shirgurkar
At the beginning of the year
-
-
-
-
Date wise Increase /Decrease in PromotersShare holding during theyear specifying the reasonsfor increase / decrease(e.g.allotment / transfer /bonus/ sweat equity etc):
-
-
-
-
At the End of the year
-
-
-
-
4.
Mr. K S Shetty
At the beginning of the year -
-
-
-
Date wise Increase /Decrease in PromotersShare holding during theyear specifying the reasonsfor increase / decrease(e.g.allotment / transfer /bonus/ sweat equity etc):
-
-
-
-
At the End of the year
-
-
-
-
5. Mr. K Srinivasan
At the beginning of the year
2650 0.13 2650 0.13
Date wise Increase /Decrease in PromotersShare holding during theyear specifying the reasonsfor increase / decrease(e.g.allotment / transfer /bonus/ sweat equity etc):
-
-
-
-
At the End of the year
2650 0.13 2650 0.13
6.
Mr. Peter Verholen
At the beginning of the year
-
-
-
-
Date wise Increase /Decrease in PromotersShare holding during theyear specifying the reasonsfor increase / decrease(e.g.allotment / transfer /bonus/ sweat equity etc):
-
-
-
-
At the End of the year - - - -
2.
Mr. Edmar Allitsch
At the beginning of the
year
-
-
-
-
Date wise Increase /Decrease in PromotersShare holding during theyear specifying the reasonsfor increase / decrease(e.g.allotment / transfer /bonus/ sweat equity etc):
-
-
-
-
At the End of the year -
-
-
-
(v) Shareholding of Directors and Key Managerial Personnel:
S.No
For Each of the Directors
and KMP
Shareholding at the beginning of the year (1st April 2017)
Cumulative Shareholding during the year
No. of shares
% of total
shares of % of totalshares of
the company the company
No. of shares
40

42 43
S.No For Each of the Directors
and KMP
Shareholding at the beginning of the year (1st April 2017)
Cumulative Shareholding during the year
No. of shares
% of totalshares of
% of totalshares of
the company the company
No. of shares
2.
Mr. Mukesh Kumar Hamirwasia, Chief Financial Officer
At the beginning of the year
-
-
-
-
Date wise Increase /Decrease in PromotersShare holding during theyear specifying the reasonsfor increase / decrease(e.g.allotment / transfer /bonus/ sweat equity etc):
-
-
-
-
At the End of the year
-
-
-
-
3.
Ms. Akanksha Bijawat, Company Secretary
At the beginning of the year
-
-
-
-
Date wise Increase /Decrease in PromotersShare holding during the yearspecifying the reasons forincrease / decrease(e.g.allotment / transfer /bonus/ sweat equity etc):
- - - -
At the End of the year - - - -
KMP
1.
Mr. Rajesh Khanna, Chief Executive
At the beginning of the year
240
0.01
240
0.01
Date wise Increase /Decrease in PromotersShare holding during the yearspecifying the reasons forincrease / decrease(e.g.allotment / transfer /bonus/ sweat equity etc):
-
-
-
-
At the End of the year 240 0.01 240 0.01
7.
Ms. Hima Srinivas
At the beginning of the year
-
-
-
-
Date wise Increase /Decrease in PromotersShare holding during theyear specifying the reasonsfor increase / decrease(e.g.allotment / transfer /bonus/ sweat equity etc):
-
-
-
-
At the End of the year - - - -
8.
Mr. M Lakshminarayan
At the beginning of the year
-
-
-
-
Date wise Increase /Decrease in PromotersShare holding during theyear specifying the reasonsfor increase / decrease(e.g.allotment / transfer /bonus/ sweat equity etc):
-
-
-
-
At the End of the year - - - -
S.No Particulars of Remuneration
Name of Directors Total Amount
(Rs. In Lakhs)
Mr. Shrinivas G Shirgurkar
Mr. K S Shetty
Ms. Hima Srinivas
Mr. M Lakshminarayan
Fee for attending board /a. committee meetings
2.30 2.40 1.40 0.20 6.30
Commissionb. * 3.00 3.00 2.81 0.10 8.91
Others, please specifyc. - - - - - Total B (1) 15.21
VI. REMUNERATION OF DIRECTORS AND KEY MANAGERIAL PERSONNEL:
A. Remuneration to Managing Director, Whole-time Directors and/or Manager:
B. Remuneration to other Directors:
1. Independent Directors
V. INDEBTEDNESS:
Indebtedness of the Company including interest outstanding/accrued but not due for payment Secured Loans
excluding
deposits
Unsecured
Loans
Deposits
Total
Indebtedness
Indebtedness at the beginning of the financial year
i) Principal Amount
-
-
-
-
ii) Interest due but not paid
-
-
-
-
iii) Interest accrued but not due
-
-
-
-
Total (i+ii+iii)
-
-
-
-
Change in Indebtedness during the financial year
Addition
-
-
-
-
Reduction
-
-
-
-
Net Change
-
-
-
-
Indebtedness at the end of the financial year
i) Principal Amount
-
-
-
-
ii) Interest due but not paid - - - -
iii) Interest accrued but not due
- - - -
S.No Particulars of
Remuneration
Name of MD/WTD/Manager Total Amount None
1 Gross salary (a) NIL
(b)
(c)
2
3
4
5
Total (A)
Ceiling as per the Act
Salary as per provisions contained in section 17(1) of the Income - tax Act, 1961 Value of perquisites u/s 17(2) Income - tax Act, 1961
Profits in lieu of salary under section 17(3) Income - tax Act, 1961
Stock Option
Sweat Equity
Commission - as % of profit - others, specify…
Others, please specify
Total (i+ii+iii) - - - -
*Commission for the year will be paid after approval of shareholders and adoption of accounts by the shareholders at the 36th Annual General Meeting.

2. Non-Executive Directors
S.No Particulars of Remuneration Name of Directors Total
Amount (Rs. InLakhs) Mr. M M
Murguppan Mr. Edmar Allitsch
Mr. K Srinivasan
Fee for attending board / committee meetings
0.90 - - 0.90
Commission - - - -
Others, please specify - - - -
Total B (2) 0.90
Total (B) = (1)+(2) 16.11
S.No
Particulars of Remuneration
Key Managerial Personnel
Mr. Rajesh Khanna, CEO
Mr. Mukesh Kumar
Hamirwasia, CFO
Ms. Akanksha Bijawat, C S
Total(Rs. In Lakhs)
1 (a) Salary as per provisions contained in section 17(1) of the Income -tax Act, 1961
97.45 30.09 7.46 135.00
1 (b) Value of perquisites u/s 17(2) Income -tax Act, 1961
15.36 2.37 - 17.73
1 (c) Profits in lieu of salary under section 17(3) Income -tax Act, 1961
- - - -
2 Stock Option - - - -
3 Sweat Equity - - - -
4 Commission
- as % of profit
-
others, specify
- - - -
5
Others, please specify
-Retirals benefit 12.80
3.34
0.90
17.04
Total (C)
125.61
35.80
8.36
169.77
VII. PENALTIES / PUNISHMENT/ COMPOUNDING OF OFFENCES:
made, if any (give
Type
Section of the
Companies Act
Brief Description
Details of Penalty / Punishment/
Compounding
fees imposed
Authority [RD / NCLT/ COURT]
Appeal
Details)
A. COMPANY Penalty None Punishment
Compounding
B. DIRECTORS
Penalty None
Punishment
Compounding
C. OTHER OFFICERS IN DEFAULT
Penalty None
Punishment
Compounding
C. Remuneration to Key Managerial Personnel other than MD/MANAGER/WTD:
4544
ANNEXURE C
ANNUAL REPORT ON CORPORATE SOCIAL RESPONSIBILITY (CSR) ACTIVITIES
1.
A brief outline of the company's CSR policy, including overview ofprojects or programs proposed to be undertaken and a referenceto the web-link to the CSR policy and projects / programs
Refer Section Corporate Social Responsibility
2.
Website link where the CSR policy is uploaded http://www.wendtindia.com/pdf/csrpolicy.pdf
3. The Composition of the CSR CommitteeMr. K S Shetty, Chairman (Independent Director) Mr. Shrinivas G Shirgurkar, Member (Independent Director)Mr. K Srinivasan, Member (Non-Executive Director)
4. Average net profit of the company for last three financial years Rs. 1618.05 Lakhs
5. Prescribed CSR Expenditure (two per cent of the amount as in item 4 above) Rs. 32.36 Lakhs
6. Details of CSR spent during the financial year
(a)
Total amount spent for the financial year (b) Amount unspent, if any
Rs. 32.36 Lakhs
-
Manner in which the amount spent during the financial year is detailed below
Sl
No CSR project or activity
identified. Sector
Location
Amount outlay
(budget) projectwise
Amount spent on
the projects /programs
Cumulative expenditure
upto the reporting
period
Amount spent: Direct
or through implementing
agency
1 Promoting Education
including special education and employment enhancing vocation skills
Promoting Literacy among children
Local Area.
Hosur, Tamilnadu
30.36 30.36 30.36 Direct
2 Research & Development in the areas of food and sustainable agriculture, environment management and renewable energy to create livelihood opportunities in rural India.
RuralDevelopmentProjects
Chennai,Tamilnadu
2.00 2.00 2.00 AMMResearchCentre
TOTAL 32.36 32.36 32.36
7. In case the company has failed to spend the two per cent of the average net profit of the last three financial years or any part thereof, the company shall provide the reasons for not spending the amount in its Board report: N.A.
8. The CSR Committee of the Company hereby confirms that the implementation and monitoring of CSR Policy, is in compliance with CSR objectives and Policy of the Company.
Place: Bengaluru
Date: 25th April 2018
K S ShettyChairman of CSR Committee
K SrinivasanDirector
(Rs. In Lakhs)
For and on behalf of the Board
a.
b.
c.

46 47
ANNEXURE – D
STATEMENT OF EMPLOYEES' REMUNERATION
A. The details of top ten employees in terms of remuneration drawn during the financial year 2017-18 as per Rule 5(2) of the Companies (Appointment and Remuneration of Managerial Personnel) Rules, 2014 duly amended by the Companies (Appointment and Remuneration of Managerial Personnel) Amendment Rules, 2016 are as follows:
Sl. No.
Name and Age Designation/ Nature of duties
Gross remuneration paid (Rsin Lakhs)
Qualification & experience (years)
Date of commencement of employment
Previous employment
1 Rajesh Khanna (57)
Chief Executive Officer
125.61 B.E (Mech), PGDBA (35 years)
01 - 10 - 1982 NIL
2 M S Venkatesh (52)
Unit Head 52.28. B.E. (28 years)
25 - 03 - 1996 Mysore Kirloskar Ltd.
5 D K Hotta (54) Business Head- Super Abrasives
29 .45 B.E., PGDBA (27 years)
16 - 09 - 2002 ICFAI Business School
6 Santosh Kulkarni P (47)
Marketing Head - SA -Domestic & Exports
24 .35 B.E. (25years)
02 - 05 - 1997 Ultra Filter Pvt. Ltd.
7 Uday R B (48) Senior General Manager - SA Manufacturing
24 .05 B.E. (26 years)
08 - 01 - 2005 Sundram Fasteners
4 Mukesh Kumar Hamirwasia (46)
Chief Financial Officer
35 .80 B.COM(Hons), ACA,AICWA (20 years)
15 - 04 - 2010 Ecom Gill Coffee Trading Pvt. Ltd.
3 S Sundariya (53) Business Head- Machine & Precision Components
37.21 IIIE (35 years)
03 - 08 - 1992 Rane Brake Lining Limited
9 Prasanna Kumar H K (56)
General Manager- TQM, Lean & Management Standards
21 .71 DME (33 years)
09 - 09 - 1985 WIDIA
10 Ponnuvel C (57) General Manager - Precision Components
21 .51 DME (33 years)
10 - 12 - 1984 Usha Telehoist Ltd.
8 Satish Kumar S (50)
General Manager- Machine Tools
21 .90 B.E. (Mech) (26 years)
06 - 10 - 1995 Gedee Weiler Pvt. Ltd.
a) None of the employees of the Company other than the Chief Executive were in receipt of remuneration for the FY 2017-18 in excess of Rupees One crore and two lakh rupees per year or eight lakhs and fifty thousand rupees per month.
B. The details of remuneration during the year 2017-18 as per Rule 5(1) of the Companies (Appointment & Remuneration of Managerial Personnel) Rules 2014 as amended by the Companies (Appointment and Remuneration of Managerial Personnel) Amendment Rules, 2016 as are as follows:
(i) the ratio of the remuneration of
each director to the median
remuneration of the employees of
the company for the financial year.
(ii) the percentage increase in
remuneration of each director, Chief
Financial Officer, Chief Executive
Officer, Company Secretary, if any,
in the financial year.
(iii) the percentage increase in the
median remuneration of employees
in the financial year.
(iv) the number of permanent
employees on the rolls of company.
N.A.
The directors are paid only sitting fees and a fixedsum as commission* for attending Board andCommittee Meetings.* subject to the shareholders' approval at the36th AGM of the Company.
Director: N.A.
CEO: 7.90%
CFO: 8%
CS: 8%
8.47%
399
(v)
(a) Average percentile increase already made in the salaries of employees other than the managerialpersonnel in the last financial year: N.A. The directors are paid sitting fees and a fixed sum ascommission for attending Board and Committee Meetings.
(b) Percentile increase in the managerial remuneration: N.A.
(c) Comparison of the above and justification thereof: N.A.
(d) Point out if there are any exceptional circumstances for increase in the managerial
remuneration: None
(vi) affirmation that the
remuneration is as per the
remuneration policy of the company.
The Company is in compliance with its
Remuneration Policy.

48 49
FORM No. MR-3
SECRETARIAL AUDIT REPORT
For the Financial Year ended 31st March, 2018
(Pursuant to Section 204 (1) of the Companies Act 2013 and rule No. 9 of the Companies (Appointment and Remuneration Personnel) Rules 2014)
To,
The Members
Wendt (India) LimitedFlat No. 105, 1st Floor, Cauvery Block, National Games Housing Complex, Koramangala,Bangalore – 560 047
I have conducted the secretarial audit of the compliance of statutory provisions and the adherence to the good corporate practices by WENDT (INDIA) LIMITED, (Corporate Identity No. L85110KA1980PLC003913 (herein after called “the Company”). Secretarial Audit was conducted in a manner that provided me reasonable basis for evaluating the corporate conducts/statutory compliances and expressing my opinions thereon.
Based on my verification of WENDT (INDIA) LIMITED books, papers minute books, forms and returns filed and other records maintained by the Company and also the information provided by the Company, its officers, agents and authorized representatives during the conduct of the secretarial audit, I hereby report that in my opinion, the Company has, during the audit period covering the financial year ended on March 31, 2018 complied with the statutory provisions listed hereunder and also that the Company has proper Board processes and compliance mechanism in place to the extent, in the manner and subject to the reporting made hereinafter:
I have examined the books, papers, minute books, forms and returns filed and other records maintained by the Company for the financial year ended on 31st March, 2018 according the provisions of:
i) The Companies Act 2013 (the Act) and rules made thereunder;
ii) The Securities Contracts (Regulation) Act, 1956 ('SCRA') and the rules made thereunder;
iii) The Depositories Act, 1996 and the Regulations and Bye-laws framed thereunder;
iv) During the year under review the Company has complied with the provisions of Foreign Exchange Management Act, 1999 and the rules and regulations made thereunder to the extent of Foreign Direct Investment and Overseas Direct Investment. There was no external Commercial Borrowings during the year under review;
v) The following Regulations and Guidelines prescribed under the Securities and Exchange Board of India Act, 1992 ('SEBI Act'):-
a) The Securities and Exchange Board of India (Substantial Acquisitions of Shares and Takeovers) Regulations, as amended from time to time;
b) The Securities and Exchange Board of India (Prohibition of Insider Trading) Regulations, as amended from time to time;
c) The Securities and Exchange Board of India (Registrars to an Issue and Share Transfer Agents) Regulations, as amended from time to time, regarding the Companies Act and dealing with client;
d) During the year the Company has not issued any new securities mandating compliance of the provisions of the Securities and Exchange Board of India (Issue of Capital and Disclosure Requirements) Regulations, as amended from time to time; and
e) During the year under review, the Company has not delisted its securities from any of the Stock Exchanges in which it is listed and hence the compliance of the provisions of the Securities and Exchange Board of India (Delisting of Securities) Regulations, as amended from time to time is not applicable.
I have also reviewed the systems and mechanisms established by the Company for ensuring compliances under the other applicable Acts, Rules, Regulations and Guidelines prescribed under various laws which are applicable to the
Company and categorized under the following major heads/groups:
1. Factories Act, 1948;
2. Labour Laws and other incidental laws related to labour and employees appointed by the Company including those on contractual basis relating to the wages, gratuity, prevention of sexual harassment, dispute resolution welfare, provident fund, insurance, compensation, etc.;
3. Industries (Development& Regulation) Act, 1991;
4. Acts and Rules prescribed under prevention and control of pollution;
5. Acts relating to the protection of IPR;
I have also examined compliance with the applicable clauses of the following:
i) Secretarial Standards issued by the Institute of Company Secretaries of India
ii) Securities and Exchange Board of India (Listing Obligations and Disclosure Requirements) Regulations , 2015;
During the period under review the Company has complied with the provisions of the Act, Rules, Regulations, Guidelines, Standards, etc. mentioned above subject to the following observations:
I) As per Regulation 38 of the SEBI ( Listing Obligations and Disclosure Requirements) Regulations, 2015 there should be a minimum public shareholding of 25% of the paid up capital of the Company. As on March 31, 2018 the Promoters' Shareholding is 79.74% of the total paid up share capital whereas the Public holds the balance 20.26% of the paid up share capital of the Company.
I further report that
The Board of Directors of the Company is duly constituted with proper balance of Executive Directors, Non-Executive Directors and Independent Directors.
Adequate notice is given to all the Directors before schedule of the Board Meetings, agenda and detailed notes on agenda were sent at least seven days in advance, and a system exists for seeking and obtaining further information and clarifications on the agenda before the meeting and for meaningful participation at the meeting. The quorum was maintained at all the meetings.
Based on the verification of records and minutes, the decisions were carried out with the consent of majority of Board of Directors / Committee Members and there were no dissenting members' views recorded in the minutes.
I further report that there are adequate systems and processes in the Company commensurate with the size and operations of the Company to monitor and ensure compliance with applicable laws, rules, regulations and guidelines.
Apeksha NagoriACS No. A21952C.P. No. A13639
Place: Date: 25th April, 2018
Bengaluru

50 4951
Certificate on Corporate governance
To
The Members
WENDT (INDIA) LIMITED
I have examined the compliance of conditions of Corporate Governance by Wendt (India) Limited (“the Company”) for the year ended 31st March 2018, as per Regulations 17-27, Clause (b) to (i) of Regulations 46(2) and paragraphs C, D and E of Schedule V of the Securities and Exchange Board of India (Listing Obligations and Disclosure Requirements) Regulations, 2015 (“Listing Regulations”).
The compliance of conditions of Corporate Governance is the responsibility of the Management. My examination was limited to procedures and implementation thereof, adopted by the Company for ensuring the compliance of the conditions of Corporate Governance. It is neither an audit or expression of an opinion on the financial statements of the Company.
In my opinion and to the best of my information and according to the explanations given, I certify that the Company has complied with the Corporate Governance as per Regulations 17-27, Clause (b) to (i) of Regulations 46(2) and paragraphs C, D and E of Schedule V of the Securities and Exchange Board of Listing Regulations, as applicable.
I state that such compliance is neither an assurance as to the future viability of the Company nor as to the efficiency or effectiveness with which the Management has conducted the affairs of the Company.
Apeksha NagoriACS No. A21952C.P. No. A13639
Place: Date: 25th April, 2018
Bengaluru
Responsibilityof the Board of
Directors
Audit &InternalControls
RiskManagement
CorporateGovernance
Transparencyin the
Organization
REPORT ON CORPORATE GOVERNANCE
Company's Philosophy on Corporate Governance
[Pursuant to Schedule V of the Securities and Exchange Board of India (Listing Obligations and Disclosure Requirements) Regulations, 2015]
Corporate Governance is based on good principles and practices such that the affairs of the Company are being managed in a way which ensures integrity, accountability, transparency and fairness in all its transactions in the widest sense and meet its stakeholder's aspirations and societal expectations. Effective corporate governance practices build the strong foundation on which commercial enterprises are built to succeed and sustain.
Governance broadly refers to the mechanism, relations, and processes by which a corporation is controlled and is directed and involves balancing the many interests of the stakeholders of a corporation.
Wendt (India) Limited (“the Company”) is committed to the adoption of best governance practices and to its adherence in the business of the Company. The Company's corporate governance practices are driven by timely disclosures, transparent accounting policies, internal control on operations and high levels of integrity in decision making with an objective to enhance the value to the stakeholders.
Your Company strives to follow the best corporate governance practices, develop the best policies/ guidelines, communicate and train all its employees in order to foster a culture of compliance and obligation at every level of the organization. We have established processes to ensure our Board functions effectively, promoting efficient and balanced decision-making, to effectively fulfill its duties in the best interest of our shareholders, employees and all other stakeholders.
The driving forces of Corporate Governance at Wendt are its core values, belief in people, entrepreneurship, customer orientation and pursuit of excellence. Your Company views its Corporate Governance policies not only to comply with the statutory requirements in letter and spirit, but also to aim at implementing the best practices, keeping in view the overall interest of all its stakeholders. Your Company considers Corporate Governance as a critical tool to enhance trust of its Customers, Employees, Investors, Government and the Community at large and achieve its goal of maximizing value for its stakeholders.
The Wendt Code of Conduct contains the fundamental principles and rules concerning ethical business conduct. The Company has adopted a Code of Conduct for its Directors, employees and officers, which is subject to regular audits to ensure controls and compliances are maintained at a high standard. Over the years, the Company has further strengthened its governance framework. This includes various procedures and practices which determine the way business is to be conducted and value generated.
In terms of distributing wealth to the shareholders, apart from having a track record of constant dividend payout, the Company has also delivered consistent unmatched shareholder returns since its listing.
Our commitment to adoption of best practices of Corporate Governance makes us compliant with the Companies Act 2013 as well as with the provisions of Corporate Governance of SEBI (Listing Obligations and Disclosure Requirements) Regulations, 2015 (“Listing Regulations”) is given below:
Company's Corporate Governance approach is based on the following:

The flow of content in this Report is as follows
Report on Corporate Governance
A. Board of Directors
B. Board Committees
C. Disclosures
D. Means of Communication
E. Non-Mandatory Requirements
We believe that an active, well informed and independent Board is necessary to ensure the highest standard of
Corporate Governance. The Board of Directors of your Company is the core of our Corporate Governance practices.
The Board being aware of its fiduciary responsibilities, recognises its responsibilities towards all stakeholders and to
uphold highest standards in all matters concerning the Company. The Board of Directors along with its Committees
provides leadership and strategic guidance to your Company's management as also direct, supervise, monitor and
review the performance of the Company. The Independent Directors provide an objective judgement on matters
placed before them.
The Company's Governance structure comprises a dual layer, the Board of Directors and the Committees of the Board
at the apex level and the Management structure at an operational level. This brings about a consistent balance in
governance. The Company's day to day affairs are managed by the Chief Executive, assisted by a competent
Management team under the overall supervision of the Board.
It is important to consider a variety of personal attributes among the Board incumbents including intellect,
judgment, openness, honesty and the ability to develop trust. A Board requires Directors who have the intellectual
capability to question status quo and debate any new policy/strategy and also offer suggestions and alternatives
which are in the best interests of the Company.
The key to good Corporate Governance is the optimum combination of the executive and non-executive Directors on
the Board along with appropriate balance of professionalism, knowledge and experience.
The Board of Directors of your Company has an optimal mix of executive and non-executive Directors. As of March
31, 2018, the Board at Wendt (India) comprises of 7 Non-Executive Directors out of which 4 are non-executive
Independent Directors including 1 Women Director. The Company is fully compliant with the Corporate Governance
norms in terms of constitution of the Board of Directors (“the Board”). The Executive Directors of your Company
have more than two decades of hands on experience in the Machine Tooling business. The Non-Executive
Independent Directors are eminent professionals with wide range of knowledge and experience in various spheres
of business and industry and finance. All Independent Directors, with their diverse knowledge and expertise, provide
valuable contribution in the deliberations and decisions of the Board, maintaining the requisite independence.
None of the Directors on the Board hold Directorships in more than twenty (20) companies or in more than ten (10)
public companies. Further, none of them is a member of more than ten (10) committees or chairman of more than
five (5) committees across all the public companies in which he or she is a Director. All the independent Directors
have confirmed that they meet the criteria as mentioned under Regulation 16 of the Listing Regulations and Section
A. BOARD OF DIRECTORS
a) Attributes of a Board
b) Size and Composition of the Board
Directorships and Committee Memberships:
149 of the Companies Act, 2013 (“Act”). The maximum tenure of the Independent Director is in compliance with the
Act. Independent Directors do not hold office as an Independent Director in more than seven (7) listed companies.
None of the Non-Executive Independent Director who is serving as a Whole time Director in a listed entity is acting as
an Independent Director in more than three (3) listed entities.
For the purpose of considering the limit of the Committees, Audit Committee and Stakeholders' Relationship
Committee of all Public Limited Companies, whether listed or not, shall be included and all other companies
including Private Limited Companies, Foreign Companies and Companies under Section 8 of the Companies Act,
2013 shall be excluded.
The total number of Directorships held by the Directors and the position of Membership / Chairmanship on
Committees as on 31st March 2018 is given below. All the Directors are compliant with the provisions of the
Companies Act, 2013 (hereinafter referred to as “the Act”) and “SEBI Regulations” in this regard.
Such declarations are placed at the Board meeting.
52
Name of the Director Category No. of Directorships/ No. of CommitteeChairmanships Memberships/ Chairmanships
(Excluding Wendt India) (Excluding Wendt India)
Public Limited Companies
M.M Murugappan Promoter and Non 9 (6 as 7 (out of which 4 asChairman Executive Director Chairman) Chairman)DIN: 00170478 (PD)
Edmar Allitsch Promoter and Non(Alternate Director- Peter Executive Director - -Verholen)- (AD) (PD)DIN: 03073511
K Srinivasan Non Executive 3 (1 asDIN: 00088424 Director (NED) Chairman) 1
Shrinivas G.Shirgurkar Non Executive/DIN: 00173944 Independent Director 4 1
(ID)
K S Shetty Non Executive/DIN: 01759936 Independent Director - -
(ID)
Hima Srinivas Non Executive/DIN: 07556717 Independent Director - -
(ID)
M Lakshminarayan Non Executive/ 6 (1 as 4 (1 asDIN: 00064750 Independent Director Chairman) Chairman)
(ID)
Note:
Independent Director means a Director as defined under SEBI (LODR) Regulations, 2015.
Number of other Directorships indicated above is exclusive of Directorships on the Board of Private Limited Companies (which are not holding or subsidiaries of Public Companies)/ Foreign Companies/ Alternate Directorship/ Section 8 Companies.
The details of the Committee membership/ Chairmanship are in relation to the specified committees viz. Audit Committee & Stakeholder Relationship Committee (SRC) of Indian Public Limited Companies.
None of the Directors holds any shares of the Company except for Mr. K Srinivasan who holds 2650 shares as on 31st March 2018.
None of the Directors are related to each other.
n
n
n
n
n
53

Name Category No. of Board Meetings during Attended last
the year 17-18 AGM held on
Held Attended 24.07.2017
M M Murugappan- Chairman PD 5 5# Yes
Edmar Allitsch PD 5 - No
Peter Verholen (Alternate to AD 5 - NoEdmar Allitsch)
K Srinivasan NED 5 5 Yes
Shrinivas G Shirgurkar ID 5 5 Yes
K S Shetty ID 5 5 Yes
Hima Srinivas* ID 5 4 Yes
M Lakshminarayan** ID 5 1 No
54 55
Changes in Board composition during the financial year 2017-18
C) Diversity in Board
n
n
n
D) Board Meetings
During the year ended 31st March 2018, there were no other changes in the Board composition other than as detailed below:
It is believed that a diverse board is able to make decisions more effectively by reducing the risk of 'groupthink', paying more attention to managing and controlling risks as well as having a better understanding of the company's stakeholders. Diversifying the board is said to have the following benefits:
More effective decision making.
Better utilisation of the talent pool.
Enhancement of corporate reputation and investor relations by establishing the company as a responsible corporate citizen
The Wendt Board comprises of eminent professionals of integrity with relevant skills and experience. The parameters of diversity comprise of academic qualifications, technical expertise, relevant industry knowledge, experience, nationality and age.
As per the legal requirement, minimum of four Board Meetings are required to be held each year and the gap between two Board Meetings shall not exceed four months. During the FY 2017-18, five (5) Board meetings were held and the gap between two meetings did not exceed one hundred and twenty days. The necessary quorum was present for all the meetings. The dates on which the said meetings were held are as follows:
24th April 2017,
24th July 2017,
23rd October 2017,
24th January 2018,
20th March 2018.
The tentative annual calendar of Board Meetings for the ensuing year is decided in advance by the Board which is to be held after the end of each financial quarter. Apart from the above, additional Board meetings will be convened to address specific needs, if any, of the Company otherwise the Board's approval will be taken by passing resolution by circulation, as permitted by law, which will be approved in the ensuing Board Meeting. Committees of the Board meet whenever required.
The Board Meetings are governed by a structured Agenda. Agenda for each meeting along with the explanatory notes are drafted and distributed well in advance to the Directors. Presentations are made by the CEO and the Senior
Management Team on the Company's performance, operations, plans and other matters of importance on quarterly basis. The Board has complete access to any information within your Company and they are updated about their roles and responsibilities in the Company.
The Company Secretary, records the minutes of the proceedings of Committee and Board Meetings. The draft minutes are circulated to all Board members within the stipulated time for their comments. The final minutes are entered in the Minutes Book and signed by the Chairman within 30 days from the conclusion of each meeting.
The attendance of each Director at the Board meetings and at the last Annual General Meeting (AGM) is as under:
# Mr M M Murugappan attended the Board Meeting dated 24th January 2018 through audio means.
* Ms. Hima Srinivas was inducted as a member on 24th April 2017.
** Mr. M Lakshminarayan was inducted as a member on 20th March 2018.
Independent Directors play an important role in the governance processes of the Board. With different points of views flowing from their expertise and experience they enrich the decision making process at the Board and prevent conflicts of interest in the decision making process. All the board members including Independent Directors have the opportunity and access to interact with the management. The Independent Directors have submitted declarations that they meet the criteria of Independence laid down under the Companies Act, 2013 and the Listing Regulations and have confirmed that they do not hold directorship more than the prescribed limit in the Listing Regulations.
A meeting of Independent Directors was held on 20th March 2018 in terms of requirements of the Companies Act 2013 and Rules made thereunder regulation 25(3) of the SEBI (Listing Obligations and Disclosure Requirements) Regulations, 2015.
The appointment of Independent Directors is carried out in a structured manner. The Nomination & Remuneration Committee identifies potential candidates based on certain laid down criteria and takes into consideration the diversity of the Board. As regards the appointment and tenure of Independent Directors, following is the policy adopted by the Board:
Wendt Board has adopted the provisions with respect to appointment and tenure of Independent Directors which is consistent with the Companies Act, 2013.
The Independent Directors will serve a maximum of two terms of five years each.
None of the Independent Directors serve as “Independent Directors” in more than seven listed companies.
In the process of transition to the Companies Act, 2013, which is effective 1st April 2014, those Independent Directors who have already served for ten or more years will serve for a maximum period of one term of five years.
Independent Directors
Appointment and Tenure
n
n
n
n
Name Category Nature of Change Remarks
Hima Srinivas Non Executive/
Independent Director
Appointed as an Additional
and Independent Director
Shareholders’ approved
the appointment at the
35th AGM of the
Company.
M Lakshminarayan Non Executive/
Independent Director
Appointed as an
Additional Director
Shareholders’ approval
for his appointment as an
Independent Director u/s
149 of the Companies
Act, 2013 is being sought
at the 36th AGM.

distributed for the Board meetings. During the Board meetings, the senior management is invited to present the plans and achievements relating to their respective areas of responsibility.
Information Placed before the Board:
The following information is regularly provided to the Board, as part of agenda papers for the Board meetings:
All matter covered under the Listing Requirements.
Annual operating plans and budgets and any updates.
Capital budgets and any updates.
Quarterly results for the listed entity and its business segments.
Minutes of meetings of audit committee and other committees of the board of directors.
Quarterly update on wholly owned subsidiaries.
The information on recruitment and remuneration of senior officers just below the level of board of directors, including appointment or removal of Chief Financial Officer and the Company Secretary.
Purchase and Sale of investments, subsidiaries, assets which are material in nature and not in normal course of business.
Quarterly details of investments by the Company in liquid mutual funds and returns thereon.
Quarterly details of foreign exchange exposures and the steps taken by management to limit the risks of adverse exchange rate movement, if material.
Non-compliance of any regulatory, statutory or listing requirements and shareholders service such as non-payment of dividend, delay in share transfer etc.
Show cause, demand, prosecution notices and penalty notices, which are materially important.
Fatal or serious accidents, dangerous occurrences, any material effluent or pollution problems.
Any material default in financial obligations to and by the listed entity, or substantial non-payment for goods sold by the listed entity.
Any issue, which involves possible public or product liability claims of substantial nature, including any judgement or order which, may have passed strictures on the conduct of the listed entity or taken an adverse view regarding another enterprise that may have negative implications on the listed entity.
Details of any joint venture or collaboration agreement.
Transactions that involve substantial payment towards goodwill, brand equity, or intellectual property.
Significant labour problems and their proposed solutions. Any significant development in Human Resources/ Industrial Relations front like signing of wage agreement, implementation of Voluntary Retirement Scheme etc.
Update on order book position.
Updates on R & D, Lean manufacturing and major sales initiatives taken by Company.
Updates on HR related activities.
Updates on any regulatory or statutory requirements.
The Board has established procedures to periodically review compliance reports pertaining to all laws applicable to the Company prepared by the Company as well as steps taken by the Company to rectify instances of non- compliances.
Committees are a means of improving Board effectiveness in areas where more focused, specialized and extensive discussions are required. Some of the Board functions are performed through specially constituted Board Committees consisting of Non-Executive / Independent Directors, which then report to the Board. The Board's Committees include Audit Committee, Stakeholder Relationship Committee, Corporate Social Responsibility Committee and Nomination and Remuneration Committee.
All Committees have formally established terms of reference/ charter, subject to revision/amendment as and when required and are in line with the requirements of Companies Act, 2013 and the SEBI Regulations. The Chairman of
n
n
n
n
n
n
n
n
n
n
n
n
n
n
n
n
n
n
n
n
n
n
B. BOARD COMMITTEES
This is consistent with the provisions of Companies Act, 2013. In effect, the transition will be managed by re-appointing such Independent Directors for a period of one more term that does not exceed five years.
Pursuant to the provisions of the Act and the SEBI Regulations, the Board of Directors (Board) has carried out an annual evaluation of its own performance, and that of its committees and individual directors. A structured questionnaire was prepared after taking into consideration the inputs received from the Directors, covering aspects of the Board's functioning such as adequacy of the composition of the Board and its committees, execution and performance of specific duties, obligations and governance.
A separate exercise was carried out to evaluate the performance of Individual Director including the Chairman of the Board. The Directors performance was evaluated on parameters such as level of engagement and contribution in safeguarding the interest of the Company, understanding of the role and responsibilities, understanding of the business and competitive environment, effectiveness of the contributions made during the Board meetings, understanding of the strategic issues and challenges for your Company etc.
In assessing the overall performance of the Board, the parameters included the assessment of time devoted by the Board on the Company's long term goals and strategies, Board effectiveness, quality of discussions at the meetings of the Board, time spent and quality of discussions on key subjects like risk assessment and minimization and governance duties and performance of specific duties.
The questionnaires for assessing the performance of the Committees of the Board included aspects like understanding of the terms of reference by the Committee members, adequacy of the composition of the Committees, effectiveness of the discussions at the Committee meetings, information provided to the Committee to discharge its duties, performance of the Committee vis-à-vis its responsibilities, etc.
The Chairperson was evaluated mainly on key aspects of his role. These performance exercises were conducted seeking inputs from all the Directors/ committee members wherever applicable.
An appropriate induction program for new Directors and an ongoing familiarization with respect to the business / working of the Company for all Directors is a major contributor for meaningful Board level deliberations and sound business decisions. At the time of appointing a Director, a formal letter of appointment is given to the Director, inter alia, explaining the role, function, duties and responsibilities of the Director and the Board's expectations from the Director. The Director is also explained in detail the compliances required from him / her under the Act, SEBI Regulations and other relevant regulations and his / her affirmation taken with respect to the same.
A presentation is also shared with the newly appointed director giving an overarching perspective of the industry, organizational set up of the Company, the functioning of various divisions / departments, Company's market share and the markets in which it operates, brand equity, governance and internal control processes and other relevant information pertaining to the Company's business.
Further, as an ongoing process, the Board of Directors is updated on a quarterly basis through presentations and discussions on the overall economic trends, the performance of the Company, analysis of the circumstances which helped or adversely impacted the Company's performance, comparison of the Company's performance and the initiatives taken / proposed to be taken to bring about an overall improvement in the performance of the Company, marketing strategy, business risks and mitigation plan etc.
The familiarization program for Independent Directors is disclosed on the Company's website .
All the information that is required to be made available, as applicable to the Company, in terms of Schedule II Part A of the SEBI (LODR) Regulations, 2015, is regularly provided to the Board as a part of the agenda papers well in advance of the Board meetings. There is a structured manner in which the agenda items are prepared and
Board Evaluation
Board Familiarization Process
e) Information supplied to the Board of Directors
www.wendtindia.com
56 57

58 59
each Committee fulfills an important leadership role similar to that of the Chairman of the Board, particularly in creating an environment for effective contribution of each Committee member. While each Committees follows its charter, it also takes up for discussions, matters referred to it by the Board. The minutes of each Committee's meeting are submitted to the Board for information and appropriate action.
The Audit Committee of the Board of Directors is entrusted with the responsibility to supervise the internal control and financial reporting process. The Committee acts as a link between the statutory and internal auditors and the Board of Directors. It assists the Board in fulfilling its oversight responsibilities of monitoring financial reporting processes, reviewing the Company's established systems & processes for internal financial controls, governance and reviewing the Company's statutory and internal audit activities. Majority of the Members on the Committee, including the Chairman are Independent Directors.
The Committee is constituted and governed by a Charter which is in line with the provisions of Regulation 18 of SEBI (LODR) Regulations 2015, read with section 177 of the Companies Act 2013. The functions performed by the Committee are broadly as under:
Terms of Reference/Charter of the Audit Committee
A. Powers:
1. To investigate any activity within its terms of reference.
2. To seek information from any employee.
3. To obtain outside legal or other professional advice.
4. To secure attendance of outsiders with relevant expertise, if it considers necessary.
B. The role of the audit committee shall include the following:
1. Overseeing the Company's financial reporting process and the disclosure of its financial information to ensure that the financial statement is correct, sufficient and credible;
2. Recommendation for appointment, remuneration and terms of appointment of auditors of the listed entity;
3. Approval of payment to statutory auditors for any other services rendered by the statutory auditors;
4. Reviewing, with the management, the annual financial statements and auditor's report thereon before submission to the board for approval, with particular reference to:
a. Matters required to be included in the director's responsibility statement to be included in the board's report in terms of clause (c) of sub-section (3) of Section 134 of the Companies Act, 2013;
b. Changes, if any, in accounting policies and practices and reasons for the same;
c. Major accounting entries involving estimates based on the exercise of judgment by management;
d. Significant adjustments made in the financial statements arising out of audit findings;
e. Compliance with listing and other legal requirements relating to financial statements;
f. Disclosure of any related party transactions;
g. Modified opinion(s) in the draft audit report;
5. Reviewing, with the management, the quarterly financial statements before submission to the board for approval;
6. Approval or any subsequent modification of transactions of the Company with related parties;
7. Scrutiny of inter-corporate loans and investments;
8. Evaluation of internal financial controls and risk management systems;
9. Reviewing, with the management, performance of statutory and internal auditors, adequacy of the internal control systems;
10. Reviewing the adequacy of internal audit function, if any, including the structure of the internal audit department, staffing and seniority of the official heading the department, reporting structure coverage and frequency of internal audit;
a. AUDIT COMMITTEE
11. Discussion with internal auditors of any significant findings and follow up there on;
12. Reviewing, with the management, the statement of uses / application of funds raised through an issue (public issue, rights issue, preferential issue, etc.), the statement of funds utilized for purposes other than those stated in the offer document / prospectus / notice and the report submitted by the monitoring agency monitoring the utilisation of proceeds of a public or rights issue, and making appropriate recommendations to the board to take up steps in this matter;
13. Reviewing and monitoring the auditor's independence and performance, and effectiveness of audit process;
14. Valuation of undertakings or assets of the Company, wherever it is necessary;
15. Reviewing the findings of any internal investigations by the internal auditors into matters where there is suspected fraud or irregularity or a failure of internal control systems of a material nature and reporting the matter to the board;
16. Discussion with statutory auditors before the audit commences, about the nature and scope of audit as well as post-audit discussion to ascertain any area of concern;
17. To look into the reasons for substantial defaults in the payment to the depositors, debenture holders, shareholders (in case of non-payment of declared dividends) and creditors;
18. To review the functioning of the whistle blower mechanism;
19. Approval of appointment of chief financial officer after assessing the qualifications, experience and background, etc. of the candidate;
20. Carrying out any other function as is mentioned in the terms of reference of the audit committee.
C. The audit committee shall mandatorily review the following information:
1. Management discussion and analysis of financial condition and results of operations;
2. Statement of significant related party transactions (as defined by the audit committee), submitted by
management;
3. Management letters / letters of internal control weaknesses issued by the statutory auditors;
4. Internal audit reports relating to internal control weaknesses; and
5. The appointment, removal and terms of remuneration of the Internal Auditor shall be subject to review by
the Audit Committee.
6. Statement of deviations:
(a) Quarterly statement of deviation(s) including report of monitoring agency, if applicable, submitted to stock
exchange(s) in terms of Regulation 32(1).
(b) Annual statement of funds utilized for purposes other than those stated in the offer
document/prospectus/notice in terms of Regulation 32(7).
During the year 2017-18, the Audit Committee met (4) four times during the year. As per the statutory requirement,
the maximum gap between two Audit Committee Meetings did not exceed the mandatory four months. The dates
on which the said meetings were held are as follows:
24th April 2017,
24th July 2017,
23rd October 2017,
24th January 2018.
The necessary quorum was present for all the meetings. All the members on the Audit Committee possess the
requisite qualification for appointment on the Committee and have sound knowledge of finance, accounting
practices and internal controls and are financially literate and have requisite experience in financial management.
Meetings of the Audit Committee

60
The representatives of the Statutory Auditors are permanent invitees to the Audit Committee Meetings. They have
attended all the Audit Committee Meetings held during the year. The CEO and CFO are also the permanent invitees
to the Committee and the Internal Auditors and the senior management executives are invited to participate in the
meetings of the Audit Committee wherever necessary, as decided by the Committee.
The Chairman of the Audit committee was present at the last Annual General Meeting held on 24th July 2017.
The Company Secretary officiates as the Secretary of the Committee.
The composition of the Audit Committee and the details of meetings attended by its members are given below:
*Mr. M Lakshminarayan was inducted as a member on 20th March 2018.
The Stakeholder Relationship Committee is constituted in line with the provisions of Regulation 20 of SEBI (LODR)
Regulations 2015 read with section 178 of the Act. The Stakeholder Relationship Committee has been constituted to
assist the Board in safeguarding the interests of and redressing the grievances of the security holders of the
Company.
Terms of Reference/Charter of the Stakeholder Relationship Committee
The Stakeholder Relationship Committee of the Board is constituted with powers and responsibilities including, but
not limited to:
To approve/ reject registration of transfer/ transmission/transposition of shares.
To monitor and review the mechanism for redressal of shareholders' / investors' grievances.
To approve/ reject for demat/ remat of shares.
To authorize issue of Duplicate Share Certificates and Share Certificates after Split / Consolidation /
Rematerialization and in Replacement of those which are defaced, mutilated, torn or old, decrepit or worn
out
To monitor and review the performance and service standards of the Registrar and Share Transfer Agents of
the Company and provide continuous guidance to improve the service levels.
To authorise Company Secretary to attend to matters relating to non-receipt of annual reports, notices, non-
receipt of declared dividend/interest, change of address for correspondence etc and to monitor action taken;
To carry out any other function as is mandated by the Board from time to time and / or enforced by any
statutory notification, amendment or modification, as may be applicable.
The Stakeholders Relationship Committee comprises of Mr M M Murugappan as Chairman, Mr K Srinivasan and
Mr K S Shetty as members. The Committee meets as often as required to discharge its function. Details of share
transfers/ transmissions, approved by the Committee are placed before the Board on a regular basis.
During the year, the Stakeholder Relationship Committee met on 20th March 2018 and the details of the attendance
by the Committee members are as follows:
b. STAKEHOLDER RELATIONSHIP COMMITTEE
n
n
n
n
n
n
n
Name of Member* Category No. of Committee meetings during
the year 2017-18
Held Attended
Shrinivas G Shirgurkar (Chairman) ID 4 4
K S Shetty ID 4 4
Hima Srinivas ID 4 3
K Srinivasan NED 4 4
Details of complaints received, and the number of pending complaints are furnished in the “General Shareholder
Information” section of this Annual Report.
As per SEBI Circular an exclusive mail id has been created to address the Investor
Grievances.
The Company Secretary acts as the Secretary to the Committee.
The Board has appointed the Company Secretary of the Company as the Compliance Officer for the purpose of
compliance with the requirements of the SEBI Regulations.
The Corporate Social Responsibility Committee's responsibility is to assist the Board in undertaking CSR Activities by way of formulating and monitoring spending on CSR Activities by the Company. The composition of the CSR Committee is in alignment with provisions of Section 135 of the Companies Act, 2013. The Board has approved a CSR policy formulated and recommended by the Committee which is uploaded and available on the Company's website
.
The CSR Committee comprises of Mr. K S Shetty as Chairman, Mr. Shrinivas G Shirgurkar and Mr. K Srinivasan as members.
Terms of Reference/Charter of the Corporate Social Responsibility Committee
The responsibilities of the Corporate Social Responsibility Committee are to:
Formulate and recommend to the Board, a CSR Policy which shall indicate the activities to be undertaken by the Company as specified in Schedule VII of the Companies Act, 2013.
Review and recommend the amount of expenditure to be incurred on the activities referred to above.
Institute a transparent monitoring mechanism for implementation of the CSR activities.
To provide guidance on various CSR activities to be undertaken by the Company and to monitor its progress.
To monitor the implementation of the CSR Policy of the Company from time to time.
Review the performance of the Company in the area of Corporate Social Responsibility.
To make amendments or modifications in CSR Policy as required by law or otherwise.
Carry out any other function or activity as may be considered for ensuring corporate social responsibility objectives are met.
Meetings of the Corporate Social Responsibility Committee
The Committee met 2 (two) times during the financial year 2017-18 on 23rd October 2017 and 20th March 2018. The composition and attendance of the Committee members are as follows:
www.wendtindia.com
c. CORPORATE SOCIAL RESPONSIBILITY (CSR) COMMITTEE
n
n
n
n
n
n
n
n
Name Category No. of Committee Meetings
during the year 2017-18
Held Attended
M M Murugappan, Chairman PD 1 1
K Srinivasan NED 1 1
K S Shetty ID 1 1
Name Category No. of Committee Meetings
during the year 2017-18
Held Attended
K S Shetty, Chairman ID 2 2
Shrinivas G Shirgurkar ID 2 2
K Srinivasan NED 2 2
The Company Secretary of the Company officiates as the Secretary of the Committee.
61

62
d. NOMINATION & REMUNERATION COMMITTEE
n
n
n
n
n
n
POLICY FOR SELECTION AND APPOINTMENT OF DIRECTORS AND THEIR REMUNERATION
The Nomination and Remuneration committee of the Company is constituted in line with the provisions of Regulation 19 of SEBI (LODR) Regulations 2015, read with section 178 of the Companies Act 2013. It is the responsibility of the Committee to determine the composition of the Board based on need and requirements of the Company from time to time and to identify and nominate suitable candidates for Board membership. The Committee also formulated policies relating to the remuneration of Directors, Key Managerial Personnel and other employees of the Company.
The Nomination & Remuneration Committee comprises of Mr. K S Shetty as Chairman, Mr. Shrinivas G Shirgurkar and Mr. K Srinivasan as members.
Terms of Reference/Charter of the Nomination & Remuneration (N&R) Committee
Formulation of the criteria for determining qualifications, positive attributes and independence of a director and recommend to the board of directors a policy relating to, the remuneration of the directors, key managerial personnel and other employees;
Formulation of criteria for evaluation of performance of Independent Directors and the Board of Directors;
Identifying persons who are qualified to become directors and who may be appointed in senior management in accordance with the criteria laid down, and recommend to the board of directors their appointment and removal;
Devising a policy on diversity of Board of Directors;
Whether to extend or continue the term of appointment of the Independent Director, on the basis of the report of performance evaluation of Independent Directors.
Carrying out any other function as is mandated by the Board from time to time and / or is enforced by any statutory notification, amendment or modification, as may be applicable.
During the year, the Nomination & Remuneration Committee met on 24th April 2017, 23rd October 2017 and 20th March 2018 and the details of the attendance by the Committee members are as follows:
The Company Secretary of the Company officiates as the Secretary of the Committee.
The Nomination & Remuneration (N&R) Committee has adopted a Charter which, inter alia, deals with the manner of selection of Board of Directors and CEO and their remuneration. This Policy is accordingly derived from the said charter.
1. Criteria for Selection & Remuneration of Non-Executive Directors
a. Nomination and Remuneration Committee while evaluating the potential candidates, considers a variety of personal attributes, including experience, intellect, foresight, judgment and transparency, and match these with the requirements set out by the Board.
b. The Non-Executive Directors shall be of high integrity with relevant expertise and experience so as to have a diverse Board with directors having qualifications in terms of personal traits, experience & background, fit &
proper, positive attributes and independence standards.
c. In case of appointment of Independent Directors, the N&R Committee shall certify itself with regard to the independent nature of the Directors vis-a-vis the Company so as to enable the Board to discharge its function and duties effectively.
d. In case of re-appointment of Non-Executive Directors, the Board shall take into consideration the performance evaluation of the Director and his engagement level.
e. Remuneration of Non-Executive Directors:
The Non-Executive Directors (“NEDs”) are paid remuneration by way of Sitting Fees within the limits prescribed under the Companies Act, 2013 for every Board/ Committee meeting attended by them.
Non-Executive and Independent Directors will be paid an amount up to Rs. 3.00 lakhs not exceeding 3% of the net profits of the Company for the year, in accordance with section 197 of the Companies Act, 2013. Commission for the year 2017-18 will be paid after approval of shareholders and adoption of accounts by the shareholders at the 36th Annual General Meeting.
2. Criteria for Selection & Remuneration of Key Management Personnel / Senior Executives
a. The Company's total compensation for Key Management Personnel / Senior Executives consists of:
Fixed compensation
Variable compensation in the form of annual incentive
Benefits
Work related facilities and perquisites
b. Fixed compensation is determined on the basis of size and scope of the job typically as reflected by the level or grade of the job, trends in the market value of the job and the skills, experience and performance of the employee. Fixed compensation includes Basic Salary, Housing Allowance, Leave Travel Allowance and a cash allowance.
c. The Annual Incentive (variable pay) of senior executives is linked directly to the performance of the Business Unit and the Company through a Balanced Score Card in accordance with the Employees Incentive Scheme of the Company. The Balanced Score Card comprises goals under four perspectives – Financial, Customer, Internal Process and Learning and Growth Perspective. The objective is to reward current performance as reflected in the financial perspective as well as to focus on initiatives to secure the long-term health of the Company as encapsulated in the other three Perspectives.
d. A formal annual performance management process is applicable to all employees, including senior executives. Annual increases in fixed and variable compensation of individual executives are directly linked to the performance ratings of individual executives.
e. Overall compensation is subject to periodic reviews which take into account data from compensation surveys conducted by specialist firms, as well as factors such as affordability based on the Company's performance and the economic environment.
A copy of Remuneration Policy is made available on the website of the Company
Your Company has in place a Code of Conduct which helps to maintain high standards of ethics for the Company's employees. The Code lays down the standard of conduct which is expected to be followed by the Directors and by the employees in their business dealings and in particular on matters relating to integrity in the work place, in business practices and in dealing with stakeholders. The Company has adopted a Code of Conduct which applies to all its Directors and employees in terms of Regulation 17 of the SEBI (LODR) Regulations, 2015.
All the Board Members and the Senior Management Personnel of your Company have affirmed their compliance with the Code of Conduct for the current year. A declaration signed by the Chief Executive has been submitted to the Board.
l
l
n
n
n
n
www.wendtindia.com
C DISCLOSURES
(A) WENDT (INDIA) CODE OF CONDUCT
63
Name Category No. of Committee Meetings
during the year 2017-18
Held Attended
K S Shetty, Chairman ID 3 3
Shrinivas G Shirgurkar ID 3 3
K Srinivasan NED 3 3

64
A copy of the Code of Conduct is made available on the website of the Company .
The Company has adopted a “Code of Conduct for prevention of Insider Trading” to regulate, monitor and report trading by insiders under the SEBI (Prohibition of Insider Trading) Regulations 2015. The Code requires pre-clearance for dealing in the Company's shares for all transactions by Directors and designated employees (together called Designated Persons) and prohibits the purchase or sale of Company securities by Designated Persons while in possession of unpublished price sensitive information in relation to the Company. Further, trading in securities is also prohibited for Designated Persons during the period when the Trading Window is closed. The Company Secretary is responsible for implementation of the Code. The Company also has in place a Code for practices and procedures for fair disclosure of unpublished price sensitive information which is hosted on the website of the Company.
Wendt is committed to the highest standards of Corporate Governance and stakeholder responsibility. It has adopted a Whistle Blower Policy under Vigil mechanism and has established the necessary mechanism in line with the requirements under the Companies Act, 2013, Listing Agreement and SEBI (Listing Obligations and Disclosure Requirements) Regulations, 2015.
Your Company has a well established whistle blower policy as part of a vigil mechanism for Directors and employees to report concerns about unethical behaviour, actual or suspected fraud or violation of the Company's Code of conduct or ethics policy. This mechanism also provides for adequate safeguards against victimization of Director(s) / employee(s) who avail of the mechanism and also provides for direct access to the Chairman of the Audit Committee in exceptional cases.
The Company takes a Quarterly Report from the Ombudsman appointed for the Group.
A copy of Whistle Blower Policy is made available on the website of the Company
The Company has two wholly owned overseas subsidiaries. The Company does not have any material non-listed Indian Subsidiary Company, whose turnover or net worth (paid-up capital and free reserves) exceeds 20% of the consolidated turnover or net worth of the holding company in the immediately preceding accounting year or has generated 20% of the consolidated income of the Company. Both the subsidiary companies are managed with their Board having the rights and obligations to manage such companies. The Board of Directors of the subsidiary companies meet quarterly to review the quarterly performance and subsequently the same are being placed before the Board of Directors of your Company.
A copy of Policy for determining Material Subsidiaries is made available on the website of the Company
All related party transactions that were entered into during the financial year were on an arm's length basis and were in the ordinary course of business. All Related Party transactions were placed before the Audit Committee for approval. The Audit Committee has granted omnibus approval for Related Party transactions as per the provisions and restrictions contained in the Listing Regulations. Details of Related Party Transactions are provided in the Financial Statements of the Company.
A copy of Policy on Related Party Transactions is made available on the website of the Company
Your Company has complied with all requirements of the Stock Exchanges, SEBI and other statutory authorities on all matters relating to capital markets during the past three years. No penalties or strictures have been imposed on the Company by the Stock Exchanges, SEBI or any other statutory authorities relating to the above.
Your Company follows the mandatory Accounting Standards notified under the Companies Act, 2013 and
www.wendtindia.com
www.wendtindia.com
www.wendtindia.com
www.wendtindia.com
.
(B) PREVENTION OF INSIDER TRADING
(C) WHISTLE BLOWER POLICY
(D) SUBSIDIARY COMPANIES
(E) RELATED PARTY TRANSACTIONS
(F) COMPLIANCE OF MATTER RELATING TO CAPITAL MARKET
(G) ADHERENCE TO ACCOUNTING STANDARDS
prescribed by The Institute of Chartered Accountants of India and to the best of its knowledge, there are no deviations in the accounting treatment that require specific disclosure.
As a voluntary approach, the Company has adopted “IND AS” w.e.f. the financial year 2016-17 and the same has been followed for the financial year 2017-18.
The Directors are satisfied that your Company has adequate resources to continue its business for the foreseeable future and consequently consider it appropriate to adopt the going concern basis in preparing the financial statements.
The Company has been addressing various risks impacting the Company. The Company has comprehensive risk management policy and the same is periodically reviewed by the Board of Directors. The Risk Management Issues are discussed in the Management Discussion and Analysis Report.
Your Company has no pecuniary relationship or transaction with its non-executive Directors other than payment of sitting fees and commission for attending Board and Committee Meetings.
The Company has from this year onwards introduced payment of commission to Non-Executive and Independent Directors subject to approval by the shareholders at the ensuing AGM. For any successful organization, overall remuneration (sitting fees and commission) should be reasonable and sufficient to attract, retain and motivate Directors aligned to the requirements of the Company (taking into consideration the challenges faced by the Company and its future growth imperatives).
The actual commission will be paid to the Non-Executive and Independent Directors based on the time spent by the Directors for attending to the affairs and business of the Company and extent of responsibilities cast on Directors under general law and other relevant factors and it will be restricted to a fixed sum as decided by the Board of Directors and approved by the shareholders within the ceiling as per the Act.
Details of Remuneration paid to Directors for the period under review are as follows.
(H) INDIAN ACCOUNTING STANDARDS (IND AS) – IFRS CONVERGED STANDARDS
(I) GOING CONCERN
(J) RISK MANAGEMENT
(K) REMUNERATION OF DIRECTORS
65
Director Sitting Fee* Commission #
M M Murugappan- Chairman 0.90 Nil
Edmar Allitsch Nil Nil
Peter Verholen (Alternate to Edmar Allitsch) Nil Nil
K Srinivasan Nil Nil
Shrinivas G Shirgurkar 2.30 3.00
K S Shetty 2.40 3.00
Hima Srinivas 1.40 2.81
M Lakshminarayan 0.20 0.10
*Sitting Fee includes Board, Audit Committee, Stakeholders Relationship Committee, Corporate Social Responsibility Committee and Nomination & Remuneration Committee fees.
# Commission will be paid subject to shareholder's approval and after adoption of accounts by shareholders at the 36th Annual General Meeting.
(Rs. In Lakhs)

As required under the SEBI Regulations and as per the Companies Act, 2013, the brief profile of the Director who is retiring by rotation and eligible for re-appointment is as follows:
The Company has undertaken Secretarial Audit for the year 2017-18 which, inter alia, includes audit of compliance with the Companies Act, 2013, and Regulations and Guidelines prescribed by the Securities and Exchange Board of India. The Secretarial Audit Report forms part of this Report.
In accordance with the requirements of Regulation 17(8) of the SEBI Regulations, 2015, Mr Rajesh Khanna, Chief Executive and Mr Mukesh Kumar Hamirwasia, Chief Financial Officer of the Company have certified to the Board regarding the fairness of the financial statements and other matters as required under the above regulation.
Along with this report on Corporate Governance, certificate from the Auditor is annexed as required by the SEBI Regulations.
Details of Annual General Meetings
Location and time, where last three Annual General Meetings held:
(N) SECRETARIAL AUDIT REPORT
CEO/CFO CERTIFICATION
REPORT ON CORPORATE GOVERNANCE
GENERAL BODY MEETINGS
Date of Birth 7th September 1946
Date of appointment 20th March 2018
Qualification Masters degree in Mechanical Engineering from IIT, Mumbai
Experience in Specific functional areas Mr. Lakshminarayan holds a Master's degree in Mechanical
Engineering from IIT, Mumbai and is a fellow member of the
Indian Institute of Production Engineering. He has served as
the Joint Managing Director of Bosch Limited. Besides being
the Chairman of WABCO India, he is also on the Boards of
several companies like Rane (Madras), TVS Electronics and
Kirloskar Oil Engines India Limited. He has been the
Chairman of Confederation of Indian Industry, Southern
Region Council & Karnataka State Council besides being a
member of Karnataka State Industrial Policy Board and an
Executive Council Member of Indian Machine Tool
Manufacturer's Association.
Name M Lakshminarayan
Date of Birth 22nd November 1957
Date of appointment 30th January 2002
Qualification B Tech(Mechanical)
Experience in Specific functional areas Mr K Srinivasan holds a bachelor's degree in mechanical
engineering. He has over 35 years of experience in the
machine tools and abrasive industries in sales, technical,
production and general management. He was part of the
Management Council of the Wendt Group Global. He was
a part of the team that turned around the Industrial
Ceramics Business of CUMI. He was handling the
Marketing and Business Development function at
Abrasives before taking over the mantle of President &
Wholetime Director of CUMI. Presently he is the Managing
Director of CUMI and director in other group and associate
companies.
Name K Srinivasan
66
Details of Shareholding of Directors as on 31st March 2018 is as below:
(i) To avoid duplication and overlap between the Director's Report and a separate Management Discussion and Analysis Report, the information required to be provided has been given in the Directors Report itself as required by the SEBI Regulations.
(ii) No material transaction has been entered into by the Company with the Promoters Directors or the senior management, their subsidiaries or relatives etc. that may have a potential conflict with interest of the Company at large. The declaration to this effect has been submitted by all the senior management.
As required under the SEBI Regulations and as per the Companies Act, 2013, the brief profile of the Director who is recommended by the Board for appointment is as follows:
(L) MANAGEMENT
(M)SHAREHOLDERS
67
Director No. of Shares (Rs. 10/- Paid up )
M M Murugappan- Chairman Nil
Edmar Allitsch Nil
Peter Verholen (Alternate to Edmar Allitsch) Nil
K Srinivasan 2,650
Shrinivas G Shirgurkar Nil
K S Shetty Nil
Hima Srinivas Nil
M Lakshminarayan Nil

No postal ballot was conducted by the Company during the last three financial years.
No special resolution was passed during the last three financial years.
Your Company follows a robust process of communicating with its stakeholders and investors. For this purpose, it displays multiple channels of communications viz. through dissemination of information on the on-line portal of the Stock Exchanges, press releases, the Annual Reports and uploading relevant information on its website
. Timely disclosure of consistent, comparable, relevant and reliable information on corporate financial performance is at the core of good governance. Towards this end:
a) Quarterly/Half Yearly/Annual Results: The unaudited quarterly results are announced within forty-five days of the close of the quarter. The audited annual results are announced within two months from the close of the financial year, as required under SEBI Regulations. The aforesaid financial results are announced to the Stock Exchanges within thirty minutes from the close of the Board Meeting at which these were considered and approved.
D. MEANS OF COMMUNCIATION
www.wendtindia.com
b) Stock Exchange: Your Company makes timely disclosures of necessary information to BSE Limited and the National Stock Exchange of India Limited in terms of the Listing Regulations and other rules and regulations issued by the SEBI.
The Company discloses to the Stock Exchanges, all information required to be disclosed under Regulation 30 read with Part A of Schedule III of the SEBI Regulations including material information having a bearing on the performance / operations of the Company or other price sensitive information. All information is filed electronically on BSE's on-line Portal - BSE Corporate Compliance & Listing Centre (Listing Centre) and on NSE Electronic Application Processing System (NEAPS), the on-line portal of National Stock Exchange of India Limited.
c) NEAPS (NSE Electronic Application Processing System): NEAPS is a web-based application designed by NSE for corporates. All periodical compliance filings, inter alia, shareholding pattern, Corporate Governance Report, corporate announcements, amongst others are also filed electronically through NEAPS.
d) BSE Corporate Compliance & Listing Centre: BSE Listing is a web-based application designed by BSE for corporates. All periodical compliance filings, inter alia, Shareholding pattern, Corporate Governance Report, Corporate announcements, amongst others are also filed electronically on the Listing Centre.
e) Publication of Quarterly/Half Yearly/Annual Results: The Quarterly/ Half Yearly/Annual Financial Results of the Company are published in the prescribed format within 48 hours of the conclusion of the Board Meeting, one in English newspaper having nationwide circulation and one in Vernacular newspaper of the State of Karnataka, where the registered office of Your Company is situated.
The quarterly financial results during the financial year 2017-18 were published as detailed below:
f) Website: Your Company's website contains a dedicated section “Investor Relations” where information for shareholders is available. The quarterly/half yearly/Annual Financial Results are promptly and prominently posted on the website. The Annual Reports of the subsidiary companies are also posted on the website of the Company. The Quarterly Corporate Governance Report, Shareholding Pattern, Policies, status of unclaimed dividend and other communications made to the Stock Exchanges are also available on the website. This results in prompt information disposal to the shareholders and also contributes in saving paper thus saving trees and helps in making the planet greener.
g) Annual Report: Annual Report of your Company containing, inter alia, Audited Standalone and Consolidated Financial Statements, Directors' Report, Report on Corporate Governance, Auditors' Report and other important information is circulated to all the Members and other entitled thereto within the statutory period and well in advance of the Annual General Meeting. The Management Discussion and Analysis Report (MDAR) forms part of the Annual Report. The Annual Report is also available on the Company's website in downloadable pdf format for ease of use.
h) Reminder to Investors: Reminders to encash the unclaimed dividend on shares and unclaimed shares are sent to the shareholders as per records every year.
i) Designated email id for investors: Your Company has a designated exclusive email id for investors at .
j) SEBI Complaints Redress System (SCORES): The investor complaints are processed in a centralized web-based complaints redress system. The salient features of this system are Centralized database of all complaints, online upload of Action Taken Reports by the concerned companies and online viewing by investors of actions taken on the complaint and its current status.
www.wendtindia.com
www.wendtindia.com
69
Year Date Time Venue
04:00 PM2016-17 24.07.2017
02:30 PM2015-16 26.07.2016
Bharatiya Vidya Bhavan, R a c e C o u r s e R o a d , Bangalore
Bharatiya Vidya Bhavan, R a c e C o u r s e R o a d , Bangalore
Ordinary Resolution
04:00 PM2014-15 23.07.2015 Bharatiya Vidya Bhavan, R a c e C o u r s e R o a d , Bangalore
l
l
l
l
Adoption of Annual Accounts for the year ended March 31, 2015.Re-appointment of Mr. K Srinivasan as a Director Ratification of Appointment of M/s Deloitte Haskins & Sells as the Statutory Auditors of the Company for the year 2015-16.
Declaration of Dividend on equity shares.
l
l
l
l
l
Adoption of Annual Accounts for the year ended March 31, 2017.Re-appointment of Mr. K Srinivasan as Director. Appointment of M/s PWC as the Statutory Auditors of the Company for a term of 5 years.
Declaration of Dividend on equity shares.Special BusinessAppointment of Ms. Hima Srinivas as an Independent Director of the Company for a term of 5 consecutive years.
l
l
l
l
Adoption of Annual Accounts for the year ended March 31, 2016.Re-appointment ofMr. K Srinivasan as Director.Appointment of M/s Deloitte Haskins & Sells as the Statutory Auditors of the Company for the year 2016-17.Declaration of Dividend on equity shares.
Quarter Date of Board Date of Name of the newspaper
(F.Y. 2017-18) Meeting Publication
1st Quarter ended 30th June, 2017 24.07.2017 25.07.2017 Business Standard and Vijay Karnataka
2nd Quarter ended 30th September, 2017 23.10.2017 24.10.2017 Business Standard and Vijay Karnataka
3rd Quarter ended 31st December, 2017 24.01.2018 25.01.2018 Business Standard and Vijay Karnataka
68

70 71
E. NON MANDATORY REQUIREMENTS
a) Shareholders' Rights
Annual, Half yearly and other quarterly financial statements are published in newspaper, one in English newspaper having nationwide circulation and one in Vernacular newspaper of the State of Karnataka, where the registered office of the Company is situated, and posted on Your Company's website
Any major developments are conveyed through Press Release issued by the Company and posted on the Company's website.
b) Audit qualifications
During the year under audit, there is no audit qualification.
c) Training of Board Members
At the Board/Committee Meetings, detailed presentations are being shared by the management on the business related matters, risks, opportunities, strategy and effect of the regulatory changes etc.
d) Separation of the Office of Chairman and the Chief Executive Officer (CEO)
As recommended in Part E of schedule II to Regulation 27(1) of the Listing Regulations, the post of Chairman and CEO are held by separate persons. This promotes the right balance and prevents unfettered decision making power with a single individual. For greater efficiency, there is also a clear demarcation of the role and responsibilities of the Chairman and the CEO.
The Chairman provides the necessary guidance and support to the CEO, and both have regular and structured access to the executive and management team. CEO is the principal executive of the Company and is accountable for the management and operations of the Company and implementation of business policies and strategies agreed to by the Board of Directors in a manner that is consistent with best business practices. CEO leads internally, with the Chairman adding value in strategy and structure, and ensuring that the Company is represented with integrity to institutions, investors, analysts and other stakeholders.
e) Shareholders Satisfaction Survey
Your Company carries out Shareholders Satisfaction Survey every year. The questionnaire forms part of the Annual Report and it comprises of various areas on investor services, corporate governance, etc. The Management compiles the feedback received from shareholders and takes necessary action.
f) Social Accountability Policy
Your Company recognizes the need and is committed to provide a safe, healthy and respectable work environment to all its employees. Your Company strives to provide an environment, which is free of discrimination, intimidation and abuse. Your Company has put in place SA 8000 System & Social Accountability Policy. As per the policy, the Company will not engage, support or tolerate the use of Child Labour, Forced or Compulsory Labour, Discrimination based on Race, National or Social origin, Caste, Birth, Religion, Disability, Gender etc., Corporal punishment, Mental or Physical coercion, verbal abuse, harsh or inhumane treatment of personnel and will comply with all the requirements as outlined by applicable Law.
GENERAL SHAREHOLDER INFORMATION
This is annexed.
(www.wendtindia.com).
By order of the Board
M M Murugappan
Chairman
For Wendt (India) Limited
Bengaluru
25th April 2018
GENERAL SHAREHOLDER INFORMATION
1. Date of Incorporation: 21st August, 1980
2. Annual General Meeting
3. Financial Calendar
4. Book Closure Date
5. Dividend Payment Date
6. Registered Office Adress
Date and time : Tuesday, July 24th, 2018 at 03.00 P.M
Venue : Bharatiya Vidya Bhavan Race Course Road, Bangalore- 560 001, Karnataka
Last date of receipt of Proxy forms: 22nd July 2018 before 03.00 p.m.
The financial year of the Company commences from 1st April every year and ends on 31st March in the succeeding year. Results for the financial year 2018-19 shall be declared as per the following schedule:
14th July 2018 to 24th July 2018 (both days inclusive)
The Company declared an interim dividend of Rs. 10/- per share in its Board Meeting held on 24th January 2018 for the financial year 2017-18 to those members whose names were appearing in the Register of Members on 8th February 2018. The Board of Directors of the Company has proposed a dividend of Rs. 15 per share (150%) on equity shares of Rs. 10/- each. The dividend will be paid on 1st August 2018 after approval by the shareholders at the Annual General Meeting.
Flat No. 105, 1st Floor, Cauvery Block,National Games Housing Complex,KormanagalaBangalore-560047, KarnatakaTel: +91 80 25701423/1424Fax:+91 80 25701425
Statutory AuditorPrice Waterhouse Chartered Accountants LLP, 5th Floor, Tower 'D', The Millenia, 1 & 2 Murphy Road, Ulsoor,Bangalore - 560 008
Internal Auditor (for the FY 2017-18)Ernst & Young LLP Chartered Accountants6th & 7th Floor, A Block, Tidel Park,4, Rajiv Gandhi Salai, Taramani, Chennai 600 113
7. Auditors
Particulars Quarter Due date
Unaudited results 30th June 2018 15th August 2018
Unaudited results 30th September 2018 15th November 2018
Unaudited results 31st December 2018 15th February 2019
Audited Results 31st March 2019 31st May 2019

72 73
Secretarial Auditor (for the FY 2017-18)Ms. Apeksha NagoriVeera 506, SJR – Verity, Kasavanahalli,Bangalore – 560035
Bombay Stock Exchange : 505412National Stock Exchange : WENDTListing Fee (FY 17-18) : Paid
8. Listing Details & Codes
9. Corporate Identification Number: L85110KA1980PLC003913
10.NSDL & CDSL (ISIN): INE274C01019
11. Share Price Data
12. Stock Performances in comparison to broad based indices:
Month Bombay Stock Exchange National Stock Exchange
High (Rs.) Low (Rs.) High (Rs.) Low (Rs.)
2017 APRIL 2445.00 1939.70 2444.95 1905.00
MAY 2475.00 2028.30 2511.95 2059.95
JUNE 2360.00 2113.00 2350.00 2112.20
JULY 2809.85 2178.10 2817.85 2160.25
AUGUST 2592.00 2305.45 2593.95 2300.00
SEPTEMBER 2565.00 2313.00 2558.00 2329.95
OCTOBER 2499.00 2336.20 2505.70 2302.00
NOVEMBER 2470.00 2303.00 2495.00 2293.70
DECEMBER 3544.00 2270.05 3455.70 2275.00
2018 JANUARY 4260.00 3150.00 4270.00 3137.85
FEBRUARY 3301.00 2654.85 3291.15 2615.00
MARCH 2761.05 2372.00 2796.85 2340.00
Sensex Vs Share Price
Sensex
Share Price
Nifty
Share Price
Nifty Vs Share Price
May
-17
Jun-
17
Jul-1
7
Aug-1
7
Sep-1
7
Oct-1
7
Nov
-17
Dec
-17
Jan-
18
Feb-1
8
Mar
-18
April-17
Pri
ce
(R
s.)
Sensex Vs Share Price
BS
E I
nd
ex
Pri
ce
(R
s.)
NIF
TY
May
-17
Jun-
17
Jul-1
7
Aug-1
7
Sep-1
7
Oct-1
7
Nov
-17
Dec
-17
Jan-
18
Feb-1
8
Mar
-18
April-17
3350
3100
2850
2600
2350
2100
35500.00
34000.00
32500.00
31000.00
29500.00
11500
11000
10500
10000
9500
9000
3350
3100
2850
2600
2350
2100
Shareholding Pattern % To Equity
Category No. of shareholders Total no. of Shares held % of Share Capital
PROMOTERS (PRO) 1 7,97,352 39.87%
FOREIGN PROMOTERS (FPR) 1 7,97,352 39.87%
RESIDENT INDIVIDUALS (PUB) 5,835 3,56,339 17.81%
BODIES CORPORATE (LTD) 185 15,827 0.79%
HUF 265 14,717 0.74%
DIRECTORS 1 2,650 0.13%
BANKS (BNK) 4 1,919 0.10%
NON RESIDENT INDIANS 64 2,258 0.11%
NRI NON-REPATRIATION 36 2,489 0.12%
CLEARING MEMBERS 21 427 0.02%
NBFC 2 25 0.01%
IEPF 1 8,050 0.40%
INDIAN FINANCIAL INSTITUTIONS 1 595 0.03%
TOTAL 6,417 20,00,000 100%
Category (Amount) No. of % of Total Amount (Rs.) % of
(Rs.) shareholders shareholders Shares Amount
1-5,000 6,307 98.28 2,60,588 2605880.00 13.03%
5,001-10,000 70 1.09 53,484 534840.00 2.67%
10,001-20,000 27 0.42 39,104 391040.00 1.96%
20,001-30,000 4 0.06 10,968 109680.00 0.55%
30,001-40,000 3 0.05 10,200 102000.00 0.51%
40,001-50,000 2 0.03 8,827 88270.00 0.44%
50,001-1,00,000 1 0.02 8,050 80500.00 0.40%
1,00,001 & Above 3 0.05 16,08,779 16087790.00 80.44%
TOTAL 6,417 100% 20,00,000 2,00,00,000 100%
13. Distribution of Shareholding as on 31st March, 2018
14. Shareholding Pattern as on 31st March 2018
39.87%
39.87%
17.82%
0.79% 0.74%0.40%0.13%
0.02% 0.00%
0.11%0.03%0.10%
0.12%
FOREIGN PROMOTERS
PROMOTERS
RESIDENT INDIVIDUALS
BODIES CORPORATES
HUF
IEPF
DIRECTORS
NRI NON-REPATRIATION
NON RESIDENT INDIANS
BANKS
INDIAN FINANCIAL INSTITUTIONS
CLEARING MEMBERS
NBFC

75
15. Dematerialisation of Shares
Your Company has signed agreements with both National Securities Depositories Limited (NSDL) and with Central Depository Services (India) Limited (CDSL) to provide the facility of holding equity shares in dematerialized form with either of the two depositories.
As per SEBI's instruction, the Company's shares can be sold through stock exchanges only in dematerialized form.
As on 31st March 2018, 19,65,567 Shares constituting 98.28 % of the total paid up capital of the company are in demat form.
16. Outstanding GDRS/ADRS/Warrants or any convertible Instruments conversion date and likely impact on equity.
17. Share Transfer Process
The Company has not issued any GDRS/ADRS/Warrants or any convertible Instruments during the financial year
2017-18.
Share transfers in physical form are processed by the Registrar and Transfer Agent, Karvy Computershare Private
Limited and are approved by the Stakeholders Relationship Committee of the Company. The status on share
transfer is reported to the Board on regular basis. Share transfers are registered and returned within 15 days
from the date of lodgment if documents are complete in all respects. The depository system handles share
transfers in dematerialised form.
The Company obtains from a Company Secretary in practice, a half-yearly certificate of compliance with the
share transfer formalities as required under Regulation 7(3) of SEBI (LODR) Regulations, 2015 and files a copy of
the certificate with the Stock Exchanges.
Shareholding Summary as on 31/03/2018
Category No. of share holders Total no. of Shares % to share capital
PHYSICAL 293 34,433 1.72
NSDL 3,843 1,864,786 93.24
CDSL 2,281 1,00,781 5.04
TOTAL 6,417 2,000,000 100.00
% To Equity
PHYSICAL
N S D L
C D S L
93.24%
1.72%5.04%
74
18. Complaints received during the financial year ended 31st March 2018 by the Company and the Registrar and Transfer Agents of the Company.
19. Unclaimed Dividend
Section 124 of the Companies Act, 2013, mandates that companies have to transfer dividend that has been
unclaimed for a period of seven years from the unpaid dividend account to the Investor Education and
Protection Fund (IEPF). In accordance with the following schedule, the dividend for the years mentioned as
follows, if unclaimed within a period of seven years, will be transferred to IEPF. No claim shall lie against the
Company for the amounts so transferred nor shall any payment be made in respect of such claims. Shareholders
who have not claimed their dividend are requested to approach M/s Karvy Computershare Private Limited, for
issue of demand drafts in lieu of the revalidated dividend warrants.
Nature of Complaints No. of complaints
Received Resolved Pending
Non receipt of Dividend Warrants 8 8 Nil
Non receipt of Share Certificates 0 0 Nil
Non receipt of Annual Report 1 1 Nil
Total 9 9 Nil
Trend of Investor Complaints Received During Last 5 Years
40
50
30
10
20
0
60
Non Receipt of Divident warrants Non Receipt of Annual Report
Non Receipt of securities SEBI SCORES
2013-14 2014-15 2015-16 2016-17
32
12
0
22
23
16
9
10
2
23
7
5
810
2017-18

7776
A separate communication was sent in February 2018 to the shareholders, who have not encashed their
dividends for the year 2010-11, providing them details of their uncashed dividends and requesting them to
comply with the procedure for seeking payment of the same.
A sum of Rs. 3,78,125/- have been transferred to the Investor Education and Protection Fund during the year
2017 -18 towards unclaimed/unpaid dividend for the year 2009-10.
In accordance with the requirement of SEBI Regulations, the Company reports that there are 2 allottees
pertaining to a holding of 75 shares which are lying unclaimed. The shares with regard to the same are lying in
the Escrow Account.
The voting rights on the shares outstanding in the Escrow account as on March 31, 2018 shall remain frozen till
the rightful owner of such shares claims the shares.
In terms of Section 124(6) of the Companies Act, 2013 read with Investor Education & Protection Fund (IEPF)
Authority (Accounting, Audit, Transfer and Refund) Rules, 2016 and Investor Education and Protection Fund
Authority (Accounting, Audit, Transfer and Refund) Amendment Rules, 2017, the Company is required to
transfer the shares in respect of which dividends have remained unclaimed for a period of seven consecutive
years or more to the IEPF Account established by the Central Government. As required under the said Rules, the
Company had published a Notice in the newspapers inviting the Members attention to the aforesaid Rules. The
Company has also sent out individual communication to the concerned Members whose shares are liable to be
transferred to IEPF Account, pursuant to the said Rules to take immediate action in the matter.
The Company has within the due date, transferred the required number of shares during the year to the IEPF.
The Company obtains from a Company Secretary in practice, a quarterly certificate of reconciliation of share
capital audit with regard to the total admitted equity share capital with the National Securities Depository
Limited (“NSDL”) and the Central Depository Services (India) Limited (“CDSL”) and held in physical form, with
20. Unclaimed Shares
21. Transfer of Shares into Investor Education and Protection Fund (IEPF) (in cases
where dividend has not been paid or claimed for seven consecutive years or
more)
22. Reconciliation of Share Capital Audit
Year Type of Dividend Dividend per share (Rs) Date of declaration Due date for transfer
2010-11 Final 25.00 27/07/2011 02-09-2018
2011-12 Final 25.00 13/07/2012 19-08-2019
2012-13 Final 15.00 25/07/2013 31-08-2020
2013-14 Interim 10.00 22/01/2014 28-02-2021
2013-14 Final 15.00 24/07/2014 30-08-2021
2014-15 Interim 10.00 27/01/2015 05-03-2022
2014-15 Final 15.00 23/07/2015 29-08-2022
2015-16 Interim 10.00 25/01/2016 03-03-2023
2015-16 Final 15.00 26/07/2016 01-09-2023
2016-17 Interim 10.00 24/01/2017 02-03-2024
2016-17 Final 15.00 24/07/2017 30-08-2024
2017-18 Interim 10.00 24/01/2018 02-03-2025
the issued and listed capital under Regulation 55A of The Securities and Exchange Board of India (Depositories
and Participants) Regulation, 1996. The Certificate is submitted to BSE Limited and NSE Limited and is also
placed before the Board of Directors.
Your Company recommends the following to the shareholders to mitigate/avoid risks while dealing with securities and related matters.
i) Dematerialize (Demat) your shares
The Equity shares of the Company are under compulsory dematerialisation (“Demat”) category and can be traded only in electronic form. Shareholders are requested to convert their physical holding to demat/electronic form through any of the Depository Participants (DPs) to avoid the hassles involved in the physical shares such as possibility of loss, mutilation, etc. and also to ensure safe and speedy transaction in shares. Holding shares in demat form helps investors to get immediate transfer to securities. No stamp duty is payable on transfer of shares held in demat form and risks associated with physical certificates such as forged transfers, fake certificates and bad deliveries are avoided.
ii) Register your National Electronic Clearing Service(NECS)/Electronic Clearing Service(ECS)
SEBI vide its circular dated 21st March 2013 has emphasized on the usage of electronic mode for payments to the members for various purposes. To ensure compliance, members are requested to provide an NECS/ECS mandate to the Company in case of shares held in physical form and ensure that the correct and updated particulars of their bank account are available with the depository participant (DP) in case of share held in demat form. This would also facilitate in receiving direct credits of dividends etc from companies and avoiding postal delays and loss in transit.
iii) Nomination facility
As per the provisions of the Companies Act, 2013, facility for making nomination is available for Members in respect of shares held by them. Members holding shares in physical form may obtain nomination form from the RTA of the Company, Karvy Computershare Private Limited. Members holding shares in dematerialized form should contact their Depository Participants (DP) in this regard. The members can approach the Company or Karvy Computershare Private Limited with regard to the same.
iv) Permanent Account Number (PAN)
Members holding shares in physical form are advised that SEBI has made it mandatory that a copy of the PAN card of the transferees, members, surviving joint holders / legal heirs be furnished to the Company while obtaining the services of transfer, transmission and issue of duplicate share certificates.
v) Encash your Dividend in time
Please encash your dividends promptly to avoid hassles of revalidation/losing your right of claim owing to
transfer of unclaimed dividends beyond seven years to Investors Education and Protection Fund.
vi) Support the Green Initiative
To support the 'Green Initiative', your Company has proposed to send Notice calling General Meetings, Annual Report and other documents in electronic mode in future vide its letter dated 9th June 2014 and 10th February 2012 to all the shareholders at their email addresses. It was also requested to inform the Company in case the shareholders wish to receive the above documents in physical form. Accordingly, the Annual Report along with Notice will be sent to the members in electronic mode at their email addresses.
Members holding shares in demat form are requested to provide their email id to the depository through their concerned depository participant and members holding shares in physical form are requested to provide email id to the Company at or at and also update the email address as and when there is any change.
23. Company's Recommendation to the Shareholders

78 79
Members are requested to quote their Folio No. / DP & Client ID Nos., as the case may be, their Contact nos./ Fax nos. and email id in all correspondence with the Company. All correspondences regarding shares of the Company should be addressed to the Company's Registrar, Karvy Computershare Private Limited, Karvy Selenium Tower B, Plot 31-32, Gachibowli, Financial District, Nanakramguda, Hyderabad – 500 032.
viii) Specimen Signature
Please maintain a record of your specimen signature before lodgment of shares with the Company to obviate possibility of difference in signature at a later date.
ix) Updation of details
Members holding shares in physical form are requested to notify promptly any change in address/ pin code and bank account details. Beneficial owners of shares in dematerialized form are requested to send their instructions regarding change of address, bank details, nomination, power of attorney etc. directly to their DP as the same are maintained by the DPs.
x) Consolidation of securities
Member(s) of the Company who have multiple accounts in identical name(s) or more than one share certificate in the same name under different ledger folio(s) are requested to apply for the consolidation of such folio(s) and send the relevant share certificates to the Company.
xi) Queries at the AGM
Members desiring any information with regard to the accounts are requested to write to the Company at least a week in advance of the Annual General Meeting date so as to enable the management to keep the information ready. However, the queries relating to operational and financial performance may be raised at the Annual General Meeting.
xii) Lodging investor complaint with SCORES
SEBI has started an online investor grievance redressal forum “SEBI Complaints Redress System-SCORES”. Investors, have to first approach the Company/Registrar & Share Transfer Agent for their complaints redressal and in case they are dissatisfied with the response, they can log on to and lodge their complaint by doing one time registration.
Wendt (India) LimitedPlot No. 69/70, SIPCOT Industrial EstateHosur- 635126, Tamil NaduTel: +91 4344 276851/52, 405500Fax: +91 4344 405620, 405630
(i) Wendt Grinding Technologies Limited, Thailand 109/21, Moo.4, Tambon Pluakdaeng,Aumpur Pluakdaeng,Rayong 21140Thailand
(ii) Wendt Middle East FZE, SharjahWarehouse No. W3-8PO Box No.50732Hamriyah Free Zone - SharjahUnited Arab Emirates
vii) Quoting the Folio No./DP Id - Client ID
http://scores.gov.in/
24.Plant Location
25. SUBSIDIARIES
26. Addresses for Communication
[email protected] [email protected]
(a) Compliance Officer & Company Secretary
Akanksha BijawatWendt (India) LimitedPlot No. 69/70, SIPCOT Industrial EstateHosur- 635126, Tamil NaduTel: +91 4344 405500
Email:
(b) Registrar and Share Transfer Agent
Karvy Computershare Private Limited
Unit: Wendt (India) LimitedKarvy Selenium Tower B, Plot 31-32, Gachibowli, Financial District, Nanakramguda, Hyderabad - 500 032Tel: +91 40 67162222-1510-1512Fax:+91 40 23001153Email: Website:
(c ) Toll Free number of Registrar & Share Transfer Agent's exclusive call centre
1-800-3454001
(d) Web based Query redressal system
A new facility has been extended by Registrar & Share Transfer Agent for redressal of shareholders' queries.
The shareholder can visit and click on “Investors” options for query registration after
free identity registration
The above report has been placed before the Board at its meeting held on April 25th, 2018 and the same was
approved.
http://karisma.karvy.com/
By order of the Board
M M Murugappan
Chairman
For Wendt (India) Limited
Place: Bengaluru
Date: 25th April 2018
81
INDEPENDENT AUDITORS' REPORT
TO THE MEMBERS OF WENDT (INDIA) LIMITED.
Report on the Standalone Indian Accounting Standards (Ind AS) Financial Statements
1. We have audited the accompanying standalone Ind AS financial statements of Wendt (India) Limited (“the Company”) which comprise the Balance Sheet as at March 31, 2018, the Statement of Profit and Loss (including Other Comprehensive Income), the Cash Flow Statement and the Statement of Changes in Equity for the year then ended and a summary of significant accounting policies and other explanatory information.
Management’s Responsibility for the Standalone Ind AS Financial Statements
2. The Company's Board of Directors is responsible for the matters stated in Section 134(5) of The Companies Act , 2013 (“the Act”) with respect to the preparation of these standalone Ind AS financial statements to give a true and fair view of the financial position, financial performance (including other comprehensive income), cash flows and changes in Equity of the Company in accordance with accounting principles generally accepted in India, including the Indian Accounting Standards specified in the Companies (Indian Accounting Standards) Rules, 2015 (as amended) under Section 133 of the Act. This responsibility also includes maintenance of adequate accounting records in accordance with the provisions of the Act for safeguarding the assets of the Company and for preventing and detecting frauds and other irregularities; selection and application of appropriate accounting policies; making judgments and estimates that are reasonable and prudent; and the design, implementation and maintenance of adequate internal financial controls that were operating effectively for ensuring the accuracy and completeness of the accounting records, relevant to the preparation and presentation of the standalone Ind AS financial statements that give a true and fair view and are free from material misstatement, whether due to fraud or error.
Auditors' Responsibility
3. Our responsibility is to express an opinion on these standalone Ind AS financial statements based on our audit.
4. We have taken into account the provisions of the Act and Rules made thereunder including the accounting and auditing standards and matters which are required to be included in the audit report under the provisions of the Act and the Rules made thereunder.
5. We conducted our audit of the standalone Ind AS financial statements in accordance with Standards on Auditing specified under Section 143(10) of the Act and other applicable authoritative pronouncements issued by the Institute of Chartered Accountants of India. Those Standards and pronouncements require that we comply with ethical requirements and plan and perform the audit to obtain reasonable assurance about whether the standalone Ind AS financial statements are free from material misstatement.
6. An audit involves performing procedures to obtain audit evidence about the amounts and the disclosures in the standalone Ind AS financial statements .The procedures selected depend on the auditors' judgment, including the assessment of the risks of material misstatement of the standalone Ind AS financial statements, whether due to fraud or error. In making those risk assessments, the auditor considers internal financial control relevant to the Company's preparation of the standalone Ind AS financial statements that give a true and fair view, in order to design audit procedures that are appropriate in the circumstances. An audit also includes evaluating the appropriateness of the accounting policies used and the reasonableness of the accounting estimates made by the Company's Directors, as well as evaluating the overall presentation of the standalone Ind AS financial statements.
7. We believe that the audit evidence we have obtained is sufficient and appropriate to provide a basis for our audit opinion on the standalone Ind AS financial statements.
Opinion
8. In our opinion and to the best of our information and according to the explanations given to us, the aforesaid standalone Ind AS financial statements give the information required by the Act in the manner so required and give a true and fair view in conformity with the accounting principles generally accepted in India, of the state of
80
affairs of the Company as on March 31, 2018, and its total comprehensive income (comprising of profit and other comprehensive income), its cash flows and the changes in equity for the year ended on that date.
Other Matter
9. The standalone Ind AS financial statements of the Company for the year ended March 31, 2017, were audited by another firm of chartered accountants under the Companies Act , 2013 who, vide their report dated April 24, 2017, expressed an unmodified opinion on those standalone Ind AS financial statements. Our opinion is not qualified in respect of this matter.
Report on other Legal and Regulatory Requirements
10. As required by the Companies (Auditor's Report) Order , 2016 issued by the Central Government of India in terms of sub-section (11) of Section 143 of the Act (“the Order”), and on the basis of such checks of the books and records of the Company as we considered appropriate and according to the information and explanations given to us, we give in the Annexure B a statement on the matters specified in paragraphs 3 and 4 of the Order.
11. As required by Section 143(3) of the Act, we report that :
(a) We have sought and obtained all the information and explanations which to the best of our knowledge and belief were necessary for the purposes of our audit.
(b) In our opinion, proper books of account as required by law have been kept by the Company so far as it appears from our examination of those books.
(c) The Balance Sheet, the Statement of Profit and Loss (including other comprehensive Income), the Cash Flow Statement and the Statement of Changes in Equity dealt with by this Report are in agreement with the books of account.
(d) In our opinion, the aforesaid standalone Ind AS financial statements comply with the Indian Accounting Standards specified under Section 133 of the Act.
(e) On the basis of the written representations received from the directors as on March 31, 2018 taken on record by the Board of Directors, none of the Directors is disqualified as on March 31, 2018 from being appointed as a director in terms of Section 164(2) of the Act.
(f) With respect to the adequacy of the internal financial controls with reference to standalone Ind AS financial statements of the Company and the operating effectiveness of such controls, refer to our separate Report in Annexure A.
(g) With respect to the other matters to be included in the Auditors' Report in accordance with Rule 11 of the Companies (Audit and Auditors) Rules , 2014, in our opinion and to the best of our knowledge and belief and according to the information and explanations given to us:
i) The Company has disclosed the impact, if any, of pending litigations as at March 31, 2018 on its financial position in its standalone Ind As financial statements – Refer Note 37;
ii) The Company did not have any long-term contracts including derivative contracts as at March 31, 2018.
iii) There has been no delay in transferring amounts, required to be transferred, to the Investor Education and Protection Fund by the Company during the year ended March 31, 2018.
iv) The reporting on disclosures relating to Specified Bank Notes is not applicable to the Company for the year ended March 31, 2018
For Price Waterhouse Chartered Accountants LLP
Firm Registration Number: 012754N/N500016
Chartered Accountants
Bengaluru
April 25, 2018
Mohan Danivas S A
Partner
Membership Number: 209136

ANNEXURE “A” TO INDEPENDENT AUDITOR'S REPORT
Referred to in paragraph 11 (f) of the Independent Auditors' Report of even date to
the members of Wendt (India) Limited on the standalone financial statements for
the year ended March 31, 2018.
Report on the Internal Financial Controls under Clause (i) of Sub-section 3 of Section 143 of the Act
1. We have audited the internal financial controls over financial reporting of Wendt (India) Limited (“the
Company”) as of March 31, 2018 in conjunction with our audit of the standalone financial statements of the
Company for the year ended on that date.
Management's Responsibility for Internal Financial Controls
2. The Company's management is responsible for establishing and maintaining internal financial controls based
on internal control over financial reporting criteria established by the Company considering the essential
components of internal control stated in the Guidance Note on Audit of Internal financial Controls Over
Financial Reporting issued by the Institute of Chartered Accountants of India (ICAI). These responsibilities
include the design, implementation and maintenance of adequate internal financial controls that were
operating effectively for ensuring the orderly and efficient conduct of its business, including adherence to
company's policies, the safeguarding of its assets, the prevention and detection of frauds and errors,
the accuracy and completeness of accounting records, and the timely preparation of reliable financial
information, as required under the Act.
Auditors’ Responsibility
3. Our responsibility is to express an opinion on the Company's internal financial controls over financial reporting
based on our audit. We conducted our audit in accordance with the Guidance Note on Audit of Internal
Financial Controls Over Financial Reporting (the “Guidance Note”) and the Standards of
Auditing deemed to be prescribed under Section 143(10) of the Act, to the extent applicable to an audit of
internal financial controls, both applicable to an audit of internal financial controls and both
issued by the ICAI. Those Standards and Guidance Note require that we comply with the ethical requirements
and plan and perform the audit to obtain reasonable assurance about whether adequate internal financial
controls over financial reporting was established and maintained and if such controls operated effectively in all
material respects.
4. Our audit involves performing procedures to obtain audit evidence about the adequacy of the internal financial
controls system over financial reporting and their operating effectiveness. Our audit of internal financial
controls over financial reporting, included obtaining an understanding of internal financial controls over
financial reporting, assessing the risk that a material weakness exists, and testing and evaluating the design and
operating effectiveness of internal control based on the assessed risk. The procedures selected depend on the
auditor's judgment, including the assessment of the risks of material misstatement of the standalone financial
statements, whether due to fraud or error.
5. We believe that the audit evidence we have obtained is sufficient and appropriate to provide a basis for our
audit opinion on the Company's internal financial control system over financial reporting.
Meaning of Internal Financial Controls Over Financial Reporting
6. A company's internal financial control over financial reporting is a process designed to provide reasonable
assurance regarding the reliability of financial reporting and the preparation of standalone financial statements
for external purposes in accordance with generally accepted accounting principles. A company's internal
financial control over financial reporting includes those policies and procedures that (1) pertain to the
maintenance of records that, in reasonable detail, accurately and fairly reflect the transactions and dispositions
of the assets of the company; (2) provide reasonable assurance that transactions are recorded as necessary to
permit preparation of standalone financial statements in accordance with generally accepted accounting
82 83
principles, and that receipts and expenditures of the company are being made only in accordance with
authorizations of management and directors of the company; and (3) provide reasonable assurance regarding
prevention or timely detection of unauthorized acquisition, use, or disposition of the company's assets that
could have a material effect on the standalone financial statements.
Inherent Limitations of Internal Financial Controls Over Financial Reporting
7. Because of the inherent limitations of internal financial controls over financial reporting, including the
possibility of collusion or improper management override of controls, material misstatements due to error or
fraud may occur and not be detected. Also, projections of any evaluation of the internal financial controls over
financial reporting to future periods are subject to the risk that the internal financial control over financial
reporting may become inadequate because of changes in conditions, or that the degree of compliance with the
policies or procedures may deteriorate.
Opinion
In our opinion, the Company, has, in all material respects, an adequate internal financial controls systems over
financial reporting and such internal financial controls over financial reporting were operating effectively as at
March 31, 2018, based on the internal control over financial reporting criteria established by the Company
considering the essential components of internal control stated in the Guidance Note on Audit of Internal
Financial Controls Over Financial Reporting issued by the Institute of Chartered Accountants of India.
For Price Waterhouse Chartered Accountants LLP
Firm Registration Number: 012754N/N500016
Chartered Accountants
Bengaluru
April 25, 2018
Mohan Danivas S A
Partner
Membership Number: 209136

8584
ANNEXURE B TO INDEPENDENT AUDITORS' REPORT
Referred to in paragraph 10 of the Independent Auditors' Report of even date to the members of Wendt (India) Limited on the standalone financial statements as of and for the year ended March 31, 2018.
i. (a) The Company is maintaining proper records showing full particulars, including quantitative details and situation, of fixed assets.
(b) The fixed assets are physically verified by the Management according to a phased program designed to cover all the items over a period of two years which, in our opinion, is reasonable having regard to the size of the Company and nature of its assets. Pursuant to the program, a portion of the fixed assets has been physically verified by the Management during the year and no material discrepancies have been noticed on such verification.
(c) The title deeds of the immovable properties, as disclosed in Note 3 on fixed assets to the standalone financial statements, are held in the name of the Company.
ii. The physical verification of inventory excluding stocks with third parties have been conducted at reasonable intervals by the Management during the year. In respect of inventory lying with third parties, these have substantially been confirmed by them. The discrepancies noticed on physical verification of inventory as compared to book records were not material.
iii. The company has not granted any loans, secured or unsecured, to companies, firms, Limited Liability Partnerships or other parties covered in the register maintained under Section 189 of the Act. Therefore, the provisions of Clause 3(iii), (iii)(a), (iii) (b), and (iii)(c) of the said Order are not applicable to the Company.
iv. In our opinion, and according to the information and explanations given to us, the Company has complied with the provisions of Section 185 and 186 of the Companies Act, 2013 in respect of the loans and investments made, and guarantees and security provided by it.
v. In our opinion, and according to the information and explanations given to us, the Company has not accepted any deposits from the public within the meaning of Sections 73, 74. 75 and 76 of the Act and the Rules framed there under to the extent notified.
vi. Pursuant to the rules made by the Central Government of India, the Company is required to maintain cost records as specified under Section 148(1) of the Act in respect of its products. We have broadly reviewed the same and are of the opinion that prima facie, the prescribed accounts and records have been made and maintained. We have not, however, made a detailed examination of the records with a view to determine whether they are accurate or complete.
vii. (a) According to the information and explanations given to us and the records of the Company examined by us, in our opinion, the Company is regular in depositing the undisputed statutory dues, including provident fund, employees’ state insurance, income tax, sales tax, service tax, duty of customs, duty of excise, value added tax, cess, goods and service tax with effect from July 1, 2017 and other material statutory dues, as applicable, with the appropriate authorities.
(b) According to the information and explanations given to us and the records of the Company examined by us, there are no dues of income-tax, sales-tax, service-tax, duty of customs and duty of excise, or value added tax or goods and service tax which have not been deposited on account of any dispute.
viii. As the Company does not have any loans or borrowings from any financial institution or bank or Government, nor has it issued any debentures as at the balance sheet date, the provisions of Clause 3 (viii) of the Order are not applicable to the Company.
ix. The Company has not raised any monies by way of initials public offer, further public offer (including debt instruments) and term loans. Accordingly, the provisions of Clause 3 (ix) of the Order are not applicable to the Company.
x. During the course of our examination of the books and records of the Company, carried out in accordance with the generally accepted auditing practices in India, and according to the information and explanations given to us, we have neither come across any instance of material fraud by the Company or on the Company by its officers or employees, noticed or reported during the year, nor have we been informed of any such case by the Management.
xi. The Company has paid/provided for managerial remuneration in accordance with the requisite approvals mandated by the provisions of Section 197 read with Schedule V to the Act.
xii. As the Company is not a Nidhi Company and the Nidhi Rules, 2014 are not applicable to it; the provisions of Clause 3(xii) of the Order are not applicable to the Company.
xiii. The Company has entered into transactions with related parties in compliance with the provisions of Sections 177 and 188 of the Act. The details of such related party transactions have been disclosed in the financial statements as required under Indian Accounting Standards (Ind AS) 24, Related Party Disclosures, specified in the Companies (Indian Accounting Standards) Rules, 2015 (as amended) under Section 133 of the Act.
xiv. The Company has not made any preferential allotment or private placement of shares or fully or partly convertible debentures during the year under review. Accordingly, the provisions of Clause 3(xiv) of the Order are not applicable to the Company.
xv. The Company has not entered into any non cash transactions with its directors or persons connected with him. Accordingly, the provisions of Clause 3(xv) of the order are not applicable to the Company.
xvi. The Company is not required to be registered under Section 45-IA of the Reserve Bank of India Act, 1934. Accordingly, the provisions of Clause 3(xvi) of the Order are not applicable to the Company.
For Price Waterhouse Chartered Accountants LLP
Firm Registration Number: 012754N/N500016
Chartered Accountants
Bengaluru
April 25, 2018
Mohan Danivas S A
Partner
Membership Number: 209136

86 87
Standalone
Financial
Statements
This Space has
been purposely
Left Blank

(Rs. in lakhs)
88 89
STATEMENT OF PROFIT AND LOSS FOR THE YEAR ENDED 31ST MARCH, 2018(Rs. in lakhs)
BALANCE SHEET AS AT 31ST MARCH, 2018
This is the balance sheet referred to in our report of even date.
For and on behalf of the Board of Directors
This is the statement of Profit and Loss referred to in our report of even date.
For Price Waterhouse Chartered Accountants LLP
Firm Registration Number : 012754N/N500016
Bengaluru BengaluruApril 25, 2018 April 25, 2018
AKANKSHA BIJAWATCompany Secretary
MUKESH KUMAR HAMIRWASIAChief Financial Officer
M M MURUGAPPAN
Chairman
SHRINIVAS G SHIRGURKAR
Director
K SRINIVASANDirector
MOHAN DANIVAS S APartnerMembership Number : 209136
For and on behalf of the Board of DirectorsFor Price Waterhouse Chartered Accountants LLP
Firm Registration Number : 012754N/N500016
Bengaluru BengaluruApril 25, 2018 April 25, 2018
AKANKSHA BIJAWATCompany Secretary
MUKESH KUMAR HAMIRWASIAChief Financial Officer
M M MURUGAPPAN
Chairman SHRINIVAS G SHIRGURKARDirector
K SRINIVASANDirector
MOHAN DANIVAS S APartnerMembership Number : 209136
Particulars Note No. As at March 31, As at March 31, 2018 2017
A ASSETS1 Non-current assets
(a) Property, Plant and Equipment 3 5,170.69 5,635.74 (b) Capital work-in-progress 200.46 194.39 (c) Goodwill 4 10.27 10.27 (d) Other Intangible assets 5 214.31 237.59 (e) Financial Assets - Investments 6 430.55 430.55 (f) Other non-current assets 8 50.21 44.51 (g) Income Tax Assets (Net) 9 287.87 294.99
Total Non - Current Assets (1) 6,364.36 6,848.04
2 Current assets (a) Inventories 10 1,876.15 1,844.31 (b) Financial Assets
(i) Investments 6 1,798.82 1,071.50 (ii) Trade receivables 11 3,382.96 2,872.26 (iii) Cash and cash equivalents 12A 205.22 36.90 (iv) Bank balances other than (iii) above 12B 431.55 230.13 (v) Other Financial Assets 7 99.73 110.36
(c) Other Current assets 8 400.29 358.55
Total Current Assets (2) 8,194.72 6,524.01
Total Assets (1+2) 14,559.08 13,372.05
B EQUITY AND LIABILITIES
1 Equity (a) Equity Share capital 13 200.00 200.00 (b) Other Equity 14 10,707.51 10,043.37
Total Equity (1) 10,907.51 10,243.37 LIABILITIES
2 Non-current liabilities(a) Provisions 15 91.21 187.42 (b) Deferred tax liabilities (Net) 16 397.37 565.62
Total Non - Current Liabilities (2) 488.58 753.04 3 Current liabilities
(a) Financial Liabilities(i) Trade payables 17 1,742.40 1,242.95 (ii) Other financial liabilities 18 717.12 612.56
(b) Provisions 15 94.93 128.92 (c) Income Tax Liabilities (Net) 9 279.81 116.71 (d) Other current liabilities 19 328.73 274.50
Total Current Liabilities (3) 3,162.99 2,375.64 Total Equity and Liabilities (1+2+3) 14,559.08 13,372.05
The above balance sheet should be read in conjunction with the accompanying notes.
Particulars Note No. Year ended 31.03.2018 31.03.2017
1 Revenue from operations 20 13,167.88 14,080.642 Other Income 21 428.42 372.98
3 Total Revenue (1 + 2) 13,596.30 14,453.62
4 EXPENSES
(a) Cost of materials consumed 22 3,899.75 4,197.78
(b) Purchases of Stock-in-trade 23 185.13 275.67
(c) Changes in stock of finished goods,work-in-progress and stock-in-trade 24 37.23 (139.63)
(d) Excise duty on sale of goods 225.72 1,130.90
(e) Employee benefit expense 25 2,588.04 2,362.98
(f) Finance costs 26 19.64 12.20
(g) Depreciation and amortisation expense 27 1,016.13 963.53
(h) Other expenses 28 3,973.21 4,080.06
Total Expenses (4) 11,944.85 12,883.49
5 Profit before tax (3 - 4) 1,651.45 1,570.13
6 Tax Expense
(a) Current tax 29 590.00 439.10
(b) Income tax for earlier years 29 - (50.74)
(c) Deferred tax 29 (168.25) 12.44
Total tax expense (6) 421.75 400.80
7 Profit for the period (5 - 6) 1,229.70 1,169.33
8 Other comprehensive incomeA Items that will not be reclassified to profit or loss
(i) Remeasurements of the defined benefit plans 36.23 (68.62)
Total Other Comprehensive Income (8) 36.23 (68.62)
9 Total comprehensive income for the period (7 + 8) 1,265.93 1,100.71
10 Earnings per equity share: 36
(1) Basic 61.49 58.47(2) Diluted 61.49 58.47
The above statement of Profit and Loss should be read in conjunction with the accompanying notes.

Balance as at April 1, 2016 5,597.73 3,995.06 (48.34) 9,544.45
Profit for the year - 1,169.33 - 1,169.33 Other comprehensive income for the year, net of income tax - - (68.62) (68.62)
Total comprehensive income for the year - 1,169.33 (68.62) 1,100.71
Payment of Final Dividend for the preceding financial year - (300.00) - (300.00)Payment of Dividend tax on Final Dividend for the preceding financial year - (61.07) - (61.07)Payment of Interim Dividend for the current year - (200.00) - (200.00)Payment of Dividend tax on Interim Dividend for the current year - (40.72) - (40.72)
Transfer to General Reserve 120.00 (120.00) - -
Balance as at March 31, 2017 5,717.73 4,442.60 (116.96) 10,043.37
Profit for the year - 1,229.70 - 1,229.70 Other comprehensive income for the year, net of income tax - - 36.23 36.23 Transfer from Retained earnings - - - -
Total comprehensive income for the year - 1,229.70 36.23 1,265.93
Payment of Final Dividend for the preceding financial year - (300.00) - (300.00)Payment of Dividend tax on Final Dividend for the preceding financial year - (61.07) - (61.07)Payment of Interim Dividend for the current year - (200.00) - (200.00)Payment of Dividend tax on Interim Dividend for the current year - (40.72) - (40.72)
Transfer to General Reserve 130.00 (130.00) - -
Balance as at March 31, 2018 5,847.73 4,940.51 (80.73) 10,707.51
The above statement of changes in equity should be read in conjunction with the accompanying notes.
Particulars 31.03.2018 31.03.2017
Year ended Year ended
CASH FLOW FROM OPERATING ACTIVITIES
Profit before tax 1,651.45 1,570.13
Adjustments for :
Depreciation and amortisation expense 1,016.13 963.53Provision for trade receivables (net of reversal) 16.32 (16.54)Bad Debts written off 2.39 8.79Finance costs 19.64 12.20Interest Income on Deposits (1.39) (4.68)Dividend from current investments - mutual funds (52.60) (23.67)Dividend from long term investments in subsidiaries (197.01) (223.48)Loss / (Profit) on sale / discarding of tangible fixed assets (net) 0.11 0.13Provisions and Liabilities no longer required, written back (10.94) (8.68)Net Gain on sale / fair valuation of current investments (net) (8.02) (30.96)Unrealised exchange loss / (gain) (21.08) 4.98
Operating profit before working capital changes 2,415.00 2,251.75
Changes in working capital :
(Increase)/Decrease in Inventories (31.84) (56.95)(Increase)/Decrease in Trade receivables (505.03) 26.04(Increase)/Decrease in Other financial assets 10.63 3.51(Increase)/Decrease in Other non-current assets (5.70) (14.59)(Increase)/Decrease in Other current assets (5.51) (1.43)Increase/(Decrease) in Trade payables 507.08 (380.57)Increase/(Decrease) in Other current financial liabilities 212.27 200.43Increase/(Decrease) in Other non-current liabilities and Provisions (96.21) 30.49Increase/(Decrease) in Other current liabilities and provisions 20.25 (72.64)
CASH FLOW GENERATED FROM OPERATING ACTIVITIES 2,520.94 1,986.04
Income Taxes Paid (net of refunds) (433.90) (344.19)
NET CASH GENERATED FROM OPERATING ACTIVITIES (A) 2,087.04 1,641.85
Cash flow from investing activities
Capital expenditure on tangible fixed assets (483.50) (1,001.07)Capital expenditure on intangible fixed assets (36.92) (37.85)Proceeds from Sale of tangible fixed assets 3.61 4.84Sale / (Purchase) of current investments (net) (719.30) (110.70)Interest Income on Deposits 1.39 4.68Dividend from long term investment in subsidiaries 197.01 223.48Dividend from current investments - mutual funds 52.60 23.67Bank balances not considered as cash and cash equivalents - Placed (500.00) (500.00)
- Matured / encashed 298.58 298.53
NET CASH USED IN FROM INVESTING ACTIVITIES (B) (1,186.53) (1,094.42)
Cash flow from financing activities
Finance costs (5.52) (12.20)
Dividend Paid (including tax thereon) (601.79) (601.79)
NET CASH USED IN FINANCING ACTIVITIES (C) (607.31) (613.99)
Net Increase/(decrease) in cash and cash equivalents (A+B+C) 293.20 (66.56)
Cash and cash equivalents at the beginning of the year D (87.98) (21.42)
Cash and cash equivalents at the end of the year (A+B+C+D) 205.22` (87.98)
90
STATEMENT OF CHANGES IN EQUITY FOR THE YEAR ENDED MARCH 31, 2018 CASH FLOW STATEMENT FOR THE YEAR ENDED 31ST MARCH, 2018(Rs. in lakhs) (Rs. in lakhs)
Items of other comprehensive
ParticularsRemeasurement of defined benefit
planTotal
income
GeneralReserve
RetainedEarnings
(B) Other Equity
This is the Statement of changes in equity referred to in our report of even date.
91
For and on behalf of the Board of DirectorsFor Price Waterhouse Chartered Accountants LLP
Firm Registration Number : 012754N/N500016
Bengaluru BengaluruApril 25, 2018 April 25, 2018
AKANKSHA BIJAWATCompany Secretary
MUKESH KUMAR HAMIRWASIAChief Financial Officer
M M MURUGAPPAN
Chairman SHRINIVAS G SHIRGURKARDirector
K SRINIVASANDirector
MOHAN DANIVAS S APartnerMembership Number : 209136
Add: Changes in equity share capital during the year -
(A) Equity Share Capital
Add: Changes in equity share capital during the year -
Balance as at April 1, 2017 200.00
Balance as at April 1, 2016 200.00
Balance as at March 31, 2017 200.00
Balance as at March 31, 2018 200.00

NOTES FORMING PART OF THE FINANCIAL STATEMENTS
policies. These note provides an overview of the areas that involved higher degree of judgement or complexity, and of items which are more likely to be materially adjusted due to estimates and assumptions turning out to be different than those originally assessed. Detailed information about each of these estimates and judgements is included in the relevant notes together with information about the basis of calculation for each affected line item in the financial statements.
The areas involving critical estimates or judgements are:
(i) Estimation of useful life of Tangible and Intangible assets - Note 2.14 & 2.15
(ii) Impairment of Trade receivables - Note 11 & Note 2.21.4
(iii)Estimation of defined benefit obligation - Note 34
Estimates and judgements are continually evaluated. They are based on historical experience and other factors, including expectations of future events that may have a financial impact on the Company and that are believed to be reasonable under the circumstances.
Acquisitions of businesses are accounted for using the acquisition method. The consideration transferred in a business combination is measured at fair values of the assets transferred, liabilities incurred to the former owners of the acquired business , equity interests issued by the company and fair value of any asset or liability resulting from a contingent consideration arrangement. Identifiable assets and liabilities are measured initially at their fair values at the acquisition date. Acquisition related costs are expensed as incurred.
2.3 Business combinations
2.4 Goodwill
2.5 Revenue recognition
Goodwill is measured as the excess of the sum of the consideration transferred, the amount of any non-controlling interests in the acquired business and the acquisition date fair value of any previous equity interest in the acquired entity (if any),over the fair value of the net identifiable assets acquired.
If the initial accounting for a business combination is incomplete by end of the reporting period in which the combination occurs, the Company reports provisional amounts for the items for which the accounting is incomplete. Those provisional amounts are adjusted during the measurement period, or additional assets or liabilities are recognised, to reflect new information obtained above facts and circumstances that existed at the acquisition date that, if known, would have affect the amounts recognised at that date.
Goodwill arising on acquisition of a business is carried at costs as established at the date of acquisition of the business less accumulated impairment losses, if any.
Goodwill is tested for impairment annually. For the purpose of impairment testing, goodwill is allocated to those cash-generating units that are expected to benefit from the business combination in which the goodwill arose. If the recoverable amount of the cash-generating unit is less than its carrying amount, the impairment loss is allocated to reduce the carrying amount of the goodwill. Any impairment loss recognised for goodwill is not reversed in subsequent periods.
Revenue is measured at the fair value of the consideration received or receivable. Amounts disclosed as revenue are inclusive of excise duty and net of returns, trade discounts & rebates. Amounts collected on behalf of third parties such as value added taxes, goods and service tax (GST) are excluded from revenue.
2.5.1 Sale of goods
Revenue from the sale of goods are recognised when the goods are despatched and titles have passed to the buyer, which generally coincides with dispatch of goods, at which time all the following conditions are satisfied :
• the company has transferred to the buyer the significant risk and rewards of ownership of the goods• the company retains neither continuing managerial involvement to the degree usually associated with
ownership nor effective control over the goods sold
• the amount of revenue can be measured reliably
NOTE No.1
1 COMPANY OVERVIEW
2 SIGNIFICANT ACCOUNTING POLICIES
2.1 Basis of preparation and presentation
2.2 Critical Estimates and Judgements
Wendt (India) Limited was incorporated on August 21, 1980 under the provisions of the erstwhile Companies Act,1956, and is a joint venture between Wendt GmbH Germany and Carborundum Universal Limited, India. Wendt (India) Limited is a leading manufacturer of Super Abrasives, High precision Grinding, Honing and Special Purpose Machines and High Precision components. The Company`s registered office is in Bangalore and factory is situated in Hosur, Tamilnadu.
(i) Compliance with Ind AS
The financial statements of the company have been prepared in accordance with Indian Accounting Standards (Ind AS) notified under Section 133 of the Companies Act, 2013 (the act) [Indian Accounting Standards Rules, 2015] and other relevant provisions of the Act.
(ii) Historical Cost Convention
These financial statements have been prepared on the historical cost basis, except for certain financial instruments which are measured at fair values at the end of each reporting period, as explained in the accounting policies below. Historical cost is generally based on the fair value of the consideration given in exchange for goods and services. Fair value is the price that would be received to sell an asset or paid to transfer a liability in an orderly transaction between market participants at the measurement date.
(iii)Operating Cycle
Based on the nature of products / activities of the Company and the normal time between acquisition of assets and their realization in cash or cash equivalents, the Company has determined its operating cycle as 12 months for the purpose of classification of its assets and liabilities as current and non-current.
The preparation of these financial statements requires the use of accounting estimates which could differ from the actual results. Management also needs to exercise judgement in applying the Company's accounting
NOTES FORMING PART OF THE FINANCIAL STATEMENTS
For and on behalf of the Board of Directors
This is the cash flow statement referred to in our report of even date.
For Price Waterhouse Chartered Accountants LLP
Firm Registration Number : 012754N/N500016
Bengaluru BengaluruApril 25, 2018 April 25, 2018
AKANKSHA BIJAWATCompany Secretary
MUKESH KUMAR HAMIRWASIAChief Financial Officer
M M MURUGAPPAN
Chairman
SHRINIVAS G SHIRGURKAR
Director
K SRINIVASANDirector
MOHAN DANIVAS S APartnerMembership Number : 209136
Particulars 31.03.2018 31.03.2017
Year ended Year ended
Cash and cash equivalents (Note 12A) 205.22 36.90
Book Overdrafts (Note 18) - (124.88)
Balance as per statement of cash flows 205.22 (87.98)
The above cash flow statement should be read in conjunction with the accompanying notes.
9392
Cash and cash equivalents as per above comprise of the following:
Reconciliation of Cash and cash equivalents as per cash flow statement

94 95
NOTES FORMING PART OF THE FINANCIAL STATEMENTS
Transactions in currencies other than the entity's functional currency (foreign currencies) are recognised at the rates of exchange prevailing at the date of the transactions. At the end of each reporting period, monetary items denominated in foreign currencies are retranslated at the rates prevailing at that date. Non-monetary items carried at fair value that are denominated in foreign currencies are retranslated at the rates prevailing at that date when the fair value was determined. Non-monetary items that are measured in terms of historical cost in a foreign currency are not retranslated.
Exchange differences on monetary items are recognised in the statement of profit and loss.
Borrowing costs, other than that are directly attributable to the acquisition, construction or production of a qualifying asset are expensed in the period in which they are incurred.
2.10.1 Long Term Employee Benefits
Long -Term Employee Benefits - Compensated Absences
Accumulated Compensated absences which fall due beyond 12 months is provided for in the books on actuarial valuation basis at the year end using projected unit credit method.
Defined Contribution Plans
Superannuation fund, Provident fund and Pension fund are defined contribution plans towards which the company makes contribution at predetermined rates to the Superannuation Trust, and the Regional Provident Fund Commissioner respectively. The same is debited to the Statement of Profit and Loss based on the amount of contribution required to be made and when services are rendered by the employees.
The Company also makes contributions to state plans namely Employee’s State Insurance Fund and Employee’s Pension Scheme 1995. The Company has no further payment obligation once the contributions have been paid.
Defined Benefit Plan
The liability or asset recognised for gratuity as at the Balance sheet date is determined on the basis of actuarial valuation using Projected Unit Credit method. The amount is funded to a Gratuity fund administered by the trustees and managed by Life Insurance Corporation of India.
Remeasurement, comprising actuarial gain and losses arising from experience adjustments and changes in actuarial assumptions are recognised in the period in which they occur directly in other comprehensive income. They are included in retained earnings in the statement of changes in equity and in the Balance Sheet. Defined benefit costs are categorised as follows : • service cost (including current service cost, past service cost, as well as gains and losses on curtailments and
settlements);• net interest expense or income;• remeasurement
Termination benefits are recognized as an expense as and when incurred.
Income tax expense represents the sum of the tax currently payable and deferred tax. Income tax expense is recognized in the statement of profit and loss except to the extent it relates to items directly recognized in equity or in other comprehensive income.
2.9 Borrowing Costs
2.10 Employee Benefits
2.11 Taxation
2.10.2 Short Term Employee Benefits
Short term employee benefits including performance incentive and compensated absences which are expected to be settled within 12 months after the end of the period in which the employee renders related service, are determined as per Company's policy and recognized as expense based on expected obligation on undiscounted basis.
• it is probable that the economic benefits associated with the transaction will flow to the company and
• the cost incurred or to be incurred in respect of the transactions can be measured reliably.
2.5.2 Rendering of services
Revenue from rendering of services priced on a time and material basis is recognized on rendering of services as per the terms of contracts with customers.
2.5.3 Dividend and interest income
Dividend income from investments is recognised when the shareholder's right to receive payment has been established.
Interest income from a financial asset is recognised and accrued on time proportion basis.
2.5.4 Rental income
The company's policy for recognition of revenue from operating lease is described in note 2.6.1
Leases are classified as finance lease whenever the terms of the lease transfer substantially all the risks and rewards of ownership to the lessee. All other leases are classified as operating leases.
2.6.1 The Company as lessor
Rental income from operating leases is generally recognised on a straight-line basis over the lease term. Where the rentals are structured solely to increase in line with expected general inflation to compensate for the company's expected inflationary cost increases, such increases are recognised in the year in which such benefits accrue. Initial direct costs incurred in negotiating and arranging an operating lease are added to the carrying amount of the leased asset and recognised on a straight-line basis over the lease term.
2.6.2 The Company as lessee
Lease payments under operating leases are recognised as an expense on a straight line basis in the statement of profit and loss over the lease term except where the lease payments are structured to increase in line with expected general inflation.
Grants from the government are recognized at their fair value where there is a reasonable assurance that the grant will be received and the Company will comply with all attached conditions.
Government grants relating to income are deferred and recognized in the profit or loss over the period necessary to match them with the costs that they are intended to compensate and presented within other operating income.
Government grants relating to the purchase of property, plant and equipment are included in non-current liabilities as deferred income and are credited to profit or loss on a straight-line basis over the expected lives of the related assets and presented within other operating income.
The export incentives from the Government are recognized based on eligibility at their fair value where there is a reasonable assurance that the incentive will be received and the company will comply with all attached conditions.
2.6 Leasing - Operating
2.7 Government Grants
2.8 Foreign Currency
Items included in the financial statements of the company are measured using the currency of the primary economic environment in which the entity operate (i.e. the "functional currency"). The financial statements are presented in Indian Rupee (INR), the national currency for India, which is the functional and presentation currency of the company.
NOTES FORMING PART OF THE FINANCIAL STATEMENTS

NOTES FORMING PART OF THE FINANCIAL STATEMENTS
2.11.2 Deferred Tax
Deferred income tax is recognized using the Balance Sheet approach. Deferred income tax assets and liabilities are recognized for deductible and taxable temporary differences arising between the tax base of assets and liabilities and their carrying amount in financial statements. However, the deferred tax liabilities are not recognised if they arise from the initial recognition of goodwill or from initial recognition of an asset or liability in a transaction that is not a business combination and affects neither accounting nor taxable profits or losses at the time of the transaction.
Deferred income tax asset are recognized to the extent that it is probable that taxable profit will be available against which the deductible temporary differences, and the carry forward of unused tax credits and unused tax losses can be utilized.
Deferred income tax liabilities are recognized for all taxable temporary differences.
The carrying amount of deferred income tax assets are reviewed at each reporting date and reduced to the extent that it is no longer probable that sufficient taxable profit will be available to allow all or part of the deferred income tax asset to be utilized.
Deferred income tax assets and liabilities are measured at the tax rates that are expected to apply in the period when the asset is realized or the liability is settled, based on tax rates (and tax laws) that have been enacted or substantively enacted at the reporting date.
Revenue expenditure pertaining to research are charged to the respective heads in Statement of Profit and Loss. Development costs of products are also charged to the Statement of Profit and Loss unless a product’s technical feasibility has been established, in which case such expenditure is capitalised. The amount capitalised comprises expenditure that can be directly attributed or allocated on a reasonable and consistent basis to creating, producing and making the asset ready for its intended use. Fixed assets utilised for research and development are capitalised and depreciated in accordance with the policies stated for Property, plant and equipment.
2.11.1 Current Tax
Current income tax for the current and prior periods are measured at the amount expected to be recovered from or paid to the taxation authorities based on the taxable income for the period. The tax rates and tax laws used to compute the current tax amount are those that are enacted or substantively enacted by the reporting date and applicable for the period. The Company offsets current tax assets and current tax liabilities, where it has a legally enforceable right to set off the recognized amounts and where it intends either to settle on a net basis or to realize the asset and liability simultaneously.
The basic earnings/ (loss) per share is computed by dividing the net profit attributable to equity shareholders for the year by the weighted average number of equity shares outstanding during the year. Diluted earnings per share adjusts the figures used in the determination of basic earnings per share to take into account the after income tax effect of interest and other financing costs associated with dilutive potential equity shares, and the weighted average number of additional equity shares that would have been outstanding assuming the conversion of all dilutive potential equity shares.
Freehold Land is carried at historical cost.
All other items of Property, Plant and equipment are stated at historical cost less accumulated depreciation and
impairment losses, if any. The cost of tangible assets comprises its purchase price net of any trade discounts and
rebates, any import duties and other taxes (other than those subsequently recoverable from the tax authorities),
any directly attributable expenditure on making the asset ready for its intended use, other incidental expenses
2.12 Earning per Share
2.13 Research and development costs
2.14 Property, Plant and equipment
and interest on borrowings attributable to acquisition of qualifying tangible assets up to the date the asset is
ready for its intended use. Machinery spares which can be used exclusively in connection with an item of
tangible asset and whose use is expected to be irregular are capitalised and depreciated over the useful life of
the principal item of the relevant assets. Subsequent costs are included in the asset's carrying amount are
recognised as a separate asset, as appropriate only when it is probable that future economic benefits associated
with the item will flow to the company and the cost of the item can be measured reliably.
Individual assets costing less than Rs.5,000 each are depreciated in full in the year of acquisition.
Capital work-in-progress:
Items of assets which are not yet ready for their intended use are carried at cost, comprising direct cost, related
incidental expenses and attributable interest, if any.
Depreciation
Depreciation is recognised so as to write off the cost of the assets (other than freehold land and assets under
progress) less their residual values over their useful lives, using the straight-line method. The estimated useful
lives, residual value and depreciation method are reviewed at the end of each reporting period, with the effect
of any changes in estimate accounted for on a prospective basis.
Estimated useful lives of the tangible assets are as follows:-
Buildings
(i) Factory Building 30 years
(ii) Residential Building 60 years
Plant and equipment
(i) Single Shift 15 years
(ii) Double Shift 10 years
(iii) Triple Shift 7.5 years
Office equipment
(i) Computers and Data Processing equipments 3 years
(ii) Servers and Networks 6 years
(iii) Others 5 years
Furniture and Fixtures 10 years
Vehicles 8 years
Depreciation on tangible fixed assets has been provided on the straight-line method as per the useful life
prescribed in Schedule II to the Companies Act, 2013 except in respect of the used / second hand machines &
process bath equipments , in whose case the life of the assets has been assessed based on technical advice,
taking into account the nature of the asset, the estimated usage of the asset, the operating conditions of the
asset, past history of replacement, anticipated technological changes, manufacturers warranties and
maintenance support, etc.
Depreciation on assets added / disposed off during the year is provided on pro-rata basis from the month of
addition or up to the month prior to the month of disposal, as applicable.
An item of property, plant and equipment is derecognised upon disposal or when no future economic benefits
are expected to arise from the continued use of the asset. Any gain or loss arising on the disposal or retirement
of an item of property, plant and equipment is determined as the difference between the sales proceeds and the
carrying amount of the asset and is recognised in profit or loss.
NOTES FORMING PART OF THE FINANCIAL STATEMENTS
96
97

NOTES FORMING PART OF THE FINANCIAL STATEMENTS
amounts of cash and which are subject to an insignificant risk of changes in values, and bank overdrafts. Bank overdrafts and Book overdrafts are disclosed under "Other financial liabilities".
Cash flows are reported using the indirect method, whereby profit for the period is adjusted for the effects of transactions of a non-cash nature, any deferrals or accruals of past or future operating cash receipts or payments and item of income or expenses associated with investing or financing cash flows. The cash flows from operating, investing and financing activities of the Company are segregated.
Provisions are recognised when the company has a present obligation (legal or constructive) as a result of a past event, it is probable that the company will be required to settle the obligation, and a reliable estimate can be made of the amount of the obligation.
The amount recognised as a provision is the best estimate of the consideration required to settle present obligation at the end of reporting period, taking into account the risk and uncertainties surrounding the obligation. When a provision is measured using the cash flows estimated to settle the present obligation, its carrying amount is the present value of those cash flows (when the effect of the time value of money is material).
When some or all of the economic benefits required to settle a provision are expected to be recovered from a third party, a receivable is recognised as an asset if it is virtually certain that reimbursement will be received and the amount of receivable can be measured reliably.
A disclosure for contingent liabilities is made where there is a possible obligation or a present obligation that may probably not require an outflow of resources or an obligation for which the future outcome cannot be ascertained with reasonable certainty. When there is a possible or a present obligation where the likelihood of outflow of resources is remote, no provision or disclosure is made.
Contingent assets are not recognized in the financial statements.
2.19 Provisions and Contingencies
2.20 Financial Instruments
2.21 Financial Assets
Financial assets and financial liabilities are recognised when the company become a party to the contractual provision of the instruments.
Financial assets and financial liabilities are initially measured at fair value. Transaction costs that are directly attributable to the acquisition or issue of financial assets and financial liabilities (other than financial assets and financial liabilities at fair value through profit or loss) are added to or deducted from the fair value of the financial assets or financial liabilities, as appropriate, on initial recognition. Transactions costs directly attributable to the acquisition of financial assets or financial liabilities at fair value through profit or loss are recognised immediately in profit or loss.
All regular way purchases or sales of financial assets are recognised and derecognised on a trade date basis. Regular way purchases or sales are purchases or sales of financial assets that require delivery of assets within the time frame established by regulation or convention in the market place.
All recognised financial assets are subsequently measured in their entirety at either amortized cost or fair value, depending on the classification of the financial assets.
2.21.1. Classification of financial assets
Financial Assets that meet the following conditions are subsequently measured at amortised cost (except for financial assets that are designated as at fair value through profit or loss on initial recognition) :
2.15 Intangible Assets
2.16 Impairment of tangible and intangible assets other than goodwill
2.17 Inventories
2.18 Cash and cash equivalents
2.15.1 Intangible assets acquired separately
Intangible assets with finite useful lives that are acquired separately are carried at cost less accumulated amortisation and accumulated impairment losses, if any. Amortisation is recognised on a straight-line basis over their estimated useful lives. The estimated useful life and amortisation method are reviewed at the end of each reporting period, with the effect of any changes in estimate being accounted for on a prospective basis.
2.15.2. Intangible assets acquired in a business combination
At the end of each reporting period, the company reviews the carrying amounts of its tangible and intangible assets to determine whether there is any indication that those assets have suffered an impairment loss. If any such indication exists, the recoverable amount of the assets is estimated in order to determine the extent of the impairment loss (if any). When it is not possible to estimate the recoverable amount of an individual asset, the company estimates the recoverable amount of the cash-generating unit to which the asset belongs. When a reasonable and consistent basis of allocation can be identified, corporate assets are also allocated to individual cash-generating units, or otherwise they are allocated to the smallest group of cash-generating units for which a reasonable and consistent allocation basis can be identified.
Recoverable amount is higher of fair value less cost of disposal and value in use. In assessing value in use, the estimated future cash flows are discounted to their present value using a pre-tax discount rate that reflects current market assessments of the time value of money and the risks specific to the asset for which the estimates of future cash flows have not been adjusted.
If the recoverable amount of an asset (or cash-generating unit) is estimated to be less than its carrying amount, the carrying amount of the asset(or cash-generating unit) is reduced to its recoverable amount. An impairment loss is recognised immediately in profit or loss.
Inventories are valued at lower of cost and net realizable value. Cost of raw materials, stores and spares and traded goods comprises cost of purchases. Cost of work-in-progress and finished goods comprises direct materials, direct labour, and an appropriate proportion of overheads. Cost of inventories also include all other costs incurred in bringing the inventories to the present location and condition. Cost is computed on weighted average basis.
Net realisable value represents the estimated selling price for inventories less the estimated costs of completion and estimated costs necessary to make the sale.
Cash and cash equivalents includes cash on hand, deposits held at call with financial institutions, other short term, highly liquid investments with original maturity of 3 months or less that are readily convertible into known
Intangible assets acquired in a business combination other than goodwill are initially recognised at their fair value at the acquisition date (which is regarded as their cost).
2.15.3 Useful lives of intangible assets
Estimated useful lives of the intangible assets are as follows:-
Technical Knowhow 5 years
Computer Software 5 years
Brands and Trademarks 5 years
Patents 5 years
NOTES FORMING PART OF THE FINANCIAL STATEMENTS
98 99

NOTES FORMING PART OF THE FINANCIAL STATEMENTS NOTES FORMING PART OF THE FINANCIAL STATEMENTS
• the asset is held within business model whose objective is to hold assets in order to collect contractual cash flows; and
• the contractual terms of the instruments give rise on specified dates to cash flows that are solely payments of principal and interest on the principal amount outstanding.
Financial assets are presented as current assets, except for those maturing later than 12 months after the reporting date which are presented as non-current assets. Financial assets are measured initially at fair value plus transaction costs and subsequently carried at amortised cost using the effective interest method, less any impairment loss.
Amortised cost are represented by security deposits, cash and cash equivalents and eligible current and non-current assets. Cash and cash equivalent comprise cash on hand and in banks and demand deposit with banks which can be withdrawn at any time without prior notice or penalty on the principal.
For the impairment policy on financial assets measured at amortised cost, refer Note 2.21.4
Financial assets that meet the following conditions are subsequently measured at fair value through other comprehensive income (except for financial assets that are designated as at fair value through profit or loss on initial recognition) :
• the asset is held within a business model whose objective is achieved both by collecting contractual cash flows and selling financial assets; and
• the contractual terms of the instruments give rise on specified dates to cash flows that are solely payments of principal and interest on the principal amount outstanding.
2.21.2 Investment in equity instruments at FVTOCI
On initial recognition, the group can make an irrevocable election (on an instrument- by instrument basis) to present the subsequent changes in fair value in other comprehensive income pertaining to investment in equity instruments. This election is not permitted if the equity investment is held for trading. These elected investments are initially measured at fair value. Subsequently, they are measured at fair value with gain and losses arising from changes in fair value recognised in other comprehensive income and accumulated in the 'Reserve for equity instrument through other comprehensive income'. The cumulative gain or loss is not reclassified to profit or loss on disposal of the investments.
2.21.3. Financial assets at fair value through profit or loss (FVTPL)
Financial asset at FVTPL are measured at fair value at the end of each reporting period, with any gains or losses arising on remeasurement recognised in profit or loss. The net gain or loss recognised in profit or loss incorporate any dividend or interest earned on the financial asset and is included under 'Other income'. Dividend on financial asset at FVTPL is recognised when the company’s right to receive the dividends is established. It is probable that the economic benefits associated with the dividend will flow to the entity, the dividend does not represent a recovery of part of cost of the investment and the amount can be measured reliably.
FVTPL is a residual category for financial assets. Any financial categorisation as at amortised cost or as FVTOCI, is classified at FVTPL. In addition, the company may elect to designate the financial asset, which otherwise meets amortised cost or FVTOCI criteria, at FVTPL, if doing so eliminates or significantly reduces a measurement or recognition inconsistency.
2.21.4. Impairment of financial assets
The company measures the loss allowance for a financial instruments at an amount equal to the lifetime expected credit losses if the credit risk on that financial instruments has increased significantly since initial recognition. If the credit risk on a financial instruments has not increased significantly since initial recognition, the company measures the loss allowance for that financial instruments at an amount equal to 12 month
expected credit losses. 12 month expected credit losses are portion of the lifetime expected credit losses and represents the lifetime cash shortfalls that will result if default occurs within the 12 months after the reporting date and thus, are not cash shortfalls that are predicted over the 12 months. For trade receivables or any contractual rights to receive cash or another financial assets that result from transactions that are within the scope of Ind AS 11 and Ind AS 18, the company always measures the loss allowance at an amount equal to life time expected credit losses.
Further, for the purposes of measuring lifetime expected credit loss allowance for trade receivables, the company has used a practical expedient as permitted under Ind AS 109. This expected credit loss allowance is computed based on a provision matrix which takes into account historical credit loss experience and adjusted for forward-looking information.
Operating segments are reported in a manner consistent with the internal reporting provided to the chief operating decision maker (CODM). Refer Note 32 for segment information presented.
All amounts disclosed in the financial statements and notes have been rounded off to the nearest lakhs, as per the requirement of Schedule III, unless otherwise stated.
2.24.1 Ind AS 21
Appendix B to Ind AS 21, Foreign currency transactions and advance consideration: On March 28, 2018, Ministry of Corporate Affairs ("MCA") has notified the Companies (Indian Accounting Standards) Amendment Rules, 2018 containing Appendix B to Ind AS 21, Foreign currency transactions and advance consideration which clarifies the date of the transaction for the purpose of determining the exchange rate to use on initial recognition of the related asset, expense or income, when an entity has received or paid advance consideration in a foreign currency.
The Company is evaluating the requirements of the amendment and the impact on the financial statements.
2.24.2 Ind AS 115
Ind AS 115- Revenue from Contract with Customers: On March 28, 2018, Ministry of Corporate Affairs ("MCA") has notified the Ind AS 115, Revenue from Contract with Customers. The core principle of the new standard is that an entity should recognize revenue to depict the transfer of promised goods or services to customers in an amount that reflects the consideration to which the entity expects to be entitled in exchange for those goods or services. Further the new standard requires enhanced disclosures about the nature, amount, timing and uncertainty of revenue and cash flows arising from the entity’s contracts with customers.
The standard permits two possible methods of transition:
-Retrospective approach - Under this approach the standard will be applied retrospectively to each prior reporting period presented in accordance with Ind AS 8- Accounting Policies, Changes in Accounting Estimates and Errors.
-Retrospectively with cumulative effect of initially applying the standard recognized at the date of initial application (Cumulative catch - up approach)
The effective date for adoption of Ind AS 115 is financial periods beginning on or after April 1, 2018.
The Company is evaluating the requirements of the standard and the impact on the financial statements.
2.22 Segment Reporting
2.23 Rounding Off
2.24 New standards and interpretations not yet adopted
(Rs. in lakhs)
101100

NOTES FORMING PART OF THE FINANCIAL STATEMENTS NOTES FORMING PART OF THE FINANCIAL STATEMENTS
102
No
te
4 -
Go
od
will
A r
eco
ncili
atio
n o
f th
e c
arr
yin
g a
mo
un
t o
f g
oo
dw
ill a
t th
e b
eg
inn
ing
an
d e
nd
of
the
re
po
rtin
g p
erio
d
Descri
pti
on
of
Assets
As
at
Ma
rch
31
, 2
01
7
Co
st
Ba
lan
ce
at
be
gin
nin
g o
f ye
ar
Ad
ditio
na
l am
ou
nts
re
cog
nis
ed
fro
m b
usin
ess
co
mb
ina
tio
ns
occ
urr
ed
du
rin
g t
he
ye
ar
(No
te 3
0)
Ba
lan
ce
at
en
d o
f y
ea
r
Ac
cu
mu
late
d I
mp
air
me
nt
Ba
lan
ce
at
be
gin
nin
g o
f ye
ar
Imp
airm
en
t lo
sse
s re
co
gn
ise
d in
th
e y
ea
r
Ba
lan
ce
at
en
d o
f y
ea
r
Ne
t C
arr
yin
g V
alu
e
As
at
Ma
rch
31
, 2
01
8
10
.27 -
10
.27 - - -
10
.27
-
10
.27
10
.27 - - -
10
.27
(Rs.
in
lakh
s)
(Rs.
in
lakh
s)
417.4
0
3,9
88.7
0521.4
31
37
.11
49
.95
5,1
14
.59
53.7
9
704.9
0145.5
22
1.5
41
5.1
89
40
.93
-(2
1.6
5)
(43.6
0)
-(3
.78
)(6
9.0
3)
471.1
9
4,6
71.9
5623.3
51
58
.65
61
.35
5,9
86
.49
1,1
65.2
43,9
41.7
2331.8
41
23
.91
69
.37
5,6
35
.74
1,1
18.9
03,6
19.8
0238.9
71
25
.31
64
.05
5,1
70
.69
9,8
19
.39
Descri
pti
on
of
Assets
Lan
d -
Fre
eh
old
Bu
ild
ing
s -
Fre
eh
old
Pla
nt
an
d
Eq
uip
men
t
Off
ice
Eq
uip
men
t
Fu
rnit
ure
an
d
Fix
ture
s
Ve
hic
les
To
tal
I. G
ross B
lock
Net
Carr
yin
g V
alu
e a
s a
t M
arc
h 3
1, 2017
Net
Carr
yin
g V
alu
e a
s a
t M
arc
h 3
1, 2018
Co
st
as a
t A
pri
l 1, 2016
3.6
6
3.6
6
3.6
6
1
,557.7
4
7,1
92.3
8
724.4
2
24
7.3
4
93
.85
1
,12
9.8
8
(2
16
.54
)
47
9.6
0
(72
.75
)
1
1,1
57
.18
4,4
30
.13
89
6.0
2
(2
11
.56
)
5,1
14
.59
Additi
ons
Dis
posa
ls
Bala
nce a
s a
t M
arc
h 3
1, 2017
Bala
nce a
s a
t A
pri
l 1, 2017
Additi
ons
Dis
posa
ls
Bala
nce a
s a
t M
arc
h 3
1, 2018
II. A
ccu
mu
late
d d
ep
recia
tio
n
Bala
nce a
s a
t A
pri
l 1, 2016
Depre
ciatio
n e
xpense
for
the y
ear
(Note
27)
Elim
inate
d o
n d
isposa
l of ass
ets
Bala
nce a
s a
t M
arc
h 3
1, 2017
Bala
nce a
s a
t A
pri
l 1, 2017
Depre
ciatio
n e
xpense
for
the y
ear
(Note
27)
Elim
inate
d o
n d
isposa
l of ass
ets
Bala
nce a
s a
t M
arc
h 3
1, 2018
3.6
6
-
-
3.6
6
-
-
3.6
6 - - - - - - - -
1,5
82.6
4
24.9
0
-
1,5
82.6
4
7.4
5
-
1,5
90.0
9
365.3
5
52.0
5 -
417.4
0
7,9
30.4
2
8
68.2
2
(1
47.7
8)
7,9
30.4
2
3
82.9
8
(21.6
5)
8,2
91.7
5
3,4
77.4
6
6
58.3
7
(1
47.1
3)
3,9
88.7
0
853.2
7
189.1
1
(
60.2
6)
853.2
7
52.6
5
(
43.6
0)
862.3
2
431.0
3
150.6
6
(
60.2
6)
521.4
3
26
1.0
2
13
.68
-
26
1.0
2
22
.94
-
2
83
.96
11
5.9
1
21
.20
-
13
7.1
1
1
19
.32
33
.97
(
8.5
0)
1
19
.32
1
3.5
8
(
7.5
0)
1
25
.40
40
.38
1
3.7
4
(
4.1
7)
49
.95
1
0,7
50
.33
1
0,7
50
.33
Acq
uis
itions
thro
ugh b
usi
ness
com
bin
atio
ns
(Note
30)
--
17.6
0
--
-1
7.6
0
No
te 3
- P
rop
ert
y, P
lan
t an
d E
qu
ipm
en
t
Descri
pti
on
of
Assets
Tech
nic
al
Co
mp
ute
r
So
ftw
are
Bra
nd
s/
Tra
dem
ark
sP
ate
nts
To
tal
202.2
7217.1
4-
- 419.4
1
- 81.0
0
50.0
0
131.0
0
-53.1
3-
-53.1
3
202.2
7270.2
781.0
050.0
0603.5
4
202.2
7270.2
781.0
050.0
0603.5
4
-51.9
2-
-51.9
2
202.2
7322.1
981.0
050.0
0655.4
6
145.7
7152.6
7-
- 298.4
4
18.5
229.3
412.1
57.5
067.5
1
164.2
9182.0
112.1
57.5
0365.9
5
164.2
9182.0
112.1
57.5
0
365.9
5
14.6
5
34.3
5
16.2
0
10.0
0
75.2
0
178.9
4216.3
628.3
517.5
0441.1
5
37.9
888.2
668.8
542.5
0237.5
9
I. G
ross B
lock
Co
st
as a
t A
pri
l 1, 2016
Additi
ons
thro
ugh b
usi
ness
com
bin
atio
n (
Refe
r N
ote
30)
Additi
ons
Bala
nce a
s a
t M
arc
h 3
1, 2017
Bala
nce a
s a
t A
pri
l 1, 2017
Additi
ons
Bala
nce a
s a
t M
arc
h 3
1, 2018
II. A
ccu
mu
late
d a
mo
rtis
ati
on
Bala
nce a
s a
t A
pri
l 1, 2016
Am
ort
isatio
n e
xpense
for
the y
ear
(Refe
r N
ote
27)
Bala
nce a
s a
t M
arc
h 3
1, 2017
Bala
nce a
s a
t A
pri
l 1, 2017
Am
ort
isatio
n e
xpense
for
the y
ear
(Refe
r N
ote
27)
Bala
nce a
s a
t M
arc
h 3
1, 2018
Net
Carr
yin
g V
alu
e a
s a
t M
arc
h 3
1, 2017
Net
Carr
yin
g V
alu
e a
s a
t M
arc
h 3
1, 2018
23.3
3105.8
352.6
532.5
0214.3
1
Kn
ow
ho
w
No
te 5
- O
ther
Inta
ng
ible
Ass
est
s
103
a)
Refe
r to
Note
37.3
for
info
rmatio
n o
n p
ropert
y, p
lant and e
quip
ment ple
dged a
s se
curity
by
the C
om
pany.

Un
its
(No
s)A
mo
un
tU
nit
s (N
os)
Am
ou
nt
Un
its
(No
s)A
mo
un
tU
nit
s (N
os)
Am
ou
nt
- -
10,2
99,9
93.0
0
277
.39
- -
10,
299,
993.
00
2
77.3
9
- -
8.
00
1
53.1
6 -
-
8.0
0
153
.16
-
430.
55
-
430.
55
33,0
53
33.1
1 -
-
19,9
97
20.0
2 -
-
30,8
58
31.1
5 -
-
125,
467
127.
26
- -
667,
437
117.
04
- -
- -
- -
49,5
79
49.7
1 -
- -
- -
-
490,
000
49.3
9 -
- -
- -
-
- -
- -
49
,179
49
.19
- -
595,
696
101.
89
- -
- -
- -
3,22
9 49
.39
- -
4,
002
61.1
8 -
-
400,
000
40.3
2 -
- -
- -
-
295,
555
95.4
3 -
-
295,
555
90.3
5 -
-
186,
618
62.5
8 -
-
186,
618
58.7
5 -
-
4,27
7,04
5 46
1.47
-
-
3,53
1,86
738
5.27
-
-
21,7
58
224.
26
- -
14
,125
14
5.45
-
-
4,96
0 49
.67
- -
- -
- -
- -
- -
2,
998
30.0
1 -
-
- -
- -
3,
983
40.0
0 -
-
311,
803
31.4
2 -
- -
- -
-
33,0
07
330.
45
- -
1,
500
15.0
2 -
-
5,10
4 51
.22
- -
4,
883
49.0
0 -
-
1,21
3 20
.32
- -
- -
- -
1,7
98.8
2 -
1
,071
.50
-
1,79
8.82
430.
55
1
,071
.50
43
0.55
1,79
8.82
430.
55
1
,071
.50
43
0.55
1,75
6.36
-
1,
032.
85-
1,79
8.82
-
1,0
71.5
0 -
-
430.
55
-
430.
55
--
--
No
n C
urr
ent
As
at M
arch
31,
201
8 A
s at
Mar
ch 3
1, 2
017
Cu
rren
t N
on
Cu
rren
t C
urr
ent
CO
ST
I. U
nq
uo
ted
Inve
stm
ents
Inve
stm
ents
in E
quity
Inst
rum
ents
- o
f Sub
sidi
arie
s
i)
WE
ND
T G
RIN
DIN
G T
EC
HN
OLO
GIE
S L
TD
, TH
AIL
AN
D
(10,
299,
993
equi
ty s
hare
s of
face
val
ue B
aht 1
0/-
eac
h (p
revi
ous
year
10,
299,
993)
, par
tly p
aid
up @
2.5
Bah
t per
sha
re)
ii)
WE
ND
T M
IDD
LE E
AS
T F
ZE
, SH
AR
JAH
(8 e
quity
sha
res
of fa
ce v
alue
of A
ED
150
,000
eac
h (p
revi
ous
year
8)
fully
pai
d up
)
TOTA
L U
NQ
UO
TE
D IN
VE
ST
ME
NT
S C
AR
RIE
D A
T C
OS
T [
A]
Des
ign
ated
as
Fai
r V
alu
e T
hro
ug
h P
rofi
t an
d L
oss
I. Q
uo
ted
Inve
stm
ents
Inve
stm
ents
in M
utu
al F
un
ds
ICIC
I Pru
dent
ial M
oney
Mar
ket F
und
- D
aily
Div
iden
d
ICIC
I Pru
dent
ial S
avin
gs F
und
- D
aily
Div
iden
d
ICIC
I Pru
dent
ial R
egul
ar In
com
e F
und
- G
row
th
Adi
tya
Birl
a S
un L
ife S
avin
gs F
und
- D
aily
Div
iden
d -
Reg
ular
Pla
n -
Rei
nves
tmen
t
Adi
tya
Birl
a S
un L
ife In
terv
al In
com
e F
und-
Qrt
ly P
lan-
Ser
ies
1 D
ivid
end-
Reg
Pla
n-P
ayou
t
Adi
tya
Sun
Life
Flo
atin
g R
ate
Fun
d-S
TP
-IP
-Dai
ly D
ivid
end
Ren
ives
tmen
tB
irla
Rel
ianc
e M
ediu
m T
erm
Fun
d -
Dai
ly D
ivid
end
Pla
n- D
ivid
end
Rei
nves
tmen
t
Rel
ianc
e Li
quid
Fun
d Tr
easu
ry P
lan
- D
aily
Div
iden
d O
ptio
n D
ivid
end
Rei
nves
tmen
t
Rel
ianc
e F
ixed
Hor
izon
Fun
d -
XX
XV
I-S
erie
s4-D
ivid
end
Pla
n-D
ivid
end
Pay
out
TATA
Sho
rt T
erm
Bon
d F
und
Pla
n A
- G
row
th
TATA
Sho
rt T
erm
Bon
d F
und
Dire
ct P
lan
- G
row
th
Bar
oda
Pio
neer
Cre
dit O
ppor
tuni
ties
Fun
d -P
lan
A M
onth
ly D
ivid
end-
Rei
nves
tmen
t
Bar
oda
Pio
neer
Tre
asur
y A
dvan
tage
Fun
d-P
lan
A D
aily
Div
iden
d -R
einv
estm
ent
Bar
oda
Pio
neer
Liq
uid
Fun
d-P
lan
A D
aily
Div
iden
d-R
einv
estm
ent
DS
P B
lack
Roc
k Li
quid
ity F
und
- In
stitu
tiona
l Pla
n -
Dai
ly D
ivid
end
DS
P B
lack
Roc
k M
oney
Man
ager
Fun
d -
Reg
ular
-D
aily
Div
iden
d
DS
P B
lack
Roc
k F
MP
- S
erie
s 22
2-3m
-Reg
-Div
-Reg
Pay
Indi
abul
ls L
iqui
d F
und
- E
xist
ing
Pla
n D
aily
Div
iden
d -
Rei
nves
tmen
t
Indi
abul
ls U
ltra
Sho
rt T
erm
Fun
d -
Exi
stin
g P
lan
Dai
ly D
ivid
end
- R
einv
estm
ent
SB
I Mag
num
Inst
a C
ash
Fun
d -
Reg
ular
Pla
n- D
aily
Div
iden
d
TOTA
L IN
VE
ST
ME
NT
S C
AR
RIE
D A
T F
VT
PL
[B]
TOTA
L IN
VE
ST
ME
NT
S (
A)
+ (B
)
TOTA
L IN
VE
ST
ME
NT
S C
AR
RY
ING
VA
LU
E (
A)
+ (B
)
Oth
er d
iscl
osu
res
Agg
rega
te c
ost o
f quo
ted
inve
stm
ents
Agg
rega
te m
arke
t val
ue o
f quo
ted
inve
stm
ents
Agg
rega
te v
alue
of u
nquo
ted
inve
stm
ents
Agg
rega
te a
mou
nt o
f im
pairm
ent i
n va
lue
of in
vest
men
ts
Sl N
o.
A B 1 2 3 4 5 6 7 8 9 10 11 12 13 14 15 16 17 18 19 20
Par
ticu
lars
NOTES FORMING PART OF THE FINANCIAL STATEMENTS NOTES FORMING PART OF THE FINANCIAL STATEMENTS
104 105
No
te 6
- In
vest
men
ts
Note 7 - Other financial assets
Note 8 - Other non-current and current assets
(Rs.
in
lakh
s)
(Rs. in lakhs)
Particulars As at March 31, 2018
7.02
62.36
27.21
3.14
99.73
As at March 31, 2017
9.50
57.60
41.99
1.27
110.36
Unsecured, considered good
(a) Advances to suppliers (b) Balances with government authorities (other than
income taxes)
(i) Cenvat receivable
(ii) GST credit receivable
(iii) VAT credit receivable
(iv) Service tax credit receivable
(c) Other loans and advances
(d) Prepayments
(e) Security Deposits with Government
(f) Export Incentive receivable
Unsecured, considered doubtful
(a) Other loans and advances
Less: Provisions for doubtful loans and advances
(a) Security Deposits
(b) Employee advances
( c) Receivables from subsidiaries
(d) Rent receivable
Total
Total
Current Non- Current
39.55 -
2.71 -
7.59 -
- -
- -
27.76 -
232.40 -
- 50.21
90.28 -
34.19 -
(34.19) -
400.29 50.21
As at March 31, 2018
Current Non- Current
44.85 -
82.66 -
- -
9.92 -
93.23 -
22.11 -
105.78 -
- 44.51
- -
39.09 -
(39.09) -
358.55 44.51
As at March 31, 2017 Particulars
Note 9 - Income tax Assets & Liabilities
Particulars As at March 31, 2018 As at March 31, 2017
Income tax Assets - Non Current
Advance Income tax paid (net) 287.87 294.99
Total 287.87 294.99
Income tax Liabilities - Current
Provision for Income Tax (net) 279.81 116.71
Total 279.81 116.71

Note 10 - Inventories
NOTES FORMING PART OF THE FINANCIAL STATEMENTS
107
NOTES FORMING PART OF THE FINANCIAL STATEMENTS
106
Note 11 - Trade receivables
Notes1) Write down of inventories to net realisable value amounted to Rs 31.32 Lacs (March 31, 2017: Rs.37.57 lakhs). These were recognised as an expense during the year and included in 'Change in inventories of finished goods, work-in-progress and stock-in-trade' in Statement of Profit and Loss account.
(Rs. in lakhs) (Rs. in lakhs)
(a) Raw materials
(b) Work-in-progress
(c) Finished goods
(d)
(e) Stores and spares
Included above, goods-in-transit:
(i) Raw materials
Total goods-in-transit
Stock-in-trade
Total
852.31
644.95
130.61
55.37
161.07
1,844.31
24.35
24.35
Particulars As at March 31, 2017
892.46
693.05
55.39
45.26
189.99
1,876.15
46.53
46.53
As at March 31, 2018
Particulars As at March 31, 2017As at March 31, 2018CurrentCurrent
(Unsecured)
(a) Considered good 3,382.96 2,872.26 (b) Considered doubtful 37.78 29.69
3,420.74 2,901.95 Less: Allowance for doubtful debts 37.78 29.69
Total 3,382.96 2,872.26
Note 11(a) - Movement in the allowance for doubtful debts
Particulars As at March 31, 2017As at March 31, 2018
Balance at beginning of the year 29.69 60.98 Impairment losses recognised in the year
- Other receivables 31.35 20.05 Amounts written off during the year as uncollectable (8.23) (14.75)
Amounts recovered during the year (15.03) (36.59)
Balance at end of the year 37.78 29.69
Note 11(b) - Trade Receivables breakup
Particulars As at March 31, 2017As at March 31, 2018
Of the above, trade receivables from: - Related Parties 419.93 253.95
- Others 3,000.81 2,648.00
Total 3,420.74 2,901.95
Note 11(c) - Expected Credit Loss (%)
Particulars As at March 31, 2017As at March 31, 2018
Within the credit period - - 1-30 days past due 1 1 31-60 days past due 2 1 61-90 days past due 2 2 More than 90 days past due 6 5
Note 11(d) - Ageing of Receivables
Particulars As at March 31, 2017As at March 31, 2018
Within the credit period 2,259.53 1,916.601-30 days past due 416.36 404.5731-60 days past due 202.85 228.7461-90 days past due 88.65 94.48
More than 90 days past due 453.35 257.56
Total 3,420.74 2,901.95
Note 12A - Cash and Cash Equivalents
Particulars As at March 31, 2017As at March 31, 2018
199.66 22.78
5.06 13.57
(a) Unrestricted Balances with banks
(b) Cheques on hand
(c) Cash in hand 0.50 0.55
Total 205.22 36.90
Note 12B - Bank balances other than above
Particulars As at March 31, 2017As at March 31, 2018
0.70 0.70(a) Deposit accounts
(b) Earmarked balances in Dividend accounts 430.85 229.43
Total 431.55 230.13

Particulars As at March 31, 2017As at March 31, 2018
Note - 13: Equity Share Capital
NOTES FORMING PART OF THE FINANCIAL STATEMENTS
109
NOTES FORMING PART OF THE FINANCIAL STATEMENTS
(a) Reconciliation of the number of shares outstanding at the beginning and at the end of the period
Retained Earnings comprise of the Company's undistributed earnings after taxes.
(Rs. in lakhs, except for number of shares) (Rs. in lakhs)
108
Authorised:
30,00,000 (March 31, 2017: 30,00,000) Equity
shares of Rs. 10/- each with voting rights
Issued, Subscribed and Fully Paid:
20,00,000 (March 31, 2017: 20,00,000) Equity
shares of Rs. 10/- each with voting rights
Total 200.00 200.00
300.00 300.00
200.00 200.00
Amount No. of SharesRs. in lakhs
Shares outstanding at the beginning of the period 200 2,000,000
Add: Movements during the year - -
Shares outstanding at the end of the period
2,000,000 -
2,000,000 200 2,000,000
No. of Shares Amount Rs. in lakhs
200
-
200
As at March 31, 2018 As at March 31, 2017
Particulars
(b) Details of shares held by each shareholder holding more than 5% shares in the Company:
No. of Shares % No. of Shares %
797,352 39.87 797,352 39.87
Equity Shares : (with equal voting rights)
Wendt GmbH, Germany
Carborundum Universal Limited, India 797,352 39.87 797,352 39.87
ParticularsAs at March 31, 2018 As at March 31, 2017
The Company has only one class of equity shares with voting rights (one vote per share). The dividends proposed by the Board of directors is subject to approval of the shareholders in the ensuing Annual General Meeting. In the event of liquidation of the Company, the equity shareholders are entitled to receive only the residual assets of the Company. The distribution of dividend is in the proportion to the number of equity shares held by the shareholders.
(c) Rights, Preferences and Restrictions attached to shares
(d) There are no instances of bonus shares issued, shares issued for consideration other than cash and shares bought back during the period of 5 years immediately preceding the Balance Sheet date.
Note 14 - Other equity
Particulars As at March 31, 2017As at March 31, 2018
Total
General Reserve 5,847.73 5,717.73
Retained earnings 4,859.78 4,325.64
10,707.51 10,043.37
14.1 General Reserve
Particulars As at March 31, 2017As at March 31, 2018
5,847.73 5,717.73Balance as at the year end
5,717.73 5,597.73
130.00 120.00
Balance at the beginning of the year
Transfer from Retained earnings
The general reserve is a free reserve, retained from Company's profits and can be utilised upon fulfilling certain conditions in accordance with Companies Act.
14.2 Retained earnings
Particulars As at March 31, 2017As at March 31, 2018
4,325.64 3,946.72
1,229.70 1,169.3336.23 (68.62)
(300.00) (300.00)
(61.07) (61.07)
(200.00) (200.00)
(40.72) (40.72)
(130.00) (120.00)
4,859.78 4,325.64
Balance at the beginning of the year
Other Comprehensive income arising from remeasurement
of defined benefit obligation, net of tax
Balance as at the year end
Dividend Tax on Final Dividend for the preceding financial
year
Transfer to General Reserve
Dividend Tax on Interim Dividend for the current year
Payment of Interim Dividend for the current year
Payment of Final Dividend for the preceding financial year
Profit for the year
14.3 Distributions made and proposed
The amount of per share dividend recognized as distributions to equity shareholders for the year ended March 31, 2018 and March 31, 2017 was Rs.25 and Rs. 25 respectively.
The Board of Directors at its meeting held on April 24, 2017 had recommended a final dividend of 150% (Rs.15/- per equity share of face value Rs.10/- each). The proposal was approved by shareholders at the Annual General Meeting held on July 24, 2017, this has resulted in a cash outflow of Rs. 361.07 lakhs, inclusive of dividend distribution tax of Rs. 61.07 lakhs. Also, the Board of Directors at its meeting held on January 24, 2018 had declared an interim dividend of 100% (Rs.10/- per equity share of face value of Rs.10/- each). Further, the Board of Directors at its meeting held on April 25, 2018 have recommended a final dividend of 150% (Rs. 15/- per equity share of face value of Rs.10/- each) which is subject to approval of shareholders. If approved, this would result in a cash outflow of Rs. 361.07 lakhs, inclusive of dividend distribution tax.
Current Current
ParticularsAs at March 31, 2018 As at March 31, 2017
Note 15 - Provisions
Non- CurrentNon- Current
(a) Provision for employee benefits
- Compensated absences 94.93 91.21 91.58 91.02
- Other employee obligations - - 37.34 96.40
Total 94.93 91.21 128.92 187.42
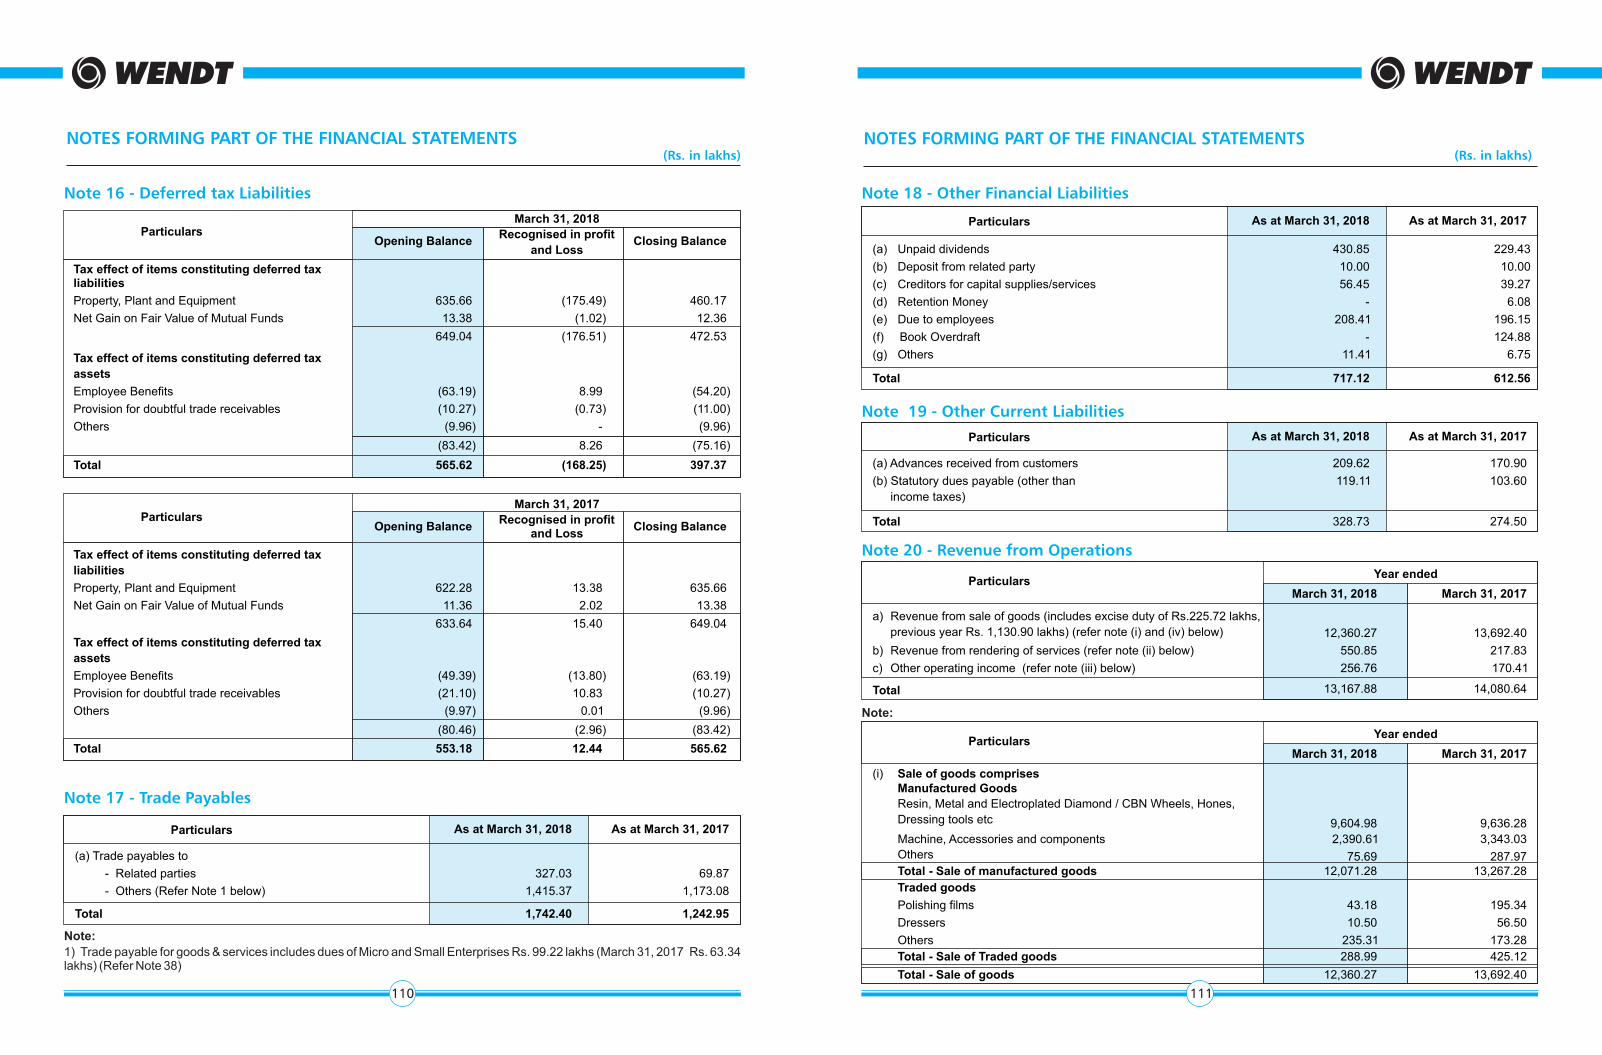
March 31, 2018 March 31, 2017
Year endedParticulars
(i) Sale of goods comprises
Manufactured Goods
Resin, Metal and Electroplated Diamond / CBN Wheels, Hones,
Dressing tools etc 9,604.98 9,636.28
Machine, Accessories and components 2,390.61 3,343.03
Others 75.69 287.97 Total - Sale of manufactured goods 12,071.28 13,267.28
Traded goods
Polishing films 43.18 195.34
Dressers 10.50 56.50
Others 235.31 173.28
Total - Sale of Traded goods 288.99 425.12
Total - Sale of goods 12,360.27 13,692.40
Note 18 - Other Financial Liabilities
NOTES FORMING PART OF THE FINANCIAL STATEMENTS
111
NOTES FORMING PART OF THE FINANCIAL STATEMENTS
110
Note 17 - Trade Payables
(Rs. in lakhs) (Rs. in lakhs)
Note 16 - Deferred tax Liabilities
Opening BalanceRecognised in profit
and LossClosing Balance
Tax effect of items constituting deferred tax liabilities
Property, Plant and Equipment 635.66 (175.49) 460.17
Net Gain on Fair Value of Mutual Funds 13.38 (1.02) 12.36
649.04 (176.51) 472.53
Tax effect of items constituting deferred tax
assets
Employee Benefits (63.19) 8.99 (54.20)
Provision for doubtful trade receivables (10.27) (0.73) (11.00)
Others (9.96) - (9.96)
(83.42) 8.26 (75.16)
Total 565.62 (168.25) 397.37
Opening BalanceRecognised in profit
and LossClosing Balance
Tax effect of items constituting deferred tax
liabilities
Property, Plant and Equipment 622.28 13.38 635.66
Net Gain on Fair Value of Mutual Funds 11.36 2.02 13.38
633.64 15.40 649.04
Tax effect of items constituting deferred tax
assets
Employee Benefits (49.39) (13.80) (63.19)
Provision for doubtful trade receivables (21.10) 10.83 (10.27)
Others (9.97) 0.01 (9.96)
(80.46) (2.96) (83.42)
Total 553.18 12.44 565.62
ParticularsMarch 31, 2018
ParticularsMarch 31, 2017
Particulars As at March 31, 2017As at March 31, 2018
(a) Trade payables to
- Related parties 327.03 69.87
- Others (Refer Note 1 below) 1,415.37 1,173.08
Total 1,742.40 1,242.95
Note:
1) Trade payable for goods & services includes dues of Micro and Small Enterprises Rs. 99.22 lakhs (March 31, 2017 Rs. 63.34 lakhs) (Refer Note 38)
Particulars As at March 31, 2017As at March 31, 2018
(a) Unpaid dividends 430.85 229.43
(b) Deposit from related party 10.00 10.00
(c) Creditors for capital supplies/services 56.45 39.27
(d) Retention Money - 6.08
(e) Due to employees 208.41 196.15
(f) Book Overdraft - 124.88
(g) Others 11.41 6.75
Total 717.12 612.56
Note 19 - Other Current Liabilities
Particulars As at March 31, 2017As at March 31, 2018
(a) Advances received from customers 209.62 170.90
(b) Statutory dues payable (other than
income taxes)
119.11 103.60
Total 328.73 274.50
Note 20 - Revenue from Operations
March 31, 2018 March 31, 2017
a) Revenue from sale of goods (includes excise duty of Rs.225.72 lakhs,
previous year Rs. 1,130.90 lakhs) (refer note (i) and (iv) below) 13,692.40
b) Revenue from rendering of services (refer note (ii) below) 217.83
c) Other operating income (refer note (iii) below) 170.41
14,080.64
Year ended
Total
Particulars
12,360.27
550.85
256.76
13,167.88
Note:

Note 22 - Cost of Materials Consumed
NOTES FORMING PART OF THE FINANCIAL STATEMENTS NOTES FORMING PART OF THE FINANCIAL STATEMENTS
113112
(Rs. in lakhs) (Rs. in lakhs)
(ii) Sale of Services comprises
Machining charges 550.85 217.83
Total - Sale of Services 550.85 217.83
(iii) Other Operating income comprises
Sale of Scrap 57.83 53.19
Service charges 29.22 52.80
Commission 20.08 18.08
Management fee and other charges received from subsidiaries 37.82 33.20
Export Incentive (refer note V below) 111.81
13.14
Total - Other Operating income 256.76 170.41
March 31, 2018 March 31, 2017
Year endedParticulars
(iv) Goods and Service Tax (GST) has been effective from July 1, 2017. Consequently, excise duty, value added tax (VAT),
Central sales tax (CST), Service tax etc, have been replaced with GST. Until June 30, 2017, 'Sale of goods' included the
amount of excise duty recovered on sales. With effect from July 1, 2017, 'Sale of goods' excludes the amount of GST
recovered. Accordingly, revenue from 'Sale of goods' and "Revenue from operations' for the year ended March 31, 2018 are
not comparable with those of the previous year.
(v) Exports incentives represent grants in the nature of licenses under Merchandise Export from India Scheme (MEIS) and
duty drawback. There are no unfulfilled conditions or contingencies attached to these grants.
Note 21 - Other Income
March 31, 2018 March 31, 2017
Year endedParticulars
197.01 223.48
52.60 23.67
14.76 13.42
4.21 25.25
3.81 5.71
- 0.83
114.90 19.89
15.03 36.59
10.94 8.68
13.77 10.78
428.42 372.98
1.39 4.68 (a) Interest income on deposits
(b) Dividend Income
-Dividend income on long-term investments (from subsidiaries)
-Dividend income from current investments - mutual funds
(c) Operating lease rental income
(d) Net Gain on sale of current investments
(e)
(f)
(g) Forex gain (net)
(h)
-For doubtful trade receivables
-For other expenses
(i) Miscellaneous income
Total
Provisions and Liabilities no longer required, written back
Net gain arising on financial assets designated as fair valuethrough profit or loss
Profit on sale of capital assets (net of loss on assets sold /scrapped / written off)
March 31, 2018 March 31, 2017
Year endedParticulars
Opening stock 852.31 911.21
Add: Purchases 3,939.90 4,138.88
4,792.21 5,050.09
Less: Closing stock 892.46 852.31
Cost of materials consumed 3,899.75 4,197.78
Material consumed comprises:
Industrial and Synthetic Diamonds and Cubic Boron Nitride 1545.13 1624.76
Bonding Mixture and Matrix Powder 265.95 294.70
Steel 299.64 296.79
Other items 1789.03 1981.53
Total 3899.75 4197.78
Note 23 - Purchases of Stock-in-trade
March 31, 2018 March 31, 2017
Year endedParticulars
Polishing Films 33.58 153.02
Dressing Sticks 9.40 10.67
Floking Filter System 8.93 10.91
Dressers 9.72 -
Others 123.50 101.07
Total 185.13 275.67
Note 24 - Change in inventories of finished goods, work-in-progress and stock-in-trade
March 31, 2018 March 31, 2017
Year endedParticulars
Opening stock
Work - in - progress 644.95 487.48
Finished goods 130.61 111.60
Stock-in- trade 55.37 92.22
830.93 691.30Closing stock
Work - in - progress 693.05 644.95
Finished goods 55.39 130.61
Stock-in- trade 45.26 55.37
793.70 830.93
Net (increase) / decrease 37.23 (139.63)

Note 25 - Employee Benefits Expense Note 28 - Other Expenses
NOTES FORMING PART OF THE FINANCIAL STATEMENTS
115
NOTES FORMING PART OF THE FINANCIAL STATEMENTS
114
March 31, 2018 March 31, 2017
Year endedParticulars
Note 26 - Finance Cost
Particulars March 31, 2018 March 31, 2017
Year ended
Note (i)
The above excise duty relates to difference between the opening and closing stock of finished goods.
(Rs. in lakhs) (Rs. in lakhs)
2,108.90 1,947.20
179.14 155.32
300.00 260.46
(a) Salaries,wages and bonus
(b) Contribution to provident and other funds
(c) Staff welfare expenses
2588.04 2362.98Total
March 31, 2018 March 31, 2017
Year endedParticulars
5.52 11.86
- 0.34
14.12 -
19.64 12.20
(a) Interest expense
(b) Other borrowing costs
(c) Interest on shortfall in payment of advance tax
Total
March 31, 2018 March 31, 2017
Year endedParticulars
Note 27 - Depreciation and amortisation expense
940.93 896.02
75.20 67.51
(a) Depreciation of Property, Plant and Equipment (Note no. 3)
(b) Amortisation of intangible assets (Note no. 5)
Total 1016.13 963.53
715.05 828.82
82.01 106.69
71.32 79.05
151.87 121.03
36.56 40.49
306.45 319.30
318.42 190.11
16.51 15.76
561.06 600.35
7.22 5.00
8.91 -
134.92 106.26
2.00 2.00
30.36 26.84
- 3.52
23.78 19.11
37.75 21.90
10.62 23.54
8.23 2.39 14.75 8.79
31.35 20.05
(14.51) 2.11
8.75 8.24
1.00 1.00
4.04 2.25
66.69 57.80
177.68 182.05
138.87 188.46
297.21 344.66
384.06 345.97
28.28 32.04
0.11 -
343.10 400.41
3,973.21 4,080.06
Stores and spares consumed
Contract labour
Repairs and maintenance
- Buildings
- Machinery
- Others
Power and Fuel charges
Freight outward and packing charges (net)
Rental charges
Processing Charges
Directors' Sitting Fees
Commission to Non-whole time Independent Directors
Rates and taxes
Contribution to Research Institution (refer note 46)
Donation (refer note 46)
Insurance charges
Selling Commission
Bad Trade receivables written off
Less:- Transferred from Provision
Provision for doubtful trade receivables (refer note 11(a))
Auditors remuneration and out-of-pocket expenses
- As Auditors
- For Taxation matters
- Auditors out-of-pocket expenses
Bank Charges
Service fee
Legal and other professional costs
Advertisement and Sales Promotion expenses
Travelling & Conveyance Expenses
Communication expenses
Loss on sale / disposal of fixed assets (net)
Miscellaneous expenses
Total
Increase / (decrease) of excise duty on inventory (refer note (i)
below)
Expenditure on corporate social responsibility (refer note 46)

Note 29 - Income tax recognised in profit or loss
NOTES FORMING PART OF THE FINANCIAL STATEMENTS NOTES FORMING PART OF THE FINANCIAL STATEMENTS
116
Year ended March 31, 2018 Year ended March 31, 2017
(a) Income Tax Expense
Particulars
(b) Numerical Reconciliation between average effective tax rate and applicable tax rate :
Particulars Amount
Note 31 - Financial Instruments
(Rs. in lakhs) (Rs. in lakhs)
In respect of the current year 590.00 439.10
In respect of the Prior year - (50.74)
590.00 388.36Deferred tax
In respect of the current year (168.25) 12.44
(168.25) 12.44
Total 421.75 400.80
Current tax
Year ended March 31, 2018 Year ended March 31, 2017Particulars
Profit Before tax
Income Tax using the Company's domestic Tax rate of
34.61% (March 31, 2017 - 34.61%)
Effect of income that is exempt from tax
Effect of expenses that are not deductible in determiningtaxable profit
Effect of concessions (Research and development)
Effect of dividend income from foreign subsidiaries
Effect of changes in deferred tax rates
Others
Adjustment recognised in the current year in relation to
current tax of previous years
Income Tax recognised in Statement of Profit and Loss
1570.13
543.39
(6.18)
78.50
(108.44)
(38.67)
-
(17.06)
451.54
(50.74)
400.80
1,651.45
571.54
(13.81)
10.51
(25.31)
(34.09)
(74.89)
(12.19)
421.75
-
421.75
Note
The tax impact for deferred tax purposes has been arrived by applying a tax rate of 29.12% (March 31, 2017 : 34.61%) being the prevailing tax rate applicable for the company for the financial year ending March 31, 2019 under the Income tax Act , 1961.
Note 30 - Business Combinations
The Company had acquired the “Diamond Tool” business from Star Diamond Tools Private Limited at a consideration of Rs. 250 lakhs.
This acquisition was made to enhance the company’s offerings in the field of one of our existing product line stationery dressers and this would also augment our existing manufacturing capability and capacity.
Consideration transferred :-
Tangible Assets (incuding CWIP)Machines and equipmentsInventories
Intangible assetsBrands & Trade marksPatentsGoodwill
Total
18.2890.45
81.0050.0010.27
250.00
(i) The initial accounting for the acquisition of the business was provisionally determined as at the year ended March 31, 2016, pending installation of the tangible assets and registration of the intangible assets. Accordingly, as on March 31, 2016, the Company had classified these assets under the head “Capital Work-in-progress” and the inventories of Rs. 90.45 lakhs were included under current assets for the year ended March 31, 2016. The tangible assets were received by the company in the month of April 2016 and was subsequently installed and commissioned. These tangible assets have been capitalized during the year 2016-17.
(ii) The intangible assets comprising of Brands & Trademarks and Patents. Trademarks have been filed for registration in the name of the company. These intangible assets acquired in the business combination amounting to Rs. 131.00 lakhs have been recognized separately from Goodwill at their fair value at the acquisition date (which is regarded as their cost).
(iii) Goodwill arising on the acquisition of Star Diamond Tools Private Limited amounting to Rs. 10.27 lakhs has been recognized.
Financial Assets
Measured at fair- value through profit and loss
(FVTPL)Investments
Measured at amortized cost
- Trade Receivables
- Cash and cash equivalents
- Other bank balances
- Other Financial Assets
Total Financial Assets
Financial Liabilities
Measured at amortized cost
- Trade payables
- Other Financial Liabilities
Total Financial Liabilities
Particulars March 31, 2018 March 31, 2017
1,798.82 1,071.50 1,798.82 1,071.50
3,382.96 2,872.26 3,382.96 2,872.26
205.22 36.90 205.22 36.90
431.55 230.13 431.55 230.13
99.73 110.36 99.73 110.36
5,918.28 4,321.15 5,918.28 4,321.15
1742.40 1242.95 1,742.40 1,242.95
717.12 612.56 717.12 612.56
2,459.52 1,855.51 2,459.52 1,855.51
Carrying Amount
March 31, 2018 March 31, 2017
Fair Value
31.1 Capital Management
The capital includes issued equity share capital and all other equity reserves attributable to the equity holders. The Company’s objectives when managing capital is to safeguard their ability to continue as a going concern while maximizing the return to shareholders through the optimization of cash and cash equivalents along with investment which is predominantly investment in liquid and short term mutual funds.
31.2 Categories of financial instruments
The carrying value and fair value of financial instruments by categories as of March 31, 2018 and March 31, 2017 were as follows:
117

NOTES FORMING PART OF THE FINANCIAL STATEMENTS NOTES FORMING PART OF THE FINANCIAL STATEMENTS
There have been no transfers among Level 1, Level 2 and Level 3 during the period.
Note 31.3 Financial Risk management objectives and polices
The Company treasury function provides service to the business, co-ordinates access to domestic and international financial markets, monitors and manages the financial risks relating to the operations of the company through internal risk report which analyze exposures by degree and magnitude of risk. These risk include market risk, currency risk, credit risk and liquidity risk.
The Company seeks to minimize the effects of these risks by using policies approved by the board of directors, which provide written principles on interest risk, credit risk and investment of excess liquidity. The Company does not enter into trade financial instruments for speculative purpose.
The Company treasury function reports quarterly to the senior management team that monitors risk and policies implemented to mitigate risk exposures.
31.3.1 Market risk
The company is exposed primarily to the financial risk of change in foreign currency exchange rate. The Company transacts in various foreign currencies. Foreign currencies are recognised at the rate of exchange prevailing at the date of transaction. Company being a net exporter, follows the policy of natural hedging of foreign exchange earnings. Net forex gain is always at positive side.
31.3.1 (a) Foreign currency risk management
The company undertakes transactions denominated in foreign currencies, consequently, the company is exposed to exchange rate fluctuations. The company, being a net exporter, follows the policy of natural hedging of foreign exchange earnings and outflow and hence it does not take any forward covers.
The carrying amounts of the Company's foreign currency (unhedged) denominated monetary assets and monetary liabilities at the end of the reporting period are as follows:
(Rs. in lakhs) (Rs. in lakhs)
The management assessed that fair value of cash and short- term deposits, trade receivables, trade payables, book overdrafts and other current financial assets and liabilities approximate their carrying amounts largely due to the short-term maturities of these instruments.
The fair value of the financial assets and liabilities is included at the amount at which the instrument could be exchanged in a current transaction between willing parties, other than in a forced or liquidation sale.
The following methods and assumptions were used to estimate the fair values:
i) The fair value of the quoted mutual funds is based on price quotations at reporting date. The fair value of unquoted instruments, loans from banks and other financial liabilities, as well as other non-current financial liabilities is estimated by discounting future cash flows using rates currently available for debtor similar terms, credit risk and remaining maturities.
Fair value hierarchy
Level 1 - Quoted prices (unadjusted) in active markets for identical assets or liabilities.
Level 2 - Inputs other than quoted prices included within Level 1 that are observable for the asset or liability, either directly (i.e.as prices) or indirectly (i.e. Derived from prices).
Level 3 - Inputs for the assets or liabilities that are not based on observable market data (unobservable inputs).
The following table presents the fair value measurement hierarchy of financial assets measured at fair value on recurring basis as at March 31, 2018 and March 31, 2017.
1,798.82
Financial assets designated at FVTPL:
As at March 31, 2018
- Investment in mutual funds
As at March 31, 2017 - Investment in mutual funds 1,071.50
Quoted prices in
active markets
(Level 1)
Significant
observable
inputs (Level 2)
Significant
unobservable
inputs (Level 3)
- - 1,798.82
1,071.50
- -
Fair value measurement using
Particulars
6
6
Note Total
The following table presents the assets and liabilities which are measured at amortized cost for which fair values are disclosed as at March 31, 2018 and March 31, 2017.
Quoted prices in active markets
(Level 1)
Significant observable
inputs (Level 2)
Significant unobservable
inputs (Level 3)
Fair value measurement using
Particulars Note Total
11 3,382.96 - - 3,382.9612A 205.22 - - 205.22 12B 431.55 - - 431.55
7 99.73 - - 99.73
17 1,742.40 - - 1,742.4018 717.12 - - 717.12
11 2,872.26 - - 2,872.26
12A 36.90 - - 36.90
12B 230.13 - - 230.13
7 110.36 - - 110.36
17 1,242.95 - - 1,242.95
As at March 31, 2018Financial assets measured at amortized cost: - Trade Receivables - Cash and cash equivalents - Other bank balances - Other Financial Assets
Financial liabilities measured at amortized cost: - Trade payables - Other Financial Liabilities
As at March 31, 2017
Financial assets measured at amortized cost: - Trade Receivables - Cash and cash equivalents - Other bank balances - Other Financial Assets
Financial liabilities measured at amortized cost: - Trade payables - Other Financial Liabilities 18 612.56
118
- - 612.56
(in lakhs)
Foreign Currency INR (in lakhs)
6.44 423.45 1.59 129.53 0.28 25.63
9.05 585.53 3.33 264.10 2.40 217.74
Foreign
lakhs)
4.79 0.80 0.04
6.33 2.95 0.96
Currency (in INR (in lakhs)
314.72 56.47 3.44
405.56 200.55 76.35
- USD - EUR - GBP
Trade and other receivables - USD - EUR - GBP
Creditors against Import of goods, capital itemsand services
March 31, 2018 March 31, 2017
Particulars
The sensitivity of impact on profit or loss of the company to changes in the exchange rates , individual currency wise, is summarized below:-
Currency Sensitivity
USD Sensitivity
INR/USD - Increase by 1%INR/USD - Decrease by 1%
EUR Sensitivity
INR/EUR - Increase by 1%INR/EUR - Decrease by 1%
GBP Sensitivity
INR/GBP - Increase by 1%INR/GBP - Decrease by 1%
0.10%(-0.10%)
0.08%(-0.08%)
0.12%(-0.12%)
0.06%(-0.06%)
0.09%(-0.09%)
0.05%(-0.05%)
March 31, 2018 March 31, 2017
Impact on profit before tax (in %)
119

NOTES FORMING PART OF THE FINANCIAL STATEMENTS NOTES FORMING PART OF THE FINANCIAL STATEMENTS
32.2 Segment Revenues and Results
(Rs. in lakhs) (Rs. in lakhs)
31.3.2 Credit Risk
Credit risk is the risk that counter party will not meet its obligations under a financial instrument or customer contract, leading to a financial loss. The company is exposed to credit risk from its operating activities (primarily trade receivables) and from its financing activities, including deposits with banks and financial institutions, foreign exchange transactions and other financial instruments.
The customers are broadly classified into high risk and medium risk, accordingly credit limit exposure is fixed. The company carries out payment performance review of all customers and based on this analysis, risk category of customers are evaluated annually. Further, the utilization of credit limit is regularly monitored through inbuilt locks in the ERP system.
31.3.3 Liquidity Risk
Liquidity risk is the risk that the company will not be able to meet its financial obligations as they fall due. The company's approach to managing liquidity is to ensure that it will always have sufficient liquidity to meet its liabilities when due, under both normal and stressed conditions, without incurring unacceptable losses or risking damage to the company's business and reputation.
The Company regularly reviews its receivables, inventory and other working capital elements to mitigate any liquidity concerns. Any surplus from the business funds needs is parked in debt mutual funds (liquid / liquid plus) of reputed Asset Management Companies to provide day to day working capital.
Also, the company has unutilized credit limits with bank.
The following table presents the maturity period of all financial liabilities as at March 31, 2018 and March 31, 2017.
Carrying
amount
Less than 1
year1 - 2 years
More than 2
years
As at March 31, 2018
Financial liabilities measured at amortized cost: - Trade payables 17 1,742.40 1,742.40 - - - Other Financial Liabilities 18 717.12 717.12 - -
As at March 31, 2017
Financial liabilities measured at amortized cost: - Trade payables 17 1,242.95 1,242.95 - - - Other Financial Liabilities 18 612.56 612.56 - -
Particulars Note
Contractual cash flows
Note 32 - Segment Disclosure
32.1 Products and services from which reportable segments derive their revenue
The CEO of the Company has been identified as the Chief Operating Decision Maker (CODM) as defined by Ind AS 108, Operating Segments. Operating segments are defined as components of an enterprise for which discrete financial information is available that is evaluated regularly by the CODM, in deciding how to allocate resources and assessing performance.
1) The Company is organised into two main business segments, namely :
a) Super Abrasives and b) Machines, Accessories and Components.
The above segments have been identified taking into account the organisation structure as well as the differing risks and returns of these segments. The Company has identified business segments as its primary segments. The reportable business segments are in line with the segment wise information which is being presented to the CODM.
2) Segment Assets and Segment Liabilities of the Company's business have not been identified to any reportable segment, as these are used interchangeably between segments.
3) Segment Revenue and expenses have been identified to segments on the basis of their relationships to the operating activities of the segment. Revenue and expenses, which relate to the enterprise as a whole and are not allocable to segments on a reasonable basis have been included under "Other un-allocable Expenditure" .
120
Year ended March 31, 2018 Year ended March 31, 2017
10,229.18 10,414.53
2,681.94 3,495.70
12,911.12 13,910.23
-
12,911.12 13,910.23
1,975.47 1,822.00
217.32 451.64
2,192.79 2,273.64
19.64 12.20
521.70 691.31
421.75 400.80
1,229.70 1,169.33
Particulars
1. Segment Revenue
a) Super Abrasives
b) Machines, Accessories and Components
Total
Less:- Inter Segment Revenue
Revenues / Income From Operations
2. Segment Results
a) Super Abrasives
Total
Less: (i) Finance costs
(iii) Tax expense
b) Machines, Accessories and Components
(ii) Other un-allocable Expenditure net of un-allocable
Profit for the year
income of Rs. 685.18 lakhs (P.Y. Rs. 543.39 lakhs)
-
32.3 Revenue by Geographical market
India 9,053.91 10,890.81
Outside India 3,857.21 3,019.42
Total 12,911.12 13,910.23
Year ended March 31, 2018 Year ended March 31, 2017Particulars
32.4 Non current and Non Financial assets by Geographical market
Year ended March 31, 2018 Year ended March 31, 2017Particulars
India 5,645.94 6,122.50
Outside India - -
Total 5,645.94 6,122.50
32.5 Information about major customers
No single customer represents 10% or more of the company's total revenue for the year ended March 31, 2018 and March 31, 2017.
Note 33 - Leases(a) The Company is obligated under cancelable operating leases towards residential accommodation, which are renewable at
the option of both the lessor and the lessee. Total rental expense debited to the Statement of Profit and Loss under cancelable operating leases amounts to Rs. 16.51 lakhs (March 31, 2017: Rs 15.60 lakhs).
There are no sub-lease payments received/receivable recognised in the statement of profit and loss. Also, there are no contingent rents payable and there are no restrictions imposed by lease agreements such as those concerning dividends and additional debt.
121

NOTES FORMING PART OF THE FINANCIAL STATEMENTS
123
NOTES FORMING PART OF THE FINANCIAL STATEMENTS
(b) The Company has leased out a portion of its factory building to a related party. Total rental income credited to the Statement of Profit and Loss amounts to Rs. 14.76 lakhs (March 31, 2017 : Rs. 13.42 lakhs)
The lease agreement is for a period of 12 months and can be terminated by either party by giving one month notice.
Details of the above referred lease are as given below:
(Rs. in lakhs) (Rs. in lakhs)
Particulars Amount
Gross carrying amount 1,590.09 Less: Accumulated Depreciation 471.19
Net carrying amount 1,118.90
The depreciation recognized in respect of the factory building for the year is Rs. 53.79 lakhs.
There are no contingent rents receivable.
Note 34 - Employee BenefitsDefined Contribution Plans
The Company operates defined contribution benefit plans for all qualifying employees of the company.
Superannuation fund, Providend fund and pension fund are defined contribution plans towards which the company makes contribution at predetermined rates to the Superannuation Trust funded with Life Insurance Corporation Of India and the Regional Provident Fund Commissioner respectively. The same is debited to the Statement of Profit and Loss accounts based on the amount of contribution required to be made and services rendered by the employees. The Company also makes contributions to state plans namely Employee’s State Insurance Fund and Employee’s Pension Scheme 1995. The Company has no further payment obligation once the contributions have been paid.
Defined Benefit Plans
The Company is having defined benefit plan namely gratuity for all qualifying employees of the company.
The liability for gratuity to employees as at the Balance sheet date is determined on the basis of actuarial valuation using Projected Unit Credit method. The amount is funded to a Gratuity fund administered by the trustees and managed by Life Insurance Corporation of India.
Remeasurement, comprising actuarial gain and losses and the return on plan assets (excluding net interest), is reflected immediately in the balance sheet with a charge or credit recognised in other comprehensive income in the period in which they occur. Remeasurement recognised in other comprehensive income is reflected in retained earnings and is not reclassified to profit or loss.
The plans typically expose the company to actuarial risks such as investment risk, interest rate risk, longevity risk and salary risk.
122
Investment risk
Interest rate risk
Longevity risk
Salary risk
The present value of the defined benefit plan liability is calculated using the discount rate which is determined by reference to market yield at the end of the reporting period on government bonds. For other defined benefit plans, the discount rate is determined by reference to market yields at the end of the reporting period. If the return on plan asset is below this rate, it will create a plan deficit.
A decrease in the bond interest rate will increase the plan liability: however, this will be partially offset by an increase in the return on the plan's debt investments.
The present value of the defined benefit plan liability is calculated by reference to the best estimate of the mortality of plan participants both during and after their employment. An increase in the life expectance of the plan participants will increase the plan's liability.
The present value of the defined benefit plan liability is calculated by reference to the future salaries of plan participants. As such, an increase in the salary of the plan participants will increase the plan's liability.
A. Gratuity
The following tables set out the funded status of the gratuity plans and the amounts recognised in the Company's financial statements as at March 31, 2018 and March 31, 2017:
(a) Change in defined benefit obligation (DBO)
Particulars As at March 31, 2018 As at March 31, 2017
Defined benefit obligation at beginning of period 377.88 335.46 Service cost a) Current service cost 32.93 30.01 b) Past service cost - - Interest expenses 25.63 25.33 Benefits Paid (23.37) (37.74)Remeasurements: a) Effect of changes in demographic assumptions - - b) Effect of change in financial assumptions (11.36) 53.74 c) Effect of experience adjustments 13.19 (28.92)
Defined benefit obligation at end of period 414.90 377.88
(b) Change in fair value of plan assets
Particulars As at March 31, 2018 As at March 31, 2017Fair value of plan assets at beginning of period 244.14 275.84 Interest Income 25.74 20.80 Contributions 206.69 29.05 Benefits Paid (23.37) (37.74)Remeasurements:
a) Return on plan assets (excluding interest income) 38.06 (43.81)
Fair value of plan assets at end of period 491.26 244.14
(c) Amounts recognized in the Balance Sheet
Particulars As at March 31, 2018 As at March 31, 2017Defined benefit obligation 414.90 377.88 Fair value of plan assets (491.26) (244.14)Funded status (76.36) 133.74 Effect of asset ceiling - -
Net defined benefit liability / (asset)* (76.36) 133.74
*Included under prepayments in Note 8 - "Other current assets"
(d) Amounts recognized in the Statement of Profit and Loss
For the year ended March 31,
2018
For the year ended March 31,
2017
32.93 30.01 - -
(0.10) 4.53
32.83 34.54
Particulars
Service CostNet interest cost a) Interest expense on DBO
Net Gratuity Cost in the Statement of Profit and Loss

(f) Composition of plan assets
Particulars
Fund with an Insurance Company 244.14
(g) Significant actuarial assumptions
Particulars
Discount rate 7.50% 7.00%Salary escalation rate 7.00% 7.00%Attrition Rate 6.00% 6.00%Retirement Age 58 years 58 years
Pre-retirement mortality
Indian Assured LivesMortality
(2006-08) Ultimate
Indian Assured LivesMortality
(2006-08) Ultimate
Disability Nil Nil
NOTES FORMING PART OF THE FINANCIAL STATEMENTS NOTES FORMING PART OF THE FINANCIAL STATEMENTS
The weighted average duration of the defined benefit obligation is 10 years (March 31, 2017: 10 years)
The Company expects to make a contribution of Rs. 50 lakhs (as at March 31, 2017: Rs.29.69 lakhs) to the defined benefit plans during the next financial year. The employee benefit obligations(net) have been included in current liabilities based on the expected contributions.
B. Compensated Absences
(Rs. in lakhs) (Rs. in lakhs)
(e) Amounts recognized in the Other Comprehensive Income
Particulars
For the year ended
March 31, 2018
For the year ended
March 31, 2017
For the year ended
March 31, 2018
For the year ended
March 31, 2017
Remeasurement of the net defined benefit liability/(asset)
Actuarial (gains) / losses 24.81 (Return)/Loss on plan assets excluding amounts included
in the net interest on the defined benefit liability / (asset) (43.81)
Net Cost in Other Comprehensive Income
For the year ended
March 31, 2018
For the year ended
March 31, 2017
491.26
1.83 38.06
(36.23) 68.62
The Company assesses these assumptions with its projected long-term plans of growth and prevalent industry standards. The discount rate is based on the government securities yield.
(h) Sensitivity analysis - DBO end of Period
Particulars As at March 31, 2018 As at March 31, 2017
Discount rate +100 basis points 393.38 356.91 Discount rate -100 basis points 439.17 401.51 Salary Increase Rate +1% 437.02 399.42 Salary Increase Rate -1% 394.94 358.40 Attrition Rate +1% 415.40 377.71 Attrition Rate -1% 414.32 378.04
Significant actuarial assumptions for the determination of the defined obligation are discount rate, expected salary increase and mortality. The sensitivity analyses above have been determined based on reasonably possible changes of the respective assumptions occurring at the end of the reporting period, while holding all other assumptions constant.
The sensitivity analysis presented above may not be representative of the actual changes in the defined benefit obligation as it is unlikely that the change in assumptions would occur in isolation of one another as some of the assumptions may be correlated.
Furthermore, in presenting the above sensitivity analysis, the present value of the defined benefit obligation has been calculated using the projected unit credit method at the end of the reporting period, which is the same as that applied in calculating the defined benefit obligation liability recognised in the balance sheet.
124
(i) Expected cash flows for following year
Particulars As at March 31, 2018 As at March 31, 2017
Expected employer contributions /Addl. Provision next year 89.79 50.26Expected total benefit paymentsYear 1 93.70 37.34Year 2 55.51 76.69Year 3 26.43 46.64Year 4 52.51 22.56Year 5 23.40 42.76Next 5 years 114.33 97.22
As at March 31, 2018 As at March 31, 2017
17.34 57.13
94.93 91.58
(a) Charge to Statement of Profit and Loss and Liability
Particulars
Charge / (credit) in the Statement of Profit and Loss
Liability as at the year end - Short- term (Refer Note 15) - Long- term (Refer Note 15) 91.21 91.02
186.14 182.60
(b) Actuarial Assumptions
Particulars As at March 31, 2018 As at March 31, 2017
Discount Rate 7.50% p.a. 7.00% p.a. Salary Escalation Rate 7.00% p.a. 7.00% p.a.
For the year ended
March 31, 2018
For the year ended
March 31, 2017
55.52 60.17 29.36 28.70 18.53 9.56
61.43 31.91
C. Defined Contribution Plans
Particulars
Employers' Contribution to Provident Fund *Employers’ Contribution to Superannuation Fund *Employers’ Contribution to Employee’sState Insurance #
Employers’ Contribution to Employee’s PensionScheme 1995 *
* Included in Contribution to provident and other funds# Included in staff welfare expenses
Note 35 - Related Party Transactions
1) List of Related parties:i) Party with whom control exists -Subsidiaries (a) Wendt Grinding Technologies Ltd, Thailand (b) Wendt Middle East FZE
125

NOTES FORMING PART OF THE FINANCIAL STATEMENTS NOTES FORMING PART OF THE FINANCIAL STATEMENTS
ii) Venturers and its subsidiaries , to the joint venture with whom transactions have taken place during the year
(a) Carborundum Universal Limited (CUMI)(1) Cumi America(2) Cumi (Australia) Pty Ltd(3) Cumi Abrasives & Ceramics Company Ltd(4) Net Access India Ltd
(b) Wendt GmbH Germany
iii) Company in which KMP / Director is a director(a) Ace Designers Ltd(b) Pragati Transmission P Ltd(c) Tespa Tools Pvt Ltd(d) Sterling Abrasives Limited
iv) Key Management PersonnelMr.Rajesh Khanna, Chief Executive
v) Relatives of Key Management PersonnelMrs. Preethi Khanna - Wife of Mr. Rajesh Khanna
2) Transaction with related parties during the year ended March 31, 2018 and March 31, 2017 are as follows:
126 127
(Rs. in lakhs) (Rs. in lakhs)
3) The details of amounts due to or due from related parties as at March 31, 2018 and March 31, 2017 are as follows:
Wendt GmbH Germany - - - 18.08 - - - 20.08 18.08
Receipt of Dividend
Wendt Middle East FZE 53.20 -
Wendt Grinding Technologies Ltd Thailand 170.28 -
Payment of Service Fee and Commission
Carborundum Universal Limited (CUMI) - -
Wendt Middle East FZE 4.39 -
Payment of Dividend
Carborundum Universal Limited (CUMI) - -
Wendt GmbH Germany * - -
Management fee, Service charges,
Commission, Rent and Accounting charges
Carborundum Universal Limited (CUMI) - -
Wendt Grinding Technologies Ltd Thailand 20.64 -
Wendt Middle East FZE 8.92 -
Reimbursement of Expenses - Paid
Carborundum Universal Limited (CUMI) - -
Reimbursement of Expenses - Received
Wendt GmbH Germany - -
Carborundum Universal Limited (CUMI) - -
Wendt Grinding Technologies Ltd Thailand
41.56
155.45
-
-
-
-
-
29.58
8.24
-
-
-
3.58 1.30
-
-
209.59
-
199.34
199.34
13.42
-
-
57.75
0.25
100.80
-
-
208.54
-
199.34
199.34
20.08
14.76
-
-
67.11
-
13.38
- -
-
-
-
-
-
-
-
-
-
-
-
-
-
-
-
-
-
-
-
-
-
-
-
-
-
-
-
-
-
-
-
-
-
-
-
-
-
- -
41.56 53.20
155.45 170.28
208.54 209.59
- 4.39
199.34 199.34
199.34 199.34
14.76 13.42
29.58 20.64
8.24 8.92
67.11 57.75
- 0.25
13.38 100.80
3.58 1.30
Particulars
31.03.18 31.03.17 31.03.18 31.03.17 31.03.18 31.03.17 31.03.18 31.03.17 31.03.18 31.03.17
Amount due from
Wendt GmbH Germany - - 67.10 39.49 - - - - 67.10 39.49
Carborundum Universal Limited (CUMI) - - 40.33 46.48 - - - - 40.33 46.48
Cumi America - - 144.91 124.48 - - - - 144.91 124.48
CUMI (Australia) Pty Ltd - - - 0.24 - - - - - 0.24
Cumi Abrasives & Ceramics Company Ltd - - 142.82 34.49 - - - - 142.82 34.49
Wendt Grinding Technologies Ltd Thailand 56.62 40.56 - - - - - - 56.62 40.56
Wendt Middle East FZE - 20.53 - - - - - - - 20.53
Amount due to
Wendt GmbH Germany - - 67.19 31.72 - - - - 67.19 31.72
Wendt Grinding Technologies Ltd Thailand 3.02 1.34 - - - - - - 3.02 1.34
Wendt Middle East FZE 74.99 75.55 - - - - - - 74.99 75.55
Carborundum Universal Limited (CUMI) - - 279.32 34.68 - - - - 279.32 34.68
Cumi America - - 0.54 - - - - - 0.54 -
Cumi Abrasives & Ceramics Company Ltd - - 0.73 - - - - - 0.73 -
Rajesh Khanna - - - - - - 0.65 - 0.65 -
Preethi Khanna - - - - - - 0.64 - 0.64 -
Sterling Abrasives Limited - - 1.19 0.91 - - - - 1.19 0.91
Net Access India Limited - - 3.10 1.22 - - - - 3.10 1.22
SubsidiariesJoint venturers & its
subsidiaries
Director'sTotal
Key Management
Personnel and their
relatives Company
Carborundum Universal Limited (CUMI) - -
Wendt Middle East FZE - -
Other Purchases
Wendt Gmbh, Germany - -
Carborundum Universal Limited (CUMI) - -
Wendt Grinding Technologies Ltd Thailand 3.99 -
Cumi Abrasives & Ceramics Company Ltd - -
Wendt Middle East FZE - -
Tespa Tools Pvt Ltd - -
Sterling Abrasives Limited - -
Net Access India Limited - -
Sale of Goods and Services
Wendt GmbH Germany - -
Carborundum Universal Limited (CUMI) - -
Cumi America - -
CUMI (Australia) Pty Ltd - -
Cumi Abrasives & Ceramics Company Ltd - -
Wendt Middle East FZE 190.11 -
Ace Designers Ltd - -
-
2.27
-
-
14.86
-
3.00
-
-
-
-
-
-
-
-
209.41
-
-
-
425.86
95.47
-
0.07
-
-
9.20
11.00
381.08
186.61
396.65
6.70
41.04
-
-
-
0.70
-
270.57
81.13
-
0.56
-
-
9.87
9.73
261.81
205.05
353.99
0.73
183.67
-
-
-
-
-
-
-
-
-
-
-
0.08
-
-
-
-
-
-
-
2.27
-
-
-
-
-
-
-
0.60
-
-
-
-
-
-
-
0.22
-
-
-
-
-
-
-
-
-
-
-
-
-
-
-
-
-
0.70 -
2.27 -
270.57 425.86
81.13 95.47
14.86 3.99
0.56 0.07
3.00 -
0.08 0.60
9.87 9.20
9.73 11.00
261.81 381.08
205.05 186.61
353.99 396.65
0.73 6.70
183.67 41.04
Wendt Grinding Technologies Ltd Thailand 229.40 - 282.47 - - - 282.47 229.40
209.41 190.11
2.27 0.22
Particulars
Purchase of Capital Goods
Wendt GmbH Germany - -- 2.29 - - - 2.29
SubsidiariesJoint venturers &
its subsidiaries
Director's Key Management Personnel and their
relativesTotal
Company
17-1816-17 16-1717-18 16-17 17-18 16-17 17-18 17-18 16-17
Pragati Transmission P Ltd - -
Payment of Rent
Rajesh Khanna - 7.80
Preethi Khanna - 7.80
-
-
-
-
-
-
-
-
-
-
-
-
0.38
-
-
-
8.26
8.25
- 0.38
8.26 7.80
8.25 7.80

NOTES FORMING PART OF THE FINANCIAL STATEMENTS NOTES FORMING PART OF THE FINANCIAL STATEMENTS
128
4) The details of compensation to key management personnel are as follows:
Note 36 - Earning per share (EPS)
Note 38 - Disclosures required under Section 22 of the Micro, Small and MediumEnterprises Development Act, 2006
Note 39 - Value of imports on CIF basis:
(Rs. in lakhs) (Rs. in lakhs)
17-18 16-17
Short term benefits 97.45 89.72
Post-Employment Benefits 12.80 11.33
Other benefits 15.36 15.36
Particulars
a) The related party relationships are as identified by the Company, on the basis of information available with the Company and relied upon by the auditors.
b) No amounts in respect of related parties have been written off / back other than the amount included above during the year.
c) Key managerial personnel do not exercise significant influence over the gratuity and superannuation trust of the company.
* Amount for both the years lying in unclaimed / unpaid dividend account
Particulars March 31, 2018 March 31, 2017
(a) Profit for the year 1,229.70 1,169.33
b) Weighted average number of equity shares 2,000,000 2,000,000
c) Nominal value of shares (in rupees) 10 10
Earnings per share (in rupees) -
Basic and diluted 61.49 58.47
Note 37 - Contingent Liability and commitments to the extent not provided for:
37.1 Contingent Liabilities
Particulars March 31, 2018 March 31, 2017
a) Claims against the Company not acknowledged as debt: Disputed income tax demands under appeal.
- 59.32
37.2 Commitments
Particulars March 31, 2018 March 31, 2017
a) Estimated amount of contracts remaining to be executed on capital account (in respect of tangible assets) and not provided for (net of advances Rs. Nil lakhs, March 31, 2017: Rs.8.31 lakhs)
341.51
-b) Other Commitments
368.40
-
37.3 The Company has a working capital limit with State Bank of India, secured by hypothecation of stock and book debts and collateral charge on all fixed assets other than land and building.
Particulars March 31, 2018 March 31, 2017
99.22 63.34
- -
- -
- -
- -
- -
(i) Principal amount remaining unpaid to any supplier as at the end of each accounting year
(ii) Interest due thereon remaining unpaid to any supplier as at the end of each accounting year
(iii) The amount of interest paid by the buyer in terms of section 16 of the Micro, Small and Medium Enterprises Development Act, 2006, along with the amounts of the payment made to the supplier beyond the appointed day during each accounting year
(iv)The amount of interest due and payable for the period of delay in making payment (which have been paid but beyond the appointed day during the year) but without adding the interest specified under the Micro, Small and Medium Enterprises Development Act, 2006;
(v) The amount of interest accrued and remaining unpaid at the end of each accounting year
(vi)The amount of further interest remaining due and payable even in the succeeding years, until such date when the interest dues above are actually paid to the small enterprise, for the purpose of disallowance of a deductible expenditure under Section 23 of the Micro, Small and Medium Enterprises Development Act, 2006.
Dues to Micro and Small Enterprises have been determined to the extent such parties have been identified on the basis of information collected by the Management. This has been relied upon by the auditors.
Particulars March 31, 2018 March 31, 2017
Raw Materials 2,298.21 2,333.73 Traded goods 141.73 199.91 Stores and Spare parts 116.96 106.03
Capital Goods 123.60 243.76
Note 40 - Expenditure in Foreign Currency
Particulars March 31, 2018 March 31, 2017
Technical consultancy fee 50.15 46.08
Travel 76.34 50.32
Others 15.35 45.09
Note 41 - Details of consumption of imported and indigenous items
Particulars March 31, 2018 March 31, 2017
ImportedRaw Material 2,147.74 2,451.90 Stores and Spare parts 70.28 115.35 IndigenousRaw Material 1,752.01 1,745.88 Stores and Spare parts 644.77 713.47
129

NOTES FORMING PART OF THE FINANCIAL STATEMENTS
Note 42 - Earnings in Foreign exchange :
Research and Development expenditure incurred during the year aggregates to Rs. 227.18 lakhs (Previous year Rs. 243.25 lakhs) as detailed below:
131
Note 43 - Research and Development Expenditure
Note 45 - Dislosure on Specified Bank Notes (SBN)During the year ended March 31, 2017, the Company had specified bank notes or other denomination note as defined in the MCA notification G.S.R. 308(E) dated March 31, 2017. The details of Specified Bank Notes (SBN) held and transacted during the period from November 8, 2016 to December 30, 2016, the denomination wise SBNs and other notes as per the notification is given below:
130
(Rs. in lakhs)
(in Rs.)
(Rs. in lakhs)
Particulars March 31, 2018 March 31, 2017
FOB Value of goods exported 3805.97 3019.42Others 254.90 301.58
Particulars March 31, 2018 March 31, 2017
Revenue expenditure (refer note below) 163.33 201.74Capital expenditure (including capital work in progress) 63.85 41.51
TOTAL 227.18 243.25
Notes:-
I) Revenue expenditure shown above includes Depreciation on R&D assets of Rs. 49.33 lakhs (Previous year Rs.46.96 lakhs), Consultancy Services of Rs. 12.78 lakhs (Previous year Rs. 30.78 lakhs), Consultancy travel expenditure of Rs. 3.51 lakhs (Previous year Rs. 4.17 lakhs) & Contract manpower of Rs. NIL lakhs (Previous year Rs. 0.16 lakhs).
Note 44 - Previous years's figures have been regrouped / reclassified to conform to the current year's presentation for the purpose of comparability
Other denomination notes
Particulars SBNs Total
Closing balance in hand as on November 8, 2016 81,000 6,746 87,746
(+) Permitted receipts - 404,048 404,048
(-) Permitted payments 339,458 339,458
(-) Amount deposited in Bank 81,000 - 81,000
Closing cash in hand as on December 30, 2016 - 71,336 71,336
Note 46 - Corporate Social Responsibiltiy(a) Gross amount required to be spent by the company during the year :- Rs. 32.36 lakhs (Previous Year Rs. 32.34 lakhs)(b) Amount spent by the company during the year on :- Rs. 32.36 lakhs (Previous Year Rs. 32.34 lakhs)
Yet to be paid in cash Particulars In Cash Total
- - -
26.01 6.35 32.36
(i) Construction / acquisition of any asset
(ii) On purposes other than (i) above
- in 2017-18 - in 2016-17 28.06 4.28 32.34
Note 47 - Approval of financial statementsThe financial statements were approved for issue by the board of directors on April 25, 2018.
Statement of Holding Company's Interest in Subsidiary Company
For and on behalf of the Board of Directors
BengaluruApril 25, 2018
AKANKSHA BIJAWATCompany Secretary
MUKESH KUMAR HAMIRWASIAChief Financial Officer
M M MURUGAPPAN SHRINIVAS G SHIRGURKARChairman Director
K SRINIVASANDirector
1 Name of the Company Wendt GrindingTechnologies Ltd
Wendt Middle East FZE
2 The Financial year of the Subsidiary ended on 31st March 2018 31st March 2018
3
a
Face Value Paid up value Face Value Paid up value
ii) Face value and paid up value per share Thai Baht 10 - Thai Baht 2.50 AED 150,000 AED 150,000
iii) Interest of Wendt India Ltd 100% 100%
b
ii) Face value and paid up value per share ---- ----
iii) Interest of Wendt India Ltd ---- ----
Rs in lakhs Rs in lakhs
4
b) For the previous financial years of the Subsidiary since it became a subsidiary of Wendt India Ltd
1208.00
1767.77
ii) Dealt with in the accounts of Wendt India Ltd, by way of Dividends on the shares held in the subsidiary
a) For the Subsidiary 's Financial year ended 31 st March, 2018
155.45
The Net aggregate profit/loss of subsidiary Company sofar as it concerns the holding Company
i) Not dealt with in the accounts of Wendt India Ltd
a) For the Subsidiary 's Financial year ended 31st March, 2018 *
295.86
161.15
41.56
271.41
7.04
b) For the previous financial years of the Subsidiary since it became a subsidiary of Wendt India Ltd
i) Number of ordinary shares held by Wendt India Ltd in the Subsidiary Company on the above date
1,02,99,993 8
i) Number of Preference shares held by Wendt India Ltd in the Subsidiary Company on the above date
--- ---
* Computed based on the exchange rates as on 31st March 2018 (Thai Baht Rs. 2.094 and AED Rs. 17.709)
(Rs. in lakhs)
For and on behalf of the Board of Directors
Bengaluru BengaluruApril 25, 2018 April 25, 2018
AKANKSHA BIJAWATCompany Secretary
MUKESH KUMAR HAMIRWASIAChief Financial Officer
For Price Waterhouse Chartered Accountants LLP
Firm Registration Number : 012754N/N500016 M M MURUGAPPAN
Chairman SHRINIVAS G SHIRGURKARDirector
K SRINIVASANDirector
MOHAN DANIVAS S APartnerMembership Number : 209136

132 133
Consolidated
Financial
Statements
This Page has been
Intentionally
Left blank

INDEPENDENT AUDITORS' REPORT
TO THE MEMBERS OF WENDT (INDIA) LIMITED.
Report on the Consolidated Indian Accounting Standards (Ind AS) Financial Statements
1. We have audited the accompanying consolidated Ind AS financial statements of Wendt (India) Limited (”hereinafter referred to as the Holding Company”) and its subsidiaries (the Holding Company and its subsidiaries together referred to as “the Group”) (refer Notes 1 and 2.3 to the attached consolidated Ind AS financial statements), comprising of the Consolidated Balance Sheet as at March 31, 2018, the consolidated Statement of Profit and Loss (including Other Comprehensive Income), the consolidated Cash Flow Statement for the year then ended and the Statement of Changes in Equity for the year ended and a summary of significant accounting policies and other explanatory information prepared based on the relevant records (hereinafter referred to as “the Consolidated Ind AS Financial Statements “)
Management’s Responsibility for the Consolidated Ind AS Financial Statements
2. The Holding Company's Board of Directors is responsible for the preparation of these consolidated Ind AS financial statements in terms of the requirements of the Companies Act , 2013 (hereinafter referred to as the “Act”) that give a true and fair view of the consolidated financial position, consolidated financial performance, consolidated cash flows and changes in equity of the Group in accordance with accounting principles generally accepted in India including the Indian Accounting Standards specified in the Companies (Indian Accounting Standards)Rules, 2015 (as amended) under Section 133 of the Act. The Holding Company's Board of Directors is also responsible for ensuring accuracy of records including financial information considered necessary for the preparation of consolidated Ind AS financial statements. The respective Board of Directors of the Companies included in the Group are responsible for maintenance of adequate accounting records in accordance with the provisions of the Act for safeguarding the assets of the Group and for preventing and detecting frauds and other irregularities; the selection and application of appropriate accounting policies; making judgements and estimates that are reasonable and prudent; and the design, implementation and maintenance of adequate internal financial controls that were operating effectively for ensuring the accuracy and completeness of the accounting records, relevant to the preparation and presentation of the consolidated Ind AS financial statements that give a true and fair view and are free from material misstatement, whether due to fraud or error, which has been used for the purpose of preparation of the consolidated Ind AS financial statements by the Directors of the Holding Company, as aforesaid.
Auditors' Responsibility
3. Our responsibility is to express an opinion on these consolidated Ind AS financial statements based on our audit. While conducting the audit, we have taken into account the provisions of the Act and the Rules made thereunder including the accounting standards and matters which are required to be included in the audit report.
4. We conducted our audit of the consolidated Ind AS financial statements in accordance with the Standards on Auditing specified under Section 143(10) of the Act and other applicable authoritative pronouncements issued by the Institute of Chartered Accountants of India. Those standards and pronouncements require that we comply with ethical requirements and plan and perform the audit to obtain reasonable assurance about whether the consolidated Ind AS financial statements are free from material misstatement.
5. An audit involves performing procedures to obtain audit evidence about the amounts and disclosures in the consolidated Ind AS financial statements .The procedures selected depend on the auditors' judgment, including the assessment of the risks of material misstatement of the consolidated Ind AS financial statements, whether due to fraud or error. In making those risk assessments, the auditor considers internal financial control relevant to the Holding Company's preparation of the consolidated Ind AS financial statements that give a true and fair view, in order to design audit procedures that are appropriate in the circumstances. An audit also includes evaluating the appropriateness of the accounting policies used and the reasonableness of the accounting estimates made by the Holding Company's Board of Directors, as well as evaluating the overall presentation of the consolidated Ind AS financial statements.
6. We believe that the audit evidence obtained by us and the audit evidence obtained by the other auditors in terms
134 135
of their reports referred to in paragraph 8 of the Other Matters paragraph below, is sufficient and appropriate to provide a basis for our audit opinion on the consolidated Ind AS financial statements.
Opinion
7. In our opinion and to the best of our information and according to the explanations given to us, the aforesaid consolidated Ind AS financial statements give the information required by the Act in the manner so required and give a true and fair view in conformity with the accounting principles generally accepted in India of the consolidated state of affairs of the Group as at March 31, 2018, and their consolidated total comprehensive income (comprising of consolidated profit and consolidated other comprehensive income), their consolidated cash flows and consolidated changes in equity for the year ended on that date.
Other Matter
8. We did not audit the financial statements / financial information of two subsidiaries whose financial statements / financial information reflect total assets of Rs.2,010 Lakhs and net assets of Rs.1,677 Lakhs as at March 31, 2018, total revenue of Rs.2,298 Lakhs, total comprehensive income (comprising of profit and other comprehensive income) of Rs.290 Lakhs and net cash flows amounting to Rs.130 Lakhs for the year ended on that date, as considered in the consolidated Ind AS financial statements. These financial statements/financial information have been audited by other auditors whose reports have been furnished to us by the Management, and our opinion on the consolidated Ind AS financial statements insofar as it relates to the amounts and disclosures included in respect of these subsidiaries and our report in terms of sub section (3) 0f Section 143 of the Act insofar as it relates to the aforesaid subsidiaries, is based solely on the reports of the other auditors.
Our opinion on the consolidated Ind AS financial statements and our report on Other Legal and Regulatory Requirements below, is not modified in respect of the above matter with respect to our reliance on the work done and the reports of the other auditors.
9. The consolidated Ind AS financial statements of the Company for the year ended March 31, 2017, were audited by another firm of chartered accountants under the Companies Act , 2013 who, vide their report dated April 24, 2017, expressed an unmodified opinion on those consolidated Ind AS financial statements. Our opinion is not qualified in respect of this matter.
Report on other Legal and Regulatory Requirements
10. As required by Section 143(3) of the Act, we report, to the extent applicable, that :
(a) We have sought and obtained all the information and explanations which to the best of our knowledge and belief were necessary for the purposes of our audit of the aforesaid consolidated Ind AS financial statements.
(b) In our opinion, proper books of account as required by law maintained by the Holding Company including relevant records relating to preparation of the aforesaid consolidated Ind AS financial statements have been kept so far as it appears from our examination of those books and records of the Holding Company and the reports of the other auditors.
(c) The Consolidated Balance Sheet, the Consolidated Statement of Profit and Loss (including other comprehensive Income), Consolidated Cash Flow Statement and the Consolidated Statement of changes in Equity dealt with by this Report are in agreement with the relevant books of account maintained by the Holding Company including relevant records relating to the preparation of the consolidated Ind AS financial statements.
(d) In our opinion, the aforesaid consolidated Ind AS financial statements comply with the Indian Accounting Standards specified under Section 133 of the Act.
(e) On the basis of the written representations received from the directors of the Holding Company as on March 31, 2018 taken on record by the Board Directors of the Holding Company, none of the directors of the Holding Company is disqualified as on March 31, 2018 from being appointed as a director in terms of Section 164(2) of the Act.
(f) With respect to the adequacy of the internal financial controls with reference to consolidated Ind AS financial statements of the Holding Company and the operating effectiveness of such controls, refer to our separate Report in Annexure A.

136
(g) With respect to the other matters to be included in the Auditors' Report in accordance with Rule 11 of the Companies (Audit and Auditors) Rules, 2014, in our opinion and to the best of our information and according to the explanations given to us:
i) The consolidated Ind AS financial statements disclose the impact, if any, of pending litigations as at March 31, 2018 on the consolidated financial position of the Group – Refer Note 36 to the consolidated Ind AS financial statements.
ii) The Group did not have any long-term contracts including derivative contracts as at March 31, 2018.
iii) There has been no delay in transferring amounts, required to be transferred, to the Investor Education and Protection Fund by the Holding Company and its subsidiary companies incorporated in India during the year ended March 31, 2018.
iv) The reporting on disclosures relating to Specified Bank Notes is not applicable to the Group for the year ended March 31, 2018
Report on the Internal Financial Controls under Clause (i) of Sub-section 3 of Section 143 of the Act
1. In conjunction with our audit of the consolidated financial statements of the Company as of and for the year ended March 31, 2018, we have audited the internal financial controls over financial reporting of Wendt (India) Limited (hereinafter referred to as “the Holding Company”) as of that date. Reporting under clause (i) of sub section 3 of Section 143 of the Act in respect of the adequacy of the internal financial controls over financial reporting is not applicable to two subsidiaries namely, Wendt Grinding Technologies Limited and Wendt Middle East FZE, pursuant to MCA notification GSR 583 (E) dated June 13, 2017.
Management's Responsibility for Internal Financial Controls
2. The Board of Directors of the Holding Company which is incorporated in India, are responsible for establishing and maintaining internal financial controls based on internal control over financial reporting criteria established by the Company considering the essential components of internal control stated in the Guidance Note on Audit of Internal financial Controls Over Financial Reporting issued by the Institute of Chartered Accountants of India (ICAI). These responsibilities include the design, implementation and maintenance of adequate internal financial controls that were operating effectively for ensuring the orderly and efficient conduct of its business, including adherence to the respective company's policies, the safeguarding of its assets, the prevention and detection of frauds and errors, the accuracy and completeness of the accounting records, and the timely preparation of reliable financial information, as required under the Act.
Auditor's Responsibility
3. Our responsibility is to express an opinion on the Company's internal financial controls over financial reporting based on our audit. We conducted our audit in accordance with the Guidance Note on Audit of internal Financial Controls Over Financial Reporting (the “Guidance Note”)issued by the ICAI and the Standards on
ANNEXURE “A” TO INDEPENDENT AUDITORS’ REPORT
Referred to in paragraph 10(f) of the Independent Auditors' Report of even date to the members of Wendt (India) Limited on the consolidated financial statements for the year ended March 31, 2018.
Auditing deemed to be prescribed under Section 143(10) of the Companies Act, 2013, to the extent applicable to an audit of internal financial controls, both applicable to an audit of internal financial controls and both issued by the ICAI. Those Standards and the Guidance Note require that we comply with ethical requirements and plan and perform the audit to obtain reasonable assurance about whether adequate internal financial controls over financial reporting was established and maintained and if such controls operated effectively in all material respects.
4. Our audit involves performing procedures to obtain audit evidence about the adequacy of the internal financial controls system over financial reporting and their operating effectiveness. Our audit of internal financial controls over financial reporting included obtaining an understanding of internal financial controls over financial reporting, assessing the risk that a material weakness exists, and testing and evaluating the design and operating effectiveness of internal control based on the assessed risk. The procedures selected depend on the auditor's judgment, including the assessment of the risks of material misstatement of the consolidated financial statements, whether due to fraud or error.
5. We believe that the audit evidence we have obtained, is sufficient and appropriate to provide a basis for our audit opinion on the Company's internal financial control system over financial reporting.
Meaning of Internal Financial Controls Over Financial Reporting
6. A company's internal financial control over financial reporting is a process designed to provide reasonable assurance regarding the reliability of financial reporting and the preparation of consolidated financial statements for external purposes in accordance with generally accepted accounting principles. A company's internal financial control over financial reporting includes those policies and procedures that (1) pertain to the maintenance of records that, in reasonable detail, accurately and fairly reflect the transactions and dispositions of the assets of the company; (2) provide reasonable assurance that transactions are recorded as necessary to permit preparation of consolidated financial statements in accordance with generally accepted accounting principles, and that receipts and expenditures of the company are being made only in accordance with authorizations of management and directors of the company; and (3) provide reasonable assurance regarding prevention or timely detection of unauthorized acquisition, use, or disposition of the company's assets that could have a material effect on the consolidated financial statements.
Inherent Limitations of Internal Financial Controls Over Financial Reporting
7. Because of the inherent limitations of internal financial controls over financial reporting, including the possibility of collusion or improper management override of controls, material misstatements due to error or fraud may occur and not be detected. Also, projections of any evaluation of the internal financial controls over financial reporting to future periods are subject to the risk that the internal financial control over financial reporting may become inadequate because of changes in conditions, or that the degree of compliance with the policies or procedures may deteriorate.
Opinion
8. In our opinion, the Holding Company, which is incorporated in India, has, in all material respects, an adequate internal financial controls system over financial reporting and such internal financial controls over financial reporting were operating effectively as at March 31, 2018 based on the internal control over financial reporting criteria established by the Company considering the essential components of internal control stated in the Guidance Note on Audit of Internal Financial Controls Over Financial Reporting issued by the Institute of Chartered Accountants of India.
137
For Price Waterhouse Chartered Accountants LLP
Firm Registration Number: 012754N/N500016
Chartered Accountants
Bengaluru
April 25, 2018
Mohan Danivas S A
Partner
Membership Number: 209136
For Price Waterhouse Chartered Accountants LLP
Firm Registration Number: 012754N/N500016
Chartered Accountants
Bengaluru
April 25, 2018
Mohan Danivas S A
Partner
Membership Number: 209136

Particulars Note No. Year ended 31.03.2018 31.03.2017
1 Revenue from operations 20 14,894.14 15,745.26 2 Other Income 21 255.08 164.29
3 Total Revenue (1 + 2) 15,149.22 15,909.55
4 EXPENSES
(a) Cost of materials consumed 22 3,899.75 4,197.78 (b) Purchases of Stock-in-trade 1,158.90 1,202.57 (c) Changes in stock of finished goods,
work-in-progress and stock-in-trade 23 25.45 (127.28)(d) Excise duty on sale of goods 225.72 1,130.90 (e) Employee benefit expense 24 2,765.61 2,524.42 (f) Finance costs 25 19.64 12.20 (g) Depreciation and amortisation expense 26 1,042.94 999.50 (h) Other expenses 27 4,207.15 4,312.56
Total Expenses (4) 13,345.16 14,252.65
5 Profit before tax (3 - 4) 1,804.06 1,656.90
6 Tax Expense
(1) Current tax 28 659.91 490.08 (2) Income tax for earlier years 28 - (50.74)(3) Deferred tax 28 (168.25) 12.44
Total tax expense (6) 491.66 451.78
7 Profit for the period (5 - 6) 1,312.40 1,205.12
8 Other comprehensive income
A Items that will not be reclassified to profit or loss (i) Remeasurements of the defined benefit plans 36.23 (68.62)
B Items that may be reclassified to profit or loss(i) Exchange differences in translating the financial 184.13 (1.83)
statements of foreign operations
Total Other Comprehensive Income (8) 220.36 (70.45)
9 Total comprehensive income for the period (7 + 8) 1,532.76 1,134.67
10 Earnings per equity share: 35
(1) Basic 65.62 60.26 (2) Diluted 65.62 60.26
(Rs. in lakhs)
138 139
CONSOLIDATED STATEMENT OF PROFIT AND LOSS FOR THE YEAR ENDED MARCH 31, 2018(Rs. in lakhs)
CONSOLIDATED BALANCE SHEET AS AT MARCH 31, 2018
Note No. As at March 31,2018
As at March 31,2017
13 5,873.28
194.39
4 10.27
5 237.94
8 53.15
(a) Property, Plant and Equipment
(b) Capital work-in-progress
(c) Goodwill
(d) Other Intangible assets
(e) Other non-current assets
(f) Income Tax Assets (Net) 9 291.35
(1) Total Non - Current Assets 6,660.38 2 Current assets
(a) Inventories 10 2,087.67
(b) Financial Assets
(i) Investments 6 1,467.21
(ii) Trade receivables 11 3,069.03
(iii) Cash and cash equivalents 12A 485.92
(iv) Bank balances other than (iii) above 12B 230.13
(v) Other Financial Assets 7 73.27
(c) Other Current assets 8 428.29
Total Current Assets 7,841.52 14,501.90
1 Equity
(a) Equity Share capital 13 200.00
(b) Other Equity 14 11,031.51
Total Equity 11,231.51
Liabilities
2 Non-current liabilities(a) Provisions 15 191.49
(b) Deferred tax liabilities (Net) 16 565.62
(2)Total Non - Current Liabilities 757.11
3 Current liabilities
(a) Financial Liabilities
17 1,405.83 (i) Trade payables
(ii) Other financial liabilities 18 613.12
(b) Provisions 15 128.92 (c) Income Tax Liabilities (Net) 9 140.40
(d) Other current liabilities 19 225.01
(3)Total Current Liabilities 2,513.28
5,459.03
199.56
10.27
214.77
60.11
287.87
6,231.61
2,130.28
2,245.16
3,661.45
784.30
431.55
88.58
420.39
9,761.71 15,993.32
200.00
11,962.48
12,162.48
91.21
397.37
488.58
1,933.58
717.12
94.93 319.44
277.19
3,342.26 15,993.32 14,501.90
Particulars
Total Assets
Non-current assets
ASSETS
EQUITY AND LIABILITIES
(1+2+3)Total Equity and Liabilities
(1)
(2) (1+2)
A
B
The above Consolidated balance sheet should be read in conjunction with the accompanying notes.
The above consolidated statement of Profit and Loss should be read in conjunction with the accompanying notes.
This is the Consolidated balance sheet referred to in our report of even date.
For Price Waterhouse Chartered Accountants LLP
Firm Registration Number : 012754N/N500016
BengaluruApril 25, 2018
AKANKSHA BIJAWATCompany Secretary
MUKESH KUMAR HAMIRWASIAChief Financial Officer
SHRINIVAS G SHIRGURKAR
Director
For and on behalf of the Board of Directors
BengaluruApril 25, 2018
M M MURUGAPPAN
Chairman
K SRINIVASANDirector
MOHAN DANIVAS S APartnerMembership Number : 209136
For and on behalf of the Board of Directors
This is the statement of Profit and Loss referred to in our report of even date.Consolidated
For Price Waterhouse Chartered Accountants LLP
Firm Registration Number : 012754N/N500016
Bengaluru BengaluruApril 25, 2018 April 25, 2018
AKANKSHA BIJAWATCompany Secretary
MUKESH KUMAR HAMIRWASIAChief Financial Officer
M M MURUGAPPAN
Chairman
SHRINIVAS G SHIRGURKAR
Director
K SRINIVASANDirector
MOHAN DANIVAS S APartnerMembership Number : 209136

For
an
d o
n b
eh
alf
of
the B
oard
of
Dir
ect
ors
Ben
galu
ruA
pri
l 25,
2018
AK
AN
KSH
A B
IJA
WA
TC
om
pan
y Secr
eta
ry
MU
KESH
KU
MA
R H
AM
IRW
ASIA
Ch
ief
Fin
an
cial O
ffic
er
M
M M
URU
GA
PPA
N
Ch
air
man
SH
RIN
IVA
S G
SH
IRG
URK
AR
Dir
ect
or
K S
RIN
IVA
SA
ND
irect
or
Ben
galu
ruA
pri
l 2
5,
20
18
MO
HA
N D
AN
IVA
S S
APart
ner
Mem
bers
hip
Nu
mb
er
: 2
09
13
6
140 141
CONSOLIDATED STATEMENT OF CHANGES IN EQUITY FOR THE YEAR ENDED MARCH 31, 2018 CONSOLIDATED STATEMENT OF CHANGES IN EQUITY FOR THE YEAR ENDED MARCH 31, 2018(Rs. in lakhs)(Rs. in lakhs)
(A) Equity Share Capital
Balance as at April 1, 2016 200.00 Add: Changes in equity share capital during the year -
Balance as at March 31, 2017 200.00
Balance as at April 1, 2017 200.00 Add: Changes in equity share capital during the year -
Balance as at March 31, 2018 200.00
This Space has
been Purposely
Left Blank
Th
is is
the c
on
solid
ate
d s
tate
men
t o
f ch
an
ges
in e
qu
ity
refe
rred
to
in
ou
r re
po
rt o
f eve
n d
ate
.
The a
bove
conso
lidate
d s
tate
ment of ch
anges
in e
quity
should
be r
ead in
conju
nct
ion w
ith t
he a
ccom
panyi
ng n
ote
s.
(B)
Oth
er
Eq
uit
y
Ge
ne
ral
Re
se
rve
Sta
tuto
ry
Re
se
rve
Re
tain
ed
E
arn
ing
so
f d
efi
ne
d
Ex
ch
an
ge
be
ne
fit
pla
n
Re
me
as
ure
me
nt
dif
fere
nc
e
P
art
icu
lars
To
tal
Ite
ms
of
oth
er
co
mp
reh
en
siv
e
inc
om
e
Bala
nce a
s a
t A
pri
l 1, 2016
6,0
05.6
640.2
74,5
52.1
3(4
8.3
4)
(51.0
9)
10,4
98.6
3P
rofit
for
the y
ear
- -
1,2
05.1
2-
- 1,2
05.1
2O
ther
com
pre
hensi
ve in
com
e for
the y
ear,
net of
inco
me tax
--
-(6
8.6
2)
(1.8
3)
(70.4
5)
To
tal co
mp
reh
en
siv
e in
co
me f
or
the y
ear
--
1,2
05.1
2(6
8.6
2)
(1.8
3)
1,1
34.6
7
Paym
ent of F
inal D
ivid
end for
the p
rece
din
g
financia
l year
- -
(300.0
0)
- -
(300.0
0)
Paym
ent of D
ivid
end tax
on F
inal D
ivid
end for
the p
rece
din
g fin
anci
al y
ear
- -
(61.0
7)
- -
(61.0
7)
Paym
ent of In
terim
Div
idend for
the c
urr
ent ye
ar
- -
(200.0
0)
- -
(200.0
0)
Paym
ent of D
ivid
end tax
on Inte
rim
Div
idend for
the c
urr
ent ye
ar
- -
(40.7
2)
- -
(40.7
2)
Tra
nsf
er
to G
enera
l Rese
rve
120.0
0
- (1
20.0
0)
- -
-
Tra
nsf
er
to S
tatu
tory
Rese
rve
-4.1
6(4
.16)
--
-B
ala
nce a
s a
t M
arc
h 3
1, 2017
6,1
25.6
644.4
35,0
31.3
0(1
16.9
6)
(52.9
2)
11,0
31.5
1
Pro
fit for
the y
ear
- -
1,3
12.4
0
- -
1,3
12.4
0
Oth
er
com
pre
hensi
ve in
com
e for
the y
ear,
net of
inco
me tax
--
-36.2
3184.1
3220.3
6To
tal co
mp
reh
en
siv
e in
co
me f
or
the y
ear
--
1,3
12.4
0
36.2
3184.1
31,5
32.7
6
Paym
ent of F
inal D
ivid
end for
the p
rece
din
g
financia
l year
- -
(300.0
0)
- -
(300.0
0)
Paym
ent of D
ivid
end tax
on F
inal D
ivid
end for
the p
rece
din
g fin
anci
al y
ear
- -
(61.0
7)
- -
(61.0
7)
Paym
ent of In
terim
Div
idend for
the c
urr
ent ye
ar
- -
(200.0
0)
- -
(200.0
0)
Paym
ent of D
ivid
end tax
on Inte
rim
Div
idend for
the c
urr
ent ye
ar
- -
(40.7
2)
- -
(40.7
2)
Tra
nsf
er
to G
enera
l Rese
rve
130.0
0
- (1
30.0
0)
- -
- T
ransf
er
to S
tatu
tory
Rese
rve
-0.9
9(0
.99)
--
-
Bala
nce a
s a
t M
arc
h 3
1, 2018
6,2
55.6
645.4
25,6
10.9
2
(80.7
3)
131.2
111,9
62.4
8
For
Pri
ce W
ate
rho
use
Ch
art
ere
d A
cco
un
tan
ts L
LP
Firm
Reg
istr
ati
on
Nu
mb
er
: 0
12
75
4N
/N5
00
01
6

142 143
CONSOLIDATED CASH FLOW STATEMENT FOR THE YEAR ENDED MARCH 31, 2018 CONSOLIDATED CASH FLOW STATEMENT FOR THE YEAR ENDED MARCH 31, 2018(Rs. in lakhs)(Rs. in lakhs)
Particulers Year ended
CASH FLOW FROM OPERATING ACTIVITIES
Profit before tax 1,804.06 1,656.90
Adjustments for :
Depreciation and amortisation expense 1,042.94 999.50Provision for trade receivables (net of reversal) 14.66 (16.11)Bad Debts written off 2.39 8.79Finance costs 19.64 12.20Interest Income on Deposits (5.21) (12.35)Dividend from Current investments - mutual funds (52.60) (23.67)Loss / (Profit) on sale / discarding of tangible fixed assets (net) 0.11 0.13Provisions and Liabilities no longer required, written back (15.12) (8.81)Net Gain on sale / fair valuation of current investments (net) (11.73) (30.96)Unrealised exchange Loss / (Gain) (23.87) 4.98
Operating profit before working capital changes 2,775.27 2,590.60
Changes in working capital :(Increase)/Decrease in Inventories (42.61) (44.69)(Increase)/Decrease in Trade receivables (583.45) 63.46(Increase)/Decrease in Other financial assets (15.31) 21.57(Increase)/Decrease in Other non-current assets (6.96) (15.25)(Increase)/Decrease in Other current assets 44.13 (52.71)Increase/(Decrease) in Trade payables 536.54 (458.01)Increase/(Decrease) in Other current financial liabilities 211.70 200.45Increase/(Decrease) in Other non-current liabilities and Provisions (96.10) 30.40Increase/(Decrease) in Other current liabilities and provisions 18.19 (107.32)
CASH FLOW GENERATED FROM OPERATING ACTIVITIES 2,841.40 2,228.50
Income Taxes Paid (net of refunds) (491.51) (391.19)
NET CASH GENERATED FROM OPERATING ACTIVITIES (A) 2,349.89 1,837.31
Cash flow from investing activities
Capital expenditure on tangible fixed assets (560.02) (1,011.30)Capital expenditure on intangible fixed assets (37.21) (37.98)Proceeds from Sale of tangible Fixed Assets 3.61 4.84 Sale / (Purchase) of current Investments (net) (766.22) (48.61)Interest Income on Deposits 5.21 12.35Dividend from current Investments - mutual funds 52.60 23.67 Bank balances not considered as cash and cash equivalents - Placed (500.00) (500.00) - Matured / encashed 298.58 298.53
NET CASH USED IN FROM INVESTING ACTIVITIES (B) (1,503.45) (1,258.50)
Cash flow from financing activities
Finance costs (5.52) (12.20)
Dividend Paid (including tax thereon) (601.79) (601.79)
NET CASH USED IN FINANCING ACTIVITIES (C) (607.31) (613.99)
Translation adjustment (D) 184.13 (1.83)
NET INCREASE/(DECREASE) IN CASH AND CASH EQUIVALENTS (A+B+C+D) 423.26 (37.01)
CASH AND CASH EQUIVALENTS AT THE BEGINNING OF THE YEAR E 361.04 398.05
CASH AND CASH EQUIVALENTS AT THE END OF THE YEAR (A+B+C+D+E) 784.30 361.04
Year ended31.03.2018 31.03.2017
NOTE No.1
1 GROUP OVERVIEW
2 SIGNIFICANT ACCOUNTING POLICIES
2.1 Basis of preparation and presentation
Wendt (India) Limited (hereinafter referred to as "the Company") was incorporated on August 21, 1980 under the provisions of the erstwhile Companies Act,1956, and is a joint venture between Wendt GmbH, Germany and Carborundum Universal Limited, India. Wendt (India) Limited is a leading manufacturer of Super Abrasives, High precision Grinding, Honing and Special Purpose Machines and High Precision components. The Company's registered office is in Bangalore and factory is situated in Hosur, Tamilnadu. The Company has 2 subsidiaries viz. Wendt Grinding Technologies Limited, Thailand and Wendt Middle East FZE, UAE. The Company, together with subsidiaries are hereinafter referred to as "the Group".
(i) Compliance with Ind AS
The Consolidated financial statements have been prepared in accordance with Indian Accounting Standards (Ind AS) notified under Section 133 of the Companies Act, 2013 (the act) [Indian Accounting Standards Rules, 2015] and other relevant provisions of the Act.
(ii) Historical Cost Convention
These Consolidated financial statements have been prepared on the historical cost basis, except for certain financial instruments which are measured at fair values at the end of each reporting period, as explained in the accounting policies below. Historical cost is generally based on the fair value of the consideration given in exchange for goods and services. Fair value is the price that would be received to sell an asset or paid to transfer a liability in an orderly transaction between market participants at the measurement date.
This is the consolidated cash flow statement referred to in our report of even date.
The above consolidated cash flow statement should be read in conjunction with the accompanying notes.
Reconciliation of Cash and cash equivalents as per cash flow statement
Cash and cash equivalents (Note 12A) 784.30 485.92
Book Overdrafts (Note 18) - (124.88)
Balance as per statement of cash flows 784.30 361.04
Cash and cash equivalents as per above comprise of the following:
Particulars Year ended March
31, 2018
Year ended March
31, 2017
NOTES FORMING PART OF THE CONSOLIDATED FINANCIAL STATEMENTS
For and on behalf of the Board of DirectorsFor Price Waterhouse Chartered Accountants LLP
Firm Registration Number : 012754N/N500016
Bengaluru BengaluruApril 25, 2018 April 25, 2018
AKANKSHA BIJAWATCompany Secretary
MUKESH KUMAR HAMIRWASIAChief Financial Officer
M M MURUGAPPAN
Chairman
SHRINIVAS G SHIRGURKAR
Director
K SRINIVASANDirector
MOHAN DANIVAS S APartnerMembership Number : 209136

144
NOTES FORMING PART OF THE CONSOLIDATED FINANCIAL STATEMENTS
(iii)Operating Cycle
Based on the nature of products / activities of the Group and the normal time between acquisition of assets and their realization in cash or cash equivalents, the Group has determined its operating cycle as 12 months for the purpose of classification of its assets and liabilities as current and non-current.
The preparation of these Consolidated financial statements requires the use of accounting estimates which could differ from the actual results. Management also needs to exercise judgement in applying the Group's accounting policies. These note provide an overview of the areas that involved higher degree of judgement or complexity, and of items which are more likely to be materially adjusted due to estimates and assumptions turning out to be different than those originally assessed. Detailed information about each of these estimates and judgements is included in the relevant notes together with information about the basis of calculation for each affected line item in the consolidated financial statements.
The areas involving critical estimates or judgements are:
(i) Estimation of useful life of Tangible and Intangible assets - Note 2.15 & 2.16
(ii) Impairment of Trade receivables - Note 11 & Note 2.22.4
(iii)Estimation of defined benefit obligation - Note 33
Estimates and judgements are continually evaluated. They are based on historical experience and other factors, including expectations of future events that may have a financial impact on the Group and that are believed to be reasonable under the circumstances.
When the Group loses control of a subsidiary, a gain or loss is recognised in profit or loss and is calculated as the
2.2 Critical Estimates and Judgements
2.3 Basis of consolidation
2.3.1. Changes in the Group's ownership interest in existing subsidiaries
The consolidated financial statements incorporate the financial statements of the Company and entities controlled by the Company. Control is achieved when the Company:
• has power over the investee
• is exposed, or has rights , to variable return from its involvement with the investee; and
• has the ability to use its power to affect its returns.
Consolidation of a subsidiary begins when the Company obtains control over the subsidiary and cease when the Company lose control of the subsidiary. Specifically, income and expenses of a subsidiary acquired or disposed of during the year are included in the consolidated statement of profit and loss from the date the Company gains control until the date when the Company ceases to control the subsidiary.
The Group combines the financial statements of the parent and its subsidiaries line by line adding together like items of assets, liabilities, equity, income and expenses. Intercompany transactions, balances and unrealized gains on transactions between group companies are eliminated. Unrealized losses are also eliminated unless the transaction provides evidence of an impairment of the transferred asset.
When necessary, adjustments are made to the financial statements of subsidiaries to bring their accounting policies into line with the Group's accounting policies.
Following subsidiary companies have been included in Consolidation:-
(i) Wendt Grinding Technologies Limited, Thailand - 100% Ownership Proportion (as on March 31, 2018 & as on March 31, 2017)(incorporated on 19th July 2005)
(ii) Wendt Middle East FZE, Sharjah (UAE) - 100% Ownership Proportion (as on March 31, 2018 & as on March 31, 2017)(incorporated on 24th September 2008)
NOTES FORMING PART OF THE CONSOLIDATED FINANCIAL STATEMENTS
145
difference between (i) the aggregate of the fair value of the consideration received and the fair value of any retained interest and (ii) the previous carrying amount of the assets (including goodwill), and liabilities of the subsidiary. All amounts previously recognised in other comprehensive income in relation to that subsidiary (i.e.., reclassified to profit or loss or transferred to another category of equity as specified/permitted by applicable Ind AS). The fair value of any investment retained in the former subsidiary at the date when control is lost is regarded as the fair value on initial recognition for subsequent accounting under Ind AS 109, or , when applicable , the cost on initial recognition of an investment in an associate or a joint venture.
2.4 Business combinations
2.5 Goodwill
2.6 Revenue recognition
Acquisitions of businesses are accounted for using the acquisition method. The consideration transferred in a business combination is measured at fair values of the assets transferred, liabilities incurred to the former owners of the acquired business, equity interests issued by the company and fair value of any asset or liability resulting from a contingent consideration arrangement. Identifiable assets and liabilities are measured initially at their fair values at the acquisition date. Acquisition related costs are expensed as incurred.
Goodwill is measured as the excess of the sum of the consideration transferred, the amount of any non-controlling interests in the acquired business and the acquisition date fair value of any previous equity interest in the acquired entity (if any), over the fair value of the net identifiable assets acquired.
If the initial accounting for a business combination is incomplete by end of the reporting period in which the combination occurs, the Group reports provisional amounts for the items for which the accounting is incomplete. Those provisional amounts are adjusted during the measurement period, or additional assets or liabilities are recognised, to reflect new information obtained above facts and circumstances that existed at the acquisition date that, if known, would have affect the amounts recognised at that date.
Goodwill arising on acquisition of a business is carried at costs as established at the date of acquisition of the business less accumulated impairment losses, if any.
Goodwill is tested for impairment annually. For the purpose of impairment testing, goodwill is allocated to those cash-generating units that are expected to benefit from the business combination in which the goodwill arose. If the recoverable amount of the cash-generating unit is less than its carrying amount, the impairment loss is allocated to reduce the carrying amount of the goodwill. Any impairment loss recognised for goodwill is not reversed in subsequent periods.
Revenue is measured at the fair value of the consideration received or receivable. Amounts disclosed as revenue are inclusive of excise duty and net of returns, trade discounts & rebates. Amounts collected on behalf of third parties such as value added taxes, good and service tax (GST) are excluded from revenue.
2.6.1 Sale of goods
Revenue from the sale of goods are recognised when the goods are despatched and titles have passed to the buyer, which generally coincides with dispatch of goods, at which time all the following conditions are satisfied :
• the company has transferred to the buyer the significant risk and rewards of ownership of the goods;
• the company retains neither continuing managerial involvement to the degree usually associated with ownership nor effective control over the goods sold;
• the amount of revenue can be measured reliably;
• it is probable that the economic benefits associated with the transaction will flow to the group; and
• the cost incurred or to be incurred in respect of the transactions can be measured reliably.
2.6.2 Rendering of services
Revenue from rendering of services priced on a time and material basis is recognized on rendering of services as per the terms of contracts with customers.

146 147
NOTES FORMING PART OF THE CONSOLIDATED FINANCIAL STATEMENTS
Leases are classified as finance lease whenever the terms of the lease transfer substantially all the risks and rewards of ownership to the lessee. All other leases are classified as operating leases.
2.6.3 Dividend and interest income
Dividend income from investments is recognised when the shareholder's right to receive payment has been established.
Interest income from a financial asset is recognised and accrued on time proportion basis.
2.6.4 Rental income
The group's policy for recognition of revenue from operating lease is described in note 2.7.1
2.7.1 The group as lessor
Rental income from operating leases is generally recognised on a straight-line basis over the lease term. Where the rentals are structured solely to increase in line with expected general inflation to compensate for the group's expected inflationary cost increases, such increases are recognised in the year in which such benefits accrue. Initial direct costs incurred in negotiating and arranging an operating lease are added to the carrying amount of the leased asset and recognised on a straight-line basis over the lease term.
2.7.2 The group as lessee
Lease payments under operating leases are recognised as an expense on a straight line basis in the statement of profit and loss over the lease term except where the lease payments are structured to increase in line with expected general inflation.
2.7 Leasing - Operating
2.8 Government Grants
2.9 Foreign currency
Grants from the government are recognized at their fair value where there is a reasonable assurance that the grant will be received and the Group will comply with all attached conditions.
Government grants relating to income are deferred and recognized in the consolidated profit or loss over the period necessary to match them with the costs that they are intended to compensate and presented within other operating income.
Government grants relating to the purchase of property, plant and equipment are included in non-current liabilities as deferred income and are credited to profit or loss on a straight-line basis over the expected lives of the related assets and presented within other operating income.
The export incentives from the Government are recognized based on eligibility at their fair value where there is a reasonable assurance that the incentive will be received and the company will comply with all attached conditions.
In preparing the financial statements of each individual group entity, transactions in currencies other than the
entity's functional currency (foreign currency) are recognised at the rates of exchange prevailing at the dates of
the transactions. At the end of each reporting period, monetary items denominated in foreign currencies are
retranslated at the rates prevailing at that date. Non-monetary items carried at fair value that are denominated
in foreign currencies are retranslated at the rates prevailing at the date when the fair value was determined.
Non-monetary items that are measured in terms of historical cost in a foreign currency are not retranslated.
For the purposes of presenting these consolidated financial statements, the assets and liabilities of the Group's foreign operations are translated into Indian Rupees using exchange rates prevailing at the end of each reporting period. Income and expense items are translated at the average exchange rates for the period, unless exchange rates fluctuate significantly during that period, in which case the exchange rates at the dates of
NOTES FORMING PART OF THE CONSOLIDATED FINANCIAL STATEMENTS
transactions are used. Exchange differences arising, if any, are recognised in other comprehensive income and accumulated in equity (and attributed to non-controlling interests as appropriate).
On the disposal of a foreign operation (i.e. disposal of the Group's entire interest in a foreign operation, a disposal involving loss of control over a subsidiary that includes a foreign operation, or a partial disposal of an interest in a joint arrangement or an associate that includes a foreign operation of which the retained interest becomes a financial asset), all of the exchange differences accumulated in equity in respect of that operation attributable to the owners of the Company are reclassified to profit or loss.
In addition, in relation to a partial disposal of a subsidiary that includes a foreign operation that does not result in the Group losing control over the subsidiary, the proportionate share of accumulated exchange differences are re-attributed to non-controlling interests and are not recognised in profit or loss. For all other partial disposals (i.e. partial disposals of associates or joint arrangements that do not result in the Group losing significant influence are joint controlled), the proportionate share of the accumulated exchange differences is reclassified to profit or loss.
2.11.1 Long Term Employee Benefits
Long -Term Employee Benefits - Compensated Absences
2.10 Borrowing costs
2.11 Employee benefits
Borrowing costs, other than that are directly attributable to the acquisition, construction or production of a qualifying asset are expensed in the period in which they are incurred.
Accumulated Compensated absences which fall due beyond 12 months is provided for in the books on actuarial valuation basis at the year end using projected unit credit method.
Defined Contribution Plans
Superannuation fund, Provident fund and Pension fund are defined contribution plans towards which the company makes contribution at predetermined rates to the Superannuation Trust, and the Regional Provident Fund Commissioner respectively. The same is debited to the Statement of Profit and Loss based on the amount of contribution required to be made and when services are rendered by the employees.
The Company also makes contributions to state plans namely Employee’s State Insurance Fund and Employee’s Pension Scheme 1995. The Company has no further payment obligation once the contributions have been paid.
Defined Benefit Plan
The liability or asset recognised for gratuity as at the Consolidated Balance sheet date is determined on the basis of actuarial valuation using Projected Unit Credit method. The amount is funded to a Gratuity fund administered by the trustees and managed by Life Insurance Corporation of India.
Remeasurement, comprising actuarial gain and losses arising from experience adjustments and changes in actuarial assumptions are recognised in the period in which they occur directly in consolidated other comprehensive income. They are included in retained earnings in the consolidated statement of changes in equity and in the consolidated Balance Sheet. Defined benefit costs are categorised as follows :
• service cost (including current service cost, past service cost, as well as gains and losses on curtailments and settlements);
• net interest expense or income;
• remeasurement
Termination benefits are recognized as an expense as and when incurred.
2.11.2 : Short-term employee benefits
Short term employee benefits including performance incentive and compensated absences which are expected

NOTES FORMING PART OF THE CONSOLIDATED FINANCIAL STATEMENTS
to be settled within 12 months after the end of the period in which the employee renders related service, are determined as per Company's policy and recognized as expense based on expected obligation on undiscounted basis.
Income tax expense represents the sum of the tax currently payable and deferred tax. Income tax expense is recognized in the consolidated statement of profit and loss except to the extent it relates to items directly recognized in equity or in consolidated other comprehensive income.
2.12.1 Current tax
Current income tax for the current and prior periods are measured at the amount expected to be recovered from or paid to the taxation authorities based on the taxable income for the period. The tax rates and tax laws used to compute the current tax amount are those that are enacted or substantively enacted by the reporting date and applicable for the period. The group offsets current tax assets and current tax liabilities, where it has a legally enforceable right to set off the recognized amounts and where it intends either to settle on a net basis or to realize the asset and liability simultaneously.
2.12.2 Deferred tax
Deferred income tax is recognized using the Balance Sheet approach. Deferred income tax assets and liabilities are recognized for deductible and taxable temporary differences arising between the tax base of assets and liabilities and their carrying amount in consolidated financial statements. However, the deferred tax liabilities are not recognised if they arise from the initial recognition of goodwill or from initial recognition of an asset or liability in a transaction that is not a business combination and affects neither accounting nor taxable profits or losses at the time of the transaction.
Deferred income tax asset are recognized to the extent that it is probable that taxable profit will be available against which the deductible temporary differences, and the carry forward of unused tax credits and unused tax losses can be utilized.
Deferred income tax liabilities are recognized for all taxable temporary differences other than investment in subsidiaries, where the Parent is able to control the timing of the reversal of the temporary difference and it is probable that the temporary difference will not reverse in the foreseeable future.
The carrying amount of deferred income tax assets are reviewed at each reporting date and reduced to the extent that it is no longer probable that sufficient taxable profit will be available to allow all or part of the deferred income tax asset to be utilized.
Deferred income tax assets and liabilities are measured at the tax rates that are expected to apply in the period when the asset is realized or the liability is settled, based on tax rates (and tax laws) that have been enacted or substantively enacted at the reporting date.
The basic earnings/ (loss) per share is computed by dividing the net profit attributable to equity shareholders for the year by the weighted average number of equity shares outstanding during the year. Diluted earnings per share adjusts the figures used in the determination of basic earnings per share to take into account the after income tax effect of interest and other financing costs associated with dilutive potential equity shares, and the weighted average number of additional equity shares that would have been outstanding assuming the conversion of all dilutive potential equity shares.
Revenue expenditure pertaining to research are charged to the respective heads in Consolidated Statement of Profit and Loss. Development costs of products are also charged to the Consolidated Statement of Profit and Loss unless a product’s technical feasibility has been established, in which case such expenditure is capitalised.
2.12 Taxation
2.13 Earnings per share
2.14 Research and development costs
NOTES FORMING PART OF THE CONSOLIDATED FINANCIAL STATEMENTS
The amount capitalised comprises expenditure that can be directly attributed or allocated on a reasonable and consistent basis to creating, producing and making the asset ready for its intended use. Fixed assets utilised for research and development are capitalised and depreciated in accordance with the policies stated for Property, plant and equipment.
Freehold Land is carried at historical cost.
All other items of Property, Plant and equipment are stated at historical cost less accumulated depreciation and impairment losses, if any. The cost of tangible assets comprises its purchase price net of any trade discounts and rebates, any import duties and other taxes (other than those subsequently recoverable from the tax authorities), any directly attributable expenditure on making the asset ready for its intended use, other incidental expenses and interest on borrowings attributable to acquisition of qualifying tangible assets up to the date the asset is ready for its intended use. Machinery spares which can be used exclusively in connection with an item of tangible asset and whose use is expected to be irregular are capitalised and depreciated over the useful life of the principal item of the relevant assets. Subsequent costs are included in the asset's carrying amount are recognised as a separate asset, as appropriate only when it is probable that future economic benefits associated with the item will flow to the company and the cost of the item can be measured reliably.
Individual assets costing less than Rs.5,000 each are depreciated in full in the year of acquisition.
Capital work-in-progress:
Items of assets which are not yet ready for their intended use are carried at cost, comprising direct cost, related incidental expenses and attributable interest, if any.
Depreciation
Depreciation is recognised so as to write off the cost of the assets (other than freehold land and properties under construction) less their residual values over their useful lives, using the straight-line method. The estimated useful lives, residual value and depreciation method are reviewed at the end of each reporting period, with the effect of any changes in estimate accounted for on a prospective basis.
Estimated useful lives of the tangible assets are as follows:-
Buildings
(I) Factory Building 30 years
(ii) Residential Building 60 years
(iii) Others 20 years
Plant and equipment
(I) Single Shift 15 years
(ii) Double Shift 10 years
(iii) Triple Shift 7.5 years
Office equipment
(i) Computers and Data Processing equipments 3 years
(ii) Servers and Networks 6 years
(iii) Others 5 years
Furniture and Fixtures 10 years
Vehicles 8 years
2.15 Property, Plant and equipment
148 149

151
NOTES FORMING PART OF THE CONSOLIDATED FINANCIAL STATEMENTS
Depreciation on tangible fixed assets has been provided on the straight-line method as per the useful life prescribed in Schedule II to the Companies Act, 2013 except in respect of the used / second hand machines & process bath equipments , in whose case the life of the assets has been assessed based on technical advice, taking into account the nature of the asset, the estimated usage of the asset, the operating conditions of the asset, past history of replacement, anticipated technological changes, manufacturers warranties and maintenance support, etc.
Depreciation on assets added / disposed off during the year is provided on pro-rata basis from the month of addition or up to the month prior to the month of disposal, as applicable.
An item of property, plant and equipment is derecognised upon disposal or when no future economic benefits are expected to arise from the continued use of the asset. Any gain or loss arising on the disposal or retirement of an item of property, plant and equipment is determined as the difference between the sales proceeds and the carrying amount of the asset and is recognised in consolidated statement of profit or loss.
Technical Knowhow 5 years
Software 5 years
Brands and Trademarks 5 years
Patents and Copyrights 5 years
2.16 Intangible assets
2.17 Impairment of tangible and intangible assets other than goodwill
2.16.1 Intangible assets acquired separately
Intangible assets with finite useful lives that are acquired separately are carried at cost less accumulated amortisation and accumulated impairment losses, if any. Amortisation is recognised on a straight-line basis over their estimated useful lives. The estimated useful life and amortisation method are reviewed at the end of each reporting period, with the effect of any changes in estimate being accounted for on a prospective basis.
2.16.2 Intangible assets acquired in a business combination
Intangible assets acquired in a business combination other than goodwill are initially recognised at their fair value at the acquisition date (which is regarded as their cost).
2.16.3 Useful lives of intangible assets
Estimated useful lives of the intangible assets are as follows:-
At the end of each reporting period, the group reviews the carrying amounts of its tangible and intangible assets to determine whether there is any indication that those assets have suffered an impairment loss. If any such indication exists, the recoverable amount of the assets is estimated in order to determine the extent of the impairment loss (if any). When it is not possible to estimate the recoverable amount of an individual asset, the group estimates the recoverable amount of the cash-generating unit to which the asset belongs. When a reasonable and consistent basis of allocation can be identified, corporate assets are also allocated to individual cash-generating units, or otherwise they are allocated to the smallest group of cash-generating units for which a reasonable and consistent allocation basis can be identified.
Recoverable amount is higher of fair value less cost of disposal and value in use. In assessing value in use, the estimated future cash flows are discounted to their present value using a pre-tax discount rate that reflects current market assessments of the time value of money and the risks specific to the asset for which the estimates of future cash flows have not been adjusted.
If the recoverable amount of an asset (or cash-generating unit) is estimated to be less than its carrying amount, the carrying amount of the asset(or cash-generating unit) is reduced to its recoverable amount. An impairment loss is recognised immediately in profit or loss.
NOTES FORMING PART OF THE CONSOLIDATED FINANCIAL STATEMENTS
2.18 Cash and cash equivalents
2.19 Inventories
2.20 Provisions and Contingencies
2.21 Financial Instruments
2.22 Financial assets
Cash and cash equivalents includes cash on hand, deposits held at call with financial institutions, other short term, highly liquid investments with original maturity of 3 months or less that are readily convertible into known amounts of cash and which are subject to an insignificant risk of changes in values, and bank overdrafts. Bank overdrafts and Book overdrafts are disclosed under "Other financial liabilities".
Cash flows are reported using the indirect method, whereby profit for the period is adjusted for the effects of transactions of a non-cash nature, any deferrals or accruals of past or future operating cash receipts or payments and item of income or expenses associated with investing or financing cash flows. The cash flows from operating, investing and financing activities of the group are segregated.
Inventories are valued at lower of cost and net realizable value. Cost of raw materials, stores and spares and traded goods comprises cost of purchases. Cost of work-in-progress and finished goods comprises direct materials, direct labour, and an appropriate proportion of overheads. Cost of inventories also include all other costs incurred in bringing the inventories to the present location and condition. Cost is computed on weighted average basis.
Net realisable value represents the estimated selling price for inventories less the estimated costs of completion and estimated costs necessary to make the sale.
Provisions are recognised when the group has a present obligation (legal or constructive) as a results of a past event, it is probable that the group will be required to settle the obligation, and a reliable estimate can be made of the amount of the obligation.
The amount recognised as a provision is the best estimate of the consideration required to settle present obligation at the end of reporting period, taking into account the risk and uncertainties surrounding the obligation. When a provision is measured using the cash flows estimated to settle the present obligation, its carrying amount is the present value of those cash flows (when the effect of the time value of money is material).
When some or all of the economic benefits required to settle a provision are expected to be recovered from a third party, a receivable is recognised as an asset if it is virtually certain that reimbursement will be received and the amount of receivable can be measured reliably.
A disclosure for contingent liabilities is made where there is a possible obligation or a present obligation that may probably not require an outflow of resources or an obligation for which the future outcome cannot be ascertained with reasonable certainty. When there is a possible or a present obligation where the likelihood of outflow of resources is remote, no provision or disclosure is made.
Contingent assets are not recognized in the financial statements.
Financial assets and financial liabilities are recognised when the group become a party to the contractual provision of the instruments.
Financial assets and financial liabilities are initially measured at fair value. Transaction costs that are directly attributable to the acquisition or issue of financial assets and financial liabilities (other than financial assets and financial liabilities at fair value through profit or loss ) are added to or deducted from the fair value of the financial assets or financial liabilities, as appropriate, on initial recognition. Transactions costs directly attributable to the acquisition of financial assets or financial liabilities at fair value through profit or loss are recognised immediately in Consolidated profit or loss.
All regular way purchases or sales of financial assets are recognised and derecognised on a trade date basis.
150

152
NOTES FORMING PART OF THE CONSOLIDATED FINANCIAL STATEMENTS NOTES FORMING PART OF THE CONSOLIDATED FINANCIAL STATEMENTS
Regular way purchases or sales are purchases or sales of financial assets that require delivery of assets within the time frame established by regulation or convention in the market place.
All recognised financial assets are subsequently measured in their entirety at either amortized cost or fair value, depending on the classification of the financial assets.
2.22.1. Classification of financial assets
Financial Assets that meet the following conditions are subsequently measured at amortised cost (except for financial assets that are designated as at fair value through profit or loss on initial recognition) :
• the asset is held within business model whose objective is to hold assets in order to collect contractual cash flows; and
• the contractual terms of the instruments give rise on specified dates to cash flows that are solely payments of principal and interest on the principal amount outstanding.
Financial assets are presented as current assets, except for those maturing later than 12 months after the reporting date which are presented as non-current assets. Financial assets are measured initially at fair value plus transaction costs and subsequently carried at amortised cost using the effective interest method, less any impairment loss.
Amortised cost are represented by security deposits, cash and cash equivalents and eligible current and non-current assets. Cash and cash equivalent comprise cash on hand and in banks and demand deposit with banks which can be withdrawn at any time without prior notice or penalty on the principal.
For the impairment policy on financial assets measured at amortised cost, refer Note 2.22.4
Financial assets that meet the following conditions are subsequently measured at fair value through other comprehensive income (except for financial assets that are designated as at fair value through profit or loss on initial recognition) :
• the asset is held within a business model whose objective is achieved both by collecting contractual cash flows and selling financial assets; and
• the contractual terms of the instruments give rise on specified dates to cash flows that are solely payments of principal and interest on the principal amount outstanding.
2.22.2 Investment in equity instruments at FVTOCI
On initial recognition, the company can make an irrevocable election (on an instrument- by instrument basis) to present the subsequent changes in fair value in other comprehensive income pertaining to investment in equity instruments. This election is not permitted if the equity investment is held for trading. These elected investments are initially measured at fair value. Subsequently, they are measured at fair value with gain and losses arising from changes in fair value recognised in consolidated other comprehensive income and accumulated in the 'Reserve for equity instrument through consolidated other comprehensive income'. The cumulative gain or loss is not reclassified to profit or loss on disposal of the investments.
2.22.3. Financial assets at fair value through profit or loss (FVTPL)
Financial asset at FVTPL are measured at fair value at the end of each reporting period, with any gains or losses arising on remeasurement recognised in consolidated profit or loss. The net gain or loss recognised in consolidated profit or loss incorporate any dividend or interest earned on the financial asset and is included under 'Other income'. Dividend on financial asset at FVTPL is recognised when the group’s right to receive the dividends is established. It is probable that the economic benefits associated with the dividend will flow to the entity, the dividend does not represent a recovery of part of cost of the investment and the amount can be measured reliably.
FVTPL is a residual category for financial assets. Any financial categorisation as at amortised cost or as FVTOCI, is classified at FVTPL. In addition, the group may elect to designate the financial asset, which otherwise meets amortised cost or FVTOCI criteria, at FVTPL, if doing so eliminates or significantly reduces a measurement or recognition inconsistency.
2.22.4. Impairment of financial assets
The group measures the loss allowance for a financial instruments at an amount equal to the lifetime expected
153
(Rs. in lakhs)
credit losses if the credit risk on that financial instruments has increased significantly since initial recognition. If the credit risk on a financial instruments has not increased significantly since initial recognition, the group measures the loss allowance for that financial instruments at an amount equal to 12 month expected credit losses. 12 month expected credit losses are portion of the lifetime expected credit losses and represents the lifetime cash shortfalls that will result if default occurs within the 12 months after the reporting date and thus, are not cash shortfalls that are predicted over the 12 months.
For trade receivables or any contractual rights to receive cash or another financial assets that result from transactions that are within the scope of Ind AS 11 and Ind AS 18, the company always measures the loss allowance at an amount equal to life time expected credit losses.
Further, for the purposes of measuring lifetime expected credit loss allowance for trade receivables, the group has used a practical expedient as permitted under Ind AS 109. This expected credit loss allowance is computed based on a provision matrix which takes into account historical credit loss experience and adjusted for forward-looking information.
Operating segments are reported in a manner consistent with the internal reporting provided to the chief operating decision maker (CODM). Refer Note 31 for segment information presented.
All amounts disclosed in the financial statements and notes have been rounded off to the nearest lakhs, as per the requirement of Schedule III, unless otherwise stated.
2.25.1 Ind AS 21
Appendix B to Ind AS 21, Foreign currency transactions and advance consideration: On March 28, 2018, Ministry of Corporate Affairs ("MCA") has notified the Companies (Indian Accounting Standards) Amendment Rules, 2018 containing Appendix B to Ind AS 21, Foreign currency transactions and advance consideration which clarifies the date of the transaction for the purpose of determining the exchange rate to use on initial recognition of the related asset, expense or income, when an entity has received or paid advance consideration in a foreign currency.
The group is evaluating the requirements of the amendment and the impact on the financial statements.
2.25.2 Ind AS 115
Ind AS 115- Revenue from Contract with Customers: On March 28, 2018, Ministry of Corporate Affairs ("MCA") has notified the Ind AS 115, Revenue from Contract with Customers. The core principle of the new standard is that an entity should recognize revenue to depict the transfer of promised goods or services to customers in an amount that reflects the consideration to which the entity expects to be entitled in exchange for those goods or services. Further the new standard requires enhanced disclosures about the nature, amount, timing and uncertainty of revenue and cash flows arising from the entity’s contracts with customers.
The standard permits two possible methods of transition:-
-Retrospective approach - Under this approach the standard will be applied retrospectively to each prior reporting period presented in accordance with Ind AS 8- Accounting Policies, Changes in Accounting Estimates and Errors.
-Retrospectively with cumulative effect of initially applying the standard recognized at the date of initial application (Cumulative catch - up approach)
The effective date for adoption of Ind AS 115 is financial periods beginning on or after April 1, 2018.
The group is evaluating the requirements of the standard and the impact on the financial statements.
2.23 Segment Reporting
2.24 Rounding Off
2.25 New standards and interpretations not yet adopted

Descri
pti
on
of
Assets
Lan
d -
Fre
eh
old
Bu
ild
ing
s-
Fre
eh
old
Bu
ild
ing
s-
Leaseh
old
Pla
nt
an
d
Eq
uip
men
t
Off
ice
Eq
uip
men
t
Fu
rnit
ure
an
d F
ixtu
res
Veh
icle
sTo
tal
I. G
ross B
lock
Co
st
as a
t A
pri
l 1, 2016
103.7
5
1,8
53.8
43.5
8
7,3
39.4
4
767.0
4
250.0
9
166.4
510,4
84.1
9
Additi
ons
thro
ugh b
usi
ness
com
bin
ation
(Note
No.2
9)
- -
- 17.6
0
- -
- 17.6
0
Additi
ons
-
26.2
1
-
868.2
2 191.2
4
14.4
5
33.9
7
1,1
34.0
9
Dis
posa
ls -
-
-
(
147.7
8) (6
0.2
6)
- (8
.50)
(216.5
4)
Effect
of fo
reig
n c
urr
ency
tra
nsla
tion fro
m
funct
ional c
urr
ency
to r
eport
ing c
urr
ency
(
0.0
1) 3
.55
-
(3
.60) (0
.50)
-
-
(0.5
6)
Bala
nce a
s a
t M
arc
h 3
1, 2017
1
03.7
4
1
,883.6
0
3
.58 8,0
73.8
8
8
97.5
2
2
64.5
4
1
91.9
2
11,4
18.7
8
1
03.7
4
1
,883.6
0
3
.58 8,0
73.8
8
8
97.5
2
2
64.5
4
1
91.9
2
11,4
18.7
8
Bala
nce a
s a
t A
pri
l 1, 2017
Additi
ons
thro
ugh b
usi
ness
com
bin
ation
(Note
No.2
9)
-
-
-
-
-
-
-
-
Additi
ons
-
7
.45
-
382.9
8 53.6
3
22.9
4
41.9
0
508.9
0
Dis
posa
ls -
-
-
(2
3.6
4)
(
43.6
0)
-
(21.5
1)
(88.7
5)
Effect
of fo
reig
n c
urr
ency
tra
nsla
tion fro
m
funct
ional c
urr
ency
to r
eport
ing c
urr
ency
1
1.8
0
35.4
8
-
16.5
7 4.9
6
-
8.5
5
7
7.3
6
Bala
nce a
s a
t M
arc
h 3
1, 2018
115.5
41,9
26.5
33.5
88,4
49.7
9912.5
1287.4
8220.8
611,9
16.2
9
II. A
ccu
mu
late
d d
ep
recia
tio
n
Bala
nce a
s a
t A
pri
l 1, 2016
-
510.7
8
3.5
8
3,6
24.5
2470.3
6118.1
2104.4
14,8
31.7
7
Depre
ciatio
n e
xpense
for
the y
ear
(Note
No.2
6) -
67.2
1 -
658.3
7
158.4
0
21.8
0
26.0
9
931.8
7
Elim
inate
d o
n d
isposa
l of ass
ets
-
-
-
(1
47.1
3)
(60.2
6)
- (4
.17)
(211.5
6)
Effect
of fo
reig
n c
urr
ency
tra
nsla
tion fro
m
funct
ional c
urr
ency
to r
eport
ing c
urr
ency
-
5.4
7
-
(3
.70)
(4.2
4)
(0.3
4)
(3.7
7)
(6.5
8)
Bala
nce a
s a
t M
arc
h 3
1, 2017
-583.4
63.5
84,1
32.0
6564.2
6139.5
8122.5
65,5
45.5
0
Bala
nce a
s a
t A
pri
l 1, 2017
-
583.4
6
3.5
8
4,1
32.0
6564.2
6139.5
8122.5
65,5
45.5
0
Depre
ciatio
n e
xpense
for
the y
ear
(Note
No.2
6) -
70.6
1 -
704.8
9
151.0
8
22.1
4
18.8
4
967.5
6
Elim
inate
d o
n d
isposa
l of ass
ets
-
-
-
(2
3.6
4)
(43.6
0)
- (1
7.7
9)
(85.0
3)
Effect
of fo
reig
n c
urr
ency
tra
nsla
tion fro
m
funct
ional c
urr
ency
to r
eport
ing c
urr
ency
-
2
3.6
4
-
4.6
2 (3
.74)
(0
.60)
5.3
1
29.2
3
Bala
nce a
s a
t M
arc
h 3
1, 2018
-
677.7
13.5
84,8
17.9
3668.0
0161.1
2128.9
26,4
57.2
6
Net
Carr
yin
g V
alu
e a
s a
t M
arc
h 3
1, 2017
103.7
41,3
00.1
43,9
41.8
2333.2
6124.9
669.3
65,8
73.2
8
Net
Carr
yin
g V
alu
e a
s a
t M
arc
h 3
1, 2018
115.5
41,2
48.8
2-
3,6
31.8
6244.5
1126.3
691.9
45,4
59.0
3
No
te 3
- P
rop
ert
y, P
lan
t an
d E
qu
ipm
en
t
NOTES FORMING PART OF THE CONSOLIDATED FINANCIAL STATEMENTS NOTES FORMING PART OF THE CONSOLIDATED FINANCIAL STATEMENTS
154 155
(Rs. in lakhs) (Rs. in lakhs)
a)
R
efe
r to
Note
36.3
for
info
rmatio
n o
n p
ropert
y, p
lant
and e
quip
ment
ple
dged a
s se
curity
by
the G
roup.
Descri
pti
on
of
Assets
Tech
nic
al
Kn
ow
ho
wC
om
pu
ter
So
ftw
are
Bra
nd
s/
Tra
dem
ark
sP
ate
nts
To
tal
I. G
ross B
lock
Co
st
as a
t A
pri
l 1, 2016
202.2
6218.0
2-
- 420.2
8
Additi
ons
thro
ugh b
usi
ness
com
bin
atio
n (
Note
No.2
9)
- -
81.0
0
50.0
0
131.0
0
Additi
ons
-53.2
0-
-53.2
0
Bala
nce a
s a
t M
arc
h 3
1, 2017
202.2
6271.2
281.0
050.0
0604.4
8
Bala
nce a
s a
t A
pri
l 1, 2017
202.2
6271.2
281.0
0
50.0
0
604.4
8
Additi
ons
- 52.0
8
- -
52.0
8
Effect
of fo
reig
n c
urr
ency
tra
nsl
atio
n fro
m funct
ional c
urr
ency
to
report
ing c
urr
ency
- 0.0
5
- -
0.0
5
Bala
nce a
s a
t M
arc
h 3
1, 2018
202.2
6323.3
581.0
050.0
0656.6
1
II. A
ccu
mu
late
d a
mo
rtis
ati
on
Bala
nce a
s a
t A
pri
l 1, 2016
145.7
7153.2
0-
- 298.9
7
Am
ort
isatio
n e
xpense
for
the y
ear
(Note
No. 26)
18.5
2
29.4
6
12.1
5
7.5
0
67.6
3
Effect
of fo
reig
n c
urr
ency
tra
nsl
atio
n fro
m funct
ional c
urr
ency
to
report
ing c
urr
ency
- (0
.06)
- -
(0.0
6)
Bala
nce a
s a
t M
arc
h 3
1, 2017
164.2
9182.6
012.1
57.5
0366.5
4
Bala
nce a
s a
t A
pri
l 1, 2017
164.2
9182.6
012.1
5
7.5
0
366.5
4
Am
ort
isatio
n e
xpense
for
the y
ear
(Note
No.2
6)
14.6
4
34.5
4
16.2
0
10.0
0
75.3
8
Effect
of fo
reig
n c
urr
ency
tra
nsl
atio
n fro
m funct
ional c
urr
ency
to
report
ing c
urr
ency
-(0
.08)
--
(0.0
8)
Bala
nce a
s a
t M
arc
h 3
1, 2018
178.9
3217.0
628.3
517.5
0441.8
4
Net
Carr
yin
g V
alu
e a
s a
t M
arc
h 3
1, 2017
37.9
788.6
268.8
542.5
0237.9
4
Net
Carr
yin
g V
alu
e a
s a
t M
arc
h 3
1, 2018
23.3
3106.2
952.6
532.5
0214.7
7
No
te 4
- G
oo
dw
ill
A r
eco
nci
liatio
n o
f th
e c
arr
yin
g a
mo
un
t o
f g
oo
dw
ill a
t th
e b
eg
inn
ing
an
d e
nd
of
the
re
po
rtin
g p
erio
d
No
te 5
- O
ther
Inta
ng
ible
Ass
est
s
Co
st
Bala
nce
at begin
nin
g o
f year
10.2
7
- A
dditi
onal a
mounts
recognis
ed fro
m b
usi
ness
com
bin
atio
ns
occ
urr
ed d
uring the y
ear
(Note
29)
-10.2
7
Bala
nce a
t en
d o
f year
10.2
710.2
7
Accu
mu
late
d Im
pair
men
t
Bala
nce
at begin
nin
g o
f year
- -
Impairm
ent lo
sses
recognis
ed in
the y
ear
--
Bala
nce a
t en
d o
f year
--
Net
Carr
yin
g V
alu
e10.2
710.2
7
Descri
pti
on
of
Assets
As a
t M
arc
h 3
1, 2018
As a
t M
arc
h 3
1, 2017

No
te 6
- In
vest
men
ts
Un
its (
No
s)
Am
ou
nt
A D
esig
nate
d a
s F
air
Valu
e T
hro
ug
h P
rofi
t an
d L
oss
Qu
ote
d In
vestm
en
ts
Investm
en
ts in
Mu
tual F
un
ds
1IC
ICI P
rudentia
l Money
Mark
et F
und -
Daily
Div
idend
33,0
53
33.1
1
2IC
ICI P
rudentia
l Savi
ngs
Fund -
Daily
Div
idend
30,8
58
31.1
5
3IC
ICI P
rudentia
l Regula
r In
com
e F
und -
Gro
wth
667,4
37
117.0
4
4A
dity
a B
irla
Sun L
ife S
avi
ngs
Fund -
Daily
Div
idend -
Regula
r P
lan -
Rein
vest
ment
49,5
79
49.7
1
5A
dity
a B
irla
Sun L
ife Inte
rval I
nco
me F
und-Q
rtly
Pla
n-S
eries
1 D
ivid
end-R
eg P
lan-P
ayo
ut
490,0
00
49.3
9
6A
dity
a
Sun L
ife F
loatin
g R
ate
Fund-S
TP
-IP
-Daily
Div
idend R
eniv
est
ment
Birla
- -
7R
elia
nce
Mediu
m T
erm
Fund -
Daily
Div
idend P
lan-
Div
idend R
ein
vest
ment
595,6
96
101.8
9
8R
elia
nce
Liq
uid
Fund T
reasu
ry P
lan -
Daily
Div
idend O
ptio
n D
ivid
end R
ein
vest
ment
3,2
29
49.3
9
9R
elia
nce
Fix
ed H
orizo
n F
und -
XX
XV
I-S
eries4
-Div
idend P
lan-D
ivid
end P
ayo
ut
400,0
00
40.3
2
10
TA
TA
Short
Term
Bond F
und P
lan A
- G
row
th295,5
55
95.4
3
11TA
TA
Short
Term
Bond F
und D
irect P
lan -
Gro
wth
186,6
18
62.5
8
12
Baro
da P
ioneer
Cre
dit
Opport
unitie
s F
und -
Pla
n A
Month
ly D
ivid
end-R
ein
vest
ment
4,2
77,0
45
461.4
7
13
Baro
da P
ioneer
Tre
asu
ry A
dva
nta
ge F
und-P
lan A
Daily
Div
idend -
Rein
vest
ment
21,7
58
224.2
6
14
Baro
da P
ioneer
Liq
uid
Fund-P
lan A
Daily
Div
idend-R
ein
vest
ment
4,9
60
49.6
7
15
DS
P B
lack
Rock
Liq
uid
ity F
und -
Inst
itutio
nal P
lan -
Daily
Div
idend
- -
16
DS
P B
lack
Rock
Money M
anager
Fund -
Regula
r -D
aily
Div
idend
- -
17
DS
P B
lack
Rock
FM
P -
Series 2
22-3
m-R
eg-D
iv-R
eg P
ay
311
,803
31.4
2
18
India
bulls
Liq
uid
Fund -
Exi
stin
g P
lan D
aily
Div
idend -
Rein
vest
ment
33,0
07
330.4
5
19
India
bulls
Ultr
a S
hort
Term
Fund -
Exis
ting P
lan D
aily
Div
idend -
Rein
vest
ment
5,1
04
51.2
2
20
SB
I M
agnum
Inst
a C
ash
Fund -
Regula
r P
lan-
Daily
Div
idend
1,2
13
20.3
2
21
UO
B A
sse
t M
anagem
ent -
Sure
Daily
1,6
90,8
55
446.3
4
TO
TA
L IN
VE
ST
ME
NT
S C
AR
RIE
D A
T F
VT
P 2
,245.1
6
Oth
er
dis
clo
su
res
Aggre
gate
cost
of quote
d in
vest
ments
- 2
,202.7
1
Aggre
gate
mark
et va
lue o
f quote
d investm
ents
- 2
,245.1
6
Aggre
gate
valu
e o
f unquote
d in
vest
ments
- -
Aggre
gate
am
ount of im
pairm
ent in
valu
e o
f in
vest
ments
- -
Sl N
o A
s a
t M
arc
h 3
1, 2018
Part
icu
lars
Cu
rren
t U
nit
s (
No
s)
Am
ou
nt
19,9
97
20.0
2
125,4
67
127.2
6
- -
- -
- -
49,1
79
49.1
9
- -
4,0
02
61.1
8
- -
295,5
55
90.3
5
186,6
18
58.7
5
3,5
31,8
67
385.2
7
14,1
25
145.4
5
- -
2,9
98
30.0
1
3,9
83
40.0
0
- -
1,5
00
15.0
2
4,8
83
49.0
0
- -
1,6
90,8
55 395.7
1
1
,467.2
1
- 1
,428.5
6
- 1
,467.2
1
--
- -
As a
t M
arc
h 3
1, 2017
Cu
rren
t
NOTES FORMING PART OF THE CONSOLIDATED FINANCIAL STATEMENTS NOTES FORMING PART OF THE CONSOLIDATED FINANCIAL STATEMENTS(Rs. in lakhs) (Rs. in lakhs)
156 157
As at March 31, 2017
(a) Security Deposits 9.50
(b) Employee advances 62.50
(c) Rent receivable 1.27
Total 73.27
Particulars
Note 7 - Other financial assets
As at March 31, 2018
7.02
78.42
3.14
88.58
Note 8 - Other non-current and current assets
Current Non- Current
39.55 -
2.71 -
7.59 -
1.76 -
- -
28.59 -
249.91 -
- 60.11
90.28 -
34.19 -
(34.19) -
420.39 60.11
Unsecured, considered good
(a) Advances to suppliers
(b) Balances with government authorities (other
than income taxes)
(i) Cenvat receivable
(ii) GST credit receivable
(iii) VAT credit receivable
(iv) Service tax credit receivable
(c) Other loans and advances
(d) Prepayments
(e) Security Deposits with Government
(f) Export Incentive receivable
Unsecured, considered doubtful
(a) Other loans and advances
Less: Provisions for doubtful loans and advances
Total
Particulars
As at March 31, 2018
Current Non- Current
96.32 -
82.66 -
- -
10.19 -
93.23 -
22.79 -
123.10 -
- 53.15
- -
39.09 -
(39.09) -
428.29 53.15
As at March 31, 2017
Note 9 - Income tax Assets & Liabilities
Particulars As at March 31, 2018 As at March 31, 2017
Income tax Assets -Non Current
Advance Income tax paid (net) 287.87 291.35
Total 287.87 291.35
Income tax Liabilities - Current
Provision for Income Tax (net) 319.44 140.40
Total 319.44 140.40

Particulars As at March 31, 2018 As at March 31, 2017
(a) Raw materials
(b) Work-in-progress
(c) Finished goods
(d)
(e) Stores and spares
Included above, goods-in-transit:
(i) Raw materials
(ii) Stock-in-trade
Total goods-in-transit
Stock-in-trade
Total
892.46 852.31
693.05 644.95
55.39 130.61
293.65 291.98
195.73 167.82
2,130.28 2,087.67
46.53 24.35
99.75 118.86
146.28 143.21
NOTES FORMING PART OF THE CONSOLIDATED FINANCIAL STATEMENTS
159
(Rs. in lakhs)NOTES FORMING PART OF THE CONSOLIDATED FINANCIAL STATEMENTS
(Rs. in lakhs)
158
Note - 10: Inventories
Note 11 - Trade receivables
Note
1) Write down of inventories to net realisable value amounted to Rs 31.32 Lakhs (March 31, 2017: Rs.37.57 lakhs). These were recognised as an expense during the year and included in 'Change in inventories of finished goods, work-in-progress and stock-in-trade' in Consolidated statement of Profit and Loss.
Note - 12A - Cash and Cash Equivalents
As at March 31, 2018 As at March 31, 2017ParticularsAs at March 31, 2018 As at March 31, 2017
Current Current
3,661.45 3,069.03
41.14 34.71 3,702.59 3,103.74 41.14 34.71
(Unsecured)
(a) Considered good
(b) Considered doubtful
Less: Allowance for doubtful debts
Total 3,661.45 3,069.03
Particulars
Note 11(a) - Movement in the allowance for doubtful debts
Particulars As at March 31, 2018 As at March 31, 2017
Balance at beginning of the year 34.71 65.57
Impairment losses recognised in the year
- Other receivables 31.35 23.52
Amounts written off during the year as uncollectable (8.23) (14.75)
Amounts recovered during the year (16.69) (39.50)
Exchange difference on opening provision (0.13)-
Balance at end of the year 41.14 34.71
Note 11(b) - Trade Receivables breakup
Particulars As at March 31, 2018 As at March 31, 2017
Of the above, trade receivables from:
- Related Parties 408.33 245.18
- Others 3,294.26 2,858.56
Total 3,702.59 3,103.74
Note 11(c) - Expected Credit Loss (%)
Particulars As at March 31, 2018 As at March 31, 2017
Within the credit period - - 1-30 days past due 1 1 31-60 days past due 2 1 61-90 days past due 2 2 More than 90 days past due 6 5
Note 11(d) - Ageing of Receivables
Particulars As at March 31, 2018 As at March 31, 2017
Within the credit period 2,228.48 2,016.43 1-30 days past due 565.45 462.12 31-60 days past due 275.49 258.35 61-90 days past due 141.67 94.82 More than 90 days past due 491.50 272.02
Total 3,702.59 3,103.74
778.27 471.73
5.06 13.57
0.97 0.62
(a) Unrestricted Balances with banks
(b) Cheques on hand
(c ) Cash in hand
Total 784.30 485.92
As at March 31, 2018 As at March 31, 2017Particulars
Note - 12B - Bank balances other than above
0.70 0.70
430.85 229.43
(a) Deposit accounts
(b) Earmarked balances in Dividend accounts
Total 431.55 230.13
Note - 13: Equity Share Capital
Authorised:
30,00,000 (March 31, 2017: 30,00,000) Equity
shares of Rs. 10/- each with voting rights
Issued, Subscribed and Fully Paid:
20,00,000 (March 31, 2017: 20,00,000) Equity
shares of Rs. 10/- each with voting rights
Total
300.00
200.00
200.00
As at March 31, 2018 As at March 31, 2017Particulars
300.00
200.00
200.00
Rs. in Lakhs, except for number of shares

No. of Shares %
797,352 39.87
797,352 39.87
As at March 31, 2018
No. of Shares Amount
(Rs. in lakhs)
2,000,000
-
200.00
-
2,000,000 200.00
As at March 31, 2018
NOTES FORMING PART OF THE CONSOLIDATED FINANCIAL STATEMENTS
161
(Rs. in lakhs)NOTES FORMING PART OF THE CONSOLIDATED FINANCIAL STATEMENTS
(Rs. in lakhs)
(b) Details of shares held by each shareholder holding more than 5% shares in the Company:
Equity Shares : (with equal voting rights)
Wendt GmbH, Germany
Carborundum Universal Limited, India
ParticularsNo. of Shares %
797,352 39.87
797,352 39.87
As at , 2017March 31
(a) Reconciliation of the number of shares outstanding at the beginning and at the end of the period
Shares outstanding at the beginning of the period
Add: Movements during the year
Shares outstanding at the end of the period
Particulars No. of Shares Amount
(Rs. in lakhs)
2,000,000
-
200.00
-
2,000,000 200.00
As at March 31, 2017
(c) Rights, Preferences and Restrictions attached to shares
The Company has only one class of equity shares with voting rights (one vote per share). The dividends proposed by the Board of directors is subject to approval of the shareholders in the ensuing Annual General Meeting. In the event of liquidation of the Company, the equity shareholders are entitled to receive only the residual assets of the Company. The distribution of dividend is in the proportion to the number of equity shares held by the shareholders.
Note 14- Other equity
(d) There are no instances of bonus shares issued, shares issued for consideration other than cash and shares bought back during the period of 5 years immediately preceding the Balance Sheet date.
Particulars As at March 31, 2018 As at March 31, 2017
A. Reserves and Surplus
6,255.66 6,125.66
Statutory Reserve 45.42 44.43
5,530.19 4,914.34
B. Items of Other Comprehensive Income
131.21 (52.92)
Total 11,962.48 11,031.51
General Reserve
Retained earnings
Foreign Currency Translation Reserve
14.1 General Reserve
6,125.66 6,005.66
130.00 120.00
6,255.66 6,125.66
Transfer from Surplus in Statement of Profit and Loss
Balance as at the year end
Balance at the beginning of the year
Particulars As at March 31, 2018 As at March 31, 2017
The general reserve is a free reserve, retained from Company's profits and can be utilised upon fulfilling certain conditions in accordance with Companies Act.
160
14.2 Statutory Reserve
Particulars As at March 31, 2018 As at March 31, 2017
44.43 40.27
0.99 4.16
45.42 44.43Balance as at the year end
Balance at the beginning of the year
Transfer from Surplus in Statement of Profit and Loss
This represents appropriation of profit by the Company.
14.3 Retained earnings
Particulars As at March 31, 2018 As at March 31, 2017
4,914.34 4,503.791,312.40 1,205.12
36.23 (68.62)
(300.00) (300.00) (61.07) (61.07)
(200.00) (200.00) (40.72) (40.72)
(130.00) (120.00)
(0.99) (4.16)
5,530.19 4,914.34
Payment of Interim Dividend for the current yearDividend Tax on Interim Dividend for the current year
Transfer to General Reserve
Balance as at the year end
Balance at the beginning of the yearProfit for the yearOther Comprehensive income arising from remeasurement of
defined benefit obligation, net of tax
Transfer to Statutory Reserve
Payment of Final Dividend for the preceding financial yearDividend Tax on Final Dividend for the preceding financial year
Retained Earnings comprise of the Company's undistributed earnings after taxes.
14.4 Foreign Currency Translation Reserve
Particulars As at March 31, 2018 As at March 31, 2017
(52.92) (51.09)
184.13 (1.83)
131.21 (52.92)Balance as at the year end
Balance at the beginning of the year
Transfer
Exchange differences relating to the translation of the results and net assets of the Group's foreign subsidiaries from their functional currencies to the Group's presentation currency (i.e. Indian Rupees) are recognised directly in Other Comprehensive Income and accumulated in the foreign currency translation reserve. Exchange differences accumulated in the foreign currency translation reserve are reclassified to Profit or Loss at the time of disposal of respective foreign operation.
14.5 Distributions made and proposed
The amount of per share dividend recognized as distributions to equity shareholders for the year ended March 31, 2018 and March 31, 2017 was Rs.25 and Rs. 25 respectively.
The Board of Directors at its meeting held on April 24, 2017 had recommended a final dividend of 150% (Rs.15/- per equity share of face value Rs.10/- each). The proposal was approved by shareholders at the Annual General Meeting held on July 24, 2017, this has resulted in a cash outflow of Rs. 361.07 lakhs, inclusive of dividend distribution tax of Rs. 61.07 lakhs. Also, the Board of Directors at its meeting held on January 24, 2018 had declared an interim dividend of 100% (Rs.10/- per equity share of face value of Rs.10/- each). Further, the Board of Directors at its meeting held on April 25, 2018 have recommended a final dividend of 150% (Rs. 15/- per equity share of face value of Rs.10/- each) which is subject to approval of shareholders. If approved, this would result in a cash outflow of Rs. 361.07 lakhs, inclusive of dividend distribution tax.

NOTES FORMING PART OF THE CONSOLIDATED FINANCIAL STATEMENTS
163
(Rs. in lakhs)NOTES FORMING PART OF THE CONSOLIDATED FINANCIAL STATEMENTS
(Rs. in lakhs)
162
Note 18 - Other Financial Liabilities Note 15 - Provisions
Note 16- Deferred tax Liabilities
Note 19 - Other Current Liabilities
Current Non- Current Current Non- Current
(a) Provision for employee benefits- Compensated absences 94.93 91.21 91.58 91.54- Other employee obligations - - 37.34 99.95
Total 94.93 91.21 128.92 191.49
Particulars As at March 31, 2018 As at March 31, 2017
Opening BalanceRecognised in profit and Loss
Tax effect of items constituting deferred tax liabilitiesProperty, Plant and Equipment 635.66 (175.49) Net Gain on Fair Value of Mutual Funds 13.38 (1.02)
649.04 (176.51)
Tax effect of items constituting deferred tax assetsEmployee Benefits (63.19) 8.99 Provision for doubtful trade receivables (10.27) (0.73) Others (9.96) -
(83.42) 8.26
Total 565.62 (168.25)
Opening Balance
Recognised in
profit and Loss
Tax effect of items constituting deferred tax liabilitiesProperty, Plant and Equipment 622.28 13.38 Net Gain on Fair Value of Mutual Funds 11.36 2.02
633.64 15.40 Tax effect of items constituting deferred tax assetsEmployee Benefits (49.39) (13.80)Provision for doubtful trade receivables (21.10) 10.83Others (9.97) 0.01
(80.46)
(2.96)
Total 553.18 12.44
Closing Balance
460.17 12.36
472.53
(54.20) (11.00) (9.96)
(75.16)
397.37
Closing Balance
635.66 13.38
649.04
(63.19) (10.27)
(9.96)(83.42)
565.62
Particulars
March 31, 2018
Particulars
March 31, 2017
Note 17 - Trade Payables
Particulars As at March 31, 2018 As at March 31, 2017
410.10 155.54 1,523.48 1,250.29
(a) Trade payables to- Related parties- Others
Total 1,933.58 1,405.83
Particulars As at March 31, 2018 As at March 31, 2017
430.85 229.4310.00 10.00 56.45 39.27
- 6.08 208.41 196.71
- 124.8811.41 6.75
(a) Unpaid dividends (b) Deposit from related party (c) Creditors for capital supplies/services (d) Retention Money (e) Due to employees (f) Book Overdraft (g) Others
Total 717.12 613.12
As at March 31, 2018 As at March 31, 2017
(a) Advances received from customers 140.23 104.29136.96 120.72
Total 277.19 225.01
(b) Statutory dues payable (other than income taxes)
Particulars
Note 20 - Revenue from Operations
Particulars March 31, 2018 March 31, 2017
a) Revenue from sale of goods (includes excise duty of Rs.225.72
lakhs, previous year Rs. 1,130.90 lakhs) (refer note (i) and (iv)
below) 13,962.29 15,254.66b) Revenue from rendering of services (refer note (ii) below) 695.16 341.97 c) Other operating income (refer note (iii) below) 236.69 148.63
14,894.14 15,745.26
Year ended
Total
March 31, 2018 March 31, 2017
(i) Sale of goods comprisesManufactured Goods 11,579.40 12,859.22 Traded goods 2,382.89 2,395.44
Total - Sale of goods 13,962.29 15,254.66
(ii) Sale of Services comprisesMachining charges 695.16 341.97 Total - Sale of Services 695.16 341.97
(iii) Other Operating income comprisesSale of Scrap 57.84 53.22 Service charges 46.96 64.19 Commission 20.08 18.08 Export Incentive (refer note V below) 111.81 13.14 Total - Other Operating income 236.69 148.63
Particulars Year ended
Note:
(iv) Goods and Service Tax (GST) has been effective from July 1, 2017. Consequently, excise duty, value added tax (VAT), Central sales tax (CST), Service tax etc, have been replaced with GST. Until June 30, 2017, 'Sale of goods' included the amount of excise duty recovered on sales. With effect from July 1, 2017, 'Sale of goods' excludes the amount of GST recovered. Accordingly, revenue from 'Sale of goods' and "Revenue from operations' for the year ended March 31, 2018 are not comparable with those of the previous year.
(v) Exports incentives represents grants in the nature of licenses under Merchandise Export from India Scheme (MEIS) and duty drawback. There are no unfulfilled conditions or contingencies attached to these grants.

NOTES FORMING PART OF THE CONSOLIDATED FINANCIAL STATEMENTS(Rs. in lakhs)
NOTES FORMING PART OF THE CONSOLIDATED FINANCIAL STATEMENTS(Rs. in lakhs)
Note 21 - Other Income
Note 22 - Cost of Materials Consumed
Note 23 - Change in inventories of finished goods, work-in-progress and stock-in-trade
Note 25 Finance Cost
March 31, 2018 March 31, 2017
967.56 931.87 75.38 67.63
Total 1,042.94 999.50
(a) Depreciation of Property, Plant and Equipment (Note No. 3)(b) Amortisation of intangible assets (Note No. 5)
ParticularsYear ended
March 31, 2018 March 31, 2017
5.52 11.86 - 0.34
14.12 -
Total 19.64 12.20
(a) Interest expense(b) Other borrowing costs(c) Interest on shortfall in payment of advance tax
Year endedParticulars
Note 26 Depreciation and amortisation expense
165
March 31, 2018 March 31, 2017
5.21 12.35
52.60 23.67 14.76 13.42
4.21 25.25
7.51 5.71
- 0.83
112.54 23.72
16.69 39.50 15.12 8.81
(a)
(b)
(c)(d)
(e)
(f)
(g)(h)
(i) 26.44 11.03
Total 255.08 164.29
ParticularsYear ended
Interest Income on Deposits
Dividend Income- Dividend income from current investments - mutual funds
Operating lease rental incomeNet Gain on sale of current investments
Forex gain (net)
- For doubtful trade receivables - For other expenses
Miscellaneous income
Net gain arising on financial assets designated as at fair value
through profit or loss
Provisions and Liabilities no longer required, written back
Profit on sale of capital assets (net of loss on assets sold /
scrapped / written off)
March 31, 2017
Opening stock 911.21
Add: Purchases 4,138.885,050.09
Less: Closing stock 852.31
Cost of materials consumed 4,197.78
Particulars Year endedMarch 31, 2018
852.31
3,939.904,792.21
892.46
3,899.75
March 31, 2018 March 31, 2017
Opening stockWork - in - progress 644.95 487.48Finished goods 130.61 111.60Stock-in- trade 291.98 341.18
1,067.54 940.26
Net (increase) / decrease 25.45 (127.28)
Particulars Year ended
Note 24 Employee Benefits Expense
Closing stockWork - in - progress 693.05 644.95Finished goods 55.39 130.61Stock-in- trade 293.65 291.98
1,042.09 1,067.54
March 31, 2018 March 31, 2017
(a) Salaries,wages and bonus 2,273.02 2,103.82 (b) Contribution to provident and other funds 179.81 155.32 (c) Staff welfare expenses 312.78 265.28
Total 2,765.61 2,524.42
ParticularsYear ended
164

NOTES FORMING PART OF THE CONSOLIDATED FINANCIAL STATEMENTS(Rs. in lakhs)
NOTES FORMING PART OF THE CONSOLIDATED FINANCIAL STATEMENTS(Rs. in lakhs)
Note 27 - Other Expenses
Note (i)
The above excise duty relates to difference between the opening and closing stock of finished goods.
Note 28 - Income tax recognised in profit or loss
Year ended March
Current taxIn respect of the current yearIn respect of the Prior year
Deferred taxIn respect of the current year
Total
(a) Income Tax Expense
Particulars
(b) Numerical Reconciliation between average effective tax rate and applicable tax rate :
31, 2018
659.91 -
659.91
(168.25)
(168.25)
491.66
Year ended March
31, 2017
490.08 (50.74)
439.34
12.44
12.44
451.78
720.71 848.57
82.98 107.05
75.54 81.58
152.21 125.57
38.90 40.49
309.11 321.73
331.02 190.11
43.75 43.12
561.06 600.35
7.22 5.00
8.91 -
139.50 110.49
2.00 2.00
30.36 26.84
- 3.52
25.74 21.28
80.60 52.78
10.62 23.54
8.23 2.39 14.75 8.79
31.35 23.52
(14.51) 2.11
13.39 13.40
1.00 1.00
4.04 2.25
70.45 61.80
177.68 182.05
144.98 188.81
310.33 361.31
451.86 416.73
39.08 41.45
0.11 -
365.39 428.86
Total 4,207.15 4,312.56
Stores and spares consumed
Contract labour
Repairs and maintenance
- Buildings
- Machinery
- Others
Power & Fuel charges
Freight outward and packing charges (net)
Rental charges
Processing Charges
Directors' Sitting Fees
Commission to Non-whole time Independent Directors
Rates and taxes
Contribution to Research Institution (refer Note 37)
Donation (refer Note 37)
Insurance charges
Selling Commission
Bad Trade receivables written off
Less:- Transferred from Provision
Provision for doubtful trade receivables (refer note 11(a))
Auditors remuneration and out-of-pocket expenses
- As Auditors
- For Taxation matters
- Auditors out-of-pocket expenses
Bank Charges
Service fee
Legal and other professional costs
Advertisement and Sales Promotion expenses
Travelling & Conveyance Expenses
Communication expenses
Loss on sale / disposal of fixed assets (net)
Miscellaneous expenses
Increase/(decrease) of excise duty on inventory (refer note (i)
below)
Expenditure on corporate social responsibility (refer Note 37)
ParticularsYear ended
March 31, 2018 March 31, 2017
166
Year ended
March 31, 2018
Year ended
March 31, 2017
Profit Before tax 1,804.06 1,656.90
Income Tax using the Company's domestic Tax rate of 34.61% (March
31, 2017 - 34.61%)624.35 573.42
Effect of income that is exempt from tax (13.81) (6.18)
Effect of expenses that are not deductible in determining taxable profit 10.51 78.50
Effect of concessions (Research and development) (25.31) (108.44)
Effect of dividend income from foreign subsidiaries 34.09 38.67
Effect of different overseas tax rates (54.09) (58.89)
Effect of changes in deferred tax rates (74.89) -
Others (9.19) (14.56)
491.66 502.52 Adjustment recognised in the current year in relation to - current tax of previous years - (50.74)
491.66 451.78
Particulars
Income Tax recognised in Statement of Profit and Loss
Note:
The tax impact for deferred tax purposes for Wendt (India) Ltd has been arrived by applying a tax rate of 29.12% (March 31, 2017: 34.61%) being the prevailing tax rate applicable for the company for the financial year ending March 31, 2019 under the Income tax Act , 1961.
Note 29 - Business CombinationsThe group had acquired the “Diamond Tool” business from Star Diamond Tools Private Limited at a consideration of Rs. 250 lakhs, under slump sale on March 29, 2016.
This acquisition is made to enhance the group's offerings in the field of one of our existing product line stationery dressers and this would also augment our existing manufacturing capability and capacity.
Consideration transferred :-
Particulars Amount
Tangible Assets (incuding CWIP)Machines and equipments 18.28Inventories 90.45
Intangible assetsBrands & Trade marks 81.00Patents 50.00Goodwill 10.27
Total 250.00
167

NOTES FORMING PART OF THE CONSOLIDATED FINANCIAL STATEMENTS(Rs. in lakhs)
NOTES FORMING PART OF THE CONSOLIDATED FINANCIAL STATEMENTS(Rs. in lakhs)
The management assessed that fair value of cash and short- term deposits, trade receivables, trade payables, book overdrafts and other current financial assets and liabilities approximate their carrying amounts largely due to the short-term maturities of these instruments.
The fair value of the financial assets and liabilities is included at the amount at which the instrument could be exchanged in a current transaction between willing parties, other than in a forced or liquidation sale.
The following methods and assumptions were used to estimate the fair values:
i) The fair value of the quoted mutual funds is based on price quotations at reporting date. The fair value of unquoted instruments , loans from banks and other financial liabilities, as well as other non-current financial liabilities is estimated by discounting future cash flows using rates currently available for debtor similar terms, credit risk and remaining maturities.
Fair value hierarchy
Level 1 - Quoted prices (unadjusted) in active markets for identical assets or liabilities.
Level 2– Inputs other than quoted prices included within Level 1 that are observable for the asset or liability, either directly (i.e.as prices) or indirectly (i.e. derived from prices).
Level 3 - Inputs for the assets or liabilities that are not based on observable market data (unobservable inputs).
(i) The initial accounting for the acquisition of the business was provisionally determined as at the year ended March 31, 2016, pending installation of the tangible assets and registration of the intangible assets. Accordingly, as on March 31, 2016, the group had classified these assets under the head “Capital Work-in-progress” and the inventories of Rs. 90.45 lakhs were included under current assets for the year ended March 31, 2016. The tangible assets were received by the group in the month of April 2016 and was subsequently installed and commissioned. These tangible assets have been capitalized during the year 2016-17.
(ii) The intangible assets comprising of Brands & Trademarks and Patents. Trademarks have been filed for registration in the name of the group. These intangible assets acquired in the business combination amounting to Rs. 131.00 lakhs have been recognized separately from Goodwill at their fair value at the acquisition date (which is regarded as their cost).
(iii) Goodwill arising on the acquisition of Star Diamond Tools Private Limited amounting to Rs. 10.27 lakhs has been recognized.
Note 30 - Financial Instruments
The following table presents the fair value measurement hierarchy of financial assets measured at fair value on recurring basis as at March 31, 2018 and March 31, 2017.
168
30.1 Capital Management
The capital includes issued equity share capital and all other equity reserves attributable to the equity holders. The group’s objectives when managing capital is to safeguard their ability to continue as a going concern while maximising the return to shareholders through the optimisation of cash and cash equivalents along with investment which is predominantly investment in liquid and short term mutual funds.
30.2 Categories of financial instruments
The carrying value and fair value of financial instruments by categories as of March 31, 2018 & March 31, 2017 were as follows:
March 31, 2018 March 31, 2017 March 31, 2018 March 31, 2017
2,245.16 1,467.21 2,245.16 1,467.21
3,661.45 3,069.03 3,661.45 3,069.03 784.30 485.92 784.30 485.92 431.55 230.13 431.55 230.13
88.58 73.27 88.58 73.277,211.04 5,325.56 7,211.04 5,325.56
1933.58 1405.83 1,933.58 1,405.83 717.12 613.12 717.12 613.12
Financial Assets
Measured at fair- value through profit and
loss (FVTPL)Investments
Measured at amortised cost
- Trade Receivables - Cash and cash equivalents - Other bank balances - Other Financial AssetsTotal Financial Assets
Financial Liabilities
Measured at amortised cost - Trade payables - Other financial liabilities
Total Financial Liabilities 2,650.70 2,018.95 2,650.70 2,018.95
Particulars
Carrying Amount Fair Value
Financial assets designated at FVTPL:
As at March 31, 2018
- Investment in mutual funds
As at March 31, 2017 - Investment in mutual funds
Particulars
6 2,245.16
6 1,467.21
Quoted pricesin active
Significant observable
inputs (Level 2)
Significant unobservable
markets (Level 1) inputs (Level 3)
2,245.16 - -
1,467.21 - -
Fair value measurement using
Note Total
The following table presents the assets and liabilities which are measured at amortized cost for which fair values are disclosed as at March 31, 2018 and March 31, 2017.
As at March 31, 2018
Financial assets measured atamortized cost:
- Trade Receivables 11 3,661.45 - - 3,661.45 - Cash and cash equivalents 12A 784.30 - - 784.30 - Other bank balances 12B 431.55 - - 431.55 - Other Financial Assets 7 88.58 - - 88.58
Financial liabilities measured atamortized cost:
- Trade payables 17 1,933.58 - - 1,933.58 - Other Financial Liabilities 18 717.12 - - 717.12
As at March 31, 2017
Financial assets measured atamortized cost:
- Trade Receivables 11 3,069.03 - - 3,069.03 - Cash and cash equivalents 12A 485.92 - - 485.92 - Other bank balances 12B 230.13 - - 230.13 - Other Financial Assets 7 73.27 - - 73.27
Financial liabilities measured atamortized cost: - Trade payables 17 1,405.83 - - 1,405.83 - Other Financial Liabilities 18 613.12 - - 613.12
Particulars Quoted pricesin active
Significant observable
inputs (Level 2)
Significant unobservable
markets (Level 1) inputs (Level 3)
Fair value measurement using
Note Total
There have been no transfers among Level 1, Level 2 and Level 3 during the period.
30.3 Financial Risk management objectives and polices
The group treasury function provides service to the business, co-ordinates access to domestic and international financial markets, monitors and manages the financial risks relating to the operations of the group through internal risk report which analyze exposures by degree and magnitude of risk. These risk include market risk, currency risk, interest risk, price risk, credit risk and liquidity risk.
The group seeks to minimise the effects of these risks by using policies approved by the board of directors, which provide written principles on interest risk, credit risk and investment of excess liquidity. The group does not enter into trade of financial instruments for speculative purpose.
The group treasury function reports quarterly to the senior management team that monitors risk and policies implemented to mitigate risk exposures.
169

NOTES FORMING PART OF THE CONSOLIDATED FINANCIAL STATEMENTS(Rs. in lakhs)
NOTES FORMING PART OF THE CONSOLIDATED FINANCIAL STATEMENTS(Rs. in lakhs)
The sensitivity of impact on profit or loss of the group to changes in the exchange rates , individual currency wise, is summarized below:-
30.3.1 Market risk
The group is exposed primarily to the financial risk of change in foreign currency exchange rate. The group transacts in various foreign currencies. Foreign currencies are recognised at the rate of exchange prevailing at the date of transaction. Group being a net exporter, follows the policy of natural hedging of foreign exchange earnings. Net forex gain is always at the positive side.
30.3.1 (a) Foreign currency risk management
The group undertakes transactions denominated in foreign currencies, consequently, the group is exposed to exchange rate fluctuations. The group, being a net exporter, follows the policy of natural hedging of foreign exchange earnings and outflow and hence it does not take any forward covers.
The carrying amounts of the group's foreign currency (unhedged) denominated monetary assets and monetary liabilities at the end of the reporting period are as follows:
31.1 Products and services from which reportable segments derive their revenue
The CEO of the holding Company has been identified as the Chief Operating Decision Maker (CODM) of the Group as defined by Ind AS 108, Operating Segments. Operating segments are defined as components of an enterprise for which discrete financial information is available that is evaluated regularly by the CODM, in deciding how to allocate resources and assessing performance.
1) The Group is organised into three business segments, namely :
a) Super Abrasives b) Machines, Accessories and Components and c) Others
The "other" segment includes other trading products
The above segments have been identified taking into account the organisation structure as well as the differing risks and returns of these segments. The Group has identified business segments as its primary segments. The reportable business segments are in line with the segment wise information which is being presented to the CODM.
2) Segment Assets and Segment Liabilities of the Company's business have not been identified to any of the reportable segments, as these are used interchangeably between segments.
3) Segment revenue and expenses have been identified to segments on the basis of their relationships to the operating activities of the segment. Revenue and expenses, which relate to the enterprise as a whole and are not allocable to segments on a reasonable basis have been included under "Other un-allocable Expenditure".
171
- Creditors against Import of goods,capital items
USDUSDUSDEUREURGBP
- Trade and other receivables USDEURGBP
AED (in
lakhs)
Thai Baht
(in lakhs)
Foreign
Currency
(in lakhs)
INR (in
lakhs)
- 4.77 313.39 54.74 103.51
0.45 - - 7.96 - - 0.80 56.47 - 2.59 4.90 - - 0.04 3.44
- - 5.64 361.54 - - 2.95 200.55 - - 0.96 76.35
March 31, 2018 March 31, 2017
Particulars
- - 6.40 420.44 - 44.40 - 92.99
0.59 - - 10.51 - - 1.59 129.53 - 9.24 - 19.34 - - 0.28 25.63
- - 9.38 607.58 - - 3.33 264.10 - - 2.40 217.74
Thai Baht
(in lakhs)
Foreign
Currency
(in lakhs)
INR (in
lakhs)
AED (in
lakhs)
Currency SensitivityMarch 31, 2018 March 31, 2017
USD Sensitivity
INR/USD - Increase by 1% 0.10% 0.03%INR/USD - Decrease by 1% (-0.10%) (-0.03%)
EUR Sensitivity
INR/EUR - Increase by 1% 0.07% 0.09%INR/EUR - Decrease by 1% (-0.07%) (-0.09%)
GBP Sensitivity
INR/GBP - Increase by 1% 0.11% 0.04%INR/GBP - Decrease by 1% (-0.11%) (-0.04%)
Impact on profit before tax (in %)
30.3.2 Credit Risk
Credit risk is the risk that counter party will not meet its obligations under a financial instrument or customer contract, leading to a financial loss. The group is exposed to credit risk from its operating activities (primarily trade receivables) and from its financing activities, including deposits with banks and financial institutions, foreign exchange transactions and other financial instruments.
The customers are broadly classified into high risk and medium risk, accordingly credit limit exposure is fixed. The group carries out payment performance review of all customers and based on this analysis, risk category of customers are evaluated annually. Further, the utilization of credit limit is regularly monitored through inbuilt locks in the ERP system.
170
30.3.3 Liquidity Risk
Liquidity risk is the risk that the group will not be able to meet its financial obligations as they fall due. The group's approach to managing liquidity is to ensure that it will always have sufficient liquidity to meet its liabilities when due, under both normal and stressed conditions, without incurring unacceptable losses or risking damage to the group's business and reputation.
The group regularly reviews its receivables, inventory & other working capital elements to mitigate any liquidity concerns. Any surplus from the business funds needs is parked in debt mutual funds (liquid / liquid plus) from reputed Asset Management Companies to provide day to day working capital.
Also, the group has unutilized credit limits with bank.
The following table presents the maturity period of all financial liabilities as at March 31, 2018 and March 31, 2017.
Particulars Note
Contractual cash flows
Carrying Less than 1 - 2 years
More than 2 years
17 1,933.58 1,933.58 - - 18 717.12 717.12 - -
17 1,405.83 1,405.83 - -
As at March 31, 2018
Financial liabilities measured at amortized cost: - Trade payables - Other Financial Liabilities
As at March 31, 2017
Financial liabilities measured at amortized cost: - Trade payables - Other Financial Liabilities 18 613.12 613.12 - -
1 yearamount
Note 31 - Segment Disclosures

NOTES FORMING PART OF THE CONSOLIDATED FINANCIAL STATEMENTS(Rs. in lakhs)
NOTES FORMING PART OF THE CONSOLIDATED FINANCIAL STATEMENTS(Rs. in lakhs)
173
31.5 Information about major customers
No single customer represents 10% or more of the group's total revenue for the year ended March 31, 2018 and March 31, 2017.
172
31.2 Segment Revenues and Results
Particulars Year ended March
31, 2018
Year ended March
31, 2017
10,622.76 10,847.032,681.94 3,495.701,352.75 1,253.90
14,657.45 15,596.63- -
14,657.45 15,596.63
2,046.55 1,923.90 217.32 456.03 275.00 210.91
2,538.87 2,590.8419.64 12.20
715.17 921.74
491.66 451.78
1. Segment Revenue
a) Super Abrasivesb) Machines , Accessories and Componentsc) Others
TotalLess:- Inter Segment RevenueRevenues2. Segment Resultsa) Super Abrasivesb) Machines , Accessories and Componentsc) OthersTotalLess: (i) Finance costs (ii) Other Un-allocable Expenditure net of Un-allocable income of
Rs.491.77 lakhs (31st March, 2017 Rs.312.92 lakhs) (iii) Tax expense
Profit for the year 1,312.40 1,205.12
31.3 Revenue by Geographical market
Particulars
Year ended March
31, 2018
Year ended March
31, 2017
India 9,053.91 10,890.81 Outside India 5,603.54 4,705.82
Total Revenues 14,657.45 15,596.63
31.4 Non current and Non Financial assets by Geographical market
Particulars 31st March, 2018 31st March, 2017
India 5,645.04 6,122.46 Outside India 298.70 246.57
Total Non Current assets 5,943.74 6,369.03
Note 32 - LeasesNote 32 - Leases
(a) The group is obligated under cancelable operating leases towards residential accommodation, which are renewable at the option of both the lessor and the lessee. Total rental expense debited to the Consolidated Statement of Profit and Loss under cancelable operating leases amounts to Rs. 43.75 lakhs. (Previous year: Rs 42.96 lakhs).
There are no sub-lease payments received/receivable recognised in the statement of profit and loss. Also, there are no contingent rents payable and there are no restrictions imposed by lease agreements such as those concerning dividends and additional debt.
(b) The Company has leased out a portion of its factory building to a related party. Total rental income credited to the Consolidated Statement of Profit and Loss amounts to Rs. 14.76 lakhs (March 31, 2017 : Rs. 13.42 lakhs)
Details of the above referred lease are as given below:
Particulars Amount
Gross carrying amount 1,590.09 Less: Accumulated Depreciation 471.19 Net carrying amount 1,118.90
The depreciation recognized in respect of the factory building for the year is Rs. 53.79 lakhs.
There are no contingent rents receivable.
Note 33 - Employee Benefits
Defined Contribution Plans
The Group operates defined contribution benefit plans for all qualifying employees.
Superannuation fund, Provident fund, Social Security Fund and pension fund are defined contribution plans towards which the group makes contribution at predetermined rates to the Superannuation Trust funded with Life Insurance Corporation Of India and the Regional Provident Fund Commissioner respectively. The same is debited to the Consolidated Statement of Profit and Loss accounts based on the amount of contribution required to be made and services are rendered by the employees.
Defined Benefit Plans
The Company is having defined benefit plan namely gratuity for all qualifying employees of the company.
The liability for gratuity to employees as at the balance sheet date is determined on the basis of actuarial valuation using projected Unit Credit method. The amount is funded to a Gratuity fund administered by the trustees and managed by Life Insurance Corporation of India. The liability is paid and absorbed in the statement of profit and loss at the year end.
Remeasurement, comprising actuarial gain and losses and the return on plan assets (excluding net interest), is reflected immediately in the balance sheet with a charge or credit recognised in other comprehensive income in the period in which they occur. Remeasurement recognised in other comprehensive income is reflected in retained earnings and is not reclassified to profit or loss.
The plans typically expose the company to actuarial risks such as investment risk, interest rate risk, longevity risk and salary risk.
Investment risk
Interest rate risk
Longevity risk
Salary risk
The present value of the defined benefit plan liability is calculated using the discount rate which is determined by reference to market yield at the end of the reporting period on government bonds. For other defined benefit plans, the discount rate is determined by reference to market yields at the end of the reporting period. If the return on plan asset is below this rate, it will create a plan deficit.
The present value of the defined benefit plan liability is calculated by reference to the best estimate of the mortality of plan participants both during and after their employment. An increase in the life expectance of the plan participants will increase the plan's liability.
A decrease in the bond interest rate will increase the plan liability: however, this will be partially offset by an increase in the return on the plan's investments.
The present value of the defined benefit plan liability is calculated by reference to the future salaries of plan participants. As such, an increase in the salary of the plan participants will increase the plan's liability.

NOTES FORMING PART OF THE CONSOLIDATED FINANCIAL STATEMENTS(Rs. in lakhs)
NOTES FORMING PART OF THE CONSOLIDATED FINANCIAL STATEMENTS(Rs. in lakhs)
175174
A. Gratuity
The following tables set out the funded status of the gratuity plans and the amounts recognised in the Company's financial statements as at March 31, 2018 and March 31, 2017:
(a) Change in defined benefit obligation (DBO)
As at March 31, 2018 As at March 31, 2017
377.88 335.46
32.93 30.01 - -
25.63 25.33 (23.37) (37.74)
- - (11.36) 53.74
13.19 (28.92)
Particulars
Defined benefit obligation at beginning of periodService cost a) Current service cost b) Past service cost c) (Gain) / loss on settlementsInterest expenses Benefits PaidRemeasurements a) Effect of changes in demographic assumptions b) Effect of change in financial assumptions c) Effect of experience adjustments
Defined benefit obligation at end of period 414.90 377.88
(b) Change in fair value of plan assets
Particulars As at March 31, 2018 As at March 31, 2017
Fair value of plan assets at beginning of period 244.14 275.84 Interest Income 25.74 20.80 Contributions 206.69 29.05 Benefits Paid (23.37) (37.74)Remeasurements a) Return on plan assets (excluding interest income) 38.06 (43.81)
Fair value of plan assets at end of period 491.26 244.14
( c ) Amounts recognized in the Balance Sheet
Particulars As at March 31, 2018 As at March 31, 2017
Defined benefit obligation 414.90 377.88 Fair value of plan assets (491.26) (244.14)Funded status (76.36) 133.74 Effect of asset ceiling - -
Net defined benefit liability / (asset)* (76.36) 133.74
*Included under prepayments in Note 8 - "Other current assets"
(d) Amounts recognized in the Statement of Profit and Loss
ParticularsMarch 31, 2018 March 31, 2017
Service Cost 32.93 30.01 Net interest cost - - a) Interest expense on DBO (0.11) 4.53
Net Gratuity Cost 32.82 34.54
For the year ended For the year ended
Significant actuarial assumptions for the determination of the defined obligation are discount rate, expected salary increase and mortality. The sensitivity analyses above have been determined based on reasonably possible changes of the respective assumptions occurring at the end of the reporting period, while holding all other assumptions constant.
The sensitivity analysis presented above may not be representative of the actual changes in the defined benefit obligation as it is unlikely that the change in assumptions would occur in isolation of one another as some of the assumptions may be correlated.
Furthermore, in presenting the above sensitivity analysis, the present value of the defined benefit obligation has been calculated using the projected unit credit method at the end of the reporting period, which is the same as that applied in calculating the defined benefit obligation liability recognised in the balance sheet.
(e) Amounts recognized in the Other Comprehensive Income
Particulars For the year endedMarch 31, 2018
For the year endedMarch 31, 2018
For the year ended March 31, 2017
March 31, 2017For the year ended
Remeasurement of the net defined benefit liability / (asset)
Actuarial (gains) / losses 1.83 24.81 (Return) / Loss on plan assets excluding amounts included in the net
interest on the defined benefit liability / (asset) 38.06
(43.81)
(36.23) 68.62
(f) Composition of plan assets
Particulars
Fund with an Insurance Company 491.26 244.14
(g) Significant actuarial assumptions
For the year endedMarch 31, 2018 March 31, 2017
For the year endedParticulars
Discount rate 7.50% 7.00%Salary escalation rate 7.00% 7.00%Attrition Rate 6.00% 6.00%Retirement Age 58 years 58 years
Pre-retirement mortality Indian Assured Lives Mortality
(2006-08) Ultimate
Indian Assured Lives Mortality
(2006-08) Ultimate Disability Nil Nil
The Company assesses these assumptions with its projected long-term plans of growth and prevalent industry standards. The discount rate is based on the government securities yield.
(h) Sensitivity analysis - DBO end of Period
Particulars As at March 31, 2018 As at March 31, 2017
Discount rate +100 basis points 393.38 356.91 Discount rate -100 basis points 439.17 401.51 Salary Increase Rate +1% 437.02 399.42 Salary Increase Rate -1% 394.94 358.40 Attrition Rate +1% 415.40 377.71 Attrition Rate -1% 414.32 378.04

NOTES FORMING PART OF THE CONSOLIDATED FINANCIAL STATEMENTS(Rs. in lakhs)
NOTES FORMING PART OF THE CONSOLIDATED FINANCIAL STATEMENTS(Rs. in lakhs)
177176
(i) Expected cash flows for following year
Particulars As at March 31, 2018 As at March 31, 2017
Expected employer contributions /Addl. Provision next year 89.79 50.26Expected total benefit paymentsYear 1 93.70 37.34Year 2 55.51 76.69Year 3 26.43 46.64Year 4 52.51 22.56Year 5 23.40 42.76Next 5 years 114.33 97.22
The weighted average duration of the defined benefit obligation is 10 years (March 31, 2017: 10 years)
The Company expects to make a contribution of Rs. 50.00 lakhs (as at March 31, 2017: Rs.29.69 lakhs) to the defined benefit plans during the next financial year. The employee benefit obligations(net) have been included in current liabilities based on the expected contributions.
B. Compensated Absences
(a) Charge to Statement of Profit and Loss and Liability
Charge / (credit) in the Statement of Profit and Loss 17.34 57.13
Liability as at the year end - Short- term (Refer Note 15) 94.93 91.58 - Long- term (Refer Note 15) 91.21 91.02
186.14 182.60
(b) Actuarial Assumptions
Particulars As at March 31, 2018 As at March 31, 2017
Discount Rate 7.50% p.a. 7.00% p.a. Salary Escalation Rate 7.00% p.a. 7.00% p.a.
C. Defined Contribution Plans
Particulars
Employers' Contribution to Provident Fund * 55.52 60.17 Employers’ Contribution to Superannuation Fund * 29.36 28.70
Employers’ Contribution to Employee’s State Insurance # 18.53 9.56 Employers’ Contribution to Employee’s Pension Scheme 1995 * 61.43 31.91 Employers' Contribution to Social security Fund # 1.96 1.64
For the year endedMarch 31, 2018 March 31, 2017
For the year ended
As at March 31, 2018 As at March 31, 2017
* Included in Contribution to provident and other funds# Included in staff welfare expenses
Particulars
17-18
-0.70
270.57681.06
0.56 - -
9.73
261.81 251.93 353.99
0.73 183.67
- -
--
208.54
199.34 199.34
20.08 14.76
67.11
- 13.38
16-17
2.29-
607.60 0.07
- -
11.00
381.08 218.23 396.65
6.70 41.04
- -
--
209.59
199.34 199.34
18.08 13.42
57.75
0.25 100.80
17-18
--
-- -
0.089.87
-
- - - - -
2.27-
--
-
- -
- -
-
- -
16-17 16-17 17-18 16-17
TotalJoint venturers & its subsidiaries
KMP / Director's Company
Key Management Personnel and their relatives
Purchase of Capital Goods
Wendt Gmbh - - - 2.29Carborundum Universal Limited (CUMI) - - 0.70 -Other PurchasesWendt Gmbh 425.86 - - 270.57 425.86Carborundum Universal Limited (CUMI) - - 681.06 607.60 Cumi Abrasives & Ceramics Company Ltd - - 0.56 0.07 Tespa Tools Pvt Ltd 0.60 - 0.08 0.60 Sterling Abrasives Limited 9.20 - 9.87 9.20 Net Access India Limited - - 9.73 11.00 Sale of GoodsWendt Gmbh - - 261.81 381.08 Carborundum Universal Limited (CUMI) - - 251.93 218.23 Cumi America - - 353.99 396.65 CUMI (Australia) Pty Ltd - - 0.73 6.70 Cumi Abrasives & Ceramics Company Ltd - - 183.67 41.04 Ace Designers Limited 0.22 - 2.27 0.22 Pragati Transmission P Ltd 0.38 - - 0.38Payment of RentRajesh Khanna - 7.80 8.26 7.80Preethi Khanna - 7.80 8.25 7.80 Payment of Service Fee & CommissionCarborundum Universal Limited (CUMI) - - 208.54 209.59 Payment of Dividend Carborundum Universal Limited (CUMI) - - 199.34 199.34 Wendt GmbH Germany* - - 199.34 199.34 Service Charges, Commission & Rent receiptsWendt Gmbh - - 20.08 18.08 Carborundum Universal Limited (CUMI) - - 14.76 13.42 Reimbursement of Expenses PaidCarborundum Universal Limited (CUMI) - - 67.11 57.75 Reimbursement of Expenses ReceivedWendt Gmbh - - - 0.25 Carborundum Universal Limited (CUMI) -
17-18
--
-- - - - -
- - - - - - -
8.268.25
-
- -
- -
-
- - - 13.38 100.80
1) List of Related parties
i) Venturers to the joint venture with whom transactions have taken place during the year (a) Carborundum Universal Limited (CUMI)
(1) Cumi America(2) Cumi (Australia) Pty Ltd(3) Cumi Abrasives & Ceramics Company Ltd(4) Net Access India Ltd
(b) Wendt GmbH Germany
ii) Company in which KMP / Director is a director(a) Ace Designers Ltd(b) Pragati Transmission P Ltd(c) Tespa Tools Pvt Ltd(d) Sterling Abrasives Limited
iii) Key Management PersonnelMr. Rajesh Khanna, Chief Executive
iv) Relatives of Key Management PersonnelMrs. Preethi Khanna - Wife of Mr. Rajesh Khanna
Note 34 - Related Party Disclosures
2) Transaction with related parties during the year ended March 31, 2018 and March 31, 2017 are as follows:

NOTES FORMING PART OF THE CONSOLIDATED FINANCIAL STATEMENTS(Rs. in lakhs)
NOTES FORMING PART OF THE CONSOLIDATED FINANCIAL STATEMENTS(Rs. in lakhs)
3) The details of amounts due to or due from related parties as at March 31, 2018 and March 31, 2017 are as follows:
31.03.18
67.10 53.50
144.91 -
142.82
67.19
365.41
0.54
0.73
-
-
-
3.10
31.03.18
- - - - -
-
-
-
-
-
-
1.19
-
31.03.18
- - - - -
-
-
-
-
0.65
0.64
-
-
31.03.18 31.03.17
Particulars
31.03.17
39.4946.48
124.480.24
34.49
31.72
131.69
-
-
-
-
-
1.22
31.03.17 31.03.17
Joint venturers & its
subsidiariesDirector's Company Total
Key Management
Personnel and their
relatives
Amount due From
Wendt Gmbh - - 67.10 39.49 Carborundum Universal Limited (CUMI) - - 53.50 46.48 Cumi America - - 144.91 124.48 CUMI (Australia) Pty Ltd - - - 0.24 Cumi Abrasives & Ceramics Company Ltd - - 142.82 34.49
Amount due to
Wendt Gmbh - - 67.19 31.72
Carborundum Universal Limited (CUMI) - - 365.41 131.69
Cumi America - - 0.54 -
Cumi Abrasives & Ceramics Company Ltd - - 0.73 -
Rajesh Khanna - - 0.65 -
Preethi Khanna - - 0.64 -
Sterling Abrasives Limited 0.91 - 1.19 0.91
Net Access India Limited - - 3.10 1.22
4) The details of compensation to key management personnel are as follows:
17-18 16-17
Short term benefits 97.45 89.72 Post-Employment Benefits 12.80 11.33 Other benefits 15.36 15.36
Particulars
a) The related party relationships are as identified by the Company, on the basis of information available with the Company and relied upon by the auditors.
b) No amounts in respect of related parties have been written off / back other than the amount included above during the year.
c) Key managerial personnel do not exercise significant influence over the gratuity and superannuation trust of the company.
* Amount for both the years lying in unclaimed / unpaid dividend account
Note 35 - Earning per share (EPS)
Particulars March 31, 2018 March 31, 2017
1,312.40 1,205.12
2,000,000 2,000,000
10 10
(a) Profit for the year
b) Weighted average number of equity shares
c) Nominal value of shares (in rupees) Earnings per share (in rupees) - Basic and diluted 65.62 60.26
Note 36 - Contingent Liability and commitments to the extent not provided for:36.1 Contingent Liabilities
Particulars March 31, 2018 March 31, 2017
a) Claims against the Company not acknowledged as debt: Disputed income tax demands under appeal. - 59.32
179
MOHAN DANIVAS S APartnerMembership Number : 209136
For and on behalf of the Board of DirectorsFor Price Waterhouse Chartered Accountants LLP
Firm Registration Number : 012754N/N500016
Bengaluru BengaluruApril 25, 2018 April 25, 2018
AKANKSHA BIJAWATCompany Secretary
MUKESH KUMAR HAMIRWASIAChief Financial Officer
M M MURUGAPPAN
Chairman
SHRINIVAS G SHIRGURKAR
Director
K SRINIVASANDirector
36.3 The group has a working capital limit with State Bank of India, secured by hypothecation of stock and book debts and collateral charge on all fixed assets other than land and building.
36.2 Commitments
Particulars March 31, 2018 March 31, 2017
a) Estimated amount of contracts remaining to be executed on capital account (in respect of tangible assets) and not provided for (net of advances Rs. Nil lakhs; previous year Rs.8.31 lakhs) 341.51 368.40
b) Other Commitments - -
Note 37 - Corporate Social Responsibiltiy(a) Gross amount required to be spent by the company during the year :- Rs. 32.36 lakhs (Previous Year Rs. 32.34 lakhs)
(b) Amount spent by the company during the year on :- Rs. 32.36 lakhs (Previous Year Rs. 32.34 lakhs)
Particulars In Cash
Yet to
be paid in cash Total
(i) Construction / acquisition of any asset - - -
(ii) On purposes other than (i) above - in 2017-18 26.01 6.35 32.36 - in 2016-17 28.06 4.28 32.34
Note 38 - Dislosure on Specified Bank Notes (SBN)During the year ended March 31, 2017, the Company had specified bank notes or other denomination note as defined in the MCA notification G.S.R. 308(E) dated March 31, 2017. The details of Specified Bank Notes (SBN) held and transacted during the period from November 8, 2016 to December 30, 2016, the denomination wise SBNs and other notes as per the notification is given below:
Particulars SBNs
Other denomination
notes Total
Closing balance in hand as on November 8, 2016 81,000 6,746 87,746
(+) Permitted receipts - 404,048 404,048
(-) Permitted payments 339,458 339,458
(-) Amount deposited in Bank 81,000 - 81,000
Closing cash in hand as on December 30, 2016 - 71,336 71,336
Note 39 Previous years's figures have been regrouped / reclassified to conform to the current year's presentation for the purpose of comparability.
Note 40 - Approval of financial statements
The Consolidated financial statements were approved for issue by the board of directors on April 25, 2018.
(in Rs.)
178

NOTES FORMING PART OF THE CONSOLIDATED FINANCIAL STATEMENTS(Rs. in lakhs)
180
FORM AOC-I
(Rs. in lakhs)
Pursuant to section 129 (3) of the Companies Act, 2013
Statement containing salient features of the financial statement of subsidiaries
31-3-2018 31-3-2017 31-3-2018 31-3-2017
Wendt Grinding Technologies Ltd(WGTL)
Wendt Middle East FZE(WME)
Incorporated onJuly 19, 2005
Incorporated onSeptember 24, 2008
* Total Liabilities include : Share capital of subsidiary + Non current liabilities + current liabilities + Defered tax liability (net)
** Total Assets include: Non Current Assets and Current Assets. (excluding current and non-current investments)
The exchange rates used are as below:
31-3-2018 31-3-2017 31-3-2018 31-3-2017
THB (WGTL) 2.094 1.882 1.951 1.911
AED (WME) 17.709 17.629 17.528 18.239
Currency
Balance Sheet
(Closing Rate)
Statement of Profit and Loss
(Average Rate)
Notes:
a) The Consolidated Ind AS financial statements has been prepared in accordance with the recognition and measurement principles laid down in Indian Accounting Standards, prescribed under Section 133 of the Companies Act, 2013.
b) The above information has been furnished in accordance with Section 129(3) of the Companies Act, 2013. The above statement is based on the financial statements of the respective subsidiary company which have been prepared in accordance with regulatory requirements as applicable in the country of incorporation.
Share capital 539.29 486.89 212.51 211.51
Reserves and surplus 921.90 727.83 17.63 52.31
Total liabilities * 1,746.58 1,448.63 261.66 317.78
Total assets** 1,300.24 1,052.92 261.66 317.78
Details of current and non-current investments
(except investment in subsidiary) 446.34 395.71
- -
Turnover 1,844.45 1,645.11 411.64 449.34
Profit before taxation 353.11 265.44 7.25 52.03
Provision for taxation 69.91 50.98 - -
Profit after taxation 283.20 214.46 7.25 52.03
Proposed dividend (including dividend tax) - - - -
% of Shareholding 100 100 100 100


![t ^liilipptnos - Senate of the Philippines 10707.pdf · 10707] AN ACT AMENDING PRESIDENTIAL DECREE NO. 968, OTHERWISE KNOWN AS THE “PROBATION LAW OF 1976”, AS AMENDED Be …](https://static.fdocuments.net/doc/165x107/5b812b927f8b9a7b6f8bcece/t-liilipptnos-senate-of-the-philippines-10707pdf-10707-an-act-amending.jpg)