Final Diazinon Criteria Report - State Water Resources Control Board
107
Water Quality Criteria Report for Diazinon Phase III: Application of the pesticide water quality criteria methodology Prepared for the Central Valley Regional Water Quality Control Board Amanda J. Palumbo, Ph.D., Tessa L. Fojut, Ph.D., Patti L. TenBrook, Ph.D., and Ronald S. Tjeerdema, Ph.D. Department of Environmental Toxicology University of California, Davis March 2010
Transcript of Final Diazinon Criteria Report - State Water Resources Control Board

Water Quality Criteria Report for Diazinon
Phase III: Application of the pesticide water quality criteria methodology
Prepared for the Central Valley Regional Water Quality Control Board
Amanda J. Palumbo, Ph.D., Tessa L. Fojut, Ph.D.,
Patti L. TenBrook, Ph.D., and
Ronald S. Tjeerdema, Ph.D.
Department of Environmental Toxicology University of California, Davis
March 2010
Disclaimer
Funding for this project was provided by the California Regional Water Quality Control Board, Central Valley Region (CRWQCB-CVR). The contents of this document do not necessarily reflect the views and policies of the CRWQCB-CVR, nor does mention of trade names or commercial products constitute endorsement or recommendation for use.

Water Quality Criteria Report for Diazinon
Phase III: Application of Pesticide Water Quality Criteria Methodology
Report Prepared for the Central Valley Regional Water Quality Control Board
Amanda J. Palumbo, Ph.D., Tessa L. Fojut, Ph.D.,
Patti L. TenBrook, Ph.D.*, and
Ronald S. Tjeerdema, Ph.D.
Department of Environmental Toxicology University of California, Davis
*Current affiliation: U.S. EPA Region 9, San Francisco, CA (Contents do not necessarily reflect the views or policies of the USEPA nor does mention
of trade names or commercial products constitute endorsement or recommendation for use.)
March 2010
i

Table of Contents
Title page Table of Contents List of Figures List of Tables List of acronyms and abbreviations 1. Introduction 2. Basic information 3. Physical-chemical data 4. Human and wildlife dietary values 5. Ecotoxicity data 6. Data reduction 7. Acute criterion calculation 8. Chronic criterion calculation 9. Bioavailability 10. Mixtures 11. Temperature, pH, and other water quality effects 12. Sensitive species 13. Ecosystem studies 14. Threatened and endangered species 15. Bioaccumulation 16. Harmonization with air and sediment criteria 17. Assumptions, limitations, and uncertainties 18. Comparison to national standard methods 19. Final criteria statement Acknowledgements References Data Tables Appendix A: Ecosystem data summaries Appendix B: Comparison to other criteria Appendix C: Fit Test Appendix D: Toxicity Data Summaries Appendix D1: Studies rated RR Appendix D2: Studies rated RL, LR, LL Appendix D3: Studies rated N
i ii iii iv v 1 1 2 5 5 6 7 9 9 10 11 12 13 14 15 17 17 18 19 20 21 32 A1 B1 C1 D1 D2 D71 D237
ii

List of Figures
Figure 1. Structure of diazinon Figure 2. Histogram of the natural log of the diazinon species mean acute values. Figure 3. Plot of species mean acute values for diazinon and fit of the Reciprocal Weibull distribution.
1 8 8
iii

List of Tables Table 1. Diazinon hydrolysis and photolysis. Table 2. Bioconcentration factors for diazinon. Table 3. Final acute toxicity data set for diazinon. Table 4. Acceptable acute data excluded in data reduction process. Table 5. Final chronic toxicity data set for diazinon. Table 6. Reduced acceptable chronic data for diazinon. Table 7. Calculation of the final acute-to-chronic ratio for diazinon. Table 8. Studies excluded from criteria derivation (rated RL, LR, or LL; L = less relevant or less reliable). Table 9. Synergistic interactions between diazinon and other pesticides. Table 10. Predicted LC50 values for threatened or endangered species.
3 4 33 36 37 38 39 40 57 58
iv

List of acronyms and abbreviations ACE Acute-to-Chronic Estimation ACR Acute-to-Chronic Ratio APHA American Public Health Association ASTM American Society for Testing and Materials BAF Bioaccumulation Factor BCF Bioconcentration Factor BMF Biomagnification Factor CAS Chemical Abstract Service CDFG California Department of Fish and Game CSIRO Commonwealth Scientific and Industrial Research Organization, Australia CVRWQCB Central Valley Regional Water Quality Control Board DPR Department of Pesticide Regulation ECx Concentration that affects x% of exposed organisms FACR Final Acute to Chronic Ratio FAV Final Acute Value FDA Food and Drug Administration FT Flow-through test GMAV Genus Mean Acute Value ICx Inhibition concentration; concentration causing x% inhibition ICE Interspecies Correlation Estimation IUPAC International Union of Pure and Applied Chemistry K Interaction Coefficient KH Henry’s law constant Kow Octanol-Water partition coefficient Kp or Kd Solid-Water partition coefficient LCx Concentration lethal to x% of exposed organisms LDx Dose lethal to x% of exposed organisms LL Less relevant, Less reliable study LOEC Lowest-Observed Effect Concentration LOEL Lowest-Observed Effect Level LR Less relevant, Reliable study MATC Maximum Acceptable Toxicant Concentration N Not relevant or Not reliable study n/a Not applicable NOAEL No-Observed Adverse Effect Level NOEC No-Observed Effect Concentration NR Not reported OECD Organization for Economic Co-operation and Development OP Organophosphate QSAR Quantitative Structure Activity Relationship pKa Acid dissociation constant RL Relevant, Less reliable study RR Relevant and Reliable study S Static test
v

SMACR Species Mean Acute to Chronic Ratio SMAV Species Mean Acute Value SR Static renewal test SSD Species Sensitivity Distribution TES Threatened and Endangered Species US United States USEPA United States Environmental Protection Agency
vi
1. Introduction
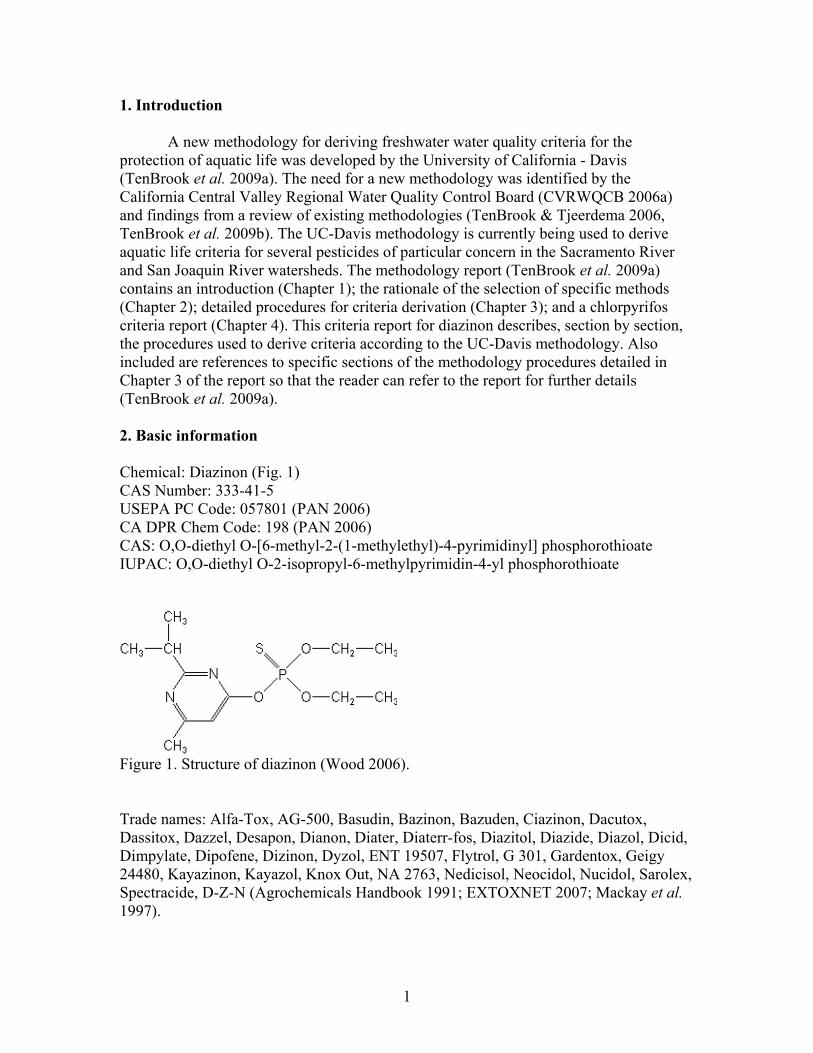
A new methodology for deriving freshwater water quality criteria for the protection of aquatic life was developed by the University of California - Davis (TenBrook et al. 2009a). The need for a new methodology was identified by the California Central Valley Regional Water Quality Control Board (CVRWQCB 2006a) and findings from a review of existing methodologies (TenBrook & Tjeerdema 2006, TenBrook et al. 2009b). The UC-Davis methodology is currently being used to derive aquatic life criteria for several pesticides of particular concern in the Sacramento River and San Joaquin River watersheds. The methodology report (TenBrook et al. 2009a) contains an introduction (Chapter 1); the rationale of the selection of specific methods (Chapter 2); detailed procedures for criteria derivation (Chapter 3); and a chlorpyrifos criteria report (Chapter 4). This criteria report for diazinon describes, section by section, the procedures used to derive criteria according to the UC-Davis methodology. Also included are references to specific sections of the methodology procedures detailed in Chapter 3 of the report so that the reader can refer to the report for further details (TenBrook et al. 2009a). 2. Basic information Chemical: Diazinon (Fig. 1) CAS Number: 333-41-5 USEPA PC Code: 057801 (PAN 2006) CA DPR Chem Code: 198 (PAN 2006) CAS: O,O-diethyl O-[6-methyl-2-(1-methylethyl)-4-pyrimidinyl] phosphorothioate IUPAC: O,O-diethyl O-2-isopropyl-6-methylpyrimidin-4-yl phosphorothioate
Figure 1. Structure of diazinon (Wood 2006). Trade names: Alfa-Tox, AG-500, Basudin, Bazinon, Bazuden, Ciazinon, Dacutox, Dassitox, Dazzel, Desapon, Dianon, Diater, Diaterr-fos, Diazitol, Diazide, Diazol, Dicid, Dimpylate, Dipofene, Dizinon, Dyzol, ENT 19507, Flytrol, G 301, Gardentox, Geigy 24480, Kayazinon, Kayazol, Knox Out, NA 2763, Nedicisol, Neocidol, Nucidol, Sarolex, Spectracide, D-Z-N (Agrochemicals Handbook 1991; EXTOXNET 2007; Mackay et al. 1997).
1

3. Physical-chemical data Molecular Weight 304.36 Mackay et al. 1997 Density1.11 g/cm3 at 20oC Worthing 1991 1.116-1.118 g/cm3 at 20oC Milne 1995; Montgomery 1993; Tomlin 2003 Water Solubility 40 mg/L at room temperature Martin & Worthing 1977 40 mg/L at 23.5-26.0oC Jarvinen & Tanner 1982 40.5 mg/L at 20-22 oC Kanazawa 1981 68.8 mg/L at 22 oC Bowman & Sans 1979; 1983b Geometric Mean: 46.0 mg/L Melting Point Liquid at room temperature Tomlin 1994 Vapor Pressure 8.2 x 10⁻⁵ mm Hg at 25oC (0.011 Pa) Kim et al. 1984 1.5 x 10 -4 mm Hg (0.02 Pa) Hinckley et al. 1990 9 x 10⁻⁵ mm Hg (0.012 Pa) Tomlin 1994 Geometric Mean: 1.0 x 10⁻⁴ mm Hg (0.014 Pa) Henry’s constant (KH) 0.011 Pa m3/mol = 4.6 x 10⁻⁶ dimensionless (wetted-wall column, Fendinger & Glotfelty 1988) 0.0119 Pa m3/mol = 4.8 x 10⁻⁶ dimensionless (mean of two values from fog chamber method, Fendinger et al. 1989) Geometric Mean: 0.0114 Pa m3/mol = 4.7 x 10⁻⁶ dimensionless Organic carbon-water (Koc) or organic matter-water (Kom) partition coefficients 132 (Kom, Briggs 1981) 250 (Kom, Sharom et al. 1980) 2049, 2247, 2087 (Koc in natural soil, TOC = 3.8-4.3 g/kg, Iglesias-Jimenez et al. 1997) 5810, 5718, 6777 (Koc in natural soil amended with humic acid, TOC = 13.6-15.4 g/kg, Iglesias-Jimenez et al. 1997) 348 (Kom, mean of 25 soils, Arienzo et al. 1994) 840 (Koc, mean of 5 soils converted from Kd values using % organic carbon data, Cooke et al. 2004) 251 (Koc; mean of 2 soils; Kanazawa 1989) Mean (weighted) Kom: 336 Mean (weighted) Koc: 2261
2

Log Kow3.79 Tsuda et al. 1997a 3.81 Bowman & Sans 1983a Use: 3.81 (recommended by Sangster Research Laboratories 2004) pKa 2.4 Ku et al. 1998 Environmental Fate
Table 1. Diazinon hydrolysis and photolysis. Half-life
(d) Water Temp
(oC) pH Reference
Hydrolysis 0.49 Buffer 20 3.1 Gomaa et al. (1969), Faust & Gomaa (1972)
6 Buffer 20 10.4 Gomaa et al. (1969), Faust & Gomaa (1972)
17 Milli-Q 40 8.0 Noblet et al. (1996) 30 Lake Superior 22.5 7.4-7.8 Jarvinen & Tanner (1982)
31 Buffer 20 5.0 Gomaa et al. (1969), Faust & Gomaa (1972)
37.2 Filtered river NR NR Medina et al. (1999) 52 Filtered river 22 7.3 Lartiges & Garrigues (1995) 69 Milli-Q 22 6.1 Lartiges & Garrigues (1995) 80 River 22 7.3 Lartiges & Garrigues (1995) 88 Milli-Q 24 8.0 Noblet et al. (1996)
136 Buffer 20 9.0 Gomaa et al. (1969), Faust & Gomaa (1972)
171 Distilled 21 7.3 Mansour et al. (1999)
185 Buffer 20 7.4 Gomaa et al. (1969), Faust & Gomaa (1972)
Aqueous photolysis 12
0 mg/L humic material 25 NR Kamiya & Kameyama (1998)
9-12 5 mg/L humic material 25 NR Kamiya & Kameyama (1998)
Photolysis plus hydrolysis 31.1 Filtered river 26-35 NR Medina et al. (1999)
3

Table 2. Bioconcentration factors (BCF) for diazinon. FT: flow-through; SR: static-renewal; S: static; values are on a wet weight basis and are not lipid normalized unless noted. Species BCF Exposure Reference Carassius aurapus 37 FT (steady-state) Tsuda et al. (1997b) Cipangopoludina malleata
5.9 FT Kanazawa (1978)
Cyprinus auratus 37 FT Kanazawa (1978) Cyprinus carpio 65 FT Kanazawa (1978) Cyprinus carpio (gallbladder)
39 FT (steady-state) Tsuda et al. (1990)
Cyprinus carpio (kidney) 131 FT (steady-state) Tsuda et al. (1990) Cyprinus carpio (liver) 60 FT (steady-state) Tsuda et al. (1990) Cyprinus carpio (muscle) 25 FT (steady-state) Tsuda et al. (1990) Gnathopogon caerulescens
248 FT (steady-state) Tsuda et al. (1989)
Indoplanorbis esustus 17 FT Kanazawa (1978) Labistes reticulates 17 FT Kanazawa (1978) Lebistes reticulates (females)
86 FT (steady-state) Tsuda et al. (1997b)
Lebistes reticulates (males)
132 FT (steady-state) Tsuda et al. (1997b)
Oryzias latipes 88 FT (steady-state) Tsuda et al. (1997b) Oryzias latipes 49 FT (steady-state) Tsuda et al. (1997b) Oryzias latipes 28 FT (steady-state) Tsuda et al. (1995a) Oryzias latipes 22 FT (steady-state) Tsuda et al. (1995a) Oryzias latipes 58 FT (steady-state) Tsuda et al. (1995b) Poecilia reticulata 224a SR Deneer et al. (1999) Poecilia reticulata 148a SR Deneer et al. (1999) Poecilia reticulata 188 SR (steady-state) Keizer et al. (1993) Poecilia reticulata 39 SR (steady-state) Keizer et al. (1991) Poecilia reticulata 46 SR (rate constant
ratio) Keizer et al. (1991)
Poecilia reticulata 59 SR (steady-state) Keizer et al. (1991) Poecilia reticulata 56 SR (rate constant
ratio) Keizer et al. (1991)
Procambarus clarkii 4.9 FT Kanazawa (1978) Pseudorasbora parva 152 FT (steady-state) Kanazawa (1978;
1981) Sarotherodon galilaeus 39 S El Arab et al. (1990) Tanichthys albonubes 36 FT (steady-state) Tsuda et al. (1997b) aCalculated from measured Kow value and lipid content of fish
4

4. Human and wildlife dietary values
There are no tolerance or FDA action levels for fish tissue (USFDA 2000). Wildlife LC50s (dietary) for animals with significant food sources in water
Two studies reporting subacute dietary LC50 (lethal feed concentration for 50% of organisms tested) values were categorized as core studies by the USEPA, which means that the studies satisfied the established USEPA guideline for use in risk assessment. Both studies were 8-d studies, with several concentrations of diazinon in the feed given to the birds for 5-d, and clean food given for the subsequent 3-d with observation. The mallard duck dietary LC50 values for these two core studies are 32 and 191 mg/kg feed (USEPA 2004). Four acute oral toxicity USEPA core studies on mallard ducks are available. These studies administered an acute single dose by oral intubation or oral gavage to determine a LD50 for mallards for pure diazinon (not in feed). The four core oral toxicity LD50 values are 1.44, 3.54, 6.38, and 6.66 mg/kg body weight (USEPA 2004). Wildlife dietary NOECs for animals with significant food sources in water
The only relevant dietary no-observed effect concentration (NOEC) for diazinon is 8.3 mg/kg feed for mallard duck reproduction (USEPA 2004). This NOEC is from a USEPA core chronic study in which diazinon was added to the breeding birds’ diet throughout the breeding cycle. Two no-observed adverse effect level (NOAEL) values for diazinon are reported for mallard ducks in USEPA core studies; a subacute dietary NOAEL of 16 mg/kg feed, and an acute oral toxicity NOAEL of 0.316 mg/kg body weight (USEPA 2004).
USEPA (2004) also states that "Among pesticides, diazinon is the cause of the
second most documented avian mortality incidents," but little information is available in this regard. Water may not be the route of exposure in these incidents. 5. Ecotoxicity data Approximately 250 original studies on the effects of diazinon on aquatic life were identified and reviewed. In the review process, many parameters are rated for documentation and acceptability for each study, including, but not limited to: organism source and care, control description and response, chemical purity, concentrations tested, water quality conditions, and statistical methods (see Tables 3.6, 3.7, 3.8 in TenBrook et al. 2009a). Single-species effects studies that were rated relevant (R) or less relevant (L) according to the method were summarized in the data summary sheets. Information in these summaries was used to evaluate each study for reliability using the rating systems described in the methodology (section 3-2.2, TenBrook et al. 2009a) to give a reliability rating of reliable (R), less reliable (L), or not reliable (N). Copies of completed summaries for all studies are included in Appendix D of this report. All data rated as acceptable (RR) or supplemental (RL, LR, LL) for criteria derivation are summarized in
5

Tables 3 – 6, found at the end of this report. Acceptable studies rated as RR are used for numeric criteria derivation, while supplemental studies rated as RL, LR or LL are used for evaluation of the criteria to check that they are protective of particularly sensitive species and threatened and endangered species. These considerations are reviewed in section 12 and 14 of this report, respectively. Studies that were rated not relevant (N) or not reliable (RN or LN) were not used in criteria derivation.
Studies conducted according to methods described by the World Health Organization (WHO 1963) were not given credit for use of an acceptable standard method. The WHO method is unacceptable by more recent standards due to such things as allowing use of deionized water as a dilution water, using 4th instar larvae (ASTM 2005 and USEPA 2000a require 2nd-3rd instars) and allowance of use of as much as 1 mL of carrier solvent per 100 mL test solution (various ASTM methods allow only 0.1 mL/L and 0.5 mL/L for chronic and acute tests, respectively).
Using the data evaluation criteria (section 3-2.2, TenBrook et al. 2009a), 22 acute toxicity studies yielding 52 toxicity values were judged reliable and relevant (RR; Tables 3 and 4). Five chronic toxicity studies yielding eight toxicity values were judged reliable and relevant (RR; Tables 5 and 6). Forty-two studies were rated RL, LR, or LL, and were used as supplemental information for evaluation of derived criteria in the Sensitive Species section 12 (Table 8).
Thirty-three mesocosm, microcosm and ecosystem (field and laboratory) studies were identified and reviewed using Table 3.9 (TenBrook et al. 2009a). Four of these studies were rated reliable (R) or less reliable (L) and were used as supporting data in section 14 to evaluate the derived criteria to ensure that they are protective of ecosystems. Ten more field studies that did not rate highly (because of the likely presence of other contaminants) were summarized in Appendix A. They were included because they focus mainly on toxicity in waterways in the California Central Valley. Other ecosystem-level studies were not summarized in summary sheets due to their complexity. Nine studies of diazinon effects on wildlife were identified and reviewed using Table 3.10 (TenBrook et al. 2009a) for consideration of bioaccumulation in section 15. 6. Data reduction Multiple toxicity values for diazinon for the same species were reduced down to one species mean acute value (SMAV) or one species mean chronic value (SMCV) according to procedures described in the methodology (section 3-2.4, TenBrook et al. 2009a). Acceptable acute and chronic data that were reduced, and the reasons for their exclusion, are shown in Tables 4 and 6, respectively. Reasons for reduction of data included: tests with measured concentrations are preferred over tests with nominal concentrations, flow-through tests are preferred over static tests, a test with a more sensitive life-stage of the same species was available, longer exposure durations are preferred, and tests with more sensitive endpoints were available. The final acute and chronic data sets are shown in Tables 3 and 5, respectively. The final acute data set contains 13 SMAVs, and the final chronic set contains five SMCVs.
6

7. Acute criterion calculation
At least five acceptable acute toxicity values were available and fulfilled the five taxa requirements of the species sensitivity distribution (SSD) procedure (section 3-3.1, TenBrook et al. 2009a). The five taxa requirements are a warm water fish, a species in the family Salmonidae, a planktonic crustacean, a benthic crustacean, and an insect. Acute values were plotted in a histogram (Figure 2); the data appears to be bimodal with invertebrates encompassing the lower subset and fish and one amphibian in the upper subset. The distribution was fit to the entire data set because according to the methodology, a data set should not be split unless the fit test indicates a lack of fit to the entire data set (section 3-3.2.4, TenBrook et al. 2009). The Burr Type III SSD procedure (section 3-3.2.1, TenBrook et al. 2009a) was used for the acute criterion calculation because more than eight acceptable acute toxicity values were available in the diazinon data set (Table 3). The Burr Type III SSD consists of a family of three related distributions; the BurrliOZ software (CSIRO 2001) displays the results for the distribution that best fits the data set based on a goodness of fit based on maximum likelihood estimation. Of the three possible distributions, the Reciprocal Weibull distribution best fit the acute diazinon data set.
The Burr Type III SSD procedure was used to derive 5th percentile values (median
and lower 95% confidence limit), as well as 1st percentile values (median and lower 95% confidence limit), as instructed in the methodology (section 3-3.2.1, TenBrook et al. 2009a). These values are reported to three significant digits as instructed by the methodology (section 3-3.2.1, TenBrook et al. 2009a). The median 5th percentile value is recommended for use in criteria derivation by the methodology because it is the most robust of the distributional estimates (section 3-3.2, TenBrook et al. 2009a). Comparing the median estimate to the lower 95% confidence limit of the 5th percentile values, it can be seen that the first significant figures of the two values are different (0.349 vs. 0.155 μg/L). Because there is uncertainty in the first significant digit, the final criterion will be reported with one significant digit (section 3-3.2.6, TenBrook et al. 2009a). Reciprocal Weibull distribution (from Burr Type III distribution) Fit parameters: alpha=2.123041; beta=0.326993. (likelihood=87.377508) 5th percentile, 50% confidence limit: 0.349 μg/L 5th percentile, 95% confidence limit: 0.155 μg/L 1st percentile, 50% confidence limit: 0.0937 μg/L 1st percentile, 95% confidence limit: 0.0392 μg/L Recommended acute value = 0.349 μg/L (median 5th percentile value) Acute criterion = acute value ÷ 2 (1)
= 0.349 μg/L ÷ 2 = 0.175 μg/L
7

Acute criterion = 0.2 μg/L
No significant lack of fit was found (X22n = 0.1561) using a fit test based on cross
validation and Fisher’s combined test (section 3-3.2.4, TenBrook et al. 2009a), indicating that the whole data set should be used for criteria derivation. The fit test calculations are shown in Appendix C. It is preferable to use as much data as possible to characterize the distribution; therefore the acute criterion was derived using the whole data set. The fit of the Reciprocal Weibull distribution to the whole acute data set is shown in Figure 3. The acute criterion of 0.2 μg/L, calculated with the median 5th percentile value is the recommended acute criterion; this value will be evaluated for protectiveness in sections 12-14 of this report.
0
0.05
0.1
0.15
0.2
0.25
0.3
0.35
0.4
-2 - 0 0 - 2 2 - 4 4 - 6 6 - 8 8 - 10
ln(acute value, μg/L)
Prob
abili
ty
Figure 2. The natural log of the diazinon SMAVs were plotted on a histogram to show the general shape of the distribution of the data. Data are split into two groups.
8

0.001
0.01
0.1
1
0.01 0.1 1 10 100 1000 10000
Concentration (μg/L)
Cum
ulat
ive
Prob
abili
ty
LC50sReciprocal WeibullAcute Criterion5th percentile1st percentile
Figure 3. Plot of acute values (SMAVs of LC50s) for diazinon and fit of the Reciprocal Weibull distribution. The graph shows the median 5th and 1st percentile values with the lower 95% confidence limits and the acute criterion at 0.2 μg/L. 8. Chronic criterion calculation
Chronic toxicity values from fewer than five different families were available, thus, the acute-to-chronic ratio (ACR) procedure was used to calculate the chronic criterion (section 3-4.2, TenBrook et al. 2009a). There are five SMCVs in the acceptable (rated RR) data set (Table 5), which satisfy three of the five taxa requirements for use of a SSD (section 3-3.1, TenBrook et al. 2009a): a species in the family Salmonidae (Salvelinus fontinalis), a warm water fish (Pimephales promelas) and a planktonic crustacean (Daphnia magna). The two missing taxa are a benthic crustacean and an insect. Three of the chronic toxicity values could be paired with an appropriate corresponding acute toxicity value in order to calculate an ACR with measured toxicity data, satisfying the three family requirements for the ACR method: a fish, an invertebrate, and another sensitive species (section 3-4.2.1, TenBrook et al. 2009a).
The species mean ACRs (SMACRs) were calculated for each of the three species by dividing the acute LC50 value by the chronic MATC value for a given species (section 3-4.2.1, TenBrook et al. 2009a). There was an increasing trend of SMACRs as the SMAVs increased. Because this trend was observed, the final multispecies ACR was calculated as the geometric mean of the ACRs for species whose SMAVs are close to the acute criterion, which includes species with SMACRs within a factor of 10 of the SMACR of the species whose SMAV is nearest the 5th percentile value (part 1, section 3-4.2.1, TenBrook et al. 2009a). For diazinon, the species with an acute value closest to the
9

calculated 5th percentile acute value is Daphnia magna (SMAV=0.52 μg/L), with a SMACR of 2.3. None of the other SMACRs are within a factor of 10 of that value; therefore the final multispecies ACR is 2.3 (part 1, section 3-4.2.1, TenBrook et al. 2009a). Data used to calculate the final multispecies ACR are shown in Table 7. Calculations of the chronic criterion are shown below using both the median and lower 95% confidence limit of the 5th percentile. The chronic criterion calculations are based on the acute 5th percentile values, and will therefore also be reported with one significant figure (see section 7 above). The chronic criterion calculated with the median 5th percentile estimate is the recommended chronic criterion because the median value is the most robust estimate; this value will be evaluated for protectiveness in sections 12-14 of this report. Chronic criterion calculated with the median 5th percentile estimate: 5th percentile, 50% confidence limit: 0.349 μg/L Chronic criterion = acute 5th percentile value ÷ ACR (2)
= 0.349 μg/L ÷ (2.3) = 0.152 μg/L
Chronic criterion = 0.2 μg/L Chronic criterion calculated with the lower 95% confidence interval of the 5th percentile estimate: 5th percentile, 95% confidence limit: 0.155 μg/L Chronic criterion = acute 5th percentile value ÷ ACR (2)
= 0.155 μg/L ÷ (2.3) = 0.0674 μg/L
Chronic criterion = 0.07 μg/L 9. Bioavailability
Few studies were identified that investigated the bioavailability of diazinon, with even fewer pertaining to bioavailability to organisms in the water column. The bioavailability of diazinon to Daphnia magna was reduced in a linear relationship with increased dissolved humic material; presumably because diazinon was binding to the dissolved humic material (Steinberg et al. 1993). With such little information regarding the toxicity of diazinon in various phases, it is not possible to determine if the bioavailability of diazinon is predictable without site-specific, species-specific data. Until such data are available, criteria compliance should be determined on a total concentration basis, as recommended in the methodology (section 3-5.1, TenBrook et al. 2009a). 10. Mixtures The effects of pesticide mixtures are evaluated and recommendations for criteria compliance determination when chemical mixtures are present are discussed according to section 3-5.2 of the methodology (TenBrook et al. 2009a). Definitions of additivity, synergism, antagonism, and non-additivity are available in the literature (Lydy and
10
Austin 2004) and more detailed descriptions of the recommended models can be found in the methodology (section 3-5.2, TenBrook et al. 2009a).
Diazinon often occurs in the environment with other organophosphate (OP) pesticides (TenBrook & Tjeerdema 2006). Bailey et al. (1997) calculated joint toxicity of diazinon and chlorpyrifos using the toxicity unit (TU) approach (see section 3-5.2.1.1, TenBrook et al. 2009a) and reported that these mixtures resulted in an average of 1.13 TUs, indicating additivity for these two compounds. Lydy and Austin (2004) also demonstrated additive toxicity for mixtures of chlorpyrifos and diazinon in acute toxicity tests with Chironomus tentans. Environmental samples collected by Hunt et al. (2003) were tested for Ceriodaphnia dubia survival, and samples that contained both chlorpyrifos and diazinon demonstrated additivity, with mean C. dubia survival of 97% when less than 1 TU of the two compounds was present, and mean survival was 34% when more than 1 TU was present. Since these two compounds have the same mode of action, concentration addition is a valid assumption; either the toxic unit or the relative potency factor approach can be used to determine compliance when both diazinon and chlorpyrifos are present (3-5.2.1, TenBrook et al. 2009a).
In a study by Laetz et al. (2009) Coho salmon (Oncorhynchus kisutch) exposed to
combinations of diazinon with malathion had synergistic, rather than additive, effects on AChE activities. Mixtures were designed to produce 50% AChE inhibition based on additive interactions, however, the pairing of diazinon (7.3 µg/L) with malathion (3.7 µg/L) produced severe AChE inhibition (> 90%). Many fish species die after high rates of acute brain AChE inhibition (> 70–90%) (Fulton and Key 2001). While mixtures of diazinon with malathion were found to have synergistic toxicity effects, the study did not provide a way to incorporate this interaction quantitatively into compliance. However, in light of the recent dramatic decline of Chinook salmon and the ban on commercial salmon fishing off the coast of California, this finding has possibly very important implications for environmentally relevant concentrations of OPs in mixtures and their toxic effects on endangered Salmonids. Diazinon toxicity was synergized by cyanazine (Lydy & Austin 2004) and atrazine (Anderson & Lydy 2002, Belden & Lydy 2000). Table 9 shows the synergistic ratios (SR) for these studies, as well as for the interaction of diazinon with ammonia. The SR is obtained by dividing the EC50 for the pesticide alone by the EC50 in the presence of a non-toxic concentration of the synergist. Thus, the SR reported in these studies is equivalent to the interaction coefficient (K), which is described in the methodology (section 2-4.2.2, TenBrook et al. 2009a). SR values > 1 indicate synergistic interaction; SR values < 1 indicate antagonistic interaction. Since multiple K values are available for atrazine over a range of concentrations, these values were used to derive a quantitative relationship. Least squares regressions of the Chironomus tentans and Hyalella azteca combined data resulted in a significant relationship between atrazine concentration and K values (p < 0.001; JMP IN v.5.1.2; JMP 2004):
11

K = 0.0095(Conc. Atrazine) + 1.05 (r2 = 0.87, p = 0.0007) To determine compliance, or to assess potential for harm, equation 3 may be used to establish the effective concentration of diazinon in the presence of atrazine: Ca =Cm (K) (3) where: Ca = adjusted, or effective, concentration of chemical of concern Cm = concentration measured for chemical of concern K = coefficient of interaction, calculated for the synergist concentration in water The effective concentration may be compared to diazinon criteria, or may be used in one of the additivity models. Less than additive (antagonistic) effects have been reported for the interaction of diazinon with copper and zinc (Banks et al. 2003, Mahar & Watzin 2005, Van Der Geest et al. 2000b), but data were not given that could be used to calculate interaction coefficients. Bailey et al. (2001) reported less than additive effects when Ceriodaphnia dubia were exposed to mixtures of ammonia and diazinon. The reduction in diazinon toxicity was moderate (K = 0.94) and was only calculable for a single ammonia concentration. Not enough data are available from these to allow derivation of a quantitative relationship between K values and antagonist concentration. Ankley & Collyard (1995) reported reduced toxicity of diazinon to Hyalella azteca and Chironomus tentans in the presence of piperonyl butoxide (PBO), but antagonistic ratios were not reported. PBO is commonly used in toxicity identification evaluations because it is known to reduce the toxic effects of OPs (Ankley et al. 1991, Hunt et al. 2003). Because no interaction coefficients have been derived to describe antagonism between diazinon and PBO, it is not possible to quantify this non-additive toxicity. Consequently, there is no way to account for this interaction in compliance determination.
OP insecticides, such as diazinon, are increasingly used in combination with pyrethroids because they can synergistically increase the effects of pyrethroids, especially where pest populations have developed resistance (Perry et al. 2007). Denton et al. (2003) demonstrated that exposure to the pyrethroid esfenvalerate and diazinon resulted in greater than additive toxicity in fathead minnow larvae. These greater than additive effects were attributed to the complementary modes of toxic action of these two insecticide classes, which act on different components of nerve impulse transmission. Again, there is insufficient data to account for this interaction for compliance determination. Interpretation of monitoring data in cases where synergists and antagonists are both present is not possible with the available models. If, for example, ammonia and a
12

pyrethroid were both present in combination with diazinon, there would be no simple way to determine an effective concentration of diazinon that accounts for both interactions. 11. Temperature, pH, and other water quality effects
Temperature, pH, and other water quality effects on the toxicity of diazinon were examined to determine if any effects are described well enough in the literature to incorporate into criteria compliance (section 3-5.3, TenBrook et al. 2009a). One study showed increased diazinon toxicity with increased temperature to Chironomus riparius (Landrum et al. 1999). However, this study was rated LL for failing to report the control response and low reliability, so it cannot be used to quantify effects of temperature on diazinon toxicity. This study also investigated the effect of pH and found no clear correlation to toxicity.
Three separate acute toxicity studies on Chironomus tentans display increased
toxicity with increased temperature. These studies resulted in LC50 values of 30, 19.1, 10.7 μg/L for tests performed at 20, 21 and 23oC, respectively (Ankley & Collyard 1995, Belden & Lydy 2000, Lydy & Austin 2004). However, these tests are not directly comparable because differences in important test parameters, such as life stage and nominal versus measured concentrations, could account for the differences in toxicity values. Among diazinon studies rated RR, there are no cases of chronic tests conducted at different temperatures with the same species. Data on other OPs show increased toxicity with increased temperature and no effect of pH in a variety of aquatic species (Baer et al. 2002, Lydy et al. 1999, Lydy et al. 1990, Patra et al. 2007). Although there is evidence of temperature effects on diazinon toxicity, there is not enough data to adequately quantify the relationship at this time. Therefore, only results of tests conducted at standard temperatures are included in the data set and temperature equations are not needed for criteria expression. 12. Sensitive species
The derived criteria are compared to toxicity values for the most sensitive species in both the acceptable (RR) and supplemental (RL, LR, LL) data sets to ensure that these species will be adequately protected (section 3-6.1, TenBrook et al. 2009a). The acute and chronic criteria calculated with the acute median 5th percentile value (both 0.2 μg/L) are below all of the toxicity values in the acute and chronic RR data sets. The lowest value in the acute RR data set is a value for Ceriodaphnia dubia of 0.21 μg/L, which is similar to the criterion (Table 3). This value for Ceriodaphnia dubia is the lowest compared to ten others used for criteria derivation (0.26, 0.29, 0.32, 0.33, 0.33, 0.35, 0.38, 0.436, 0.47, 0.507, SMAV is 0.34 μg/L). There is also a similar value in the supplemental data set of 0.25 μg/L (Norberg-King 1987, Table 8). While there is one Ceriodaphnia dubia toxicity value in the RR data set that is very close to the proposed acute criterion and several other values near the proposed acute criterion, the SMAV is the most robust toxicity value to represent a species. The Ceriodaphnia dubia SMAV is
13

based on eleven separate tests, and is therefore a more robust and reliable value than a single test value. A SMAV is calculated for use in the SSD so that no single species or single test for a species receives undue weight in the derivation process (section 2-2.7, TenBrook et al. 2009a). The goal of a SSD is to utilize the whole data set to derive protective estimates. In this case, it is not recommended that the acute criterion be adjusted downward based on one of nine toxicity values for Ceriodaphnia dubia, because the SMAV indicates that the acute criterion of 0.2 μg/L will be protective of this species. Downward adjustment of criteria can be recommended when a proposed criterion is higher than toxicity values for a sensitive species (section 3-6.1, TenBrook et al. 2009a), especially when there is very little data for a species, but it is not recommended in this case because there is ample highly rated data for Ceriodaphnia dubia.
The lowest measured chronic value in the data set rated RR is a maximum acceptable toxicant concentration (MATC) of 0.23 μg/L for Daphnia magna (Surprenant 1988a), which is just above the chronic criterion (0.2 μg/L). This is the only highly rated value for Daphnia magna or any Cladoceran species. The supplemental data set (Table 8) contains six MATC values for D. magna that are approximately equivalent to the criterion (0.16, 0.16, 0.22, 0.24, 0.24 and 0.24 μg/L; Dortland 1980, Fernández Casalderrey et al. 1995, Sánchez et al. 1998) and twelve MATC values for D. magna of 0.07 μg/L, which are below the chronic criterion (Sánchez et al. 1998, 2000). These studies did not rate highly because test parameters were not documented well, but had no obvious flaws in study design or execution. Sánchez et al. (2000) reported the concentrations incorrectly in their original report as ng/L instead of μg/L, which was confirmed via correspondence with the authors. This was a multi-generational test, which would be expected to be more sensitive than the test rated RR that only monitored reproduction in one generation (Surprenant 1988a). The only other chronic value for a Cladoceran is 0.34 μg/L for a Ceriodaphnia dubia 7-d test (Norberg King 1987), in the supplemental data set. C. dubia is the most sensitive species in the acute distribution; thus this gap in the chronic data rated RR may lead to an underprotective criterion. The supplemental data set also contains a toxicity value of 0.13 μg/L for Hyalella azteca, which is below the chronic criterion, but the endpoint in this study does not have an established connection to survival, growth, or reproduction. Highly rated chronic data are generally lacking for Cladocerans, the most sensitive taxon. There is one chronic toxicity value that was highly rated, and it is approximately the equivalent to the derived chronic criterion, while 13 supplemental values are lower, eleven of which were based on measured concentrations. There is very little data to show that the supplemental data are in error and no major problems were found with those studies (e.g., test with saltwater species, testing an endpoint not directly related to survival, growth or reproduction), aside from incorrect units and missing documentation of some parameters. Therefore, the chronic criterion, as calculated may be underprotective of Cladocerans and use of one of the lower distributional estimates for calculation of the chronic criterion is recommended. The methodology states that “if evidence suggests that the 5th percentile will not be protective, criteria may be adjusted downward,” (section 3-6.0, TenBrook et al. 2009a), based on measured data (section 3-6.1, TenBrook et al. 2009a). To make a downward adjustment, the methodology
14

recommends the use of the lower 95% confidence limit of the 5th percentile for criterion calculation, or the median or 95% confidence limit of the 1st percentile (section 3-6.0, TenBrook et al. 2009a). The use of lower 95% confidence limit of the 5th percentile to calculate the chronic criterion yields a recommended chronic criterion of 0.07 μg/L (section 8). 13. Ecosystem and other studies The derived criteria are compared to acceptable laboratory, field, or semi-field multispecies studies (rated R or L) to determine if the criteria will be protective of ecosystems (section 3-6.2, TenBrook et al. 2009a). Four studies of diazinon effects on microcosms, mesocosm and model ecosystems were rated acceptable (R or L reliability rating, using Table 3.9, TenBrook et al. 2009a). Most of these studies used formulations or mixtures of several pesticides, rather than technical diazinon. Also, for many of the studies, diazinon levels were not measured, and other water quality parameters were not reported.
In Giddings et al. (1996) diazinon was applied in a range of concentrations (2.0 - 500 μg/L) to aquatic microcosms (sediment from pond including invertebrates and plants with bluegill sunfish added). The LOEC was near the 10th percentile of single-species LC50 values, at 9.2 μg/L, and the NOEC was 4.3 μg/L (70-d averages). Cladoceran species were found to be the least tolerant, while gastropods and rotifers were the most tolerant species. Arthur et al. (1983) used three outdoor experimental channels to assess the effect of a 12 week exposure to diazinon using a low treatment of 0.3 μg/L and high treatment of 6 μg/L (nominal concentrations). Then the dose was increased for 4 weeks to higher concentrations (12 and 30 μg/L). Macroinvertebrate and insect emergence, density, drift and percent occurrence were monitored. Effects on amphipods and insects were seen in the lowest treatment with lower numbers of mayflies and damselflies emerging from treated channels. Flatworms, gastropods, isopods and chironomids were most tolerant to diazinon. Werner et al. (2004) exposed larval fish (fathead minnows, rainbow trout), waterfleas (Ceriodaphnia dubia, Simocephalus vetelus) and midge larvae (Chironomus riparius) to stormwater runoff collected in a California orchard after application of diazinon and esfenvalerate (in separate areas), following two consecutive rainstorms. Diazinon concentrations measured in orchard runoff were 277-340 µg/L (first rain storm), and 10.7-19.5 µg/L (second rain storm). All runoff was toxic to C. dubia, and toxicity to the fish and midge varied by treatment. Moore et al. (2007) investigated the role of organic matter in pesticide exposure in a constructed wetland by exposing leaf litter to 160 μg/L of diazinon. Hyalella azteca survival was affected by exposure to contaminated leaf-litter removed from the wetlands (measured diazinon residues of > 60 μg/kg). The concentrations tested in these ecosystem studies are all well above the criteria, except the study by Arthur et al. (1983) that documented effects at 0.3 μg/L, which is only slightly above the derived criteria.
Studies that did not receive an R or L reliability rating but were considered of interest are included in Appendix A. These studies implicated various levels of diazinon in effluents and run-off in California as part of the cause of toxicity to organisms. These
15

studies did not meet the criteria for ecosystem or mesocosm evaluations, primarily because other contaminants were often present and effects could not be related to diazinon with certainty. Most of the measured diazinon concentrations were also above the criteria. Given the results of the above studies, it appears that an acute criterion of 0.2 μg/L and a chronic criterion of 0.07 μg/L will be protective. However, effects were seen at 0.3 μg/L, as described above (Arthur et al. 1983), which is very close to the acute criterion. While this study is not conclusive enough to demonstrate that 0.2 μg/L will not be protective (there is no NOEC), it adds support for use of a lower chronic criterion of 0.07 μg/L, calculated from the lower confidence limit from the estimation, as discussed in sections 8 and 12.
14. Threatened and endangered species
The derived criteria are compared to measured toxicity values for threatened and endangered species (TES), as well as to predicted toxicity values for TES, to ensure that they will be protective of these species (section 3-6.3, TenBrook et al. 2009a). Current lists of state and federally listed threatened and endangered plant and animal species in California were obtained from the California Department of Fish and Game (CDFG) web site (www.dfg.ca.gov/hcpb/species/t_e_spp/tespp.shtml; CDFG 2006a, b). None of the listed animals or plants is represented in the acceptable acute or chronic data sets (rated RR). However, some of the listed species are represented in the acute data set by members of the same family or genus. For these, the USEPA interspecies correlation estimation (ICE v. 1.0; USEPA 2003) software was used to estimate toxicity values. Table 10 summarizes the results of the ICE analyses. The values in Table 10 range from 730 μg/L for Oncorhynchus mykiss (steelhead) to 2750 μg/L for Ptychocheilus lucius (Colorado squawfish), indicating that the acute criterion of 0.2 μg/L should be protective of these species.
Additionally, the supplemental data set (Table 8) contains data for endangered
species. The supplemental data set includes LC50 values for Oncorhynchus mykiss of 90-2760 μg/L. The value estimated above for O. mykiss does fall within this range. Oncorhynchus tshawytscha (Chinook salmon) is listed as federally threatened or endangered, depending on season and location. The supplemental data set contains an LC50 of 545,000 μg/L and a MATC of 70,700 μg/L for embryos of O. tshawytscha and an LC50 of 29,500 μg/L for the alevins of O. tshawytscha. Although not as reliable, these data support that the criteria is protective of these endangered salmonids. Cyprinella monacha and Notropis mekistocholae are also threatened and endangered species, although they reside in the Southwestern U.S., not in California. The criteria in this report are protective based on the reported toxicity values for these species: an IC25 of 4115 μg/L for C. monacha and 199 μg/L for N. mekistocholae. There was one algal study (the only plant value) that rated reliable and relevant for criteria derivation, but no algae species are on the state or federal endangered, threatened or rare species lists. As discussed in the chlorpyrifos criteria report of the methodology (section 4-4.0, TenBrook et al. 2009a), plants are relatively insensitive to OP insecticides, and therefore the calculated criteria should be protective.
16

Based on the available data and estimated values for animals, there is no evidence
that the calculated acute and chronic criteria will be underprotective of threatened and endangered species. However, the caveat of this assessment is that no data were found for effects of diazinon on federally endangered Cladocerans or insects, or acceptable surrogates (i.e., in the same family), which are the most sensitive species in the data sets. 15. Bioaccumulation Bioaccumulation was assessed to ensure that the derived criteria will not lead to unacceptable levels of diazinon in food items (section 3-7.1, TenBrook et al. 2009a). Diazinon has a log Kow of 3.81 (Sangster Research Laboratories 2004), and molecular weight of 304.3, which indicates its bioaccumulative potential. There are no tolerance or FDA action levels for fish tissue (USFDA 2000). Bioaccumulation of diazinon has been measured in a number of studies (Table 2).
Palacio et al. (2002) found that juvenile tilapia exposed to a concentration of diazinon 10-fold lower than the determined 96-h LC50 (3.85 mg/L) reached steady-state accumulation (28.45 mg/kg) after 7.7 d, and that after 6 d in clean water, levels decreased to 0.29 mg/kg. Sancho et al. (1993) estimated biological half-lives of 25 h and 26 h for diazinon in the liver and muscle, respectively, of the freshwater eel, Anguilla anguilla. This study also observed elimination of diazinon once the animals were placed in clean water (over 50% eliminated after 24 h).
El Arab et al. (1990) studied the bioaccumulation and excretion of 14C-labeled diazinon in perch (Sarotherodon galilaeus). In comparison with other lipophilic pesticides (e.g., DDT, lindane), the bioaccumulation factor (BAF) of diazinon was found to be lower by greater than a factor of 10, and both the compound and its metabolites were eliminated quickly (9% of bioaccumulated diazinon was left after 3 d). Kanazawa (1978) exposed seven species of freshwater organisms to 10 and 50 μg/L diazinon for 7 d, and found that the bioconcentration ratios of fishes were generally larger than those of crustaceans and gastropods, and also found that diazinon is quickly eliminated from tissues (~8 d).
Deneer et al. (1999) found the lethal body burden of diazinon in guppies to range from 1.8 - 2.1 μmol/g, and that the log-normalized bioconcentration factor (BCF) of diazinon ranged from 2.17-2.35, depending on exposure level. The study performed by Keizer et al. (1991) compared uptake in the guppy (Poecilia reticulata) to the zebra fish (Danio rerio). It was found that differences in metabolism play a pivotal role in the rate of bioaccumulation, as the LC50 values and BCF values between these two species varied greatly (0.8 mg/L and 39 in the guppy, 8 mg/L and > 300 in the zebra fish).
Three studies assessing the bioaccumulation of diazinon were performed by Tsuda et al. (1990; 1995a; 1997b). The 1990 study reported Cyprinus carpio BCF values for diazinon ranging from 20.9 - 111.1 in the muscle, liver, kidney, and gallbladder, and second-order excretion. In the 1995 study, it was reported that bioconcentration in the
17
Japanese killifish (Oryzias latipes) plateaued at 24 hr, and that when a mixture of pesticides, including diazinon, was tested, a bioconcentration plateau occurred more rapidly. The excretion rate of diazinon was found to be similar to other OP pesticides (fenthion, fenitrothion). The 1997 study looked at correlations between the BCF values of four fishes (guppy, killifish, goldfish, white cloud mountain fish) exposed to 2.1 - 2.9 μg/L diazinon (in addition to 10 other OP pesticides), and found that the BCF values of diazinon and other pesticides correlated more closely between different fishes than did the octanol-water partition coefficient (Kow). The BCF of diazinon peaked at 120 h in all fishes with the exception of the white cloud mountain fish (72 h BCF peak), and ranged from 35.7 in the white cloud mountain fish to 132 in the male guppy.
In summary, most studies found that diazinon is relatively quickly eliminated from tissues after placing organisms in clean water (3-8 d), and that steady-state is reached within a few days. BCF values varied widely amongst different species.
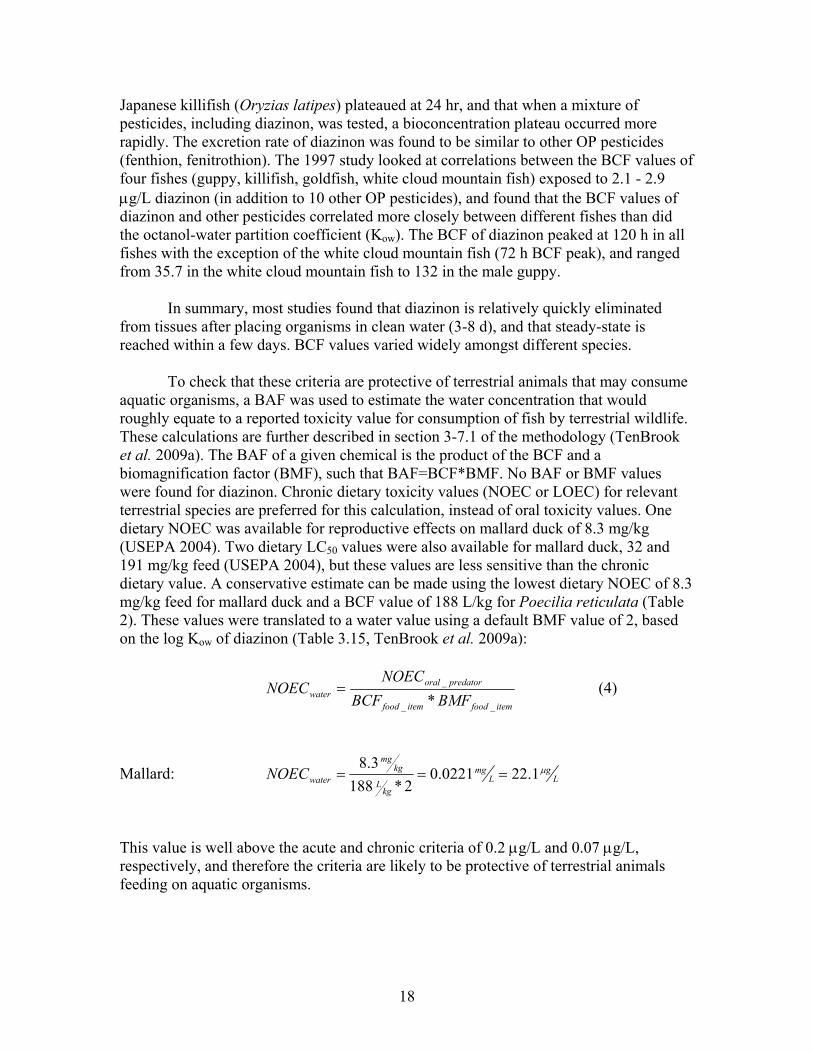
To check that these criteria are protective of terrestrial animals that may consume aquatic organisms, a BAF was used to estimate the water concentration that would roughly equate to a reported toxicity value for consumption of fish by terrestrial wildlife. These calculations are further described in section 3-7.1 of the methodology (TenBrook et al. 2009a). The BAF of a given chemical is the product of the BCF and a biomagnification factor (BMF), such that BAF=BCF*BMF. No BAF or BMF values were found for diazinon. Chronic dietary toxicity values (NOEC or LOEC) for relevant terrestrial species are preferred for this calculation, instead of oral toxicity values. One dietary NOEC was available for reproductive effects on mallard duck of 8.3 mg/kg (USEPA 2004). Two dietary LC50 values were also available for mallard duck, 32 and 191 mg/kg feed (USEPA 2004), but these values are less sensitive than the chronic dietary value. A conservative estimate can be made using the lowest dietary NOEC of 8.3 mg/kg feed for mallard duck and a BCF value of 188 L/kg for Poecilia reticulata (Table 2). These values were translated to a water value using a default BMF value of 2, based on the log Kow of diazinon (Table 3.15, TenBrook et al. 2009a):
itemfooditemfood
predatororalwater BMFBCF
NOECNOEC
__
_
*= (4)
Mallard: Lg
Lmg
kgL
kgmg
waterNOEC μ1.220221.02*188
3.8===
This value is well above the acute and chronic criteria of 0.2 μg/L and 0.07 μg/L, respectively, and therefore the criteria are likely to be protective of terrestrial animals feeding on aquatic organisms.
18

16. Harmonization with air or sediment criteria
This section addresses how the maximum allowable concentration of diazinon might impact life in other environmental compartments through partitioning (section 3-7.2, TenBrook et al. 2009a). The only available sediment criteria for diazinon is estimated based on partitioning from water using the USEPA water quality criteria (USEPA 2006a), making it useless to estimate back to a water concentration. There are no other federal or state sediment or air quality standards for diazinon (California Air Resources Board 2005, California Department of Water Resources 1995, USEPA 2006b). However, diazinon can be present in the atmosphere and transported via rain and fog. Diazinon was measured in rain (2.00-0.0013 μg/L), snow (up to 14 ng/L), and fog water (76.30-0.0013 μg/L) in the Sierra Nevada mountains, likely transported there from the California Central Valley (McConnell et al. 1998, Zabik & Seiber 1993). Diazinon has been measured in fog water at 0.1-0.3 μg/L, near Parlier, CA (Glotfelty et al. 1990) and rain in Europe at 0.1-0.3 μg/L by Scharf et al. (1992) and at 0.008-0.21 μg/L by Charizopoulos & Papadopoulou-Mourkidou (1999). Because there are no atmospheric limits for diazinon, no estimations on the partitioning from water to the atmosphere were made. 17. Assumptions, limitations, and uncertainties
The assumptions, limitations and uncertainties involved in criteria generation are available to inform environmental managers of the accuracy and confidence in criteria (section 3-8.0, TenBrook et al. 2009a). Chapter 2 of the methodology (TenBrook et al. 2009a) discusses these points for each section as different procedures were chosen, such as the list of assumptions associated with using an SSD (section 2-3.1.5.1), and reviews them in section 2-7.0. This section summarizes any data limitations that affected the procedures used to determine the final diazinon criteria. The different calculations of distributional estimates included in section 7 of this report may be used to consider the uncertainty in the resulting acute criterion. For diazinon, the major limitation was lack of data in the chronic data set. Two of five taxa requirements were not met (the benthic crustacean and insect) which precluded the use of a SSD; therefore, an ACR was used to derive the chronic criterion. Three acceptable ACRs were available, but because of the wide range of values between fish and the Cladocerans only the ACR for the Cladoceran was used (according to section 3-4.2.1, TenBrook et al. 2009a). The chronic criterion was initially derived using this one ACR and the acute median 5th percentile value to give a result of 0.2 µg/L. When comparing this criterion (0.20 µg/L) to the supplemental data set it seems that chronic effects may occur at lower concentrations (0.07 - 0.16 µg/L, section 12). This is difficult to confirm as these studies lack several quality control parameters. The few other supplemental values are only slightly higher (0.22 -0.24 µg/L). The chronic criterion was calculated with an ACR, which does not quantify uncertainty, unlike the use of a SSD. As described in the method, “criteria must be protective of aquatic life, and therefore must err on the side of conservatism when data are lacking,” (section 2-3.2.1, TenBrook et al.
19
2009a). To ensure adequate protection of Cladocerans, a lower chronic criterion of 0.07 µg/L, calculated with the lower 95% confidence limit of the acute 5th percentile estimate, is recommended.
Bimodality is apparent in this data set; however, the final data could be fit to a
Burr Type III distribution, so the data set was not split in order to use as much data as possible in criteria derivation.
Although greater than additive effects have been observed for mixtures of
pyrethroids and diazinon, there is insufficient data to account for this interaction for compliance determination. This is a significant limitation because formulations that contain both pyrethroids and diazinon are now available on the market. When additional highly rated data is available, the criteria should be recalculated to incorporate new research.
18. Comparison to national standard methods
This section is provided as a comparison between the UC-Davis methodology for criteria calculation (TenBrook et al. 2009a) and the current USEPA (1985) national standard. The following example diazinon criteria were generated using the USEPA (1985) methodology with the data set generated in this diazinon criteria report.
The USEPA acute methods have three additional taxa requirements beyond the five required by the SSD procedure of the UC-Davis methodology (section 3-3.1, TenBrook et al. 2009a). They are: 1. A third family in the phylum Chordata (e.g., fish, amphibian); 2. A family in a phylum other than Arthropoda or Chordata (e.g., Rotifera, Annelida, Mollusca); 3. A family in any order of insect or any phylum not already represented. All three of these additional requirements are met as follows: 1. The other fish/amphibian requirement is met because there is data for three warmwater fish: Jordanella floridae, Lepomis macrochirus, and Pimephales promelas. 2. This requirement is met with data from Physa spp. or Pomacea paludosa, which are mollusks. 3. This requirement is met because Chironomus tentans and Procloeon spp. are insects from different orders.
Using the log-triangular calculation (following the USEPA 1985 guidelines) and the diazinon data set from Table 3, containing thirteen SMAVs, the following acute criterion was calculated (Note: USEPA methodology uses genus mean acute values, while species mean acute values are used in this methodology and are reported in Table 3. Since there is only one species from each genus in Table 3, this final data set would be the same in both schemes.):
20

Example Final Acute Value (5th percentile value) = 0.17 μg/L
Example Acute Criterion = final acute value ÷ 2
= 0.1662 μg/L ÷ 2 = 0.08310 μg/L = 0.083 μg/L
According to the USEPA (1985) method, the criterion is rounded to two significant digits. This example acute criterion calculation is demonstrated in more detail in Appendix B. The example acute criterion is lower than the acute criterion calculated by the UCD methodology (0.2 μg/L) by approximately a factor of 2.
For the chronic criterion, the diazinon data set only has data from four species, which are not enough for use in a species sensitivity distribution by either method. The USEPA (1985) methodology contains a similar ACR procedure as the UC-Davis methodology, to be used when three acceptable ACRs are available. The same three ACR values calculated for this methodology (Table 7) were calculated according to the USEPA (1985) methodology to give a final ACR of 2.3. The chronic criterion is calculated by dividing the final acute value by the final ACR:
Example Chronic Criterion = final acute value ÷ final ACR = 0.1662 μg/L ÷ 2.3 = 0.07226 μg/L = 0.072 μg/L
The example chronic criterion is very similar to the one recommended by the UC-Davis methodology. 19. Final criteria statement The final criteria statement is: Aquatic life in the Sacramento River and San Joaquin River basins should not be affected unacceptably if the four-day average concentration of diazinon does not exceed 0.07 μg/L (70 ng/L) more than once every three years on the average and if the one-hour average concentration does not exceed 0.2 μg/L (200 ng/L) more than once every three years on the average.
Although the criteria were derived to be protective of aquatic life in the
Sacramento and San Joaquin Rivers, these criteria would be appropriate for any freshwater ecosystem in North America, unless species more sensitive than are represented by the species examined in the development of these criteria are likely to occur in those ecosystems.
The final acute criterion was derived using the Burr Type III SSD procedure
(section 7). The chronic criterion was derived by use of an ACR (section 8), and after
21

reviewing the supplemental data set, a lower value was recommended (section 12 and 17) based on the calculation with the lower 95% confidence limit estimate (sections 7 and 8). This acute criterion is slightly higher than the USEPA diazinon acute criterion of 170 ng/L (USEPA 2005); however, the difference is mostly due to rounding. The chronic value is lower than the EPA diazinon chronic freshwater criteria of 170 ng/L (USEPA 2005). The derived criteria are similar to the current acute and chronic water quality objectives of 160 and 100 ng/L, respectively, for the lower San Joaquin River (CVRWQCB 2005), which are identical to those proposed for the Sacramento and San Joaquin River Basins (CVRWQCB 2006b). The derived criteria are both higher than acute and chronic criteria of 80 and 50 ng/L, respectively, for waterways in Sacramento County (CVRWQCB 2004). These objectives are based on criteria derived by the CDFG using the USEPA (1985) methodology (Siepmann & Finlayson 2000), but with a different data set than that used by USEPA (2005).
The criteria from the different agencies are very similar overall. A detailed comparison of the diazinon criteria reports of USEPA, CDFG and this one is included in Appendix B. The small differences seem to be due to both the method used to construct the SSD and the data set used. The data that was used to calculate the acute criterion in this report were put through the USEPA log triangular calculation (USEPA 1985), as discussed in section 18, which resulted in a criterion maximum concentration (analogous to an acute criterion) of 0.083 μg/L. Fitting a Burr Type III distribution to the USEPA data set using the BurrliOZ program yielded an estimate of 0 for the 5th percentile value with 50% confidence limits. This is likely due to the bimodal distribution, which is more apparent in the USEPA data set (see Appendix B, Figure B-1). Using only the eight most sensitive genus mean acute values, a 5th percentile value of 0.41 μg/L was obtained, which yields an acute criterion of 0.21 μg/L. This value is similar to the acute criterion in this report.
To calculate the chronic criterion, all three reports used the same method, an
ACR, and fairly similar results were obtained. The analysis done for this report yielded a chronic criterion of 0.2 μg/L, which is similar to EPA's value of 0.17 μg/L. However, in light of other information, a final chronic criterion of 0.07 μg/L was recommended. The difference between the CDFG and the EPA chronic criteria is primarily due to the use of an ACR of 3 versus 2, respectively. Table B-5 (Appendix B), lists the data that was used and the reasons agencies omitted certain studies or values in calculating the ACR. Acknowledgements We thank the following reviewers: Daniel McClure (CVRWQCB), Joshua Grover (CVRWQCB), Stella McMillan (CDFG), John P. Knezovich (Lawrence Livermore National Laboratory), and Xin Deng (CDPR). This project was funded through a contract with the Central Valley Regional Water Quality Control Board of California. Mention of specific products, policies, or procedures do not represent endorsement by the Regional Board.
22

23

References Adedeji OB, Adedeji AO, Adeyemo OK, Agbede SA. 2008. Acute toxicity of diazinon to
the African catfish (Clarias gariepinus). African J Biotechnol 7(5):51-654.Agrochemicals Handbook. 1991. Agrochemicals Handbook, Third Edition. Cambridge,
UK: The Royal Society of Chemistry. Alabaster JS. 1969. Survival of fish in 164 herbicides, insecticides, fungicides, wetting
agents and miscellaneous substances. Intl Pest Cont 11:29-35. Alam MGM, Al-Arabi SAM, Halder GC, Mazid MA. 1995. Toxicity of diazinon to the
fry of Indian major carp Cirrhina mrigala (Hamilton). Bangladesh J Zool 23: 183-186.
Alam MK, Maughan OE. 1992. The effect of malathion, diazinon, and various concentrations of zinc, copper, nickel, lead, iron, and mercury on fish. Biol Trace Elem Res 34: 225-236.
Alam MK, Maughan OE. 1993. Acute toxicity of selected organophosphorus pesticides to Cyprinus carpio and Barilius vagra. J Environ Health B 28: 81-89.
Aldenberg T. 1993. ETX 1.3a. A program to calculate confidence limits for hazardous concentrations based on small samples of toxicity data. National Institute of Public Health and the Environment (RIVM), Bilthoven, The Netherlands.
Allison DT. 1977. Use of exposure units for estimating aquatic toxicity of organophosphate pesticides. EPA-600/3-77-077. Office of Research and Development, US Environmental Protection Agency, Duluth, MN.
Allison DT, Hermanutz RO. 1977. Toxicity of diazinon to brook trout and fathead minnows. EPA-600/3-77-060. Environmental Research Laboratory-Duluth, Office of Research and Development, US Environmental Protection Agency, Duluth, MN.
Anderson BG. 1959. The toxicity of organic insecticides to Daphnia. Trans 1959 Sem, Biol Probl Wat Poll. US Department of Health, Education, and Welfare, Public Health Service. pp.94-95.
Anderson BS, Phillips BM, Hunt JW, Connor V, Richard N, Tjeerdema RS. 2006. Identifying primary stressors impacting macroinvertebrates in the Salinas River (California, USA): Relative effects of pesticides and suspended particles. Environ Poll 141: 402-408.
Anderson TD, Lydy MJ. 2002. Increased toxicity to invertebrates associated with a mixture of atrazine and organophosphate insecticides. Environ Toxicol Chem 21: 1507-1514.
Anees MA. 1974. Changes in starch-gel electrophoretic pattern of serum proteins of a freshwater teleost Channa punctatus (Bloch) exposed to sublethal and chronic levels of three organophosphorus insecticides. Ceylon J Sci (Bio Sci) 11: 53-59.
Anees MA. 1976. Intestinal pathology in a freshwater teleost, Channa punctatus (Bloch) exposed to sub-lethal and chronic levels of three organophosphorus insecticides. Acta Physiologica Latino Americana 26: 67-71.
Anees MA. 1978. Hepatic pathology in a fresh-water teleost Channa punctatus (Bloch) exposed to sub-lethal and chronic levels of three organophosphorus insecticides. Bull Environ Contam Toxicol 19: 524-527.
24

Anjum F, Siddiqui MKJ. 1990. In vitro inhibition of fish (Tilapia mossambicus) brain Ca2+ -ATPase by monocrotophos, dimethoate, diazinon and DDT. Indian J Exp Biol 28: 488-489.
Ankley GT, Collyard SA. 1995. Influence of piperonyl butoxide on the toxicity of organophosphate insecticides to three species of freshwater benthic invertebrates. Comp Biochem Physiol 110C: 149-155.
Ankley GT, Dierkes JR, Jensen DA, Peterson GS. 1991. Piperonyl butoxide as a tool in aquatic toxicological research with OP insecticides. Ecotoxicol Environ Saf 21: 266–274.
Ansari BA, Aslam M, Kumar K. 1987. Diazinon toxicity: activities of acetylcholinesterase and phosphatases in the nervous tissue of zebra fish, Brachydanio rerio. Acta Hydrochim Hydrobiol 15: 301-306.
Ansari BA, Kumar K. 1988. Diazinon toxicity: effect on protein and nucleic acid metabolism in the liver of zebrafish, Brachydanio rerio (Cyprinidae). Sci Tot Environ 76: 63-68.
Applegate VC, Howell JH, Hall AE Jr, Smith MA. 1957. Toxicity of 4.346 chemicals to larval lampreys and fishes. US Fish and Wildlife Service Special Scientific Report—Fisheries No. 207. United States Department of the Interior, Washington, DC.
Arienzo M, Crisanto T, Sanchez-Martin MJ, Sanchez-Camazano M. 1994. Effect of soil characteristics on adsorption and mobility of (C-14) diazinon. J Agric Food Chem 42: 1803-1808.
Ariyoshi T, Shiiba S, Hasegawa H, Arisono K. 1990. Profile of metal-binding proteins and heme oxygenase in red carp treated with heavy metals, pesticide and surfactants. Bull Environ Contam Toxicol 44: 643-649.
Arthur JW, Zischke JA, Allen KN, Hermanutz RO. 1983. Effects of diazinon on macroinvertebrates and insect emergence in outdoor experimental channels. Aquat Toxicol 4: 283-301.
ASTM. 1980. Standard practice for conducting acute toxicity tests with fishes, macroinvertebrates, and amphibians. In Annual Book of ASTM Standards, E729-80. American Society for Testing and Materials, Philadelphia, PA.
ASTM. 2005. Standard Test Method for Measuring the Toxicity of Sediment-Associated Contaminants with Freshwater Invertebrates. American Society for Testing and Materials. E 1706-05.
Aydin R, Köprücü K. 2005. Acute toxicity of diazinon on the common carp (Cyprinus carpio L.) embryos and larvae. Pest Bioch Physiol 82: 220-225.
Baer KN, Olivier K, Pope CN. 2002. Influence of temperature and dissolved oxygen on the acute toxicity of profenofos to fathead minnows (Pimephales promelas). Drug Chem Toxicol 25: 231-245.
Bailey HC, DiGiorgia C, Kroll K, Miller JL, Hinton DE, Starrett G. 1996. Development of procedures for identifying pesticide toxicity in ambient waters: carbofuran, diazinon, chlorpyrifos. Environ Toxicol Chem 15: 837-845.
Bailey HC, Draloi R, Elphick JR, Mulhall A-M, Hunt P, Tedmanson L, Lovell A. 2000. Application of Ceriodaphnia dubia for whole effluent toxicity tests in the Hawkesbury-Nepean watershed, New South Wales, Australia: method development and validation. Environ Toxicol Chem 19: 88-93.
25
Bailey HC, Elphick JR, Drassoi R, Lovell A. 2001. Joint acute toxicity of diazinon and ammonia to Ceriodaphnia dubia. Environ Toxicol Chem 20: 2877-2882.
Bailey HC, Miller JL, Miller MJ, Wiborg LC, Deanovic L, Shed T. 1997. Joint acute toxicity of diazinon and chlorpyrifos to Ceriodaphnia dubia. Environ Toxicol Chem 16: 2304-2308.
Banks KE, Turner PK, Wood SH, Matthews C. 2005. Increased toxicity to Ceriodaphnia dubia in mixtures of atrazine and diazinon at environmentally realistic concentrations. Ecotoxicol Environ Safety 60: 28-36.
Banks KE, Wood SH, Matthews C, Thuesen KA. 2003. Joint acute toxicity of diazinon and copper to Ceriodaphnia dubia. Environ Toxicol Chem 22: 1562-1567.
Bathe R, Sachsse K, Ullmann L, Hörmann WD, Zak F, Hess R. 1975. The evaluation of fish toxicity in the laboratory. Proc Eur Soc Toxicol 16: 113-124.
Bauer NJ, Seidler RJ, Knittel MD. 1981. A simple, rapid bioassay for detecting effects of pollutants on bacteria. Bull Environ Contam Toxicol 27: 577-582.
Beauvais SL, Jones SB, Brewer SK, Little EE. 2000. Physiological measures of neurotoxicity of diazinon and malathion to larval rainbow trout (Oncorhynchus mykiss) and their correlation with behavioral measures. Environ Toxicol Chem 19: 1875-1880.
Belden JB, Lydy MJ. 2000. Impact of atrazine on organophosphate insecticide toxicity. Environ Toxicol Chem 19: 2266-2274.
Beliles RP. 1965. Diazinon Safety evaluation on fish and wildlife (bobwhite quail, goldfish, sunfish, and rainbow trout). Unpublished report by Woodard Research Corporation. Report No: 304601302. EPA MRID 00109010.
Bishop CA, Mahony NA, Struger J, Ng P, Pettit KE. 1999. Anuran development, density and diversity in relation to agricultural activity in the Holland River watershed, Ontario Canada (1990-1992). Environ Monitor Assess 57:21-43.
Bisson M, Hontela A. 2002. Cytotoxic and endocrine-disrupting potential of atrazine, diazinon, endosulfan, and mancozeb in adrenocortical steroidogenic cells of rainbow trout exposed in vitro. Toxicol Appl Pharm 180:110-117.
Bowman BT, Sans WW. 1979. The aqueous solubility of twenty-seven insecticides and related compounds. J Environ Sci Health B-Pesticides Food Contaminants and Agricultural Wastes 14:625-634.
Bowman BT, Sans WW. 1983a. Determination of octanol-water partitioning coefficients (Kow) of 61 organo-phosphorus and carbamate insecticides and their relationship to respective water solubility (S) values. J Environ Sci Health B-Pesticides Food Contaminants and Agricultural Wastes 18: 667-683.
Bowman BT, Sans WW. 1983b. Further water solubility determination of insecticidal compounds. J Environ Sci Health B-Pesticides Food Contaminants and Agricultural Wastes 18: 221-227.
Bresch H. 1991. Early life-stage test in zebrafish versus a growth test in rainbow trout to evaluate toxic effects. Bull Environ Contam Toxicol 46: 641-648.
Brewer SK, Little EE, DeLonay AJ, Beauvais SL, Jones SB, Ellersieck MR. 2001. Behavioral dysfunctions correlate to altered physiology in rainbow trout (Oncorhynchus mykiss) exposed to cholinesterase-inhibiting chemicals. Arch Environ Contam Toxicol 40: 70-76.
26

Briggs GG. 1981. Theoretical and experimental relationships between soil adsorption, octanol-water partition-coefficients, water solubilities, bioconcentration factors, and the parachor. J Agric Food Chem 29: 1050-1059.
Burbank SE, Snell TW. 1994. Rapid toxicity assessment using esterase biomarkers in Brachionus calyciflorus (Rotifera). Environ Toxicol Wat Qual 9: 171-178.
Burkepile DE, Moore MT, Holland MM. 2000. Susceptibility of five nontarget organisms to aqueous diazinon exposure. Bull Environ Contam Toxicol 64: 114-121.
Burkhard LP, Jenson JJ. 1993. Identification of ammonia, chlorine, and diazinon as toxicants in a municipal effluent. Arch Environ Contam Toxicol 25: 506-515.
Butler GL, Deason TR, O’Kelley JC. 1975b. Loss of five pesticides from cultures of twenty-one planktonic algae. Bull Environ Contam Toxicol 13:149-152.
California Air Resources Board. 2005. California Ambient Air Quality Standards. www.arb.ca.gov/research/aaqs/caaqs/caaqs.htm. Sacramento, CA.
California Department of Water Resources 1995. Compilation of sediment & soil standards, criteria & guidelines. Quality assurance technical document 7. Sacramento, CA.
Call DJ. 1993. Validation study of a protocol for testing the acute toxicity of pesticides to invertebrates using the apple snail (Pomacea paludosa).
CDFG. 1992a. Test No. 157. 96-h acute toxicity of chlorpyrifos to Ceriodaphnia dubia. California Department of Fish and Game, Elk Grove, CA.
CDFG. 1992b. Test No. 163. 96-h acute toxicity of chlorpyrifos to Ceriodaphnia dubia. California Department of Fish and Game, Elk Grove, CA.
CDFG. 1992c. Test No. 162. 96-h acute toxicity of diazinon to Neomysis mercedis, Aquatic Toxicity Laboratory, California Department of Fish and Game, Elk Grove, CA.
CDFG. 1992d. Test No. 168. 96-h acute toxicity of diazinon to Neomysis mercedis. Aquatic Toxicology Laboratory, California Department of Fish and Game, Elk Grove, CA.
CDFG. 1998a. Test No. 122. 96-h acute toxicity of diazinon to Ceriodaphnia dubia, Aquatic Toxicology Laboratory, California Department of Fish and Game, Elk Grove, California.
CDFG. 1998b. Test 132. 96-h toxicity of diazinon to Physa sp. Aquatic Toxicology Laboratory, California Department of Fish and Game, Elk Grove, California.
CDFG. 2006a. State and federally listed endangered and threatened animals of California. California Natural Diversity Database. California Department of Fish and Game, Sacramento, CA.
CDFG. 2006b. State and federally listed endangered, threatened, and rare plants of California. California Natural Diversity Database. California Department of Fish and Game, Sacramento, CA.
Cerón JJ, Ferrando MD, Sancho E, Gutierrez-Panizo C, Andreu-Moliner E. 1996a. Effects of diazinon exposure on cholinesterase activity in different tissues of European eel (Anguilla anguilla). Ecotox Environ Safety 35: 222-225.
Cerón JJ, Sancho E, Ferrando MD, Gutierrez C, Andreu E. 1996b. Metabolic effects of diazinon on the European eel Anguilla anguilla. J Environ Sci Health B 31:1029-1040.
27

Charizopoulos E, Papadopoulou-Mourkidou E. 1999. Occurrence of Pesticides in Rain of the Axios River Basin, Greece. Environ Sci Technol 33: 2363 – 2368.
Chen P-S, Lin Y-N, Chung C-L. 1971. Laboratory studies on the susceptibility of mosquito-eating fish, Lebistes reticulatus, and the larvae of Culex pipiens fatigans to insecticides. JFMA 70: 28-35.
Christensen GM, Tucker JH. 1976. Effects of selected water toxicants on the in vitro activity of fish carbonic anhydrase. Chem-Biol Interactions 13: 181-192.
Chu KH, Lau PY. 1994. Effects of diazinon, malathion, and paraquat on the behavioral response of the shrimp Metapenaeus ensis to chemoattractants. Bull Environ Contam Toxicol 53: 127-133.
Clegg TJ, Koevenig JL. 1974. The effect of four chlorinated hydrocarbon pesticides and one organophosphate pesticide on ATP levels in three species of photosynthesizing freshwater algae. Botanical Gazette 135:368-372.
Collyard SA, Ankley GT, Hoke RA, Goldenstein T. 1994. Influence of age on the relative sensitivity of Hyalella azteca to diazinon, alkylphenol ethoxylates, copper, cadmium, and zinc. Arch Environ Contam Toxicol 26: 110-113.
Conners DE, Black MC. 2004. Evaluation of lethality and genotoxicity in the freshwater mussel Utterbackia imbecillis (Bivalvia: Unionidae) exposed singly and in combination to chemicals used in lawn care. Arch Environ Contam Toxicol 46: 362-371.
Cooke CM, Shaw G, Lester JN, Collins CD. 2004. Determination of solid-liquid partition coefficients (K-d) for diazinon, propetamphos and cis-permethrin: implications for sheep dip disposal. Sci Total Environ 329: 197-213.
Cope OB. 1965. Sport fishery investigations. Effects of pesticides on fish and wildlife; 1964 research findings of the Fish and Wildlife Service. Circular No. 226. pp 51-63.
CSIRO. 2001. BurrliOZ v. 1.0.13. Commonwealth Scientific and Industrial Research Organization, Australia. Available at http://www.cmis.csiro.au/Envir/burrlioz/.
Curtis C, Lima A, Lozano SJ, Veith GD. Evaluation of a bacterial bioluminescence bioassay as a method for predicting acute toxicity of organic chemicals to fish. Aquatic Toxicology and Hazard Assessment: Fifth Conference. ASTM STP 766. Pearson JG, Foster RB, Bishop WE, eds. American Society for Testing and Materials. pp. 170-178.
CVRWQCB. 2004. Total maximum daily load (TMDL) report for the pesticides diazinon and chlorpyrifos in: Arcade Creek, Elder Creek, Elk Grove Creek, Morrison Creek, Chicken Ranch Slough, and Strong Ranch Slough Sacramento County, CA. Central Valley Regional Water Quality Control Board, California Environmental Protection Agency. Rancho Cordova, CA.
CVRWQCB. 2005. Amendments to the Water Quality Control Plan for the Sacramento River and San Joaquin River Basins for the Control of Diazinon and Chlorpyrifos Runoff in the Lower San Joaquin River, Final Staff Report. Central Valley Regional Water Quality Control Board, State Water Resources Control Board, California Environmental Protection Agency. Rancho Cordova, CA.
CVRWQCB. 2006a. Sacramento and San Joaquin River Watersheds Pesticide Basin Plan Amendment Fact Sheet. Central Valley Regional Water Quality Control Board, Rancho Cordova, CA
28

CVRWQCB. 2006b. Amendments to the Water Quality Control Plan for the Sacramento River and San Joaquin River Basins for the Control of Diazinon and Chlorpyrifos Runoff into the Sacramento-San Joaquin Delta. Central Valley Regional Water Quality Control Board, State Water Resources Control Board, California Environmental Protection Agency. Rancho Cordova, CA.
Dembélé K, Haubruge E, Gaspar C. 2000. Concentration effects of selected insecticides on brain acetylcholinesterase in the common carp (Cyprinus carpio L.). Ecotox Environ Safety 45: 49-54.
Deneer JW, Budde BJ, Weijers A. 1999. Variations in the lethal body burdens of organophosphorus compounds in the guppy. Chemosphere 38: 1671-1683.
Dennis WH Jr, Meier EP, Randall WF, Rosencrance AB, Rosenblatt DH. 1979. Degradation of diazinon by sodium hypochlorite. Chemistry and aquatic toxicity. Environ Sci Technol 13: 594-598.
Dennis WH Jr, Rosencrance AB, Randall WF, Meier EP. 1980. Acid hydrolysis of military formulations of diazinon. J Environ Sci Health B 15: 47-60.
Denton D, Wheelock C, Murray S, Deanovic L, Hammock B, Hinton D. 2003. Joint acute toxicity of esfenvalerate and diazinon to larval fathead minnows (Pimephales promelas). Environ Toxicol Chem 22: 336-341.
Devillers J, Neunier T, Chambon P. 1985. Usefulness of the dosage- effect-time relation in ecotoxicology for determination of different chemical classes of toxicants. Techniques et Sciences Municipales 80: 329-334 (in French with English abstract)
Doggett SM, Rhodes RG. 1991. Effects of a diazinon formulation on unialgal growth rates and phytoplankton diversity. Bull Environ Contam Toxicol 47: 36-42.
Dortland RJ. 1980. Toxicological evaluation of parathion and azinphosmethyl in freshwater model ecosystems. Agric Res Rep (Versl. Landbouwk. Onderz.) 898, Center for Agricultural Publishing and Documentation, Wageningen, the Netherlands.
Durmaz H, Sevgiler Y, Üner N. 2006. Tissue-specific antioxidative and neurotoxic responses to diazinon in Oreochromis niloticus. Pest Bioch Physiol 84: 215-226.
Dutt N, Guha RS. 1988. Toxicity of few organophosphorus insecticides to fingerlings of bound water fishes, Cyprinus carpio (Linn.) and Tilapia mossambicus Peters. Indian J Entomol 50: 403-421.
Dutta H, Marcelino J, Richmonds C. 1992. Brain acetylcholinesterase activity and optomotor behavior in bluegills, Lepomis macrochirus, exposed to different concentrations of diazinon. Arch Intl Physiol Biochim Biophy 100: 331-334.
Dutta HM, Maxwell LB. 2003. Histological examination of sublethal effects of diazinon on ovary of bluegill, Lepomis macrochirus. Environ Poll 121: 95-102.
Dutta HM, Meijer HJM. 2003. Sublethal effects of diazinon on the structure of the testis of bluegill, Lepomis macrochirus: a microscopic analysis. Environ Poll 125: 355-360.
Dutta HM, Munshi JSD, Roy PK, Singh NK, Motz L, Adhikari S. 1997. Effects of diazinon on bluegill sunfish, Lepomis macrochirus, gills: scanning electron microscope observations. Exp Biol Online 2:17.
Dutta HM, Qadri N, Ojha J, Singh K, Adhikari S, Datat Munshi JS, Roy PK. 1997. Effect of diazinon on macrophages of bluegill sunfish, Lepomis macrochirus: a cytochemical evaluation. Bull Environ Contam Toxicol 58: 135-141.
29

Dutta HM, Richmonds CR, Zeno T. 1993. Effects of diazinon on the gills of bluegill sunfish Lepomis macrochirus. J Environ Path Toxicol Oncol 12: 219-227.
Dwyer FJ, Hardesty DK, Ingersoll CG, Whites DW, Augspurger T, Canfield TJ, Mount DR, Mayer FL. 2005. Assessing contaminant sensitivity of endangered and threatened aquatic species: Part III. Effluent toxicity tests. Arch Environ Contam Toxicol 48: 174-183.
Dyer SK, Dickson KL, Zimmerman EG. 1993. A laboratory evaluation of the use of stress proteins in fish to detect changes in water quality. Environmental Toxicology and Risk Assessment, ASTM STP 1179, Landis WG, Hughes JS, Lewis MA, eds. American Society for Testing and Materials, Philadelphia, PA. pp. 247-261.
Ebere AG, Akintonwa A. 1992. Acute toxicity of pesticides to Gobius sp., Palaemonetes africanus, and Desmocaris trispimosa. Bull Environ Contam Toxicol 49: 588-592.
El Arab AE, Attar A, Ballhorn L, Freitag D, Korte F. 1990. Behavior of diazinon in a perch species. Chemosphere 21: 193-199.
Evtugyn GA, Rizaeva EP, Stoikova EE, Latipova VZ, Budnikov HC.1997. The application of cholinesterase potentiometric biosensor for preliminary screening of the toxicity of waste waters. Electroanalysis 9: 1124-1128.
EXTOXNET. 2007. Pesticide profile diazinon.http://extoxnet.orst.edu/. Faust SD, Gomaa HM. 1972. Chemical Hydrolysis of Some Organic Phosphorus and
Carbamate Pesticides in Aquatic Environments. Environ Lett 3: 171. Federle PF, Collins WJ. 1976. Insecticide toxicity to three insects from Ohio ponds. Ohio
J Sci 76: 19-24. Fendinger NJ, Glotfelty DE. 1988. A laboratory method for the experimental
determination of air-water Henrys law constants for several pesticides. Environ Sci Technol 22: 1289-1293.
Fendinger NJ, Glotfelty DE, Freeman HP. 1989. Comparison of 2 experimental techniques for determining air-water Henry law constants. Environ Sci Technol 23: 1528-1531.
Fernández-Casalderrey A, Ferrando MD, Andreu-Moliner E. 1992a. Acute toxicity of several pesticides to rotifer (Brachionus calyciflorus). Bull Environ Contam Toxicol 48: 14-17.
Fernández-Casalderrey A, Ferrando MD, Andreu-Moliner E. 1992b. Effect of sublethal diazinon concentrations on the demographic parameters of Brachionus calyciflorus Pallas (Rotifera). Bull Environ Contam Toxicol 48: 202-208.
Fernández-Casalderrey A, Ferrando MD, Andreu-Moliner E. 1992c. Filtration and ingestion rates of Brachionus calyciflorus after exposure to endosulfan and diazinon. Comp Biochem Physiol 103C: 357-361.
Fernández-Casalderrey A, Ferrando MD, Andreu-Moliner E. 1995. Chronic toxicity of diazinon to Daphnia magna: effects on survival, reproduction, and growth. Toxicol Environ Chem 49: 25-32.
Ferrando MD, Sancho E, Andreu-Moliner E. 1991. Comparative acute toxicities of selected pesticides to Anguilla anguilla. J Environ Sci Health B 26: 491-498.
Fort DJ, Stover EL, Burks SL, Atherton RA, Blankemeyer JT. 1996. Utilizing biomarker techniques: cellular membrane potential as a biomarker of subchronic toxicity. Environmental Toxicology and Risk Assessment: Biomarkers and Risk
30

Assessment—Fifth Volume, ASMT STP 1306, Bengtson DA, Henshel DS, eds. American Society for Testing and Materials. pp. 177-187.
Fredeen. 1972. Reactions of the larvae of three rheophilic species of Trichoptera to selected insecticides. Can Ent 104: 945-953.
Fulton MH, Key PB. 2001. Acetylcholinesterase inhibition in estuarine fish and invertebrates as an indicator of organophosphorus insecticide exposure and effects. Environ Toxicol Chem 20:37-45.
Geiger DL, Call DJ, Brooke LT. 1988. Acute toxicities of organic chemicals to fathead minnows (Pimephales promelas). Center for Lake Superior Environmental Studies, University of Wisconsin-Superior. 279-280.
Giddings JM, Biever RC, Annuziato MF, Hosmer AJ. 1996. Effects of diazinon on large outdoor pond microcosms. Environ Toxicol Chem 15: 618-629.
Glotfelty DE, Majewski MS, Seiber JN. 1990. Environ Sci Technol 24: 353-357. Goodman LR, Hansen DJ, Coppage DL, Moore JC, Matthews E. 1979. Diazinon®:
chronic toxicity to, and brain acetylcholinesterase inhibition in, the sheepshead minnow, Cyprinodon variegatus. Trans Am Fish Soc 108: 479-488.
Gomaa HM, Suffet IH, Faust SD. 1969. Kinetics of hydrolysis of diazinon and diazoxon. Residue Review 29: 171-190.
Grade R. (Ciba-Geigy) 1993. Acute toxicity of Rainbow Trout to Diazinon. Ciba-Geigy Test No. 938004. EPA MRID 46364312.
Hall LW Jr, Anderson RD. 2005. Acute toxicity of diazinon to the amphipod, Gammarus pseudolimnaeus: implications for water quality criteria. Bull Environ Contam Toxicol 74: 94-99.
Hamm JT, Hinton DE. 2000. The role of development and duration of exposure to the embryotoxicity of diazinon. Aquat Toxicol 48: 403-418.
Hamm JT, Wilson BW, Hinton DE. 1998. Organophosphate-induced acetylcholinesterase inhibition and embryonic retinal cell necrosis in vivo in teleost (Oryzias latipes). Neurotoxicol 19: 853-870.
Hamm JT, Wilson BW, Hinton DE. 2001. Increasing uptake and bioactivation with development positively modulate diazinon toxicity in early life stage medaka (Oryzias latipes). Toxicol Sci 61: 304-313.
Hanazato T. 1991. Pesticides as chemical agents inducing helmet formation in Daphnia ambigua. Freshwater Biology 26: 419-424.
Harris ML, Bishop CA, Struger J, Ripley B, Bogart JP. 1998. The functional integrity of northern leopard frog (Rana pipiens) and green frog (Rana clamitans) populations in orchard wetlands. II. Effects of pesticides and eutrophic conditions on early life stage development. Environ Toxicol Chem 17: 1351-1363.
Hashimoto Y, Nishiuchi Y. 1981. Establishment of bioassay methods for the evaluation of acute toxicity of pesticides to aquatic organisms. J Pest Sci 6: 257-264.
Hashimoto Y, Okubo E, Ito T, Yamaguchi M, Tanaka S. 1982. Changes in susceptibility of carp to several pesticides with growth. J Pesticide Sci 7: 457-461.
Hidaka H, Hattanda M, Tatsukawa R. 1984. Avoidance of pesticides with medakas (Oryzias latipes). Nippon Nogeikagaku Kaishi 58: 145-151.
Hilsenhoff WH. 1959. The evaluation of insecticides of the control of Tendipes plumosus (Linnaeus). J Econ Entom 52: 331-332.
31

Hiltibran RC. 1974. Oxygen and phosphate metabolism of bluegill liver mitochondria in the presence of some insecticides. Trans Ill State Acad Sci 67: 228-237.
Hiltibran RC. 1982. Effects of insecticides on the metal-activated hydrolysis of adenosine triphosphate by bluegill liver mitochondria. Arch Environ Contam Toxicol 11:709-717.
Hinckley DA, Bidleman TF, Foreman WT, Tuschall JR. 1990. Determination of vapor-pressures for nonpolar and semipolar organic-compounds from gas-chromatographic retention data. J Chem Eng Data 35: 232-237.
Hirayama K, Tamonoi S. 1980. Acute toxicity of MEP and diazinon (pesticide) to larvae of Kuruma prawn Penaeus japonicus and of swimming crab Portunus trituberculatus. Bulletin of the Japanese Society of Scientific Fisheries 46: 117-123.
Hogan JW, Knowles CO. 1972. Metabolism of diazinon by fish liver microsomes. Bull Environ Contam Toxicol 8: 61-64.
Hong LCD, Becker-Van Slooten K, Tarradellas J. 2004. Tropical ecotoxicity testing with Ceriodaphnia cornuta. Environ Toxicol 19:497-504.
Hughes JS. 1988. Toxicity of Diazinon Technical to Selenastrum capricornutum. CIBA-GEIGY Lab Sty N. 0267 – 40-1100-1. EPA MRID 40509806.
Hunt JW, Anderson BS, Phillips BM, Nicely PN, Tjeerdema RS, Puckett HM, Stephenson M, Worcester K, De Vlaming V. 2003. Ambient toxicity due to chlorpyrifos and diazinon in a central California coastal watershed. Environ Monit Assess 82: 83-112.
Iglesias-Jimenez E, Poveda E, Sanchez-Martin MJ, Sanchez-Camazano M. 1997. Effect of the nature of exogenous organic matter on pesticide sorption by the soil. Arch Environ Contam Toxicol 33: 117-124.
Jamnback H, Frempong-Boadu J. 1966. Testing blackfly larvicides in the laboratory and in streams. Bull Wld Hlth Org 34: 405-421.
Jarvinen AW, Tanner DK. 1982. Toxicity of selected controlled release and corresponding unformulated technical grade pesticides to the fathead minnow Pimephales promelas. Environ Pollut Series A-Ecological and Biological 27: 179-195.
JMP. 2004. Statistical discovery software. JMP IN v. 5.1.2. SAS Institute, Inc., Cary, NC, USA.
Johnson WW, Finley MT. 1980. Handbook of Acute Toxicity of Chemicals to Fish and Aquatic Invertebrates. Resource Publication 137. U.S. Fish and Wildlife Service, Washington, DC.
Juchelka CM, Snell TW. 1994. Rapid toxicity assessment using rotifer ingestion rate. Arch Environ Contam Toxicol 26: 549-554.
Jun BH, Lee SI, Ryu HD, Kim YJ. 2006. Temperature-based rapid toxicity test using Ceriodaphnia dubia. Wat Sci Tech 53: 347-355.
Kamiya M, Kameyama K. 1998. Photochemical effects of humic substances on the degradation of organophosphorus pesticides. Chemosphere 36: 2337-2344.
Kanazawa J. 1978. Bioconcentration ratio of diazinon by freshwater fish and snail. Bull Environ Contam Toxicol 20: 613-617.
32

Kanazawa J. 1981. Measurement of the bioconcentration factors of pesticides by fresh-water fish and their correlation with physiochemical properties or acute toxicities. Pestic Sci 12: 417-424.
Kanazawa J. 1989. Relationship between the soil sorption constants for pesticides and their physicochemical properties. Environ Toxicol Chem 8: 477-484.
Kaur K, Toor HS. 1980. Role of abiotic factors in the embryonic development of scale carp. Proc. Indian Natl Sci Acad 46B: 136-148.
Keizer J, Dagostino G, Nagel R, Gramenzi F, Vittozzi L. 1993. Comparative diazinon toxicity in guppy and zebra fish - different role of oxidative-metabolism. Environ Toxicol Chem 12: 1243-1250.
Keizer J, Dagostino G, Vittozzi L. 1991. The importance of biotransformation in the toxicity of xenobiotics to fish. 1. Toxicity and bioaccumulation of diazinon in guppy (Poecilia reticulata) and zebra fish (Brachydanio rerio). Aquat Toxicol 21: 239-254.
Khalaf-Allah SS. 1999. Effect of pesticide water pollution on some haematological, biochemical and immunological parameters in Tilapia nilotica fish. Dtsch. Tiereärztl. Wschr 106: 67-71.
Khoshbavar-Rostami HA, Soltani M, Hassan HMD. 2006. Immune response of great sturgeon (Huso huso) subjected to long-term exposure to sublethal concentration of the organophosphate, diazinon. Aquaculture 256: 88-94.
Kikuchi M, Miyagaki T, Wakabayashi M. 1996. Evaluation of pesticides used in golf links by acute toxicity test on rainbow trout. Nippon Suisan Gakkaishi 62: 414-419.
Kikuchi M, Sasaki Y, Wakabayashi M. 2000. Screening of organophosphate insecticide pollution in water by using Daphnia magna. Ecotox Environ Safety 47: 239-245.
Kim YH, Woodrow JE, Seiber JN. 1984. Evaluation of a gas-chromatographic method for calculating vapor-pressures with organo-phosphorus pesticides. J Chromatog 314: 37-53.
Klassen W, Keppler WJ, Kitzmiller JB. 1965. Toxicities of certain larvicides to resistant and susceptible Aedes aegypti (L.). Bull Wld Hlth Org 33: 117-122.
Kok LT. 1972. Toxicity of insecticides used for Asiatic rice borer control to tropical fish in rice paddies. In: The Careless Technology: Ecology and International Development. Farvar MT, Milton JP, eds. The Natural History Press, Garden City, NY. pp. 489-498.
Koprucu, SS, Koprucu K, Ural MS, Ispir U, Pala M. 2006. Acute toxicity of organophosphorus pesticide diazinon and its effects on behavior and some hematological parameters of fingerling European catfish (Silurus glanis L.), Pestic Biochem Physiol 86: 99–105.
Kraus MP. 1985. Cyanophage assay as a new concept in the study of environmental toxicity. Aquatic Toxicology and Hazard Assessment: Seventh Symposium, ASTM STP 854. Cardwell RD, Purdy R, Bahner RC, eds. American Society for Testing and Materials. pp. 27-41.
Ku Y, Chang JL, Cheng SC. 1998. Effect of solution pH on the hydrolysis and photolysis of diazinon in aqueous solution. Wat Air Soil Pollut 108: 445-456.
Laetz CA, Baldwin DH, Collier TK, Hebert V, Stark JD, Scholz NL. 2009. The synergistic toxicity of pesticide mixtures: Implications for risk assessment and the
33

conservation of endangered Pacific salmon. Environ Health Perspect 117:348-353.
Landrum PF, Fisher SW, Hwang H. 1999. Hazard evaluation of ten organophosphorus insecticides against the midge, Chironomus riparius via QSAR. SAR and QSAR in Environ Res 10: 423-450.
Lartiges SB, Garrigues PP. 1995. Degradation Kinetics of Organophosphorus and Organonitrogen Pesticides in Different Waters under Various Environmental-Conditions. Environ Sci Technol 29: 1246-1254.
LeBrecque GC, Noe JR, Gahan JB. 1956. Effectiveness f insecticides on granular clay carriers against mosquito larvae. Mosq News 16: 1-3.
Lee SK, Freitag D, Steinberg C, Kettrup A, Kim YH. 1993. Effects of dissolved humic materials on acute toxicity of some organic chemicals to aquatic organisms. Wat Res 27: 199-204.
Lower N, Moore A. 2003. Exposure to insecticides inhibits embryo development and emergence in Atlantic salmon (Salmo saloa L.). Fish Physiol Biochem 28: 431-432.
Luskova V, Svoboda M, Kolarova J. 2002. The effect of diazinon on blood plasma biochemistry in carp (Cyprinus carpio L.). Acta Vet Brno 71: 117-123.
Lydy MJ, Austin KR. 2004. Toxicity assessment of pesticide mixtures typical of the Sacramento-San Joaquin Delta using Chironomus tentans. Arch Environ Contam Toxicol 48: 49-55.
Lydy MJ, Belden JB, Ternes MA. 1999. Effects of temperature on the toxicity of M-parathion, chlorpyrifos, and pentachlorobenzene to Chironomus tentans. Arch Environ Contam Toxicol 37: 542-547.
Lydy MJ, Lohner TW, Fisher SW. 1990. Influence of pH, temperature and sediment type on the toxicity, accumulation and degradation of parathion in aquatic systems. Aquat Toxicol 17: 27-44.
Macek KJ. 1975. Acute toxicity of pesticide mixtures to bluegills. Bull Environ Contam Toxicol 14: 648-652.
Macek KJ, Hutchinson C, Cope OB. 1969. The effects of temperature on the susceptibility of bluegills and rainbow trout to selected pesticides. Bull Environ Contam Toxicol 4(3): 174-183.
Mackay D, Shiu WY, Ma KC. 1997. Illustrated Handbook of Physical-Chemical Properties and Environmental Fate for Organic Chemicals, Volume V, Pesticide Chemicals. New York: CRC Press, Lewis Publishers.
Mahar AM, Watzin MC. 2005. Effects of metal and organophosphate mixtures on Ceriodaphnia dubia survival and reproduction. Environ Toxicol Chem 24: 1579-1586.
Malone CR, Blaylock BG. 1970. Toxicity of insecticide formulation to carp embryos reared in vitro. J Wildlife Management 34: 460-463.
Mansour M, Feicht EA, Behechti A, Schramm KW, Kettrup A. 1999. Determination photostability of selected agrochemicals in water and soil. Chemosphere 39: 575-585.
Marciall HS, Hagiwara A, Snell TW. 2005. Effect of some pesticides on reproduction of rotifer Brachionus plicatilis Müller. Hydrobiologia 546: 569-575.
34

Martin H, Worthing CR, ed. 1977. The Pesticide Manual, 5th Edition, a World Compendium. Thornton Heath, UK: The British Crop Protection Council.
Matsuo K, Tamura T. 1970. Laboratory experiments on the effect of insecticides against blackfly larvae (Diptera: Simuliidae) and fishes. Botyu-Kagaku 35: 125-130.
Maxwell LB, Dutta HM. 2005. Diazinon-induced endocrine disruption in bluegill sunfish, Lepomis macrochirus. Ecotox Environ Safety 60: 21-27.
Mayer FL, Ellersieck MR. 1986. Manual of acute toxicity: interpretation and data base for 410 chemicals and 66 species of freshwater animals. United States Department of the Interior. Fish and Wildlife Service Resource Publication 160.
McConnell LL, Lenoir JS, Datta S, Seiber JN. 1998. Wet deposition of current-use pesticides in the Sierra Nevada mountain range, California, USA. Environ Toxicol Chem 17: 1908-1916.
Medina D, Prieto A, Ettiene G, Buscema I, de V AA. 1999. Persistence of organophosphorus pesticide residues in Limon River waters. Bull Environ Contam Toxicol 63: 39-44.
Meier EP, Dennis WH, Rosencrance AB, Randall WF, Cooper WJ, Warner MC. 1979. Sulfotepp, a toxic impurity in formulations of diazinon. Bull Environ Toxicol Chem 23: 158-164.
Milne GWA. 1995. CRC Handbook of Pesticides. Boca Raton, FL: CRC Press. Mitsuhashi J, Grace TDC, Waterhouse DF. 1970. Effects of insecticides on cultures of
insect cells. Entomol Exp Appl 13:327-341. Montgomery JH. 1993. Agrochemicals Desk Reference: Environmental Data. Chelsea,
MI: Lewis Publishers. Moore MT, Lizotte Jr RE, Smith Jr S. 2007. Toxicity evaluation of diazinon
contaminated leaf litter. Bull Environ Contam Toxicol 78: 158-161. Moore A, Waring CP. 1996. Sublethal effects of the pesticide diazinon on olfactory
function in mature male Atlantic salmon parr. J Fish Biol 48: 758-775. Muirhead-Thomson RC, Merryweather J. 1970. Ovicides in Simulium control. Bull Wld
Hlth Org 42: 174-177. Mulla MS, Isaak LW, Axelrod H. 1963. Field studies of the effects of insecticides on
some aquatic wildlife species. J Econ Entom 56: 184-188. Murray HE, Guthrie RK. 1980. Effects of carbaryl, diazinon, and malathion on native
aquatic populations of microorganisms. Bull Environ Contam Toxicol 24: 535-542.
Mustafa M, Anjum F, Qadri SSH. 1982. A technique to evaluate acute toxicity of insecticide (technical and formulation) to freshwater fish, Tilapia mossambicus. Int Pest Control 24, 90.
Nishiuki Y, Hashimoto Y. 1967. Toxicity of pesticide ingredients to some fresh water organisms. Botyu-Kagaku 32: 5-11.
Noblet JA, Smith LA, Suffet IH. 1996. Influence of natural dissolved organic matter, temperature, and mixing on the abiotic hydrolysis of triazine and organophosphate pesticides. J Agric Food Chem 44: 3685-3693.
Norberg-King, TJ. 1987. Toxicity Data on Diazinon, Aniline, 2,4-Dimethylphenol. U.S.EPA, Duluth, MN:11 p. Memorandum to Stephan C, U.S.EPA, Duluth, MN and to Call D and Brooke L, Center for Lake Superior Environmental Studies, Superior, WI, August 31.
35

Norberg-King TJ. 1989. An evaluation of the fathead minnow seven-day subchronic test for estimating chronic toxicity. Environ Toxicol Chem 8: 1075-1089.
Oh HS, Lee SK, Kim Y-H, Roh JK. 1991. Mechanism of selective toxicity of diazinon to killifish (Oryzias latipes) and loach (Misgurnus anguillicaudatus). In: Aquatic Toxicology and Risk Assessment: Fourteenth Edition, ASTM STP 1124. Mayes MA, Barron MG, eds. American Society for Testing and Materials, Philadelphia, PA, pp. 343-353.
Olmstead AW, LeBlanc GA. 2005. Toxicity assessment of environmentally relevant pollutant mixtures using a heuristic model. Integrated Environmental Assessment and Management 1: 114-122.
Oruc EÖ, Üner N, Sevgiler Y, Usta D, Durmaz H. 2006. Sublethal effects of organophosphate diazinon on the brain of Cyprinus carpio. Drug Chem Toxicol 1: 57-67.
Osterauer R, Koehler H-R. 2008. Temperature-dependent effects of the pesticides thiacloprid and diazinon on the embryonic development of zebrafish (Danio rerio). Aquat Toxicol 86: 485 -494.
Palacio JA, Henao B, Velez JH, Gonzalez J, Parra CM. 2002. Acute toxicity and bioaccumulation of pesticide diazinon in red tilapia (Oreochromis niloticus x Mossambicus albina). Environ Toxicol 17: 334-340.
PAN. 2006. Pesticide Action Network Pesticide Database; http://www.pesticideinfo.org/Index.html.
Pan G, Dutta HM. 1998. The inhibition of brain acetylcholinesterase activity of juvenile largemouth bass Micropterus salmoides by sublethal concentrations of diazinon. Environ Res (Sec A) 79:133-137.
Pan G, Dutta H. 2000. Diazinon induced changes in the serum proteins of large mouth bass, Micropterus salmoides. Bull Environ Contam Toxicol 64: 287-293.
Patra RW, Chapman JC, Lim RP, Gehrke PC. 2007. The effects of three organic chemicals on the upper thermal tolerances of four freshwater fishes. Environ Toxicol Chem 26: 1454-1459.
Pennwalt Corp. 1978. The acute toxicity of Knox-Out 2FM to the bluegill sunfish Lepomis macrochirus Rafinesque. Prepared by Union Carbide Environmental Services, Union Carbide Corporation, Tarrytown, NY.
Perry MJ, Venners SA, Barr DB, Xu S. 2007. Environmental pyrethroid and organophosphorus insecticide exposures and sperm concentration. Reproduct Toxicol 23: 113-118.
Phillips TA, Summerfelt RC, Wu J, Laird DA. 2003. Toxicity of chlorpyrifos adsorbed on humic colloids to larval walleye (Stizostedion vitreum). Arch Environ Contam Toxicol 45:258-263.
Phipps GL. 1988. Diazinon acute tests for criteria development. Memorandum to R. Spehar, U.S. EPA, Duluth, MN. April 29.
Qadri N, Dutta HM. 1995. Long term effects of low and high concentrations of diazinon on bluegill fish, Lepomis macrochirus: a light microscopic study. Am Zool 35: 144A (meeting abstract).
Qadri SSH, Sultana H, Anjum F. 1982. Selective toxicity of organophosphorous and carbamate pesticides to honey bee and freshwater fish. Intl Pest Con 24: 124-126.
36

Relyea RA. 2004. Growth and survival of five amphibian species exposed to combinations of pesticides. Environ Toxicol Chem 23: 1737-1742.
Rettich F. 1977. The susceptibility of mosquito larvae to eighteen insecticides in Czechoslovakia. Mosq News 37: 252-257.
Rettich F. 1979. Laboratory and field investigations in Czechoslovakia with fenitrothion, pirimiphos-methyl, temephos and other organophosphorous larvicides applied as sprays for control of Culex pipiens molestus Forskal and Aedes cantans Meigen. Mosq News 39: 320-328.
Robertson JB, Mazzella C. 1989. Acute toxicity of the pesticide diazinon to the freshwater snail Gillia altilis. Bull Environ Contam Toxicol 42: 320-324.
Robinson PW. 1999. The toxicity of pesticides and organics to mysid shrimps can be predicted from Daphnia spp. toxicity data. Wat Res 33:1545-1549.
Roex EWM, Van Gestel CAM, Van Wezel AP, Van Straalen NM. 2000. Ratios between acute toxicity and effects on population growth rates in relation to toxicant mode of action. Environ Toxicol Chem 19:685-693.
Rogge, R.W. and C.D. Drewes. 1993. Assessing Sublethal Neurotoxicity Effects in the Freshwater oligochaete, Lumbriculus variegates. Aquat Toxicol 26:73-90.
Rongsriyam Y, Prownebon S, Hirakoso S. 1965. Effects of insecticides on the feeding activity of the guppy, a mosquito-eating fish, in Thailand. Bull WHO 39: 977-980.
Sakr SA, Gabr SA. 1992. Ultrastructural changes induced by diazinon and neopybuthrin in skeletal muscles of Tilapia nilotica. Bull Environ Contam Toxicol 48:467-473.
Sakr SA, Gabr SA, El-Saadany MM. 1991. Effect of diazinon on freeze-fracture images of microvilli of intestinal epithelial cells of Tilapia nilotica. Zeitschrift fur Ernahrungswissenschaft 30:268-275.
Sánchez M, Ferrando MD, Sancho E, Andreu-Moliner E. 1998. Evaluation of a Daphnia magna renewal life-cycle test method with diazinon. J Environ Sci Health B33: 785-797.
Sánchez M, Ferrando MD, Sancho E, Andreu E. 2000. Physiological perturbations in several generations of Daphnia magna Straus exposed to diazinon. Ecotox Environ Safety 46: 87-94.
Sancho E, Ferrando MD, Andreu E, Gamon M. 1992a. Acute toxicity, uptake and clearance of diazinon by the European eel, Anguilla anguilla L. J Environ Sci Health B 27:209-221.
Sancho E, Ferrando MD, Andreu E, and Gamon M. 1993. Bioconcentration and excretion of diazinon by eel. 1993. Bull Environ Contam Toxicol 50: 578-585.
Sancho E, Ferrando MD, Gamon M, Andreu-Moliner E. 1992b. Organophosphorus diazinon induced toxicity in the fish Anguilla anguilla. Comp Biochem Physiol 103C: 351-356.
Sanders HO. 1969. 25. Toxicity of pesticides to the crustacean Gammarus lacustris. Technical papers of the Bureau of Sport Fisheries and Wildlife. US Department of the Interior, Fish and Wildlife Service, Washington, DC.
Sanders HO, Cope OB. 1966. Toxicities of several pesticides to two species of cladocerans. Trans Am Fish Soc 95:165-169.
Sanders HO, Cope OB. 1968. The relative toxicities of several pesticides to naiads of three species of stoneflies. Limnol Oceanogr 13: 112-117.
37

Sangster Research Laboratories. 2004. LOGKOW. A databank of evaluated octanol-water partition coefficients (Log P); http:// logkow.cisti.nrc.ca/logkow/index.jsp. Canadian National Committee for CODATA.
Sastry KV, Malik PV. 1982a. Acute and chronic effects of diazinon on the activities of three dehydrogenases in the digestive system of a freshwater teleost fish Channa punctatus. Toxicol Lett 10: 55-59.
Sastry KV, Malik PV. 1982b. Histopathological and enzymological alterations in the digestive system of a freshwater teleost fish, Heteropneustes fossilis, exposed to acutely and chronically to diazinon. Ecotox Environ Safety 6: 223-235.
Sastry KV, Sharma K. 1981. Diazinon-induced histopathological and hematological alterations in a freshwater teleost, Ophiocephalus punctatus. Ecotox Environ Safety 5: 329-340.
Scharf J, Wiesiollek R, Bächmann K. 1992. Analyt Bioanalyt Chem 342: 813 – 816. Scholz NL, Truelove NK, French BL, Berejikian BA, Quinn TP, Casillas E, Collier TK.
Can J Fish Aquat Sci 57: 1911-1918. Schuler LJ, Trimble AJ, Belden JB, Lydy MJ. 2005. Joint toxicity of triazine herbicides
and organophosphate insecticides to the midge Chironomus tentans. Arch Environ Contam Toxicol 49: 173-177.
Sharom MS, Miles JRW, Harris CR, McEwen FL. 1980. Persistence of 12 Insecticides in Water. Water Res 14:1089-1093.
Shigehisa H, Shiraishi H. 1998. Biomonitoring with shrimp to detect seasonal change in river water toxicity. Environ Toxicol Chem 17:687-694.
Shigehisa H, Sugaya Y. 1989. A freshwater shrimp (Paratya compressa imporvisa) as a sensitive test organism to pesticides. Environ Pollut 59: 325-336.
Siepmann S, Finlayson B. 2000. Water quality criteria for diazinon and chlorpyrifos. Report. California Department of Fish and Game.
Singh PK. 1973. Effect of Pesticides on Blue-Green Algae. Arch Mikrobiol 89:317-320. Sinha PK, Pal S, Kumar K, Triar SB, Singh R. 1986. Thiodocarb, an effective
molluscicide for grazer snails of blue green algae. J Entomol Res 10: 116-118. Snell TW, Moffat BD. 1992. A 2-d life cycle test with the rotifer Brachionus calyciflorus.
Environ Toxicol Chem 11: 1249-1257. Sparling DW, Fellers G. 2006. Comparative toxicity of chlorpyrifos, diazinon, malathion
and their oxon derivatives to larval Rana boylii. Environ Pollut 147(3): 535 -539. Stadnyk L, Campbell RS, Johnson BT. 1971. Pesticide effect on growth and 14C
assimilation in a freshwater alga. Bull Environ Contam Toxicol 6: 1-8. Stark JD, Vargas RI. 2003. Demographic changes in Daphnia pulex (leydig) after
exposure to the insecticides spinosad and diazinon. Ecotox Environ Safety 56: 334-338.
Steinberg CE, Sturm A, Kelbel J, Kyu Lee S, Hertkorn N, Freitag D, Kettrup AA. 1992. Changes of acute toxicity of organic chemicals to Daphnia magna in the presence of dissolved humic material (DHM). Acta Hydrochim Hydrobiol 20: 236-332.
Steinberg CEW, Xu Y, Lee SK, Freitag D, Kettrup A. 1993. Effect of dissolved humic material (DHM) on bioavailability of some organic xenobiotics to Daphnia magna. Chem Speciation Bioavail 5:1-9.
38

Stevens MM. 1991. Insecticide treatments used against a rice bloodworm, Chironomus tepperi (Diptera: Chironomidae): toxicity and residual effects in water. J Econ Entom 84: 795-800.
Stevens MM. 1992. Toxicity of organophosphorus insecticides to fourth-instar larvae of Chironomus tepperi Skuse (Diptera:Chironomidae). J Aust Ent Soc 31: 335-337.
Stevens MM, Warren GN. 1992. Insecticide treatments used against a rice bloodworm, Chironomus tepperi (Diptera: Chironomidae): suppression of larval populations. J Econ Entom 85: 1606-1613.
Stratton GW, Corke CT. 1981. Interaction of permethrin with Daphnia magna in the presence and absence of particulate matter. Environ Poll (Series A) 24: 135-144.
Stuijfzand SC, Poort L, Greeve GD, Van der Geest HG, Kraak MHS. 2000. Variables Determining the Impact of Diazinon on Aquatic Insects: Taxon, Developmental Stage, and Exposure Time. Environ Toxicol Chem 19: 582-587.
Sucahyo D, van Straalen NM, Krave A, van Gestel C. 2008. Acute toxicity of pesticides to the tropical freshwater shrimp Caridina laevis. Ecotoxicol Environ Safety, 69: 421-427.
Surprenant DC. 1987. Static acute toxicity of diazinon AG500 to bluegill (Lepomis macrochirus) EPA guidelines No. 72-1. Agricultural Division Ciba-Geigy Corporation, Greensboro, NC. EPA MRID 40509802.
Surprenant DC. 1988a. The chronic toxicity of 14C-diazinon technical to Daphnia magna under flow-through conditions, EPA guidelines No. 72-4. Agricultural Division, Ciba-Geigy Corporation, Greensboro, NC.
Surprenant DC. 1988b. The toxicity of diazinon technical to fathead minnow (Pimephales promelas) embryos and larvae. Agricultural Division, Ciba-Geigy Corporation, Greensboro, NC.
Svoboda M, Luskova V, Drastiochova J, Zlabek V. 2001. The effect of diazinon on haematological indices of common carp (Cyprinus carpio L.). Acta Vet Brno 70: 457-465.
Takahashi M, Yasutomi K. 1978. Insecticidal resistance of Culex tritaeniorhynchus (Diptera: Culicidae) in Japan: genetics and mechanisms of resistance to organophosphorous insecticides. J Med Ent 24:595-603.
TenBrook PL, Palumbo AJ, Fojut TL, Hann P, Karkoski J, Tjeerdema RS. 2009a. Methodology for Derivation of Pesticide Water Quality Criteria for the Protection of Aquatic Life in the Sacramento and San Joaquin River Basins. Phase II: Methodology Development and Derivation of Chlorpyrifos Criteria. Report Prepared for the Central Valley Regional Water Quality Control Board, Rancho Cordova, CA.
TenBrook PL, Tjeerdema RS. 2006. Methodology for derivation of pesticide water quality criteria for the protection of aquatic life in the Sacramento and San Joaquin River Basins. Phase I: Review of existing methodologies. Final Report. Central Valley Regional Water Quality Control Board, Rancho Cordova, CA.
TenBrook PL, Tjeerdema RS, Hann P, Karkoski J. 2009b. Methods for Deriving Pesticide Aquatic Life Criteria. Rev Environ Contam Toxicol 199, 19-109.
Tomlin CDS, ed. 1994. The Pesticide Manual, a World Compendium, 10th Edition, Incorporating the Agrochemicals Handbook. Surrey and Cambridge, UK: The British Crop Protection Council and The Royal Society of Chemistry.
39
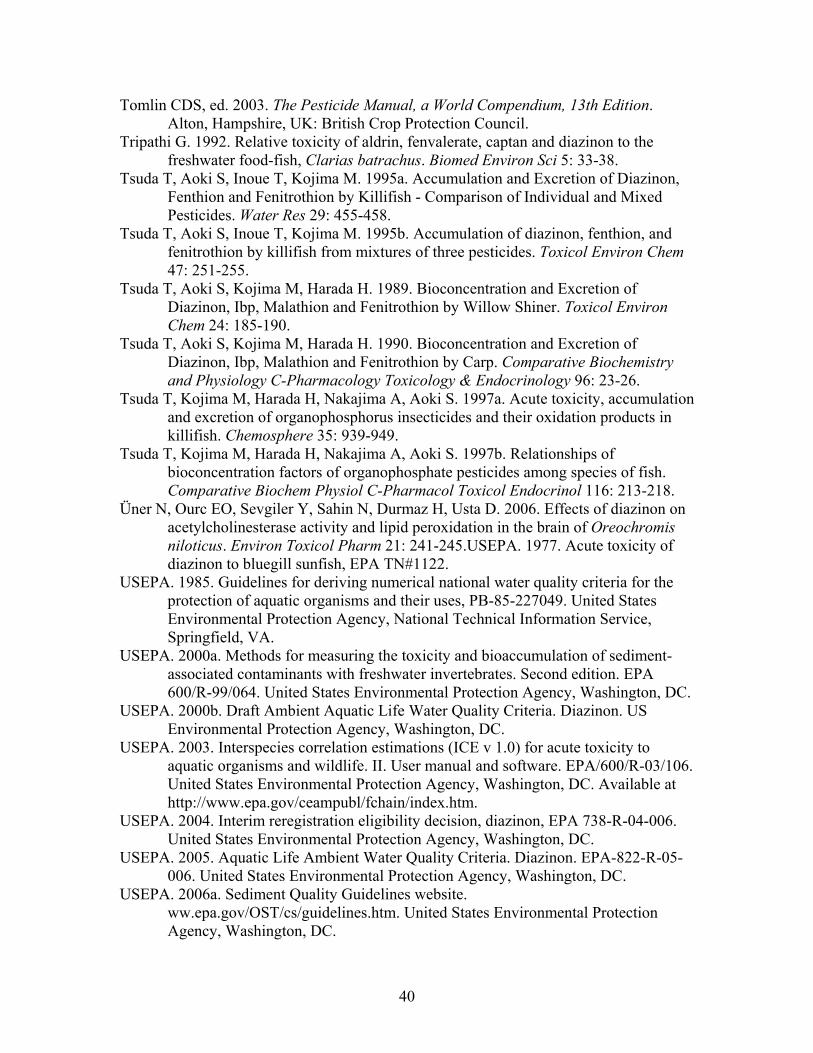
Tomlin CDS, ed. 2003. The Pesticide Manual, a World Compendium, 13th Edition. Alton, Hampshire, UK: British Crop Protection Council.
Tripathi G. 1992. Relative toxicity of aldrin, fenvalerate, captan and diazinon to the freshwater food-fish, Clarias batrachus. Biomed Environ Sci 5: 33-38.
Tsuda T, Aoki S, Inoue T, Kojima M. 1995a. Accumulation and Excretion of Diazinon, Fenthion and Fenitrothion by Killifish - Comparison of Individual and Mixed Pesticides. Water Res 29: 455-458.
Tsuda T, Aoki S, Inoue T, Kojima M. 1995b. Accumulation of diazinon, fenthion, and fenitrothion by killifish from mixtures of three pesticides. Toxicol Environ Chem 47: 251-255.
Tsuda T, Aoki S, Kojima M, Harada H. 1989. Bioconcentration and Excretion of Diazinon, Ibp, Malathion and Fenitrothion by Willow Shiner. Toxicol Environ Chem 24: 185-190.
Tsuda T, Aoki S, Kojima M, Harada H. 1990. Bioconcentration and Excretion of Diazinon, Ibp, Malathion and Fenitrothion by Carp. Comparative Biochemistry and Physiology C-Pharmacology Toxicology & Endocrinology 96: 23-26.
Tsuda T, Kojima M, Harada H, Nakajima A, Aoki S. 1997a. Acute toxicity, accumulation and excretion of organophosphorus insecticides and their oxidation products in killifish. Chemosphere 35: 939-949.
Tsuda T, Kojima M, Harada H, Nakajima A, Aoki S. 1997b. Relationships of bioconcentration factors of organophosphate pesticides among species of fish. Comparative Biochem Physiol C-Pharmacol Toxicol Endocrinol 116: 213-218.
Üner N, Ourc EO, Sevgiler Y, Sahin N, Durmaz H, Usta D. 2006. Effects of diazinon on acetylcholinesterase activity and lipid peroxidation in the brain of Oreochromis niloticus. Environ Toxicol Pharm 21: 241-245.USEPA. 1977. Acute toxicity of diazinon to bluegill sunfish, EPA TN#1122.
USEPA. 1985. Guidelines for deriving numerical national water quality criteria for the protection of aquatic organisms and their uses, PB-85-227049. United States Environmental Protection Agency, National Technical Information Service, Springfield, VA.
USEPA. 2000a. Methods for measuring the toxicity and bioaccumulation of sediment-associated contaminants with freshwater invertebrates. Second edition. EPA 600/R-99/064. United States Environmental Protection Agency, Washington, DC.
USEPA. 2000b. Draft Ambient Aquatic Life Water Quality Criteria. Diazinon. US Environmental Protection Agency, Washington, DC.
USEPA. 2003. Interspecies correlation estimations (ICE v 1.0) for acute toxicity to aquatic organisms and wildlife. II. User manual and software. EPA/600/R-03/106. United States Environmental Protection Agency, Washington, DC. Available at http://www.epa.gov/ceampubl/fchain/index.htm.
USEPA. 2004. Interim reregistration eligibility decision, diazinon, EPA 738-R-04-006. United States Environmental Protection Agency, Washington, DC.
USEPA. 2005. Aquatic Life Ambient Water Quality Criteria. Diazinon. EPA-822-R-05-006. United States Environmental Protection Agency, Washington, DC.
USEPA. 2006a. Sediment Quality Guidelines website. ww.epa.gov/OST/cs/guidelines.htm. United States Environmental Protection Agency, Washington, DC.
40

USEPA. 2006b. National Ambient Air Quality Standards website. www.epa.gov/air/criteria.html. United States Environmental Protection Agency, Washington, DC.
USFDA. 2000. Industry activities staff booklet, www.cfsan.fda.gov/~lrd/fdaact.html. United States Food and Drug Administration, Washington, DC.
Van Der Geest HG, Greve GD, Boivin M-E, Kraak MHS, Gestel CAM. 2000b. Mixture toxicity of copper and diazinon to larvae of the mayfly (Ephoron virgo) judging additivity at different effect levels. Environ Toxicol Chem 19: 2900-2905.
Van Der Geest HG, Greve GD, De Haas EM, Scheper BB, Kraak MHS, Stuijfzand SC, Augustijn KH, Admiraal W. 1999. Survival and behavioral responses of larvae of the caddisfly Hydropsyche angustipennis to copper and diazinon. Environ Toxicol Chem 18: 1965-1971.
Van Der Geest HG, Greve GD, Kroon A, Kuijl S, Kraak MHS, Admiraal W. 2000a. Sensitivity of characteristic riverine insects, the caddisfly Cyrnus trimaculatus and the mayfly Ephoron virgo, to copper and diazinon. Environ Poll 109: 177-182.
Van Der Geest HG, Soppe WJ, Greve GD, Kroon A, Kraak MHS. 2002. Combined effects of lowered oxygen and toxicants (copper and diazinon) on the mayfly Ephoron virgo. Environ Toxicol Chem 21: 2002.
Verma SR, Bansal SK, Gupta AK, Pal N, Tyagi AK, Bhathagar MC, Kumar V, Delela RC. 1982. Bioassay trials with twenty three pesticides to a fresh water teleost, Saccobranchus fossilis. Wat Res 16: 525-529.
Vial A. 1990. Report on the reproduction test of G24480 technical to daphnid Daphnia magna. Ciba-Geigy Ltd. Toxicology Services. Basel, Switzerland.
Viant MR, Pincetich CA, Tjeerdema RS. 2006. Metabolic effects of dinoseb, diazinon and esfenvalerate in eyed eggs and alevins of Chinook salmon (Oncorhynchus tshawytscha) determined by 1H NMR metabolomics. Aquat Toxicol 77: 359-371.
Vigfusson NV, Vyse ER, Pernsteiner CA, Dawson RJ. 1983. In vivo induction of sister-chromatid exchange in Umbra limi by the insecticides endrin, chlordane, diazinon and guthion. Mut Res 118: 61-68.
Vilkas AG. 1976. Acute toxicity of diazinon technical to the water flea Daphnia magna Straus, EPA guidelines No. 72-2, Agricultural Division, Ciba-Geigy Corporation, Greensboro, NC. EPA MRID 00109022.
Villar D, González M, Gualda MJ, Schaeffer DJ. 1994. Effects of organophosphorus insecticides on Dugesia tigrina; cholinesterase activity and head regeneration. Bull Environ Contam Toxicol 52: 319-324.
Weiss CM. 1959. Stream Pollution; response of fish to sub-lethal exposures of organic phosphorus insecticides. Sewage and Industrial Wastes 31: 580-593
Weiss CM. 1961. Physiological effect of organic phosphorus insecticides on several species of fish. Trans Am Fish Soc 90: 143-152.
Weiss CM, Gakstatter JH. 1964. Detection of pesticides in water by biochemical assay. J Wat Poll Cont Fed 36: 240-253.
Werner I, Nagel R. 1997. Stress proteins HSP60 and HSP70 in three species of amphipods exposed to cadmium, diazinon, dieldrin and fluoranthene. Environ Toxicol Chem 16: 2393-2403.
41

42
Werner I, Zalom FG, Oliver MN, Deanovic LA, Kimball TS, Henderson JD, Wilson BW, Krueger W, Wallender WW. 2004. Toxicity of stormwater runoff after dormant spray application of diazinon and esfenvalerate in a French Prune Orchard, Glenn County, California, USA: temporal patterns and the effect of ground covers. Environ Toxicol Chem 23: 2719-2726.
WHO. 1963. Criteria and meaning of tests for determining susceptibility or resistance of insects to insecticides. Geneva, Switzerland: World Health Organization Technical Report Series 265.
Wong CK. 1997. Effects of diazinon on some population parameters of Moina macrocopa (Cladocera). Wat Air Soil Poll 94: 393-399.
Wong PK, Chang L. 1988. The effects of 2,3-D herbicide and organophosphorus insecticides on growth, photosynthesis, and chlorophyll a synthesis of Chlamydomonas reinhardtii (mt +). Environ Poll 55: 179-189.
Wood A. 2006. Compendium of pesticide common names; diazinon. Alan Wood's web site. http://www.alanwood.net/pesticides/diazinon.html.
Worthing CR (ed). 1991. The Pesticide Manual, 9th Edition, a World Compendium. Surrey, UK: The British Crop Protection Council.
Yasuno M, Kerdpibule V. 1967. Susceptibility of larvae of Culex pipiens fatigans to organophosphorous insecticides in Thailand. Japan J Exp Med 37: 559-562.
Zabik JM, Seiber JN. 1993. Atmospheric transport of organophosphate pesticides from California's Central Valley to the Sierra Nevada mountains. J Environ Qua 22: 80-90.

43
Data Tables

Table 3. Final acute toxicity data set for diazinon. All studies were rated relevant and reliable (RR) and were conducted at standard temperature. Values in bold are species mean acute values. S: static; SR: static renewal; FT: flow-through.
Species Common identifier Family Test type Meas/
Nom Chemical
grade Duration Temp (oC) Endpoint Age/size LC/EC50 (μg/L) Reference
Ceriodaphnia dubia Cladoceran Daphniidae SR Meas 87.3% 96 h 24.7 Mortality < 24 h 0.436 (0.342-
0.504) CDFG 1998a
Ceriodaphnia dubia Cladoceran Daphniidae SR Meas 88.0% 96 h 24.4 Mortality < 24 h 0.47 CDFG 1992b
Ceriodaphnia dubia Cladoceran Daphniidae SR Meas 88.0% 96 h 24.4 Mortality < 24 h 0.507 (0.42-
0.71) CDFG 1992a
Ceriodaphnia dubia Cladoceran Daphniidae S Meas 99.0% 96 h 25 Mortality < 24 h
Test 1: 0.32 (0.27-0.38) Test 2: 0.35 (0.32-0.38)
Bailey et al. 1997
Ceriodaphnia dubia Cladoceran Daphniidae S Meas 99.0% 48 h 25 Mortality < 24 h
Test 3: 0.26 (0.21-0.32) Test 4: 0.29 (0.19-0.46)
Bailey et al. 1997
Ceriodaphnia dubia Cladoceran Daphniidae S Meas Analytical 48 h 25 Mortality < 24 h 0.33 Bailey et al.
2000 Ceriodaphnia
dubia Cladoceran Daphniidae S Meas 99.0% 48 h 25 Mortality < 24 h Test 1: 0.38 Test 2: 0.33
Bailey et al. 2001
Ceriodaphnia dubia Cladoceran Daphniidae S Meas 99.8% 48 h 25 Mortality < 24 h 0.21 Banks et al.
2005
Geomean 0.34
Chironomus dilutus
(formerly tentans)
Insect Chironomidae S Nom 95.0% 96 h 23 Mortality/ Immobility 3rd instar 10.7
(7.55-15.2) Ankley &
Collyard 1995
44

Species Common identifier Family Test type Meas/
Nom Chemical
grade Duration Temp (oC) Endpoint Age/size LC/EC50 (μg/L) Reference
Daphnia magna Cladoceran Daphniidae FT Meas 87.7% 96 h 20 Mortality/ Immobility < 24 h 0.52
(0.32-0.83) Surprenant
1988a
Gammarus pseudolimnaeus Amphipod Gammaridae SR Meas 100.0% 96 h 18 Mortality Mature 16.82
(12.82-22.08)
Hall & Anderson
2005
Hyalella azteca Amphipod Hyalellidae S Meas 98.0% 96 h 20 Mortality 14-21 d 4.3 (3.7-5.6)
Anderson & Lydy 2002
Jordanella floridae Flagfish Cyprinodontidae FT Meas 92.5% 96 h 25 Mortality 6-7 wk
Test 1: 1500 (1200-1900)Test 2: 1800 (1600-2000)
Allison & Hermanutz
1977
Geomean 1643
Lepomis macrochirus Bluegill Centrarchidae FT Meas 92.5% 96 h 25 Mortality 1 yr
Test 1: 480 (340-670)
Test 2: 440 (310-620)
Allison & Hermanutz
1977
Geomean 460 Neomysis mercedis Mysid Mysidae SR Meas 88.0% 96 h 17 Mortality < 5 d 3.57
(2.99-4.36) CDFG 1992c
Neomysis mercedis Mysid Mysidae SR Meas 88.0% 96 h 17.5 Mortality < 5 d 4.82
(3.95-6.00) CDFG 1992d
Geomean 4.15 Physa spp Pond snail Physidae SR Meas 87.0% 96 h 21.6 Mortality Juvenile 4441 CDFG 1998b
Pimephales promelas
Fathead minnow Cyprinidae FT Meas 92.5% 96 h 25 Mortality 15-20 wk
Test 1:6800 Test 2:6600
Test 3: 10,000
Allison & Hermanutz
1977
45

Species Common identifier Family Test type Meas/
Nom Chemical
grade Duration Temp (oC) Endpoint Age/size LC/EC50 (μg/L) Reference
Pimephales promelas
Fathead minnow Cyprinidae FT Meas 87.1% 96 h 24.5 Mortality 31 d 9350
(8120-10800)Geiger et al.
1988
Pimephales promelas
Fathead minnow Cyprinidae FT Meas 87.1% 96 h 23.5-26 Mortality Newly
hatched 6900
(6200-7900)Jarvinen &
Tanner 1982 Geomean 7804
Pomacea paludosa Snail Ampullariidae FT Meas 87.0% 96 h 26-27.4 Mortality 1d, 7 d
Test 1: 2950Test 2: 3270Test 3: 3390
Call 1993
Geomean 3198
Procloeon sp. Insect Baetidae SR Meas 99.0% 48 h 22.1 Mortality 0.5-1 cm Test 1: 1.53 Test 2: 2.11 Test 3: 1.77
Anderson et al. 2006
Geomean 1.79
Salvelinus fontinalis Brook trout Salmonidae FT Meas 92.5% 96 h 12 Mortality 1 yr
Test 1: 800 (440-1140) Test 2: 450 (320-630)
Test 3: 1050 (720-1520)
Allison & Hermanutz
1977
Geomean 723
46

Table 4. Acceptable acute data excluded in data reduction process. S: static; SR: static renewal; FT: flow-through.
Species Common identifier Family Test
type Meas/ Nom
Chemical grade Duration Temp
(oC) Endpoint Age/size LC/EC50 (μg/L) Reference
Reason for
exclusion
Ceriodaphnia dubia Cladoceran Daphniidae S Nom 99.8% 48 h 25 Mortality < 24 h 0.45 Banks et al.
2003 1
Ceriodaphnia dubia Cladoceran Daphniidae S Meas 99.0% 24 h 25 Mortality < 24 h
Test 1: 0.58 (0.54-0.63) Test 2: 0.75 (0.69-0.80) Test 3: 0.37 (0.29-0.42) Test 4: 0.65 (0.46-0.92)
Bailey et al. 1997 4
Ceriodaphnia dubia Cladoceran Daphniidae S Meas 99.0% 48 h 25 Mortality < 24 h
Test 1: 0.58 (0.54-0.63) Test 2: 0.48 (0.41-0.56)
Bailey et al. 1997 4
Ceriodaphnia dubia
Cladoceran Daphniidae S Meas 99.0% 72 h 25 Mortality < 24 h
Test 1: 0.35 (0.29-0.42) Test 2: 0.40 (0.36-0.44)
Bailey et al. 1997 4
Ceriodaphnia dubia Cladoceran Daphniidae S Meas 99.0% 24 h 25 Mortality < 24 h Test 1: 0.46
Test 2: 0.57 Bailey et al.
2001 4
Chironomus dilutus
(formerly tentans)
Insect Chironomidae S Meas 98.0% 96 h 20 Mortality/ Immobility 4th instar 30
(24-36) Belden &
Lydy 2000 2
47

Chironomus dilutus
(formerly tentans)
Insect Chironomidae S Meas 99.5% 96 h 21 Mortality/ Immobility 4th instar 19.1
(13.6-24.1) Lydy &
Austin 2004 2
Daphnia magna Cladoceran Daphniidae FT Meas 87.7% 48 h 20 Mortality/ Immobility < 24 h 0.78
(0.32-∞) Surprenant
1988a 4
Gammarus pseudolimnaeus Amphipod Gammaridae SR Meas 100.0% 48 h 18 Mortality Mature 27.29
(22.45-33.18)
Hall & Anderson
2005 4
Gammarus pseudolimnaeus Amphipod Gammaridae SR Meas 100.0% 72 h 18 Mortality Mature 20.21
(15.79-25.87)
Hall & Anderson
2005 4
Pimephales promelas
Fathead minnow Cyprinidae SR Meas 99.4% 96 h 20 Mortality 7 d
Test 1: 6393 Test 2: 5048 Test 3: 7969
Denton et al. 2003 3
Pimephales promelas
Fathead minnow Cyprinidae S Meas 87.1% 96 h 23.5-26 Mortality Newly
hatched2100
(1700-2900) Jarvinen &
Tanner 1982 3
Pimephales promelas
Fathead minnow Cyprinidae S Meas 87.1% 96 h 23.5-26 Mortality Newly
hatched4300
(3400-5200) Jarvinen &
Tanner 1982 3
Reasons for exclusion 1. Test with measured concentrations available 2. More sensitive lifestage available 3. Flow-through test available 4. Later exposure duration available for same test
48

Table 5. Final chronic toxicity data set for diazinon. All studies were rated relevant and reliable (RR). Values in bold are species mean chronic values. S: static; SR: static renewal; FT: flow-through.
Species Common identifier
Test type
Meas/ Nom Chemical Duration Temp
(oC) Endpoint Age/size NOEC (μg/L)
LOEC (μg/L)
MATC (μg/L) Reference
Daphnia magna Cladoceran FT Meas 87.7% 21 d 20 Mortality/ immobility < 24 h 0.17 0.32 0.23 Surprenant
1988a
Pimephales promelas Fathead minnow FT Meas 92.5% 274 d 25 Mortality 5-d 28 60.3 41 Allison &
Hermanutz 1977
Pimephales promelas Fathead minnow FT Meas 87.1% 32 d 23.5-
26.0 Weight Newly hatched 50 90 67 Jarvinen &
Tanner 1982
Geomean 54
Salvelinus fontinalis Brook trout FT Meas 92.5% 173 d
+ 1oC; variable acc. to date
Mortality 1 yr 4.8 9.6 6.8 Allison & Hermanutz 1977
Selenastrum capricornutum Green algae S Meas 87.7% 7 d 24 Mean standing
crop, cells/mL 6-8 d old culture ----- ----- EC50
6,400 Hughes 1988
Selenastrum capricornutum Green algae S Meas 87.7% 7 d 24 Mean standing
crop, cells/mL 6-8 d old culture ----- ----- EC25
4,250 Hughes 1988
49

Table 6. Acceptable chronic data excluded in data reduction process. S: static; SR: static renewal; FT: flow-through.
Species Common identifier
Test type
Meas/ Nom Chemical Duration Temp
(oC) Endpoint Age/size NOEC (μg/L)
LOEC (μg/L)
MATC (μg/L) Reference
Reason for
exclusion
Pimephales promelas
Fathead minnow FT Meas 87.1% 32 d 23.5-26.0 Mortality Newly
hatched 140 290 200 Jarvinen & Tanner 1982 1
Pimephales promelas
Fathead minnow FT Meas 87.7% 34 d 25 Length Embryo 92 170 125 Surprenant
1988b 1
Salvelinus fontinalis Brook trout FT Meas 92.5% 91 d
+ 1oC; variable acc. to date
Mortality 1 yr 4.8 9.6 6.8 Allison & Hermanutz
1977 2
Reasons for exclusion
1. More sensitive endpoint available 2. Later exposure duration available for same test
50

Table 7. Calculation of the species mean acute-to-chronic ratios.
Species Common identifier Reference LC50 (μg/L)
Chronic Endpoint
MATC (μg/L)
ACR (LC50/MATC)
Species Mean ACR
Daphnia magna Cladoceran Surprenant 1988a 0.52
21-d Mortality/ immobility
0.23 2.3 2.3
Pimephales promelas Fathead minnow Allison & Hermanutz
1977 7800 274-d
Mortality 41 190
Pimephales promelas Fathead minnow Jarvinen & Tanner 1982 6900 32-d Weight 67 103 140
Salvelinus fontinalis Brook trout Allison & Hermanutz
1977 723 173-d
Mortality 6.8 106 106
51

Table 8. Studies excluded from criteria derivation (rated RL, LR, or LL; L = less relevant or less reliable). S = static, SR = static renewal, FT = flow-through; NR = not reported
Species Common identifier
Test type
Meas/ Nom
Chemical grade Duration Temp
(oC) Endpoint Age/size LC/EC50(μg/L)
MATC (μg/L) Reference Rating
Reason for
rating
Anguilla anguilla European eel S Nom 92.0% 96 h 20 Mortality 20-30 g 80 -------- Ferrando et
al. 1991 LL 3,6
Various Bacteria S Nom Reagent 22 h 21 Dissolved oxygen depletion NR -------- -------- Bauer et al.
1981 LL 5,6
Brachionus calyciflorus Rotifer S Nom 92.0% 24 h 25 Mortality Newly
hatched
29,220 (28470-29960)
-------- Fernández-Casalderrey et al. 1992a
RL 6
Brachionus calyciflorus Rotifer SR Nom 92.0% 10-11 d 25 Net reproductive
rate Neonates 5,200 -------- Fernández-Casalderrey et al. 1992b
RL 6
Brachionus calyciflorus Rotifer SR Nom 92.0% 10-11 d 25 Generation time Neonates 8,490 --------
Fernández-Casalderrey et al. 1992b
RL 6
Brachionus calyciflorus Rotifer SR Nom 92.0% 10-11 d 25 Life expectancy Neonates 12,330 --------
Fernández-Casalderrey et al. 1992b
RL 6
Brachionus calyciflorus Rotifer S Nom 96.0% 5 hr NR Filtration rate Neonates 14,390 9,900
Fernández-Casalderrey et al. 1992c
RL 2,6
Brachionus calyciflorus Rotifer S Nom 96.0% 5 hr NR Ingestion rate Neonates 14,220 9,900
Fernández-Casalderrey et al. 1992c
RL 2,6
Brachionus calyciflorus Rotifer S Nom NR 48 h 25 Intrinsic rate of
increase < 2 h 11,000 10,000 Snell & Moffat 1992 LL 1,6
52

Species Common identifier
Test type
Meas/ Nom
Chemical grade Duration Temp
(oC) Endpoint Age/size LC/EC50(μg/L)
MATC (μg/L) Reference Rating
Reason for
rating
Brachydanio rerio Zebrafish FT Meas Analytical 42 d 26 Mortality Embryos -------- -------- Bresch 1991 LR 5
Carassius auratus Goldfish ------ ------ Technical 48 h ------ Mortality ------ 5,100 --------
Nishiuki & Hashimoto
1967 LL 6
Carassius auratus Goldfish S Nom 91% 96 h 11-17 Mortality 2.5-6 cm 9000 -------- Beliles 1965 RL 6
Caridina laevis
Shrimp S Nom 60% 24 h 26-27 Mortality Juvenile
8-10mm
0.76 (0.67-0.87)
-------- Sucahyo et al. 2008 LR 1
Caridina laevis
Shrimp S Nom 60% 96 h 26-27 Mortality Juvenile
8-10mm
0.59 (0.51-0.69)
-------- Sucahyo et al. 2008 LR 1
Ceriodaphnia dubia Cladoceran SR Nom 99.0% 3 broods 25 Biomass < 24 h -------- -------- Dwyer et al.
2005 LL 5,6
Ceriodaphnia dubia Cladoceran S Nom 85.0% 48 h 25 Mortality < 24 h
0.57 (0.47-0.70)
-------- Norberg King 1987 LL 6
Ceriodaphnia dubia Cladoceran S Nom 85.0% 48 h 25 Mortality < 24 h
0.66 (0.58-0.75)
-------- Norberg King 1987 LL 6
Ceriodaphnia dubia Cladoceran S Nom 85.0% 48 h 25 Mortality < 24 h
0.57 (0.47-0.70)
-------- Norberg King 1987 LL 6
53

MATC (μg/L) Reference Rating
Reason for
rating Species Common
identifier Test type
Meas/ Nom
Chemical grade Duration Temp
(oC) Endpoint Age/size LC/EC50(μg/L)
Ceriodaphnia dubia Cladoceran S Nom 85.0% 48 h 25 Mortality < 48 h
0.35 (0.31-0.45)
-------- Norberg King 1987 LL 6
Ceriodaphnia dubia Cladoceran S Nom 85.0% 48 h 25 Mortality < 48 h 0.35 -------- Norberg
King 1987 LL 6
Ceriodaphnia dubia Cladoceran S Nom 85.0% 48 h 25 Mortality < 6 h
0.25 (0.22-0.29)
-------- Norberg King 1987 LL 6
Ceriodaphnia dubia Cladoceran S Nom 85.0% 48 h 25 Mortality < 24 h
0.33 (0.29-0.38)
-------- Norberg King 1987 LL 6
Ceriodaphnia dubia Cladoceran S Nom 85.0% 48 h 25 Mortality < 48 h 0.35 -------- Norberg
King 1987 LL 6
Ceriodaphnia dubia Cladoceran S Nom 85.0% 48 h 25 Mortality < 48 h 0.59 -------- Norberg
King 1987 LL 6
Ceriodaphnia dubia Cladoceran S Nom 85.0% 48 h 25 Mortality < 48 h
0.43 (0.36-0.51)
-------- Norberg King 1987 LL 6
Ceriodaphnia dubia Cladoceran S Nom 85.0% 48 h 25 Mortality < 48 h 0.35 -------- Norberg
King 1987 LL 6
Ceriodaphnia dubia Cladoceran S Nom 85.0% 48 h 25 Mortality < 24 h 0.36 -------- Norberg
King 1987 LL 6
Ceriodaphnia dubia Cladoceran SR Meas 85.0% 48 h 25 Mortality < 6 h 0.66 -------- Norberg
King 1987 LL 6
54

Species Common identifier
Test type
Meas/ Nom
Chemical grade Duration Temp
(oC) Endpoint Age/size LC/EC50(μg/L)
MATC (μg/L) Reference Rating
Reason for
rating
Ceriodaphnia dubia Cladoceran SR Meas 85.0% 7 d 25 Survival, Number
of young/ female < 6 h -------- 0.34 Norberg King 1987 LL 6
Chironomus riparius Insect S Nom 97% 24 h 11 Immobility 4th instar 64.9 -------- Landrum et
al 1999 LL 4,6
Chironomus riparius Insect S Nom 97% 24 h 18 Immobility 4th instar 24.4 -------- Landrum et
al 1999 LL 4,6
Chironomus riparius Insect S Nom 97% 24 h 25 Immobility 4th instar 11.6 -------- Landrum et
al 1999 LL 4,6
Chironomus riparius Insect S Meas 99.7% 48 h 20 Mortality 1st instar
32 (30.0-34.1)
-------- Stuijfzand et al. 2000 RL 6
Chironomus riparius Insect S Meas 99.7% 96 h 20 Mortality 1st instar
22.8 (19.7-26.3)
-------- Stuijfzand et al. 2000 RL 6
Chironomus riparius Insect S Meas 99.7% 48 h 20 Activity 1st instar
22.6 (4.8-
105.8) -------- Stuijfzand et
al. 2000 RL 2,6
Chironomus riparius Insect S Meas 99.7% 48 h 20 Growth 1st instar
35.2 (32.2-38.5)
-------- Stuijfzand et al. 2000 RL 6
Chironomus riparius Insect S Meas 99.7% 96 h 20 Growth 1st instar
57.3 (31.7-103.7)
-------- Stuijfzand et al. 2000 RL 6
Chironomus riparius Insect S Meas 99.7% 48 h 20 Mortality 4th instar > 268 -------- Stuijfzand et
al. 2000 RL 5,6
55
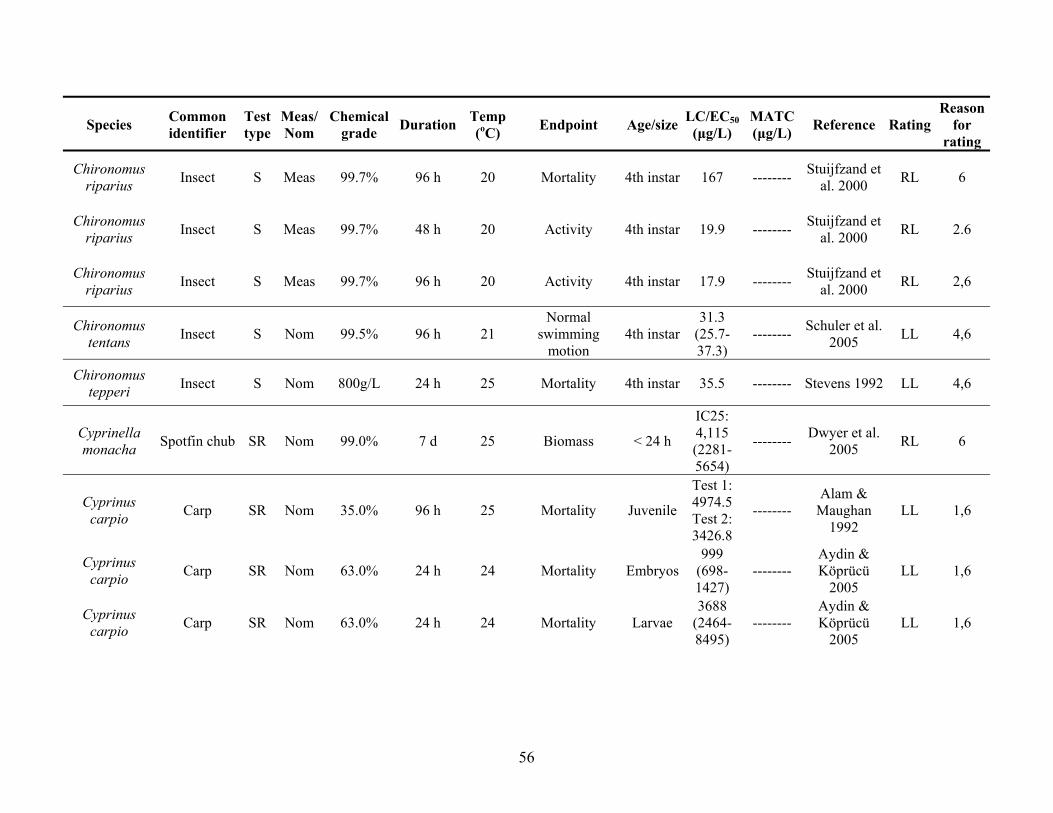
Species Common identifier
Test type
Meas/ Nom
Chemical grade Duration Temp
(oC) Endpoint Age/size LC/EC50(μg/L)
MATC (μg/L) Reference Rating
Reason for
rating
Chironomus riparius Insect S Meas 99.7% 96 h 20 Mortality 4th instar 167 -------- Stuijfzand et
al. 2000 RL 6
Chironomus riparius Insect S Meas 99.7% 48 h 20 Activity 4th instar 19.9 -------- Stuijfzand et
al. 2000 RL 2.6
Chironomus riparius Insect S Meas 99.7% 96 h 20 Activity 4th instar 17.9 -------- Stuijfzand et
al. 2000 RL 2,6
Chironomus tentans Insect S Nom 99.5% 96 h 21
Normal swimming
motion 4th instar
31.3 (25.7-37.3)
-------- Schuler et al. 2005 LL 4,6
Chironomus tepperi Insect S Nom 800g/L 24 h 25 Mortality 4th instar 35.5 -------- Stevens 1992 LL 4,6
Cyprinella monacha Spotfin chub SR Nom 99.0% 7 d 25 Biomass < 24 h
IC25: 4,115 (2281-5654)
-------- Dwyer et al. 2005 RL 6
Cyprinus carpio Carp SR Nom 35.0% 96 h 25 Mortality Juvenile
Test 1: 4974.5 Test 2: 3426.8
-------- Alam &
Maughan 1992
LL 1,6
Cyprinus carpio Carp SR Nom 63.0% 24 h 24 Mortality Embryos
999 (698-1427)
-------- Aydin & Köprücü
2005 LL 1,6
Cyprinus carpio Carp SR Nom 63.0% 24 h 24 Mortality Larvae
3688 (2464-8495)
-------- Aydin & Köprücü
2005 LL 1,6
56
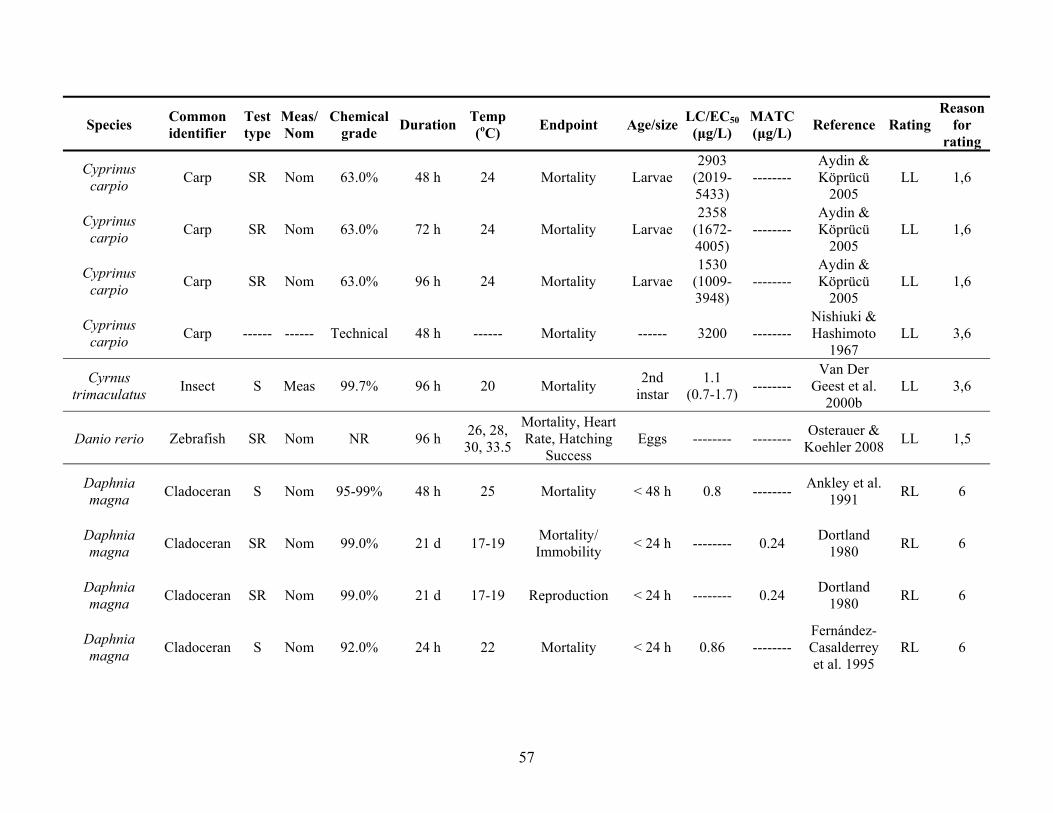
Species Common identifier
Test type
Meas/ Nom
Chemical grade Duration Temp
(oC) Endpoint Age/size LC/EC50(μg/L)
MATC (μg/L) Reference Rating
Reason for
rating
Cyprinus carpio Carp SR Nom 63.0% 48 h 24 Mortality Larvae
2903 (2019-5433)
-------- Aydin & Köprücü
2005 LL 1,6
Cyprinus carpio Carp SR Nom 63.0% 72 h 24 Mortality Larvae
2358 (1672-4005)
-------- Aydin & Köprücü
2005 LL 1,6
Cyprinus carpio Carp SR Nom 63.0% 96 h 24 Mortality Larvae
1530 (1009-3948)
-------- Aydin & Köprücü
2005 LL 1,6
Cyprinus carpio Carp ------ ------ Technical 48 h ------ Mortality ------ 3200 --------
Nishiuki & Hashimoto
1967 LL 3,6
Cyrnus trimaculatus Insect S Meas 99.7% 96 h 20 Mortality 2nd
instar 1.1
(0.7-1.7) -------- Van Der
Geest et al. 2000b
LL 3,6
Danio rerio Zebrafish SR Nom NR 96 h 26, 28, 30, 33.5
Mortality, Heart Rate, Hatching
Success Eggs -------- -------- Osterauer &
Koehler 2008 LL 1,5
Daphnia magna Cladoceran S Nom 95-99% 48 h 25 Mortality < 48 h 0.8 -------- Ankley et al.
1991 RL 6
Daphnia magna Cladoceran SR Nom 99.0% 21 d 17-19 Mortality/
Immobility < 24 h -------- 0.24 Dortland 1980 RL 6
Daphnia magna Cladoceran SR Nom 99.0% 21 d 17-19 Reproduction < 24 h -------- 0.24 Dortland
1980 RL 6
Daphnia magna Cladoceran S Nom 92.0% 24 h 22 Mortality < 24 h 0.86 --------
Fernández-Casalderrey et al. 1995
RL 6
57

Species Common identifier
Test type
Meas/ Nom
Chemical grade Duration Temp
(oC) Endpoint Age/size LC/EC50(μg/L)
MATC (μg/L) Reference Rating
Reason for
rating
Daphnia magna Cladoceran SR Nom 92.0% 21 d 22 Longevity < 24 h -------- 0.16
Fernández-Casalderrey et al. 1995
RL 6
Daphnia magna Cladoceran SR Nom 92.0% 21 d 22 Mean number of
broods < 24 h -------- 0.16 Fernández-Casalderrey et al. 1995
RL 6
Daphnia magna Cladoceran SR Nom 92.0% 21 d 22 Mean days to
reproduction < 24 h -------- 0.24 Fernández-Casalderrey et al. 1995
RL 6
Daphnia magna Cladoceran S Nom Analytical 48 h 21 Immobility < 24 h
0.87 (0.74-1.0)
-------- Kikuchi et al. 2000 RL 6
Daphnia magna Cladoceran SR Nom 96.1% 7 d 22 Mortality < 24 h -------- 0.22 Sánchez et al.
1998 RL 6
Daphnia magna Cladoceran SR Nom 96.1% 21 d 22 Young per adult < 24 h -------- 0.07 Sánchez et al.
1998 RL 6
Daphnia magna Cladoceran SR Nom 96.1% 21 d 22 Brood size < 24 h -------- 0.07 Sánchez et al.
1998 RL 6
Daphnia magna Cladoceran SR Nom 96.1% 21 d 22 Broods per adult < 24 h -------- 0.07 Sánchez et al.
1998 RL 6
Daphnia magna Cladoceran SR Meas 96.1% 21 d 22 Longevity, F0
generation < 24 h 0.67 -------- Sánchez et al. 2000 RL 6
Daphnia magna Cladoceran SR Meas 96.1% 21 d 22
Young per female, F0 generation
< 24 h 0.35 -------- Sánchez et al. 2000 RL 6
58

Species Common identifier
Test type
Meas/ Nom
Chemical grade Duration Temp
(oC) Endpoint Age/size LC/EC50(μg/L)
MATC (μg/L) Reference Rating
Reason for
rating
Daphnia magna Cladoceran SR Meas 96.1% 21 d 22 Brood size, F0
generation < 24 h 0.47 0.07 Sánchez et al. 2000 RL 6
Daphnia magna Cladoceran SR Meas 96.1% 21 d 22
Broods per female, F0 generation
< 24 h 0.43 0.07 Sánchez et al. 2000 RL 6
Daphnia magna Cladoceran SR Meas 96.1% 21 d 22
Intrinsic rate of increase, F0 generation
< 24 h 0.72 0.61 Sánchez et al. 2000 RL 6
Daphnia magna Cladoceran SR Meas 96.1% 21 d 22
Longevity, first brood, F1
generation < 24 h 0.41 -------- Sánchez et al.
2000 RL 6
Daphnia magna Cladoceran SR Meas 96.1% 21 d 22
Young per female, first
brood, F1 generation
< 24 h 0.20 -------- Sánchez et al. 2000 RL 6
Daphnia magna Cladoceran SR Meas 96.1% 21 d 22
Brood size, first brood, F1
generation < 24 h 0.29 0.07 Sánchez et al.
2000 RL 6
Daphnia magna Cladoceran SR Meas 96.1% 21 d 22
Broods per female, first
brood, F1 generation
< 24 h 0.29 -------- Sánchez et al. 2000 RL 6
Daphnia magna Cladoceran SR Meas 96.1% 21 d 22
Intrinsic rate of increase, first
brood, F1 generation
< 24 h 0.44 0.61 Sánchez et al. 2000 RL 6
59

Species Common identifier
Test type
Meas/ Nom
Chemical grade Duration Temp
(oC) Endpoint Age/size LC/EC50(μg/L)
MATC (μg/L) Reference Rating
Reason for
rating
Daphnia magna Cladoceran SR Meas 96.1% 21 d 22
Longevity, third brood, F1
generation < 24 h 0.35 0.07 Sánchez et al.
2000 RL 6
Daphnia magna Cladoceran SR Meas 96.1% 21 d 22
Young per female, third
brood, F1 generation
< 24 h 0.22 0.07 Sánchez et al. 2000 RL 6
Daphnia magna Cladoceran SR Meas 96.1% 21 d 22
Time to first brood, third
brood, F1 generation
< 24 h ----- 0.07 Sánchez et al. 2000 RL 6
Daphnia magna Cladoceran SR Meas 96.1% 21 d 22
Brood size, third brood, F1
generation < 24 h 0.27 0.07 Sánchez et al.
2000 RL 6
Daphnia magna Cladoceran SR Meas 96.1% 21 d 22
Broods per female, third
brood, F1 generation
< 24 h 0.25 0.07 Sánchez et al. 2000 RL 6
Daphnia magna Cladoceran SR Meas 96.1% 21 d 22
Intrinsic rate of increase, third
brood, F1 generation
< 24 h 0.47 0.07 Sánchez et al. 2000 RL 6
Daphnia magna Cladoceran S Nom Technical 48 h 17 Mortality < 20 h
0.96 (0.83-1.10)
-------- Vilkas 1976 LL 4,6
Daphnia pulex Cladoceran S Nom Technical 48 h 15 Immobility 1st instar 0.8 (0.6-1.1) -------- Johnson &
Finley 1980 LL 4,6
60

Species Common identifier
Test type
Meas/ Nom
Chemical grade Duration Temp
(oC) Endpoint Age/size LC/EC50(μg/L)
MATC (μg/L) Reference Rating
Reason for
rating
Daphnia pulex Cladoceran ------ ------ Technical 3 h ------ Mortality ------ 7.8 -------- Nishiuki & Hashimoto
1967 LL 6
Ephoron virgo Insect S Meas 99.7% 96 h 20 Mortality 2-d larvae
11.8 (3.0-9.0) --------
Van Der Geest et al.
2000a LL 3,6
Ephoron virgo Insect S Meas 99.7% 96 h 20 Mortality 0-2 d larvae
6.9 (4.7-10.1) --------
Van Der Geest et al.
2000b LR 3
Ephoron virgo Insect S Meas 99.7% 72 h 20 Mortality 0-2 d larvae
4.7 (1.0-13.3)
-------- Van Der
Geest et al. 2002
LR 3
Ephoron virgo Insect S Meas 99.7% 96 h 20 Mortality 0-2 d larvae
1.1 (0.5-2.3) --------
Van Der Geest et al.
2002 LR 3
Gammarus fasciatus Amphipod S Nom Technical 96 h 21 Mortality Mature 2.0 -------- Johnson &
Finley 1980 LL 4,6
Gillia altilis Mollusk SR Nom 88.6% 96 h 20.5-23.5 Mortality NR 11,000 --------
Robertson & Mazzella
1989 LL 4,6
Hyalella azteca Amphipod S Nom 95.0% 96 h 23 Mortality/
Immobility 7-14 d 6.51
(4.90-8.66)
-------- Ankley & Collyard
1995 LR 4
Hyalella azteca Amphipod S Nom NR 96 h 25 Mortality 0-2 d 6.2 -------- Collyard et
al. 1994 LL 1,6
Hyalella azteca Amphipod S Nom NR 96 h 25 Mortality 2-4 d 4.2 -------- Collyard et
al. 1994 LL 1,6
61

Species Common identifier
Test type
Meas/ Nom
Chemical grade Duration Temp
(oC) Endpoint Age/size LC/EC50(μg/L)
MATC (μg/L) Reference Rating
Reason for
rating
Hyalella azteca Amphipod S Nom NR 96 h 25 Mortality 6-8 d 4.2 -------- Collyard et
al. 1994 LL 1,6
Hyalella azteca Amphipod S Nom NR 96 h 25 Mortality 8-10 d 4.5 -------- Collyard et
al. 1994 LL 1,6
Hyalella azteca Amphipod S Nom NR 96 h 25 Mortality 12-14 d 3.8 -------- Collyard et
al. 1994 LL 1,6
Hyalella azteca Amphipod S Nom NR 96 h 25 Mortality 16-18 d 4.5 -------- Collyard et
al. 1994 LL 1,6
Hyalella azteca Amphipod S Nom NR 96 h 25 Mortality 20-22 d 4.8 -------- Collyard et
al. 1994 LL 1,6
Hyalella azteca Amphipod S Nom NR 96 h 25 Mortality 24-26 d 4.8 -------- Collyard et
al. 1994 LL 1,6
Hyalella azteca Amphipod S Nom NR 24 h 20 Increase in heat
shock proteins NR -------- 0.13 Werner & Nagel 1997 LL 1,2,6
Hydropsyche angustipennis Insect S Meas 99.7% 48 h 20 Mortality 5th instar
242.8 (123.1-478.9)
-------- Stuijfzand et al. 2000b LL 3,6
Hydropsyche angustipennis Insect S Meas 99.7% 96 h 20 Mortality 5th instar
29.4 (16.9-51.0)
-------- Stuijfzand et al. 2000 LL 3,6
Hydropsyche angustipennis Insect S Meas 99.7% 48 h 20 Mortality 1st instar
2.9 (2.2-13.9)
-------- Stuijfzand et al. 2000 LL 3,6
62

Species Common identifier
Test type
Meas/ Nom
Chemical grade Duration Temp
(oC) Endpoint Age/size LC/EC50(μg/L)
MATC (μg/L) Reference Rating
Reason for
rating
Hydropsyche angustipennis Insect S Meas 99.7% 96 h 20 Mortality 1st instar 1.3
(1.2-1.5) -------- Stuijfzand et al. 2000 LL 3,6
Hydropsyche angustipennis Insect S Meas 99.7% 48 h 20 Mortality 1st instar 2.9
(2.2-3.9) -------- Van Der
Geest et al. 1999
LR 3
Hydropsyche angustipennis Insect S Meas 99.7% 96 h 20 Mortality 1st instar 1.3
(1.2-1.5) -------- Van Der
Geest et al. 1999
LR 3
Hydropsyche angustipennis Insect S Meas 99.7% 168 h 20 Mortality 1st instar 1.0
(0.8-1.1) -------- Van Der
Geest et al. 1999
LR 3
Lepomis macrochirus Bluegill S Nom 92% 96 h 18 Mortality 1.0 g
168 (120-220)
-------- Johnson & Finley 1980 LL 4,6
Lepomis macrochirus Bluegill S Nom 23% 96 h 21.8 Mortality 0.7 g
28,600 (21800-37400)
-------- Pennwalt Corp. 1978 LL 1,4
Lepomis macrochirus Bluegill S Meas 48% 96 h 21-22 Mortality 40 mm;
0.75 g
210 (160-290)
-------- Surprenant 1987 LR 1
Lestes congener Insect S Nom 94% 96 h 25 Mortality
Late instar
nymphs50 -------- Federle &
Collins 1976 RL 6
Lumbriculus variegatus Oligochaete S Nom 95% 96 h 23 Mortality/
Immobility Mixed ages
6160 (5170-7340)
-------- Ankley & Collyard
1995 LL 4,6
Moina macrocopa Cladoceran ------ ------ Technical 3 h ------ Mortality ------ 26 --------
Nishiuki & Hashimoto
1967 LL 6
63

Species Common identifier
Test type
Meas/ Nom
Chemical grade Duration Temp
(oC) Endpoint Age/size LC/EC50(μg/L)
MATC (μg/L) Reference Rating
Reason for
rating
Moina macrocopa Cladoceran SR Nom 60.0% 11-12 d 26 Survivorship < 24 h -------- 0.32 Wong 1997 LL 1,6
Notropis mekistocholas
Cape Fear shiner SR Nom 99.0% 7 d 25 Biomass < 24 h
IC25: 199 (57-
1269) -------- Dwyer et al.
2005 RL 6
Oncorhynchus clarki
Cutthroat trout S Nom 92.0% 96 h 12 Mortality 2.0 g
Test 1: 1,700 (1390-2090) Test 2: 2,760 (2280-3330)
-------- Johnson & Finley 1980 LL 4,6
Oncorhynchus mykiss
Rainbow trout SR Nom 98.0% 24 h NR
Cholinesterase inhibition; muscarinic cholinergic
receptor number
40 d -------- -------- Beauvais et al. 2000 LL 2,5
Oncorhynchus mykiss
Rainbow trout SR Nom 98.0% 96 h NR
Cholinesterase inhibition; muscarinic cholinergic
receptor number
40 d -------- -------- Beauvais et al. 2000 LL 2,5
Oncorhynchus mykiss
Rainbow trout FT Meas Analytical 28 d 15-17 Weight 1-3 g -------- -------- Bresch 1991 LR 5
Oncorhynchus mykiss
Rainbow trout SR Nom 98.0% 96 h 15 Swimming
behavior Juvenile -------- -------- Brewer et al. 2001 LL 2,5,6
64

Species Common identifier
Test type
Meas/ Nom
Chemical grade Duration Temp
(oC) Endpoint Age/size LC/EC50(μg/L)
MATC (μg/L) Reference Rating
Reason for
rating
Oncorhynchus mykiss
Rainbow trout SR Nom 98.0% 96 h 15
Acetylcholin-esterase
inhibition Juvenile -------- -------- Brewer et al.
2001 LL 2,5,6
Oncorhynchus mykiss
Rainbow trout S Nom 89.0% 96 h 13 Mortality 1.2 g 90 -------- Johnson &
Finley 1980 LL 4,6
Oncorhynchus mykiss
Rainbow Trout S Nom 91% 96 h 13-18 Mortality 3-7 cm 400 -------- Beliles 1965 RL 6
Oncorhynchus mykiss
Rainbow Trout S Nom 99.8% 96 h 14 Mortality 6 cm,
1.5g >100,000 -------- Grade 1993 LR 5
Oncorhynchus tshawytscha
Chinook salmon SR Nom Technical 96 h 10 Mortality Eyed
eggs 545,000 -------- Viant et al. 2006 RL 6
Oncorhynchus tshawytscha
Chinook salmon SR Nom Technical 96 h 10 Mortality Alevins 29,500 -------- Viant et al.
2006 RL 6
Oncorhynchus tshawytscha
Chinook salmon SR Nom Technical 96 h 10 Phospho-creatine
levels Eyed eggs -------- 70,700 Viant et al.
2006 RL 2,6
Oreochromis niloticus x
Mossambicus albina
Red tilapia SR Nom 97.5% 24 h 22 Mortality 4.27 g 6000
(4980-30240)
-------- Palacio et al. 2002 LL 3,6
Oreochromis niloticus x
Mossambicus albina
Red tilapia SR Nom 97.5% 48 h 22 Mortality 4.27 g 5650
(4660-13150)
-------- Palacio et al. 2002 LL 3,6
65
Species Common identifier
Test type
Meas/ Nom
Chemical grade Duration Temp
(oC) Endpoint Age/size LC/EC50(μg/L)
MATC (μg/L) Reference Rating
Reason for
rating Oreochromis
niloticus x Mossambicus
albina
Red tilapia SR Nom 97.5% 72 h 22 Mortality 4.27 g 4360
(4090-4910)
-------- Palacio et al. 2002 LL 3,6
Oreochromis niloticus x
Mossambicus albina
Red tilapia SR Nom 97.5% 96 h 22 Mortality 4.27 g 3850
(3660-4110)
-------- Palacio et al. 2002 LL 3,6
Oryzias latipes Japanese medaka S Nom 99.0% 96 h NR Total hatch 1-d
embryos -------- 19,300 Hamm & Hinton 2000 LL 3,6
Oryzias latipes Japanese medaka S Nom 99.0% 96 h NR Total hatch 3-d
embryos -------- 19,300 Hamm & Hinton 2000 LL 3,6
Oryzias latipes Japanese medaka S Nom 99.0% 8 d NR Total hatch 1-d
embryos -------- 14,900 Hamm & Hinton 2000 LL 3,6
Oryzias latipes Japanese medaka S Nom 99.0% 6 d NR Total hatch 3-d
embryos -------- 19,300 Hamm & Hinton 2000 LL 3,6
Oryzias latipes Japanese medaka S Nom 99.0% 96 h NR Mean day of
hatch 3-d
embryos -------- 19,300 Hamm & Hinton 2000 LL 3,6
Oryzias latipes Japanese medaka S Nom 99.0% 96 h NR Total length of
larvae 1-d
embryos -------- 2,200 Hamm & Hinton 2000 LL 3,6
Oryzias latipes Japanese medaka S Nom 99.0% 96 h NR Total length of
larvae 3-d
embryos -------- 2,200 Hamm & Hinton 2000 LL 3,6
66

Species Common identifier
Test type
Meas/ Nom
Chemical grade Duration Temp
(oC) Endpoint Age/size LC/EC50(μg/L)
MATC (μg/L) Reference Rating
Reason for
rating
Oryzias latipes Japanese medaka S Nom 99.0% 96 h NR Total length of
larvae 5-d
embryos -------- 2,200 Hamm & Hinton 2000 LL 3,6
Oryzias latipes Japanese medaka S Nom 99.0% 8 d NR Total length of
larvae 1-d
embryos -------- 2,200 Hamm & Hinton 2000 LL 3,6
Oryzias latipes Japanese medaka S Nom 99.0% 6 d NR Total length of
larvae 3-d
embryos -------- 2,200 Hamm & Hinton 2000 LL 3,6
Oryzias latipes Japanese medaka ------ ------ Technical 48 h ------ Mortality ------ 5,300 --------
Nishiuki & Hashimoto
1967 LL 6
Pimephales promelas
Fathead minnow SR Nom 99.0% 7 d 25 Biomass < 24 h
IC25: 1176 (413-2261)
-------- Dwyer et al. 2005 RL 6
Pimephales promelas
Fathead minnow FT Meas 88.2% 32 d NR Growth < 24 h
embryos -------- 25 Norberg-King 1989 RL 4,6
Pimephales promelas
Fathead minnow SR Meas 88.2% 7 d NR Growth < 24 h
larvae -------- 251 Norberg-King 1989 RL 4,6
Pimephales promelas
Fathead minnow FT Meas 88.2% 7 d NR Growth < 24 h
larvae -------- 210 Norberg-King 1989 RL 4,6
Pimephales promelas
Fathead minnow FT Meas 88.2% 7 d NR Growth < 24 h
larvae -------- 122 Norberg-King 1989 RL 46
Poecilia reticulata Guppy SR Nom 98.0% 96 h 20-22 Mortality Adult
females 800 -------- Keizer et al. 1991 LL 4,6
67

MATC (μg/L) Reference Rating
Reason for
rating Species Common
identifier Test type
Meas/ Nom
Chemical grade Duration Temp
(oC) Endpoint Age/size LC/EC50(μg/L)
Pteronarcys californica Insect S Nom 89.0% 96 h 15 Mortality
Second year class
25 (20-30) -------- Johnson &
Finley 1980 LL 4,6
Pteronarcys californica Insect S Nom Technical 24 h 15.5 Mortality 30-35
mm
155 (115-209)
-------- Sanders & Cope 1968 LL 4,6
Pteronarcys californica Insect S Nom Technical 48 h 15.5 Mortality 30-35
mm 60
(42-84) -------- Sanders & Cope 1968 LL 4,6
Pteronarcys californica Insect S Nom Technical 96 h 15.5 Mortality 30-35
mm 25
(20-51) -------- Sanders & Cope 1968 LL 4,6
Rana clamitans Green frog SR Nom Technical 16 d 18.1 Growth Embryo -------- 1.6 Harris et al.
1998 LL 1,6
Salvelinus namaycush Brook trout S Nom 92.0% 96 h 12 Mortality 3.2 g
602 (400-906)
-------- Johnson & Finley 1980 LL 4,6
Selenastrum capricornutum Green algae S Meas 87.7% 7 d 24 Mean standing
crop, cells/mL 6-8 d old culture -------- NOEC
< 60 Hughes 1988 LR 5
Silurus glanis European catfish S Nom 63% 96 h 16 Mortality 12-14 g,
10-12 cm 4.14 -------- Koprucu et al. 2006 LR 1,3
Simocephalus serrulatus Cladoceran S Nom 89.0% 48 h 15 Immobility 1st instar
Test 1: 1.4
(1.2-1.6)Test 2:
1.8 (1.4-2.2)
-------- Johnson & Finley 1980 LL 4,6
68

MATC (μg/L) Reference Rating
Reason for
rating Reasons for exclusion 1. Chemical grade
2. Endpoint not linked to population effects 3. Family not in N. America 4. Control response 5. No toxicity value calculated 6. Low reliability score
LC/EC50(μg/L)
Meas/ Nom
Chemical grade Duration Temp
(oC) Endpoint Age/size
69
Test type Species Common
identifier
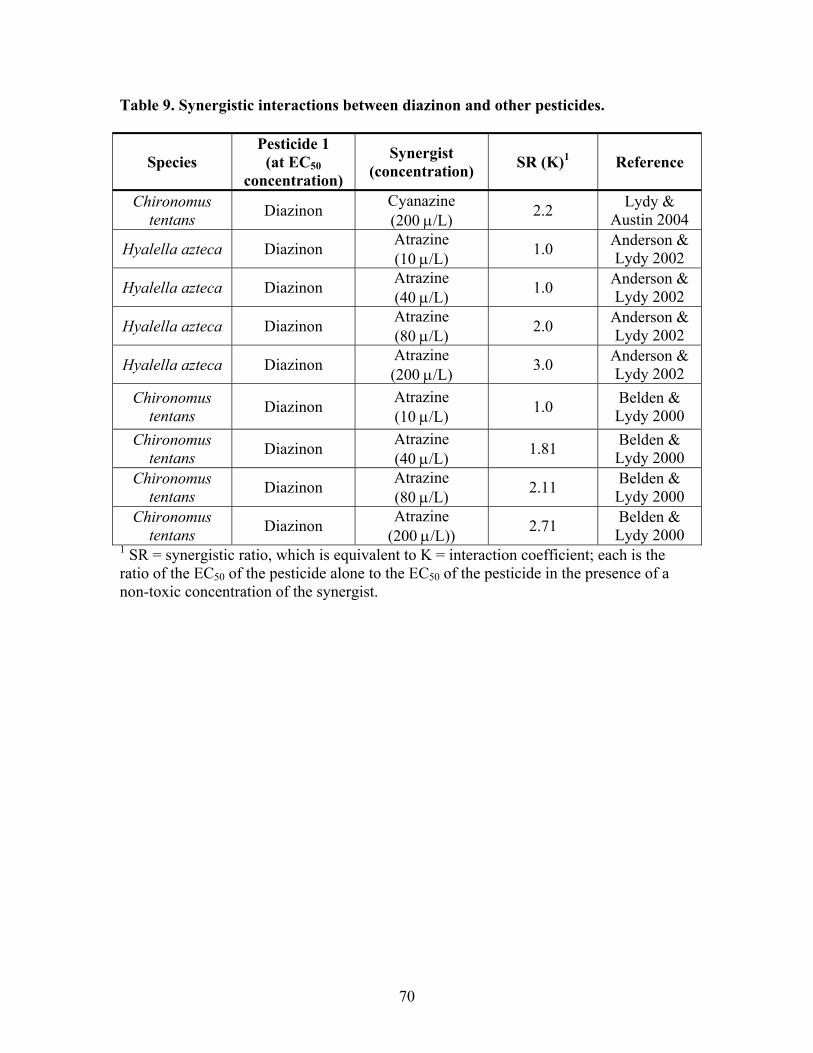
Table 9. Synergistic interactions between diazinon and other pesticides.
Species Pesticide 1
(at EC50 concentration)
Synergist (concentration) SR (K)1 Reference
Chironomus tentans Diazinon Cyanazine
(200 μ/L) 2.2 Lydy & Austin 2004
Hyalella azteca Diazinon Atrazine (10 μ/L) 1.0 Anderson &
Lydy 2002
Hyalella azteca Diazinon Atrazine (40 μ/L) 1.0 Anderson &
Lydy 2002
Hyalella azteca Diazinon Atrazine (80 μ/L) 2.0 Anderson &
Lydy 2002
Hyalella azteca Diazinon Atrazine (200 μ/L) 3.0 Anderson &
Lydy 2002 Chironomus
tentans Diazinon Atrazine (10 μ/L) 1.0 Belden &
Lydy 2000 Chironomus
tentans Diazinon Atrazine (40 μ/L) 1.81 Belden &
Lydy 2000 Chironomus
tentans Diazinon Atrazine (80 μ/L) 2.11 Belden &
Lydy 2000 Chironomus
tentans Diazinon Atrazine (200 μ/L)) 2.71 Belden &
Lydy 2000 1 SR = synergistic ratio, which is equivalent to K = interaction coefficient; each is the ratio of the EC50 of the pesticide alone to the EC50 of the pesticide in the presence of a non-toxic concentration of the synergist.
70

Table 10. Predicted LC50 values for threatened or endangered species
Species Common Name Family LC50 (μg/L) Surrogate
Gila elegans Bonytail chub Cyprinidae 2408 Pimephales promelas
Ptychocheilus lucius
Colorado squawfish Cyprinidae 2750 Pimephales
promelas
Oncorhynchus clarki Cutthroat trout Salmonidae 1205 Salvelinus
fontinalis
Oncorhynchus kisutch Coho salmon Salmonidae 1382 Salvelinus
fontinalis
Oncorhynchus mykiss Steelhead Salmonidae 730 Salvelinus
fontinalis
71

Appendix A
Ecosystem and Field Study Supplemental Information
A1

Amato JR, Mount DI, Durhan EJ, Lukasewycz MT, Ankley GT, Robert ED. 1992. An example of the identification of diazinon as a primary toxicant in an effluent. Environmental Toxicology and Chemistry 11: 209-216. A toxicity identification evaluation (TIE) was run by performing separate tests with Pimephales promelas and Ceriodaphnia dubia using municipal effluent. Diazinon concentrations of 0.21-1.31 μg/L (impact of contaminants in most about 0.35 μg/L) were measured via gas chromatography analysis and correlated well with the toxicity of each sample. Anderson BS, Hunt JW, Phillips BM, Nicely PA, de Vlaming V, Connor V, Richard N, Tjeerdema RS. 2003. Integrated assessment of the impacts of agricultural drainwater in the Salinas River (California, USA). Environmental Pollution 124:523-532. Impact of contaminants in agricultural drainwater were examined by measuring macroinvertebrate abundances in river bottoms, toxicity tests of river water to Ceriodaphnia dubia, and measured pesticide concentrations. Diazinon concentrations of 3.0-0.2 μg/L correlated to low macroinvertebrate abundance (not significant) and toxicity to Ceriodaphnia dubia. Bailey HC, Deanovic L, Reyes E, Kimball T, Larson K, Cortright K, Connor V, Hinton DE. 2000. Diazinon and chlorpyrifos in urban waterways in Northern California, USA. Environmental Toxicology and Chemistry 19:82-87. Concentrations of diazinon were measured using enzyme-linked immunosorbent assays (ELISA) in urban streams of Sacramento and Stockton, CA, in 1994 and 1995. Most samples were collected between October and May and associated with storm water runoff events. Diazinon concentrations ranged from below detection limit to 1.5 µg/L, with a median of 0.21 µg/L (n=230 samples). TIEs indicated diazinon and chlorpyrifos as major players in observed toxicity to Ceriodaphnia dubia. Burkhard L, Jenson JJ. 1993. Identification of ammonia, chlorine, and diazinon as toxicants in a municipal effluent. Archives of Environmental Contamination and Toxicology 25:506-515. A toxicity identification evaluation (TIE) was run by performing separate tests with Pimephales promelas and Ceriodaphnia dubia using municipal effluent over an 8-month period. Ammonia, chlorine and diazinon were identified as the primary cause of toxicity. Toxicity occurred when the diazinon concentrations were 0.054 - 1.68 μg/L. De Vlaming V, DiGiorgio C, Fong S, Deanovic LA, de la Paz Carpio-Obeso M, Miller JL, Miller MJ, Richard NJ. 2004. Irrigation runoff insecticide pollution of rivers in the Imperial Valley, California (USA). Environmental Pollution 132:213-229. Studies on water quality of the Alamo River and New River conducted between 1993 and 2002 revealed widespread toxicity due to the OP pesticides chlorpyrifos and diazinon from agricultural applications. Diazinon was detected at 0.1-2.8 toxic units (1 toxic unit = 0.4 µg/L) in the Alamo River, and was present in every toxic sample from the New River.
A2

Hunt JW, Anderson BS, Phillips BM, Nicely PN, Tjeerdema RS, Puckett HM, Stephenson M, Worcester K, de Vlaming V. 2003. Ambient Toxicity due to chlorpyrifos and diazinon in a Central California coastal watershed. Environmental Monitoring and Assessment 82:83-112. In all samples where diazinon was detected there was no survival of Ceriodaphnia dubia. The highest concentration of diazinon was 5.2 μg/L and the average concentration detected was 0.87 μg/L. Other evidence indicated OPs as cause of toxicity. NOTE: This study was also cited in Mixtures sections of Chlorpyrifos and Diazinon criteria reports. Kuivila KM, Foe CG. 1995. Concentrations, transport and biological effects of dormant spray pesticides in the San Francisco Estuary, California. Environmental Toxicology and Chemistry 14:1141-1150. This study detected distinct pulses of pesticides, including diazinon in the San Joaquin and Sacramento rivers following rainfall. Sacramento River water at Rio Vista was acutely toxic to Ceriodaphnia dubia for 3 consecutive days and San Joaquin River water at Vernalis for 12 consecutive days. Diazinon concentrations were high enough for most, but not all, of the observed toxicity. Measured concentrations in the Sacramento and the San Joaquin rivers were 0.037-0.281 μg/L, and 0.043-1.07 μg/L diazinon, respectively. Teh SJ, Deng DF, Werner I, Teh FC, Hung SSO. 2005. Sublethal toxicity of orchard stormwater runoff in Sacramento splittail (Pogonichthys macrolepidotus) larvae. Marine Environmental Research 59:203-216. This study measured survival, growth, histopathological abnormalities and stress protein expression (hsp60, hsp70) in larval fish (Sacramento splittail) exposed for 96 h to storm water runoff samples collected within a prune orchard after dormant spray application of diazinon. Fish were moved to clean water after 96 h exposures and maintained for 3 months to evaluate delayed effects. No significant mortality occurred after 96 h exposure to runoff containing a maximum concentration of 210.4 µg/L diazinon, but body weight and condition factor after 3 months were lower in fish exposed to runoff containing 210.4 µg/L diazinon than in control animals. Stress proteins were significantly above control levels in exposed fish. Histopathological abnormalities were seen one week after exposure, but not after the 3 month recovery period. Werner I, Deanovic LA, Connor V, de Vlaming V, Bailey HC, Hinton DE. 2000. Insecticide-caused toxicity to Ceriodaphnia dubia (Cladocera) in the Sacramento-San Joaquin River delta, California, USA. Environmental Toxicology and Chemistry 19:215-227. In this 1993-1995 monitoring study, samples were collected monthly from 24 sites in the Sacramento-San Joaquin River delta. Diazinon was identified as a primary toxicant primarily during fall and winter months, and measured concentrations in toxic samples ranged from 0.125 to 0.422 µg/L. Werner I, Deanovic LA, Hinton DE, Henderson JD, Oliveira GH, Wilson BW, Osterli P, Krueger W, Wallender WW, Oliver MN, Zalom FG. 2002. Toxicity of stormwater runoff after dormant spray application of diazinon and esfenvalerate
A3

(Asana) in a French Prune Orchard, Glenn County, California. Bulletin of Environmental Contamination and Toxicology 68:29-36. In this study, larval fish (fathead minnows, Sacramento splittail) and water fleas (Ceriodaphnia dubia) were exposed to storm water runoff collected in an orchard after application of dormant spray insecticides, diazinon and esfenvalerate. Diazinon concentrations measured in orchard runoff were 118-210 µg/L. Runoff from one of the four diazinon sprayed areas was toxic to minnow larvae. Inexplicably, a non-sprayed area, which had 15.6 μg/L diazinon, exhibited that same percent mortality of minnows, about 25% mortality. (Similar study to Werner et al. (2004) discussed in mesocosm data section.)
A4

Appendix B
Comparison of acute data used by USEPA, CDFG, and in this report for diazinon water quality criteria
B1
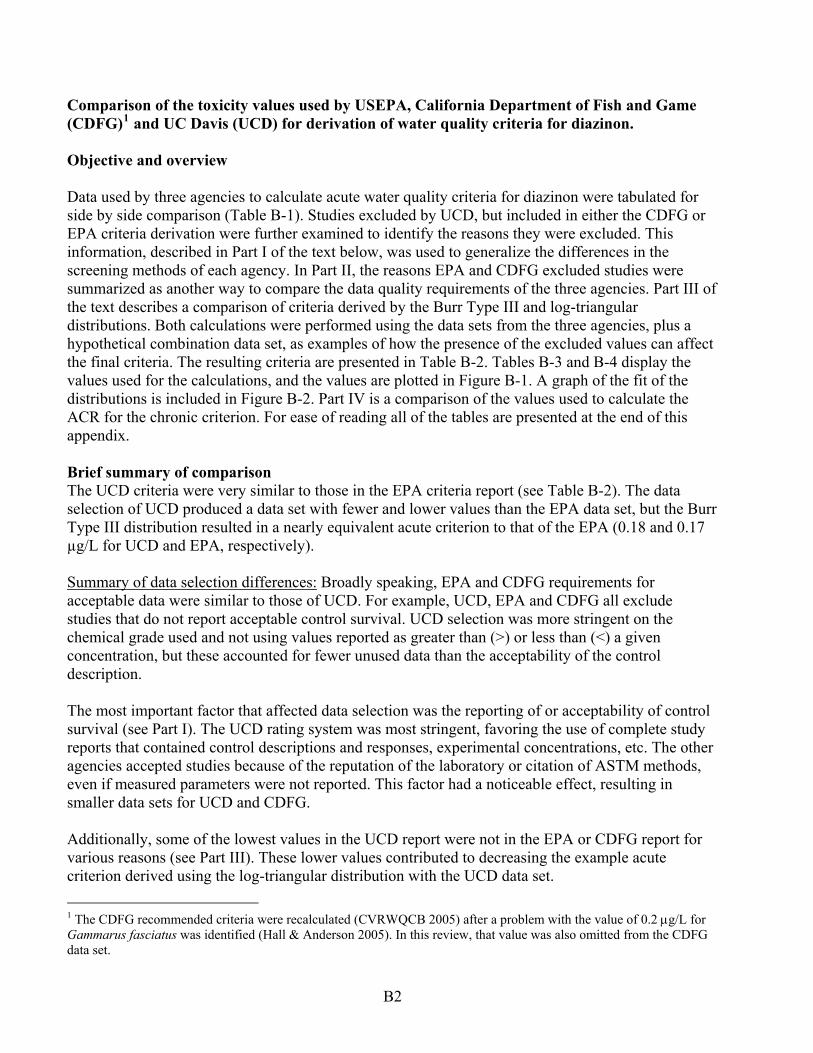
Comparison of the toxicity values used by USEPA, California Department of Fish and Game (CDFG)1 and UC Davis (UCD) for derivation of water quality criteria for diazinon. Objective and overview Data used by three agencies to calculate acute water quality criteria for diazinon were tabulated for side by side comparison (Table B-1). Studies excluded by UCD, but included in either the CDFG or EPA criteria derivation were further examined to identify the reasons they were excluded. This information, described in Part I of the text below, was used to generalize the differences in the screening methods of each agency. In Part II, the reasons EPA and CDFG excluded studies were summarized as another way to compare the data quality requirements of the three agencies. Part III of the text describes a comparison of criteria derived by the Burr Type III and log-triangular distributions. Both calculations were performed using the data sets from the three agencies, plus a hypothetical combination data set, as examples of how the presence of the excluded values can affect the final criteria. The resulting criteria are presented in Table B-2. Tables B-3 and B-4 display the values used for the calculations, and the values are plotted in Figure B-1. A graph of the fit of the distributions is included in Figure B-2. Part IV is a comparison of the values used to calculate the ACR for the chronic criterion. For ease of reading all of the tables are presented at the end of this appendix. Brief summary of comparison The UCD criteria were very similar to those in the EPA criteria report (see Table B-2). The data selection of UCD produced a data set with fewer and lower values than the EPA data set, but the Burr Type III distribution resulted in a nearly equivalent acute criterion to that of the EPA (0.18 and 0.17 µg/L for UCD and EPA, respectively). Summary of data selection differences: Broadly speaking, EPA and CDFG requirements for acceptable data were similar to those of UCD. For example, UCD, EPA and CDFG all exclude studies that do not report acceptable control survival. UCD selection was more stringent on the chemical grade used and not using values reported as greater than (>) or less than (<) a given concentration, but these accounted for fewer unused data than the acceptability of the control description. The most important factor that affected data selection was the reporting of or acceptability of control survival (see Part I). The UCD rating system was most stringent, favoring the use of complete study reports that contained control descriptions and responses, experimental concentrations, etc. The other agencies accepted studies because of the reputation of the laboratory or citation of ASTM methods, even if measured parameters were not reported. This factor had a noticeable effect, resulting in smaller data sets for UCD and CDFG. Additionally, some of the lowest values in the UCD report were not in the EPA or CDFG report for various reasons (see Part III). These lower values contributed to decreasing the example acute criterion derived using the log-triangular distribution with the UCD data set. 1 The CDFG recommended criteria were recalculated (CVRWQCB 2005) after a problem with the value of 0.2 μg/L for Gammarus fasciatus was identified (Hall & Anderson 2005). In this review, that value was also omitted from the CDFG data set.
B2

Summary of the influence of the statistical distribution: The Burr Type III distribution resulted in both higher and lower criteria in different instances. The log-triangular distribution gave more similar results to the Burr Type III distribution when the Burr Type III distribution was fit to a lower subset of the data. PART I Reasons studies were excluded by UCD, while the values were used by CDFG and/or EPA UCD excluded some of the acute values that were used in CDFG and EPA diazinon criteria reports (Siepmann and Finlayson 2000, USEPA 2005). This section summarizes the main reasons those studies were excluded by UCD. First, the number of acute studies used by agency was counted. In this count, if multiple species were tested in the same study, they were counted as separate studies. The EPA report used the most studies (36), while CDFG (29) and UCD (22) used less studies. There were 29 values used by CDFG or EPA that were excluded by UCD. The reasons UCD did not use the values from those studies are listed bellow:
Number of times a parameter was used to exclude a value, followed by the reason:
(19) control survival not reported or acceptable* (4) chemical grade was lower than 80% pure or not reported & control or control survival not
reported or acceptable (1) no toxicity values calculated & chemical grade was lower than 80% pure (4) lack of other parameters that had less weight in rating system (control not described, water
quality parameters not reported, concentrations used not reported, no standard method, temp not held to ± 1 ºC, organism source not reported)
(1) was not obtained because it did not have a calculated value and the study was not in the peer reviewed literature, OPP or ECOTOX data bases. (Vial 1990, Daphnia magna LC50 > 2.6 μg/L)
Judging by the list above and comparing to criteria of the other agencies in Part II, UCD selection was more stringent on the chemical grade used and not using values reported as > or <. More importantly, there was some difference in evaluation of an acceptable description of controls as described below. *These 19 values came from nine studies in which control survival was not reported or acceptable. Both CDFG and EPA also state that unreported or unacceptable control response was a reason for excluding studies (see Part II). However, these studies were used in their documents. EPA used all nine studies, while CDFG used only four of the nine. Of the studies CDFG used, two were Sanders and Cope (1966) and Keizer et al. (1991), which CDFG states had 100% control survival, but this information was not found in these studies. In the CDFG report, personal communication was also cited for Ankley et al. (1991). UCD contacted the author who said they may or may not still have this
B3

record. The information was not received then or after a later follow up. CDFG also used Mayer and Ellersieck (1986), for which they describe the reference and the reason they use the studies below. Note about Mayer and Ellersieck (1986), Johnson and Finley (1980) Description from CDFG (Siepmann & Finlayson 2000) criteria report: "Mayer and Ellersieck (1986) - In 1986, a study was conducted by the Fish and Wildlife Service to generate static acute toxicity test data for 410 chemicals with 66 freshwater species. All tests were performed at the Columbia National Fisheries Research Laboratory and its field laboratories between 1965 to 1984. The studies on technical grade diazinon (97%) were conducted with eight species. The tests were generally in compliance with ASTM (1980) and EPA (1975) standards. At least five concentrations of diazinon were tested. Two replicates per concentration were tested. Depending on the species, water quality parameters during the tests were as follows: temperature of 2.0 ºC to 29 ºC; pH of 6.0 to 9.0; and hardness of 44 mg/L to 272 mg/L. Control survival, dissolved oxygen, and measurement of diazinon concentrations were not discussed…. Although information about some important test characteristics could not be obtained, most of these data were accepted because of the use of ASTM guidelines and the reputation of the laboratory…." The Mayer & Ellersieck (1986) report contains most of the data reported in Johnson and Finley (1980). Mayer Ellersieck (1986) says to assume all tests meet cited ASTM and EPA methods. Johnson and Finley (1980) describe methods in detail, but not use of controls. Values from Sanders and Cope (1968), Sanders (1969), and Macek et al. (1969) are also repeated in these volumes. These references are also the source of the erroneous value of 0.2 μg/L for Gammarus fasciatus. From the UCD methods perspective, to be fair and impartial in rating the quality of all studies, such assumptions should be avoided and evaluation should be based only on information reported. It was also preferable that original study reports be used. This helps to avoid errors, as in the value for G. fasciatus.
PART II The data screening methods in the EPA and CDFG criteria reports were reviewed here to be able to compare them with UCD methods. Overall, the reasons EPA and CDFG provided for excluding studies were similar to those of UCD. CDFG exclusion of studies The CDFG diazinon and chlorpyrifos criteria document (Siepmann and Finlayson 2000) contains an appendix that summarizes and briefly discusses why studies were used or not used, including both saltwater and freshwater data. The 16 studies rejected often had more than one of the reasons below. Number of times a parameter was used to exclude a value, followed by the reason:
(8) active ingredient too low or not reported (6) control survival too low or not reported (5) mortality range inadequate or not reported a few studies also cited
B4

-dissolved oxygen low or not reported -no toxicity values calculated -inadequate duration -inappropriate dilution water -hardness not reported EPA exclusion of studies EPA documents (USEPA 2000b, 2005) contain an unused data section in which a reason for exclusion of a study is followed by citations of studies omitted for that reason. Freshwater and saltwater data were mixed in this section that contains 158 excluded studies. Number of times a parameter was used to exclude a value, followed by the reason:
(43) conducted with species that are not resident in North America (16) data were compiled from other sources (42) diazinon was a component of a drilling mud, effluent, mixture, sediment or sludge (11) either the test procedures, test material, or dilution water was not adequately described (3) the tests were conducted in distilled or deionized water without addition of appropriate
salts or were conducted in chlorinated or “tap” water, (1) concentration of a water-miscible solvent used to prepare the test solution exceeded 0.5
mL/L (10) results were not adequately described or could not be interpreted (4) tests conducted without controls, with unacceptable control survival, or with too few tests (1) organisms preconditioned to organophosphorus chemicals (27) experimental model was plasma, enzymes, tissue, or cell cultures
Additionally, examination of data tables and species mean acute values show that acceptable values from static tests with fish were not used if acceptable values were available from flow through tests. PART III Burr Type III and log-triangular criteria calculation with all three data sets Methods To examine how the different values selected may influence the final criteria calculation, the log-triangular and Burr Type III distributions were fit to each agency's data set to calculate criteria. To address the criticism that criteria by UCD method were lower simply because it excluded higher values contained mostly in Mayer & Ellersieck (1986), a hypothetical combination data set was created by adding excluded values back into the UCD data set. This was done by starting with the UCD data set (as it is in Table B-3 or B-4) and adding in any species values from EPA data where UCD had none, or from CFDG if EPA had none. To fit the log-triangular distribution, Genus Mean Acute Values (GMAVs) were used following EPA (1985) methods. To fit the Burr Type III distribution, Species Mean Acute Values (SMAVs) were used, according to the UC-Davis methodology (TenBrook et al. 2009a). SMAVs were calculated as the geometric mean of all LC50 values for the same species. Then, GMAVs were calculated as the geometric mean of all species values in the same genus. The 5th percentile at 50% confidence
B5

estimates were calculated for the Burr Type III distribution, which is the same estimate used in UCD criteria reports. These results are presented in Tables B-3 and B-4. For the log-triangular calculation, the lowest 4 values are repeated at the bottom of the table for easy comparison, as those values are weighted heavily in this calculation. Plots of the distributions fit to the UCD data set are included as Figure B-2. The EPA log-triangular plot was graphed following the procedure in USEPA (1985) and the Burr Type III distribution was constructed using the fit parameters obtained from the BurrliOZ software (CSIRO 2001). For the Burr Type III distribution, the EPA, CDFG, and hypothetical data sets did not produce a 5th percentile value (values were calculated as 0.000000, 0.027 and 0.020 µg/L, respectively, and the fitted distribution did not pass the fit test). This was likely due to the multimodality of these data (Figure B-1 and B-2). Also included in Table B-4 is the calculation performed with the lower subset of values as suggested in the UCD methodology for data that is multimodal. The visual break was below 400 µg/L and separated the phyla Arthropoda from the other phyla. Chordates (fish) and a few other phyla had higher LC50 values. Rana clamitans, which did not have an explicit value and was reported as > 50 µg/L, was grouped with the other chordates for this calculation. Also, the CDFG values for Lepomis macrochirus (272 µg/L) and Oncorhynchus mykiss (90 µg/L) did not fit clearly into one subset and were grouped with the other chordates. When the UCD and CDFG data sets were split, they contained less than eight values. Following the UCD methodology, data sets with eight or fewer values were fit to a Log-Logistic distribution. This was done using the ETX 1.3 software (Aldenberg 1993). Results Using these different data sets and methods, most of the resulting criteria equated to approximately 0.2 µg/L (Table B-2). Use of the log-triangular distribution with the UCD data set and the Burr Type III distribution with the CDFG data set resulted in lower criteria, closer to 0.1 µg/L. These lower criteria could have been caused by the lower values and a smaller number of values in these data sets. Influential values The UCD data set did contain some of the lowest values at the sensitive end, which seemed to be very influential in the log-triangular distribution. Sources of the low GMAVs not included in the EPA report included one study from CDFG (Neomysis mercedis, CDFG 1992c, d) and one published after the EPA 2005 criteria report (Procloeon sp., Anderson et al. 2006). For the genus Daphnia (magna and pulex) the GMAV used were higher in EPA and CDFG reports than in the UCD report, 1.06 and 0.902 µg/L vs. 0.52 µg/L, respectively. The values used by EPA and CDFG did not rate high enough to be used by UCD, while UCD used the value from Surprenant (1988a), which was not used by EPA (although it is an unpublished report, typical of data used to meet registration requirements) or CDFG, perhaps because the organisms were fed during the acute test. Also, UCD used a value for Hyalella azteca (Anderson and Lydy 2002) that was published after the CDFG 2000 report and that EPA did not use. Log-Triangular Distribution, Table B-3 Criteria resulting from the log triangular calculation for the UCD data set were lower than those resulting from the EPA, CDFG, or hypothetical data sets, which were more similar. When the
B6

excluded values were added back to the UCD data set (exemplified in the hypothetical data set) the criteria doubles, from 0.083 to 0.20 µg/L. Two reasons were found to explain the lower criterion from the UCD data set: 1) the lower values in the data sets, and 2) there were fewer values in the data set. However, the criterion from the CDFG data set, which had only one more value (14 values), was closer to the EPA criterion (derived from 20 values). The two lowest values in the UCD data set may be driving the difference, setting the resulting criterion apart from the others. Burr Type III Distribution, Table B-4 The bimodal data distribution makes it difficult to derive a number with the whole EPA, hypothetical, and CDFG data sets using the Burr Type III distribution. Surprisingly, the criterion derived from the lower EPA subset (0.21 µg/L) using the Burr Type III distribution was close to the criterion reported by EPA (0.17 µg/L). The criterion derived using the entire UCD data set (0.18 µg/L) was similar to that of the EPA (0.20 µg/L). The criteria results of the Burr Type III distribution approach (including the log-logistic distribution) were higher compared to the log-triangular results for the same data set in two of four cases, particularly for the UCD data set (0.18 vs. 0.083 µg/L). For the hypothetical data set, the criteria were equivalent (0.20 µg/L), and for the CDFG data set it was lower with the log-triangular than Burr Type III (0.11 and 0.16 µg/L, respectively). The purpose of the hypothetical data set was to examine the effect of the exclusion of values from Mayer and Ellersieck (1986) by UCD. The values were added back to the hypothetical data set to see if they would alter the criteria significantly. Using the Burr Type III distribution the criterion from the UCD dataset (0.18 µg/L) was close to that from hypothetical data set (0.20 µg/L), suggesting these values were not very influential. This comparison could not be made exactly because the Burr Type III distribution could only be used with the lower subset of the values in the hypothetical data set. However, the criteria from the log-triangular distribution were the same for both data sets (0.20 µg/L.) The Burr Type III distribution fit the entire UCD data set, but this data set was also split based on the bimodal distribution for the purpose of comparison. Fitting the log-logistic distribution to the lower subset provided similar results to the log-triangular analysis (0.1 and 0.083 µg/L, respectively). Summary Overall, criteria from different agencies did not vary widely and were comparable, especially those of EPA and UCD. This comparison demonstrates that the UCD data set yielded a lower criterion using the log-triangular distribution, but the Burr Type III distribution yielded a nearly equivalent criterion (0.18 µg/L) to the EPA criterion (0.17 µg/L). The Burr Type III distribution does not always provide higher criteria, as this was not the case in the CDFG data set or the chlorpyrifos report. The main factors altering criteria:
1) inclusion of lower data, by UCD for various reasons; 2) the use of less data by UCD (and CDFG), see part I for details;3) the distribution, with the Burr Type III distribution resulting in both higher and lower
criteria in different instances. As a final point of interest for the diazinon data set, the log-triangular distribution gave more similar results to the Burr Type III distribution when it was fit to only the lower subset of the data.
B7

Table B-1. Comparison of Acceptable Acute Values for Diazinon Criteria by Agency. Y- indicates agency used that value. Where disputed, the value used is shown. Only studies that at least one agency used are included. Please refer to an appropriate criteria document for full citations
Species, Common identifier
LC/EC50 (µg/L)
EPA 2005
CDFG 2000
UCD 2010 Reference
UCD Rating: Reason for Exclusion (see end
of table for key) Comments
Brachionus calyciflorus, Rotifer
29,220 Y Fernandez-Casalderrey et al. 1992a
29,220 was a preliminary LC50, w/o test details (Rating for other values in study -RL: SM, Conc NR, DO, C, % Solvent NR)
Carassius auratus, Goldfish
9,000 Y Beliles 1965 RL: 7, SM, Conc NM, % solvent NR, Temp not held ± 1 ºC, H, A,
DO, C, pH, P,
Ceriodaphnia dubia, Cladoceran
0.5 Y Y Ankley et al. 1991 RN: 4, 7, 8 Conc NR, H, A, DO, C, Ph, P,
>0.05% solvent
CDFG: also cited pers comm
0.58 Y Bailey et al. 1997 EPA used 48h values (there were 4) WB and CDFG used 96h values
(only 2) 0.48 Y 0.26 Y 0.29 Y 0.32 Y Y 0.35 Y Y 0.33 Y Bailey et al. 2000 0.38 Y Bailey et al. 2001 0.33 Y 0.21 Y Banks et al. 2005 0.45 Y Banks et al. 2003 0.436 Y Y CDFG 1998a,
Test 122
0.47 Y Y CDFG 1992a, Test 157
0.507 Y Y CDFG 1992b, Test 163
0.57 Y Norberg-King 1987
(Tests 1 & 3) LL: 8, SM, Conc NR, Fed, A,
H, P
EPA: Acceptable: h Memorandum, Not in
OPP data base or Diazinon IRED
0.35 Y (Tests 4, 5, 8-14) LL: 8 SM, Conc NR, Fed, DO, Inappropriate
dilution water, A, C, H, pH, P
B8

Species, Common identifier
LC/EC50 (µg/L)
EPA 2005
CDFG 2000
UCD 2010 Reference
UCD Rating: Reason for Exclusion (see end
of table for key) Comments
0.35 Y See above 0.25 Y See above 0.33 Y See above 0.35 Y See above 0.59 Y See above 0.43 Y See above 0.35 Y See above 0.36 Y See above Chironomus tentans, Insect
10.7 Y Y Ankley and Collyard 1995
Danio rerio, Zebrafish
8,000 Y Y Keizer et al. 1991 LN: 4, 7, 8, Conc. NR, fed NR, DO, A, C, H, #
per replicate NR
Daphnia magna, Cladoceran
0.8 Y Y Ankley et al. 1991 RN: 4, 7, 8 Conc NR, H, A, DO, C, Ph, P,
>0.05% solvent
CDFG: also cited pers comm.
1.5 Y Dortland 1980 LN: 4, 7, SM Conc NR, H, A, DO, C, pH,
0.52 Y Surprenant 1988a
>2.6 Y Vial 1990 No value calculated, Not obtained
Not in OPP data base
0.96 Y Vilkas 1976 LL: 4, 7, 8, Conc NR, Daphnia pulex, Cladoceran
0.65 Y Y Ankley et al. 1991 RN: 4, 7, 8 Conc NR, H, A, DO, C, Ph, P,
>0.05% solvent
CDFG: also cited pers comm.
0.9 Y Y Cope 1965; Sanders and Cope 1966
N: 1,4, 8, SM CDFG: Sanders and Cope 1966 " control survival was 100%'
0.8 Y Y Johnson and Finley 1980; Mayer and Ellersieck 1986
LL: 4, 7* CDFG: "control survival acceptable in all tests", also cited
pers. comm.
Dugesia tigrina, Planaria
11,640 Y Phipps 1988 N: 1,7,8 Not in OPP data base or Diazinon IRED
Gammarus fasciatus, Amphipod
2.04 Y Johnson and Finley 1980; Mayer and Ellersieck 1986
LL: 4,7 * CDFG originally use the value of 0.204. See
footnote 1, p C2
Gammarus pseudolimnaeus, Amphipod
16.82 Y Y Hall and Anderson 2005
B9

Species, Common identifier
LC/EC50 (µg/L)
EPA 2005
CDFG 2000
UCD 2010 Reference
UCD Rating: Reason for Exclusion (see end
of table for key) Comments
Gillia altilis, Snail 11,000 Y Robertson and Mazzella 1989
LL: 4,7, SM, Conc NM, DO, C, P, Fed NR, %
solvent too high, Temp not held ± 1 ºC, Org.
possibly prior contaminant exposure
Hyalella azteca, Amphipod
6.51 Y Ankley and Collyard 1995
LR: 4
4.3 Y Anderson & Lydy 2002
Jordanella floridae, Flagfish
1,500 Y Y Y Allison and Hermanutz 1977
CDFG: also cited pers comm.
1,800 Y Y Y
Lepomis macrochirus, Bluegill
480 Y Y Allison and Hermanutz 1977
CDFG: insufficient number of test organisms used
440 Y Y Y CDFG: also cited pers comm
168 Y Johnson and Finley 1980; Mayer and Ellersieck 1986
LL:4, 7* CDFG: "control survival acceptable in all tests", also cited
pers. comm EPA: Acceptable:h
Lumbriculus variegatus, Oligochaete worm
6,160 Y Ankley and Collyard 1995
LL: 4,7, SM, Conc NR, % solvent too high
9,980 Y Phipps 1988 N: 1,7,8 Not in OPP data base or Diazinon IRED
Neomysis mercedis, Mysid
3.57 Y Y CDFG 1992c, Test 162
4.82 Y Y CDFG 1992d, Test 168
Oncorhynchus clarki, Cutthroat trout
1,700 Y Y Johnson and Finley 1980; Mayer and Ellersieck 1986
LL: 4,7* CDFG: "control survival acceptable in all tests", also cited
pers. comm
2,760 Y Y Mayer and Ellersieck 1986
LL: 4,7* CDFG: "control survival acceptable in all tests", also cited
pers. comm
Oncorhynchus mykiss, Rainbow trout
400 Y Beliles 1965 RL: 7, SM, Conc NM, Temp not ± 1 ºC, H , A,
DO, C, pH, P,
3,200 Y Bathe et al. 1975a N: 1,4, 8 SM
B10

Species, Common identifier
LC/EC50 (µg/L)
EPA 2005
CDFG 2000
UCD 2010 Reference
UCD Rating: Reason for Exclusion (see end
of table for key) Comments
90 Y Y Cope 1965a; Johnson and Finley 1980; Mayer and Ellersieck 1986, Ciba-Geigy 1976
LL: 4,7 for Johnson and Finley 1980*, Cope
1965 LN: 4
CDFG: "control survival acceptable in all tests", also cited
pers. comm
1,350 Y Meier et al. 1979; Dennis et al. 1980
LN: 4, SM, solvent % NR, Org. stage +
source, Conc NR, DO, T pH
Physa sp. Pond snail
4,441 4.41 Y CDFG 1998b, Test 132
report in mg/L. CDFG mistake
Pimephales promelas, Fathead minnow
6,600 Y Y Y Allison and Hermanutz 1977
CDFG: also cited pers comm
6,800 Y Y Y 10,000 Y Y Y 9,350 Y Y Y Geiger/University
of Wisconsin- Superior 1988
6,900 Y Y Y Jarvinen and Tanner 1982
Poecilia reticulata, Guppy
800 Y Y Keizer et al. 1991 LL: 4, 7 ,8, Conc. NR, fed NR, DO, A, C, H, #
per replicate NR
CDFG: Control survival was 100%,
but article only states 'meets EEC guidelines'
Pomacea paludosa, Apple snail
2,950 Y Y Call 1993
3,270 Y Y 3,390 Y Y Procloeon sp., Insect
1.53 Y Anderson et al. 2006
2.11 Y 1.77 Y Pteronarcys californica, Insect
25 Y Y Cope 1965a; Sanders and Cope 1968; Johnson and Finley 1980; Mayer and Ellersieck 1986
LL: 4,7 for Johnson and Finley 1980*; LL 4,7 for Sanders and Cope
1968
CDFG: "control survival acceptable in all tests", also cited
pers. comm
Rana clamitans, Frog
>50 Y Harris et al. 1998 LL: 1,6,7
Salvelinus fontinalis, Brook trout
800 Y Y Y Allison and Hermanutz 1977
CDFG: also cited pers comm.
450 Y Y Y
B11
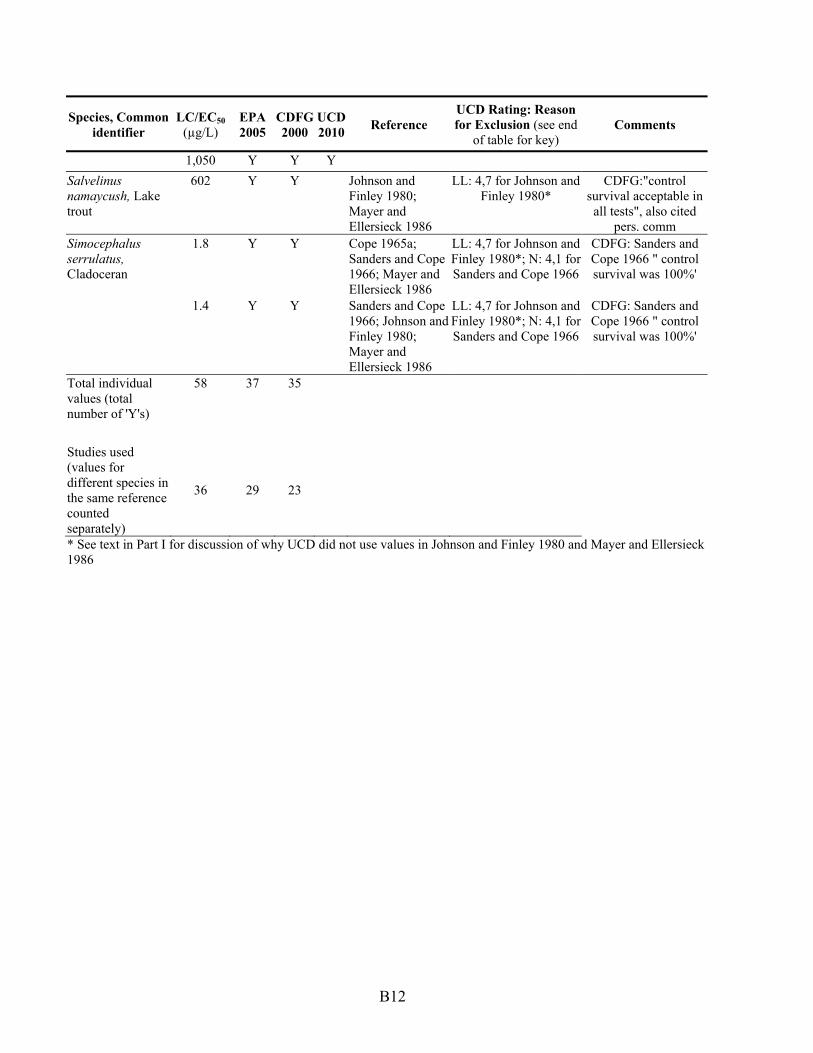
Species, Common identifier
LC/EC50 (µg/L)
EPA 2005
CDFG 2000
UCD 2010 Reference
UCD Rating: Reason for Exclusion (see end
of table for key) Comments
1,050 Y Y Y Salvelinus namaycush, Lake trout
602 Y Y Johnson and Finley 1980; Mayer and Ellersieck 1986
LL: 4,7 for Johnson and Finley 1980*
CDFG:"control survival acceptable in all tests", also cited
pers. comm Simocephalus serrulatus, Cladoceran
1.8 Y Y Cope 1965a; Sanders and Cope 1966; Mayer and Ellersieck 1986
LL: 4,7 for Johnson and Finley 1980*; N: 4,1 for Sanders and Cope 1966
CDFG: Sanders and Cope 1966 " control survival was 100%'
1.4 Y Y Sanders and Cope 1966; Johnson and Finley 1980; Mayer and Ellersieck 1986
LL: 4,7 for Johnson and Finley 1980*; N: 4,1 for Sanders and Cope 1966
CDFG: Sanders and Cope 1966 " control survival was 100%'
Total individual values (total number of 'Y's)
58 37 35
Studies used (values for different species in the same reference counted separately)
36 29 23
* See text in Part I for discussion of why UCD did not use values in Johnson and Finley 1980 and Mayer and Ellersieck 1986
B12

Codes for reasons for exclusion in the Table B-1. This table includes all values used by any of the three agencies. Reports from all agencies mention many studies that were judged unacceptable that were not included in the reports. Because of the large number of these studies, they were not included in this table.
Y- indicates value was USED by agency Acceptable: indicated values were ACCEPTABLE, BUT NOT USED by specified agency because more preferable data were available. Details are in the following list:
a. 96-h result available b. Test with measured concentrations available c. 48-h result available d. More sensitive endpoint available e. Non-standard temperature f. More sensitive lifestage available g. Flow-through test available h. EPA 2005: a more sensitive study was available Major reasons for studies rated UNACCEPTABLE by UCD only. These studies were rated LR, RL, LL, RN, LN, N according to UCD methods (see Chapter 3 of TenBrook et al. 2009a for details):
1. Chemical grade was lower than 80% pure 2. Endpoint not linked to population effects 3. Family not in North America 4. Control response was not acceptable or not reported 5. Not a freshwater test 6. No toxicity value calculated 7. Low reliability score- based on reporting of many parameters including those listed just below 8. Control not described or not reported (i.e., solvent or water only) For studies excluded only because of low reliability score (#7 from table above) more information was given with the following abbreviations: NR- not reported SM- no standard method Conc NR- concentrations not reported Conc NM- concentrations not measured (nominal) Org- organism Control desc. -control not described at all DO - dissolved oxygen NR H-hardness NR A- alkalinity NR C-conductivity NR pH- pH NR T- temperature NR P-photoperiod NR % solvent -carrier solvent percent not reported or too high, as indicated Control Type NR- not reported whether control was solvent control or water only Fed- organisms fed in acute test
B13

Table B-2. Acute criteria comparison by data set and calculation methods.
Acute criteria (µg/L) from each data set UCD 2010
Hypothetical CombinationMethod of calculation EPA 2005 CDFG 2000
Log-Triangular 0.17 0.16 0.083 0.20 Burr Type III/Log-logistic
a Values would be rounded to 1 significant figure by UCD methods, but left here with 2 significant figures to show slight difference in calculation. b Based on lower subset of invertebrates, because the entire data set could not be fit to a Burr Type III distribution.
0.21 a,b 0.11 a,b 0.18 a 0.20 a,b
Criterion from agency report 0.17 0.16 0.18 a -
B14

Table B-3. Log-Triangular Calculation for Diazinon Genus Mean Acute Values. Diazinon Genus Mean Acute Values (µg/L)
Hypothetical CombinationEPA 2005 CDFG 2000 UCD 2010 Genus species
29220 29220 Brachionus calyciflorus 11640 11640 Dugesia tigrina 11000 11000 Gillia altilis 9000 9000 Carassius auratus 8000 8000 8000 Danio rerio 7841 7841 Lumbriculus variegatus 7804 7804 7804 7804 Pimephales promelas 3198 3198 3198 Pomacea paludosa 1643 1643 1643 1643 Jordanella floridae 960.4 441 960.4 Oncorhynchus clarki, mykiss 800 800 800 Poecilia reticulata
659.7 660 723 723 Salvelinus fontinalis, namaycush 459.6 272 459.6 459.6 Lepomis macrochirus >50 50 Rana clamitans 25 25 25 Pteronarcys californica
10.7 10.7 10.7 Chironomus tentans 6.51 4.3 4.3 Hyalella azteca
5.858 16.82 16.82 Gammarus fasciatus, pseudolimnaeus 4.41 4441 4441 Physa sp. 4.15 4.15 4.15 Neomysis mercedis 1.79 1.79 Procloeon sp.
1.587 1.59 1.587 Simocephalus serrulatus 0.902 1.06 0.52 0.52 Daphnia magna, pulex 0.3773 0.44 0.34 0.34 Ceriodaphnia dubia
5.858 4.15 4.15 1.79 Lowest 4 values 1.587 1.59 1.79 1.587 0.9020 1.06 0.52 0.52 0.3773 0.44 0.34 0.34
Log-triangular results Number of values 20 14 13 24 FAV/ 5th percentile* 0.3397 0.3105 0.1738 0.3971
0.17 0.16 0.083 0.20 Acute Criterion Acute Criterion from agency report 0.17 0.16
*The calculation yields a 5th percentile value (or the final acute value, FAV). This value is divided by 2 to obtain the criterion in both methods.
B15

Table B-4. Burr Type III Calculation for Diazinon Species Mean Acute Values.
Diazinon Species Mean Acute Values (µg/L) Hypothetical Combination EPA 2005 CDFG 2000 UCD 2010 Genus species
29220 29220 Brachionus calyciflorus 11640 11640 Dugesia tigrina 11000 11000 Gillia altilis 9000 9000 Carassius auratus 8000 8000 8000 Danio rerio 7841 7841 Lumbriculus variegatus 7804 7804 7804 7804 Pimephales promelas
4.41 4441 4441 Physa sp. 3198 3198 3198 Pomacea paludosa 2166 2166 2166 Oncorhynchus clarki 1643 1643 1643 1643 Jordanella floridae 800 800 800 Poecilia reticulata 723 723 723 723 Salvelinus fontinalis 602 602 602 Salvelinus namaycush
459.6 272 460 460 Lepomis macrochirus 426 90 425.8 Oncorhynchus mykiss >50 50 Rana clamitans 25 25 25 Pteronarcys californica
16.82 16.82 16.82 Gammarus pseudolimnaeus 10.7 10.7 10.7 Chironomus tentans 6.51 4.3 4.3 Hyalella azteca
4.15 4.15 4.15 Neomysis mercedis Procloeon sp. 1.79 1.79
1.587 1.59 1.587 Simocephalus serrulatus 1.048 1.44 0.52 0.52 Daphnia magna
0.7764 0.78 0.7764 Daphnia pulex 0.3773 0.44 0.34 0.34 Ceriodaphnia dubia 2.04 2.04 Gammarus fasciatus
Burr III results, using entire data set
24 Number of values 17 13 28 No result 5th percentile* Failed fit test 0.349 Failed fit test
0.18 Criterion
Burr III results, calculated for Arthropoda subset, indicated by bold values 9 Number of values 7 7 11
0.41 5th percentile* 0.21 0.22 0.40 0.21 0.20 Criterion 0.11** 0.11**
Criterion from agency report 0.17 0.16 *The calculation yields a 5th percentile value (or the final acute value, FAV). This value is divided by 2 to obtain the criterion in both methods. **Log-Logistic distribution used for 8 or fewer data, according to UCD methods
B16

0
0.1
0.2
0.3
0.4
0.5
0.6
0.7
0.8
0.9
1
0.1 1 10 100 1000 10000 100000
Single Species LC 50 (ug/mL)
Cum
ulat
ive
Prob
abili
ty
EPA 2005 CDFG 2000UCD 2007X UCD 2010
Figure B-1. Diazinon Acute Toxicity Data Distribution.
Note: Equivalent LC50 values will not overlap because probability (on y-axis) is relative to other values in the data set. Equivalent LC50 values will be vertically in line with each other (according to concentration on x-axis).
B17

B18
Diazinon Acute Data
0.3
0.4
0.5
0.6
0.7
0.8
0.9
1
1000 10000
mul
ativ
e Pr
obab
ility
0
0.1
0.2
0.01 0.1 1 10 100
Concentration (ug/L)
Cu
LC50s (ug/L)BurrIIILog-TriangularCriterion- Log-Tri.Criterion- Burr
Figure B-2. The fit of the Burr Type III and Log-triangular distributions to the UCD diazinon acute data set

B19
PART IV Table B-5. Comparison of studies with acute and chronic toxicity data for diazinon used in different criteria reports. Gray shading indicates that values from that study were not considered for ACR. Please refer to an appropriate criteria document for full citations.
Reference Organism Used by EPA 2005 Used by CDFG 2000 UCD 2010 Comment
Freshwater species LC50µg/L
MATCµg/L ACR
LC50µg/L
MATCµg/L ACR
LC50µg/L
MATCµg/L ACR
Rejected by CDFG because it did not generate a NOEC. Rejected by UCD because control not described, no standard method, purity not reported. Allison (1977)
Jordanella floridae 1643 68.93 23.8
Allison and Hermanutz (1977)
Salvelinus fontinalis 723 <0.8 904 723 6.8 106
Rejected by CDFG because it did not generate a NOEC (for growth rate of progeny- the most sensitive endpoint). However that endpoint had interrupted dose repose. UCD used data for the survival endpoint.
Allison and Hermanutz (1977)
Pimephales promelas 7800 41 190
Chronic data not included in EPA and CDFG. Study abstract reports no NOEC (for incidence of scoliosis-most sensitive endpoint, but it is not linked to survival, growth, reproduction). UCD used data for the survival endpoint.
Jarvinen and Tanner (1982)
Pimephales promelas 6900 67.08 103 6900 67 103 6900 67 103
Norberg-King (1989)
Pimephales promelas 9350 24.97 374 9350 25 374
Study did not rate as high quality be UCD because control response not reported and low reliability score
Norberg-King (1987)
Ceriodaphnia dubia 0.376 0.3382 1.1 0.57 0.34 1.7
CDFG states it is unavailable yet did include values. Report is a memorandum to USEPA. Study did not rate as high quality by UCD.
Surprenant (1988a)
Daphnia magna 1.44 0.23 6.3 0.52 0.23 2.3
Not referenced at all by USEPA (EPA 1985 guidelines advised against using confidential studies and acute tests with feeding). CDFG used a geometric mean from multiple endpoints.
Saltwater species Goodman et al. (1979)
Cyprinodon variegatus 1400 <0.47 2979
Rejected by CDFG and UCD because it did not generate a NOEC.
Nimmo et al. (1981)
Mysidopsis bahia 4.82 3.04 1.6 4.82 1.9 2.5
Rejected by UCD because diazinon purity was <80%, control description & response not reported. EPA used original data to recalculate values. CDFG used value calculated by authors. All three agencies used the geometric mean of ACRs of species whose acute values were close to the FAV. Final ACR (species values included in bold) 2* 3 2.3
*EPA used 1985 Guidelines stipulation that if the most appropriate SMACRs < 2.0, the FACR should be assumed to be 2.0

C1
Appendix C
Fit test calculations

C2
Raw data and calculations for fit test for diazinon acute data Omi
L 2 3 6 7 t one
C50 1 4 5 8 9 10 11 12 13 0.340 0.34 34 .34 34 .34 34 .34 34 .34 34 34 0.340 0. 0 0 0 0. 0 0 0 0. 0 0 0 0. 0 0 0 0. 0 0. 0 0 0. 0.52 52 0. 0. 0. 0. 0. 0. 0. 0.52 52 52 52 0.52 52 52 52 0.52 0.52 52 1. 1.79 79 1.79 1. 1. 1. 1. 1. 1. 1.79 79 79 1.79 79 79 79 1.79 1.79 79 4. 4. 4.15 15 4.15 15 4. 4. 4. 4. 4. 4.15 15 4.15 15 15 15 4.15 4.15 15 4. 4. 4. 4.30 30 4.30 30 30 4. 4. 4. 4. 4.30 4.30 30 30 30 4.30 4.30 30
1 10.7 10.7 10.7 0.7 .70.70 0 0 0 1 0 10 0 10.7 0.7 .7 0.7 .7 .7 10.70 1 0 10 0 1 0 10 0 10 0 0 1 16.8 16.8 16.8 6.8 .8 6.86.82 2 2 2 1 2 16 2 1 2 16.8 .8 6.8 .8 .8 16.82 16 2 1 2 16 2 16 2 2 4 459. 459. 9. 59. 9. 59. 9.59.6 6 6 45 6 4 6 45 6 4 6 45 6 459. 59. 9. 9. 459.6 4 6 45 6 45 6 6 7 723. 723. 3. 23. 3. 23. 3. 23.23.0 0 0 72 0 7 0 72 0 7 0 72 0 7 0 723. 3. 3. 723.0 72 0 72 0 0 1 164 1643 1643 643 643 1643 1643 643 643643 3 1 1 1 1 1643 1643 1643 3 319 3198 3198 198 198 3198 3198 198 198 3198198 8 3 3 3 3 3198 3198 4 444 4441 4441 441 441 4441 4441 441 441 4441 4441441 1 4 4 4 4 4441 7 780 7804 7804 804 804 7804 7804 804 804 7804 7804 7804804 4 7 7 7 7
0. 0.52 1.79 4.15 4.30 10.7 16.8 460 723 1643 3198 4441 7804
Omitted point, xi: 34 0 2
Median 5th perc. 0. 0. 0. 0. 0. 0. 0. 0. 0.
97.6 95.2 .4 9.7 .5 3.1 .5 3.2 .9 4.9 .6 .2 8.23 0.97 .95 84 9 9 63 57 3 9 14 11 10 08 0.02 .04 15 0 0 36 42
0.02 .04 15 0 0 36 42 3 9 14 11 10 080.04 .09 31 0 0 73 .84 46 9 29 .23 .20 16
67 55 0.39 00 00 31 0.31 30 30 31 0.32 0.32 33
F-i(xi) 9 7 84 3 7 2 79 4 6 9 57 5 2 1 19 4 1 3 11 5 10 7 69 0 27 0. 43 0.7 72 0.7 54 0. 19 0. 55 0.2 21 0.1 94 0. 93 0. 65 0. 27 0. 23
1-F(xi) 31 0 73 0. 57 0.2 28 0.2 46 0. 81 0. 45
min of F-i(xi) or 1 -F(xi) 31 0 73 0. 57 0.2 28 0.2 46 0. 81 0. 45 0.2 21 0.1 94 0. 93 0. 65 0. 27 0. 23 pi =2(min) 62 0 46 0. 14 0.4 56 0.4 92 0. 62 0 9 0. 42 0.3 88 0. 86 0 3 0 54 0. 46

Fish
ln(pi -2* 22n
er test statistic
) X) p Sum of ln(pi i
0.0462 -3.074 33.20915 0.1 16
.3
.1 0.1561 is > 0.05; the distribution fits the diazinon acute data set 0.4056 -0.9024 0.4092 -0.8936 if X2
2n < 0.05 significant lack of fit
0 -0.3063 *** if X22n > 0.05 fit (no significant lack of fit)
8 5610.0946 -2 581 0.3114 -1 667
C3

C4
.7362 0.849 -0.1637 0.4642 -0.7674 0.3988 -0.9193 0.2986 -1.2087 0.233 -1.4567 0.20 -1.5828

C5
54 0.1646 -1.8042