Final Algos
7
GitHub: Visualisation and Recommendations Anirudh Mallem Rutgers University Piscataway, NJ, USA Email: [email protected] Zheyuan Cheng Rutgers University Piscataway, NJ, USA Email: [email protected] Sahil Karkhanis Rutgers University Piscataway, NJ, USA Email: [email protected] Abstract— GitHub is a one of the most popular web-based git hosting service. It offers all of the distributed revision control and source code management (SCM) functionality of Git as well as adding its own features. Open-source developers all over the world are working on millions of projects: writing code & documentation, fixing & submitting bugs, and so forth. Here, we strive to analyze and draw semantics out of the GitHub archived timeline data. In particular we are trying to answer questions like ”Who uses what to develop on github?”, ”Which part of the world actively contributes on github?” etc. by visualising the github archives. In additional to this, by using the processed data we also aim to develop a recommendation system that will provide a list of k-contributors who can help a particular user/project on github. I. PROJECT DESCRIPTION Our project would fall under the Massive Algorithms category and can be primarily divided into two parts: The Visualisation part & The Recommendation part. In the vi- sualization part we plan to analyze the github dataset using some metrics like ”Programming Languages used”,”No. of Active Users on GitHub”,”Geographical distribution of the users on GitHub”, ”Widely contributed repositories on github” and report our findings based on the usage patterns of all the contributors on GitHub. The second phase of our project would be a recommendation engine which given a user name would recommend some potential repositories/contributors to which he can contribute based on his past activity. We will be using the assumption that if two users have worked on the same repository then the probability of them working on the same field is high and hence will be interested in working on a similar repository again. The findings of our project will be helpful in determining data like what are the active areas in which there is immense contribution going on on github, what programming languages are widely used in development. The recommendation engine will be helpful in determining potential contributors who can work together and a list of interested repositories a user can contribute to. This will increase collaboration among the github community and improve the quality of work arising from it. We hope to come up with a working model of both the parts of our project by the end of the semester. The common problem for both the parts is that we have to process a lot of data (in the order of a million) and we have to do it efficiently in the least possible time. Also we plan to make use of some data visualisation frameworks like D3js which may take time to get accustomed to. Finally for our recommendation engine we have to come up with an Algorithm that does not get lost in the vast amount of data and we plan to do so by enforcing restrictions on the radius of the nodes to which we will do an exploratory search. What is the timeline for your project progress?. How are you planning to reach the major milestones?. The project has four stages: Gathering, Design, Infrastruc- ture Implementation, and User Interface. A. Stage1 - The Requirement Gathering Stage. GitHub Visualisation system aims at visualising the con- tribution to GitHub by users throughout the world. It aims at understanding the usage of different programming languages in github projects worldwide. Our visualisation and recom- mender system has the following types of users. • GitHub users who are interested in finding potential co- workers for working on common interests. The con- tribution of the user to different repositories and the programming languages he knows are considered in the search for potential co-workers • GitHub users interested in contributing to or learning about a particular project . The different repositories dealing with relevant information are analyzed in the search for relevant projects. • GitHub users interested in getting an idea about the compatibility of languages which can be used together in software projects. A detailed search of repositories in which different programming languages are being used together is conducted to provide a visualisation of the compatibility of programming languages. Examples of the scenarios which can arise in our project are as follows • Scenario 1: A GitHub user is interested in finding potential co-workers with common skills. – Input : GitHub Username – Input Data Type : Single variable – Output : A list of names of recommended potential co- workers. – Output Data Type : Categorical variable – Input : GitHub Username – Input Data Type : Single variable – Output : A list of names of recommended potential co- workers. – Output Data Type : Categorical variable • Scenario 2: A GitHub user is interested in finding potential software projects he can contribute to. Input : GitHub
-
Upload
anirudh-mallem -
Category
Documents
-
view
40 -
download
0
Transcript of Final Algos

GitHub: Visualisation and RecommendationsAnirudh MallemRutgers University
Piscataway, NJ, USAEmail: [email protected]
Zheyuan ChengRutgers University
Piscataway, NJ, USAEmail: [email protected]
Sahil KarkhanisRutgers University
Piscataway, NJ, USAEmail: [email protected]
Abstract— GitHub is a one of the most popular web-based githosting service. It offers all of the distributed revision control andsource code management (SCM) functionality of Git as well asadding its own features. Open-source developers all over the worldare working on millions of projects: writing code & documentation,fixing & submitting bugs, and so forth. Here, we strive to analyze anddraw semantics out of the GitHub archived timeline data. In particularwe are trying to answer questions like ”Who uses what to develop ongithub?”, ”Which part of the world actively contributes on github?”etc. by visualising the github archives. In additional to this, by usingthe processed data we also aim to develop a recommendation systemthat will provide a list of k-contributors who can help a particularuser/project on github.
I. PROJECT DESCRIPTION
Our project would fall under the Massive Algorithmscategory and can be primarily divided into two parts: TheVisualisation part & The Recommendation part. In the vi-sualization part we plan to analyze the github dataset usingsome metrics like ”Programming Languages used”,”No. ofActive Users on GitHub”,”Geographical distribution of theusers on GitHub”, ”Widely contributed repositories on github”and report our findings based on the usage patterns of allthe contributors on GitHub. The second phase of our projectwould be a recommendation engine which given a user namewould recommend some potential repositories/contributors towhich he can contribute based on his past activity. We willbe using the assumption that if two users have worked onthe same repository then the probability of them workingon the same field is high and hence will be interested inworking on a similar repository again. The findings of ourproject will be helpful in determining data like what are theactive areas in which there is immense contribution going onon github, what programming languages are widely used indevelopment. The recommendation engine will be helpful indetermining potential contributors who can work together anda list of interested repositories a user can contribute to. Thiswill increase collaboration among the github community andimprove the quality of work arising from it. We hope to comeup with a working model of both the parts of our project bythe end of the semester. The common problem for both theparts is that we have to process a lot of data (in the order of amillion) and we have to do it efficiently in the least possibletime. Also we plan to make use of some data visualisationframeworks like D3js which may take time to get accustomedto. Finally for our recommendation engine we have to comeup with an Algorithm that does not get lost in the vast amount
of data and we plan to do so by enforcing restrictions on theradius of the nodes to which we will do an exploratory search.What is the timeline for your project progress?. How are youplanning to reach the major milestones?.
The project has four stages: Gathering, Design, Infrastruc-ture Implementation, and User Interface.
A. Stage1 - The Requirement Gathering Stage.
GitHub Visualisation system aims at visualising the con-tribution to GitHub by users throughout the world. It aims atunderstanding the usage of different programming languagesin github projects worldwide. Our visualisation and recom-mender system has the following types of users.
• GitHub users who are interested in finding potential co-workers for working on common interests. The con-tribution of the user to different repositories and theprogramming languages he knows are considered in thesearch for potential co-workers
• GitHub users interested in contributing to or learningabout a particular project . The different repositoriesdealing with relevant information are analyzed in thesearch for relevant projects.
• GitHub users interested in getting an idea about thecompatibility of languages which can be used togetherin software projects. A detailed search of repositories inwhich different programming languages are being usedtogether is conducted to provide a visualisation of thecompatibility of programming languages.
Examples of the scenarios which can arise in our projectare as follows
• Scenario 1: A GitHub user is interested in finding potentialco-workers with common skills.– Input : GitHub Username– Input Data Type : Single variable– Output : A list of names of recommended potential co-
workers.– Output Data Type : Categorical variable– Input : GitHub Username– Input Data Type : Single variable– Output : A list of names of recommended potential co-
workers.– Output Data Type : Categorical variable
• Scenario 2: A GitHub user is interested in finding potentialsoftware projects he can contribute to. Input : GitHub

Username Input Data Type : Single variable Output : A listof names of recommended potential repositories. OutputData Type : Categorical variable
• Scenario 3: A GitHub user is interested to know thecomaptibility of programming languages which can beused together in software projects Input : Dataset ofGitHub Input Data Type : Dataset Output : Visualisationof compatibility of languages Output Data Type : Visual-isation of Dataset
• A detailed time line for completion of the major imple-mentaion stages together with the division of labor includ-ing testing, documentation, evaluaton, project report, andpower point presentation.
Project Time line and Division of Labor1) Week 1 and Week 2 (10/28 - 11/8):
Task 1: Set up the project and access the dataset. Processdata and design the data structure to store the graphContributors: Anirudh, SahilTask 2: Design and begin to implement the recommen-dation algorithmContributors: Zheyuan
2) Week 3 and Week 4 (11/9 - 11/22):Task 1: Analyze the data to compute the compatibilityof programming language and transform the output datastructureContributors: SahilTask 2: Implement the visualization of the compatibilityof programming languageContributors: AnirudhTask 3: Implement the recommendation algorithm andtest on large dataset Contributors: Zheyuan
3) Week 5 and Week 6 (11/23 - 12/6):Task 1: Implement the user interface. Test and improvethe system.Contributors: Anirudh, Sahil, ZheyuanTask 2: Write final report and powerpointContributors: Anirudh, Sahil, Zheyuan
B. Stage2 - The Design Stage.
Our system starts with accessing the GitHub archiveddataset stored in the Google BigTable Database fromthe following link- https://bigquery.cloud.google.com/table/publicdata:samples.github nested. Using Google BigQuerywe extract relevant fields which include information about therepositories, their owners and the different languages beingused in the repositories. Using this extracted information webuild a graph of the different users and the repositories theycontribute to.• Visualisation Module - The user enters an input to get in-
formation about the compatibilities of different program-ming languages. Using the graph stored in the internaldatabase we extract relevant attributes and process thedata and feed it to the appropriate d3.js template to outputthe results.
• Recommendation Module - The user then enters a partic-ular username as input. The input query then checks theusername and selects the appropriate algorithm, extractsrelevant data from the graph in the internal database,executes the algorithm on the processed data. The outputof the algorithms is a list of repositories which the usercan contribute to or a list of co-workers with allied skillsand interests. These results are displayed to the user inthe form of a table.
• Visualisation Module Flow Diagram.
• Recommendation Module Flow Diagram.
• High Level Pseudo Code System Description. Pleaseinsert high level pseudo-code describing the major systemmodules as per your flow diagram.
• Algorithms and Data Structures. Please insert a briefdescription of each major Algorithm and its associateddata structures here.Recommendation algorithm is based on the graph createdfrom the dataset. In each push event, we have a usernameand a repository name. We see these names as the nodesin our graph, the push events as edges and the numberof push events as the weight of the edge. The inputof our algorithm is a username. Our algorithm is tomeasure to what extent the user would be interested inother users or repositories in the graph. The basic idea ofthe algorithm is to use Dijkstra(BuildTree) to search thegraph. However, the key value of each node is not thelength of the shortest path. We use modified version ofDFS(AllPaths) to find all the paths from source to eachnode and compute a value based on these paths as thekey value for each node.
Algorithm 1 BuildTree Algorithm1: procedure BUILDTREE(G, s)2: Q← 03: S← 04: s.dis← 05: add s to Q6: while Q! = 0, S.size <= MAXS do7: u = extractmin(Q)8: add s to S9: for each vertex v ∈ adj[u] do
10: if v 6∈ S then11: if v 6∈ Q then12: Path← 013: OnPath← 014: function ALLPATHS(G, s, v)15: v.dis = ComputeDis()16: add v to Q
Algorithm 2 AllPaths Algorithm1: procedure ALLPATHS(G, u, t)2: if Onpath.size < MAXD then3: push u into Path, add u to OnPath4: if u = t then5: add u.d to Discollection6: else7: for each vertex v ∈ adj[u] do8: if v 6∈ OnPath then9: v.d = u.d + w(u, v)
10: function ALLPATHS(G, v, t)11: path.pop12: OnPath.delete(u)
• Flow Diagram Major Constraints. Please insert here theintegrity constraints:
Algorithm 3 ComputeDis Algorithm1: procedure COMPUTEDIS2: for each element e ∈ Discollection do3: e← 1/e4: sum← sum + e5: clear Discollection6: return 1/sum
– Integrity Constraint. Please insert the first integrityconstraint in here together with its description andjustification.
Please repeat the pattern for each integrity constraint.
C. Stage3 - The Implementation Stage.
Working code:Sequel Statement for Visualisation:select repo name from language where repo lang = ”Java”Sequel for Recommendation:select * from recommendation
Working code for generating graph:GraphNode repo = new GraphNode(rid, weight);GraphNode u = new GraphNode(user, weight);if(!userGraph.containsKey(user)){
List< GraphNode > listrepo = newLinkedList();
listrepo.add(repo);userGraph.put(user, listrepo);}else{
List< GraphNode > listrepo = userGraph.get(user);int f = listrepo.indexOf(repo);if(f == -1){
listrepo.add(repo);}else if(f >= 0){
GraphNode s = listrepo.get(f);double oldweight = s.getEW();double newweight = repo.getEW();double finalweight = oldweight*newweight/(oldweight +
newweight);s.setEW(finalweight);
}}
if(!repoGraph.containsKey(rid)){List< GraphNode > listuser = new
LinkedList();listuser.add(u);repoGraph.put(rid, listuser);}else{
List< GraphNode > listuser = repoGraph.get(rid);int f = listuser.indexOf(u);

if(f == -1){listuser.add(u);
}else if(f >= 0){
GraphNode s = listuser.get(f);double oldweight = s.getEW();double newweight = u.getEW();double finalweight = oldweight*newweight/(oldweight +
newweight);s.setEW(finalweight);}
}
Demo and sample findings• Data size: The size of our dataset is 3.4GB but after
refining and normalising it we are building our graphwhich comes down to a relatively smaller size and fitsentirely into RAM.
• List the most interestng findings in the data if it is a DataExploration Project. For other project types consult withyour project supervisor what the corresponding outcomesshall be. Concentrate on demonstrating the Usefuness andNovelty of your application.
We have decided to build the entire project using Javaas our language for the server-side operations and Java-Script/HTML for the client-side operations. In particularwe have encapsulated our code into the Play 2.0 MVCFramework available for Java as it would provide us out ofthe box functionality of handling DB connections and dataexchange between the client and the server.
As mentioned previously our data-set completely residesinside the Google BigQuery database as a relational modeland we could fetch the data directly using API calls. Insteadwe took the approach of having a local normalised databaseas our db calls are only once during the init phase of ourapplication and then once our graph is generated we nolonger require the sql instance. This also prevented us frombeing charged by Google for using their servers to performour queries.
Visualisation Schemarepository owner (not null) repository lang (not null)
lazyCoder Javascripter JavaScript
invincible Python
The repository owner and the repository lang together giveus an idea of who knows which programming languages. Thishelps us build a relationship between the languages whichpeople tend to learn having started with a particular language.Having just these two fields will give us unique tuples too.
Recommendation Schemarepository name repository owner actor type
simpledb lazyCoder scripter PushEventjsonParser scripter lazyCoder WatchEvent
Every row in the github dataset is an event (push,pull,watchetc..). The actor field contains the user who performed thatevent and the type relates to the type of the event performed.This schema is used by us to generate our graph. Every rowhere gives us an edge between the repository and the actor.The output of the visualisation phase would be a diagram visu-alising the usage patterns of the top 15 programming languagesused across github. The diagram would have connectionsbetween two languages if there exists a user who knows bothof them. The size of the bandwidth of the connection directlyrelates to the ratio of people who know both the languagesacross all users in github.The recommendation output would be a list of user-names/repositories which the current user would be interestedto contribute to. For Example :Input : lazyCoderOutput: scripter,invincible (usernames).Output: simpledb,jsonParser (repositories).We plan to give the output the link of the user pro-files/repositories which if clicked would direct to the githubpage of the user/repository suggested.
• Working code:Sequel Statement for Visualisation:select repo name from language where repo lang =”Java”Sequel for Recommendation:select * from recommendation
Working code for generating graph:GraphNode repo = new GraphNode(rid, weight);GraphNode u = new GraphNode(user, weight);if(!userGraph.containsKey(user)){List< GraphNode > listrepo = newLinkedList();listrepo.add(repo);userGraph.put(user, listrepo);}else{List< GraphNode > listrepo = userGraph.get(user);int f = listrepo.indexOf(repo);if(f == -1){listrepo.add(repo);}else if(f >= 0){GraphNode s = listrepo.get(f);double oldweight = s.getEW();double newweight = repo.getEW();double finalweight = oldweight*newweight/(oldweight +newweight);s.setEW(finalweight);}}
if(!repoGraph.containsKey(rid)){List< GraphNode > listuser = new
LinkedList();listuser.add(u);repoGraph.put(rid, listuser);}else{List< GraphNode > listuser = repoGraph.get(rid);int f = listuser.indexOf(u);if(f == -1){listuser.add(u);}else if(f >= 0){GraphNode s = listuser.get(f);double oldweight = s.getEW();double newweight = u.getEW();double finalweight = oldweight*newweight/(oldweight +newweight);s.setEW(finalweight);}}
• Demo and sample findings– Data size: The size of our dataset is 3.4GB but after
refining and normalising it we are building our graphwhich comes down to a relatively smaller size andfits entirely into RAM.
– List the most interestng findings in the data if itis a Data Exploration Project. For other projecttypes consult with your project supervisor what thecorresponding outcomes shall be. Concentrate ondemonstrating the Usefuness and Novelty of yourapplication.
D. Stage4 - User Interface.The user interface of our project is shown in the figure
1. Our project involves three sub-parts which include theProgramming Languages Chord Diagram, Geo-Visualisationand Recommendation Engine. The links for all the threemodules are seen on the about us page of the project whichdescribes our goal and the technologies we used to build thesame.
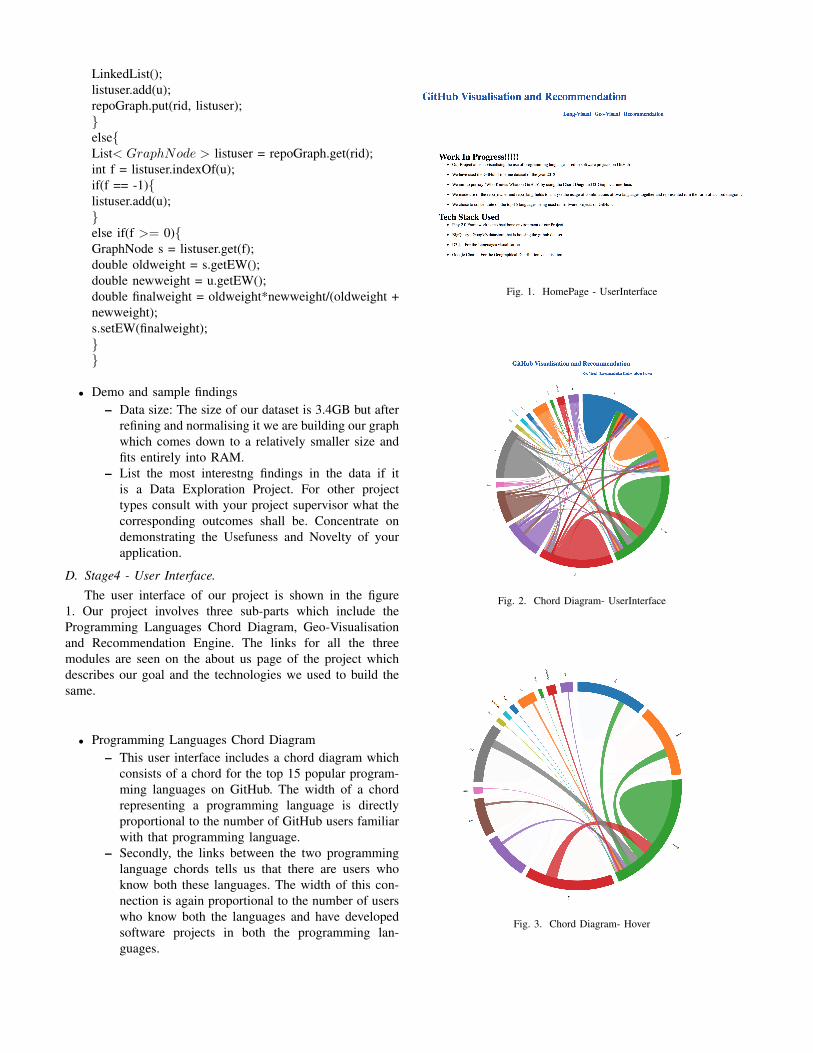
• Programming Languages Chord Diagram– This user interface includes a chord diagram which
consists of a chord for the top 15 popular program-ming languages on GitHub. The width of a chordrepresenting a programming language is directlyproportional to the number of GitHub users familiarwith that programming language.
– Secondly, the links between the two programminglanguage chords tells us that there are users whoknow both these languages. The width of this con-nection is again proportional to the number of userswho know both the languages and have developedsoftware projects in both the programming lan-guages.
Fig. 1. HomePage - UserInterface
Fig. 2. Chord Diagram- UserInterface
Fig. 3. Chord Diagram- Hover

Fig. 4. Geo-Visual Javacript Search
– If a user hovers over the name of a particularprogramming language or the chord of a program-ming language, all the paths of other programminglanguages fade out. This is seen in the figure 3.
• Geo-Visualisation– The user is given a drop down list of the pro-
gramming languages which are used by GitHubusers. The user can select one of the language inthe dropdown list or any programming language.Once the user clicks on the submit button the Geo-Visual starts populating itself with the instancesof GitHub users using that particular programminglanguage.Figure 4 describes the search results ofthe JavaScript language search on the visualisationframework.
– Once the results are populated then the user canhover over a populated region to get a zoomedview of that area and on pointing over a dot onthe zoomed area the region name is displayed. Thisfunctionality is shown in figure 5.
– If the user enters an incorrect input like ’Google’and then cliks on submit then the whole wholeworld map disappears and the results are as shownin figure 6.
• Recommendation System– As shown in figure 7, this user interface includes an
input window for you to type in the information ofuser name or repository name.And the results willbe given in two lists, called Repositories and Users.Click on any naem in the list, you will be directedto the page of a github repository or a github user’shomepage.
– User can type in the name of a user or a reposi-tory.As shown in figure 8, if the input is a user name,the system will show a list of repositories which theuser may be interested in contributing to and a listof user names who are likely to be the coworkers ofthe user.As show in figure 9, if you want someoneto help you on your repository, you can type in the
Fig. 5. Focus functionality on densely populated results
Fig. 6. Output on incorrect input in Geo-Visual module
name of your repository, the system will give you alist of user names who may be willing to help you.
– ∗ The error message: The two lists of Reposi-tories and Users will not show any result.
∗ The error message explanation: If you type ina name that does not exist or is not included inour database, then the recommendation systemcan not find any result connected to your input.Therefore, it will not show any result in the list.
∗ The error message example As shown in figure10, we arbitrarily type in a name ”1010”, thenit does not show any result.
• The interface mechanisms that activate different views.– The interface mechanism: Our interface have four
modules: Lang-Visual, Geo-Visual, Recommenda-tion, About Project. When you are in one of thisfour modules, you can direct to other three modulesby clicking the name of the module. As shown infigure 11, you are in About Project module, you can
Fig. 7. Recommendation System - UserInterface

Fig. 8. Recommendation for an input of user name
Fig. 9. Recommendation for an input of repository name
go to other modules by clicking the button at the topright corner.
REFERENCES
[1] Big Query - https://bigquery.cloud.google.com[2] Play Framework - https://www.playframework.com[3] Google Charts - https://developers.google.com/chart/?hl=en
Fig. 10. Recommendation for a name does not exist
Fig. 11. The interface mechanism


![[D2CAMPUS] Algorithm tips - ALGOS](https://static.fdocuments.net/doc/165x107/58aea5d61a28abd43a8b60a9/d2campus-algorithm-tips-algos.jpg)