
Final 2017 PV Forecast 2017 PV Forecast ... • Federal Investment Tax Credit ... – Based...
65
ISO-NE PUBLIC Final 2017 PV Forecast MAY 1, 2017 | HOLYOKE, MA
Transcript of Final 2017 PV Forecast 2017 PV Forecast ... • Federal Investment Tax Credit ... – Based...

ISO-NE PUBLIC
Final 2017 PV Forecast
M A Y 1 , 2 0 1 7 | H O L Y O K E , M A
ISO-NE PUBLIC 2
Outline
• Background & Overview
• Distribution Owner Survey Results
• Forecast Assumptions and Inputs
• 2017 PV Forecast - Nameplate MW • 2017 PV Energy Forecast • Breakdown of PV Forecast into
Resource Types
• 2017 Behind-the-meter (BTM) PV Forecast
• Geographic Distribution of PV Forecast

ISO-NE PUBLIC
ISO-NE INTERNAL USE ISO-NE PUBLIC
BACKGROUND & OVERVIEW
3

ISO-NE PUBLIC 4
Background
• Many factors influence the future commercialization potential of PV resources, some of which include: – Policy drivers:
• Feed-in-tariffs (FITs)/Long-term procurement • State RPS programs • Net energy metering (NEM) • Federal Investment Tax Credit (ITC)
– Other drivers: • Role of private investment in PV development • PV development occurs using a variety of business/ownership models • Future equipment and installation costs • Future wholesale and retail electricity costs

ISO-NE PUBLIC 5
The PV Forecast Incorporates State Public Policies and Is Based on Historical Data
• The PV forecast process is informed by ISO analysis and by input from state regulators and other stakeholders through the Distributed Generation Forecast Working Group (DGFWG)
• The PV forecast methodology is straightforward, intuitive, and rational
• The forecast is meant to be a reasonable projection of the anticipated growth of out-of-market, distributed PV resources to be used in ISO’s System Planning studies, consistent with its role to ensure prudent planning assumptions for the bulk power system
• The forecast reflects and incorporates state policies and the ISO does not explicitly forecast the expansion of existing state policies or the development of future state policy programs

ISO-NE PUBLIC 6
Forecast Focuses on State Policies in All Six New England States
• A policy-based forecasting approach has been chosen to reflect the observation that trends in distributed PV development are in large part the result of policy programs developed and implemented by the New England states
• The ISO makes no judgment regarding state policies, but rather utilizes the state goals as a means of informing the forecast
• In an attempt to control related ratepayer costs, states often factor anticipated changes in market conditions directly into policy design, which are therefore implicit to ISO’s policy considerations in the development of the forecast
ISO-NE PUBLIC
Background and Forecast Review Process
• The ISO discussed the draft PV forecast with the DGFWG at the February 28, 2017 meeting – See: https://www.iso-ne.com/static-
assets/documents/2017/02/2017_draft_pvforecast_20170228.pdf
• Stakeholders provided many helpful comments on the draft forecast – See: https://www.iso-
ne.com/committees/planning/distributed-generation/?eventId=131960
• The final PV forecast is published in the 2017 CELT (Section 3): https://www.iso-ne.com/static-assets/documents/2017/05/2017_celt_report.xls
7
ISO-NE PUBLIC
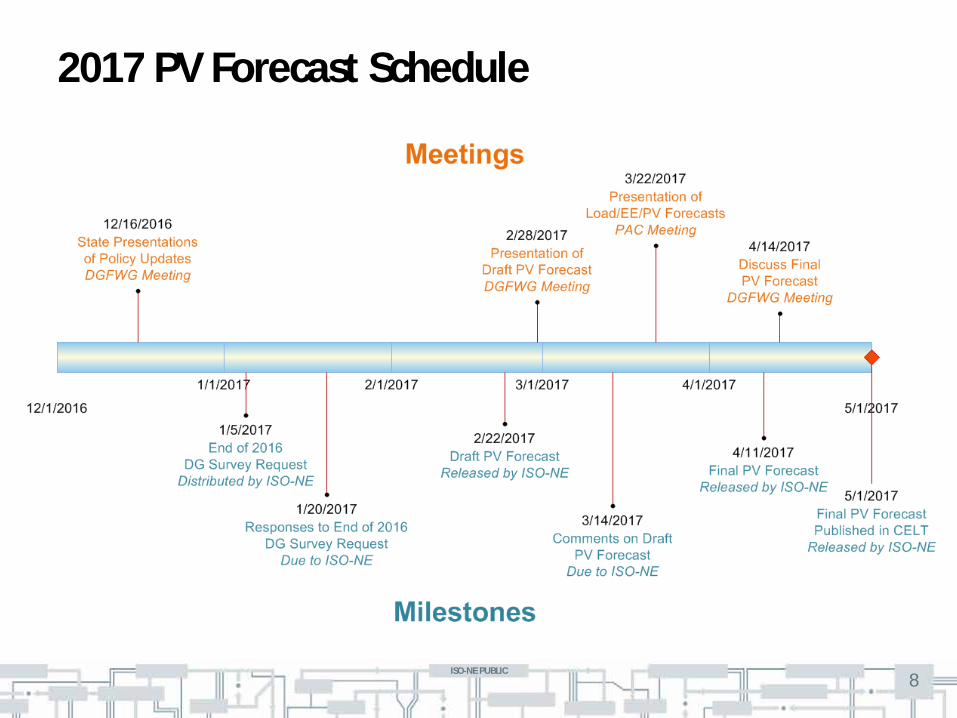
2017 PV Forecast Schedule
8

ISO-NE PUBLIC ISO-NE PUBLIC
DISTRIBUTION OWNER SURVEY RESULTS Installed PV – December 2016
9

ISO-NE PUBLIC 10
December 2016 Year-to-Date Installed PV Capacity Survey Details
• ISO requested distribution owners to provide the total nameplate PV (in MWAC) that is already installed and operational within their respective service territories as of December 31, 2016
• The following Distribution Owners responded: – CT: CL&P, CMEEC, UI – ME: CMP, Emera Maine – MA: Braintree, Chicopee, National Grid, NSTAR, Reading
Shrewsbury, Unitil, WMECO – NH: Liberty, NHEC, PSNH, Unitil – RI: National Grid – VT: Burlington, GMP, Stowe, VEC, VPPSA, WEC
• Based on respondent submittals, installed and operational PV resource totals by distribution owner and state are listed on the following slides
ISO-NE PUBLIC 11
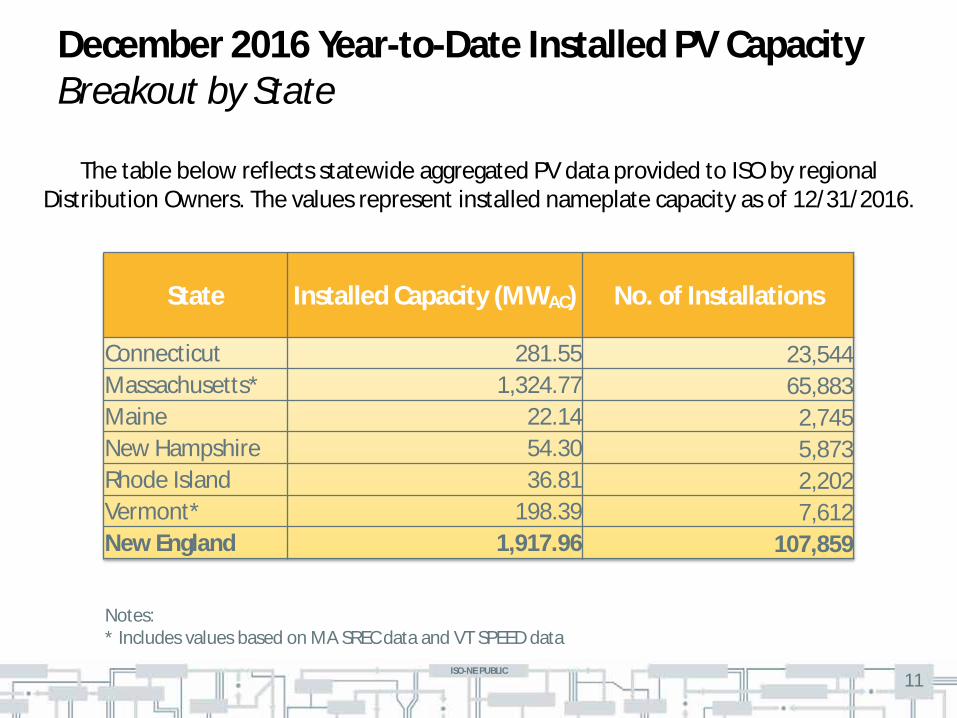
December 2016 Year-to-Date Installed PV Capacity Breakout by State
The table below reflects statewide aggregated PV data provided to ISO by regional Distribution Owners. The values represent installed nameplate capacity as of 12/31/2016.
Notes: * Includes values based on MA SREC data and VT SPEED data
State Installed Capacity (MWAC) No. of Installations
Connecticut 281.55 23,544 Massachusetts* 1,324.77 65,883 Maine 22.14 2,745 New Hampshire 54.30 5,873 Rhode Island 36.81 2,202 Vermont* 198.39 7,612 New England 1,917.96 107,859
ISO-NE PUBLIC 12
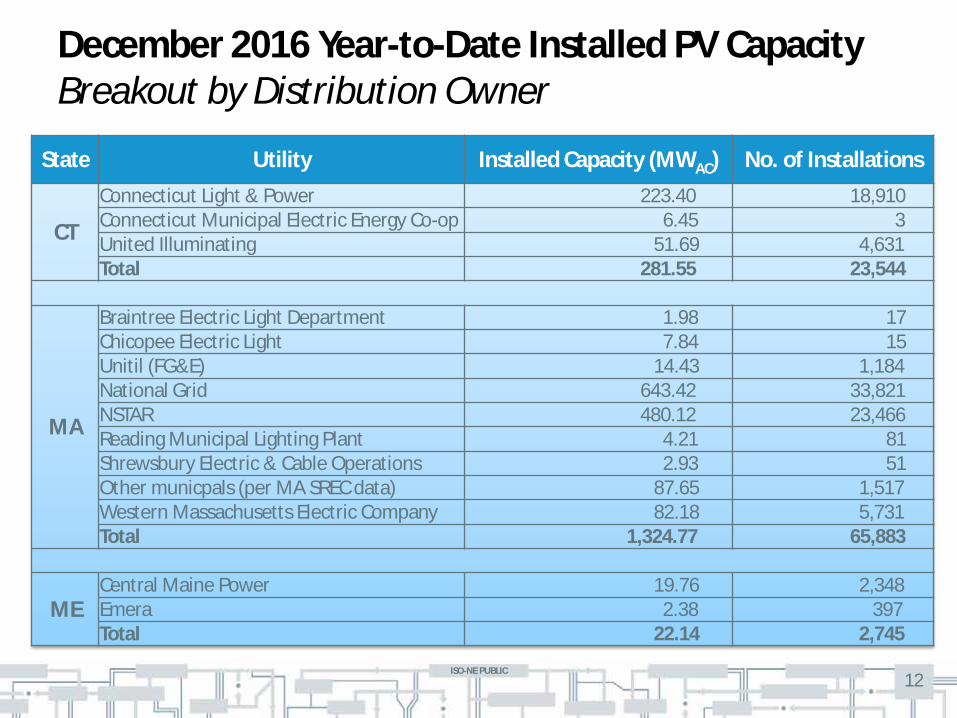
December 2016 Year-to-Date Installed PV Capacity Breakout by Distribution Owner
State Utility Installed Capacity (MWAC) No. of Installations
CT
Connecticut Light & Power 223.40 18,910 Connecticut Municipal Electric Energy Co-op 6.45 3 United Illuminating 51.69 4,631 Total 281.55 23,544
MA
Braintree Electric Light Department 1.98 17 Chicopee Electric Light 7.84 15 Unitil (FG&E) 14.43 1,184 National Grid 643.42 33,821 NSTAR 480.12 23,466 Reading Municipal Lighting Plant 4.21 81 Shrewsbury Electric & Cable Operations 2.93 51 Other municpals (per MA SREC data) 87.65 1,517 Western Massachusetts Electric Company 82.18 5,731 Total 1,324.77 65,883
ME Central Maine Power 19.76 2,348 Emera 2.38 397 Total 22.14 2,745

ISO-NE PUBLIC 13
December 2016 Year-to-Date Installed PV Capacity Breakout by Distribution Owner
State Utility Installed Capacity (MWAC) No. of Installations
NH
Liberty Utilities 3.31 377 New Hampshire Electric Co-op 6.25 778 Public Service of New Hampshire 38.95 4,080 Unitil (UES) 5.79 638 Total 54.30 5,873
RI National Grid 36.81 2,202 Total 36.81 2,202
VT
Burlington Electric Department 2.64 146 Green Mountain Power 173.31 6,204 Stowe Electric Department 1.47 59 Vermont Electric Co-op 12.95 637 Vermont Public Power Supply Authority 4.11 314 Other Municipals (per VT SPEED data) 0.10 1 Washington Electric Co-op 3.80 251 Total 198.39 7,612
New England 1,917.96 107,859

ISO-NE PUBLIC 14
Reflects statewide aggregated PV data provided to ISO by regional Distribution Owners. Values represent installed megawatt AC (MWAC) nameplate.
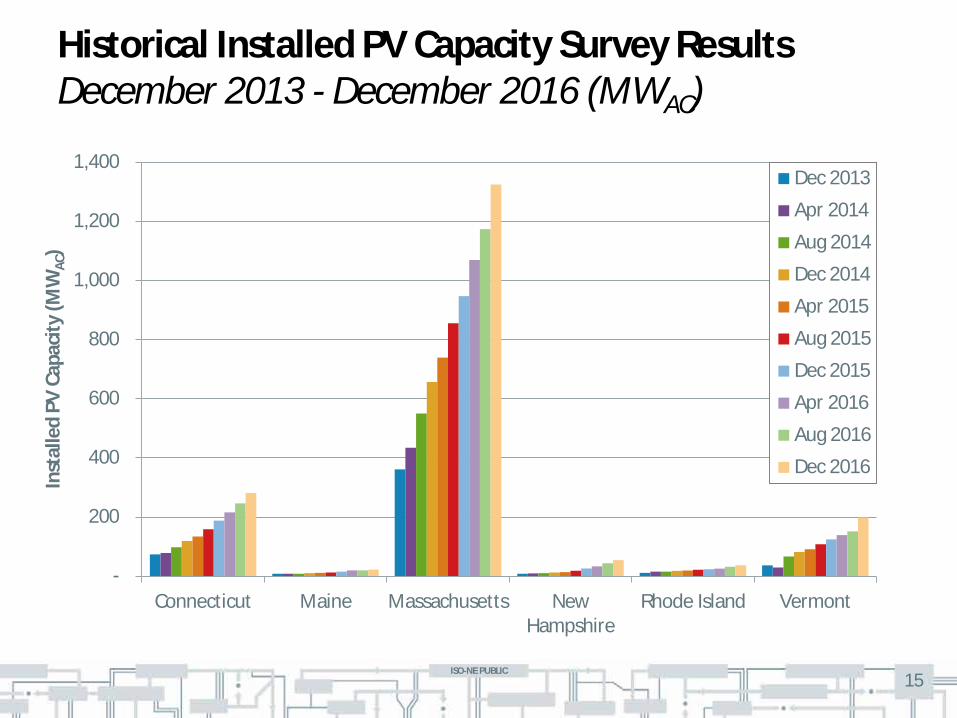
Historical Installed PV Capacity Survey Results December 2013 - December 2016 (MWAC)
Survey Date CT ME MA NH RI VT New England
Dec 2013 73.75 8.12 361.55 8.22 10.90 36.13 498.67
Apr 2014 78.42 8.51 434.39 9.35 15.29 29.40 575.36
Aug 2014 98.02 8.16 550.54 10.17 15.52 66.55 748.96
Dec 2014 118.80 10.38 656.73 12.74 18.21 81.85 898.71
Apr 2015 133.83 11.04 739.48 13.93 19.08 90.76 1,008.12
Aug 2015 158.73 12.43 855.03 18.37 21.51 108.27 1,174.34
Dec 2015 188.01 15.34 947.11 26.36 23.59 124.57 1,324.98
Apr 2016 215.56 19.54 1,069.85 33.11 25.74 139.13 1,502.90
Aug 2016 246.45 19.83 1,173.56 43.77 32.21 151.22 1,667.04
Dec 2016 281.55 22.14 1,324.77 54.30 36.81 198.39 1,917.96
ISO-NE PUBLIC 15
Historical Installed PV Capacity Survey Results December 2013 - December 2016 (MWAC)
-
200
400
600
800
1,000
1,200
1,400
Connecticut Maine Massachusetts NewHampshire
Rhode Island Vermont
Inst
alle
d PV
Cap
acity
(MW
AC)
Dec 2013
Apr 2014
Aug 2014
Dec 2014
Apr 2015
Aug 2015
Dec 2015
Apr 2016
Aug 2016
Dec 2016

ISO-NE PUBLIC 16
Year-Over-Year Installed PV Capacity New England
December 2015 1,325 MWAC
December 2016 1,918 MWAC
More information can be found at: Solar Power in New England: Locations and Impacts
ISO-NE PUBLIC ISO-NE PUBLIC
2017 FORECAST ASSUMPTIONS AND INPUTS
17

ISO-NE PUBLIC
Federal Investment Tax Credit • The federal residential and business Investment Tax Credit (ITC) is a
key driver of PV development in New England
• There are no changes to the ITC since the 2016 forecast
Sources: http://programs.dsireusa.org/system/program/detail/658 and http://programs.dsireusa.org/system/program/detail/1235
18
Maximum Allowable Residential ITC
Year Credit
2016 30%
2017 30%
2018 30%
2019 30%
2020 26%
2021 22%
Future Years 0%
ITC by Date of Construction Start Year construction starts Credit
2016 30%
2017 30%
2018 30%
2019 30%
2020 26%
2021 22%
2022 10%
Future Years 10%
Residential ITC Business ITC

ISO-NE PUBLIC
Massachusetts Forecast Methodology and Assumptions
• MA DPU’s 12/16/16 DGFWG presentation serves as primary source for MA policy information
• MA SREC I/II program goals met and Emergency Regulations result in expansion of SREC II – 83% AC-to-DC ratio assumed – Converted original 2020 goals: 1,600 MWDC = 1,328 MWAC – Emergency Regulations result in additional 400 MWDC = 332 MWAC – Total of 1,660 MWAC
• MA Distribution Owners report a total of 1,324.77 MWAC installed by 12/31/16 – Assume 30 MWAC is non-SREC capacity (i.e., “legacy”) – This results in 1,294.77 MWAC of SREC projects installed by 12/31/16 – This leaves 365.23 MWAC of SREC projects remaining
• SREC I/II programs assumed to end in 2018; remaining capacity applied: – 2017 – 273.9 MW (75%) – 2018 – 91.3 MW (25%)
19
ISO-NE PUBLIC 20
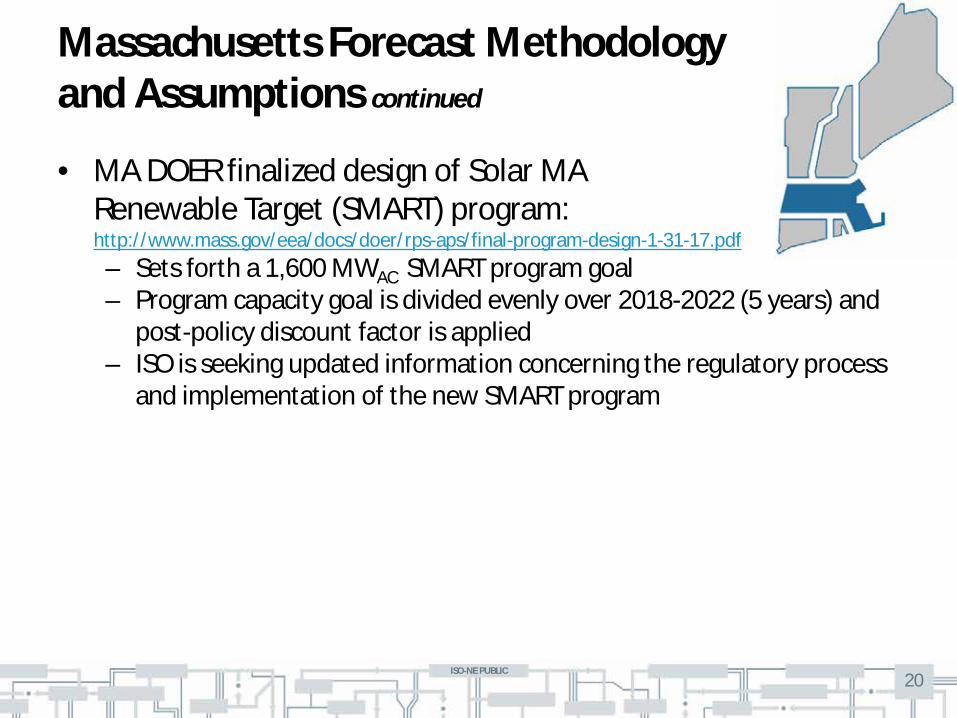
Massachusetts Forecast Methodology and Assumptions continued
• MA DOER finalized design of Solar MA Renewable Target (SMART) program: http://www.mass.gov/eea/docs/doer/rps-aps/final-program-design-1-31-17.pdf – Sets forth a 1,600 MWAC SMART program goal – Program capacity goal is divided evenly over 2018-2022 (5 years) and
post-policy discount factor is applied – ISO is seeking updated information concerning the regulatory process
and implementation of the new SMART program
ISO-NE PUBLIC
Connecticut Forecast Methodology and Assumptions
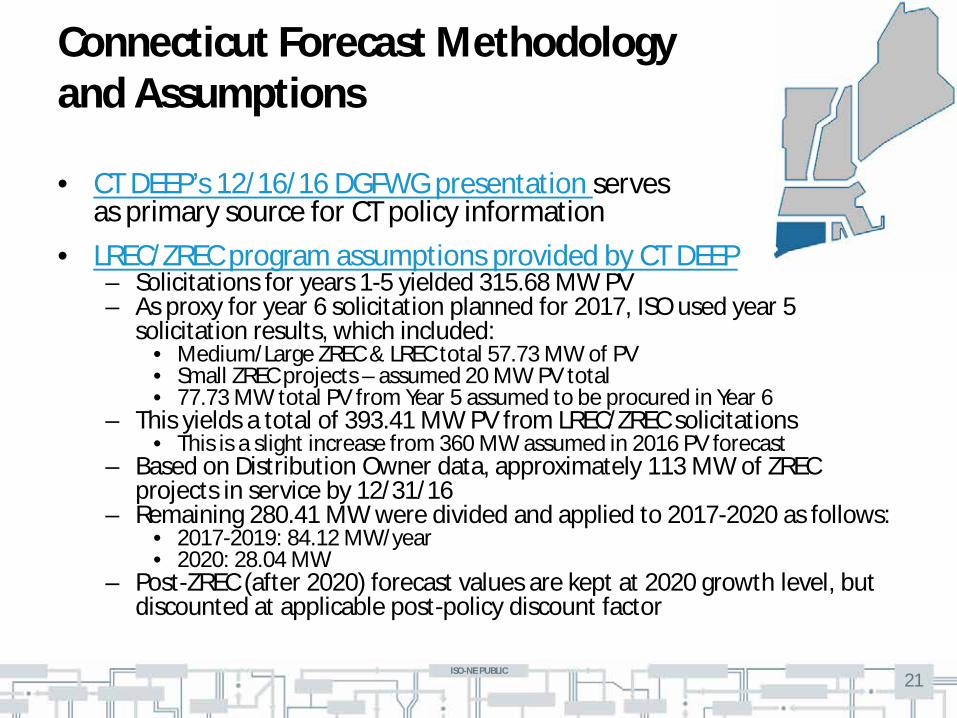
• CT DEEP’s 12/16/16 DGFWG presentation serves as primary source for CT policy information
• LREC/ZREC program assumptions provided by CT DEEP – Solicitations for years 1-5 yielded 315.68 MW PV – As proxy for year 6 solicitation planned for 2017, ISO used year 5
solicitation results, which included: • Medium/Large ZREC & LREC total 57.73 MW of PV • Small ZREC projects – assumed 20 MW PV total • 77.73 MW total PV from Year 5 assumed to be procured in Year 6
– This yields a total of 393.41 MW PV from LREC/ZREC solicitations • This is a slight increase from 360 MW assumed in 2016 PV forecast
– Based on Distribution Owner data, approximately 113 MW of ZREC projects in service by 12/31/16
– Remaining 280.41 MW were divided and applied to 2017-2020 as follows: • 2017-2019: 84.12 MW/year • 2020: 28.04 MW
– Post-ZREC (after 2020) forecast values are kept at 2020 growth level, but discounted at applicable post-policy discount factor
21

ISO-NE PUBLIC
Connecticut Forecast Methodology and Assumptions continued
• CEFIA/Green Bank Residential Solar Incentive Program (RSIP) and Solar Home Renewable Energy Credit (SHREC) program – Total 300 MW goal by 2022, but CT DEEP anticipate goal met by 2019 – Based on Distribution Owner data, approximately 154 MW installed as of
12/31/16 ; with 146 MW remaining • 48.67 MW/year from 2017-2019
– Post-2019: Forecast inputs kept at 48.67 MW/year and post-policy discount factor applied
• Small Scale Procurement (< 5MW) associated with Public Act 15-107 – Total of 5 MW expected to go into service in 2020
• A 20 MW project in Sprague/Lisbon removed from forecast since it is larger than 5MW
22

ISO-NE PUBLIC
Vermont Forecast Methodology and Assumptions
• VT DPS’ 12/16/16 DGFWG presentation serves as primary source for VT policy information, with supplemental information provided as comments on the draft forecast
• DG carve-out of the Renewable Energy Standard (RES) – Assume 85% of eligible resources will be PV and a total of 25 MW/year
will develop
• Standard Offer Program – Will promote a total of 110 MW of PV (of the 127.5 MW total goal) – All prospective renewable energy certificates (RECs) from Standard Offer
projects will be sold to utilities and count towards RES DG carve-out
• Net metering – All prospective RECs from net metered projects will be sold to utilities and
count towards RES DG carve-out
23

ISO-NE PUBLIC
New Hampshire Forecast Methodology and Assumptions
• NH PUC’s 12/16/16 DGFWG presentation serves as primary source for NH policy information
• Based on distribution owner survey results, net metering and other state rebate/grants resulted in 27.9 MW of PV growth in 2016
• Net metering – The new 100 MW cap is reflected in draft forecast – Assume all of the remaining 30.1 MW will be PV, and 100 MW
net metering cap reached by 2018
24
ISO-NE PUBLIC
Rhode Island Forecast Methodology and Assumptions
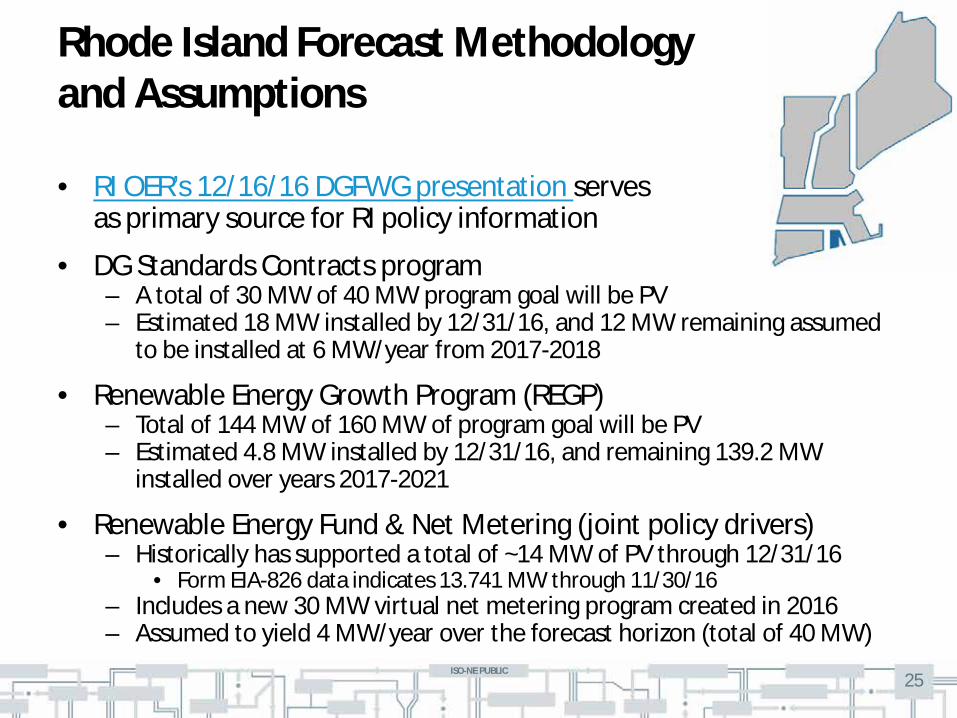
• RI OER’s 12/16/16 DGFWG presentation serves as primary source for RI policy information
• DG Standards Contracts program – A total of 30 MW of 40 MW program goal will be PV – Estimated 18 MW installed by 12/31/16, and 12 MW remaining assumed
to be installed at 6 MW/year from 2017-2018
• Renewable Energy Growth Program (REGP) – Total of 144 MW of 160 MW of program goal will be PV – Estimated 4.8 MW installed by 12/31/16, and remaining 139.2 MW
installed over years 2017-2021
• Renewable Energy Fund & Net Metering (joint policy drivers) – Historically has supported a total of ~14 MW of PV through 12/31/16
• Form EIA-826 data indicates 13.741 MW through 11/30/16 – Includes a new 30 MW virtual net metering program created in 2016 – Assumed to yield 4 MW/year over the forecast horizon (total of 40 MW)
25
ISO-NE PUBLIC
Maine Forecast Methodology and Assumptions
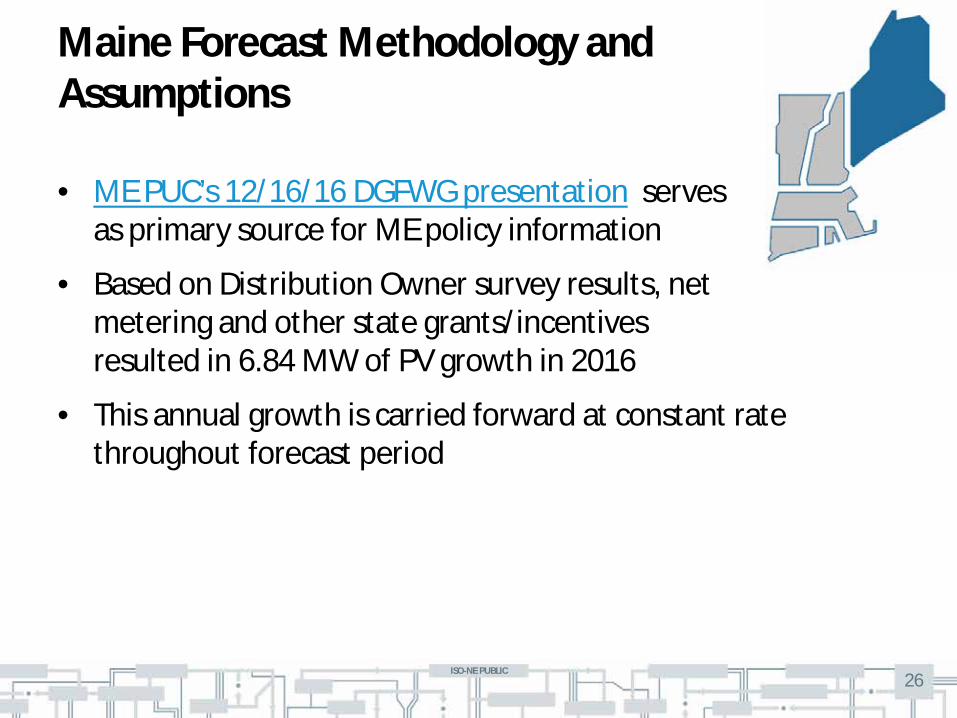
• ME PUC’s 12/16/16 DGFWG presentation serves as primary source for ME policy information
• Based on Distribution Owner survey results, net metering and other state grants/incentives resulted in 6.84 MW of PV growth in 2016
• This annual growth is carried forward at constant rate throughout forecast period
26
ISO-NE PUBLIC
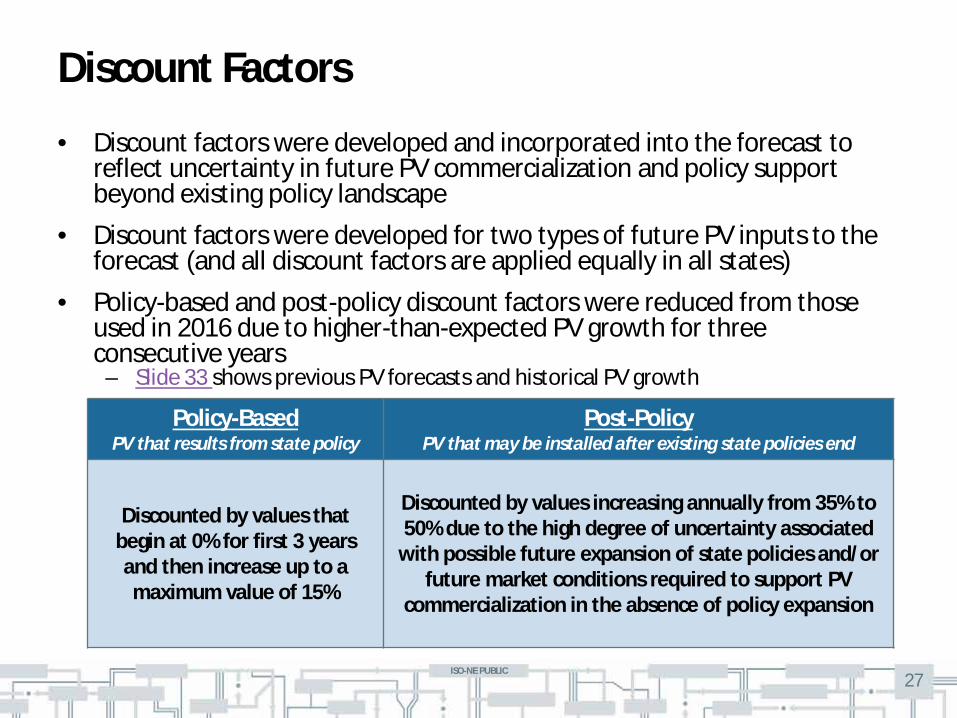
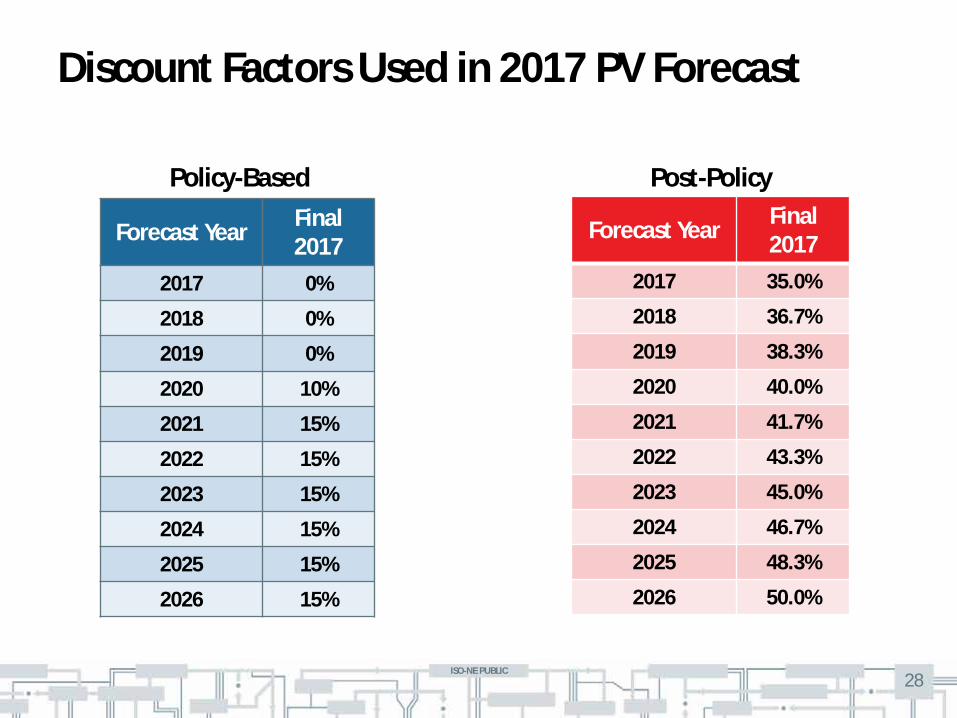
Discount Factors
• Discount factors were developed and incorporated into the forecast to reflect uncertainty in future PV commercialization and policy support beyond existing policy landscape
• Discount factors were developed for two types of future PV inputs to the forecast (and all discount factors are applied equally in all states)
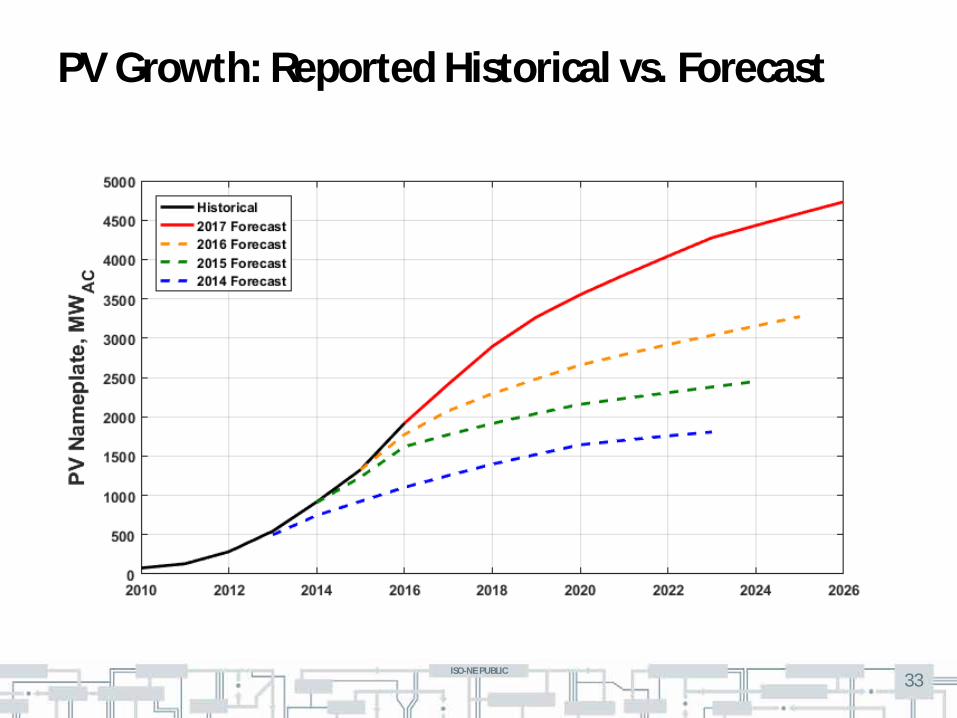
• Policy-based and post-policy discount factors were reduced from those used in 2016 due to higher-than-expected PV growth for three consecutive years – Slide 33 shows previous PV forecasts and historical PV growth
27
Policy-Based PV that results from state policy
Post-Policy PV that may be installed after existing state policies end
Discounted by values that begin at 0% for first 3 years and then increase up to a maximum value of 15%
Discounted by values increasing annually from 35% to 50% due to the high degree of uncertainty associated
with possible future expansion of state policies and/or future market conditions required to support PV
commercialization in the absence of policy expansion
ISO-NE PUBLIC
Discount Factors Used in 2017 PV Forecast
28
Forecast Year Final 2017
2017 0%
2018 0%
2019 0%
2020 10%
2021 15%
2022 15%
2023 15%
2024 15%
2025 15%
2026 15%
Forecast Year Final 2017
2017 35.0%
2018 36.7%
2019 38.3%
2020 40.0%
2021 41.7%
2022 43.3%
2023 45.0%
2024 46.7%
2025 48.3%
2026 50.0%
Policy-Based Post-Policy

ISO-NE PUBLIC
Summary of State-by-State 2017 Forecast Inputs Pre-Discounted Nameplate Values
29
Notes: (1) The above values are not the forecast, but rather pre-discounted inputs to the forecast (see slides 13-25 for details) (2) Yellow highlighted cells indicate that values include post-policy MWs (3) All values include FCM Resources, non-FCM Settlement Only Generators and Generators (per OP-14), and load reducing PV resources (4) All values represent end-of-year nameplate capacities
Thru 2016 2017 2018 2019 2020 2021 2022 2023 2024 2025 2026
CT 281.5 132.8 132.8 132.8 81.7 76.7 76.7 76.7 76.7 76.7 76.7 1,221.9
MA 1324.8 273.9 358.0 266.7 266.7 266.7 266.7 266.7 133.3 133.3 133.3 3,690.0
ME 22.1 6.8 6.8 6.8 6.8 6.8 6.8 6.8 6.8 6.8 6.8 90.5
NH 54.3 18.1 12.0 12.0 12.0 12.0 12.0 12.0 12.0 12.0 12.0 180.7
RI 36.8 41.3 41.3 35.3 35.3 17.9 17.9 17.9 17.9 17.9 17.9 297.6
VT 198.4 25.0 25.0 25.0 25.0 25.0 25.0 25.0 25.0 25.0 25.0 448.4
Pre-Discount Annual Policy-Based MWs 1918.0 497.9 309.3 200.0 100.2 49.8 35.8 35.8 35.8 35.8 35.8 3,254.3
Pre-Discount Annual Post-Policy MWs 0.0 0.0 266.7 278.7 327.4 355.4 369.3 369.3 236.0 236.0 236.0 2,674.8
Pre-Discount Annual Total (MW) 1918.0 497.9 576.0 478.7 427.6 405.2 405.2 405.2 271.8 271.8 271.8 5,929.1
Pre-Discount Cumulative Total (MW) 1918.0 2,415.9 2,991.9 3,470.5 3,898.1 4,303.3 4,708.4 5,113.6 5,385.5 5,657.3 5,929.1 5,929.1
TotalsStatesPre-Discount Annual Total MW (AC nameplate rating)

ISO-NE PUBLIC ISO-NE PUBLIC
2017 PV NAMEPLATE CAPACITY FORECAST Includes FCM, non-FCM, and BTM PV
30

ISO-NE PUBLIC 31
Final 2017 PV Forecast Nameplate Capacity, MWac
Thru 2016 2017 2018 2019 2020 2021 2022 2023 2024 2025 2026
CT 281.5 132.8 132.8 132.8 58.9 44.7 43.5 42.2 40.9 39.6 38.4 988.2
MA 1324.8 273.9 260.2 164.4 160.0 155.6 151.1 146.7 71.1 68.9 66.7 2,843.3
ME 22.1 6.8 6.8 6.8 6.2 5.8 5.8 5.8 5.8 5.8 5.8 83.7
NH 54.3 18.1 12.0 7.4 7.2 7.0 6.8 6.6 6.4 6.2 6.0 138.2
RI 36.8 41.3 41.3 35.3 31.8 15.2 11.3 11.1 10.8 10.6 10.4 255.9
VT 198.4 25.0 25.0 25.0 22.5 21.3 21.3 21.3 21.3 21.3 21.3 423.4
Regional - Annual (MW) 1918.0 497.9 478.2 371.8 286.6 249.6 239.8 233.6 156.3 152.4 148.5 4,732.7
Regional - Cumulative (MW) 1918.0 2415.9 2894.1 3265.9 3552.5 3802.1 4041.9 4275.5 4431.8 4584.2 4732.7 4,732.7
StatesAnnual Total MW (AC nameplate rating)
Totals
Notes: (1) Forecast values include FCM Resources, non-FCM Energy Only Resources, and behind-the-meter PV (2) The forecast reflects discount factors to account for uncertainty in meeting state policy goals (3) All values represent end-of-year installed capacities

ISO-NE PUBLIC
Final 2017 PV Forecast Cumulative Nameplate, MWac
Notes: (1) Forecast values include FCM Resources, non-FCM Energy Only Resources, and behind-the-meter PV (2) The forecast reflects discount factors to account for uncertainty in meeting state policy goals (3) All values represent end-of-year installed capacities
32
Thru 2016 2017 2018 2019 2020 2021 2022 2023 2024 2025 2026
CT 281.5 414.3 547.1 679.9 738.9 783.6 827.1 869.3 910.2 949.8 988.2
MA 1324.8 1598.7 1858.9 2023.3 2183.3 2338.9 2490.0 2636.7 2707.8 2776.7 2843.3
ME 22.1 29.0 35.8 42.7 48.8 54.6 60.4 66.3 72.1 77.9 83.7
NH 54.3 72.4 84.4 91.8 99.1 106.1 112.9 119.5 125.9 132.2 138.2
RI 36.8 78.1 119.5 154.8 186.6 201.8 213.1 224.1 235.0 245.6 255.9
VT 198.4 223.4 248.4 273.4 295.9 317.1 338.4 359.6 380.9 402.1 423.4
Regional - Cumulative (MW) 1918.0 2415.9 2894.1 3265.9 3552.5 3802.1 4041.9 4275.5 4431.8 4584.2 4732.7
StatesCumulative Total MW (AC nameplate rating)
ISO-NE PUBLIC
PV Growth: Reported Historical vs. Forecast
33

ISO-NE PUBLIC ISO-NE PUBLIC
2017 PV ENERGY FORECAST
34
ISO-NE PUBLIC
Development of PV Energy Forecast
• The 2017 PV nameplate forecast reflects end-of-year values
• Energy estimates in the PV forecast are inclusive of incremental growth during a given year
• ISO assumed that historical PV growth trends across the region are indicative of future intra-annual growth rates – Growth trends between 2012 and 2016 were used to estimate intra-
annual incremental growth over the forecast horizon (see next slide)
• The PV energy forecast was developed using a monthly nameplate forecast along with average monthly capacity factors developed from 5 years of PV performance data (2012-2016) – Annual capacity factor = 14.4% – Refer to slides 15 and slides 24-45
35

ISO-NE PUBLIC
Historical Monthly PV Growth Trends, 2012-2016
Month Monthly
PV Growth (% of Annual)
Monthly PV Growth
(Cumulative % of Annual)
1 6% 6% 2 4% 10% 3 6% 16% 4 7% 23% 5 6% 29% 6 8% 37% 7 9% 46% 8 9% 55% 9 7% 62%
10 8% 70% 11 7% 77% 12 23% 100%
Average Monthly Growth Rates, % of Annual
Note: Monthly percentages represent end-of-month values, and
may not sum to total due to rounding
36

ISO-NE PUBLIC
Monthly PV Capacity Factors PV Production Data, 2012-2016
37
ISO-NE PUBLIC
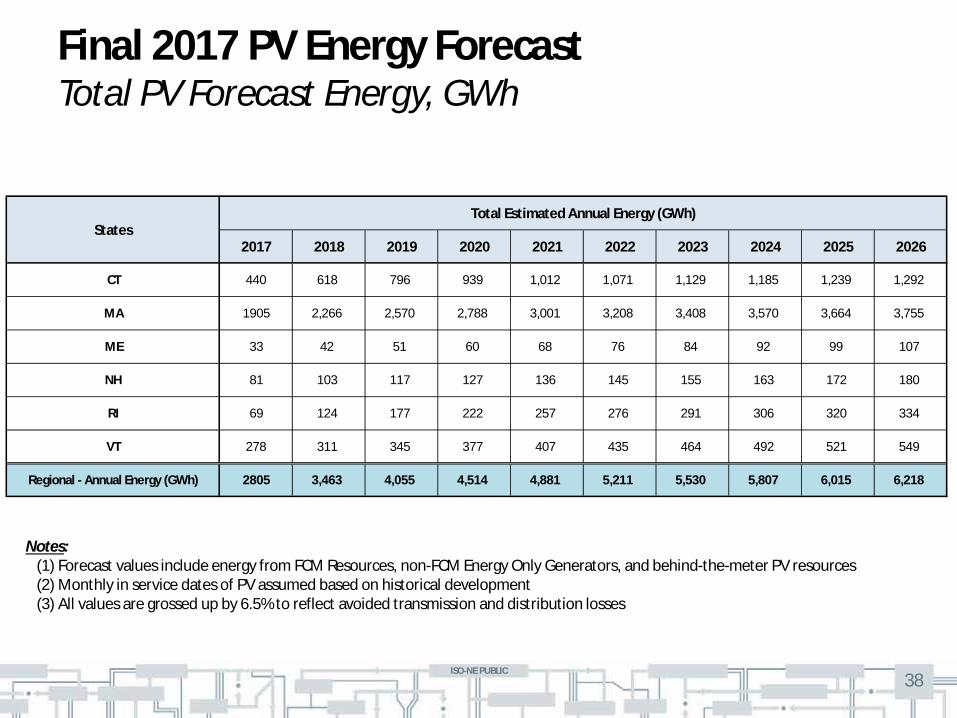
Final 2017 PV Energy Forecast Total PV Forecast Energy, GWh
Notes: (1) Forecast values include energy from FCM Resources, non-FCM Energy Only Generators, and behind-the-meter PV resources (2) Monthly in service dates of PV assumed based on historical development (3) All values are grossed up by 6.5% to reflect avoided transmission and distribution losses
38
2017 2018 2019 2020 2021 2022 2023 2024 2025 2026
CT 440 618 796 939 1,012 1,071 1,129 1,185 1,239 1,292
MA 1905 2,266 2,570 2,788 3,001 3,208 3,408 3,570 3,664 3,755
ME 33 42 51 60 68 76 84 92 99 107
NH 81 103 117 127 136 145 155 163 172 180
RI 69 124 177 222 257 276 291 306 320 334
VT 278 311 345 377 407 435 464 492 521 549
Regional - Annual Energy (GWh) 2805 3,463 4,055 4,514 4,881 5,211 5,530 5,807 6,015 6,218
StatesTotal Estimated Annual Energy (GWh)

ISO-NE PUBLIC ISO-NE PUBLIC
BREAKDOWN OF PV NAMEPLATE FORECAST INTO RESOURCE TYPES
39

ISO-NE PUBLIC
Forecast Includes Classification by Resource Type
• In order to properly account for existing and future PV in planning studies and avoid double counting, ISO classified PV into three distinct types related to the resources assumed market participation/non-participation
• These market distinctions are important for the ISO’s use of the PV forecast in a wide range of planning studies
• The classification process requires the estimation of hourly PV production that is behind-the-meter (BTM), i.e., PV that does not participate in ISO markets – BTM PV reconstitution is discussed in subsequent slides
40
ISO-NE PUBLIC
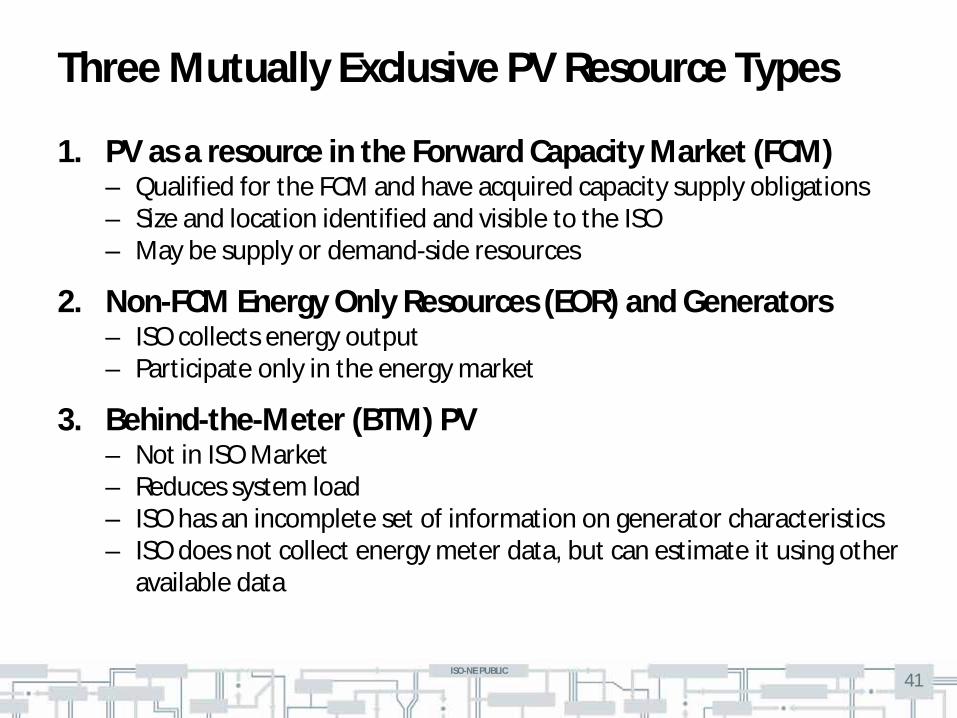
Three Mutually Exclusive PV Resource Types
1. PV as a resource in the Forward Capacity Market (FCM) – Qualified for the FCM and have acquired capacity supply obligations – Size and location identified and visible to the ISO – May be supply or demand-side resources
2. Non-FCM Energy Only Resources (EOR) and Generators – ISO collects energy output – Participate only in the energy market
3. Behind-the-Meter (BTM) PV – Not in ISO Market – Reduces system load – ISO has an incomplete set of information on generator characteristics – ISO does not collect energy meter data, but can estimate it using other
available data
41

ISO-NE PUBLIC
• Resource types vary by state – Can be influenced by state regulations
and policies (e.g., net metering requirements)
• The following steps were used to determine PV resource types for each state over the forecast horizon: 1. FCM
• Identify all Generation and Demand Response FCM PV resources for each Capacity Commitment Period (CCP) through FCA 11
2. Non-FCM EOR/Gen • Determine the % share of non-FCM PV participating in energy market at
the end of 2016 and assume this share remains constant throughout the forecast period
3. BTM • Subtract the values from steps 1 and 2 from the annual state PV
forecast, the remainder is the BTM PV
42
Determining PV Resource Type By State

ISO-NE PUBLIC
PV in ISO New England Markets
• FCM – ISO identified all PV generators or demand resources (DR) that have
Capacity Supply Obligations (CSO) in FCM up through FCA 11 – Assume aggregate total PV in FCM as of FCA 11 remains constant from
2020-2026
• Non-FCM Gen/EOR – ISO identified total nameplate capacity of PV in each state registered
in the energy market as of 12/31/16 – Assume % share of nameplate PV in energy market as of 12/31/16
remains constant throughout the forecast horizon
• Other assumptions – Supply-side FCM PV resources operate as EOR/Gen prior to their first
FCM commitment period (this has been observed in Massachusetts) – Planned PV projects known to be > 5 MWac nameplate are assumed to
trigger OP-14 requirement to register in ISO energy market as a Generator
43

ISO-NE PUBLIC
Estimation of Hourly BTM PV for Reconstitution
• Hourly historical BTM PV production data is needed to reconstitute PV into the historical loads used to develop the long-term gross load forecast
• ISO estimates hourly BTM PV production using historical PV production data and utility-provided historical PV installation data – Data sources and method are
described on the following slides
44

ISO-NE PUBLIC
• ISO develops hourly state PV profiles for the period 1/1/2012 –1/31/2016 using historical PV production data – Data are aggregated into normalized profiles for each state, which
represent a per-MW-of-nameplate production profile for PV
• Total state PV production is estimated by scaling the profiles up to the total PV installed over the period according to distribution utility data – (Normalized Hrly Profile) x (Total installed PV Capacity) = Hourly PV
production
• Subtracting the hourly PV settlements energy (where applicable) yields the total hourly BTM PV for each state
45
BTM PV Profiles Used for Reconstitution Methodology

ISO-NE PUBLIC
BTM PV Profiles Used for Reconstitution Data Source for Period From 1/1/12 to 12/31/13
• Hourly state PV profiles developed for two years (2012-2013) using production data using Yaskawa-Solectria Solar’s web-based monitoring system, SolrenView* – Represents PV generation at the
inverter or at the revenue-grade meter
• A total of more than 1,200 individual sites representing more than 125 MWac in nameplate capacity were used – Site locations depicted on adjacent
map
Yaskawa-Solectria Sites
46
*Source: http://www.solrenview.com/

ISO-NE PUBLIC
BTM PV Profiles Used for Reconstitution Data Source for Period From 1/1/14 to 1/31/17
• ISO has contracted with a third-party vendor for PV production data services
– Represents PV generation at the inverter – Includes data from more than 9,000 PV
installations – Data are 5-minutely and at the town level – Broad geographic coverage – Data provided begins in 2014
• An example snapshot of regional data is plotted to the right
– Data are from February 2, 2017 at 12:10pm – Yellow/red coloring shows level of PV
production – No data available in towns colored gray – Data not requested in towns colored black
• Using these data, state PV profiles are developed as described on the previous slide
47
Figure notes: 1. Graphic developed by ISO New England 2. Data source: Quantitative Business Analytics, Inc.
ISO-NE PUBLIC
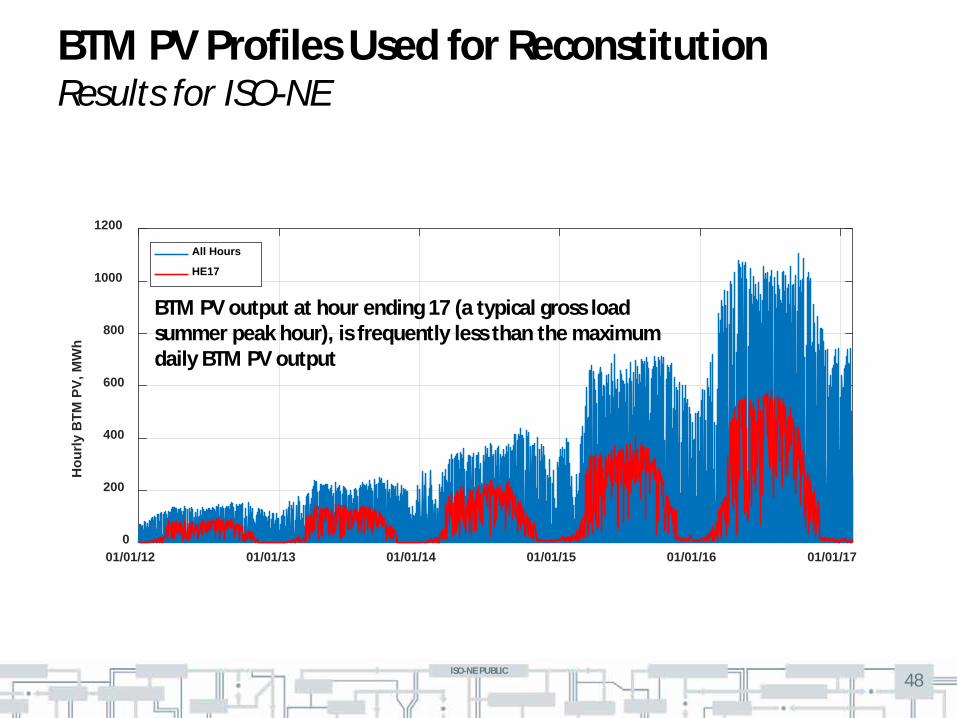
BTM PV Profiles Used for Reconstitution Results for ISO-NE
48
01/01/12 01/01/13 01/01/14 01/01/15 01/01/16 01/01/170
200
400
600
800
1000
1200
Hou
rly B
TM P
V, M
Wh
All Hours
HE17
BTM PV output at hour ending 17 (a typical gross load summer peak hour), is frequently less than the maximum daily BTM PV output

ISO-NE PUBLIC ISO-NE PUBLIC
FINAL 2017 PV NAMEPLATE FORECAST BY RESOURCE TYPE
49

ISO-NE PUBLIC
Final 2017 PV Forecast Cumulative Nameplate, MWac
50
Note: All values represent end-of-year installed capacities

ISO-NE PUBLIC
Cumulative Nameplate by Resource Type, MWac Connecticut
51
Note: All values represent end-of-year installed capacities
ISO-NE PUBLIC
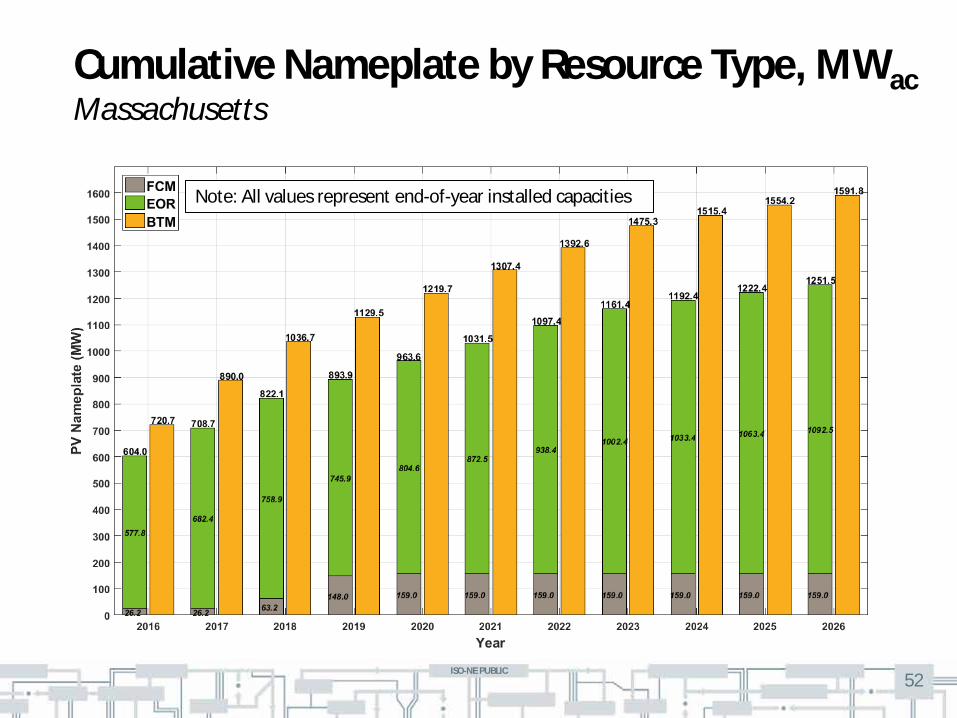
Cumulative Nameplate by Resource Type, MWac Massachusetts
52
Note: All values represent end-of-year installed capacities

ISO-NE PUBLIC
Cumulative Nameplate by Resource Type, MWac Maine
53
Note: All values represent end-of-year installed capacities

ISO-NE PUBLIC
Cumulative Nameplate by Resource Type, MWac New Hampshire
54
Note: All values represent end-of-year installed capacities

ISO-NE PUBLIC
Cumulative Nameplate by Resource Type, MWac Rhode Island
55
Note: All values represent end-of-year installed capacities

ISO-NE PUBLIC
Cumulative Nameplate by Resource Type, MWac Vermont
56
Note: All values represent end-of-year installed capacities

ISO-NE PUBLIC ISO-NE PUBLIC
2017 CELT BTM PV FORECAST: ESTIMATED ENERGY & SUMMER PEAK LOAD REDUCTIONS
57
ISO-NE PUBLIC 58
BTM PV Forecast Used in CELT Net Load Forecast
• The 2017 CELT net load forecast reflects deductions associated with the BTM PV portion of the PV forecast
• The following slides show values for annual energy and summer peak load reductions anticipated from BTM PV that is reflected in the 2017 CELT net load forecast – PV does not reduce winter peak loads, which occur after sunset
• ISO developed estimated summer peak load reductions associated with BTM PV forecast using the methodology established for the 2016 PV forecast – See Appendix of 2016 PV Forecast slides: https://www.iso-ne.com/static-
assets/documents/2016/09/2016_solar_forecast_details_final.pdf

ISO-NE PUBLIC
Final 2017 PV Energy Forecast BTM PV, GWh
Notes: (1) Forecast values include energy from FCM Resources, non-FCM Energy Only Resources, and behind-the-meter PV (2) Monthly in service dates of PV assumed based on historical development (3) All values are grossed up by 6.5% to reflect avoided transmission and distribution losses
59
States 2016 2017 2018 2019 2020 2021 2022 2023 2024 2025 2026CT 341 435 612 789 928 995 1054 1112 1167 1221 1273MA 947 1046 1262 1434 1557 1677 1793 1906 1997 2051 2102ME 27 33 42 51 60 68 76 84 92 99 107NH 51 74 93 106 115 124 132 141 149 156 164RI 17 29 53 75 95 110 118 124 130 137 143VT 197 278 311 345 377 407 435 464 492 521 549
1581 1894 2373 2800 3133 3381 3609 3830 4027 4185 4338
Estimated Annual Energy (GWh)Category
Behind-the-Meter PV
Behind-the Meter Total

ISO-NE PUBLIC
Notes: (1) Forecast values are for behind-the-meter PV only (2) BTM PV peak load reductions relate to coincident summer peak loads only; values for non-coincident summer peak loads (for example, at
the state level) may be different (3) Values include the effect of diminishing PV production as increasing PV penetrations shift the timing of peaks later in the day (4) All values represent anticipated July 1st installed PV, and are grossed up by 8% to reflect avoided transmission and distribution losses (5) Different planning studies may use values different that these estimated peak load reductions based on the intent of the study
Final 2017 Forecast BTM PV: July 1st Estimated Summer Peak Load Reductions
60
States 2016 2017 2018 2019 2020 2021 2022 2023 2024 2025 2026CT 94.9 132.6 178.4 220.9 251.2 262.4 271.4 279.5 287.5 296.0 303.8MA 255.0 317.3 366.9 400.3 421.3 442.2 461.8 479.5 491.8 496.9 501.4ME 8.2 10.0 12.2 14.3 16.3 18.0 19.6 21.1 22.6 24.1 25.6NH 14.2 22.5 27.2 29.6 31.2 32.7 34.1 35.4 36.6 37.9 39.1RI 5.0 8.9 15.4 21.1 25.7 28.9 30.3 31.2 32.1 33.1 34.0VT 61.2 84.1 90.4 96.3 102.1 107.3 112.1 116.7 121.3 126.3 131.1
Cumulative 438.6 575.4 690.5 782.5 847.8 891.5 929.3 963.3 991.8 1014.3 1035.0
39.1% 37.5% 36.0% 34.6% 33.5% 32.7% 31.9% 31.2% 30.6% 30.1% 29.6%
Cumulative Total MW - Estimated Summer Seasonal Peak Load Reduction
Category
Behind-the-Meter PV
Total
Estimated Summer Seasonal Peak Load Reduction - % of BTM AC nameplate
ISO-NE PUBLIC ISO-NE PUBLIC
GEOGRAPHIC DISTRIBUTION OF PV FORECAST
61
ISO-NE PUBLIC
Background
• A reasonable representation of the locations of existing and future PV resources is required for appropriate modeling
• The locations of most future PV resources are ultimately unknown
• Mitigation of some of this uncertainty (especially for near-term development) is possible via analysis of available data
62

ISO-NE PUBLIC
• Demand Response (DR) Dispatch Zones were created as part of the DR Integration project
• These zones were created in consideration of electrical interfaces
• Quantifying existing and forecasted PV resources by Dispatch Zone (with nodal placement of some) will aid in the modeling of PV resources for planning and operations purposes
63
Forecasting Solar By DR Dispatch Zone

ISO-NE PUBLIC
Geographic Distribution of PV Forecast
• Existing MWs: – Apply I.3.9 project MWs nodally – For remaining existing MWs,
determine Dispatch Zone locations of projects already interconnected based on utility distribution queue data (town/zip), and apply MWs equally to all nodes in Zone
• Future MWs: – Apply I.3.9 project MWs nodally – For longer-term forecast,
assume the same distribution as existing MWs
64
ISO-NE PUBLIC
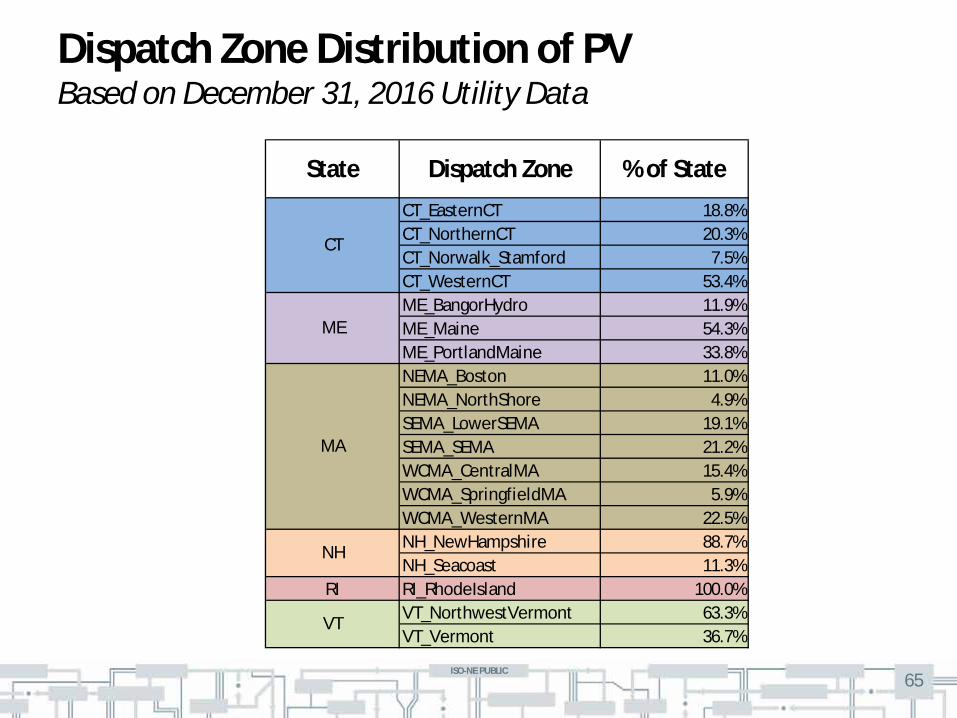
Dispatch Zone Distribution of PV Based on December 31, 2016 Utility Data
65
State Dispatch Zone % of StateCT_EasternCT 18.8%CT_NorthernCT 20.3%CT_Norwalk_Stamford 7.5%CT_WesternCT 53.4%ME_BangorHydro 11.9%ME_Maine 54.3%ME_PortlandMaine 33.8%NEMA_Boston 11.0%NEMA_NorthShore 4.9%SEMA_LowerSEMA 19.1%SEMA_SEMA 21.2%WCMA_CentralMA 15.4%WCMA_SpringfieldMA 5.9%WCMA_WesternMA 22.5%NH_NewHampshire 88.7%NH_Seacoast 11.3%
RI RI_RhodeIsland 100.0%VT_NorthwestVermont 63.3%VT_Vermont 36.7%
CT
ME
MA
NH
VT


![Future Representative Installed Capacity Requirements for ... · [a] The 2018 CELT forecast 50/50 peak loads reflect the load reduction associated with the behind-the-meter PV forecast](https://static.fdocuments.net/doc/165x107/5e5585e02f172b0510192655/future-representative-installed-capacity-requirements-for-a-the-2018-celt.jpg)
