Finacial Statement Analysis
16
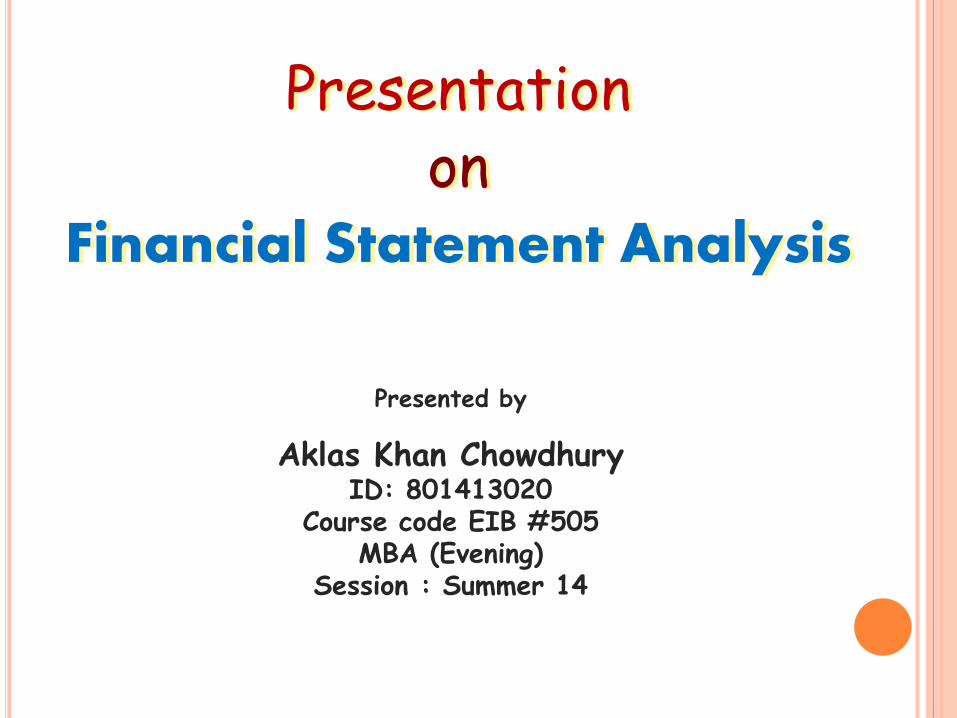
Presentation on Financial Statement Analysis Presented by Aklas Khan Chowdhury ID: 801413020 Course code EIB #505 MBA (Evening) Session : Summer 14
-
Upload
aklas-chowdhury -
Category
Economy & Finance
-
view
286 -
download
3
Transcript of Finacial Statement Analysis
Presentationon
Financial Statement Analysis
Presented by
Aklas Khan ChowdhuryID: 801413020
Course code EIB #505MBA (Evening)
Session : Summer 14

Particutalars2012-2013
Taka2011-2012
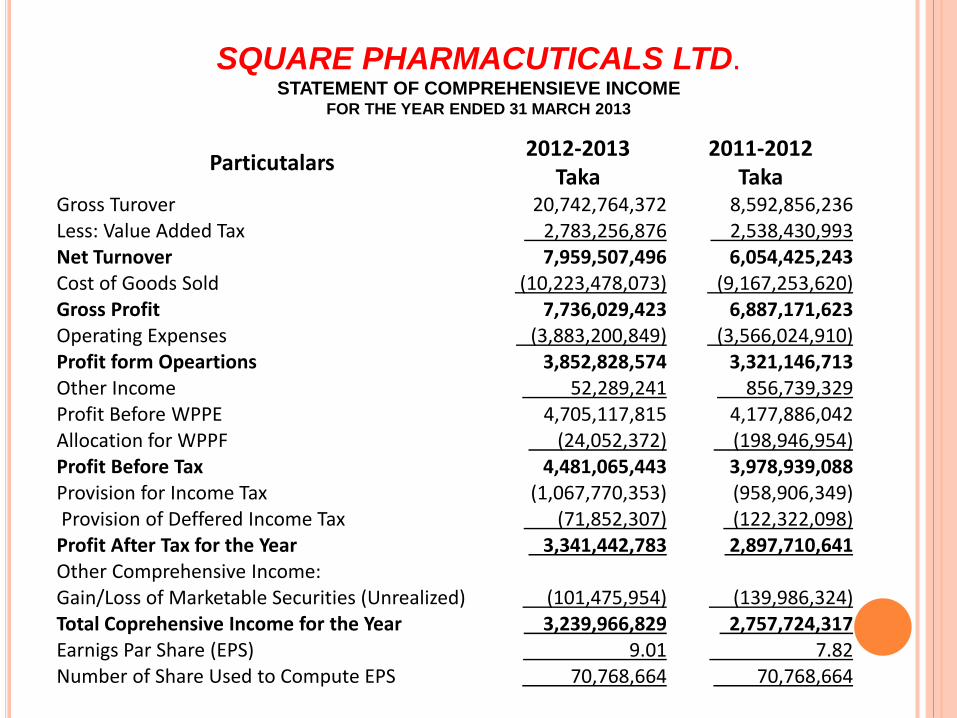
TakaGross Turover 20,742,764,372 8,592,856,236 Less: Value Added Tax 2,783,256,876 2,538,430,993 Net Turnover 7,959,507,496 6,054,425,243 Cost of Goods Sold (10,223,478,073) (9,167,253,620) Gross Profit 7,736,029,423 6,887,171,623 Operating Expenses (3,883,200,849) (3,566,024,910)Profit form Opeartions 3,852,828,574 3,321,146,713 Other Income 52,289,241 856,739,329 Profit Before WPPE 4,705,117,815 4,177,886,042 Allocation for WPPF (24,052,372) (198,946,954) Profit Before Tax 4,481,065,443 3,978,939,088 Provision for Income Tax (1,067,770,353) (958,906,349) Provision of Deffered Income Tax (71,852,307) (122,322,098) Profit After Tax for the Year 3,341,442,783 2,897,710,641 Other Comprehensive Income:Gain/Loss of Marketable Securities (Unrealized) (101,475,954) (139,986,324) Total Coprehensive Income for the Year 3,239,966,829 2,757,724,317 Earnigs Par Share (EPS) 9.01 7.82 Number of Share Used to Compute EPS 70,768,664 70,768,664
SQUARE PHARMACUTICALS LTD.STATEMENT OF COMPREHENSIEVE INCOME
FOR THE YEAR ENDED 31 MARCH 2013
Particutalars2012-2013
Taka2011-2012
TakaASSETS
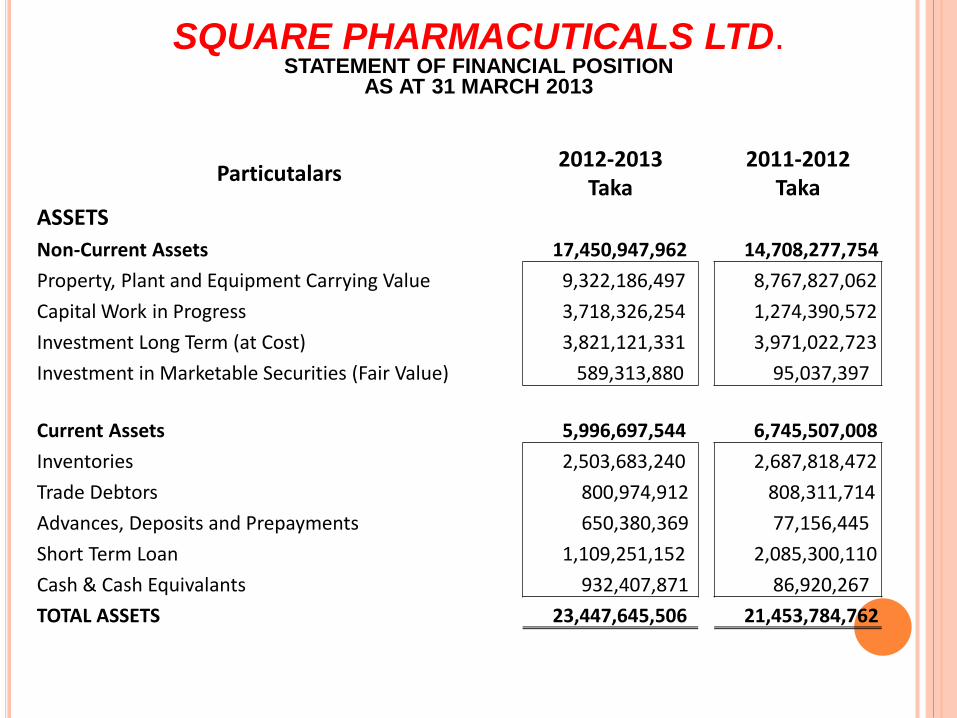
Non-Current Assets 17,450,947,962 14,708,277,754
Property, Plant and Equipment Carrying Value 9,322,186,497 8,767,827,062
Capital Work in Progress 3,718,326,254 1,274,390,572
Investment Long Term (at Cost) 3,821,121,331 3,971,022,723
Investment in Marketable Securities (Fair Value) 589,313,880 95,037,397
Current Assets 5,996,697,544 6,745,507,008
Inventories 2,503,683,240 2,687,818,472
Trade Debtors 800,974,912 808,311,714
Advances, Deposits and Prepayments 650,380,369 77,156,445
Short Term Loan 1,109,251,152 2,085,300,110
Cash & Cash Equivalants 932,407,871 86,920,267
TOTAL ASSETS 23,447,645,506 21,453,784,762
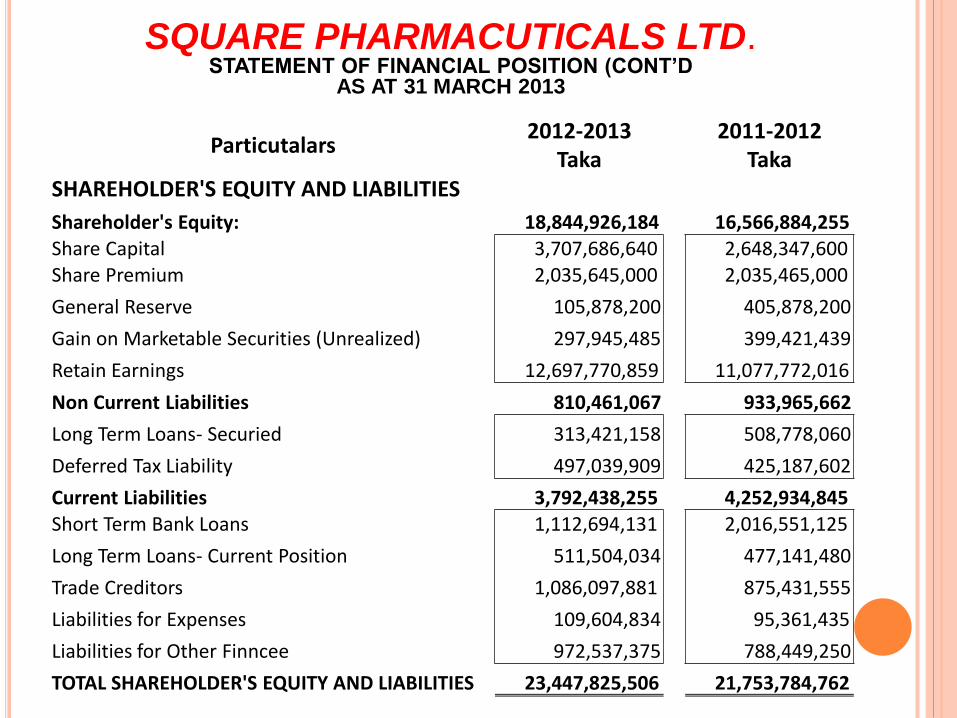
SQUARE PHARMACUTICALS LTD.STATEMENT OF FINANCIAL POSITION
AS AT 31 MARCH 2013
Particutalars2012-2013
Taka2011-2012
TakaSHAREHOLDER'S EQUITY AND LIABILITIES
Shareholder's Equity: 18,844,926,184 16,566,884,255 Share Capital 3,707,686,640 2,648,347,600 Share Premium 2,035,645,000 2,035,465,000
General Reserve 105,878,200 405,878,200
Gain on Marketable Securities (Unrealized) 297,945,485 399,421,439
Retain Earnings 12,697,770,859 11,077,772,016
Non Current Liabilities 810,461,067 933,965,662
Long Term Loans- Securied 313,421,158 508,778,060
Deferred Tax Liability 497,039,909 425,187,602
Current Liabilities 3,792,438,255 4,252,934,845 Short Term Bank Loans 1,112,694,131 2,016,551,125
Long Term Loans- Current Position 511,504,034 477,141,480
Trade Creditors 1,086,097,881 875,431,555
Liabilities for Expenses 109,604,834 95,361,435
Liabilities for Other Finncee 972,537,375 788,449,250
TOTAL SHAREHOLDER'S EQUITY AND LIABILITIES 23,447,825,506 21,753,784,762
SQUARE PHARMACUTICALS LTD.STATEMENT OF FINANCIAL POSITION (CONT’D
AS AT 31 MARCH 2013
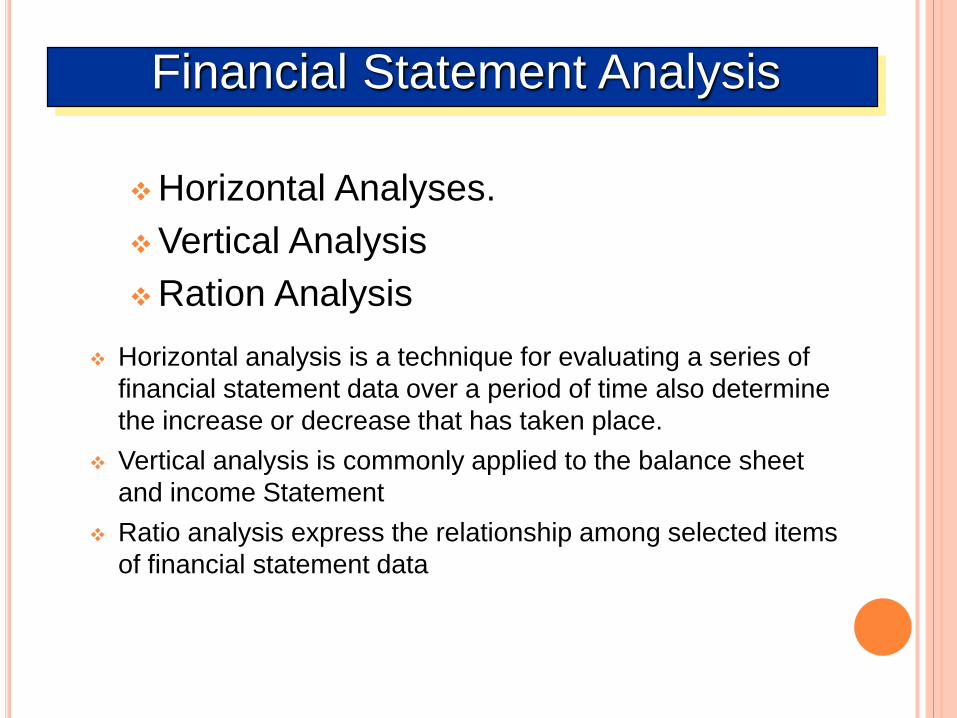
Horizontal analysis is a technique for evaluating a series of
financial statement data over a period of time also determine
the increase or decrease that has taken place.
Vertical analysis is commonly applied to the balance sheet
and income Statement
Ratio analysis express the relationship among selected items
of financial statement data
Financial Statement Analysis
Horizontal Analyses.
Vertical Analysis
Ration Analysis
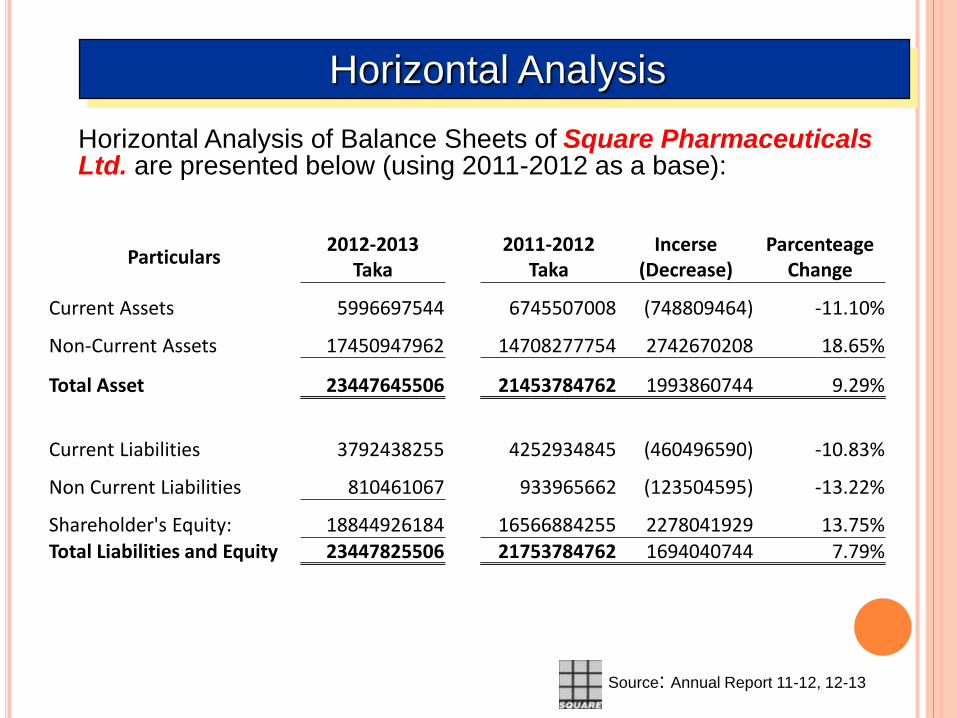
Horizontal Analysis of Balance Sheets of Square Pharmaceuticals Ltd. are presented below (using 2011-2012 as a base):
Particulars2012-2013
Taka2011-2012
TakaIncerse
(Decrease)Parcenteage
Change
Current Assets 5996697544 6745507008 (748809464) -11.10%
Non-Current Assets 17450947962 14708277754 2742670208 18.65%
Total Asset 23447645506 21453784762 1993860744 9.29%
Current Liabilities 3792438255 4252934845 (460496590) -10.83%
Non Current Liabilities 810461067 933965662 (123504595) -13.22%
Shareholder's Equity: 18844926184 16566884255 2278041929 13.75%
Total Liabilities and Equity 23447825506 21753784762 1694040744 7.79%
Horizontal Analysis
Source: Annual Report 11-12, 12-13
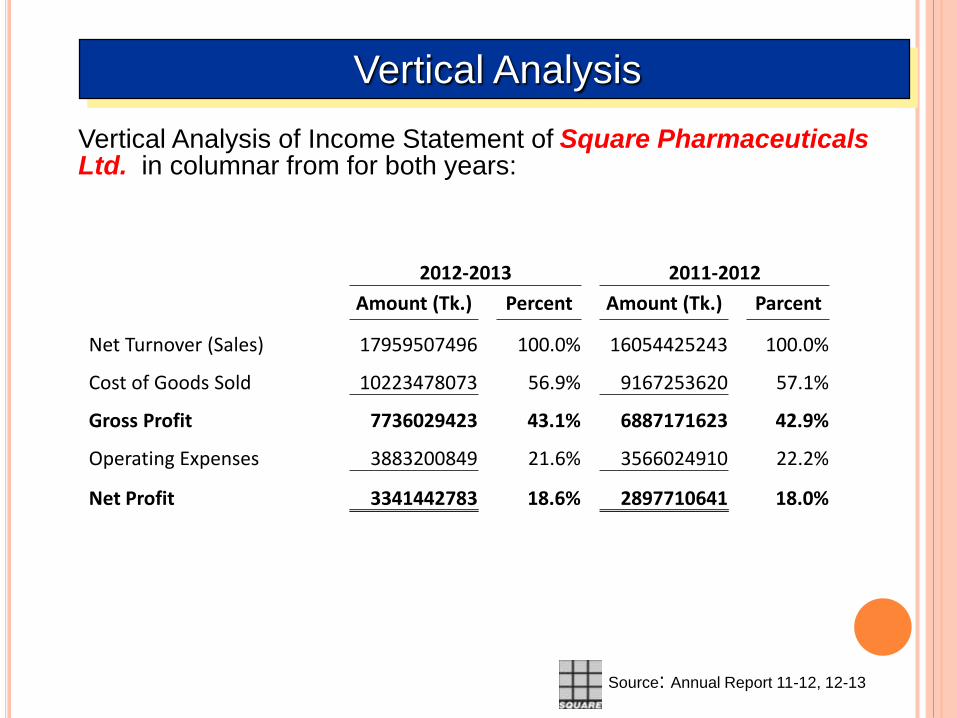
Vertical Analysis of Income Statement of Square Pharmaceuticals Ltd. in columnar from for both years:
Vertical Analysis
2012-2013 2011-2012
Amount (Tk.) Percent Amount (Tk.) Parcent
Net Turnover (Sales) 17959507496 100.0% 16054425243 100.0%
Cost of Goods Sold 10223478073 56.9% 9167253620 57.1%
Gross Profit 7736029423 43.1% 6887171623 42.9%
Operating Expenses 3883200849 21.6% 3566024910 22.2%
Net Profit 3341442783 18.6% 2897710641 18.0%
Source: Annual Report 11-12, 12-13

Vertical Analysis of Income Statement of Square Pharmaceuticals Ltd. in columnar from for both years:
Ratio Analysis
2012-2013 2011-2012
Amount (Tk.) Percent Amount (Tk.) Parcent
Net Turnover (Sales) 17959507496 100.0% 16054425243 100.0%
Cost of Goods Sold 10223478073 56.9% 9167253620 57.1%
Gross Profit 7736029423 43.1% 6887171623 42.9%
Operating Expenses 3883200849 21.6% 3566024910 22.2%
Net Profit 3341442783 18.6% 2897710641 18.0%
Source: Annual Report 11-12, 12-13
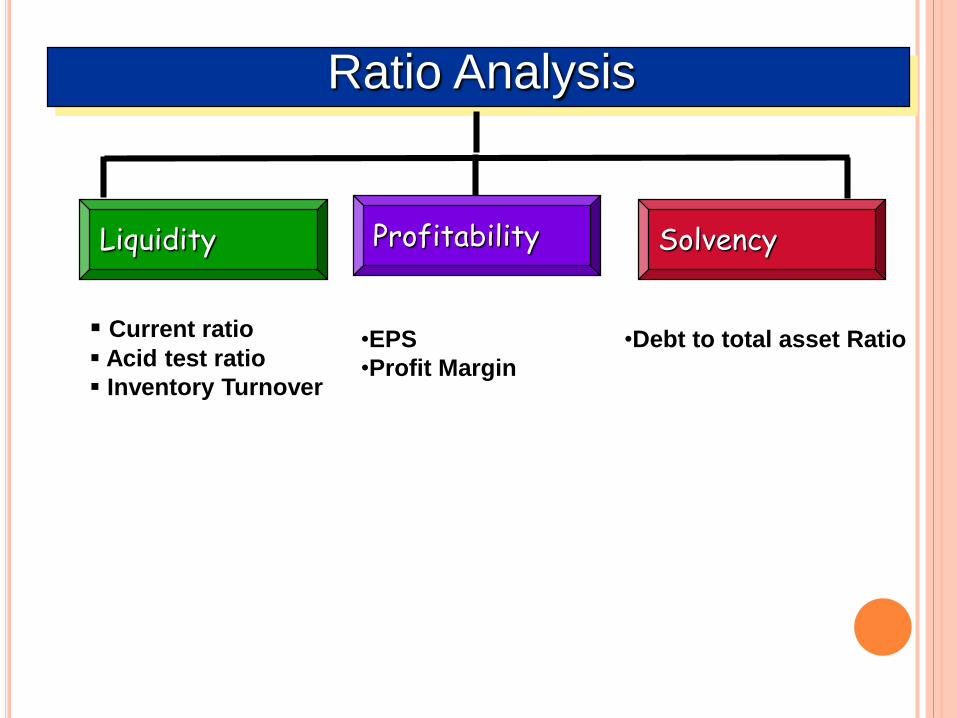
Ratio Analysis
Liquidity Profitability Solvency
Current ratio
Acid test ratio
Inventory Turnover
•EPS
•Profit Margin
•Debt to total asset Ratio
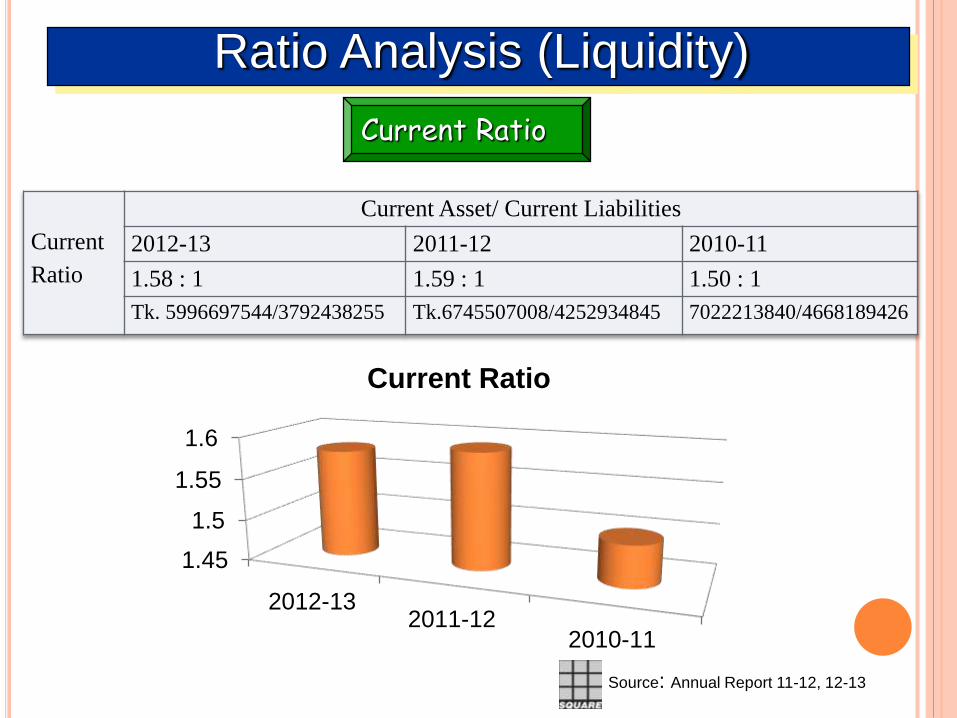
Ratio Analysis (Liquidity)
Current Ratio
Current
Ratio
Current Asset/ Current Liabilities
2012-13 2011-12 2010-11
1.58 : 1 1.59 : 1 1.50 : 1
Tk. 5996697544/3792438255 Tk.6745507008/4252934845 7022213840/4668189426
1.45
1.5
1.55
1.6
2012-132011-12
2010-11
Current Ratio
Source: Annual Report 11-12, 12-13
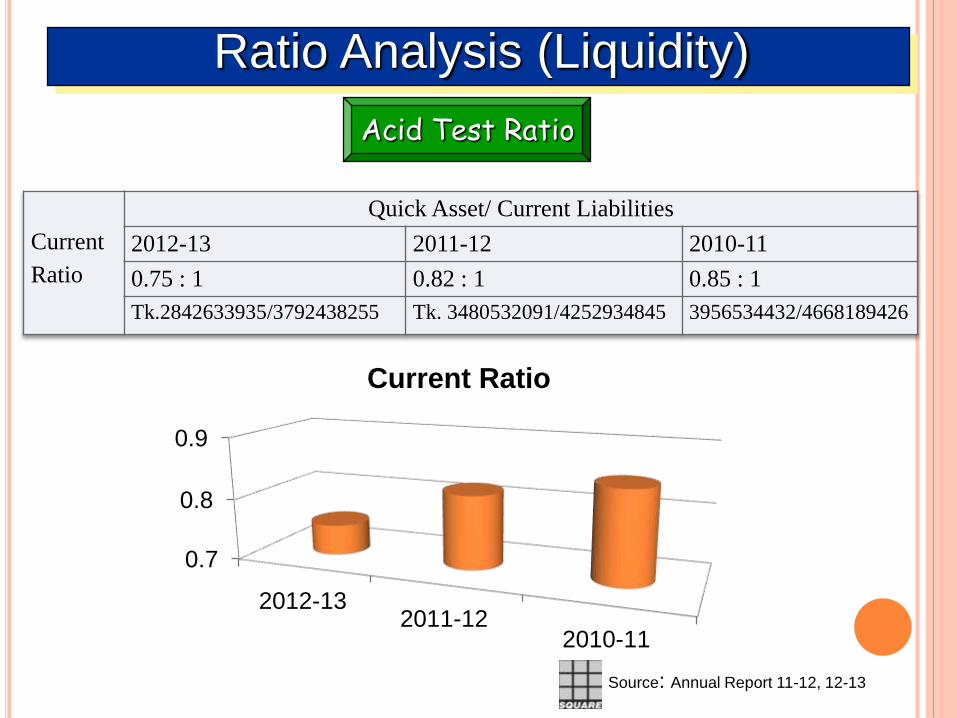
Ratio Analysis (Liquidity)
Acid Test Ratio
Current
Ratio
Quick Asset/ Current Liabilities
2012-13 2011-12 2010-11
0.75 : 1 0.82 : 1 0.85 : 1
Tk.2842633935/3792438255 Tk. 3480532091/4252934845 3956534432/4668189426
0.7
0.8
0.9
2012-132011-12
2010-11
Current Ratio
Source: Annual Report 11-12, 12-13
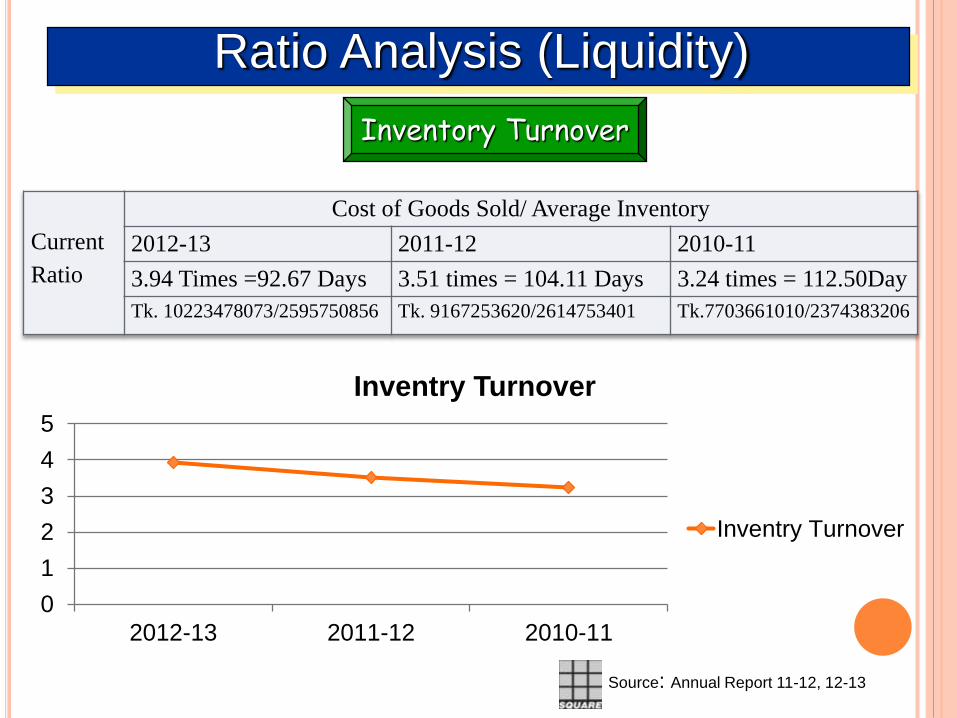
Ratio Analysis (Liquidity)
Inventory Turnover
Current
Ratio
Cost of Goods Sold/ Average Inventory
2012-13 2011-12 2010-11
3.94 Times =92.67 Days 3.51 times = 104.11 Days 3.24 times = 112.50Day
Tk. 10223478073/2595750856 Tk. 9167253620/2614753401 Tk.7703661010/2374383206
Source: Annual Report 11-12, 12-13
0
1
2
3
4
5
2012-13 2011-12 2010-11
Inventry Turnover
Inventry Turnover
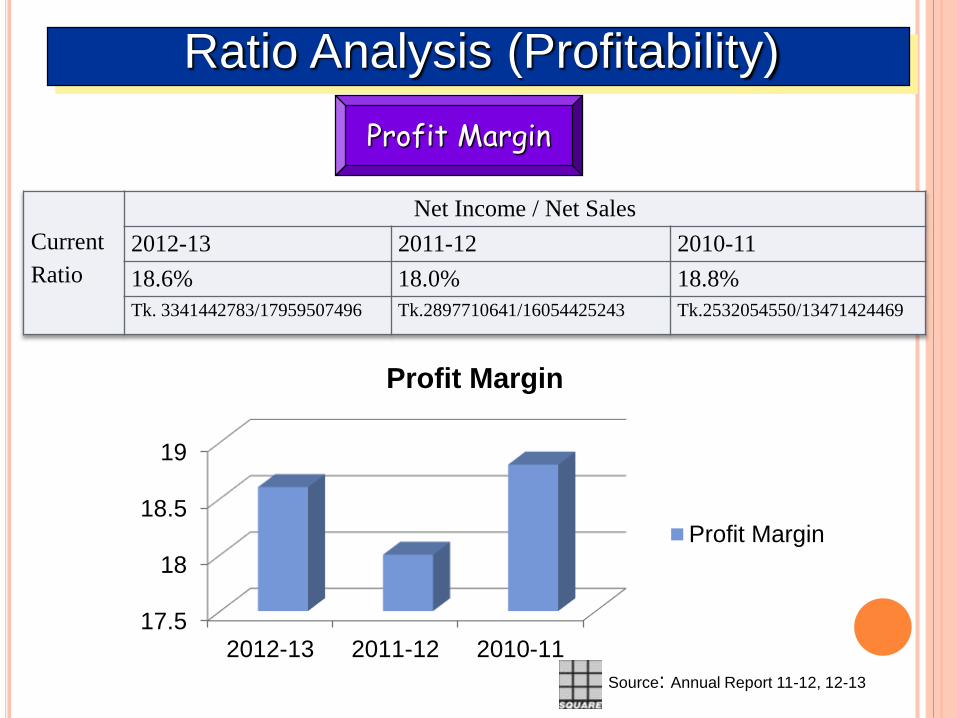
Ratio Analysis (Profitability)
Current
Ratio
Net Income / Net Sales
2012-13 2011-12 2010-11
18.6% 18.0% 18.8%
Tk. 3341442783/17959507496 Tk.2897710641/16054425243 Tk.2532054550/13471424469
Source: Annual Report 11-12, 12-13
Profit Margin
17.5
18
18.5
19
2012-13 2011-12 2010-11
Profit Margin
Profit Margin
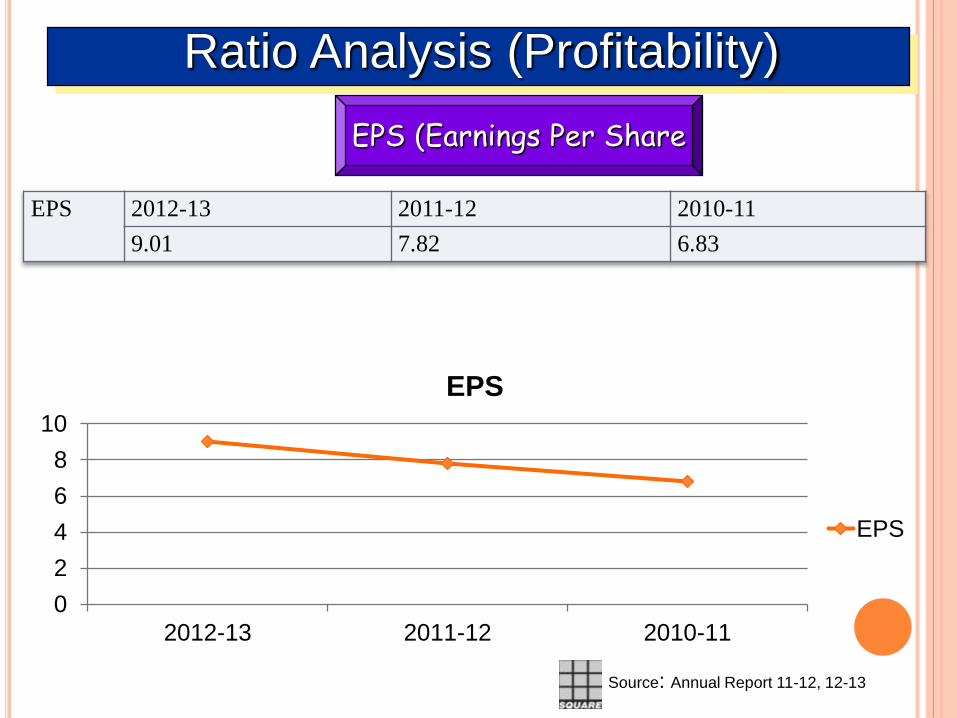
Ratio Analysis (Profitability)
EPS 2012-13 2011-12 2010-11
9.01 7.82 6.83
Source: Annual Report 11-12, 12-13
0
2
4
6
8
10
2012-13 2011-12 2010-11
EPS
EPS
EPS (Earnings Per Share
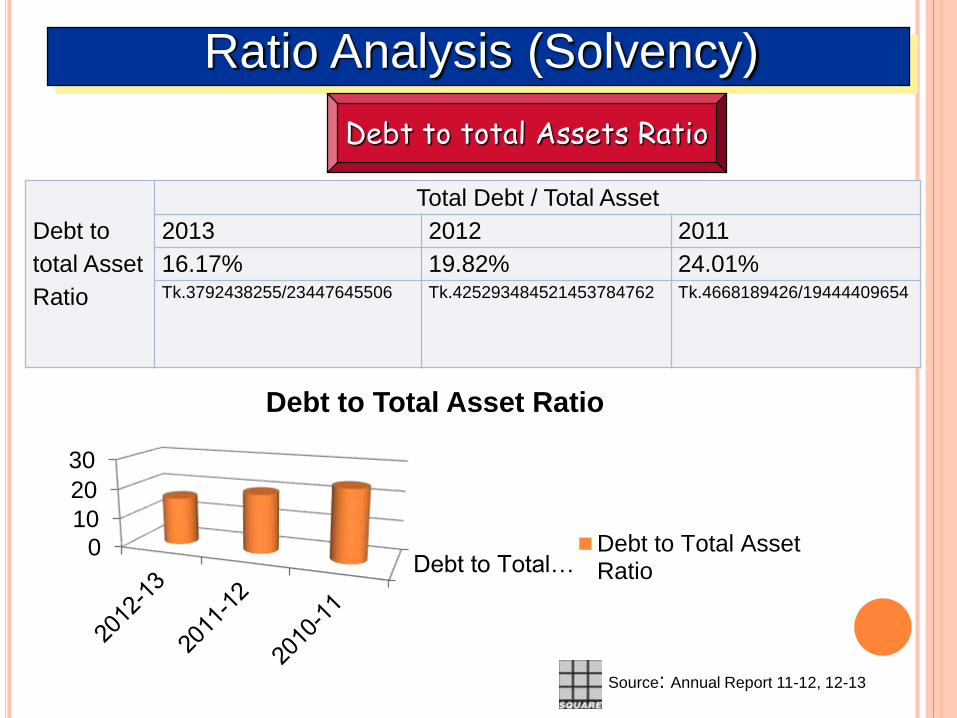
Ratio Analysis (Solvency)
Source: Annual Report 11-12, 12-13
Debt to total Assets Ratio
Debt to
total Asset
Ratio
Total Debt / Total Asset
2013 2012 2011
16.17% 19.82% 24.01%Tk.3792438255/23447645506 Tk.425293484521453784762 Tk.4668189426/19444409654
Debt to Total…0
10
20
30
Debt to Total Asset Ratio
Debt to Total AssetRatio