Filosofía de la Recomendación en Fertilización de Cultivos
32
Fertilizer Recommendation Philosophies Fertilizer Recommendation Philosophies Richard B. Ferguson University of Nebraska Richard B. Ferguson University of Nebraska
-
Upload
uca-agrarias -
Category
Education
-
view
548 -
download
0
Transcript of Filosofía de la Recomendación en Fertilización de Cultivos

Fertilizer Recommendation Philosophies
Fertilizer Recommendation Philosophies
Richard B. FergusonUniversity of Nebraska
Richard B. FergusonUniversity of Nebraska

Fertilizer Recommendation Philosophies
Fertilizer Recommendation Philosophies
Philosophy - style of management.Relates to what type of risk the producer is most comfortable with.Applies to non-mobile nutrients, primarily phosphorus and potassium, to a lesser extent calcium and magnesium.
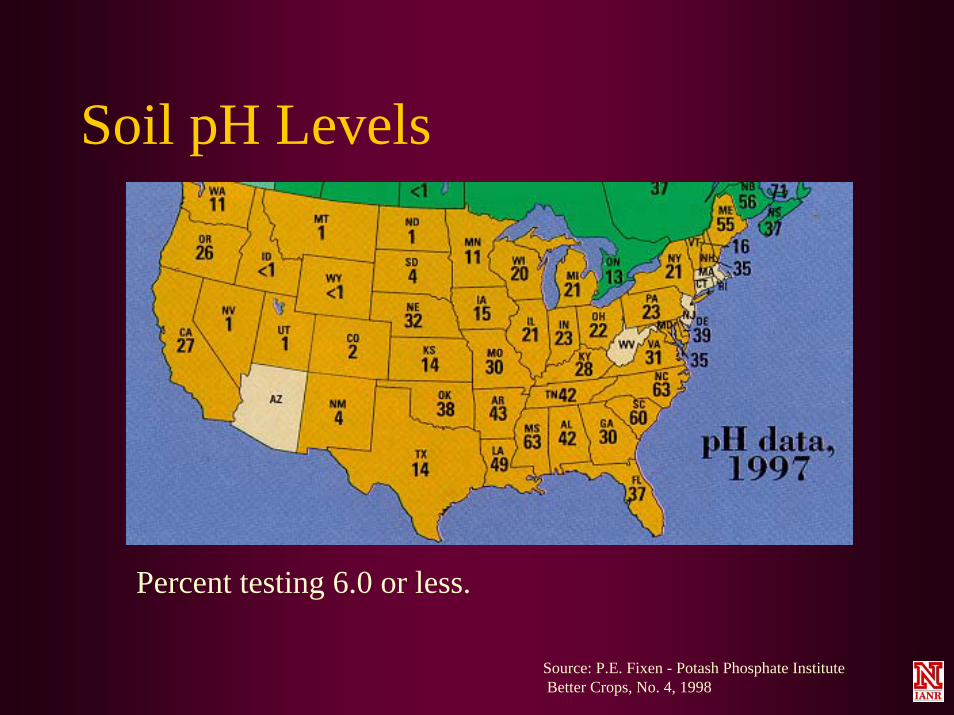
Soil pH Levels
Percent testing 6.0 or less.
Source: P.E. Fixen - Potash Phosphate InstituteBetter Crops, No. 4, 1998

Soil Test P LevelsSoil Test P Levels
Percent testing medium or lower.
Source: P.E. Fixen - Potash Phosphate InstituteBetter Crops, No. 4, 1998

Soil Test K LevelsSoil Test K Levels
Percent testing medium or lower.
Source: P.E. Fixen - Potash Phosphate InstituteBetter Crops, No. 4, 1998
Soyb
ean:
12 pp
m
Corn:
15 pp
m
Whe
at: 25
ppm
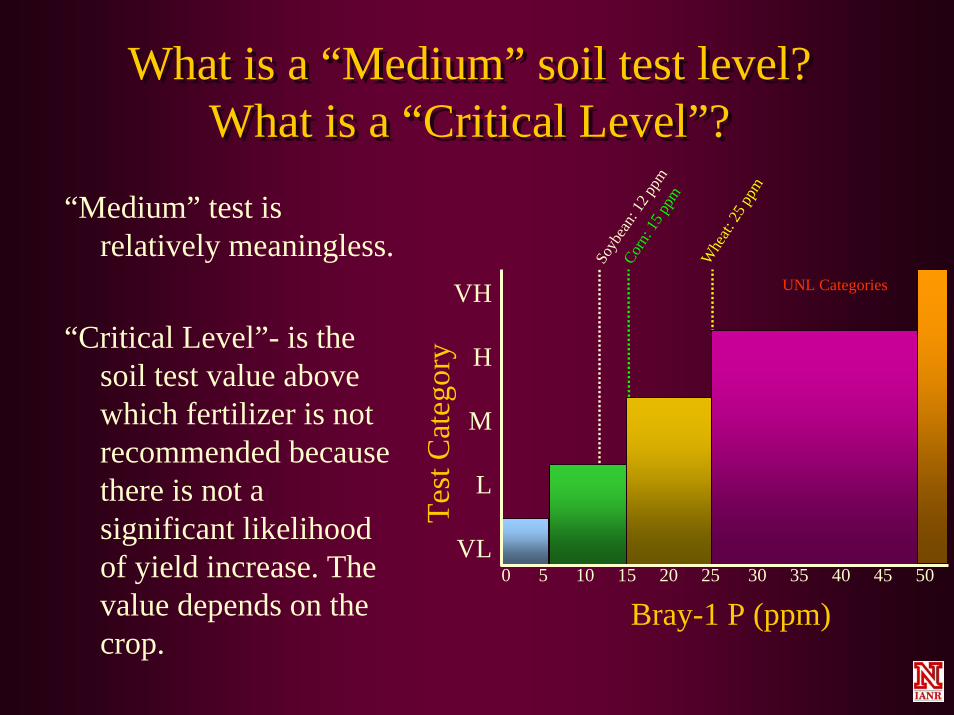
What is a “Medium” soil test level?What is a “Critical Level”?
What is a “Medium” soil test level?What is a “Critical Level”?
“Medium” test is relatively meaningless.
“Critical Level”- is the soil test value above which fertilizer is not recommended because there is not a significant likelihood of yield increase. The value depends on the crop.
0 5 10 15 20 25 30 35 40 45 50
VH
H
M
L
VL
Test
Cat
ego r
y
Bray-1 P (ppm)
UNL Categories
Fertilizer Recommendation Philosophies
Fertilizer Recommendation Philosophies
Deficiency CorrectionNutrient Removal
MaintenanceBuild
Cation Balance

Soil Tests -Soil Tests -
Are an index - they estimate plant availability of nutrients under field conditions – not the total amount of nutrient in the soil.
Types of Risk - Fertilizer Application
Types of Risk - Fertilizer Application
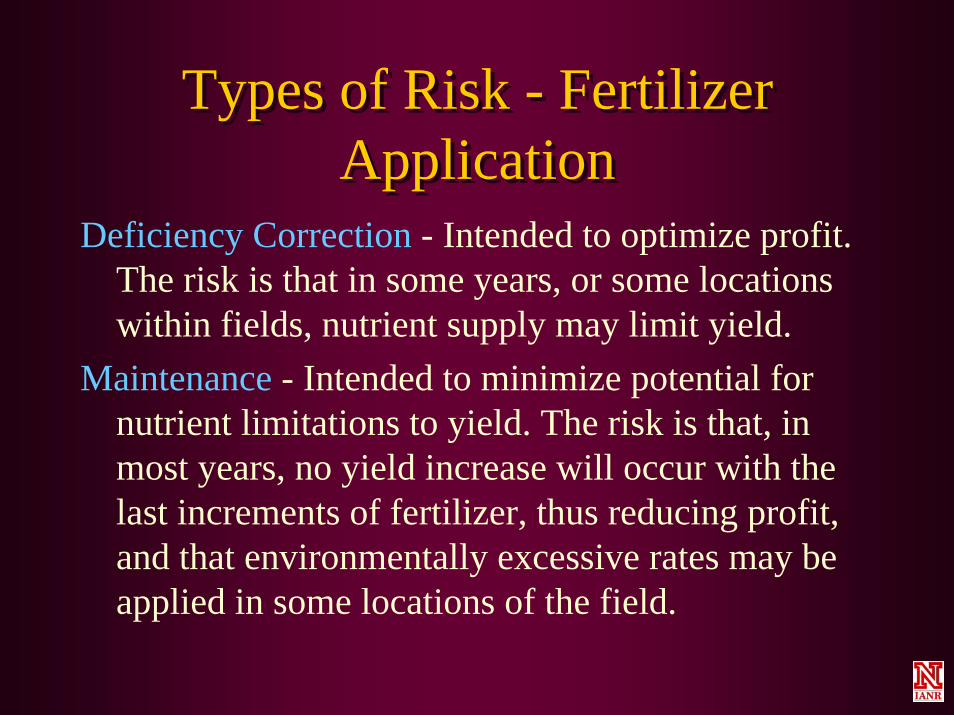
Deficiency Correction - Intended to optimize profit. The risk is that in some years, or some locations within fields, nutrient supply may limit yield.
Maintenance - Intended to minimize potential for nutrient limitations to yield. The risk is that, in most years, no yield increase will occur with the last increments of fertilizer, thus reducing profit, and that environmentally excessive rates may be applied in some locations of the field.
Should fertilizer be applied at rates adequate to take advantage of higher yield potential in years with exceptional climatic conditions?
Question:Question:

Answer:Answer:
In most cases, when climatic conditions favor exceptional yields, they also favor above-average availability of soil-derived nutrients. Consequently there is no need to fertilize above calibrated rates in order to realize full yield potential in exceptional years.
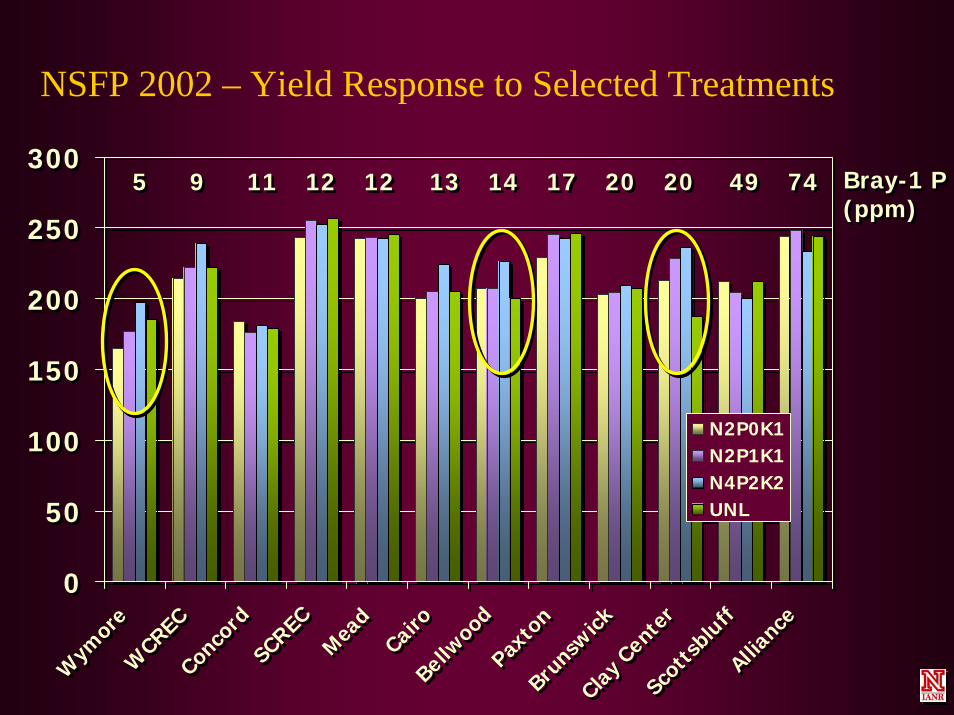
NSFP 2002 – Yield Response to Selected Treatments
0
50
100
150
200
250
300
Wym
ore
WCREC
Conco
rdSC
RECM
ead
Cairo
Bellw
ood
Paxto
nBru
nsw
ickCla
y Cen
ter
Scot
tsbl
uffAlli
ance
N2P0K1N2P1K1N4P2K2UNL
0
50
100
150
200
250
300
Wym
ore
WCREC
Conco
rdSC
RECM
ead
Cairo
Bellw
ood
Paxto
nBru
nsw
ickCla
y Cen
ter
Scot
tsbl
uffAlli
ance
N2P0K1N2P1K1N4P2K2UNL
5 9 11 12 12 13 14 17 20 20 49 74 5 9 11 12 12 13 14 17 20 20 49 74 Bray-1 P(ppm)Bray-1 P(ppm)

Fertilizing the CropFertilizing the Crop
Fertilizing the SoilFertilizing the Soil

Fertilizing the SoilFertilizing the Soil
Soil is a very inefficient location to store fertilizer. Crop recovery of fertilizer P, for example, is typically less than 30% in the year of application, and less than 10% the following year. Fertilizer orthophosphate is converted to increasingly less soluble forms of calcium phosphate with time, reducing the availability of applied P to plants.
Deficiency CorrectionDeficiency Correction
Results from research on crop response to additions of a nutrient otherwise insufficient for maximum growth.Relies on correlation and calibration field research.Goal of applying fertilizer P or K to optimize economic return in the year of application.

Soil Test ResearchSoil Test Research
Correlation - Determination of crop yield at different soil test levels for a given nutrient.
Calibration - How much fertilizer is required to optimize yield at different soil test levels.
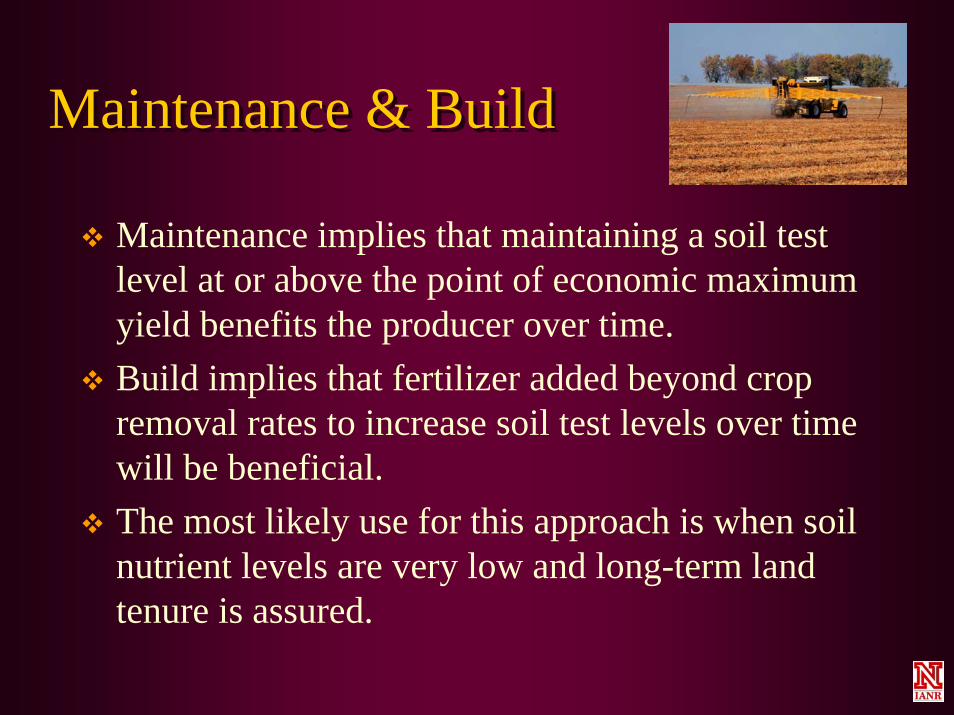
Maintenance & BuildMaintenance & Build
Maintenance implies that maintaining a soil test level at or above the point of economic maximum yield benefits the producer over time. Build implies that fertilizer added beyond crop removal rates to increase soil test levels over time will be beneficial.The most likely use for this approach is when soil nutrient levels are very low and long-term land tenure is assured.
Maintenance & BuildMaintenance & Build
Assume approximately 18 lb/acre of P2O5 is required to raise Bray-1 P test 1 ppm; 24-27 lb/acre to raise Olsen P test 1 ppm.Assume 9-10 lb/acre K2O is required to increase soil K test 1 ppm.

Yield Response as Influenced by Soil Test Leveland Recommendation PhilosophyYield Response as Influenced by Soil Test Leveland Recommendation Philosophy
100
75
50
25
0
VL L M H VH
% Y
ield
Soil Test Level
Deficiency Correction
Maintenance & Build
Maintenance/crop removal
EconomicMaximum Yield
Critical Level

Crop RemovalCrop Removal
Ultimately, over the long-term, both deficiency correction and maintenance & build recommendation programs will gravitate towards replacing the nutrients removed in yield.Fertilization according to crop nutrient removal is not likely to be as profitable as deficiency correction in the short-term.Land tenure is a major factor influencing one’s choice of fertilizer program.
Ultimately, over the long-term, both deficiency correction and maintenance & build recommendation programs will gravitate towards replacing the nutrients removed in yield.Fertilization according to crop nutrient removal is not likely to be as profitable as deficiency correction in the short-term.Land tenure is a major factor influencing one’s choice of fertilizer program.

Cation BalanceCation Balance
Suggests there is an optimum ratio of basic cations and that there is a best total base saturation for each soil.“Ideal” ratio: Ca - 65%, Mg - 10%, K - 5%, H - 20%.Initially developed in New Jersey, further researched in Missouri.

Cations required to increase saturation of exchangeable Ca, Mg and K to the mid-point of a desired range.Cations required to increase saturation of exchangeable Ca, Mg and K to the mid-point of a desired range.
Soil CEC = 15 meq/100 g Soil pH: 5.6
Actualmeq/100 g
Saturation(%)
DesiredSaturation
(%)
Desiredmeq/100 g
NutrientRequired
Ca 6.00 40.0 75.0 11.254.3
tons/acreag-lime
Mg 1.50 10.0 10.0 1.50 None
K 0.24 1.6 3.5 0.53390 lb/acre
0-0-60

Cation BalanceCation Balance
Soils have been shown to have wide ranges of cation ratios and still be highly productive.Approach has no validity for soils with pH’s above 7, but is often used for recommending K and Mg anyway.

How do different philosophies, or strategies,
of fertilizer recommendation compare in yield or profitability?
How do different philosophies, or strategies,
of fertilizer recommendation compare in yield or profitability?

University of Nebraska Comparison Study
University of Nebraska Comparison Study
Primary objective - To scientifically compare fertilizer recommendation strategies for a range of Nebraska soils.
Conducted at five locations across the state - continued for up to 10 years at each location.

UNL Comparison StudyUNL Comparison Study
Location North Platte Clay Center Mead Concord
YieldGoal
170 bu/aCorn
170 – 200 bu/aCorn
170 bu/aCorn
90 bu/aCorn
Strategy MB DC MB DC MB DC MB DC
Fertilizer$/acre 54 26 56 30 62 35 27 12
YieldBu/acre 167 167 186 189 152 154 83 84
MB - Maintenance + Build.DC - Deficiency Correction.Average cost and yield over 7 years.
“The University of Nebraska didn’t recommend any phosphorus for my field, and yet I had a 15 bushel per acre yield increase when I applied 50 lb per acre on the east half, compared to the west half where I applied only nitrogen.”
Why?Why?Spatial variability of nutrient levels, combined with inadequate soil sampling, may be a major factor in differences in perception of fertilizer recommendations.
Personal observation or testimonials may not reflect valid comparisons.
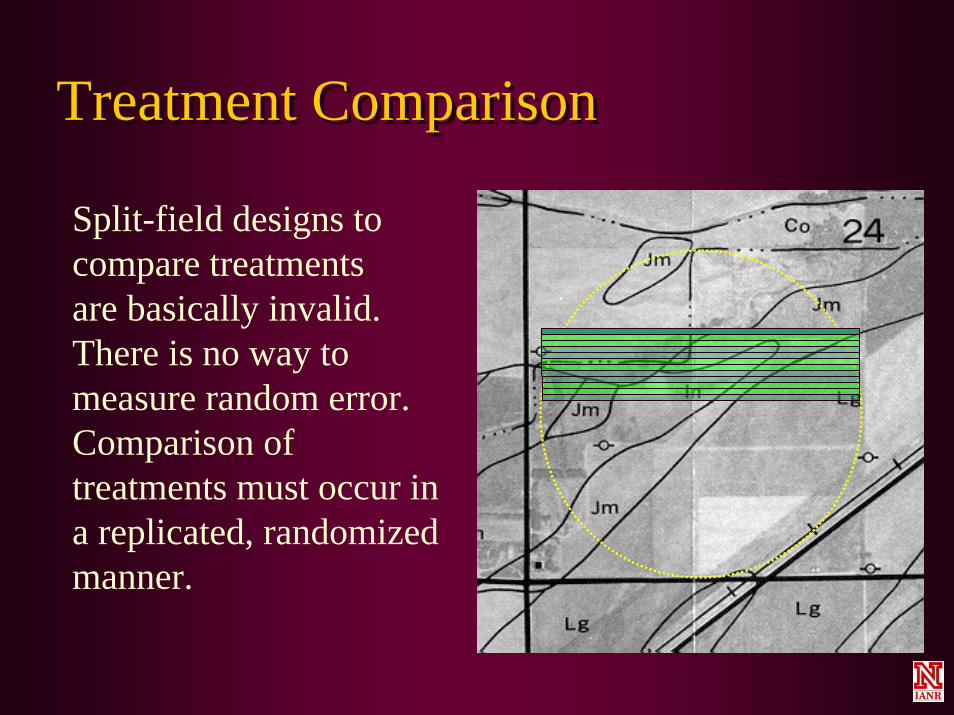
Treatment ComparisonTreatment Comparison
Split-field designs to compare treatmentsare basically invalid. There is no way to measure random error. Comparison of treatments must occur in a replicated, randomized manner.

SummarySummary
Recommendation philosophies, or strategies, apply primarily to P and K in Nebraska, to a lesser extent Ca, Mg, S and micronutrients.The type of risk the producer is most comfortable with will influence his fertilizer management strategy.The deficiency correction approach has been shown through research to have the greatest short-term profitability in Nebraska.

Exercise
For the 11 yr. period shown,calculate the annual recommendedP2O5/acre rates using twoapproaches: deficiency correctionand crop removal. Calculate thetotal P2O5 applied, the averageannual rate, and the total fertilizercost over the 11 year period.Assume crop removal to be 0.33lb P2O5/bu.
For the 11 yr. period shown,calculate the annual recommendedP2O5/acre rates using twoapproaches: deficiency correctionand crop removal. Calculate thetotal P2O5 applied, the averageannual rate, and the total fertilizercost over the 11 year period.Assume crop removal to be 0.33lb P2O5/bu.
20022003200420052005200720082009201020112012
20022003200420052005200720082009201020112012
245252215196205188243216199238224
245252215196205188243216199238224
12
9
5
12
9
5
P2O5/acreDeficiency Crop
Bray P bu/a Correction Removal
P2O5/acreDeficiency Crop
Bray P bu/a Correction Removal
Total P2O5Annual mean P cost (@ $.30/lb)
Total P2O5Annual mean P cost (@ $.30/lb)

Exercise
20022003200420052005200720082009201020112012
245252215196205188243216199238224
4040404040404040808080
8183806568628071667974
12
9
5
Bray P bu/a P2O5/aDC CR
Total P 560 809Annual mean 51 74P cost (@ $.30/lb) $168 $243