FILMEs> - NASA · We followed a similar procedure for New Lexington area but also used color...
8
#' e- MAPPING OF SPOIL BANKS USING ERTS-1 PICTURES Professor Moid U. Ahmad and David A. Kantner, Geology Department, Ohio University, Athens, Ohio Associates, lnc., Mentor, Ohio 45701; John W. Antalovich, President, Kucera and Abstract NASA's Earth Resources Technology Satellite (ERTS-1) is sending good quality pictures. used in the study of two strip mine areas in Southeastern Ohio. area is near Piedmont Lake and the second area is near New Lexington. this study 9.5 inch prints were examined under a binocular microscope and the gray tone is correlated with the actual ground conditions at several sites. For the New Lexington area, color infrared pictures taken at an elevation of 18,000 feet were also used for correlation with the ERTS-1 imagery. results indicate that MSS 5 and 7 are most useful in defining the stripped land and show that the hydrological and so51 characteristics are remarkably different than the surrounding lands. Four pictures of different wave lengths (MSS 4,5,6,7) are The f i r s t In .The Method of Investigation We have received two good sets of images of Southeastern Ohio. The rest of the images were spoiled due to the cfoud cover. we examined 9.5 inch prints under a 10-25 power binocular microscope with under and over lighting capabilities. In this investigation W e were interested in the reclaimed strip mine areas, unreclaimed strip mined areas, and undisturbed land. (1) near Priedmont Lake and (2) near New Lexington. The location of these areas is shown on Fig. 1. W e selected two areas for detailed work - Strip mined areas near Piedmont Lake were identified on the ERTS-1 pictures and the gray tone described. tone were used, the objective numerical gray scale which is included on each ERTS-1 p i c t u r e and a subjective verbal description. It was found that the verbal description seemed better for making -comparisons between pictures because of inconsistencies in gray scales between pictures and the narrow range of usable tone on some of the gray scales. The s t r i p mine areas were also located on topographic maps and the ground conditions were checked by visiting each site. Two methods of describing the gray The graytone data obtained for each site for each MSS band is not included because of lack of space. defined features. the areas near Piedmont Lake and Table 1 (end of paper) describes the condition of each site. We found MSS5 (Red) a i d MSS7 (Infrared) showed well Figures 2 and 3 are the enlargements of ERTS-1 pictures for 1575 PRECEDING PAGE BLANK NOT FILMEs> https://ntrs.nasa.gov/search.jsp?R=19730019640 2019-01-27T09:17:18+00:00Z
Transcript of FILMEs> - NASA · We followed a similar procedure for New Lexington area but also used color...

#' e-
MAPPING OF SPOIL BANKS USING ERTS-1 PICTURES
Professor Moid U. Ahmad and David A. Kantner, Geology Department, Ohio University, Athens, Ohio Associates, lnc., Mentor, Ohio
45701; John W. Antalovich, President, Kucera and
Abstract
NASA's Earth Resources Technology Satellite (ERTS-1) i s sending good q u a l i t y p ic tures . used i n t h e study of two s t r i p mine areas i n Southeastern Ohio. area is near Piedmont Lake and t h e second area is near New Lexington. t h i s s tudy 9.5 inch p r i n t s were examined under a binocular microscope and t h e gray tone is cor re la ted with t h e a c t u a l ground condi t ions a t s e v e r a l sites. For t h e New Lexington area, co lor i n f r a r e d p i c t u r e s taken a t an e leva t ion of 18,000 f e e t were a l s o used f o r c o r r e l a t i o n with t h e ERTS-1 imagery. results i n d i c a t e t h a t MSS 5 and 7 are most u s e f u l i n def ining t h e s t r i p p e d land and show t h a t t h e hydrological and so51 c h a r a c t e r i s t i c s are remarkably d i f f e r e n t than t h e surrounding lands.
Four p i c t u r e s of d i f f e r e n t wave lengths (MSS 4,5,6,7) are The f i r s t
I n
.The
Method of Inves t iga t ion
W e have received two good sets of images of Southeastern Ohio. The rest of t h e images were spoi led due t o t h e cfoud cover. w e examined 9.5 inch p r i n t s under a 10-25 power binocular microscope with under and over l i g h t i n g c a p a b i l i t i e s .
In t h i s i n v e s t i g a t i o n
We were i n t e r e s t e d i n t h e reclaimed s t r i p mine areas, unreclaimed s t r i p mined areas, and undisturbed land. (1) near Priedmont Lake and (2) near New Lexington. The loca t ion of these areas is shown on Fig. 1.
We se lec ted two areas f o r d e t a i l e d work -
S t r i p mined areas near Piedmont Lake were i d e n t i f i e d on t h e ERTS-1 p i c t u r e s and t h e gray tone described. tone were used, t h e objec t ive numerical gray scale which is included on each ERTS-1 p i c t u r e and a subjec t ive verba l descr ipt ion. It w a s found t h a t t h e verba l descr ip t ion seemed b e t t e r f o r making -comparisons between p i c t u r e s because of incons is tenc ies i n gray scales between p i c t u r e s and the narrow range of usable tone on some of the gray scales. The s t r i p mine areas were a l s o located on topographic maps and t h e ground conditions were checked by v i s i t i n g each site.
Two methods of describing t h e gray
The graytone d a t a obtained f o r each s i te f o r each MSS band is n o t included because of lack of space. defined fea tures . t h e areas near Piedmont Lake and Table 1 (end of paper) descr ibes t h e condi t ion of each site.
We found MSS5 (Red) a i d MSS7 ( Inf ra red) showed w e l l Figures 2 and 3 are t h e enlargements of ERTS-1 p i c t u r e s f o r
1575
PRECEDING PAGE BLANK NOT FILMEs>
https://ntrs.nasa.gov/search.jsp?R=19730019640 2019-01-27T09:17:18+00:00Z
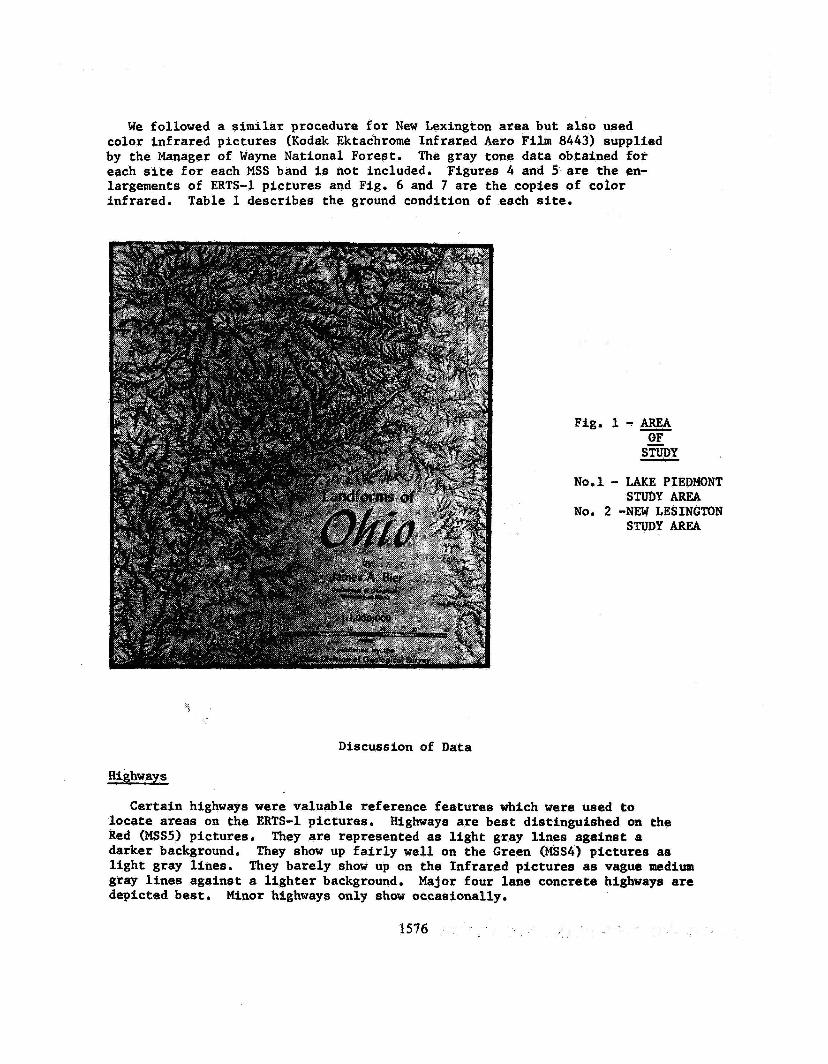
W e followed a s imilar procedure f o r New Lexington area but a l s o used color in f ra red p ic tures (Kodak Ektachrome Infrared Aero Film 8443) supplied by the Manager of Wayne National Forest. each si te f o r each MSS band is not included. largements of ERTS-1 p ic tures and Fig. 6 and 7 are the copies of color infrared. Table 1 describes the ground condition of each site.
The gray tone data obtained f o r Figures 4 and 5 are the en-
No.1 - LAKE PIEDMONT
NO. 2 -NEW LESINGTON STUDY AREA
STUDY AREA
Discussion of Data
Highways
Certain highways w e r e valuable reference fea tures which were used to loca te areas on the ERTS-1 pictures . Red (MSSS) pictures. darker background. l i g h t gray l ines . gray l i nes against a l i g h t e r background. depicted best .
Highways are bes t dist inguished on the
They show up f a i r l y w e l l on the Green (bfSS4) pic tures as They are represented as l i g h t gray l i nes against a
They barely show up on the Infrared p ic tures as vague medium Major four lane concrete highways are
Minor highways only show occasionally.
1576

Water Bodies
Bodies of water were a l s o used as reference f e a t u r e s because they are prominent v i s i b l e fea tures . and are represented by a d i s t i n c t black shade. areas represent ing bodies of water ( lakes and r i v e r s ) show up l a r g e r o r wider than they a c t u a l l y are. This may be due t o water s a t u r a t e d a reas adjacent t o these bodies. ident i fy ing lakes because t h e l a k e areas appear t o blend i n with t h e vege ta t ive tone on the p i c t u r e and are hard t o d i s t i n g u i s h from the p i c t u r e background. The Ohio River channel, however, is b e t t e r dis t inguished from its f loodpla in on these two p i c t u r e s (especit i l ly Red) than on the Inf ra red p ic tures .
They are most v i s i b l e on t h e I n f r a r e d p i c t u r e s It appears t h a t t h e black
The Red and espec ia l ly Green p i c t u r e s are poor f o r
Coal Concentrations
Coal p i l e s and s p i l l s are b e s t shown on t h e Inf ra red p i c t u r e s a s black areas. up so w e l l on t h e ERT-1 p i c t u r e s when o t h e r se t t lements t h e i r s i z e do not.
This is why t h e town of Holloway and t h e Hanna processing p l a n t show
Natural Vegetation
The general background tones on the ERTS-1 p i c t u r e s represent the n a t u r a l vegetat ion of t h e area, a combination of mainly hardwood forests and grassy areas where the trees have been removed. Inf ra red p i c t u r e s is la l i g h t gray. of t h e general topography of t h e land sur face are more r e a d i l y v i s i b l e . Red and Green p i c t u r e s have a mottled backgroutxi which seems t o show the d i f fe rences i n vegetat ion, although i t was not s tud ied i n d e t a i l . tones i n t h e mottled background may represent t h e trees covering most of t h e r idges and the l i g h t e r shades represent the more grassy va l ley bottoms. might ttirn out t o be a crude method t o determine the topographic p a t t e r n of r idges and val leys .
The background tone of the The vegetat ion doesn' t show w e l l and d e t a i l s
The
The darker
This
Unreclaimed S t r i p Mined Lands
The unreclaimed areas show up as the darker grays t o black on t h e Inf ra red p i c t u r e s (e.g., s i te 5 , Fig. 2) agains t a l i g h t gray background. They show up as white to l i g h t gray on the Red p i c t u r e s (e.g,, site 5 , Fig. 3) a g a i n s t a mottled l i g h t gray t o dark and black background. They show up on t h e Green p i c t u r e s as l i g h t gray aga ins t a mottled l i g h t e r gray background. So f a t , s p e c i f i c l a r g e r s t r i p mines have been observed on t h e ERTS-1 p i c t u r e s and located by using t h e i r r e l a t i o n s h i p t o o t h e r i d e n t i f i a b l e f e a t u r e s on t h e p i c t u r e s and comparing t h e shape of t h e areas with mapped s t r i p mines and t h e general topography.
Stripped lands show up w e l l on a l l t h e MSS bands. Undoubtedly, t h e reason is t h a t they are more o r less bar ren of vegetat ion and composed of rock and s o i l material with d i f f e r e n t hydrologic c h a r a c t e r i s t i c s which cause a marked d i f fe rence i n t h e r e f l e c t a n c e as compared t o vegetated land. It is poss ib le t h a t t h e s t r i p p e d lands may b e confused with similar barren areas such as plowed f i e l d s , but t h i s has not y e t been invest igated. do seem t o have a c h a r a c t e r i s t i c i r r e g u l a r shape and are o f t e n l a r g e enough t o b e seen e a s i l y on t h i s scale of p i c t u r e which may a i d i n t h e i r i d e n t i f i c a t i o n . Very small s t r i p mines have n o t y e t been inves t iga ted s u f f i c i e n t l y t o determine t h e i r v i s i b i l i t y on ERTS-1 p ic tures .
S t r i p mines
1577
Reclaimed Lands
In the Piedmont Lake area, the reclamation was f a i r l y recent (less than f i v e yeare), graded f i r s t t o iome semblance of the o r ig ina l contour and planted
I. From the small amount of data we have been able t o co l l ec t a t present, i t appears t ha t under these conditions the reclaimed land may show up as s l i g h t l y darker than the unreclaimed s t r ipped areas on the Green and Red p ic tures (e.g., sites 16 and 5, Fig, 3) and a l i t t le l i g h t e r thant the unreclaimed areas on the Infrared p ic tures (e.g., sites 16 and 5, Fig, 2).
The sited studied i n the New Lexington area are older , and were str ipped and reclaimed 20-30 years ago. The spo i l was not graded at a l l and the land was planted with trees which have grown re l a t ive ly la rge and dense by t h i s time, The study e i t e a were f a i r l y well defined on the Infrared p ic ture (Fig. 4) but were poorly defined on the Red (Fig. 5) and Green pictures . On the Infrared, the reclaimed areas appear t o be s l i g h t l y darker than the na tura l f o r e s t areas (e,g,, sites 5b and 7, Fig. 4). More work is needed here t o f i n d out i f d i s t i nc t ion between older tree reclaimed areas and natural wooded areas is possible from the ERTS-1 picturee.
Reclaimed lands seem t o be the most d i f f i c u l t areas t o dis t inguish, Not enough work has been done ye t t o show whether t h i s is inherent or j u e t lack of data. of defining reclaimed areas on the bas i s of the tone t h a t represents them on the four ERTS-1 bands. One problem lies i n the var ie ty of conditions tha t can exist f o r such land, For example, t he type of vegetat ive cover, the percentage of coverage, and the time since s t r ipp ing and/or reclamation e f f o r t s might a l l a f f ec t the tone recorded on the picturee, I
Research should continue i n the d i rec t ion of finding some consis tant method
There is a need f o r continued research t o determine i f there is a measurable and consis t an t change v i s i b l e on ERTS-1 p ic tures i n reclaimed land from the s t r ipped condition t o grading, planting, and the establishment and growth of vegetation t o a point i n time when conditions may blend back in to the na tura l vegetat ive background, a t leaet as f a r a6 the ERTS-1 imagery i s concerned .
Conclusion8
(1) Large scale unreclaimed s t r ipped land can be eas i ly distinguished on a l l the MSS bands,
(2)
(3)
It may be possible t o dis t inguish reclaimed land from the na tura l vegetat ive background and unreclaimed land but more intensiva! research is required, The str ipped land appears t o have d i f f e ren t s o i l and hydrological cha rac t e r i s t i c s than the surrounding land.
Acknowledgement s
We are g ra t e fu l t o Mr, W.D. Carter, Assistant Program Manager of the EROS Program, U.S, Geological Survey f o r supplying us wlth the ERTS-1 p ic tures f o r t h i s Study.
We are a l s o g ra t e fu l t o Dean Norman S, Cohn, Director of Research a t Ohio University f o r a grant t o conduct f i e l d invest igat ion, and Mr. Rene Elisar of Wayne National Forest who provided us with color Infrared p ic tures f o r the New Lexington area.
1578

F i g . 2 - LAKE PIEDMONT STUDY AREA -- Close up of Aug . 21, 1 9 7 2 Infrared ERTS-1 (MSS7) ( P h o t o ID .
N o , E-1029-15361-5N000) showing sites studied Scale 1 cm. - 1 . 7 7 mile
F i g , 3 - LAKE PIEDMONT STUDY AREA - Close UP of Aug. 21, 1972 B e d ERTS-1 (MSS5)
( P h o t o I D , No, E-1029-15361-5N000) s h o w i n g sites studied Scale 1 c m -k 1 . 7 7 m i l e
SEE TABLE NO. 1 FOR S I T E DESCRIPTIONS
1579

F i g . 4 - LEXINGTON STUDY AREA I-
42lose up of O c t . 15, 1972 Infrared ERTS-1 (MSS7) s h o w i n g sites studied Scale lcm- .61 m i l e Photo ID. NO. E - 1 0 8 4 - 1 5 4 5 - 5 N 0 0 0
Fig. 5 - E LEXINGTON STUDY AREA
C l o s e up of O c t . 15, 1972 R e d ERTS-1 (MSS5) showing sites studied Scale l c m . = . 6 1 m i l e Photo I D . NO. E - 1 0 8 4 - 1 5 4 5 - 5 N 0 0 0
SEE TABLE NO. 3 FOR S I T E DESCRIPTIONS
1580

Fig, 6 - NEW LEXINGTON STUDY AREA I__)-
Color Infrared photo mosaic (courtesy Wayne National Forest) showing sites studied
Big. 7 - NEW LEXINGTON STUDY AREA CLOSE UP - ;lose up of color infrared photo (courtesy Wayne National Forest Service) showing sites studied May 11, 1972, Altitude 18,000 feet , Copy Scale lcmr= . l 7 m i l e
SEE TABLE NO, 1 FOR SITE DESCRIPTION
1581

TABLE 1 - SITE DESCRIPTIONS
SITE DESCRIPTION (Unstudied sites omitted)
LAKE PIEDMONT STUDY AREA
Stripped area reclaimed i n 1968 according t o Ohio Law. g ra s s and brush growing on i t and some small trees. Grass reclaimed area, w e l l graded. Stripped va l l ey which has been graded and newly grassed and what appears t o b e s l i g h t l y res t r ipped near the highwall. Stripped va l l ey which had been graded but not y e t grassed. Large va l l ey which has had massive s t r ipp ing on both s ides . highwalls and s p o i l banks. No reclamation. Location of t he town of Holloway. s p i l l s along an e igh t t rack wide r a i l road switch yard. R t . 70 - A four lane concrete highway. Lake Piedmont Reservoir. Location of Hanna's coal processing plant . and s p i l l s . A narrow s t r ipped bench. A predominently grass reclaimed area. Graded, some sca t t e red trees, vegetat ion generally sparse and patchy, New s t r i p p i n g of site no. 5 found on the O c t . 15 p i c tu re which i s general ly obscured by clouds.
Area now has Coverage somewhat sparse
Fa i r ly good coverage.
Large En t i r e val ley p r a c t i c a l l y devastated.
Shows up because of coal p i l e s and
An area of coal p i l e s
Not shown on the s i t e locat ion picture .
NEW LEXINGTON STUDY AREA
Black sha le and coal s l a g p i l e s . Black sha le and coal s l a g p i l e s . Small ponds. N o r m a l farm g ras s pas tu re land. Black sha le and coal s l a g p i l e s i n moist stream bottom areas. According t o a resident , t h i s area w a s s t r i pped some t i m e i n t h e 1940's. It w a s s t r ipped by the area method and reclaimed soon a f t e r s t r i p p i n g by the normal trees used at t h a t t i m e . The trees are now l a rge (up t o 8" - 10"). According t o a r e s iden t , t h i s area was s t r ipped some t i m e i n t he 1940's. It w a s s t r i pped by the area method and reclaimed soon a f t e r s t r i p p i n g by the normal trees used a t t h a t t i m e . The trees are now l a r g e (up t o 8" - 10"). Normal fo re s t ed land. Normal dense fo re s t ed area. A p r a c t i c a l l y barren spot i n a s t r i p mine mined by the area method. Barren s t r i p mine mined by the contour method.
Some normal hardwoods.
Some normal hardwoods. Fa i r ly densely grown. Not dense, with grassy areas.
1582