Film Blowing of Linear and Long-Chain Branched Poly ...
14
polymers Article Film Blowing of Linear and Long-Chain Branched Poly(ethylene terephthalate) Michael Härth 1,2, * and Andrea Dörnhöfer 1,3 1 Institute of Polymer Materials, Friedrich-Alexander-University Erlangen-Nuremberg, Martensstraße 7, 91058 Erlangen, Germany; [email protected] 2 Kuraray Europe GmbH, Mülheimer Str. 26, 53840 Troisdorf, Germany 3 W. L. Gore & Associates GmbH, Hermann-Oberth-Str. 22, 85640 Putzbrunn, Germany * Correspondence: [email protected] Received: 27 June 2020; Accepted: 16 July 2020; Published: 19 July 2020 Abstract: Film blowing of Poly(ethylene terephthalate) (PET) is challenging due its inherently low melt viscosity and poor melt strength. In this study, it is shown how the rheological properties of a commercial PET can be altered by reactive extrusion using either pyromellitic dianhydride (PMDA) or a multifunctional epoxy (Joncryl ® ADR 4368) as chain extender, in order to improve the processing behavior during film blowing. The modified materials were characterized by shear and elongation rheometry and relevant processing characteristics, like melt pressure, bubble stability, and film thickness uniformity, were used to assess the influence of the type of modifier on processing and product performance. It is shown that PMDA is useful to increase the melt strength which leads to an improved bubble stability, while epoxy modified PET shows a reduced drawability that can cause problems at high take-up ratios. On the other hand, the epoxy modifier indicates a pronounced strain hardening during elongational deformation, and therefore leads to a better film thickness uniformity compared to the neat PET and the PET modified with PMDA. The differences with respect to processing performance are discussed and ascribed to the molecular structure of the materials. Keywords: poly(ethylene terephthalate); chain extender; long-chain branches; rheology; extensional viscosity; film blowing; film uniformity 1. Introduction Polyester films used, e.g., for packaging, adhesive tapes, medical applications, or furniture surfaces, are generally produced by the cast-film technique with a subsequent biaxial stretching process. The biaxial stretching takes place in the temperature range between the glass-transition and the cold-crystallization temperature and improves end-use properties, like tensile strength or gas permeability. Typical film thicknesses of commercially available biaxially-oriented Poly(ethylene terephthalate) (BO-PET) are between six and 500 μm[1]. PET resins are historically classified by their intrinsic viscosity [η] and are selected based on the manufacturing process requirements and the end-use application. For BO-PET, [η] values between 0.6 and 0.7 dL/g are common [2]. At relevant processing temperatures, the shear viscosity curves of such resins show a pronounced Newtonian plateau and a relatively low zero shear viscosity η 0 compared to other polymers (e.g., [3–5]). This viscosity behavior is beneficial for the cast-film process and can be ascribed to a low weight average molar mass M w and a linear molecule structure. One the other hand, these special molecular characteristics lead to a low melt strength which is of disadvantage for other processes, like blow molding or film blowing. To overcome this deficiency high Mw resins ([η] = 0.7–0.85 dL/g[2]) are typically used for PET bottles manufactured by blow molding. Furthermore, special machine equipment can be used in the case of blown PET films [6]. An alternative route to Polymers 2020, 12, 1605; doi:10.3390/polym12071605 www.mdpi.com/journal/polymers
Transcript of Film Blowing of Linear and Long-Chain Branched Poly ...

polymers
Article
Film Blowing of Linear and Long-Chain BranchedPoly(ethylene terephthalate)
Michael Härth 1,2,* and Andrea Dörnhöfer 1,3
1 Institute of Polymer Materials, Friedrich-Alexander-University Erlangen-Nuremberg, Martensstraße 7,91058 Erlangen, Germany; [email protected]
2 Kuraray Europe GmbH, Mülheimer Str. 26, 53840 Troisdorf, Germany3 W. L. Gore & Associates GmbH, Hermann-Oberth-Str. 22, 85640 Putzbrunn, Germany* Correspondence: [email protected]
Received: 27 June 2020; Accepted: 16 July 2020; Published: 19 July 2020�����������������
Abstract: Film blowing of Poly(ethylene terephthalate) (PET) is challenging due its inherently lowmelt viscosity and poor melt strength. In this study, it is shown how the rheological propertiesof a commercial PET can be altered by reactive extrusion using either pyromellitic dianhydride(PMDA) or a multifunctional epoxy (Joncryl® ADR 4368) as chain extender, in order to improve theprocessing behavior during film blowing. The modified materials were characterized by shear andelongation rheometry and relevant processing characteristics, like melt pressure, bubble stability,and film thickness uniformity, were used to assess the influence of the type of modifier on processingand product performance. It is shown that PMDA is useful to increase the melt strength which leadsto an improved bubble stability, while epoxy modified PET shows a reduced drawability that cancause problems at high take-up ratios. On the other hand, the epoxy modifier indicates a pronouncedstrain hardening during elongational deformation, and therefore leads to a better film thicknessuniformity compared to the neat PET and the PET modified with PMDA. The differences with respectto processing performance are discussed and ascribed to the molecular structure of the materials.
Keywords: poly(ethylene terephthalate); chain extender; long-chain branches; rheology; extensionalviscosity; film blowing; film uniformity
1. Introduction
Polyester films used, e.g., for packaging, adhesive tapes, medical applications, or furnituresurfaces, are generally produced by the cast-film technique with a subsequent biaxial stretchingprocess. The biaxial stretching takes place in the temperature range between the glass-transitionand the cold-crystallization temperature and improves end-use properties, like tensile strength orgas permeability. Typical film thicknesses of commercially available biaxially-oriented Poly(ethyleneterephthalate) (BO-PET) are between six and 500 µm [1].
PET resins are historically classified by their intrinsic viscosity [η] and are selected based on themanufacturing process requirements and the end-use application. For BO-PET, [η] values between 0.6and 0.7 dL/g are common [2]. At relevant processing temperatures, the shear viscosity curves of suchresins show a pronounced Newtonian plateau and a relatively low zero shear viscosity η0 comparedto other polymers (e.g., [3–5]). This viscosity behavior is beneficial for the cast-film process and canbe ascribed to a low weight average molar mass Mw and a linear molecule structure. One the otherhand, these special molecular characteristics lead to a low melt strength which is of disadvantagefor other processes, like blow molding or film blowing. To overcome this deficiency high Mw resins([η] = 0.7–0.85 dL/g [2]) are typically used for PET bottles manufactured by blow molding. Furthermore,special machine equipment can be used in the case of blown PET films [6]. An alternative route to
Polymers 2020, 12, 1605; doi:10.3390/polym12071605 www.mdpi.com/journal/polymers

Polymers 2020, 12, 1605 2 of 14
increase the melt strength and to make PET applicable for other processes is to change the moleculararchitecture. Over the last decades, the reactive extrusion of PET with chain extenders has been provenas a fast and cheap method to increase [η] of, e.g., recycled PET and/or to introduce long-chain branches(e.g., [7–11]).
In this study, we compare two well-known chain extenders (pyromellitic dianhydride (PMDA)and Joncryl® ADR 4368) with respect to their applicability to improve the processing behavior of PETin the film blowing process. Film blowing can be seen as a cheaper alternative to the BO-PET cast-filmprocess [12] by creating less edge scrap as the biaxial stretching can be obtained with a double bubbleset-up [2].
In the literature, investigations of chain extended PET for the film blowing process are veryrare. Di Maio et al. [13] used recycled PET with [η] = 0.48 dL/g and PMDA as chain extender inconcentrations between 0.25 and 0.75 wt.%. While no films could be blown with the neat PET,the authors found an improved bubble stability with increasing PMDA concentration. This hasbeen correlated to an enhanced melt strength and is in line with investigations on polyethylene [14].Film blowing experiments of PET modified with Joncryl could not be found in the literature. However,investigations with poly(lactic acid) (PLA), reactively processed with Joncryl, reveal a better bubblestability and an enlargement of the processing window compared to the neat PLA [15,16].
As the question concerning which of the two chain extenders is more suitable for film blowingapplications is of high practical and industrial relevance, the aim of this contribution is to modifycommercial PET with either PMDA or Joncryl and to compare the processing behavior. In particular,the molecular and rheological properties were analyzed and correlated to processing and end-productquantities, like extrusion pressure, bubble stability, and film thickness uniformity.
2. Experimental
2.1. Materials
A high molar mass PET copolymer (Artenius Care, La Seda de Barcelona) has been used, as itcan be film blown without a chain extender, and therefore used as a reference. According to thesupplier, the intrinsic viscosity is 1.15 dL/g. The number and weight average molar mass of the asreceived pellets have been determined by size-exclusion-chromatography (SEC) with triple-detectionto Mn = 44 kg/mol and Mw = 86 kg/mol. PMDA, which is a tetra-functional modifier was purchasedfrom Sigma-Aldrich and Joncryl® ADR 4368, which is an oligomeric multifunctional epoxy modifier,was provided by BASF. More details regarding the properties and molecular structure of the modifierscan be found elsewhere [8,9].
2.2. Reactive Extrusion
The PMDA powder and PET pellets were blended in a tumbling mixer and afterwards pre-driedat 130 ◦C for 24 h. As the Joncryl modifier has a glass transition temperature of 54 ◦C [17], the PET wasdried separately and mixed with the non-dried chain extender directly before performing the reactiveextrusion. The mixture of PET pellets and chain extender was fed into the utilized co-rotating twinscrew extruder (Leistritz LSM 34 GL, L/D ratio = 32) by gravimetric dosing, which was purged withnitrogen to avoid moisture up-take. The screw rotation speed was set to 30 rpm and the temperaturein the feeding zone to 270 ◦C and in the metering zone to 290 ◦C, respectively. The modified materialswere quenched in a water bath and afterwards granulated.
Based on a comprehensive pre-study, using the same materials, but a kneader for performing thereactive processing [8,9], the PMDA concentrations have been chosen as 0.1 and 0.25 wt.%. These lowconcentrations already lead to a significant viscosity increase without forming gels. The utilized Joncrylconcentration was 0.4 wt.%, as lower concentrations lead to only a minor viscosity increase, whereas athigher concentrations a significant gel formation occurs [9,11].

Polymers 2020, 12, 1605 3 of 14
2.3. Molecular and Rheological Characterization
The SEC measurements were performed with a GPCmax (Malvern, PA, USA) with triple detection(TDA 305, Malvern) and potential gel contents were determined by solvent extraction. Details can befound elsewhere [8].
For the rheological characterization in shear, an ARES rheometer (TA Instruments) with plate-plategeometry was used. Contrarily to the pre-investigations to this study [8,9], the materials were notpress molded before the rheological characterization in order to reduce thermal degradation. Instead,the pellets were directly loaded into the pre-heated rheometer by using a metal ring. The time-dependentelongational viscosity was measured with the extensional viscosity fixture (EVF, TA Instruments) asdescribed in Härth et al. [8].
The melt strengths of the neat PET and the modified samples were determined with a Rheotens71.97 (Göttfert). The temperature of the utilized capillary rheometer (Rheograph 2003, Göttfert) wasset to 270 ◦C and the piston speed to 1 mm/s. The diameter and length of the die was 2 mm and 20 mm,respectively. The spinning length was chosen as 100 mm and the acceleration of the Rheotens rollswas 120 mm/s2. More details regarding the Rheotens and the experimental procedure can be foundelsewhere [18,19].
2.4. Film Blowing
The film blowing experiments were conducted with a laboratory device from the Göttfert company.A schematic drawing of the experimental set-up is shown in [14]. The set-up is equipped with a singlescrew extruder with a screw diameter of 30 mm and a screw length of 600 mm. The temperature wasset to 270 ◦C in the feeding zone and 280 ◦C in the metering zone. The throughput was kept constantfor all materials at 4.4 kg/h and the cooling system was varied in such a way that a constant frost linefor all experimental set-ups was obtained. The blow-up ratio (BUR), defined as
BUR =dd0
(1)
with d being the diameter of the blown-up bubble, and d0 the diameter of the annular die, which wasset to 2, and the take-up ratio (TUR), defined as
TUR =vv0
(2)
with v being the velocity of the take-up rolls and v0 the velocity of the melt at the die exit was variedbetween 8 and 42.
3. Results and Discussion
3.1. Molecular Characterization
Figure 1 shows the molar mass distributions and Figure 2 the Mark–Houwink plot of the neat PETand the samples modified by reactive processing. The modified samples were prepared for a pre-studyin a kneader using the same raw materials as for the film blowing experiments (cf. ExperimentalSection). The neat PET was analyzed as received from the supplier.
As follows from Figure 1, the common feature of both chain extenders is to broaden the molarmass distribution towards higher molar masses, and therefore to increase the weight average molarmass compared to the neat PET. Comparing the used concentrations in wt.%, the PMDA modifiershows a higher effectiveness and does not form any gel structures, as proven by solvent extraction.In contrast, the Joncryl modified sample of Figure 1 contains a gel content of 8 ± 2 wt.%, that wasfiltered out before performing the SEC measurements. Therefore, only the soluble part of the materialis reflected by Figures 1 and 2.
Polymers 2020, 12, 1605 4 of 14Polymers 2020, 12, x FOR PEER REVIEW 4 of 14
103 104 105 106 1070.0
0.2
0.4
0.6
0.8
1.0
1.2
MLS / (g⋅mol-1)
dW
(M)⋅(
dlog
(M))-1
PET PET-P0.1 PET-P0.25 PET-J0.4
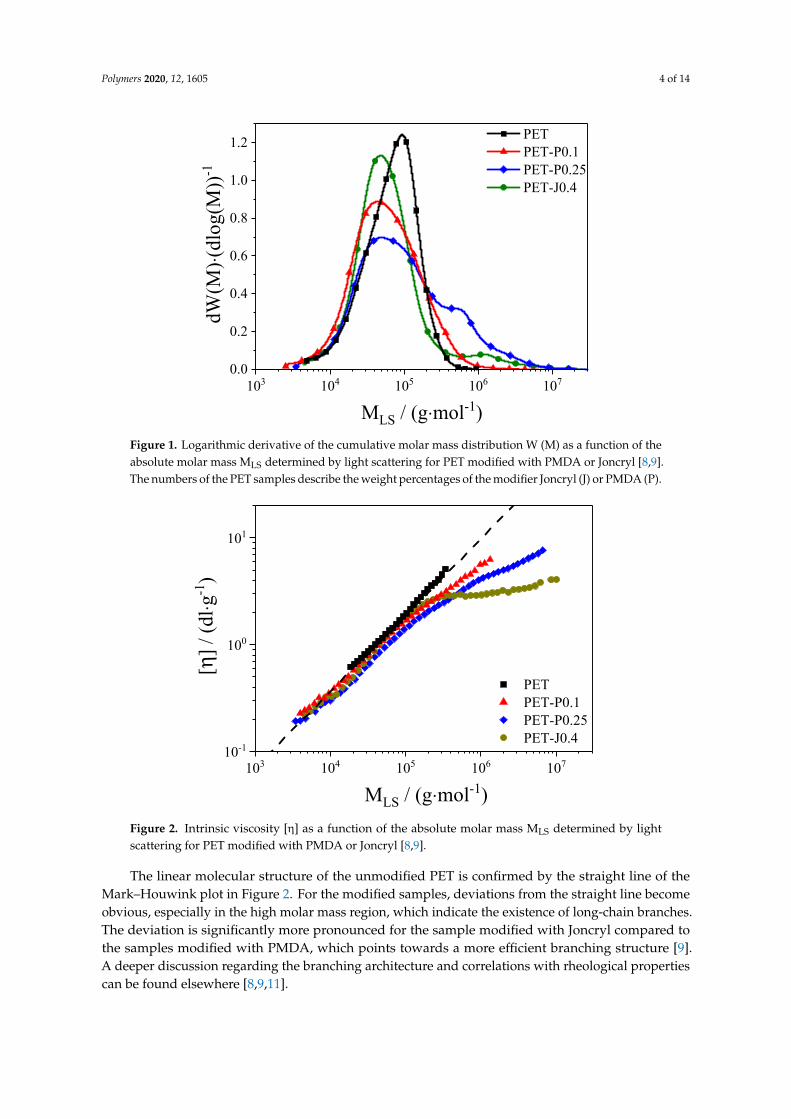
Figure 1. Logarithmic derivative of the cumulative molar mass distribution W (M) as a function of the absolute molar mass MLS determined by light scattering for PET modified with PMDA or Joncryl [8,9]. The numbers of the PET samples describe the weight percentages of the modifier Joncryl (J) or PMDA (P).
103 104 105 106 10710-1
100
101
MLS / (g⋅mol-1)
[η] /
(dl⋅g
-1)
PET PET-P0.1 PET-P0.25 PET-J0.4
Figure 2. Intrinsic viscosity [η] as a function of the absolute molar mass MLS determined by light scattering for PET modified with PMDA or Joncryl [8,9].
As follows from Figure 1, the common feature of both chain extenders is to broaden the molar mass distribution towards higher molar masses, and therefore to increase the weight average molar mass compared to the neat PET. Comparing the used concentrations in wt.%, the PMDA modifier shows a higher effectiveness and does not form any gel structures, as proven by solvent extraction. In contrast, the Joncryl modified sample of Figure 1 contains a gel content of 8 ± 2 wt.%, that was filtered out before performing the SEC measurements. Therefore, only the soluble part of the material is reflected by Figures 1 and 2.
The linear molecular structure of the unmodified PET is confirmed by the straight line of the Mark–Houwink plot in Figure 2. For the modified samples, deviations from the straight line become
Figure 1. Logarithmic derivative of the cumulative molar mass distribution W (M) as a function of theabsolute molar mass MLS determined by light scattering for PET modified with PMDA or Joncryl [8,9].The numbers of the PET samples describe the weight percentages of the modifier Joncryl (J) or PMDA (P).
Polymers 2020, 12, x FOR PEER REVIEW 4 of 14
103 104 105 106 1070.0
0.2
0.4
0.6
0.8
1.0
1.2
MLS / (g⋅mol-1)
dW
(M)⋅(
dlog
(M))-1
PET PET-P0.1 PET-P0.25 PET-J0.4
Figure 1. Logarithmic derivative of the cumulative molar mass distribution W (M) as a function of the absolute molar mass MLS determined by light scattering for PET modified with PMDA or Joncryl [8,9]. The numbers of the PET samples describe the weight percentages of the modifier Joncryl (J) or PMDA (P).
103 104 105 106 10710-1
100
101
MLS / (g⋅mol-1)
[η] /
(dl⋅g
-1)
PET PET-P0.1 PET-P0.25 PET-J0.4
Figure 2. Intrinsic viscosity [η] as a function of the absolute molar mass MLS determined by light scattering for PET modified with PMDA or Joncryl [8,9].
As follows from Figure 1, the common feature of both chain extenders is to broaden the molar mass distribution towards higher molar masses, and therefore to increase the weight average molar mass compared to the neat PET. Comparing the used concentrations in wt.%, the PMDA modifier shows a higher effectiveness and does not form any gel structures, as proven by solvent extraction. In contrast, the Joncryl modified sample of Figure 1 contains a gel content of 8 ± 2 wt.%, that was filtered out before performing the SEC measurements. Therefore, only the soluble part of the material is reflected by Figures 1 and 2.
The linear molecular structure of the unmodified PET is confirmed by the straight line of the Mark–Houwink plot in Figure 2. For the modified samples, deviations from the straight line become
Figure 2. Intrinsic viscosity [η] as a function of the absolute molar mass MLS determined by lightscattering for PET modified with PMDA or Joncryl [8,9].
The linear molecular structure of the unmodified PET is confirmed by the straight line of theMark–Houwink plot in Figure 2. For the modified samples, deviations from the straight line becomeobvious, especially in the high molar mass region, which indicate the existence of long-chain branches.The deviation is significantly more pronounced for the sample modified with Joncryl compared tothe samples modified with PMDA, which points towards a more efficient branching structure [9].A deeper discussion regarding the branching architecture and correlations with rheological propertiescan be found elsewhere [8,9,11].

Polymers 2020, 12, 1605 5 of 14
3.2. Rheological Characterization
In Figure 3, the magnitude of the complex shear viscosity of the neat PET and the materialsreactively processed in a twin-screw extruder is plotted as a function of the angular frequency at 280 ◦C.This temperature was used for the film blowing experiments. The neat PET shows a distinct Newtonianplateau at low frequencies and only at high frequencies a deviation towards lower shear viscosities.This weak shear thinning is a characteristic rheological behavior of a linear PET. The modificationwith the chain extenders leads to an increase of the viscosity in the low frequency range and a morepronounced shear thinning. The viscosity curves of all modified samples cross the viscosity curveof the neat PET within the frequency range chosen. The pronounced shear thinning is a result of thebroader molar mass distribution compared to the unmodified PET and the introduced long-chainbranches, as indicated in Figures 1 and 2. In addition, the gel content in the Joncryl modified sampleof 7 ± 1 wt.% influences the flow behavior. It is shown in [20] that adding 5% of a crosslinked linearlow-density polyethylene (LLDPE) to a non-crosslinked LLDPE increases the viscosity in the low shearrate region, but has only a minor effect on the viscosity at high shear rates. No gel was detected for thePET, PET-P0.1, and PET-P0.25 samples.
Polymers 2020, 12, x FOR PEER REVIEW 5 of 14
obvious, especially in the high molar mass region, which indicate the existence of long-chain branches. The deviation is significantly more pronounced for the sample modified with Joncryl compared to the samples modified with PMDA, which points towards a more efficient branching structure [9]. A deeper discussion regarding the branching architecture and correlations with rheological properties can be found elsewhere [8,9,11].
3.2. Rheological Characterization
In Figure 3, the magnitude of the complex shear viscosity of the neat PET and the materials reactively processed in a twin-screw extruder is plotted as a function of the angular frequency at 280 °C. This temperature was used for the film blowing experiments. The neat PET shows a distinct Newtonian plateau at low frequencies and only at high frequencies a deviation towards lower shear viscosities. This weak shear thinning is a characteristic rheological behavior of a linear PET. The modification with the chain extenders leads to an increase of the viscosity in the low frequency range and a more pronounced shear thinning. The viscosity curves of all modified samples cross the viscosity curve of the neat PET within the frequency range chosen. The pronounced shear thinning is a result of the broader molar mass distribution compared to the unmodified PET and the introduced long-chain branches, as indicated in Figures 1 and 2. In addition, the gel content in the Joncryl modified sample of 7 ± 1 wt.% influences the flow behavior. It is shown in [20] that adding 5% of a crosslinked linear low-density polyethylene (LLDPE) to a non-crosslinked LLDPE increases the viscosity in the low shear rate region, but has only a minor effect on the viscosity at high shear rates. No gel was detected for the PET, PET-P0.1, and PET-P0.25 samples.
10-1 100 101 102
103
104
ω / (s-1)
|η*|
/ (P
a⋅s)
PET PET-P0.1 PET-P0.25 PET-J0.4
T = 280 °C
Figure 3. Magnitude of complex shear viscosity as a function of angular frequency for PET modified with PMDA or Joncryl. The vertical line represents the shear rate in the extruder during the film blowing experiments.
The time-dependent elongational viscosity for different elongational rates at 260 °C is plotted for the samples PET-P0.25 and PET-J0.4 in Figure 4. The temperature has been lowered compared to the temperature used for the film blowing experiments because sagging of the samples may occur during measurements at high temperatures. Nevertheless, the melt strength at 260 °C of the samples PET and PET-P0.1 was still too low to measure the elongational viscosity. As can be seen in Figure 4, both samples show a distinct strain hardening, especially at high elongational rates. This is the well-known behavior for long-chain branched polymers [21]. Although the elongational viscosity of the neat PET could not be measured, it can be supposed that PET shows no strain hardening because the SEC measurements reveal no long-chain branches or high molar mass components.
Figure 3. Magnitude of complex shear viscosity as a function of angular frequency for PET modifiedwith PMDA or Joncryl. The vertical line represents the shear rate in the extruder during the filmblowing experiments.
The time-dependent elongational viscosity for different elongational rates at 260 ◦C is plotted forthe samples PET-P0.25 and PET-J0.4 in Figure 4. The temperature has been lowered compared to thetemperature used for the film blowing experiments because sagging of the samples may occur duringmeasurements at high temperatures. Nevertheless, the melt strength at 260 ◦C of the samples PET andPET-P0.1 was still too low to measure the elongational viscosity. As can be seen in Figure 4, both samplesshow a distinct strain hardening, especially at high elongational rates. This is the well-known behaviorfor long-chain branched polymers [21]. Although the elongational viscosity of the neat PET could notbe measured, it can be supposed that PET shows no strain hardening because the SEC measurementsreveal no long-chain branches or high molar mass components.

Polymers 2020, 12, 1605 6 of 14Polymers 2020, 12, x FOR PEER REVIEW 6 of 14
10-1 100 101 102103
104
105
106
107
t / (s)
η+ E
/ (Pa
⋅s)
PET-P0.25 PET-J0.4
3 1 0.3 0.1
ε / (s-1).
0.03
εH, max = 2.7T = 260 °C
×10
Figure 4. Time-dependent elongational viscosity at different elongational rates for PET-J0.4 and PET-P0.25. The PET-P0.25 curves are shifted by 10, as indicated in the figure.
In order to compare the strain hardening of PET-J0.4 and PET-P0.25 from a quantitative point of view, the strain hardening factor XE, defined as 𝐗𝐄 = 𝛈𝐄 (𝐭, 𝛆)𝛈𝐄 (𝐭) (3)
is calculated and plotted in Figure 5 as a function of the elongational rate at a constant Hencky strain of 2.5. For all elongational rates, XE of PET-J0.4 is higher compared to PET-P0.25. This is probably caused by a more efficient branching structure of the PET-J0.4 sample compared to the PET-P0.25 (cf. Figure 2) and by the gel content in PET-J0.4 which significantly increase the strain hardening [9,11,20].
0.1 11
2
3
4
5
6
ε / (s-1)
XE
PET-P0.25 PET-J0.4
.
T = 260 °CεH= 2.5
Figure 5. Strain hardening factor XE as a function of elongational rate 𝜀 at a Hencky strain of 2.5 for PET-J0.4 and PET-P0.25.
A laboratory experiment to analyze the melt strength and extensibility of polymers is the Rheotens test. Figure 6 compares the results of the Rheotens test for all samples investigated. Due to
Figure 4. Time-dependent elongational viscosity at different elongational rates for PET-J0.4 andPET-P0.25. The PET-P0.25 curves are shifted by 10, as indicated in the figure.
In order to compare the strain hardening of PET-J0.4 and PET-P0.25 from a quantitative point ofview, the strain hardening factor XE, defined as
XE =η+E
(t,
.ε)
η+E (t)(3)
is calculated and plotted in Figure 5 as a function of the elongational rate at a constant Hencky strain of2.5. For all elongational rates, XE of PET-J0.4 is higher compared to PET-P0.25. This is probably causedby a more efficient branching structure of the PET-J0.4 sample compared to the PET-P0.25 (cf. Figure 2)and by the gel content in PET-J0.4 which significantly increase the strain hardening [9,11,20].
Polymers 2020, 12, x FOR PEER REVIEW 6 of 14
10-1 100 101 102103
104
105
106
107
t / (s)
η+ E
/ (Pa
⋅s)
PET-P0.25 PET-J0.4
3 1 0.3 0.1
ε / (s-1).
0.03
εH, max = 2.7T = 260 °C
×10
Figure 4. Time-dependent elongational viscosity at different elongational rates for PET-J0.4 and PET-P0.25. The PET-P0.25 curves are shifted by 10, as indicated in the figure.
In order to compare the strain hardening of PET-J0.4 and PET-P0.25 from a quantitative point of view, the strain hardening factor XE, defined as 𝐗𝐄 = 𝛈𝐄 (𝐭, 𝛆)𝛈𝐄 (𝐭) (3)
is calculated and plotted in Figure 5 as a function of the elongational rate at a constant Hencky strain of 2.5. For all elongational rates, XE of PET-J0.4 is higher compared to PET-P0.25. This is probably caused by a more efficient branching structure of the PET-J0.4 sample compared to the PET-P0.25 (cf. Figure 2) and by the gel content in PET-J0.4 which significantly increase the strain hardening [9,11,20].
0.1 11
2
3
4
5
6
ε / (s-1)
XE
PET-P0.25 PET-J0.4
.
T = 260 °CεH= 2.5
Figure 5. Strain hardening factor XE as a function of elongational rate 𝜀 at a Hencky strain of 2.5 for PET-J0.4 and PET-P0.25.
A laboratory experiment to analyze the melt strength and extensibility of polymers is the Rheotens test. Figure 6 compares the results of the Rheotens test for all samples investigated. Due to
Figure 5. Strain hardening factor XE as a function of elongational rate.ε at a Hencky strain of 2.5 for
PET-J0.4 and PET-P0.25.

Polymers 2020, 12, 1605 7 of 14
A laboratory experiment to analyze the melt strength and extensibility of polymers is the Rheotenstest. Figure 6 compares the results of the Rheotens test for all samples investigated. Due to the lowmelt strength of the neat PET, the temperature had to be reduced to 270 ◦C compared to the filmblowing experiments. PET-P0.25 indicates the highest melt strength and a maximum draw ratio of 55,which is obviously not the physical limit of the material but represents the maximum velocity that canbe obtained with the device used. The PET-P0.25 is followed by the PET-J0.4 and by PET-P0.1. The highmelt strength of the modified samples is related to the special molecular characteristics, shown inFigures 1 and 2. From literature [19,22], it is known that an increase in weight average molar mass,a broadening of the molar mass distribution, and long-chain branched structures raise the melt strengthtowards higher values. The neat PET displays the lowest melt strength due to the narrow molar massdistribution and the linear molecular structure. While the neat PET and the PET modified with PMDAcan be drawn to the maximum draw ratio of 55, the extensibility of PET-J0.4 is reduced to approx. 26.This result agrees with investigations performed in [23], where PET modified with 0.3, 0.6, and 0.9 wt.%Joncryl was examined. The failure is probably due to the gel content. A reduced extensibility has alsobeen reported for materials modified with high PMDA concentrations and obvious gel structures [13].
Polymers 2020, 12, x FOR PEER REVIEW 7 of 14
the low melt strength of the neat PET, the temperature had to be reduced to 270 °C compared to the film blowing experiments. PET-P0.25 indicates the highest melt strength and a maximum draw ratio of 55, which is obviously not the physical limit of the material but represents the maximum velocity that can be obtained with the device used. The PET-P0.25 is followed by the PET-J0.4 and by PET-P0.1. The high melt strength of the modified samples is related to the special molecular characteristics, shown in Figures 1 and 2. From literature [19,22], it is known that an increase in weight average molar mass, a broadening of the molar mass distribution, and long-chain branched structures raise the melt strength towards higher values. The neat PET displays the lowest melt strength due to the narrow molar mass distribution and the linear molecular structure. While the neat PET and the PET modified with PMDA can be drawn to the maximum draw ratio of 55, the extensibility of PET-J0.4 is reduced to approx. 26. This result agrees with investigations performed in [23], where PET modified with 0.3, 0.6, and 0.9 wt.% Joncryl was examined. The failure is probably due to the gel content. A reduced extensibility has also been reported for materials modified with high PMDA concentrations and obvious gel structures [13].
0 10 20 30 40 50 600.00
0.05
0.10
0.15
0.20
0.25
0.30
0.35 PET PET-P0.1 PET-P0.25 PET-J0.4
F / (
N)
v / v0
T = 270 °C
Figure 6. Tensile force F as a function of draw ratio v/v0 for PET modified with PMDA or Joncryl. The black lines indicate various measurements on the PET-J0.4 sample, to show the repeatability of the experiment.
3.3. Film Blowing
3.3.1. Extrusion Pressure
The bar chart in Figure 7 demonstrates that the highest extrusion pressure during the film blowing experiments was observed for PET-P0.25, followed by PET, PET-P0.1, and PET-J.04. Remarkably, the reactively processed PET-P0.1 and PET-J0.4 samples show lower extrusion pressures compared to the neat PET. It is worthwhile discussing whether these differences in extrusion pressures are reflected by the viscosity data in Figure 3.
Figure 6. Tensile force F as a function of draw ratio v/v0 for PET modified with PMDA or Joncryl.The black lines indicate various measurements on the PET-J0.4 sample, to show the repeatability ofthe experiment.
3.3. Film Blowing
3.3.1. Extrusion Pressure
The bar chart in Figure 7 demonstrates that the highest extrusion pressure during the film blowingexperiments was observed for PET-P0.25, followed by PET, PET-P0.1, and PET-J.04. Remarkably,the reactively processed PET-P0.1 and PET-J0.4 samples show lower extrusion pressures compared tothe neat PET. It is worthwhile discussing whether these differences in extrusion pressures are reflectedby the viscosity data in Figure 3.

Polymers 2020, 12, 1605 8 of 14Polymers 2020, 12, x FOR PEER REVIEW 8 of 14
PET PET-P0.1 PET-P0.25 PET-J0.40
20
40
60
80
100
120
140
160
180
p / (
bar)
T = 280 °C
Figure 7. Extrusion pressure in the metering zone for PET modified with PMDA or Joncryl during the film blowing experiments.
For this purpose, the shear rate 𝛄 in the single screw extruder was calculated according to 𝛄 = 𝐍 ∙ 𝐃𝐬 ∙ 𝛑𝐇𝐬 (4)
where N is number of screw rotations per second, Ds the screw diameter, and Hs the screw flight depth [24]. Under the experimental conditions applied, a shear rate of 45 s−1 is obtained from Equation (4). For this shear rate, the viscosities of the four samples can be taken from Figure 3 making use of the Cox-Merz relationship. As a result, the pressure data in Figure 7 show the same ranking as the viscosity data. In addition, the relative differences between the viscosities are of a similar order of magnitude as those of the extrusion pressures (cf. Table 1). This result indicates the applicability of viscosity data for assessing the extrusion pressure in the single screw extruder used.
Figure 7. Extrusion pressure in the metering zone for PET modified with PMDA or Joncryl during thefilm blowing experiments.
For this purpose, the shear rate.γ in the single screw extruder was calculated according to
.γ =
N·Ds·π
Hs(4)
where N is number of screw rotations per second, Ds the screw diameter, and Hs the screw flightdepth [24]. Under the experimental conditions applied, a shear rate of 45 s−1 is obtained fromEquation (4). For this shear rate, the viscosities of the four samples can be taken from Figure 3 makinguse of the Cox-Merz relationship. As a result, the pressure data in Figure 7 show the same ranking asthe viscosity data. In addition, the relative differences between the viscosities are of a similar order ofmagnitude as those of the extrusion pressures (cf. Table 1). This result indicates the applicability ofviscosity data for assessing the extrusion pressure in the single screw extruder used.
Table 1. Summary of the rheological properties and correlation with characteristic film blowingparameters. The applied temperatures are listed in the Experimental Section.
PET PET-P0.1 PET-P0.25 PET-J0.4
Complex Viscosity 1 at 45 s−1/Pas1780(100)
1410(79)
1990(112)
1310(74)
Extrusion Pressure 1 at 45 s−1/bar154
(100)124(81)
165(107)
114(74)
Melt Strength/N 0.03 0.13 0.27 0.19Extensibility (v/v0) 55 2 55 2 55 2 26
η+E at εH = 2.5,.ε = 0.3 s−1/kPas n.m. 3 n.m. 3 110 101
XE at εH = 2.5,.ε = 0.3 s−1 n.m. 3 n.m. 3 2.1 4.0
Bubble Stability 4+ ++ +
5
Film Thickness Uniformity 4 O O ++
1 Numbers in brackets refer to the difference in % compared to PET. 2 Technical limit of the Rheotens for the settingsused. 3 Not measurable (cf. Section 3.2). 4 O equal to PET, + better than PET, ++ much better than PET. 5 Breakdownat high TUR possible.
3.3.2. Bubble Stability
An important feature for the performance of film blowing is the stability of the bubble. A stablebubble is important for films of high quality and, thus, it is a criterion determining the efficiency of ablowing process. Bubble stability is dependent on machine and processing parameters as well as on

Polymers 2020, 12, 1605 9 of 14
material properties. Investigations from the literature on widely used polyethylenes show that therheological behavior in extension plays a decisive role (e.g., [14,25–27]). The topic addressed in thissection relates to whether these results can be transferred to modified PET.
In general, three kinds of instabilities are distinguished. The first one is described by anaxisymmetric periodic variation of the bubble diameter, the other by a helical motion of the bubble anda third by a variation of the frost line. In addition, superpositions of these instabilities can be observed.Figure 8a,b demonstrates the first two instabilities occurring for an unmodified PET processed withthe laboratory equipment described in Section 2.4.
Polymers 2020, 12, x FOR PEER REVIEW 9 of 14
Table 1. Summary of the rheological properties and correlation with characteristic film blowing parameters. The applied temperatures are listed in the Experimental Section.
PET PET-P0.1 PET-P0.25 PET-J0.4
Complex Viscosity 1 at 45 s−1/Pas 1780 (100)
1410 (79)
1990 (112)
1310 (74)
Extrusion Pressure 1 at 45 s−1/bar 154 (100)
124 (81)
165 (107)
114 (74)
Melt Strength/N 0.03 0.13 0.27 0.19 Extensibility (v/v0) 55 2 55 2 55 2 26 𝜂 at 𝜀 = 2.5, 𝜀 = 0.3 s−1/kPas n.m. 3 n.m. 3 110 101
XE at 𝜀 = 2.5, 𝜀 = 0.3 s−1 n.m. 3 n.m. 3 2.1 4.0
Bubble Stability 4 + ++ + 5
Film Thickness Uniformity 4 ○ ○ ++ 1 Numbers in brackets refer to the difference in % compared to PET. 2 Technical limit of the Rheotens for the settings used. 3 Not measurable (cf. Section 3.2) 4 ○ equal to PET, + better than PET, ++ much better than PET 5 Breakdown at high TUR possible.
3.3.2. Bubble Stability
An important feature for the performance of film blowing is the stability of the bubble. A stable bubble is important for films of high quality and, thus, it is a criterion determining the efficiency of a blowing process. Bubble stability is dependent on machine and processing parameters as well as on material properties. Investigations from the literature on widely used polyethylenes show that the rheological behavior in extension plays a decisive role (e.g., [14,25–27]). The topic addressed in this section relates to whether these results can be transferred to modified PET.
In general, three kinds of instabilities are distinguished. The first one is described by an axisymmetric periodic variation of the bubble diameter, the other by a helical motion of the bubble and a third by a variation of the frost line. In addition, superpositions of these instabilities can be observed. Figure 8a,b demonstrates the first two instabilities occurring for an unmodified PET processed with the laboratory equipment described in Section 2.4.
Figure 8. Image of (a) an axisymmetric periodic variation of the bubble diameter, (b) a helical motion of the bubble, and (c) a stable bubble. Images (a) and (b) show the neat PET and (c) the PET-P0.25 sample. The processing conditions are listed in Section 2.4.
Figure 8c distinctly demonstrates that a stable bubble contour could be obtained for the PET modified with PMDA. Because a quantitative criterion for bubble stability is obviously not available,
Figure 8. Image of (a) an axisymmetric periodic variation of the bubble diameter, (b) a helical motionof the bubble, and (c) a stable bubble. Images (a) and (b) show the neat PET and (c) the PET-P0.25sample. The processing conditions are listed in Section 2.4.
Figure 8c distinctly demonstrates that a stable bubble contour could be obtained for the PETmodified with PMDA. Because a quantitative criterion for bubble stability is obviously not available,the assessment is visually performed, and is therefore of a qualitative nature. Nevertheless, a distinctranking of the bubble stability of different products could be experimentally found in the order
PET-P0.25 > PET-J0.4 > PET-P0.1 > PET.
The performance of PET-J0.4 exhibited a peculiarity insofar as a breakdown of the bubble occurredfrom time to time during processing at high TUR. This may be due to the gels found within thisJoncryl-modified sample giving rise to mechanical failure.
In the literature and particularly convincingly described for various polyethylenes in [27],the bubble stability is related to the melt strength of a sample determined in a Rheotens test.Such measurements on PET and three modified samples are presented in Figure 6. They showdistinct differences in the height of the drawing forces from the lowest value for the unmodifiedPET to the highest for PET-P0.25. The ranking corresponds very well with the bubble stability listedabove. Even the observation of the processing performance of PET-J0.4 is reflected by the Rheotensexperiments that show an earlier failure than for the three other products, which may be explained bythe gel content.
These results are in line with investigations performed on Joncryl modified PLA [15,16] andon PMDA modified PET [13], where an improved bubble stability has been found compared to theunmodified polymer. In addition, it is reported in [13] that, at high PMDA concentrations (0.75 wt.%),a gel is formed that reduces the drawing capability, as observed in the Rheotens experiment and duringfilm blowing.

Polymers 2020, 12, 1605 10 of 14
The results demonstrate two insights considering the significance of even qualitative rheologicalexperiments in extension like Rheotens tests for processing operations as film blowing. First, they allowan at least comparative assessment of the bubble stability of various polymeric materials, and second,the findings may be used for product development.
3.3.3. Film Thickness Uniformity
Only a few studies can be found in the literature dealing with the thickness uniformity of blownfilms [14,28,29]. Moreover, none of them used PET or reactively processed PET. To evaluate the filmthickness uniformity, the following procedure was applied. The thickness at each TUR was measuredat 20 positions with a distance of 1 cm in take-up and blow-up directions. This was repeated five timesfor each TUR. The average values and standard deviations for all films are plotted in Figure 9. As canbe seen, the average film thickness df decreases with TUR down to approx. 7 µm and according to [30],can be well predicted by
df =(d1/2)2
− (d0/2)2
2d1
ρMρS
1BUR·TUR
(5)
where d0 is the inner and d1 the outer diameter of the ring die, ρM the melt density, and ρS the densityof the film.Polymers 2020, 12, x FOR PEER REVIEW 11 of 14
5 10 15 20 25 30 35 40 450
5
10
15
20
25
30
35
40
45
d f / (µ
m)
TUR
PET PET-P0.1 PET-P0.25 PET-J0.4 Eq. (5)
Figure 9. Measured film thickness df as a function of take-up ratio TUR for PET modified with PMDA or Joncryl in comparison to the data calculated according to Equation (5).
With the average thickness 𝐝𝐟 and the standard deviation σ, the relative standard deviation σr, also called inhomogeneity index or non-uniformity index [14,27–29], can be calculated accordingly: 𝛔𝐫 = 𝛔𝐝𝐟 ∙ 𝟏𝟎𝟎% (6)
This value is plotted as a function of TUR in Figure 10.
5 10 15 20 25 30 35 40 452
4
6
8
10
12
14
16
σ r / (%
)
TUR
PETPET-P0.1PET-P0.25PET-J0.4
Figure 10. Non-uniformity index σR as a function of take-up ratio TUR for PET modified with PMDA or Joncryl. The lines are a guide to the eye.
In general, for all materials investigated (except for PET-P0.1), the non-uniformity index increases distinctly with growing TUR. This observation is in line with investigations on various polyethylenes [14,27,28]. Meanwhile, within the accuracy of the measurement, hardly no differences regarding film thickness uniformity can be detected between the neat PET and the samples with various PMDA contents, and the Joncryl modified material shows a significant improvement at all TUR. From this result, it can be concluded that the bubble stability and the height of the melt strength,
Figure 9. Measured film thickness df as a function of take-up ratio TUR for PET modified with PMDAor Joncryl in comparison to the data calculated according to Equation (5).
With the average thickness df and the standard deviation σ, the relative standard deviation σr,also called inhomogeneity index or non-uniformity index [14,27–29], can be calculated accordingly:
σr =σ
df·100% (6)
This value is plotted as a function of TUR in Figure 10.In general, for all materials investigated (except for PET-P0.1), the non-uniformity index
increases distinctly with growing TUR. This observation is in line with investigations on variouspolyethylenes [14,27,28]. Meanwhile, within the accuracy of the measurement, hardly no differencesregarding film thickness uniformity can be detected between the neat PET and the samples withvarious PMDA contents, and the Joncryl modified material shows a significant improvement atall TUR. From this result, it can be concluded that the bubble stability and the height of the melt

Polymers 2020, 12, 1605 11 of 14
strength, measured by the Rheotens experiment constitute no indication of a better thickness uniformity(cf. Section 3.3.3). This is in agreement with other studies [14,27,28]. The improved thickness uniformityof PET-J0.4 compared to the neat PET can be ascribed to the pronounced strain hardening behavior(cf. Figures 4 and 5), which results from the branching structure (cf. Figure 2) and the gel content [8,9].This is in line with [14], where it is convincingly shown that strain hardening is required to obtainan improved thickness uniformity. Even though the elongational viscosity of the neat PET cannot bemeasured due to sagging of the specimen in the rheometer, it can be expected from the molecularcharacteristics in Figures 1 and 2 that it shows no strain hardening due to the linear molecule structureand the absence of a high molar mass component [21]. These differences in molecular structure andrheological behavior explain the better uniformity of the PET-J0.4 sample compared to the neat PET.
Polymers 2020, 12, x FOR PEER REVIEW 11 of 14
5 10 15 20 25 30 35 40 450
5
10
15
20
25
30
35
40
45
d f / (µ
m)
TUR
PET PET-P0.1 PET-P0.25 PET-J0.4 Eq. (5)
Figure 9. Measured film thickness df as a function of take-up ratio TUR for PET modified with PMDA or Joncryl in comparison to the data calculated according to Equation (5).
With the average thickness 𝐝𝐟 and the standard deviation σ, the relative standard deviation σr, also called inhomogeneity index or non-uniformity index [14,27–29], can be calculated accordingly: 𝛔𝐫 = 𝛔𝐝𝐟 ∙ 𝟏𝟎𝟎% (6)
This value is plotted as a function of TUR in Figure 10.
5 10 15 20 25 30 35 40 452
4
6
8
10
12
14
16
σ r / (%
)
TUR
PETPET-P0.1PET-P0.25PET-J0.4
Figure 10. Non-uniformity index σR as a function of take-up ratio TUR for PET modified with PMDA or Joncryl. The lines are a guide to the eye.
In general, for all materials investigated (except for PET-P0.1), the non-uniformity index increases distinctly with growing TUR. This observation is in line with investigations on various polyethylenes [14,27,28]. Meanwhile, within the accuracy of the measurement, hardly no differences regarding film thickness uniformity can be detected between the neat PET and the samples with various PMDA contents, and the Joncryl modified material shows a significant improvement at all TUR. From this result, it can be concluded that the bubble stability and the height of the melt strength,
Figure 10. Non-uniformity index σR as a function of take-up ratio TUR for PET modified with PMDAor Joncryl. The lines are a guide to the eye.
Taking these results into account, it is surprising that the PET samples modified with PMDA showno improved thickness uniformity. Both samples reveal long-chain branched structures, proven bythe Mark–Houwink plot (Figure 2), that effect a strain hardening behavior of the PET-P0.25 sample(cf. Figures 4 and 5). The PET-P0.1 cannot be measured by elongational rheometry, however it canbe expected that the long-chain branched structures lead to a strain hardening, but probably not aspronounced as for the PET-P0.25 material. In order to compare PET-P0.25 and PET-J0.4, the elongationalviscosity and the strain hardening factor at εH = 2.5 and
.ε = 0.3 s−1 for both samples are listed in
Table 1. A Hencky strain of 2.5 and an elongational rate of 0.3 s−1 can be seen as representative valuesfor the film blowing application [31]. Comparing the elongational viscosity between PET-P0.25 andPET-J0.4 indicates that they are of a very similar order of magnitude (cf. Table 1). This gives someindication that the absolute value of the elongational viscosity is not the parameter that correlates withthe thickness uniformity. However, the strain hardening factor of the PET-J0.4 sample is significantlyhigher compared to the PET-P0.25 sample, especially at 0.3 s−1, but also for lower and higher strainrates (cf. Figure 5). From this result, it can be concluded that an improved thickness uniformity isrelated to samples showing a pronounced strain hardening and that low values of the strain hardeningfactor might not be sufficient to significantly affect the uniformity of blown films.

Polymers 2020, 12, 1605 12 of 14
4. Conclusions
From a processing point of view, a suitable polymer for film blowing applications should providea low extrusion pressure, a good bubble stability, a good drawability, and a small film thicknessvariation in take-up and blow-up directions. Reactive processing with chain extenders like PMDA orJoncryl® ADR 4368 is an elegant way to change the rheological behavior of commercially availablePET to make it more suitable for the film blowing process. In particular, it has been shown thatadding 0.4 wt.% Joncryl leads to a reduced extrusion pressure due to pronounced shear thinning, animproved bubble stability, and a better film thickness uniformity compared to the neat PET (cf. Table 1).These improvements can be ascribed to an increase in weight average molar mass, a broadening of themolar mass distribution, and the formation of long-chain branches. However, gels occur that lead to areduced drawability in the Rheotens test and an occasional breakdown of the bubble in the laboratoryexperiment at high TUR. The PMDA modified samples show good drawability and no gels, leading toa superior bubble stability at high PMDA concentration. The disadvantage of PMDA is a less efficientbranching structure, resulting in only a small improvement of the thickness uniformity compared tothe neat PET.
Taking these findings into account, a PET material suitable for film blowing applications might becreated by a two-step reactive process: (1) extrusion with PMDA in order to improve bubble stabilityby increasing weight average molar mass, broadening of molar mass distribution, and generationof branched structures, and (2) adding Joncryl in a later stage of the reactive processing in order tointroduce an efficient branching structure at low gel contents, to raise the strain hardening and toimprove the thickness uniformity. Some hints towards such a two-step reactive process can be foundin the patent literature [32] and in a recent study performed with PLA and PMDA and Joncryl as chainextenders [33].
Author Contributions: All authors contributed equally to this work. All authors have read and agreed to thepublished version of the manuscript.
Funding: This research received no external funding.
Acknowledgments: The authors would like to thank Helmut Münstedt for fruitful discussions and for proofreadingthe manuscript and Alfred Frey, Marko Heyder, and Harald Rost for their technical support.
Conflicts of Interest: The authors declare no conflict of interest.
References
1. Kuhmann, B.; Kliesch, H.; Klein, D.; Jesberger, M.; Hackl, T. Biaxially Stretched Polyester Film Containinga Chain Extender and Method for Production of Same and Use of Same. European Patent ApplicationNo. 2 184 313 B1, 3 November 2009.
2. Gupta, V.B.; Bashir, Z. PET fibers, films, and bottles. In Handbook of Thermoplastic Polyesters; Fakirov, S., Ed.;Wiley-VCH: Weinheim, Germany, 2002.
3. White, J.L.; Yamane, H. A collaborative study of the rheological properties and unstable melt spinningcharacteristics of linear and branched polyethylene terephthalates. Pure Appl. Chem. 1985, 57, 1441–1452.[CrossRef]
4. Kruse, M.; Roloón-Garrido, V.H.; Wagner, M.H. Rheological characterization of degradation andpolycondensation of poly(ethylene terephthalate) melt in air and in nitrogen. Nov. Trends Rheol. V 2013,216–229. [CrossRef]
5. Harth, M.; Kaschta, J.; Schubert, D. Rheological study of the reaction kinetics in a poly(ethylene terephthalate)melt. Polym. Degrad. Stab. 2015, 120, 70–75. [CrossRef]
6. Strutzel, H.; Gneuss, D.; Klenk, L. Tubular Film of Polyethylene Terephthalate and Process for the ProductionThereof. U.S. Patent 4,034,055, 5 July 1977.
7. Daver, E.; Gupta, R.; Kosior, E. Rheological characterization of recycled poly(ethylene terephthalate) modifiedby reactive extrusion. J. Mater. Process. Technol. 2008, 204, 397–402. [CrossRef]

Polymers 2020, 12, 1605 13 of 14
8. Härth, M.; Kaschta, J.; Schubert, D.W. Shear and elongational flow properties of long-chain branchedpoly(ethylene terephthalates) and correlations to their molecular structure. Macromolecules 2014, 47, 4471–4478.[CrossRef]
9. Härth, M. Rheological and Processing Properties of Reactively Modified Polyethylene Terephthalates.Ph.D. Thesis, University Erlangen-Nuremberg, Erlangen, Germany, 2016.
10. Duarte, I.S.; Tavares, A.A.; Lima, P.S.; Andrade, D.L.; Carvalho, L.H.; Canedo, E.L.; Silva, S.M. Chain extensionof virgin and recycled poly(ethylene terephthalate): Effect of processing conditions and reprocessing.Polym. Degrad. Stab. 2016, 124, 26–34. [CrossRef]
11. Yang, Z.; Xin, C.; Mughal, W.; Li, X.; He, Y. High-melt-elasticity poly(ethylene terephthalate) producedby reactive extrusion with a multi-functional epoxide for foaming. J. Appl. Polym. Sci. 2017, 135, 45805.[CrossRef]
12. Al Ghatta, H.; Cobror, S. Blown Polyester Film. European Patent Application No. 0 819 728 B1, 8 January 2003.13. Di Maio, L.; Incarnato, L.; Scarfato, P. Film blowing of recycled PET modified by reactive extrusion.
Polym. Recycl. 2001, 6, 77–84.14. Münstedt, H.; Steffl, T.; Malmberg, A. Correlation between rheological behaviour in uniaxial elongation and
film blowing properties of various polyethylenes. Rheol. Acta 2005, 45, 14–22. [CrossRef]15. Mallet, B.; Lamnawar, K.; Maazouz, A. Improvement of blown film extrusion of poly(lactic acid):
Structure-processing-properties relationships. Polym. Eng. Sci. 2013, 54, 840–857. [CrossRef]16. Al-Itry, R.; Lamnawar, K.; Maazouz, A. Biopolymer blends based on poly(lactic acid): Shear and elongation
rheology/structure/blowing process relationships. Polymers 2015, 7, 939–962. [CrossRef]17. BASF Corporation. Data Sheet Joncryl®ADR-4368. Available online: http://www2.basf.us/additives/pdfs/
4368_TDS.pdf (accessed on 17 June 2020).18. Wagner, M.H.; Bernnat, A.; Schulze, V. The rheology of the rheotens test. J. Rheol. 1998, 42, 917–928. [CrossRef]19. Ghijsels, A.; De Clippeleir, J. Melt strength behaviour of polypropylenes. Int. Polym. Process. 1994, 9, 252–257.
[CrossRef]20. Yamaguchi, M.; Suzuki, K.-I. Rheological properties and foam processability for blends of linear and
crosslinked polyethylenes. J. Polym. Sci. Part B Polym. Phys. 2001, 39, 2159–2167. [CrossRef]21. Münstedt, H.; Schwarzl, F.R. Deformation and Flow of Polymeric Materials; Springer Science and Business
Media LLC: Berlin/Heidelberg, Germany, 2014.22. Bernnat, A.; Wagner, M.H.; Chai, C.K. Assessment of LDPE melt strength by use of Rheotens mastercurves.
Int. Polym. Process. 2000, 15, 268–272. [CrossRef]23. Makkam, S.; Harnnarongchai, W. Rheological and mechanical properties of recycled PET modified by
reactive extrusion. Energy Procedia 2014, 56, 547–553. [CrossRef]24. Campbell, G.A.; Spalding, M.A. Troubleshooting and Analysis of Single-Screw Extruders; Carl Hanser Verlag:
Munich, Germany, 2013.25. Ghijsels, A.; Ente, J.J.S.M.; Raadsen, J. Melt strength behavior of PE and its relation to bubble stability in film
blowing. Int. Polym. Process. 1990, 5, 284–286. [CrossRef]26. Ghaneh-Fard, A.; Carreau, P.J.; LaFleur, P.G. Study of instabilities in film blowing. AIChE J. 1996, 42, 1388–1396.
[CrossRef]27. Steffl, T. Rheological and Film Blowing Properties of Various Low Density Polyethylenes and Their Blends.
Ph.D. Thesis, University Erlangen-Nuremberg, Erlangen, Germany, 2004.28. Münstedt, H.; Kurzbeck, S.; Stange, J. Advances in film blowing, thermoforming, and foaming by using
long-chain branched polymers. Macromol. Symp. 2006, 245, 181–190. [CrossRef]29. Sirisinha, K.; Somboon, W. Melt characteristics, mechanical, and thermal properties of blown film from
modified blends of poly(butylene adipate-co-terephthalate) and poly(lactide). J. Appl. Polym. Sci. 2011, 124,4986–4992. [CrossRef]
30. Han, C.D.; Kwack, T.H. Rheology-processing-property relationships in tubular blown film extrusion.I. High-pressure low-density polyethylene. J. Appl. Polym. Sci. 1983, 28, 3399–3418. [CrossRef]
31. Kurzbeck, S. Elongational Rheological Properties of Polyolefin Melts and Correlations with Their ProcessingBehavior in Film Blowing and Thermoforming. Ph.D. Thesis, University Erlangen-Nuremberg, Erlangen,Germany, 1999.

Polymers 2020, 12, 1605 14 of 14
32. Loos, R.; Schillo, S. Method for Increasing the Molecular Weight of Polyesters. European Patent ApplicationNo. 2 596 044 B1, 18 July 2011.
33. Yahyaee, N.; Javadi, A.; Garmabi, H.; Khaki, A. Effect of two-step chain extension using Joncryl and PMDAon the rheological properties of poly(lactic acid). Macromol. Mater. Eng. 2019, 305, 1900423. [CrossRef]
© 2020 by the authors. Licensee MDPI, Basel, Switzerland. This article is an open accessarticle distributed under the terms and conditions of the Creative Commons Attribution(CC BY) license (http://creativecommons.org/licenses/by/4.0/).