Fiji Renewable Energy Power Project (FREPP)...The “Resource Assessment Study for Waste-to-Energy...
23
Final Report Fiji Renewable Energy Power Project (FREPP) Report on Feasibility of Resources and Sites For Waste-to-Energy Power Generation in Fiji Waste to Energy Resource Assessment in Fiji September - 2014
Transcript of Fiji Renewable Energy Power Project (FREPP)...The “Resource Assessment Study for Waste-to-Energy...

Final Report
Fiji Renewable Energy Power Project
(FREPP)
Report on Feasibility of Resources and Sites For
Waste-to-Energy Power Generation in Fiji
Waste to Energy Resource Assessment in Fiji
September - 2014
Final Report
1
Disclaimer: This report was prepared as a part of “Resource Assessment Study for Waste-to-Energy Resources in Fiji” contracted by the Department of Energy (DoE), Government of Fiji and United Nations Development Programme (UNDP). All information contained herein is obtained from authentic sources believed to be accurate and reliable. This report is based on the data made available by various departments of Government of Fiji, City and Town Councils, Research Institutes, Industry representatives, NGOs and information available in public domain. Reasonable skill, care and diligence have been exercised in carrying out the study and report preparation. This report is not to be deemed as any undertaking, warranty or certificate. Any views or opinions presented in this report are solely those of the author and do not necessarily represent those of the DoE or UNDP. This report is solely for DoE and UNDP and should not be used, circulated, quoted or otherwise referred to for any other purpose, nor included or referred to in whole or in part in any document without prior written consent.

Final Report
2
Acknowledgements
The author would like to thank the UNDP Multi-Country Office in Fiji and the Department of
Energy, Government of Fiji for their support and guidance during development of this report
including data and information collection and stakeholder consultation during the site
surveys.

Final Report
3
Abbreviations & Acronyms
BOD Biological Oxygen Demand
CDM Clean Development Mechanism
CH4 Methane
CO Carbon Monoxide
CO2 Carbon Di-oxide
COD Chemical Oxygen Demand
GDP Gross Domestic Product
GHG Greenhouse Gases
GWh Gigawatt hours
H Hydrogen
ha hectare
FEA Fiji Electricity Authority
FMIB Fiji Meat Industry Board
FREPP Fiji Renewable Energy Power Project
FSC Fiji Sugar Corporation
IPPs Independent Power Producers
Kg Kilograms
kWh kilowatt hour
MJ Mega joule
MSW Municipal Solid Waste
MT Metric Ton
MW Megawatt
MWh Megawatt-hours
N Nitrogen
PDD Project Design Document
SCC Suva City Council
SIDS Small Island Developing States
SPD South Pacific Distilleries
STP Sewage Treatment Plant
TS Total Solids
TSS Total Suspended Solids
TWIL Tropik Wood Industries Limited
UNDP United Nations Development Programme
UNFCCC United Nations Framework Convention on Climate Change
VSS Volatile Suspended Solids

Final Report
4
Contents
Overview of “Quantification and Assessment of Waste to Energy Resources in Fiji” ................. 6
Approach & Methodology .................................................................................................................... 6
Feasibility of Waste to Energy Resources and Sites in Fiji .............................................................. 7
Municipal Solid Waste (MSW) .............................................................................................................. 7
Naboro Landfill .................................................................................................................................... 8
Lautoka (Vanutu) Dump ...................................................................................................................... 9
Suva Market Waste ........................................................................................................................... 10
Sewerage Sludge ................................................................................................................................ 11
Livestock Waste .................................................................................................................................. 12
Biomass Waste .................................................................................................................................... 14
Bagasse (Sugarcane Waste) .............................................................................................................. 14
Rarawai Cogeneration Project .......................................................................................................... 14
Labasa Cogeneration Project ............................................................................................................ 15
Logging and Forest Industries .......................................................................................................... 15
Non Hazardous Industrial Waste Water ............................................................................................ 17
Agricultural Crop Residues................................................................................................................ 18
Conclusion & Next Steps ................................................................................................................... 20
References ........................................................................................................................................... 21
Annex 1: List of Key Stakeholders Consulted ................................................................................. 22

Final Report
5
List of Figures
Figure 1: Naboro Landfill, Suva (Source: M/s HG Leach) ............................................................................ 8
Figure 2: Vanutu Rubbish Dump (Source: Lautoka City Council) ............................................................. 10
Figure 3: Segregation and Collection of Suva Market Waste (Source: Suva City Council) .................. 10
Figure 4: Waste Composition Data for Suva MSW (Source: Suva City Council) .................................... 11
Figure 5: Piggeries at Vuda and Naboro Correctional Facility (Source: Vuda Piggery) ......................... 13
Figure 6: TWIL Biomass Waste Power Plant at Drasa (Source: TWIL) ................................................... 16
List of Tables
Table 1: Estimated Electricity Generation Potential in Fiji from ................................................................... 7
Table 2: Estimated Electricity Generation from MSW through ..................................................................... 8
Table 3: Vanutu Dump Waste Composition Data (Source: Lautoka City Council) .................................... 9
Table 4: Estimated Electricity Generation Potential at ................................................................................ 11
Table 5: Estimated Electricity Generation Potential from Livestock Waste .............................................. 12
Table 6: Potential Livestock based Electricity Generation Projects, Fiji ................................................... 13
Table 7: Installed Capacity and Electricity Production by FSC Sugar Mills .............................................. 14
Table 8: Theoretical Potential for Electricity Generation from .................................................................... 15
Table 9: Proposed Biomass based Power Generation projects, Fiji ......................................................... 16
Table 10: Theoretical potential for electricity generation from FMIB Waste ............................................. 17
Table 11: Theoretical potential for electricity generation from .................................................................... 18
Table 12: Theoretical Potential for Electricity Generation ........................................................................... 19

Final Report
6
Overview of “Quantification and Assessment of Waste to
Energy Resources in Fiji”
This report under the “Fiji Renewable Energy Power Project (FREPP1), focused on
quantification and assessment of amount and types of waste resources available in Fiji for
power generation. The report included quantitative and qualitative assessment of various
potential wastes to energy resource generated in Fiji and major characteristics of waste
resources for each identified waste streams in Fiji
The potential waste streams identified in Fiji with relevance to waste to power generation
potential includes: Municipal Solid Waste (MSW); Sewage and Sludge (Domestic Waste
Water); Livestock Waste; Biomass Waste; Non Hazardous Industrial Organic Waste and
Agricultural Crop Residues. The quantification and assessment of potential waste streams in
Fiji infer that some (MSW, biomass, livestock) of the waste streams identified have
reasonable resource and potential available for power generation as stand-alone
applications or for medium scale centralized power generation activities. This is the second
report under the study assessing the feasibility of quantified waste resources under various
waste streams and identified potential sites for waste to energy (power) generation.
Approach & Methodology
The “Resource Assessment Study for Waste-to-Energy Resources in Fiji”under the “Fiji
Renewable Energy Power Project (FREPP) intends to quantify and assess the amount of
waste resources available in Fiji for power generation and identify technology options for
feasible implementation of waste to energy projects.
This report (Second under the Study) is a macro assessment focusing on estimating the
theoretical potential for power generation from the identified waste streams and assessing
the feasibility of the available resources for energy generation. The report also discusses on
the identified potential waste to energy projects in Fiji including their estimated potential for
power generation based on the site survey carried out. It is to be noted that the scope of the
study does not involve carrying out a detailed techno-economic feasibility assessment for the
identified waste streams or the potential projects. This report on “Feasibility of Resources
and Sites for Waste-to-Energy Power Generation in Fiji” is developed based on stakeholder
consultations and resource assessment site surveys carried out for identified potential
projects.
The quantification and assessment of the amount and types of waste resources (First
Report) including data and information collected on waste to energy resource availability and
assumptions considered for projections of waste resource availability were also validated
through meeting with the stakeholders during the development of this report.
Detailed on-site resource analysis including envisaged economic, social and environmental
implications, issues and benefits for the identified potential waste to energy projects were
also carried out using a waste to energy project survey template. The list of stakeholders
met and consulted including the site surveys is provided in Annex 1.
1http://www.fj.undp.org/content/dam/fiji/docs/ProDocs/Fij_FREPP_00076656.pdf
http://www.fdoe.gov.fj/index.php/energy-planning/frepp
Final Report
7
Feasibility of Waste to Energy Resources and Sites in Fiji
Municipal Solid Waste (MSW)
The composition of municipal solid waste (collected and dumped at site) mainly contains
biogenic/organic, inorganic and inert components. The biogenic fraction in the MSW can be
converted to electricity through thermo-chemical path (incineration/pyrolysis) or anaerobic
digestion (landfill gas capture and utilization).The incineration of MSW mainly involves
burning of organic materials in the waste at very high temperatures and pyrolysis burns
waste in absence of oxygen. The heat generated during the combustion process can be
used to generate electricity. A typical incineration plant generates about 550 kWh per tonne
of waste combusted2 with average power generation efficiency in the range 20-25%.
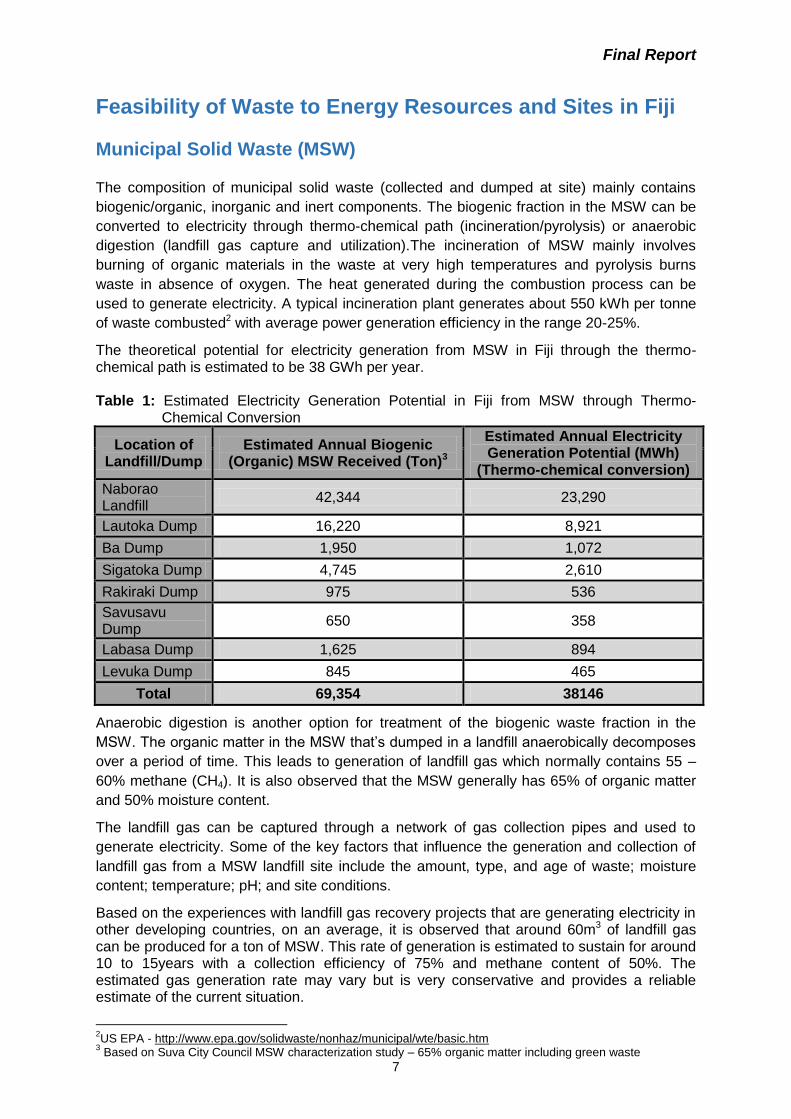
The theoretical potential for electricity generation from MSW in Fiji through the thermo-chemical path is estimated to be 38 GWh per year. Table 1: Estimated Electricity Generation Potential in Fiji from MSW through Thermo-
Chemical Conversion
Location of Landfill/Dump
Estimated Annual Biogenic (Organic) MSW Received (Ton)3
Estimated Annual Electricity Generation Potential (MWh)
(Thermo-chemical conversion)
Naborao Landfill
42,344 23,290
Lautoka Dump 16,220 8,921
Ba Dump 1,950 1,072
Sigatoka Dump 4,745 2,610
Rakiraki Dump 975 536
Savusavu Dump
650 358
Labasa Dump 1,625 894
Levuka Dump 845 465
Total 69,354 38146
Anaerobic digestion is another option for treatment of the biogenic waste fraction in the
MSW. The organic matter in the MSW that’s dumped in a landfill anaerobically decomposes
over a period of time. This leads to generation of landfill gas which normally contains 55 –
60% methane (CH4). It is also observed that the MSW generally has 65% of organic matter
and 50% moisture content.
The landfill gas can be captured through a network of gas collection pipes and used to
generate electricity. Some of the key factors that influence the generation and collection of
landfill gas from a MSW landfill site include the amount, type, and age of waste; moisture
content; temperature; pH; and site conditions.
Based on the experiences with landfill gas recovery projects that are generating electricity in other developing countries, on an average, it is observed that around 60m3 of landfill gas can be produced for a ton of MSW. This rate of generation is estimated to sustain for around 10 to 15years with a collection efficiency of 75% and methane content of 50%. The estimated gas generation rate may vary but is very conservative and provides a reliable estimate of the current situation.
2US EPA - http://www.epa.gov/solidwaste/nonhaz/municipal/wte/basic.htm
3 Based on Suva City Council MSW characterization study – 65% organic matter including green waste

Final Report
8
Table 2: Estimated Electricity Generation from MSW through Landfill Gas Recovery and
Utilization
Location of Landfill/Dump
Estimated Annual Quantity of Biogenic
(Organic) MSW Received (Ton) 4
Estimated Annual Landfill Gas
Generation (m3)
Estimated Annual Electricity Generation
Potential (MWh) (Landfill Gas Recovery)5
Naborao Landfill
42,344 254,064 8000
Lautoka Dump 16,220 97,320 3060
Ba Dump 1,950 11,700 370
Sigatoka Dump 4,745 28,470 900
Rakiraki Dump 975 5,850 180
Savusavu Dump
650 3,900 120
Labasa Dump 1,625 9,750 310
Levuka Dump 845 5,070 160
Total 69,354 416,124 13,100
The theoretical potential for electricity generation from MSW in Fiji through landfill gas recovery is estimated to be 13 GWh per year. The identified potential projects for electricity generation under the MSW stream are discussed below.
Naboro Landfill
The Naboro Landfill is a project of the Fiji Government, funded by the European Union and the Government of Republic of The Fiji Islands. The site is designed to accept municipal solid waste (MSW) from the Suva (city), Nasinu (city), towns including Nausori, Lami and Navua and other neighboring rural areas. The landfill site is envisaged to operate for 50 years. The current contractor M/s HG Leach from New Zealand have been managing the landfill since 2005 and the contract is being renewed every 5 years.
Figure 1: Naboro Landfill, Suva (Source: M/s HG Leach)
The Naboro Landfill is engineered to a high standard to contain leachate which is the liquid
residue produced by decomposing organic fraction of municipal solid waste. The compacted
clay liner and leachate collection system prevents leachate permeating into the underlying
4 Based on Suva City Council MSW characterization study – 65% organic matter including green waste
5Based on 70% landfill gas recovery rate; 45% fraction of methane in landfill gas and caloric value of methane 10
kWh/m

Final Report
9
ground water or nearby rivers or the sea as was the case at Lami. A high standard day to
day operation ensures proper placement and compaction of the waste, along with daily
cover and intermediate capping layers which minimise the fire risk and helps minimise odour
issues, windblown refuse and vermin along with uncontrolled discharge of landfill gas.
The estimated annual quantity of organic material received at the landfill including the
electricity generation potential on site has been provided in Tables 1 and 2 above. Fiji
Electricity Authority (FEA) has informed that it has conducted a detailed feasibility study of
Naboro landfill to explore the possibility of generation electricity through thermo-chemical
and landfill gas recovery techniques. However, details of the study were not available mainly
due to confidentiality issues. It is understood that the study has estimated a potential
installed capacity of around 8-10 MW through the thermo-chemical route and around 4 to 5
MW through landfill gas recovery.
Lautoka (Vanutu) Dump
The Vanutu dump in Lautoka is managed by the Lautoka City Council, a statutory body
under the Ministry of Local Government. The dump on an average receives around 69
tonnes/day of MSW which includes garbage, street sweepings, market waste, green waste
etc. The dump caters to MSW generated from Nadi, Lautoka town limits and resorts located
in the outer islands. The waste characterization data for the Vanutu dump has been provided
in the table below.
Table 3: Vanutu Dump Waste Composition Data (Source: Lautoka City Council)
Category of Waste 2008 (%) 2012 (%) 2017 (%)
Kitchen Waste (organic) 36.9 37.7 38.9
Paper 15.3 15.9 16.4
Textile 2 2.1 2.2
Plastic(PET) 1.9 1.8 1.7
Plastic(Film) 8.4 8.4 8.4
Grass and Wood 21.4 20.2 18.8
Rubber and Leather 0.4 0.3 0.3
Combustibles Sub-total 86.4 86.5 86.7
Metal 3.5 3.6 3.6
Bottle and Glass 2 2.1 2
Ceramic & Stone 3.4 3.1 2.9
Others 4.8 4.7 4.8
Non-Combustibles Sub-total 13.6 13.5 13.3
Total 100 100 100
Final Report
10
Figure 2: Vanutu Rubbish Dump (Source: Lautoka City Council)
The estimated annual quantity of organic waste received at the landfill including the
electricity generation potential on site has been provided in Tables 1 and 2 above. However,
there are some key issues associated with the location and available area for the Vanutu
dumpsite. The site is believed to be have evolved from a mangrove site during 1960’s and is
situated on a water table. There is very limited scope for converting the dumpsite into a
sanitary landfill due to the limited land area available for expansion including envisaged
impact on the local environment due to the location of the site.
Suva Market Waste
Suva City Council (SCC), a municipal entity under the Local Government Act is responsible
for collection and disposal of MSW from Suva city limits including the wastes generated by
Suva agricultural produce market. On an average the Suva market generates around 7
tonnes of waste per day.
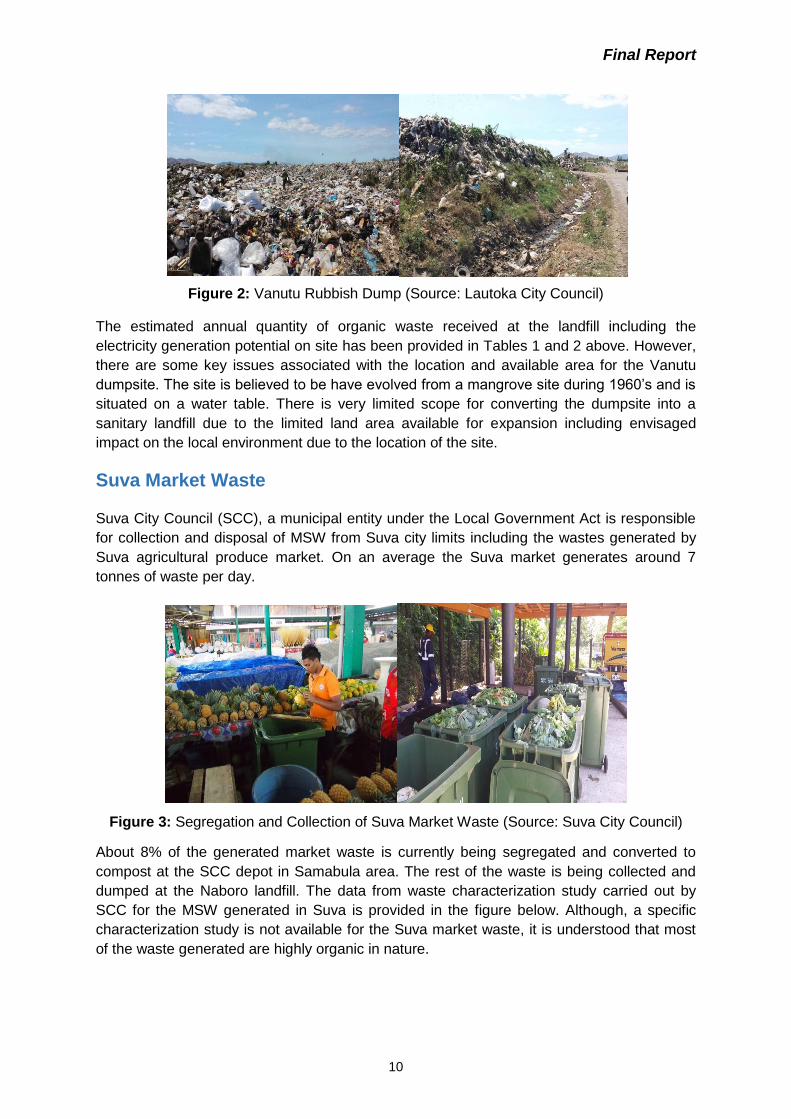
Figure 3: Segregation and Collection of Suva Market Waste (Source: Suva City Council)
About 8% of the generated market waste is currently being segregated and converted to
compost at the SCC depot in Samabula area. The rest of the waste is being collected and
dumped at the Naboro landfill. The data from waste characterization study carried out by
SCC for the MSW generated in Suva is provided in the figure below. Although, a specific
characterization study is not available for the Suva market waste, it is understood that most
of the waste generated are highly organic in nature.

Final Report
11
Figure 4: Waste Composition Data for Suva MSW (Source: Suva City Council)
It is estimated that around 560 cubic meters6 of biogas could be generated per day by
anaerobic decomposition of Suva market waste. The generated biogas can be utilized to
produce around 2800KWh7 per day of electricity which could result in approximately 1000
MWh of electricity generation annually.
Sewerage Sludge
Domestic wastewater (sewage) normally comprises of waste organic matter, some inorganic solids, heavy metals, sand and grit, and floating debris. The organic matter in the sewage (suspended or dissolved solids) can be settled through appropriate treatment process. The settled sludge has very high organic content which could be converted to biogas through anaerobic digestion of the sludge. In this process, a large fraction of the organic matter (cells) is broken down into carbon dioxide (CO2) and methane (CH4), and this is accomplished in the absence of oxygen. About half of the amount is then converted into gases, while the remainder is dried and becomes a residual soil-like material. The production of biogas provides an easy possibility of energy recovery through generation of electricity. Table 4: Estimated Electricity Generation Potential at Major Sewage Treatments Plants in
Fiji
Centre
Volume of Sewage Treated (m3/day)
Average TSS in Raw Effluent (mg/l)
Estimated Methane Generation
Potential (m3/day)8
Estimated Electricity Generation Potential
(MWh/year)9
Suva 24,500 300 4,630 8,450
Nasouri 600 220 83 152
Pacific Harbour
691 170 74 135
Lautoka 6,750 275 1,170 2,134
Nadi 3,000 249 470 858
Sigatoka 600 195 73 134
Ba 975 138 85 155
6Based on 1 tonne of vegetable waste yields 80m3 of biogas
7 Based on 1 m3 of biogas generates around 5KWh of electricity
8 Based on 70% Volatile Suspended Solids (VSS) and 0.9m3 of methane production per KG of VSS destroyed
9 Based on 1 m3 of biogas generates around 5KWh of electricity
Organic including green
waste 65%
Plastic 6%
Paper 6%
Glass 4%
Metal 5% Textile
2%
Packaging Material
8%
Others 4%
SCC - MSW CHARACTERIZATION 2010 (BY WEIGHT)

Final Report
12
Labasa 900 165 93 170
AdiCakobau School
150 285 27 49
Wailada 150 180 17 31
Naboro 300 190 36 65
The theoretical potential for electricity generation from sewage sludge in Fiji is estimated to
be 12.33 GWh per year.
As observed from the above table, only Kinoya Sewage Treatment Plant (STP) appears to have potential to generate reasonable quantity of electricity. However, the Kinoya project is currently registered under the Clean Development Mechanism (CDM) of Kyoto Protocol and is eligible for carbon credits10. The technology implemented on site for GHG emission reduction is methane capture and flaring. As per the CDM modalities and procedures, the Project Proponent is not allowed to deviate from or change the design of the registered project that has been indicated in the registered Project Design Document (PDD). In case the Project Proponent decides to install biogas generators for electricity generation during
the CDM crediting period (10 years i.e.2012 - 2022), the project might face constraints in
terms of issuance of carbon credits by UNFCCC.
Livestock Waste
Livestock farming in Fiji mainly consists of dairy and beef cattle, sheep, goats, pigs and poultry. Waste/manure generated by livestock is generally used as an organic fertilizer and energy source. The livestock waste can be burnt directly (after drying) or anaerobically digested to produce biogas11. Generating biogas is considered to be more efficient than using the waste as raw manure or direct burning. Apart from biogas, the bio-digesters also produce slurry which can be used as a fertilizer. Small-scale household level digesters can provide thermal energy for cooking and water heating needs. Large scale digesters can generate large volumes of biogas for electricity generation. The quantity of waste/manure produced by livestock varies and depends on the animal type. The methane generation potential can be evaluated based on the type of waste/manure generated and the type of animal.
Table 5: Estimated Electricity Generation Potential from Livestock Waste
Type of Livestock
Estimated Quantity of Waste Generated (ton/day)
Estimated Biogas Yield (m3/t) 12
Estimated Electricity Generation Potential
(MWh) 13
Cattle 1,472.46 40 295
Pigs 110.5 70 39
Poultry 373.4 60 112
Sheep 28.02 50 7
Goat 202.4 50 51
Total 2,186.78 504
10
http://cdm.unfccc.int/Projects/DB/TUEV-SUED1299488431.41/view 11
Biogas is the gaseous product of the anaerobic digestion (decomposition without oxygen) of organic matter. The composition of biogas varies depending upon the origin of the anaerobic digestion process. Typical composition is CH4 (50% to 70%), CO2 (30% to 50%), and traces of gases such as H, CO, and N.
12
Based on USAID Report - http://www.nrel.gov/docs/fy09osti/44808.pdf
1313
Based on 1 m3 of biogas generates around 5KWh of electricity

Final Report
13
Although the combined potential for electricity generation from livestock waste in Fiji seems
to be large, in reality, only a part of this can be achieved. This is mainly due to the fact that
waste generated by poultry and pigs can only be utilized wherein these animals are raised in
closed facilities allowing the collection of the manure. The manure from cattle although has
the highest potential to generate electricity (295 MWh), due to the grazing pattern adopted in
Fijian cattle farms, it is difficult (economically and technically) to collect the cattle manure
and transport it to a centralized location for processing. However, the cattle farms could
make use of the manure produced during milking of cattle (during when they are brought into
a common shed) for biogas generation at household scale for thermal energy needs. The
situation is very similar to cattle manure with waste/manure generated by sheep and goats.
Figure 5: Piggeries at Vuda and Naboro Correctional Facility (Source: Vuda Piggery)
The projects having potential for electricity generation under the livestock waste stream has
been discussed in the below table.
Table 6: Potential Livestock based Electricity Generation Projects, Fiji
Project Type and Quantity of
Waste Generated (ton/year)
Biogas Yield (m3/year)
Electricity Generation Potential
(MWh/year)
Naboro Correctional Facility Piggery
Pig Manure 28,105 140
401.5
Vuda Piggery Pig Manure
127,750 639 1,825
Naboro Leyland Piggery
Pig Manure 63,910 320
913
Ram Sami & Sons
Poultry Litter 219,000 1,095
3,650
Crest Poultry Poultry Litter
Data and information to estimate the potential for electricity generation was not available. Rooster Poultry

Final Report
14
Biomass Waste Bagasse (Sugarcane Waste)
Sugar mills around the world normally use bagasse, the residue of sugarcane generated
after crushing to generate steam and power through cogeneration. The simultaneous
production of both electrical power and a useable form of thermal energy, such as
steam, is termed cogeneration. This may be achieved by generating high pressure
steam in a boiler, which would then be passed through a turbine generator for power
before being used as exhaust steam in drying or process heating.
The electricity generated is used for captive consumption within the sugar industry and the
surplus is fed into the grid. The sale of surplus electricity to the grid in fact is a key source of
additional revenue which could assist in long term sustainability of the sugar industry.
Fiji Sugar Corporation (FSC) is a government-owned sugar milling company in Fiji having
monopoly on production of raw sugar in Fiji. The Government of Fiji is a major shareholder
that owns 68% of shares while statutory bodies, local companies and individuals own the
remaining shares. FSC owns and operates four sugar mills located at Lautoka, Ba and
Rakiraki on the main island of Viti Levu while Labasa mill is located on the second largest
island of Vanua Levu.
Table 7: Installed Capacity and Electricity Production by FSC Sugar Mills
Name of Sugar mill
Installed Capacity (MW)
Power Export During Crushing Season (MW)
Total Power Generated (2013) kWh
Lautoka 12 6 17,474,151
Rarawai 9 3 8,990,508
Labasa 24 14 15,208,450
Penang 3 0 3,738,200
Total 48 MW 23 MW 45,411,309 kWh
The four sugar mills owned by the Fiji Sugar Corporation (FSC) Limited have a collective electricity generating capacity of around 48 MW during the sugar cane crushing season. The boilers in these mills are fuelled by bagasse. Wood chips/Firewood is used to supplement bagasse in some mills during off-season when there is shortage of bagasse or when the open-air-stored bagasse is in an advanced stage of decay. The bagasse is generated on site while whatever Wood chips/Firewood used is purchased locally. FSC mainly depends on electricity from Fiji Electricity Authority (FEA) grid during off-season.
Rarawai Cogeneration Project
FSC is planning to implement a 40 MW cogeneration plant in its sugar mill at Rarawai on Viti Levu. The feasibility study for the cogeneration plant has been completed and the project is expected to be operational during early 2016. The Rarawai plant is proposed to have two 110 ton per hour boilers and two 20 MW extraction condensing turbo-generators. The plant is expected to supply all the steam and power to the 300 tons cane per hour capacity sugar mill during the sugar cane crushing period. The surplus power is planned to be exported to the FEA grid. During off season, the plant is expected to operate in a power generation mode supplying power only to the FEA's grid.

Final Report
15
The plant will use the entire bagasse generated in the sugar mill. FSC is also planning to supply about 50,000 MT of bagasse per year from its other sugar mills to the Rarawai cogeneration plant. In addition to bagasse it is also proposed to use wood chips and cane trash as fuels as fuel source.
Labasa Cogeneration Project
FSC is also in advanced stages of establishing a 10 MW bagasse/biomass based
cogeneration plant at Labasa sugar mill in Vanua Levu. The cogeneration facility is being
planned to operate even during off-season using surplus bagasse and wood chips procured
from third party sources. The plant is expected to be commissioned during late 2014.The
power generated from the 10 MW turbo-generator is expected to meet the internal power
requirements and the surplus power will be exported to Fiji Electricity Authority.
Logging and Forest Industries
Even though large volume of forest residues are generated during logging in Fiji which has a
potential to be used as fuel source for electricity generation, collection and handling costs
are the key barriers in utilizing the resource effectively. The residues left to decompose in
the forests also play a key role as soil nutrients. Practicing appropriate collection techniques
during logging could help in terms of collecting the residues including maintaining the soil
nutrient level by leaving behind leaves, barks and thinnings.
Table 8: Theoretical Potential for Electricity Generation from Logging and Forest Industry
Residues in Fiji
Activity Type Estimated Volume Biomass
Residues Generated (t/year) 14 Electricity Generation Potential (MWh/year) 15
Logging
Natural Forests
25,737 38,605.50
Pine 163,061 244,592
Mahogany 15,858 23,787
Wood Chips 18,900 28,350
Saw Milling 7,240 10,860
Wood Veneer Sheets
4,335 6,502
Plywood 1,200 1,800
Considering the low calorific value and the distance to be covered to transport the residues
to a centralized location, transportation costs are another prohibitive factor in using forest
residues for power generation. Due to the high capital and operating costs involved,
densification (briquetting or pillarization) tends to be the only financially viable option when
the biomass waste needs to be transported over long distances. The briquettes and pellets
14
conversion of volume to mass is based on average density of 792 kg/m3 for logging residues and 300 kg/m3 for wood waste and saw-milling residues with a moisture content of 20%
15
Based on assumption that a tonne of dry biomass generates on average 1.5 MWh with the efficiency in the range of 20 – 40%

Final Report
16
have wide range of application and usage right from rural households as cooking fuel up to
commercial and industrial fuel requirements.
The biomass residues and wood waste generated from logging activities in the outer islands
are currently being left in the forests or at the processing facilities. This is mainly due to the
exorbitant transportation costs involved in moving the residues to the main island for
utilization as an energy resource. Further, apart from Viti Levu, the grid coverage in Vanua
Levu and other outer islands are not extensive or totally nonexistent. The in-adequate grid
facility available in Vanua Levu to evacuates the generated electricity from logging and
forestry industry residues are making the proposition unattractive to Independent Power
Producers (IPPs).
Tropik Wood Industries Limited (TWIL), one of the biomass waste based IPP’s in Fiji,
maintains around 46,000 hectares of pine forests and currently process around 300,000
ton/year of logs as part of sawmilling and wood chipping operations. The waste barks and
fines (14% of the logs processed) from wood processing operations are currently being used
as feedstock for power generation through direct combustion of biomass at the two power
plants (3 MW & 9.3MW). According to TWIL, most of the biomass waste generated currently
is being consumed by the existing power plants and no excess or surplus biomass waste is
available.
Figure 6: TWIL Biomass Waste Power Plant at Drasa (Source: TWIL)
The proposed and planned power generation projects utilizing the logging and forestry industry wood residues in Fiji has been discussed in the below table.
Table 9: Proposed Biomass based Power Generation projects, Fiji
Project Company/Organization Type and Quantity of Biomass Residues Required (ton/year)
Proposed Installed
Capacity (MW)
Nabouwalu Biomass Power Project
Tropik Wood Industries Limited in collaboration with GIMCO (Korea)
Pine Chips180,000 12
Debua Biomass Power Plant
Fiji Electricity Authority Mahogany Residues26,000
3
Savusavu Biomass Power Plant
Fiji Electricity Authority Saw mill Waste and Coconut Waste22,000
2

Final Report
17
Non Hazardous Industrial Waste Water
Press mud is a by-product from sugar industry and generally contains around 75-80%
organic matter. Press mud is highly biodegradable and is a very good source for generation
of biogas through anaerobic digestion. It is estimated that 1 MT of press mud could yield
around 80-140 m3/day of biogas.
The sugar mills are estimated to generate the waste water in the ratio of 1:2 quantity of
sugarcane crushed to waste water generated. The sugar mill effluents are having high
amount of organic matter (BOD and COD) which could be potentially used to generate
electricity through anaerobic digestion.
FSC as part of its sugar production process generates wastewater and press mud. However,
FSC is not very keen in terms of utilizing the waste resources as the organization is working
towards zero waste and effluent generation. It is understood that several initiatives are being
already implemented by FSC in order to achieve the goal of zero waste and effluent16.
Fiji Meat Industry Board (FMIB) is the main abattoir in Fiji. The waste generated includes
bones, organs, hooves, and other inedible animal parts leftover after all the edible parts of
the animal have been removed. It is estimated that on average 15 liters water wasted in
each slaughtering.
The characteristics of the slaughter house waste are almost similar to that of domestic
sewage but with very high organic content. The effluent generated contains about 45%
soluble and 55% coarse suspended organics.
Due to the high organic nature of waste, there is a good potential to generated biogas and in
turn electricity.
Table 10: Theoretical potential for electricity generation from FMIB Waste
Animals Slaughtered
No. of Animals
Slaughtered/Day
Average Weight of Animals
(kg)
Average Quantity of Waste Generated
(kg/day)17
Estimated Energy Generation
Potential (MJ/)18
Cattle 50 225 5,625 87,750
Pigs 120 55 1,980 30,888
Sheep 10 25 125 1,950
Goat 10 30 150 2,340
Paradise Beverages (Fiji) Limited located in Suva manufactures and sells beer, ready-to-drink alcoholic beverages, and soft-drinks in Fiji. The South Pacific Distilleries (SPD), a sister concern of Paradise Beverages (Fiji) Limited, located in Lautoka uses the molasses from sugar industry to make the Fiji brand of rums.
16
Based on inputs FSC staff
17
Inputs from Ministry of Agriculture Staff
18
Average calorific value of 15.6MJ/kg of waste

Final Report
18
Effluent treatment is currently not being done at both the plants. The effluent is being blended with sewage and discharged into main domestic sewers. Paradise Beverages (Fiji) Limited is keen to explore potential options to utilize the waste at both the plants to generate energy. Waste water generated by breweries and distilleries generally contains high organic loading (BOD, COD & TS) levels. A part of the brewers’ grain, a by-product from the breweries is currently being used as animal feed and rest disposed-off at the landfill.
Table 11: Theoretical potential for electricity generation from SPD and Paradise Beverages
Wastewater
Plant
Quantity of Wastewater Generated (m3/year)
Average COD (t/m3)
Biogas Yield
(m3/year)19
Electricity Generation Potential
(MWh/year)20
South Pacific Distilleries
30,000 0.025 300,000 1,500
Paradise Beverages
72,000 0.00096 27,648 138
Agricultural Crop Residues
In contrast to other regions and developing countries, wherein agricultural and food crops are grown at a commercial scale and result in large quantities of residues, most of the Fijians depend on subsistence agriculture for own consumption or local markets. Further, cultivation of the agricultural and food crops are scattered and dispersed across the islands.
Due to small land holdings and dispersed nature of the agricultural residues significantly
increases the collection and transportation costs of agricultural residues to a centralized
location for electricity generation.
Furthermore, large storage and treatment facilities are required for residues generated from
seasonal crops as they become available at same time of the year.
Similar to any other developing country, large quantities of agricultural crop residues discussed in this study are already being used by urban and rural households as animal feed, manure for farms, cooking and water heating. Hence, it is difficult to come up with a realistic estimate of agricultural residues available for electricity generation. These resources are site specific and a detailed analysis needs to be carried specifically for individual project sites.
19
Based on specific biogas yield of 400 m3 CH4/t COD
20
Based on 1 m3 of biogas generates around 5KWh of electricity

Final Report
19
Table 12: Theoretical Potential for Electricity Generation from Agricultural Crop Residues in Fiji
Crop Type Production
(Tons) Residue
(Dry) (Tons) Electricity Generation Potential
(MWh/year)21
Cassava 58,772 2,997 4,495
Dalo 56,645 2,889 4,333
Yaqona 6,067 310 465
Coconut 10,634
6,476 9,714
4,020 6,030
17,757 42,617 63,925
Rice 4,288 1,684 2,526
1,015 1,522
Pawpaw 335 71 106
220 ha 19,580 29,370
Banana 3,392 721 1,081
1,087 ha 96,743 145,114
Pineapple 445 ha 35,600 53,400
There is a good potential to utilize the root crop, fruit and vegetable wastes at household and
community level wherein small biogas plants could be installed to make use of these organic
wastes and generate biogas for thermal energy requirements. Normally coconut waste (husk
& shells) are used as a source of energy for cooking and heating. These residues could also
be used for copra drying which are used rather inefficiently, resulting in large amounts being
required to achieve the desired able reduction in moisture content. Coconut shell also can be
utilized to produce high quality activated carbon and charcoal by pyrolysis process, for used
also in cooking and heating.
Given the issues and constraints with using agricultural residues as feed stock for electricity
generation, it is suggested that briquetting or pelleting of agricultural residues could be a
potential option to make use of large unused quantities of residues. The residues can be
recycled and can provide a renewable source of energy by converting waste into high
density fuel briquettes or pellets. These are a very good substitute for firewood and offer
several advantages which include: reduction of fuel wood and deforestation; easy handling,
transportation& storage due to high fuel density; cheaper than fuel wood and consistent
quality, high burning efficiency.
21
Based onassumption that a tonne of dry agricultural residue (biomass) generates on average 1.5 MWh with the efficiency in the range of 20 – 40%

Final Report
20
Conclusion & Next Steps
A macro assessment has been carried out to estimate the theoretical potential for power
generation from the identified waste streams in Fiji and the feasibility of the available
resources for energy generation has been assessed. Based on the site survey carried out,
potential waste to energy projects in Fiji has been identified including their estimated
potential for power generation. Based on the assessment, in terms of theoretical potential
for electricity generation, it appears that biomass waste stream (bagasse & logging and
forestry industry residues) has the highest potential followed by MSW and livestock waste.
The two IPPs, Fiji Sugar Corporation (FSC) and Tropik Wood Industries Ltd (TWIL) currently
involved in biomass waste to energy generation (bagasse & wood residues) are consuming
most of the economically available biomass waste generated by using them as fuel at the
existing power plants. Currently there is no excess or surplus biomass waste is available
which could be economically collected and transported to the existing project sites. As
discussed in the report, collection, handling and transportation costs are the key barriers in
utilizing the available biomass resource effectively.
Under the MSW stream, Naboro landfill and Navutu Dump in Lautoka seems to have a
reasonably good potential to generate electricity. The appropriate technology and approach
needs to be decided based on the detailed techno-economic feasibility studies. Also as
discussed in the report, for the Vanuatu dump in Lautoka, the sensitivities and issues related
to location of the dump site and available area for waste processing needs to be considered
whilst deciding on the appropriate waste to energy technology.
All the potential projects identified for the piggery and the poultry waste under the livestock
stream have good potential to generate electricity. The power generated could be used for
captive consumption and the excess fed to grid. The manure from cattle although has the
highest potential to generate electricity, due to the grazing pattern adopted in Fijian cattle
farms, it is difficult to collect the cattle manure and transport it to a centralized location for
processing.
The next steps under the study will include research and identification of relevant
technologies available globally (particularly in developing country context) for waste to
energy power generation in Fijian context and recommendation of appropriate technology
options for waste to energy power generation in Fiji considering similar experiences in other
developing countries.

Final Report
21
References
Deutsche GesellschaftfürInternationaleZusammenarbeit (GIZ) (2010), “Agro-
industrial biogas in Kenya” January.
Deutsche GesellschaftfürInternationaleZusammenarbeit (GIZ) (2014), “Biogas in
Ghana, February.
Fiji Sugar Corporation (FSC) (2014), Data on Bagasse and Co-generation at FSC
Sugar mills
Government of Fiji (2009), Fiji Agricultural Census
HG Leach (Fiji) Ltd (2014), Data on Naboro landfill waste disposal
IOSR Journal of Electrical and Electronics Engineering (IOSRJEEE) ISSN: 2278-
1676 Volume 1, Issue 5 (July-Aug. 2012), PP 11-15 “Using Agricultural Residues as
a Biomass Briquetting: An Alternative Source of Energy”.
Ministry of Agriculture (Livestock Feed Technology) (2014), Data on Piggeries;
Poultry and Cattle Farms and Abattoir
Naboro Correctional Facility (2014), Data on Naboro Piggery
National Renewable Energy Laboratory (NREL) (2009), Assessment of Biomass
Resources in Liberia, April.
Paradise Beverages (Fiji) Ltd (2014), Data on waste generated at South Pacific
Distilleries and Paradise Beverages
Suva and Lautoka City Councils (2014), MSW and Suva Market Waste Collection
and Composition Data
Tropik Wood Industries Ltd (TWIL) (2014), TWIL data on biomass waste and Power
Generation
United Nations Development Programme (UNDP) (2012), The National Bioenergy
Strategy for Lebanon. January.
Vuda Piggery (2014), Data on Piggery and Existing Biogas Plant
Water Authority of Fiji (WAF) (2014), National Sewage and Sludge Data

Final Report
22
Annex 1: List of Key Stakeholders Consulted
Name Organization Contacts
Winifereti Nainoca UNDP [email protected]
Emma Mario UNDP [email protected]
Losana Mualaulau UNDP [email protected]
Susana Pulini DoE [email protected]
Miriama W. Kolinisau DoE [email protected]
Atul Raturi USP [email protected]
Shalend Singh Lautoka City Council [email protected]
Naresh Narayan Suva City Council [email protected]
Thomas Peters Fiji Sugar Corporation [email protected]
Muthu Nambiappan Fiji Sugar Corporation [email protected]
Faiz Khan TWIL [email protected]
Karan Singh South Pacific Distilleries [email protected]
Peter Narayan South Pacific Distilleries [email protected]
Simon Cole Vuda Piggery +679 9921757
Tavo Apete Naboro Correctional
Facility [email protected]
Avinesh Dayal Ministry of Agriculture [email protected]
Mere Iavuniivi Ministry of Agriculture [email protected]
Anish Singh Paradise Beverages [email protected]