Figures Facts Targets Q3 2015 - Commerzbank · The support functions of Group Information...
24
Group Investor Relations | Frankfurt am Main | 2 November 2015 Overview Commerzbank Group Figures – Facts – Targets
Transcript of Figures Facts Targets Q3 2015 - Commerzbank · The support functions of Group Information...
Group Investor Relations | Frankfurt am Main | 2 November 2015
Overview Commerzbank Group
Figures – Facts – Targets
2Group Investor Relations | Frankfurt am Main | 2 November 2015
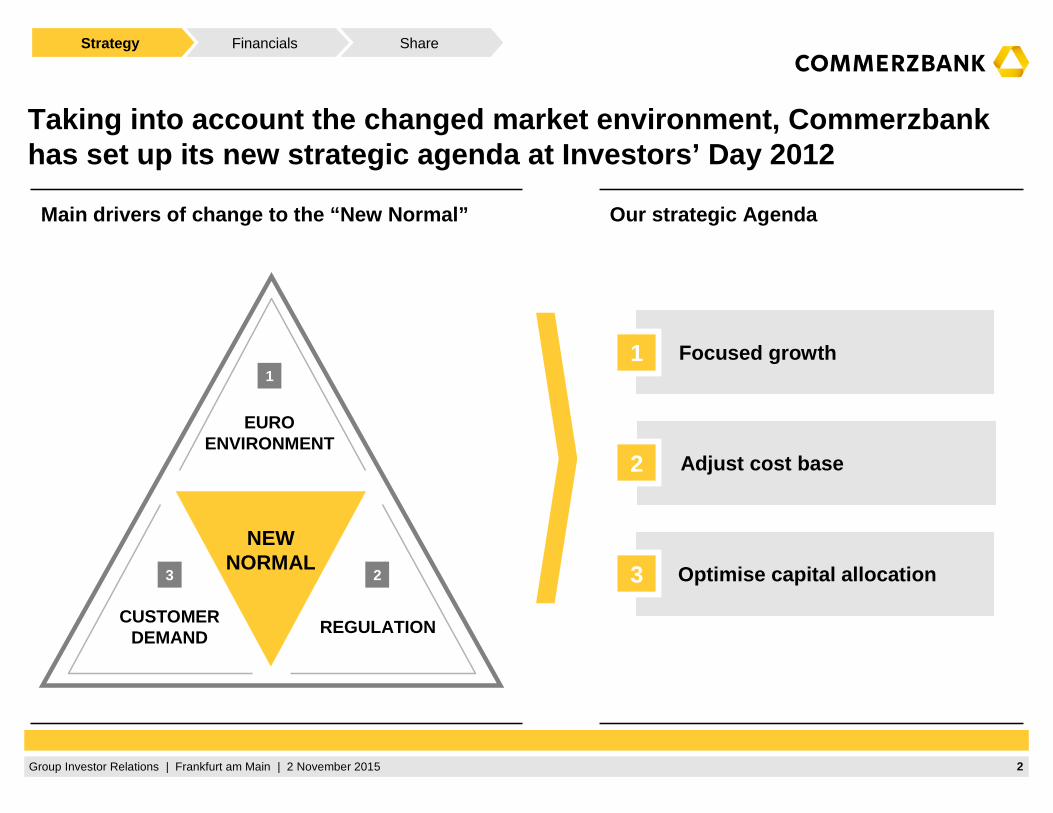
Our strategic AgendaMain drivers of change to the “New Normal”
Taking into account the changed market environment, Commerzbank has set up its new strategic agenda at Investors’ Da y 2012
Optimise capital allocation3
Adjust cost base2
Focused growth1
EUROENVIRONMENT
REGULATIONCUSTOMER
DEMAND
NEWNORMAL
1
23
ShareFinancialsStrategy
3Group Investor Relations | Frankfurt am Main | 2 November 2015
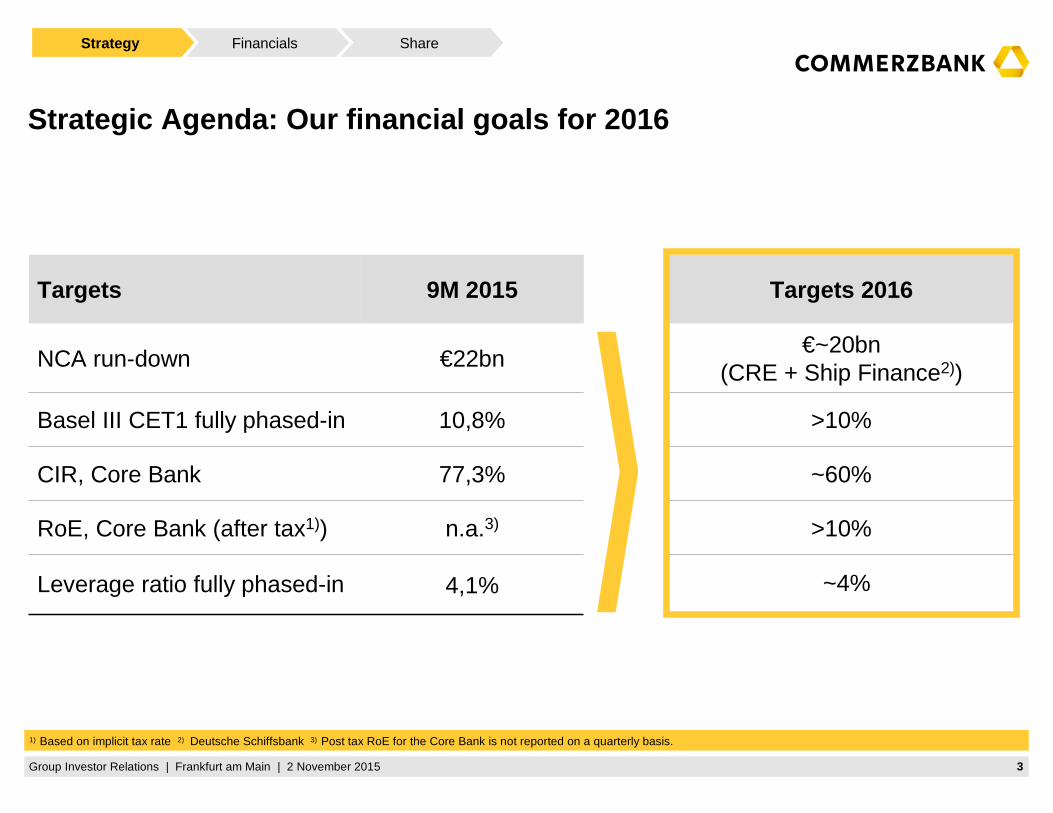
~4%
>10%
Leverage ratio fully phased-in
Strategic Agenda: Our financial goals for 2016
n.a.3)RoE, Core Bank (after tax1))
€~20bn (CRE + Ship Finance2))
€22bnNCA run-down
>10%10,8%Basel III CET1 fully phased-in
~60%
Targets 2016
77,3%
9M 2015
CIR, Core Bank
Targets
1) Based on implicit tax rate 2) Deutsche Schiffsbank 3) Post tax RoE for the Core Bank is not reported on a quarterly basis.
ShareFinancialsStrategy
4,1%
4Group Investor Relations | Frankfurt am Main | 2 November 2015
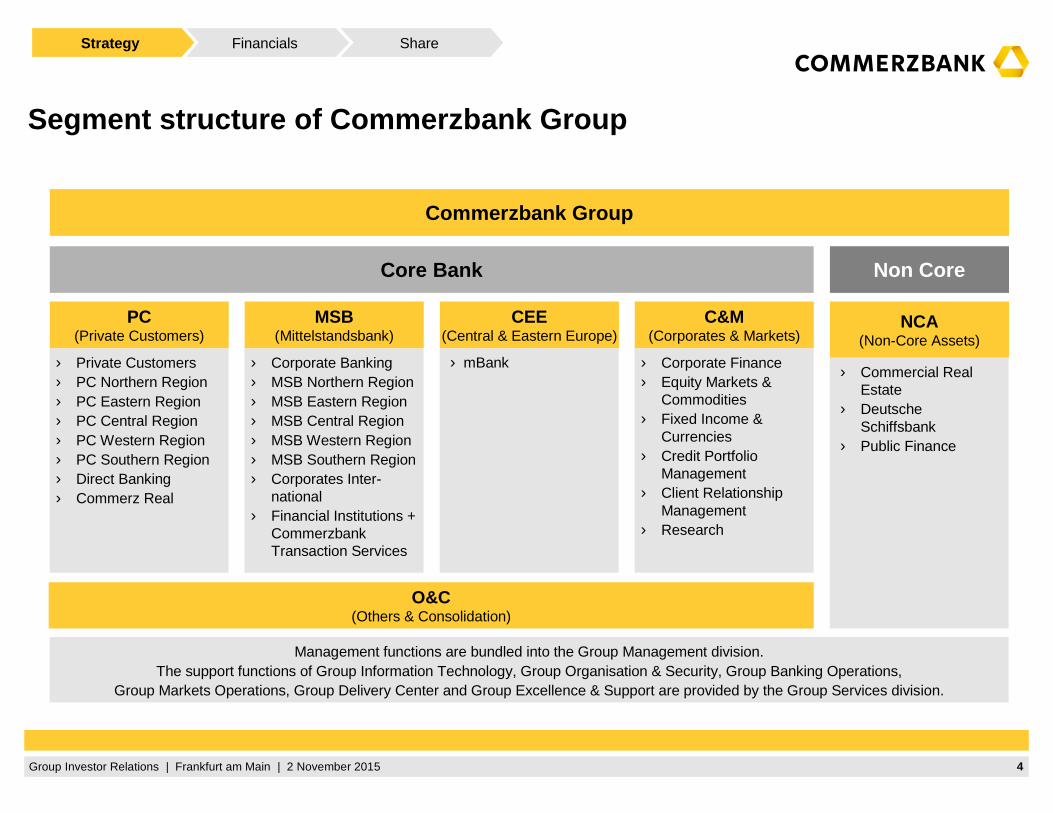
Segment structure of Commerzbank Group
Core Bank Non Core
Commerzbank Group
› Private Customers› PC Northern Region› PC Eastern Region› PC Central Region› PC Western Region› PC Southern Region › Direct Banking› Commerz Real
PC(Private Customers)
› Corporate Banking› MSB Northern Region› MSB Eastern Region› MSB Central Region› MSB Western Region› MSB Southern Region› Corporates Inter-
national› Financial Institutions +
Commerzbank Transaction Services
MSB(Mittelstandsbank)
› mBank
CEE(Central & Eastern Europe)
› Corporate Finance › Equity Markets &
Commodities› Fixed Income &
Currencies› Credit Portfolio
Management› Client Relationship
Management› Research
C&M(Corporates & Markets)
› Commercial Real Estate
› Deutsche Schiffsbank
› Public Finance
NCA(Non-Core Assets)
ShareFinancialsStrategy
Management functions are bundled into the Group Management division.The support functions of Group Information Technology, Group Organisation & Security, Group Banking Operations,
Group Markets Operations, Group Delivery Center and Group Excellence & Support are provided by the Group Services division.
O&C(Others & Consolidation)

5Group Investor Relations | Frankfurt am Main | 2 November 2015
› Strong retail franchise with significant increase in market coverage after merger: ~1,100 branch locations and 11m clients
› Comdirect is No. 1 online broker in Germany
› Top-3 position in German Wealth Management
› Transformation of business initiated, visible improvement
Private Customers: Transformation of business modell gaining momentum
CEE: Focus on our strengths
Mittelstandsbank: Leveraging our success
C&M: Client centric investment banking
› Market leader in Germany with strong regional and international presence
› Leading bank covering almost all attractive large corps within Germany (customer coverage 90%)
› Market-leading foreign trade expertise, profiting from strong export trends
› Market share of 19% in export LCs in Europe
Core Bank business models
ShareFinancialsStrategy
Q3 15
34%
Q3 14
16%
17.5%
Operating RoTE
Share avg. capitalCore Bank
Q3 15
12%
Q3 14
21%
35.9%
Operating RoTE
Share avg. capitalCore Bank
Q3 15
23%
Q3 14
27%Operating RoTE
Share avg. capitalCore Bank
Q3 15
7%
Q3 14
14%
Share avg. capitalCore Bank
20.4%
Operating RoTE
› Strong market presence of mBankin attractive growth market Poland
› Cooperation with Orange Polskafor mobile banking services and strategic partnership with AXA for distribution of insurance products
› Integrated investment banking model, serving C&M, MSB and PC clients
› Almost 90% of C&M revenues generated with direct client business
› Expansion of risk hedging and investment business with institutional customer base
› Continue to focus on core strengths and further optimise efficiency and profitability
8.7%
6Group Investor Relations | Frankfurt am Main | 2 November 2015
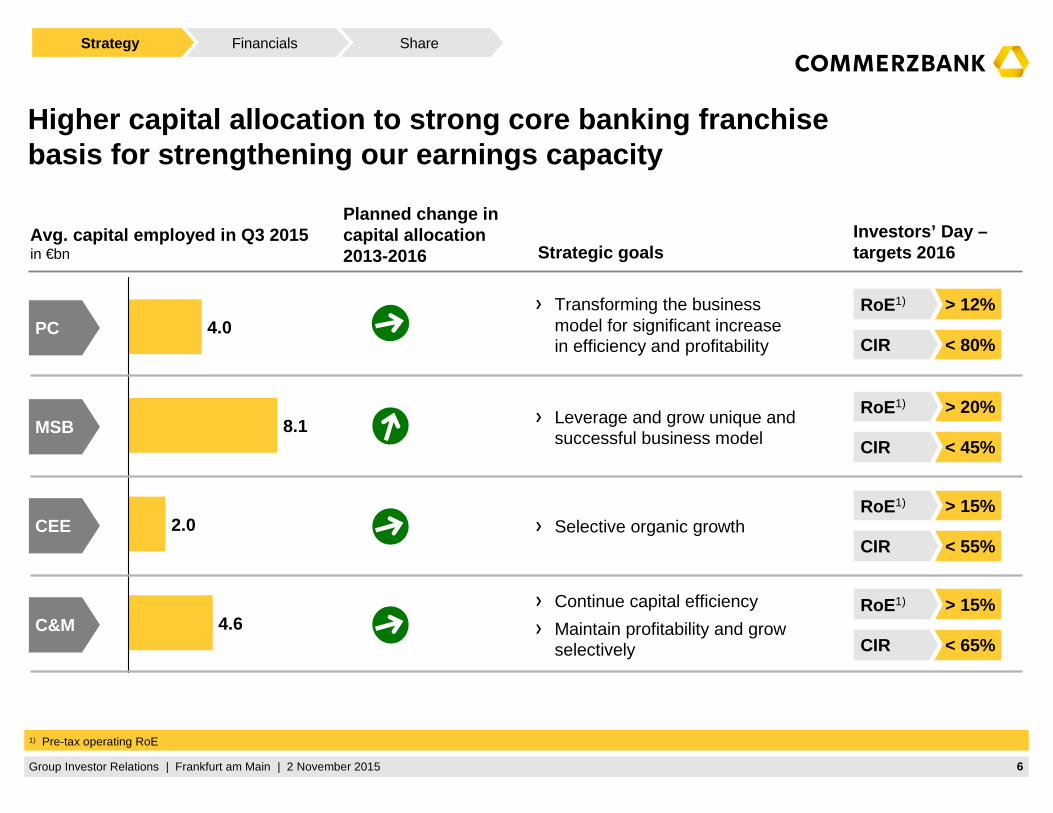
1) Pre-tax operating RoE
Avg. capital employed in Q3 2015in €bn
Planned change in capital allocation2013-2016
Investors’ Day –targets 2016Strategic goals
4.6
4.0
8.1
2.0
Transforming the business model for significant increase in efficiency and profitability
Leverage and grow unique and successful business model
Selective organic growth
Continue capital efficiency
Maintain profitability and grow selectively
> 12%RoE1)
< 80%CIR
> 20%RoE1)
< 45%CIR
> 15%RoE1)
< 55%CIR
> 15%RoE1)
< 65%CIR
PC
MSB
CEE
C&M
Higher capital allocation to strong core banking fr anchise basis for strengthening our earnings capacity
ShareFinancialsStrategy
7Group Investor Relations | Frankfurt am Main | 2 November 2015
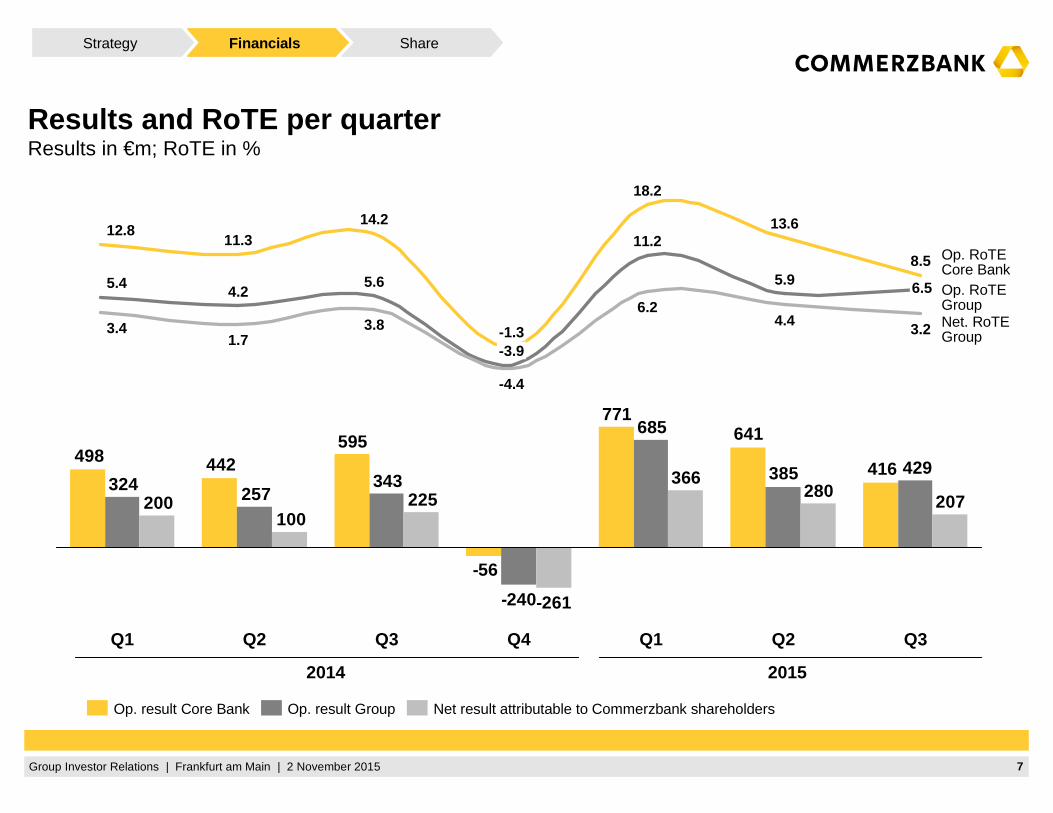
Results and RoTE per quarterResults in €m; RoTE in %
416
641771
-56
595442498
429385
685
-240
343257324
207280
366
-261
225100
200
Q2Q1Q4Q3Q2Q1 Q3
Net result attributable to Commerzbank shareholdersOp. result GroupOp. result Core Bank
ShareFinancialsStrategy
4.4
5.9
13.6
6.2
11.2
18.2
-4.4
-3.9-1.33.8
5.6
14.2
1.7
4.2
11.3
3.4
5.4
12.8
8.5
6.5
3.2
2014 2015
Op. RoTECore BankOp. RoTEGroupNet. RoTEGroup
8Group Investor Relations | Frankfurt am Main | 2 November 2015
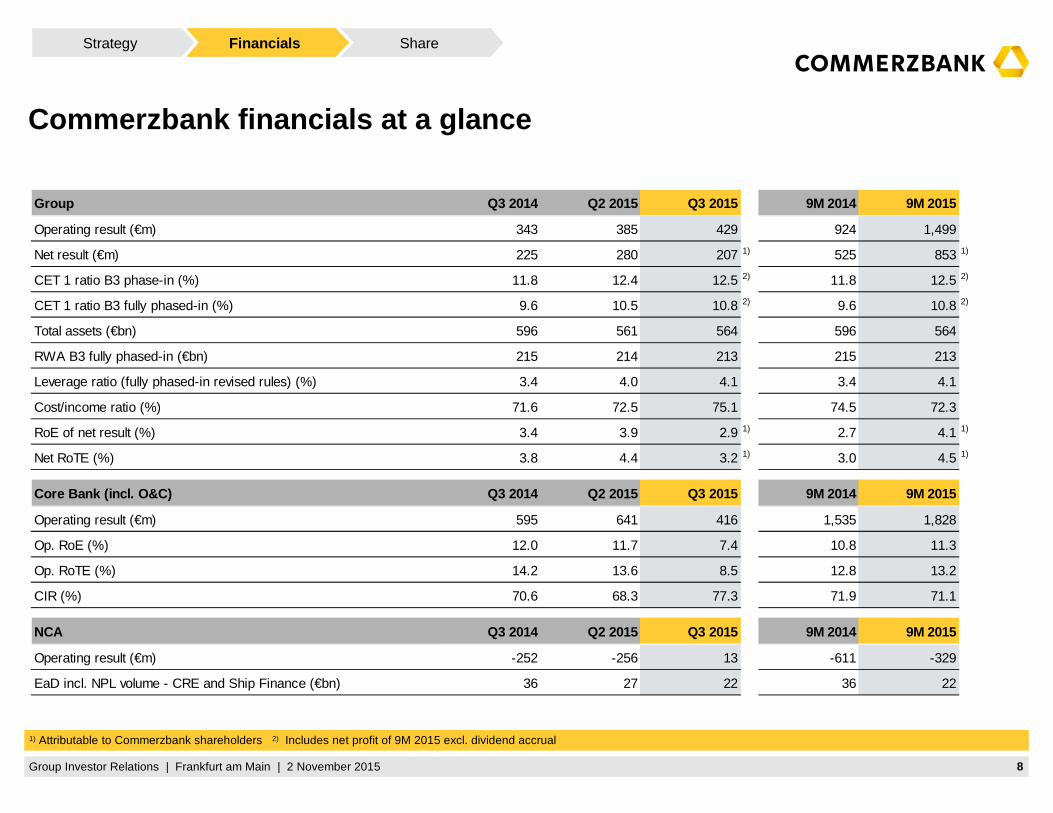
Commerzbank financials at a glance
1) Attributable to Commerzbank shareholders 2) Includes net profit of 9M 2015 excl. dividend accrual
Group Q3 2014 Q2 2015 Q3 2015 9M 2014 9M 2015
Operating result (€m) 343 385 429 924 1,499
Net result (€m) 225 280 207 1) 525 853 1)
CET 1 ratio B3 phase-in (%) 11.8 12.4 12.5 2) 11.8 12.5 2)
CET 1 ratio B3 fully phased-in (%) 9.6 10.5 10.8 2) 9.6 10.8 2)
Total assets (€bn) 596 561 564 596 564
RWA B3 fully phased-in (€bn) 215 214 213 215 213
Leverage ratio (fully phased-in revised rules) (%) 3.4 4.0 4.1 3.4 4.1
Cost/income ratio (%) 71.6 72.5 75.1 74.5 72.3
RoE of net result (%) 3.4 3.9 2.9 1) 2.7 4.1 1)
Net RoTE (%) 3.8 4.4 3.2 1) 3.0 4.5 1)
Core Bank (incl. O&C) Q3 2014 Q2 2015 Q3 2015 9M 2014 9M 2015
Operating result (€m) 595 641 416 1,535 1,828
Op. RoE (%) 12.0 11.7 7.4 10.8 11.3
Op. RoTE (%) 14.2 13.6 8.5 12.8 13.2
CIR (%) 70.6 68.3 77.3 71.9 71.1
NCA Q3 2014 Q2 2015 Q3 2015 9M 2014 9M 2015
Operating result (€m) -252 -256 13 -611 -329
EaD incl. NPL volume - CRE and Ship Finance (€bn) 36 27 22 36 22
ShareFinancialsStrategy
9Group Investor Relations | Frankfurt am Main | 2 November 2015
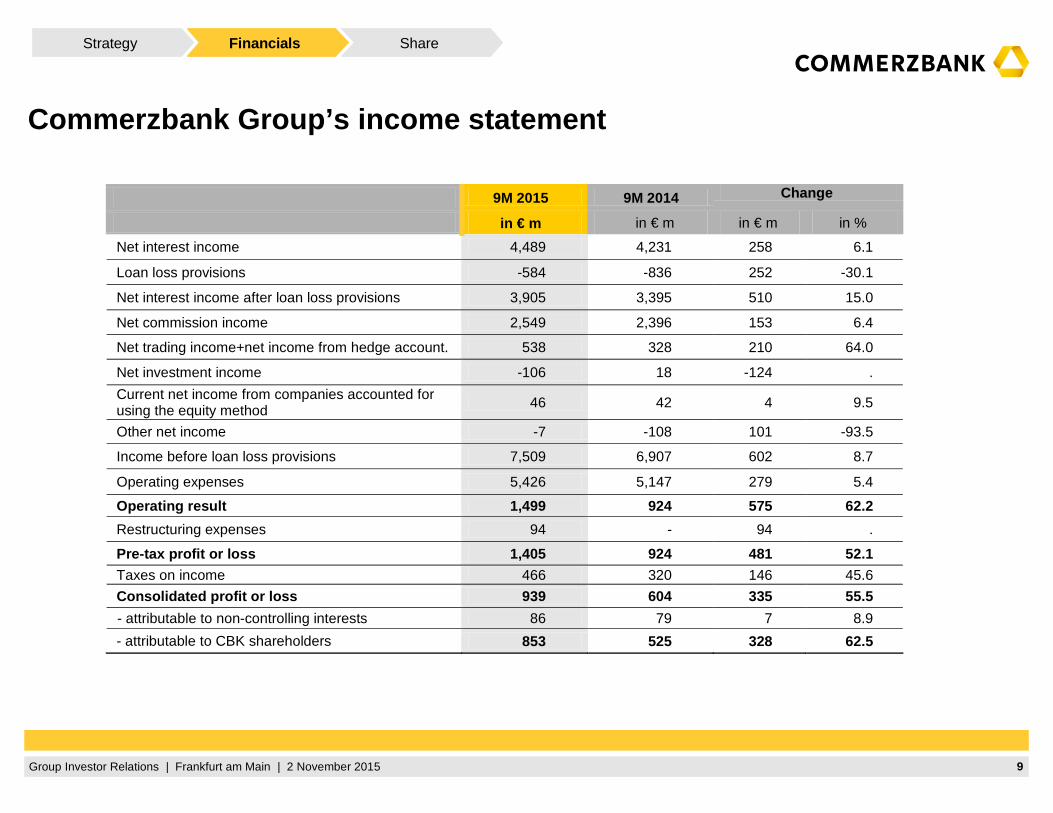
Commerzbank Group’s income statement
9M 2015 9M 2014 Change
in € m in € m in € m in %
Net interest income 4,489 4,231 258 6.1
Loan loss provisions -584 -836 252 -30.1
Net interest income after loan loss provisions 3,905 3,395 510 15.0
Net commission income 2,549 2,396 153 6.4
Net trading income+net income from hedge account. 538 328 210 64.0
Net investment income -106 18 -124 .
Current net income from companies accounted for using the equity method 46 42 4 9.5
Other net income -7 -108 101 -93.5
Income before loan loss provisions 7,509 6,907 602 8.7
Operating expenses 5,426 5,147 279 5.4
Operating result 1,499 924 575 62.2
Restructuring expenses 94 - 94 .
Pre-tax profit or loss 1,405 924 481 52.1
Taxes on income 466 320 146 45.6
Consolidated profit or loss 939 604 335 55.5
- attributable to non-controlling interests 86 79 7 8.9
- attributable to CBK shareholders 853 525 328 62.5
ShareFinancialsStrategy
10Group Investor Relations | Frankfurt am Main | 2 November 2015
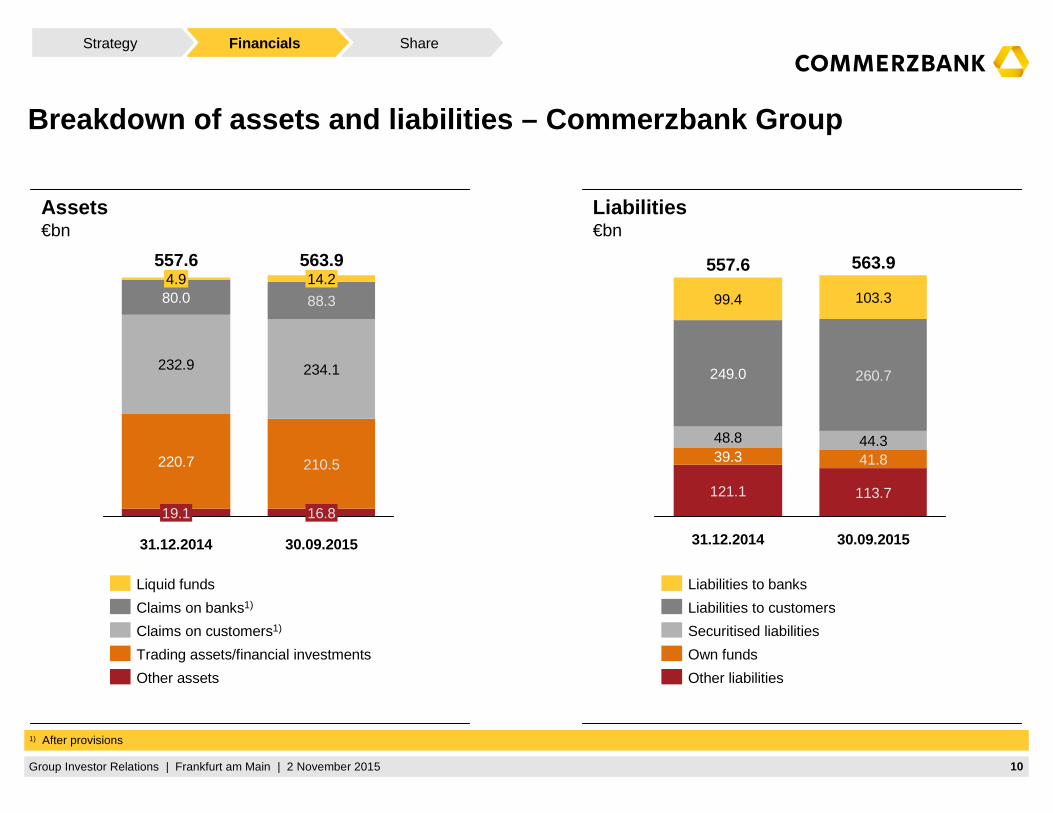
Liabilities€bn
Assets€bn
1) After provisions
ShareFinancialsStrategy
16.8
30.09.2015
14.2563.9
210.5
88.3
234.1
31.12.2014
557.6
19.1
220.7
232.9
80.04.9
Other assets
Trading assets/financial investments
Claims on customers1)
Claims on banks1)
Liquid funds
30.09.2015
563.9
103.3
260.7
41.844.3
113.7
31.12.2014
557.6
121.1
39.348.8
249.0
99.4
Other liabilities
Securitised liabilities
Own funds
Liabilities to customers
Liabilities to banks
Breakdown of assets and liabilities – Commerzbank Group
11Group Investor Relations | Frankfurt am Main | 2 November 2015
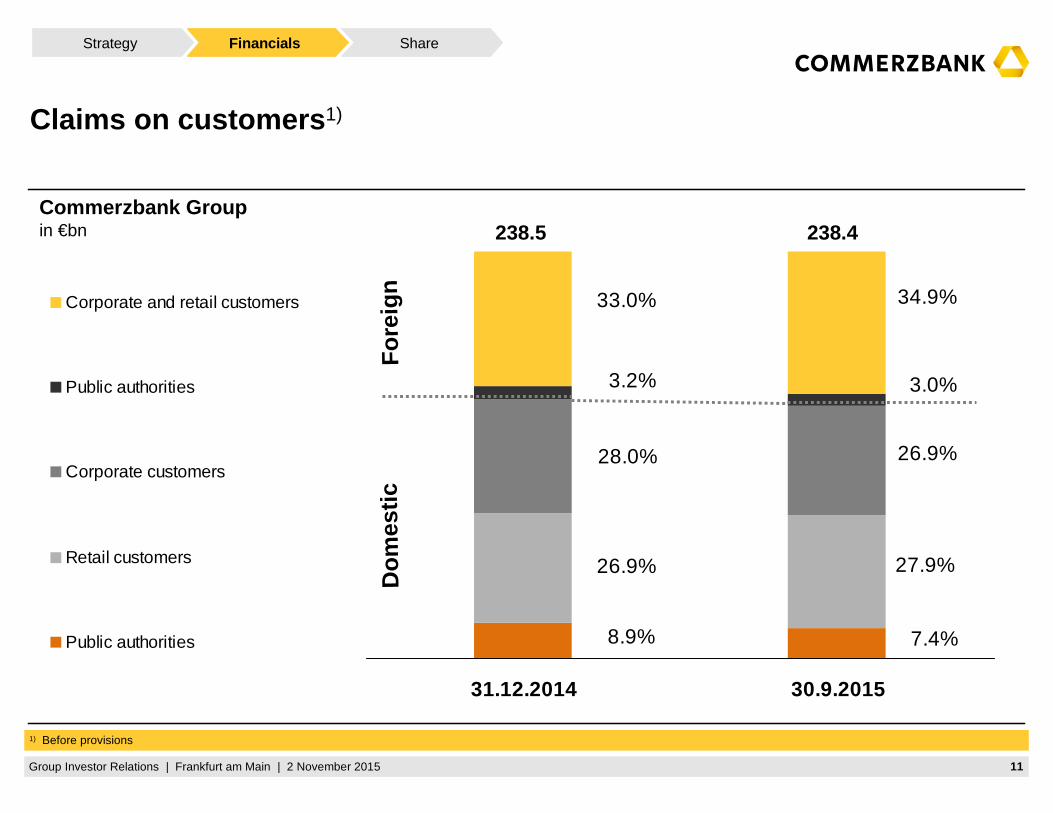
Commerzbank Groupin €bn
Claims on customers 1)
7.4%8.9%
27.9%26.9%
26.9%28.0%
3.0%3.2%
34.9%33.0%
31.12.2014 30.9.2015
Corporate and retail customers
Public authorities
Corporate customers
Retail customers
Public authorities
238.5 238.4
Fo
reig
nD
om
esti
c
1) Before provisions
ShareFinancialsStrategy

12Group Investor Relations | Frankfurt am Main | 2 November 2015
Risk-weighted assets and CET1 ratio
1) Includes net result of 9M 2015
214222
214215217218 213
Q2 2015
10.5
Q1 2015
9.5
Q4 2014
9.3
Q3 2014
9.6
Q2 2014
9.4
Q1 2014
9.0
Q3 2015
10.8
B3 CET1 fully phased-inRisk-weighted assetsB3 fully phased-in
ShareFinancialsStrategy
RWA (Basel III fully phased-in) in €bn; Ratio in %
1)
13Group Investor Relations | Frankfurt am Main | 2 November 2015
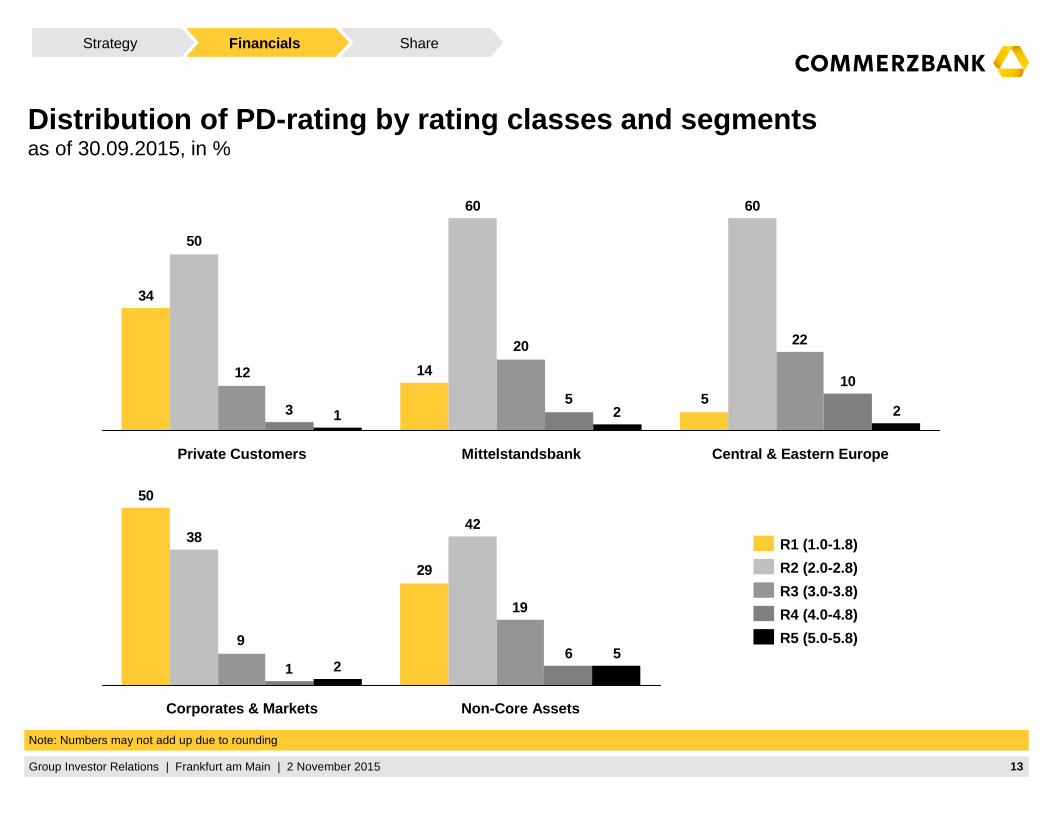
Distribution of PD-rating by rating classes and segmen tsas of 30.09.2015, in %
ShareFinancialsStrategy
5
14
34
6060
50
2220
1210
53 221
Central & Eastern EuropeMittelstandsbankPrivate Customers
29
50
4238
19
96
15
2
Non-Core AssetsCorporates & Markets
R5 (5.0-5.8)
R3 (3.0-3.8)
R4 (4.0-4.8)
R2 (2.0-2.8)
R1 (1.0-1.8)
Note: Numbers may not add up due to rounding
14Group Investor Relations | Frankfurt am Main | 2 November 2015
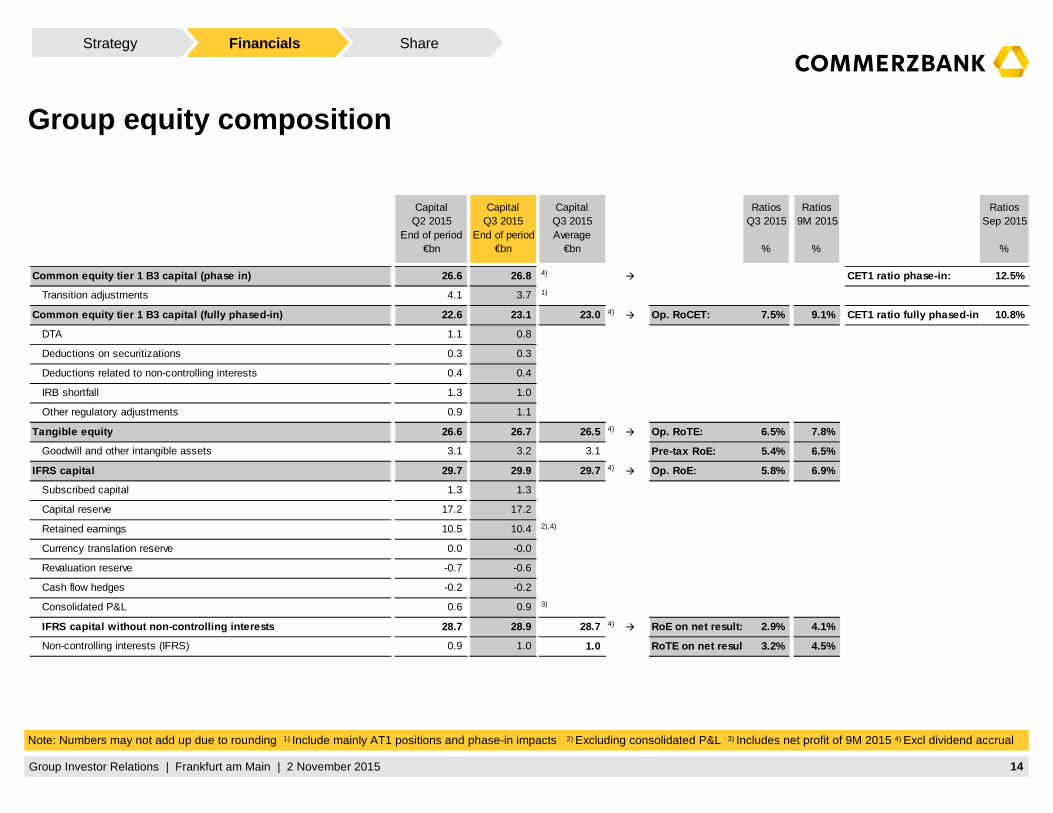
Group equity composition
Note: Numbers may not add up due to rounding 1) Include mainly AT1 positions and phase-in impacts 2) Excluding consolidated P&L 3) Includes net profit of 9M 2015 4) Excl dividend accrual
Capital Capital Capital Ratios Ratios RatiosQ2 2015 Q3 2015 Q3 2015 Q3 2015 9M 2015 Sep 2015
End of period End of period Average€bn €bn €bn % % %
Common equity tier 1 B3 capital (phase in) 26.6 26.8 4)� CET1 ratio phase-in: 12.5%
Transition adjustments 4.1 3.7 1)
Common equity tier 1 B3 capital (fully phased-in) 22 .6 23.1 23.0 4)� Op. RoCET: 7.5% 9.1% CET1 ratio fully phased-in: 10.8%
DTA 1.1 0.8
Deductions on securitizations 0.3 0.3
Deductions related to non-controlling interests 0.4 0.4
IRB shortfall 1.3 1.0
Other regulatory adjustments 0.9 1.1
Tangible equity 26.6 26.7 26.5 4)� Op. RoTE: 6.5% 7.8%
Goodwill and other intangible assets 3.1 3.2 3.1 Pre-tax RoE: 5.4% 6.5%
IFRS capital 29.7 29.9 29.7 4)� Op. RoE: 5.8% 6.9%
Subscribed capital 1.3 1.3
Capital reserve 17.2 17.2
Retained earnings 10.5 10.4 2),4)
Currency translation reserve 0.0 -0.0
Revaluation reserve -0.7 -0.6
Cash flow hedges -0.2 -0.2
Consolidated P&L 0.6 0.9 3)
IFRS capital without non-controlling interests 28.7 28.9 28.7 4)� RoE on net result: 2.9% 4.1%
Non-controlling interests (IFRS) 0.9 1.0 1.0 RoTE on net result: 3.2% 4.5%
ShareFinancialsStrategy
15Group Investor Relations | Frankfurt am Main | 2 November 2015
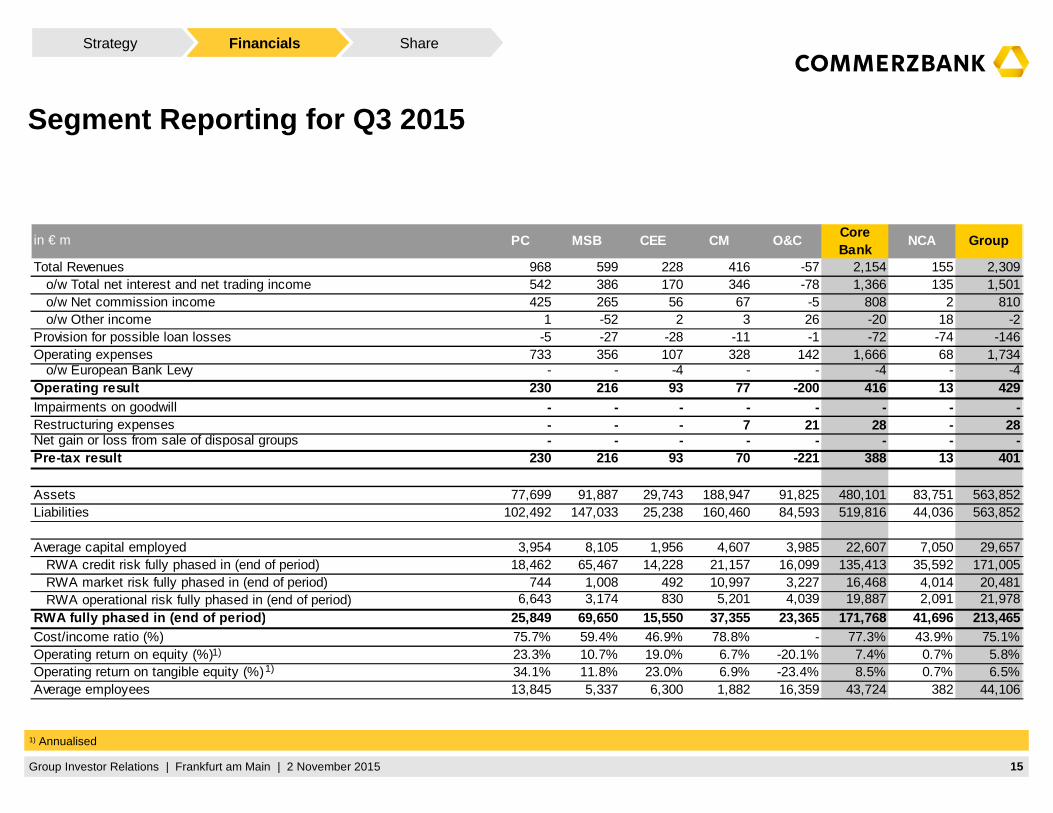
in € m PC MSB CEE CM O&CCoreBank
NCA Group
Total Revenues 968 599 228 416 -57 2,154 155 2,309 o/w Total net interest and net trading income 542 386 170 346 -78 1,366 135 1,501 o/w Net commission income 425 265 56 67 -5 808 2 810 o/w Other income 1 -52 2 3 26 -20 18 -2 Provision for possible loan losses -5 -27 -28 -11 -1 -72 -74 -146 Operating expenses 733 356 107 328 142 1,666 68 1,734 o/w European Bank Levy - - -4 - - -4 - -4 Operating result 230 216 93 77 -200 416 13 429 Impairments on goodwill - - - - - - - - Restructuring expenses - - - 7 21 28 - 28 Net gain or loss from sale of disposal groups - - - - - - - - Pre-tax result 230 216 93 70 -221 388 13 401
Assets 77,699 91,887 29,743 188,947 91,825 480,101 83,751 563,852 Liabilities 102,492 147,033 25,238 160,460 84,593 519,816 44,036 563,852
Average capital employed 3,954 8,105 1,956 4,607 3,985 22,607 7,050 29,657 RWA credit risk fully phased in (end of period) 18,462 65,467 14,228 21,157 16,099 135,413 35,592 171,005 RWA market risk fully phased in (end of period) 744 1,008 492 10,997 3,227 16,468 4,014 20,481 RWA operational risk fully phased in (end of period) 6,643 3,174 830 5,201 4,039 19,887 2,091 21,978
RWA fully phased in (end of period) 25,849 69,650 15,550 37,355 23,365 171,768 41,696 213,465 Cost/income ratio (%) 75.7% 59.4% 46.9% 78.8% - 77.3% 43.9% 75.1% Operating return on equity (%) 23.3% 10.7% 19.0% 6.7% -20.1% 7.4% 0.7% 5.8% Operating return on tangible equity (%) 34.1% 11.8% 23.0% 6.9% -23.4% 8.5% 0.7% 6.5% Average employees 13,845 5,337 6,300 1,882 16,359 43,724 382 44,106
Segment Reporting for Q3 2015
1) Annualised
ShareFinancialsStrategy
1)
1)

16Group Investor Relations | Frankfurt am Main | 2 November 2015
Private Customers
Corporates & Markets Others & Consolidation
Mittelstandsbank Central & Eastern Europe
Non-Core Assets
171161
71120115111
230
Q3 15
Q2 15
Q1 15
Q4 14
Q3 14
Q2 14
Q1 14
293342
252
365269
339
216
Q2 15
Q3 15
Q1 15
Q4 14
Q3 14
Q2 14
Q1 14
64
11689938498 93
Q2 14
Q1 14
Q3 15
Q4 14
Q3 14
Q2 15
Q1 15
184
302
120157185214
77
Q3 15
Q2 15
Q1 15
Q4 14
Q3 14
Q2 14
Q1 14
-71-150
-588
-140-211-264 -200
Q3 15
Q2 15
Q1 15
Q4 14
Q3 14
Q2 14
Q1 14
13
-256
-86-184
-252-185-174
Q3 15
Q1 15
Q2 15
Q4 14
Q3 14
Q2 14
Q1 14
ShareFinancialsStrategy
Operating result by segmentin €m
17Group Investor Relations | Frankfurt am Main | 2 November 2015
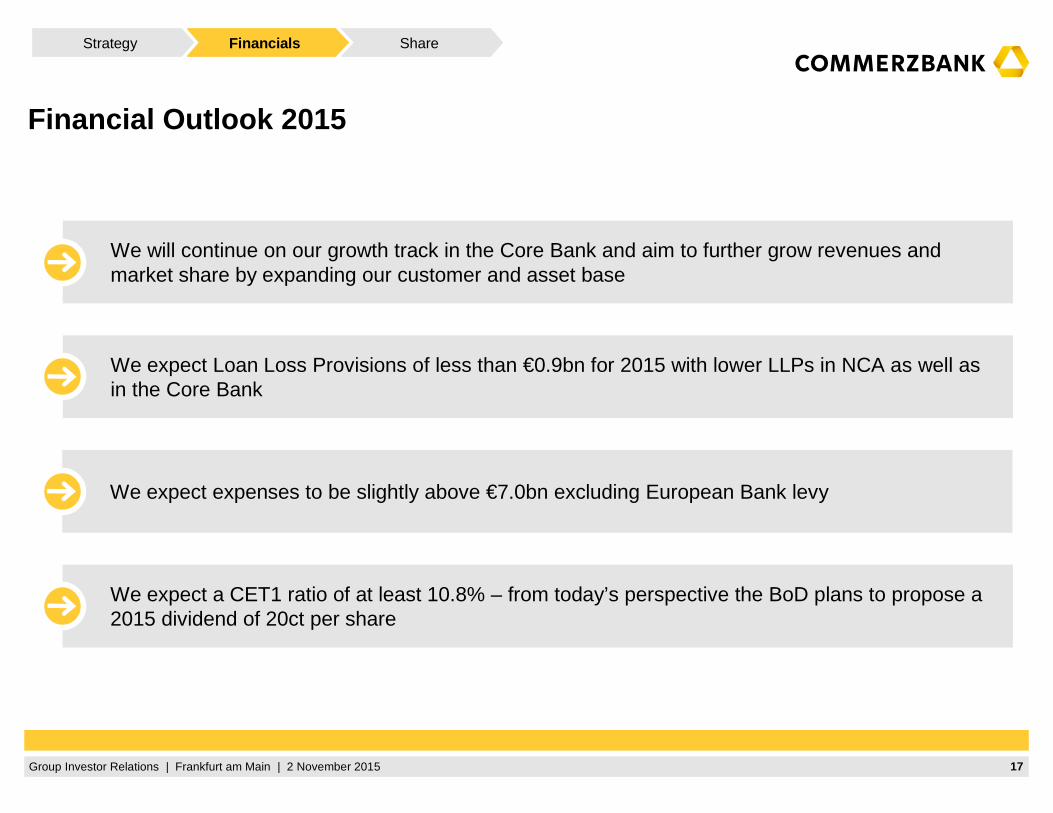
Financial Outlook 2015
We expect a CET1 ratio of at least 10.8% – from today’s perspective the BoD plans to propose a 2015 dividend of 20ct per share
We expect Loan Loss Provisions of less than €0.9bn for 2015 with lower LLPs in NCA as well as in the Core Bank
We expect expenses to be slightly above €7.0bn excluding European Bank levy
We will continue on our growth track in the Core Bank and aim to further grow revenues and market share by expanding our customer and asset base
ShareFinancialsStrategy
18Group Investor Relations | Frankfurt am Main | 2 November 2015
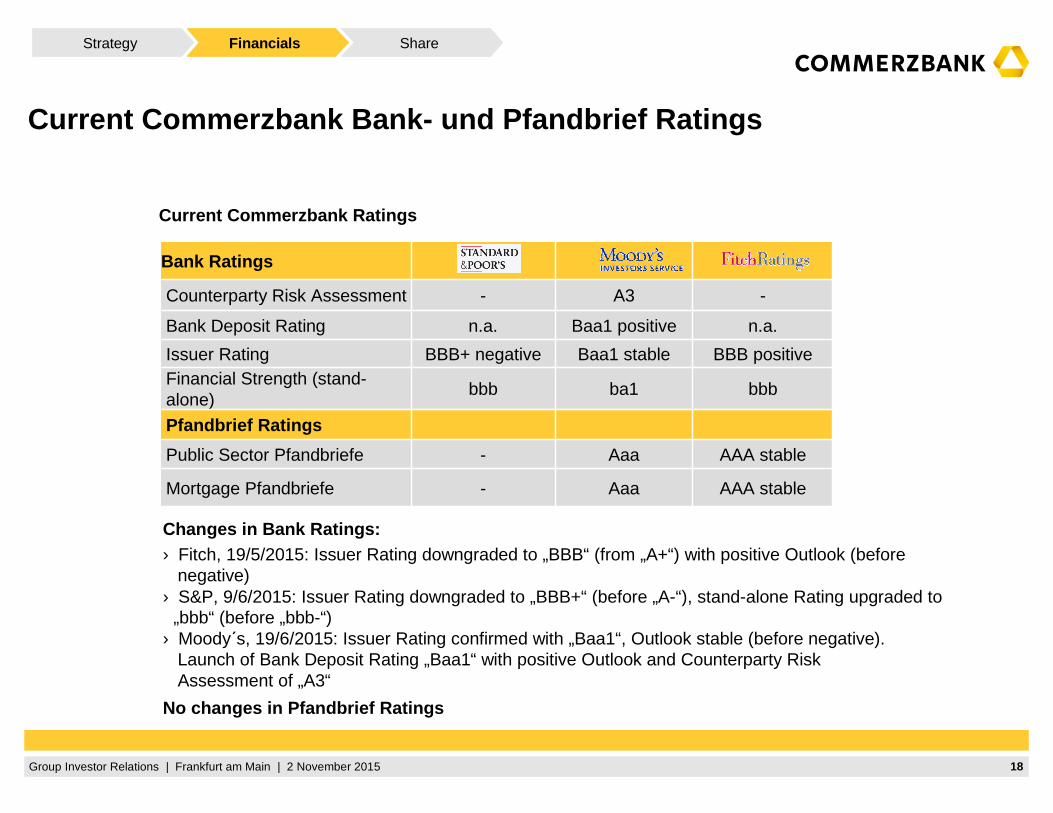
AAA stable
AAA stable
bbb
BBB positive
n.a.
-A3-Counterparty Risk Assessment
Baa1 positiven.a.Bank Deposit Rating
Bank Ratings
Issuer Rating BBB+ negative Baa1 stableFinancial Strength (stand-alone)
bbb ba1
Pfandbrief Ratings
Public Sector Pfandbriefe - Aaa
Mortgage Pfandbriefe - Aaa
Current Commerzbank Ratings
Changes in Bank Ratings:› Fitch, 19/5/2015: Issuer Rating downgraded to „BBB“ (from „A+“) with positive Outlook (before
negative)› S&P, 9/6/2015: Issuer Rating downgraded to „BBB+“ (before „A-“), stand-alone Rating upgraded to
„bbb“ (before „bbb-“)› Moody´s, 19/6/2015: Issuer Rating confirmed with „Baa1“, Outlook stable (before negative).
Launch of Bank Deposit Rating „Baa1“ with positive Outlook and Counterparty RiskAssessment of „A3“
No changes in Pfandbrief Ratings
ShareFinancialsStrategy
Current Commerzbank Bank- und Pfandbrief Ratings
19Group Investor Relations | Frankfurt am Main | 2 November 2015
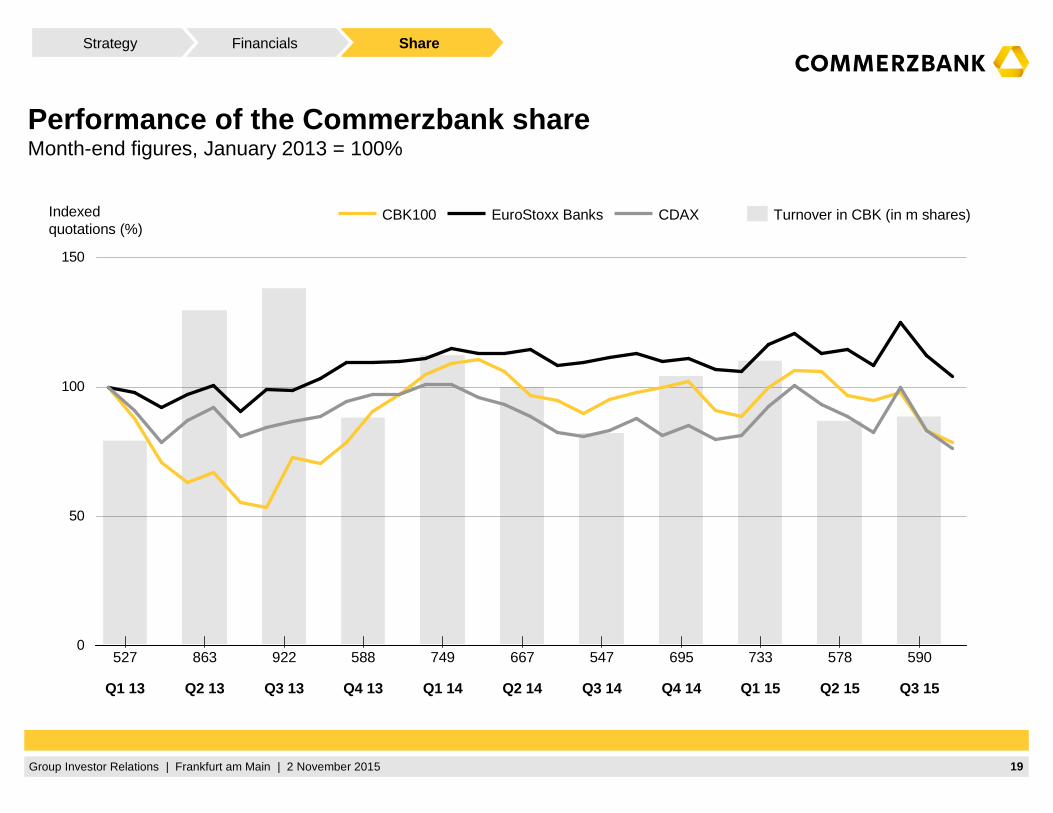
Q2 15
578
Q1 15
733
Q4 14
695
Q3 14
547
Q2 14
667
Q1 14
749
Q4 13
588
Q3 13
922
Q2 13
863
Q1 13
527
Q3 15
5900
50
100
150
Indexedquotations (%)
CDAXEuroStoxx BanksCBK100 Turnover in CBK (in m shares)
ShareFinancialsStrategy
Performance of the Commerzbank shareMonth-end figures, January 2013 = 100%
20Group Investor Relations | Frankfurt am Main | 2 November 2015
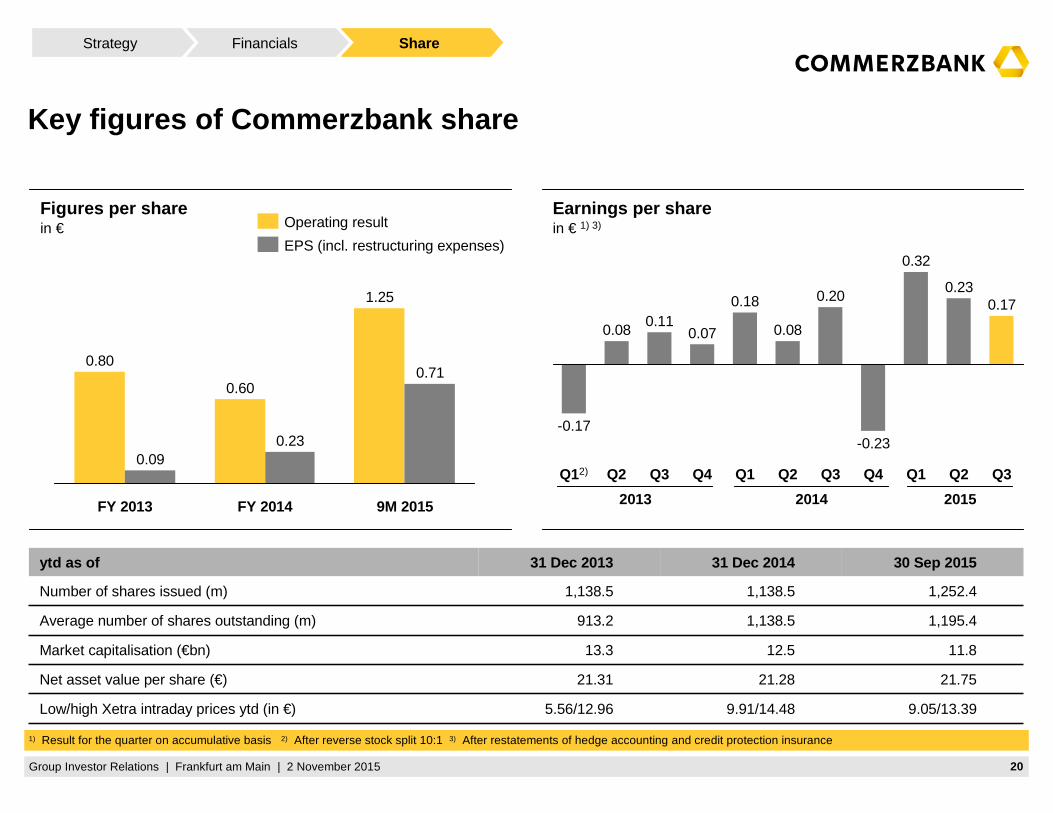
Figures per sharein €
Earnings per sharein € 1) 3)
Key figures of Commerzbank share
ytd as of 31 Dec 2013 31 Dec 2014 30 Sep 2015
Number of shares issued (m) 1,138.5 1,138.5 1,252.4
Average number of shares outstanding (m) 913.2 1,138.5 1,195.4
Market capitalisation (€bn) 13.3 12.5 11.8
Net asset value per share (€) 21.31 21.28 21.75
Low/high Xetra intraday prices ytd (in €) 5.56/12.96 9.91/14.48 9.05/13.39
1) Result for the quarter on accumulative basis 2) After reverse stock split 10:1 3) After restatements of hedge accounting and credit protection insurance
Q3
0.17
Q2
0.23
Q1
0.32
Q4
-0.23
Q3
0.20
Q2
0.08
Q1
0.18
Q4
0.07
Q3
0.11
Q2
0.08
Q12)
-0.17
9M 2015
0.71
1.25
FY 2014
0.23
0.60
FY 2013
0.09
0.80
EPS (incl. restructuring expenses)
Operating result
2013 2014 2015
AktieFinancialsStrategie ShareFinancialsStrategy
21Group Investor Relations | Frankfurt am Main | 2 November 2015
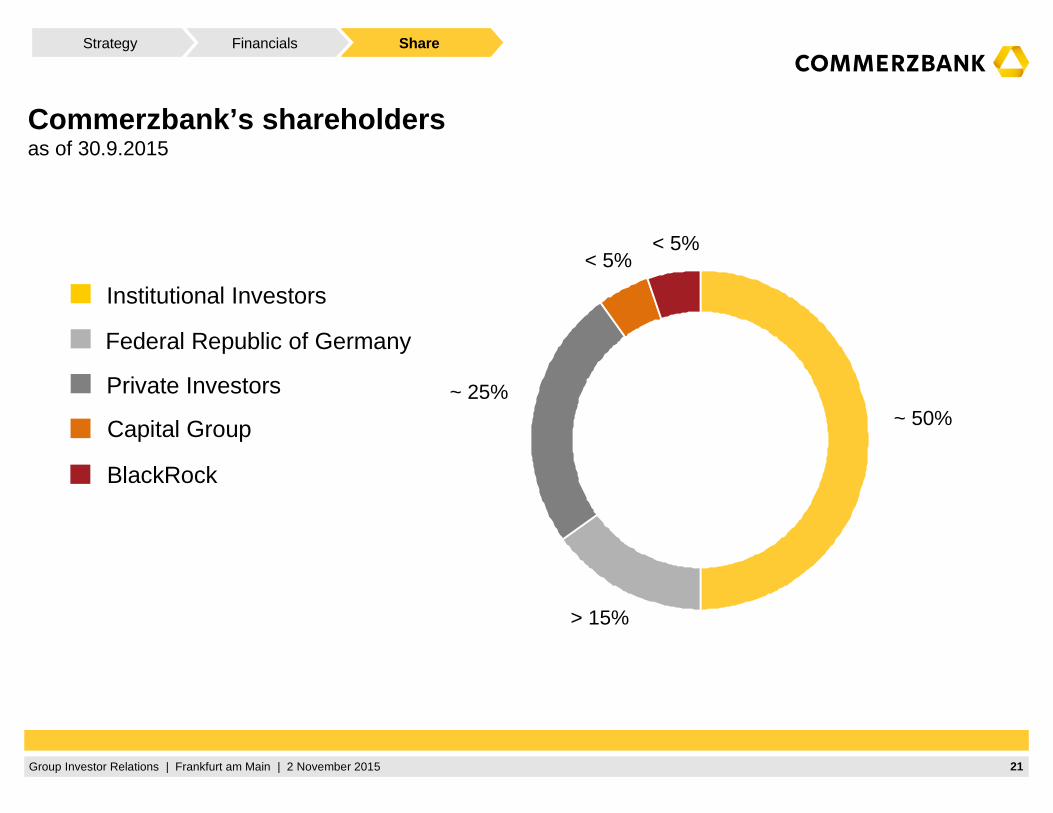
Commerzbank’s shareholdersas of 30.9.2015
Private Investors
Institutional Investors
Federal Republic of Germany
~ 50%
> 15%
~ 25%
< 5%
Capital Group
< 5%
BlackRock
ShareFinancialsStrategy
22Group Investor Relations | Frankfurt am Main | 2 November 2015
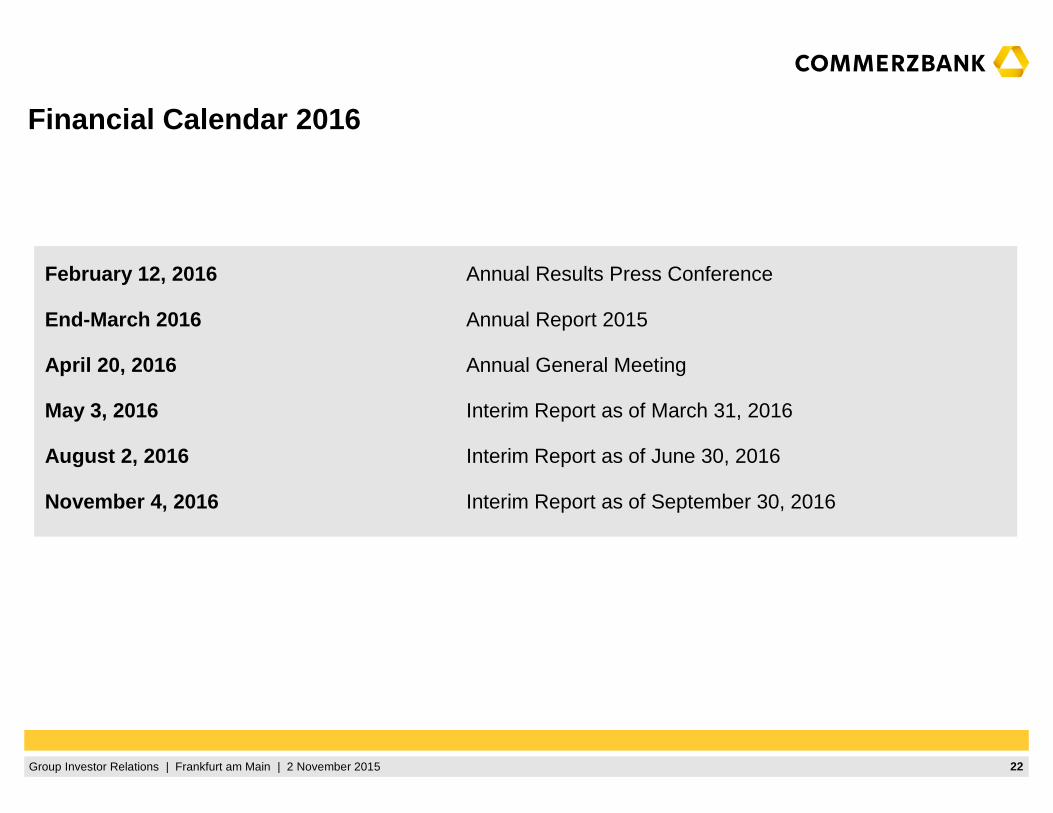
Financial Calendar 2016
February 12, 2016 Annual Results Press Conference
End-March 2016 Annual Report 2015
April 20, 2016 Annual General Meeting
May 3, 2016 Interim Report as of March 31, 2016
August 2, 2016 Interim Report as of June 30, 2016
November 4, 2016 Interim Report as of September 30, 2016

23Group Investor Relations | Frankfurt am Main | 2 November 2015
Disclaimer
Investor Relations
This presentation contains forward-looking statements. Forward-looking statements are statements that are not historical facts; they include, inter alia, statements about Commerzbank’s beliefs and expectations and the assumptions underlying them. These statements are based on plans, estimates, projections and targets as they are currently available to the management of Commerzbank. Forward-looking statements therefore speak only as of the date they are made, and Commerzbank undertakes no obligation to update any of them in light of new information or future events. By their very nature, forward-looking statements involve risks and uncertainties. A number of important factors could therefore cause actual results to differ materially from those contained in any forward-looking statement. Such factors include, among others, the conditions in the financial markets in Germany, in Europe, in the United States and elsewhere from which Commerzbank derives a substantial portion of its revenues and in which it hold a substantial portion of its assets, the development of assetprices and market volatility, potential defaults of borrowers or trading counterparties, the implementation of its strategic initiatives and the reliability of its risk management policies.
In addition, this presentation contains financial and other information which has been derived from publicly available information disclosed by persons other than Commerzbank (“external data”). In particular, external data has been derived from industry and customer-related data and other calculations taken or derived from industry reports published by third parties, market research reports and commercial publications. Commercial publications generally state that the information they contain has originated from sources assumed to be reliable, but that the accuracy and completeness of such information is not guaranteed and that the calculations contained therein are based on a series of assumptions. The external data has not been independently verified by Commerzbank. Therefore, Commerzbank cannot assume any responsibility for the accuracy of the external data taken or derived from public sources.
Copies of this document are available upon request or can be downloaded from https://www.commerzbank.com/en/hauptnavigation/aktionaere/publikationen_und_veranstaltungen/praesentationen_1/index.html
24Group Investor Relations | Frankfurt am Main | 2 November 2015
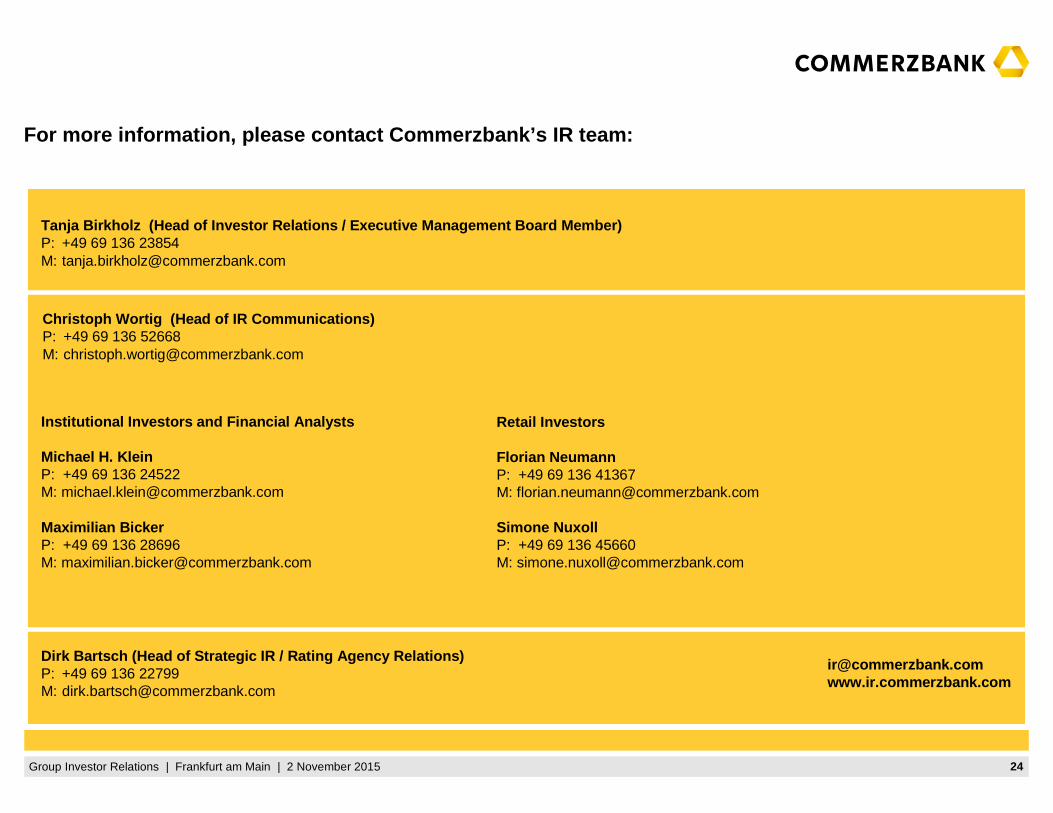
For more information, please contact Commerzbank’s I R team:
Institutional Investors and Financial Analysts
Michael H. KleinP: +49 69 136 24522M: [email protected]
Maximilian BickerP: +49 69 136 28696M: [email protected]
Tanja Birkholz (Head of Investor Relations / Executi ve Management Board Member)P: +49 69 136 23854M: [email protected]
Retail Investors
Florian Neumann P: +49 69 136 41367M: [email protected]
Simone Nuxoll P: +49 69 136 45660M: [email protected]
Dirk Bartsch (Head of Strategic IR / Rating Agency Relations)P: +49 69 136 22799 M: [email protected]
Christoph Wortig (Head of IR Communications)P: +49 69 136 52668M: [email protected]