
Figure: the world’s biggest plant roof-mounted...
156
Figure: the world’s biggest plant roof-mounted photovoltaic power generation facility built by Baosteel
Transcript of Figure: the world’s biggest plant roof-mounted...
Figure: the world’s biggest plant roof-mounted photovoltaic power generation facility built by Baosteel

ONE CHART TO UNDERSTAND THE ANNUAL REPORT
BUSINESS RESULTS
OPERATION HIGHLIGHTS
2015 BUSINESS PLAN
MARKET SHARE OF EACH PRODUCT
EXPORT
RESULTS Best in domestic industryTop 3 in global industry
Ratio in mid- and large-sized steel enterprises’ total output
Ratio in total profit
TotalOperating Revenue
Cold-Rolled Automotive Sheet
Accomplished global debut of new products
Photovoltaic power generation: 39.09 million kwh
“2013-2018 Green Manufacturing andDeveloping Plan” released
Built a green industry chain
Won the recommendation of hazardous substance management system (QC080000) certification of British Standards Institution - an international authoritative certification organization
The body structure of No. 1 blast furnacehas been capped and installation of ancillary facilities of the blast furnace has begun. Zhanjiang No.1 blast furnace is expected tobe ignited in September 2015.
The construction of Baocloud IDC phase III project has started,which will be the biggest single-scale data center in China after completion
Standard & Poor’s , Moody’s and Fitch rated the company A-, A3 and A- respectively, the highest credit ratings in global iron and steel industry, all with “stable” outlooks
E-COMMERCE DEVELOPMENT
CREDIT RATINGS
IT BUSINESS Operating revenue of E-commerce:
RMB 15.1 billion
Up 331% YoY, realizing an
annual trade volume of 4.51 million tons
Entered the stage of steel structure construction & installation and equipment installation.
Million tons sales of newly developed product
“600℃ Ultra-supercritical Thermal Power Unit Steel Tube Innovative Development andApplication” won the first prize of national science and technology progress award
“Development and Industrialization of High-grade Non-oriented Silicon Steel Manufacturing Technology” won the first prize of Shanghai science and technology progress award
“Research and Development of Cold-rolled Hot-dip Aluminizing and Galvanizing Unit Core Technology and Outfit” won the first prize of metallurgical science and technology progress award
“Most Admired Knowledge Enterprise in Asia” for 3 consecutive years
application ratio ofinvention patents hit all-time high
The first-round trial production of new product models was completed successfully and brought to market
STEEL:
Tin-Coated Sheet Oriented Electric Steel
Non-Standard Oil Pipes
Total Profit Earnings Per Share
Net Assets Per Share
America Europe and Africa
Southeast Asia and South Asia
East Asia and Australia
Steel Product Export
RMB 187.79 Billion
RMB 8.28Billion
0.35 Yuan/Share
6.94 Yuan/ Share
2.35 Million Tons
Year-On-Year Increase
346,000 Tons
TECHNOLOGY INNOVATION
ENVIRONMENT FRIENDLY
ZHANJIANGPROJECT
FRUITFUL ACHIEVEMENTS
Steel output: 23.60 million tons Sales of steel products: 22.96 million tons
Total operating revenue: RMB 194 billion Operating cost: RMB 175.7 billion
Maintaining Top 3 worldwide with respect to profit per ton
Note: CAPEX is short for Capital Expenditure, generally referring to investments in capital or fixed assets, intangible assets and deferred assets
Sales of exclusive andleading products: 12 million tons
CAPEX : RMB 24.7 billion Including RMB16 billionfor Zhanjiang Project
CUSTOMERS’ FIRST CHOICE
Zhanjiang

Important Notice
(I) TheBoardofDirectorsand theBoardofSupervisorsofBaoshan Iron&SteelCo.,Ltd. (hereinafter“theCompany”),alongwiththeirdirectors,supervisorsandseniorexecutives,herebyguaranteethattheAnnualReport is free fromfalsestatement,misleadinginformationorgravematerialomission,andassumerelevantseparateandjointresponsibilitiesinregardtothetruth,theaccuracyandtheintegrityofthecontentsoftheReport.
(II) AllmembersoftheBoardofDirectorsoftheCompanyattendedtheboardmeeting.
(III) DeloitteToucheTohmatsuCertifiedPublicAccountantsLLP(specialgeneralpartnership)gavestandardunqualifiedauditreportfortheCompany.
(IV) ChenDerong,ChairmanoftheCompany,ZhuKebing,chiefaccountant,andWangJuan,DirectoroftheFinanceDepartmentinchargeoftheaccountingaffairs,attesttothetruthfulness,correctnessandcompletenessofthefinancialstatementsinthisReport.
(V) ProposedProfitAppropriationPlanandCapitalizingofReversesPlanfortheReportingPeriodReviewedbytheBoardofDirectors
AccordingtotheCompany’spolicythattheannualdividenddistributionshouldnotbelowerthan50%ofthenetprofitintheconsolidatedstatementsattributabletotheshareholdersoftheparentcompanyauditedinthecurrentyear,withthetotalcashdividendnotlessthanRMB2,896,174,530.45in2014.WhereastheCompanyalwaysattachesimportancetorewardingshareholdersandadherestothelong-termcashdividendspolicies,theCompanyintendstoallotthecashdividendatRMB0.18pershare(incl.tax).BasedontheCompany’stotalshareattheendof2014,totalcashdividendtobedistributedwasRMB2,964,784,684.32(incl.tax),accountingfor51.2%ofthenetprofitintheconsolidatedstatementsattributabletotheshareholdersoftheparentcompany.
(VI) RiskDisclosureonforward-lookingStatements
TheproactivefutureplansanddevelopingstrategiesinthisReportdonotconstituteactualpromisestoinvestors.Investorsarekindlyremindedthatinvestmentinvolvesrisks.
(VII) WascapitalfoundintheCompanytobeoccupiedbythecontrollingshareholderanditsrelatedparties?
None
(VIII)WasguaranteefoundintheCompanytobeprovidedinanymannerthatisagainstthestipulateddecision-makingprocedures?
None
Table of ContentsSection I Definitions and Major Risks Warning
Section II Company Profile
Section III Accounting and Financial Highlights
Section IV Board of Directors’ Report
Section V Significant Events
Section VI Change of Shares and Shareholders
Section VII Preferred Stock
Section VIII Directors, Supervisors, Senior Executives and Employees
Section IX Corporate Governance
Section X Internal Control
Section XI Financial Statements
Section XII Documents Available for Reference
002
003
005
007
024
031
036
037
046
048
049
153
Section I Definitions and Major Risks Warning
2
I. Definitions
Abbreviation Specific Meaning
EVI Early Vendor Involvement.
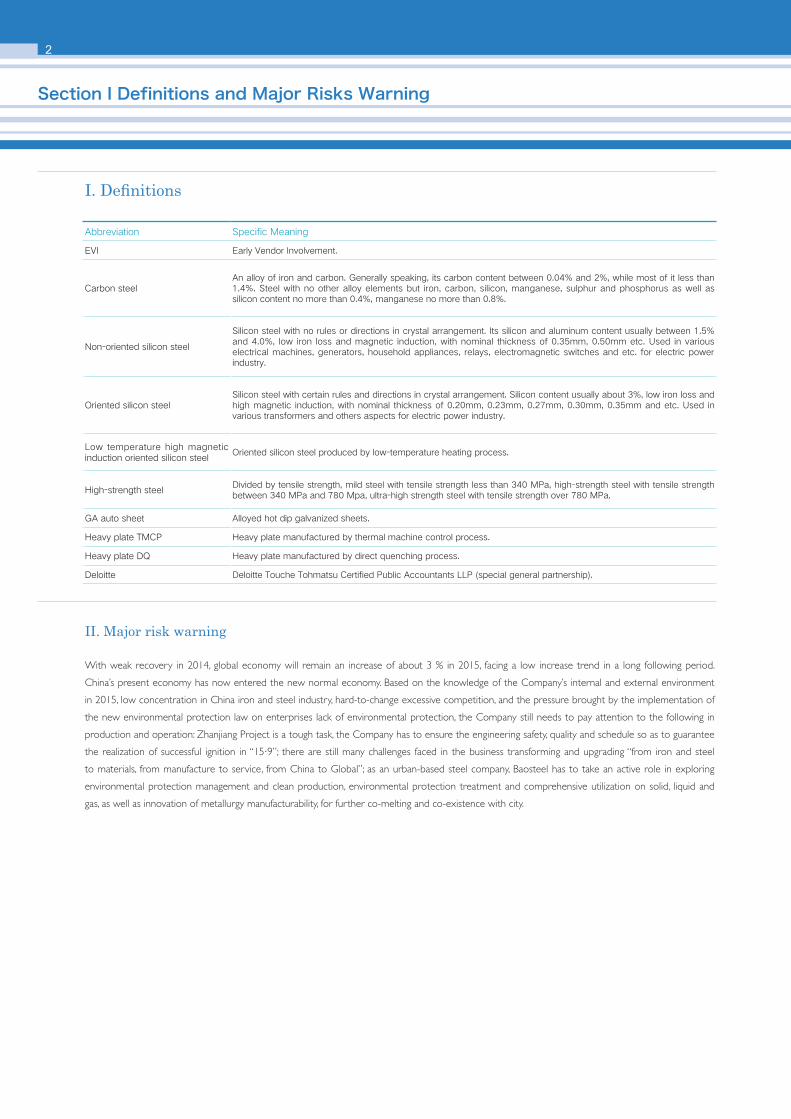
Carbon steelAn alloy of iron and carbon. Generally speaking, its carbon content between 0.04% and 2%, while most of it less than 1.4%. Steel with no other alloy elements but iron, carbon, silicon, manganese, sulphur and phosphorus as well as silicon content no more than 0.4%, manganese no more than 0.8%.
Non-oriented silicon steel
Silicon steel with no rules or directions in crystal arrangement. Its silicon and aluminum content usually between 1.5% and 4.0%, low iron loss and magnetic induction, with nominal thickness of 0.35mm, 0.50mm etc. Used in various electrical machines, generators, household appliances, relays, electromagnetic switches and etc. for electric power industry.
Oriented silicon steelSilicon steel with certain rules and directions in crystal arrangement. Silicon content usually about 3%, low iron loss and high magnetic induction, with nominal thickness of 0.20mm, 0.23mm, 0.27mm, 0.30mm, 0.35mm and etc. Used in various transformers and others aspects for electric power industry.
Low temperature high magnetic induction oriented silicon steel
Oriented silicon steel produced by low-temperature heating process.
High-strength steelDivided by tensile strength, mild steel with tensile strength less than 340 MPa, high-strength steel with tensile strength between 340 MPa and 780 Mpa, ultra-high strength steel with tensile strength over 780 MPa.
GA auto sheet Alloyed hot dip galvanized sheets.
Heavy plate TMCP Heavy plate manufactured by thermal machine control process.
Heavy plate DQ Heavy plate manufactured by direct quenching process.
Deloitte Deloitte Touche Tohmatsu Certified Public Accountants LLP (special general partnership).
II. Major risk warning
With weak recovery in 2014, global economy will remain an increase of about 3 % in 2015, facing a low increase trend in a long following period.
China’s present economy has now entered the new normal economy. Based on the knowledge of the Company’s internal and external environment
in 2015, low concentration in China iron and steel industry, hard-to-change excessive competition, and the pressure brought by the implementation of
the new environmental protection law on enterprises lack of environmental protection, the Company still needs to pay attention to the following in
production and operation: Zhanjiang Project is a tough task, the Company has to ensure the engineering safety, quality and schedule so as to guarantee
the realization of successful ignition in “15·9”; there are still many challenges faced in the business transforming and upgrading “from iron and steel
to materials, from manufacture to service, from China to Global”; as an urban-based steel company, Baosteel has to take an active role in exploring
environmental protection management and clean production, environmental protection treatment and comprehensive utilization on solid, liquid and
gas, as well as innovation of metallurgy manufacturability, for further co-melting and co-existence with city.
I. Company profile
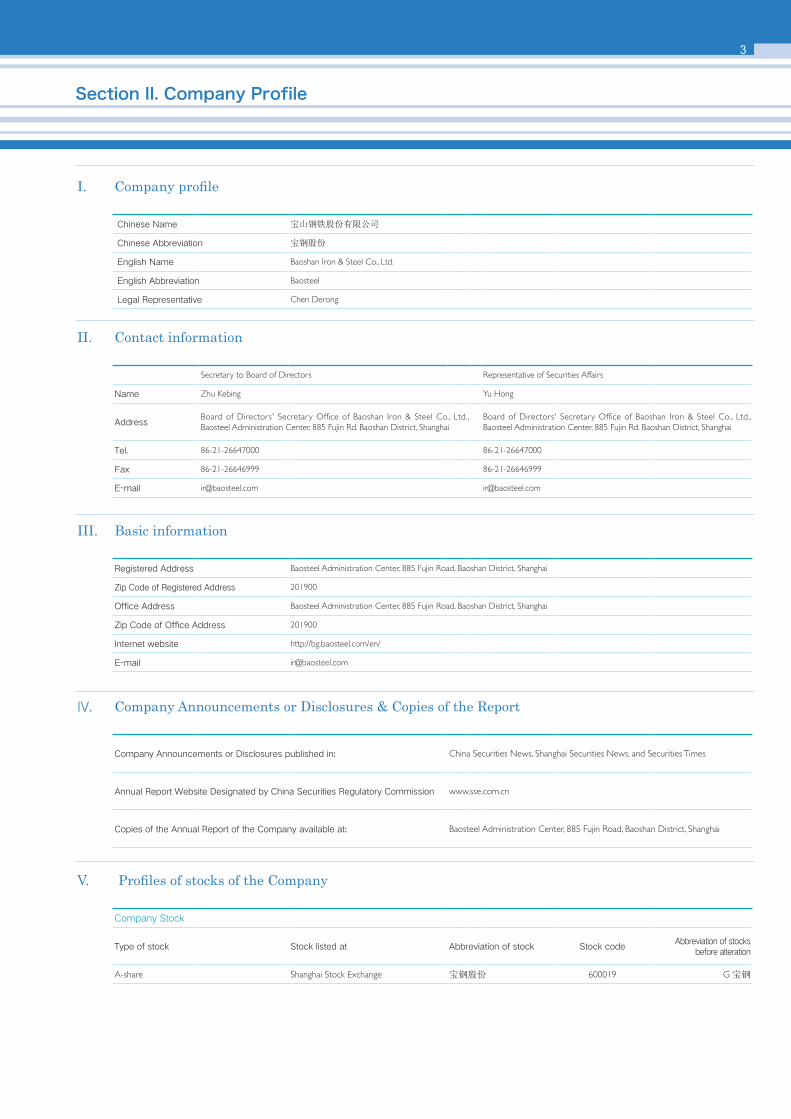
Chinese Name 宝山钢铁股份有限公司
Chinese Abbreviation 宝钢股份
English Name Baoshan Iron & Steel Co., Ltd.
English Abbreviation Baosteel
Legal Representative Chen Derong
II. Contact information
Secretary to Board of Directors Representative of Securities Affairs
Name Zhu Kebing Yu Hong
AddressBoard of Directors' Secretary Office of Baoshan Iron & Steel Co., Ltd., Baosteel Administration Center, 885 Fujin Rd. Baoshan District, Shanghai
Board of Directors' Secretary Office of Baoshan Iron & Steel Co., Ltd., Baosteel Administration Center, 885 Fujin Rd. Baoshan District, Shanghai
Tel. 86-21-26647000 86-21-26647000
Fax 86-21-26646999 86-21-26646999
E-mail [email protected] [email protected]
III. Basic information
Registered Address Baosteel Administration Center, 885 Fujin Road, Baoshan District, Shanghai
Zip Code of Registered Address 201900
Office Address Baosteel Administration Center, 885 Fujin Road, Baoshan District, Shanghai
Zip Code of Office Address 201900
Internet website http://bg.baosteel.com/en/
E-mail [email protected]
IV. Company Announcements or Disclosures & Copies of the Report
Company Announcements or Disclosures published in: China Securities News, Shanghai Securities News, and Securities Times
Annual Report Website Designated by China Securities Regulatory Commission www.sse.com.cn
Copies of the Annual Report of the Company available at: Baosteel Administration Center, 885 Fujin Road, Baoshan District, Shanghai
V. Profiles of stocks of the Company
Company Stock
Type of stock Stock listed at Abbreviation of stock Stock codeAbbreviation of stocks
before alteration
A-share Shanghai Stock Exchange 宝钢股份 600019 G 宝钢
Section II. Company Profile
3

Section II. Company Profile
4
VI. Changes of Registration of the Company during the Reporting Period
(I) Basic informationDate of registration December 1, 2014
Place of registration Shanghai
Registration number of Business License 310000000074519
Tax registration number 310113631696382
Organization code 63169638-2
(II) Company’s initial incorporation
Please refer to “IX. Other Information of the Company” in the Company’s 2000 Annual Report for information detail of the Company’s initial incorporation.
(III) Changes of its major business since listing
The Company specializes in iron and steel industry. Starting from 2005, it has been involved in more sectors including trading, shipping, coal chemical industry and information service and so on.
(IV) Changes of controlling shareholders since listing
In 2000 when the Company was first listed, the controlling shareholder is “Shanghai Baosteel Group Corporation”. In October 2005, it was changed to “Baosteel Group Corporation”.
VII. Other relevant information
Accounting Firm (Mainland China)
Name Deloitte Touche Tohmatsu Certified Public Accountants LLP
Office address 30th Floor, Bund Center, 222 East Yan An Rd, Shanghai, China (200002)
Signing Accountants Zhu Xiaolan, Jiang Jian
VIII. Others
None
I. Key data
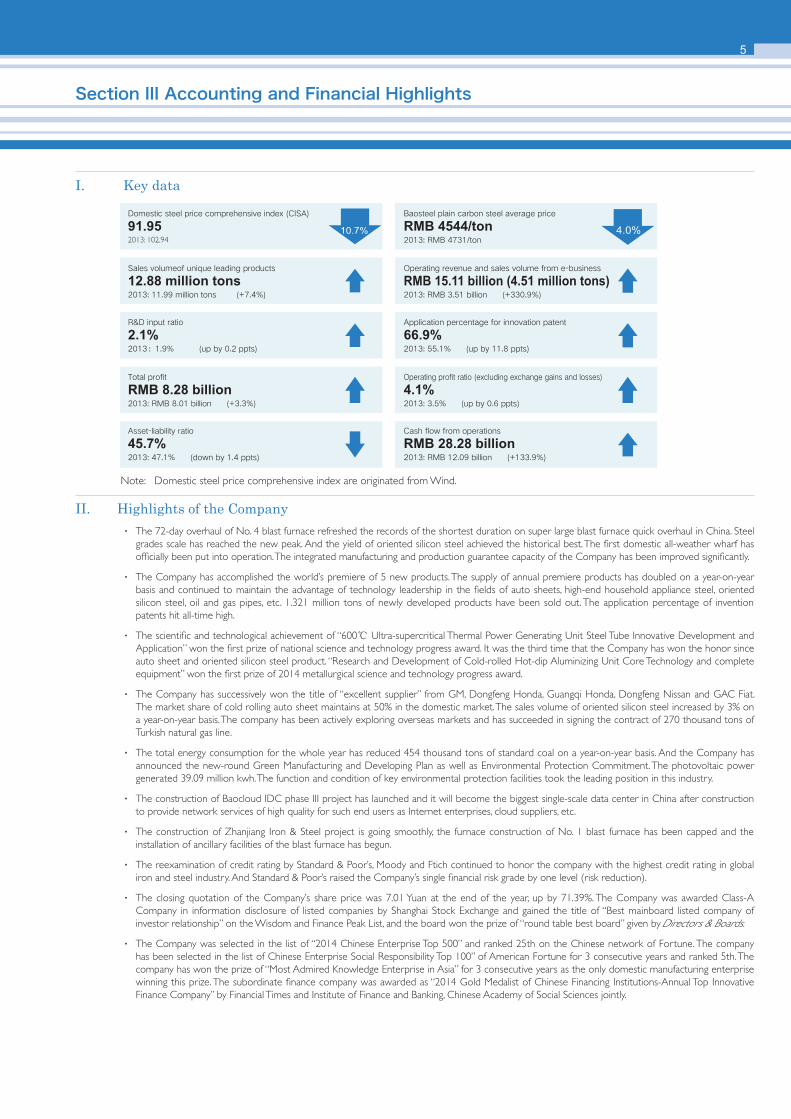
Note: Domestic steel price comprehensive index are originated from Wind.
II. Highlights of the Company· The 72-day overhaul of No. 4 blast furnace refreshed the records of the shortest duration on super large blast furnace quick overhaul in China. Steel
grades scale has reached the new peak. And the yield of oriented silicon steel achieved the historical best. The first domestic all-weather wharf has officially been put into operation. The integrated manufacturing and production guarantee capacity of the Company has been improved significantly.
· The Company has accomplished the world’s premiere of 5 new products. The supply of annual premiere products has doubled on a year-on-year basis and continued to maintain the advantage of technology leadership in the fields of auto sheets, high-end household appliance steel, oriented silicon steel, oil and gas pipes, etc. 1.321 million tons of newly developed products have been sold out. The application percentage of invention patents hit all-time high.
· The scientific and technological achievement of “600℃ Ultra-supercritical Thermal Power Generating Unit Steel Tube Innovative Development and Application” won the first prize of national science and technology progress award. It was the third time that the Company has won the honor since auto sheet and oriented silicon steel product. “Research and Development of Cold-rolled Hot-dip Aluminizing Unit Core Technology and complete equipment” won the first prize of 2014 metallurgical science and technology progress award.
· The Company has successively won the title of “excellent supplier” from GM, Dongfeng Honda, Guangqi Honda, Dongfeng Nissan and GAC Fiat. The market share of cold rolling auto sheet maintains at 50% in the domestic market. The sales volume of oriented silicon steel increased by 3% on a year-on-year basis. The company has been actively exploring overseas markets and has succeeded in signing the contract of 270 thousand tons of Turkish natural gas line.
· The total energy consumption for the whole year has reduced 454 thousand tons of standard coal on a year-on-year basis. And the Company has announced the new-round Green Manufacturing and Developing Plan as well as Environmental Protection Commitment. The photovoltaic power generated 39.09 million kwh. The function and condition of key environmental protection facilities took the leading position in this industry.
· The construction of Baocloud IDC phase III project has launched and it will become the biggest single-scale data center in China after construction to provide network services of high quality for such end users as Internet enterprises, cloud suppliers, etc.
· The construction of Zhanjiang Iron & Steel project is going smoothly, the furnace construction of No. 1 blast furnace has been capped and the installation of ancillary facilities of the blast furnace has begun.
· The reexamination of credit rating by Standard & Poor’s, Moody and Ftich continued to honor the company with the highest credit rating in global iron and steel industry. And Standard & Poor’s raised the Company’s single financial risk grade by one level (risk reduction).
· The closing quotation of the Company’s share price was 7.01 Yuan at the end of the year, up by 71.39%. The Company was awarded Class-A Company in information disclosure of listed companies by Shanghai Stock Exchange and gained the title of “Best mainboard listed company of investor relationship” on the Wisdom and Finance Peak List, and the board won the prize of “round table best board” given by Directors & Boards.
· The Company was selected in the list of “2014 Chinese Enterprise Top 500” and ranked 25th on the Chinese network of Fortune. The company has been selected in the list of Chinese Enterprise Social Responsibility Top 100” of American Fortune for 3 consecutive years and ranked 5th. The company has won the prize of “Most Admired Knowledge Enterprise in Asia” for 3 consecutive years as the only domestic manufacturing enterprise winning this prize. The subordinate finance company was awarded as “2014 Gold Medalist of Chinese Financing Institutions-Annual Top Innovative Finance Company” by Financial Times and Institute of Finance and Banking, Chinese Academy of Social Sciences jointly.
Section III Accounting and Financial Highlights
5
10.7% 4.0%
Domestic steel price comprehensive index (CISA)
91.952013: 102.94
Baosteel plain carbon steel average price
RMB 4544/ton2013: RMB 4731/ton
Sales volumeof unique leading products
12.88 million tons2013: 11.99 million tons (+7.4%)
Operating revenue and sales volume from e-business
RMB 15.11 billion (4.51 million tons)2013: RMB 3.51 billion (+330.9%)
R&D input ratio
2.1%2013:1.9% (up by 0.2 ppts)
Application percentage for innovation patent
66.9%2013: 55.1% (up by 11.8 ppts)
Total profit
RMB 8.28 billion2013: RMB 8.01 billion (+3.3%)
Operating profit ratio (excluding exchange gains and losses)
4.1%2013: 3.5% (up by 0.6 ppts)
Asset-liability ratio
45.7%2013: 47.1% (down by 1.4 ppts)
Cash flow from operations
RMB 28.28 billion2013: RMB 12.09 billion (+133.9%)

III. Major accounting data and financial indicators of the Company for the latest three years
(I) Major accounting data
Section III Accounting and Financial Highlights
6
Unit: RMB Million
(II) Major financial data
IV. Non-recurring Gains and Losses
Non-recurring Gains and Losses Items 2014 2013 2012
Profits and losses arising from disposal of non-current assets 46 -108 9,577
Government subsidy calculated in current gains and losses, except closely related to normal operating activities, consecutive ration and quantitation government subsidy in lines with national policies, rules and certain standards
637 410 716
Gains and losses from change of fair value for holding trading financial assets and liabilities, investment income by the disposal of trading financial assets and liabilities, and available-for-sale financial assets, except effective hedging operations related to the Company normal operation business
26 12 19
Other gains and losses items in lines with the definition of non-recurring gains and losses items (other non-current assets depreciation reserves)
-538 -975 -2,645
Other net non-operating income and expenditure other than the above items -46 28 -72
Effect of income tax -121 163 -1,895
Effect of minority interest -6 -32 -27
Total -2 -502 5,673
Major Accounting Data 20142013 After
restatement2013 Before restatement
Increase or Decrease (%) over the Same Period of
Last Year
2012After restatement
2012Before restatement
Operating revenue 187,414 189,688 189,688 -1.2 191,135 191,135
Net profit attributable to shareholders of listed company
5,792 5,818 5,818 -0.45 10,090 10,090
Net profit attributable to shareholders of the listed Company less non-recurring gains and losses
5,794 6,321 6,321 -8.33 4,416 4,416
Net cash flows from operating activities 28,280 12,090 12,090 133.91 22,186 22,186
Total profit 8,278 8,010 8,010 3.3 12,664 12,664
Major Financial Indicators 20142013 After
restatement2013 Before restatement
Increase or Decrease (%) over the Same Period of Last Year
2012After restatement
2012Before restatement
Basic earnings per share(Yuan/share) 0.35 0.35 0.35 0.94 0.58 0.58
Diluted earnings per share(Yuan/share) 0.35 0.35 0.35 0.94 0.58 0.58
Basic earnings per share less non-recurring gains and losses(Yuan/share)
0.35 0.38 0.38 -7.05 0.25 0.25
Weighted average return-on-equity(%) 5.16 5.29 5.29 Down by 0.13 ppts 8.77 8.77
Weighted average return-on-equity less non-recurring gains and losses (%)
5.17 5.75 5.75 Down by 0.58 ppts 3.84 3.84
Major Accounting DataThe end of 2014
2013 After restatement
2013 Before restatement
Increase or Decrease (%) over the Same Period of
Last Year
2012After restatement
2012Before restatement
Net assets attributable to shareholders of listed company
114,258 110,413 110,512 3.48 110,667 110,766
Total assets 228,653 226,704 226,668 0.86 220,912 220,876
√Applicable □ Not applicable Unit: RMB Million
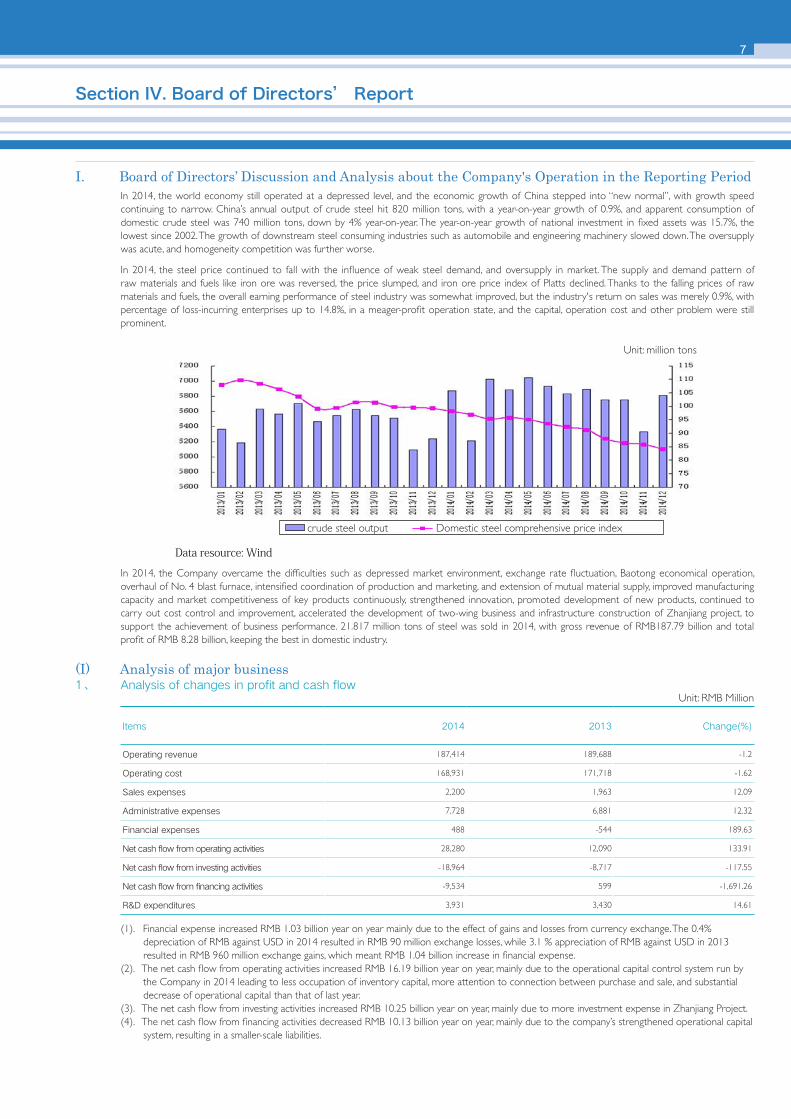
I. Board of Directors’ Discussion and Analysis about the Company's Operation in the Reporting PeriodIn 2014, the world economy still operated at a depressed level, and the economic growth of China stepped into “new normal”, with growth speed continuing to narrow. China’s annual output of crude steel hit 820 million tons, with a year-on-year growth of 0.9%, and apparent consumption of domestic crude steel was 740 million tons, down by 4% year-on-year. The year-on-year growth of national investment in fixed assets was 15.7%, the lowest since 2002. The growth of downstream steel consuming industries such as automobile and engineering machinery slowed down. The oversupply was acute, and homogeneity competition was further worse.
In 2014, the steel price continued to fall with the influence of weak steel demand, and oversupply in market. The supply and demand pattern of raw materials and fuels like iron ore was reversed, the price slumped, and iron ore price index of Platts declined. Thanks to the falling prices of raw materials and fuels, the overall earning performance of steel industry was somewhat improved, but the industry's return on sales was merely 0.9%, with percentage of loss-incurring enterprises up to 14.8%, in a meager-profit operation state, and the capital, operation cost and other problem were still prominent.
Data resource: Wind
In 2014, the Company overcame the difficulties such as depressed market environment, exchange rate fluctuation, Baotong economical operation, overhaul of No. 4 blast furnace, intensified coordination of production and marketing, and extension of mutual material supply, improved manufacturing capacity and market competitiveness of key products continuously, strengthened innovation, promoted development of new products, continued to carry out cost control and improvement, accelerated the development of two-wing business and infrastructure construction of Zhanjiang project, to support the achievement of business performance. 21.817 million tons of steel was sold in 2014, with gross revenue of RMB187.79 billion and total profit of RMB 8.28 billion, keeping the best in domestic industry.
Section IV. Board of Directors’ Report
7
Unit: million tons
(I) Analysis of major business1、 Analysis of changes in profit and cash flow
(1). Financial expense increased RMB 1.03 billion year on year mainly due to the effect of gains and losses from currency exchange. The 0.4% depreciation of RMB against USD in 2014 resulted in RMB 90 million exchange losses, while 3.1 % appreciation of RMB against USD in 2013 resulted in RMB 960 million exchange gains, which meant RMB 1.04 billion increase in financial expense.
(2). The net cash flow from operating activities increased RMB 16.19 billion year on year, mainly due to the operational capital control system run by the Company in 2014 leading to less occupation of inventory capital, more attention to connection between purchase and sale, and substantial decrease of operational capital than that of last year.
(3). The net cash flow from investing activities increased RMB 10.25 billion year on year, mainly due to more investment expense in Zhanjiang Project.(4). The net cash flow from financing activities decreased RMB 10.13 billion year on year, mainly due to the company’s strengthened operational capital
system, resulting in a smaller-scale liabilities.
Items 2014 2013 Change(%)
Operating revenue 187,414 189,688 -1.2
Operating cost 168,931 171,718 -1.62
Sales expenses 2,200 1,963 12.09
Administrative expenses 7,728 6,881 12.32
Financial expenses 488 -544 189.63
Net cash flow from operating activities 28,280 12,090 133.91
Net cash flow from investing activities -18,964 -8,717 -117.55
Net cash flow from financing activities -9,534 599 -1,691.26
R&D expenditures 3,931 3,430 14.61
Unit: RMB Million
crude steel output Domestic steel comprehensive price index
Section IV. Board of Directors’ Report
8
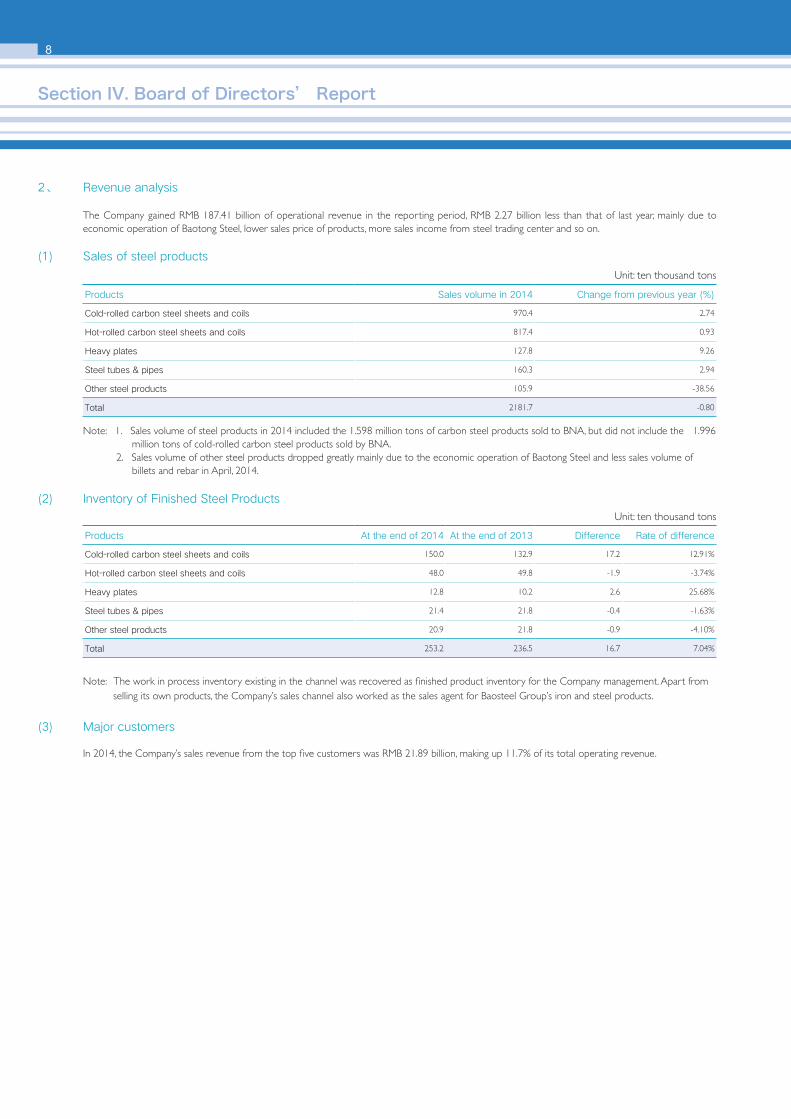
2、 Revenue analysis
The Company gained RMB 187.41 billion of operational revenue in the reporting period, RMB 2.27 billion less than that of last year, mainly due to economic operation of Baotong Steel, lower sales price of products, more sales income from steel trading center and so on.
(1) Sales of steel products
Note: 1. Sales volume of steel products in 2014 included the 1.598 million tons of carbon steel products sold to BNA, but did not include the 1.996 million tons of cold-rolled carbon steel products sold by BNA.
2. Sales volume of other steel products dropped greatly mainly due to the economic operation of Baotong Steel and less sales volume of billets and rebar in April, 2014.
(2) Inventory of Finished Steel Products
(3) Major customers
In 2014, the Company’s sales revenue from the top five customers was RMB 21.89 billion, making up 11.7% of its total operating revenue.
Products Sales volume in 2014 Change from previous year (%)
Cold-rolled carbon steel sheets and coils 970.4 2.74
Hot-rolled carbon steel sheets and coils 817.4 0.93
Heavy plates 127.8 9.26
Steel tubes & pipes 160.3 2.94
Other steel products 105.9 -38.56
Total 2181.7 -0.80
Products At the end of 2014 At the end of 2013 Difference Rate of difference
Cold-rolled carbon steel sheets and coils 150.0 132.9 17.2 12.91%
Hot-rolled carbon steel sheets and coils 48.0 49.8 -1.9 -3.74%
Heavy plates 12.8 10.2 2.6 25.68%
Steel tubes & pipes 21.4 21.8 -0.4 -1.63%
Other steel products 20.9 21.8 -0.9 -4.10%
Total 253.2 236.5 16.7 7.04%
Unit: ten thousand tons
Unit: ten thousand tons
Note: The work in process inventory existing in the channel was recovered as finished product inventory for the Company management. Apart from selling its own products, the Company’s sales channel also worked as the sales agent for Baosteel Group’s iron and steel products.
9
Items 2014 2013 Difference Rate of difference
Interest incomes -1,057 -1,205 148 -12.30%
Interest expenditures 1,412 1,568 -156 -9.90%
Gains and losses from currency exchange 89 -955 1,044 -109.30%
Others 44 48 -5 -10.40%
Total 488 -544 1,032 -189.70%
Items 2014 2013 Difference Rate of difference
Sales expense 2,200 1,963 237 12.10%
Administrative expense 7,728 6,881 847 12.30%
Unit: RMB million
Unit: RMB million
Unit: RMB million
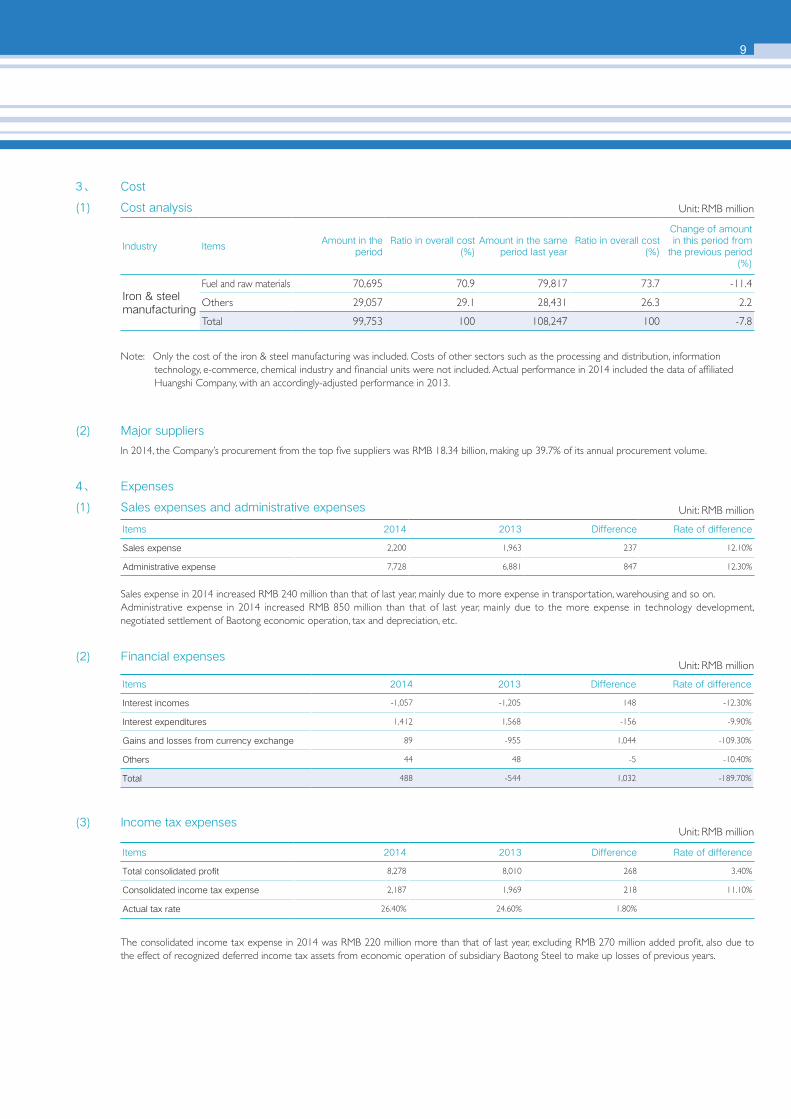
3、 Cost
(1) Cost analysis
4、 Expenses
(1) Sales expenses and administrative expenses
(2) Financial expenses
(2) Major suppliers
In 2014, the Company’s procurement from the top five suppliers was RMB 18.34 billion, making up 39.7% of its annual procurement volume.
Note: Only the cost of the iron & steel manufacturing was included. Costs of other sectors such as the processing and distribution, information technology, e-commerce, chemical industry and financial units were not included. Actual performance in 2014 included the data of affiliated Huangshi Company, with an accordingly-adjusted performance in 2013.
Sales expense in 2014 increased RMB 240 million than that of last year, mainly due to more expense in transportation, warehousing and so on. Administrative expense in 2014 increased RMB 850 million than that of last year, mainly due to the more expense in technology development, negotiated settlement of Baotong economic operation, tax and depreciation, etc.
Industry ItemsAmount in the
periodRatio in overall cost
(%)Amount in the same
period last yearRatio in overall cost
(%)
Change of amount in this period from
the previous period (%)
Iron & steel manufacturing
Fuel and raw materials 70,695 70.9 79,817 73.7 -11.4
Others 29,057 29.1 28,431 26.3 2.2
Total 99,753 100 108,247 100 -7.8
Items 2014 2013 Difference Rate of difference
Total consolidated profit 8,278 8,010 268 3.40%
Consolidated income tax expense 2,187 1,969 218 11.10%
Actual tax rate 26.40% 24.60% 1.80%
(3) Income tax expensesUnit: RMB million
The consolidated income tax expense in 2014 was RMB 220 million more than that of last year, excluding RMB 270 million added profit, also due to the effect of recognized deferred income tax assets from economic operation of subsidiary Baotong Steel to make up losses of previous years.

10
Expensing of R&D expenditures 3,931
Capitalizing of R&D expenditures -
Total R&D expenditures 3,931
Ratio of total R&D expenditures to net assets (%) 3.2
Ratio of total R&D expenditures to operating revenue (%) 2.1
Unit: RMB million
Unit: RMB million
5、 R&D expenditures
(1) R&D expenditure table
(2) Explanation
In 2014, the research and development of the Company's new products focused on world debut to lead market development, realizing the world debut for high-elongation quenching ductile steel applicable to auto and other four new products. Multiple scientific achievements won “science and technology progress award” of the state, Shanghai and metallurgical industry, including Innovative Development and Application of Steel Tubes for 600℃ Ultra-supercritical Thermal Power Unit winning first prize of National Award for Science and Technology Progress, Research and Development of Cold-rolled Hot-dip Aluminizing and Galvanizing Unit Core Technology and Outfit winning the first prize of 2014 metallurgical science and technology progress award, and the Company winning the Organization Award of China's Most Admired Knowledge Enterprise again.
6、 Cash flow
In 2014, the cash and cash equivalents of the Company decreased by RMB 310 million, among which, the net cash inflow arising from operating activities was RMB 28.28 billion, the net cash outflow arising from investing activities was RMB 18.96 billion, the net cash outflow arising from financing activities was RMB 9.53 billion, and the net cash outflow arising from the effect of fluctuation in exchange rate was RMB 90 million. Without considering the impact of the Finance Co., the cash and cash equivalents increased by RMB 470 million, among which, the net cash inflow arising from operating activities was RMB 28.62 billion, the net cash outflow arising from investing activities was RMB 18.77 billion, the net cash outflow arising from financing activities was RMB 9.29 billion, and the net cash outflow arising from the effect of fluctuation in exchange rate was RMB 90 million.
Without regard to the impact of Finance Co., the net cash inflow arising from operating activities was RMB 28.62 billion, RMB 15.52 billion more than the RMB 13.10 billion at the same period last year. This is mainly caused by the following factors:
(1). The net profit this year was RMB 5.92 billion, RMB 20 million more than the RMB 5.90 billion at the same period last year.(2). The allowances for assets impairment this year was RMB 480 million, RMB 1.88 billion less than the RMB 2.36 billion at the same period last year.(3). Income from disposal of fixed assets, intangible assets and other long-term assets was RMB 50 million, with a loss of RMB 110 million at the same
period last year, representing a decreased cash flow of RMB 160 million.(4). Depreciation and amortizement of fixed assets was RMB 200 million more cash flow than that of last year.(5). Other items like financial expense increased RMB 530 million, with a loss of RMB 1.04 billion at the same period last year, representing an
increased cash flow of RMB 1.57 billion. (6). Inventory was RMB 4.28 billion less than that at the beginning of the year, with a gain of RMB 2.82 billion at the same period last year, representing
an increased cash flow of RMB 7.10 billion.(7). Operational receivable and payable items increased RMB 6.94 billion cash flow this year, with a loss of RMB 1.73 billion at the same period last
year, representing an increased cash flow of RMB 8.67 billion.
Section IV. Board of Directors’ Report
Items
2014 2013 Variation year on year
Including Finance Co.
Excluding Finance Co.
Including Finance Co.
Excluding Finance Co.
Including Finance Co.
Excluding Finance Co.
Net cash flow arising from operating activities
28,280 28,618 12,090 13,098 16,190 15,520
Net cash flow arising from investing activities
-18,964 -18,765 -8,717 -8,642 -10,247 -10,123
Net cash flow arising from financing activities
-9,534 -9,289 599 459 -10,133 -9,748
Effect of fluctuation in exchange rate on cash
-90 -90 -6 -4 -84 -87
Net increase in cash and cash equivalents -308 473 3,967 4,912 -4,274 -4,438
11
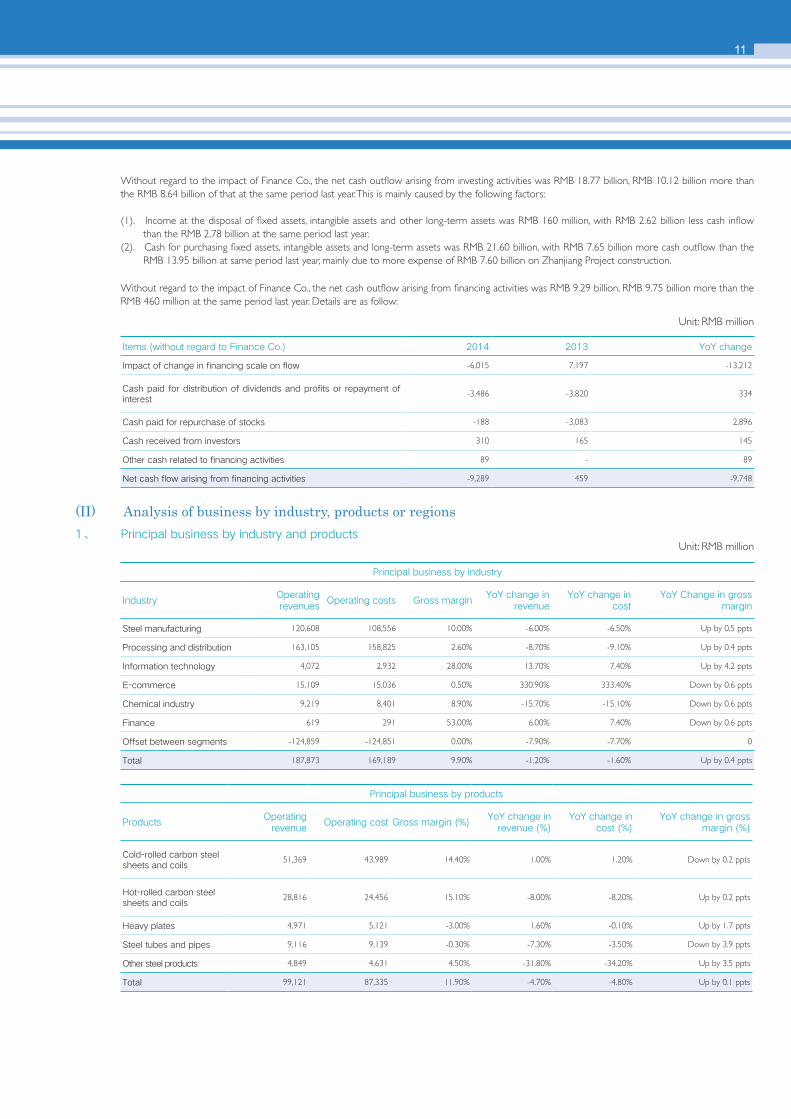
Without regard to the impact of Finance Co., the net cash outflow arising from investing activities was RMB 18.77 billion, RMB 10.12 billion more than the RMB 8.64 billion of that at the same period last year. This is mainly caused by the following factors:
(1). Income at the disposal of fixed assets, intangible assets and other long-term assets was RMB 160 million, with RMB 2.62 billion less cash inflow than the RMB 2.78 billion at the same period last year.
(2). Cash for purchasing fixed assets, intangible assets and long-term assets was RMB 21.60 billion, with RMB 7.65 billion more cash outflow than the RMB 13.95 billion at same period last year, mainly due to more expense of RMB 7.60 billion on Zhanjiang Project construction.
(II) Analysis of business by industry, products or regions1、 Principal business by industry and products
Without regard to the impact of Finance Co., the net cash outflow arising from financing activities was RMB 9.29 billion, RMB 9.75 billion more than the RMB 460 million at the same period last year. Details are as follow:
Items (without regard to Finance Co.) 2014 2013 YoY change
Impact of change in financing scale on flow -6,015 7,197 -13,212
Cash paid for distribution of dividends and profits or repayment of interest
-3,486 -3,820 334
Cash paid for repurchase of stocks -188 -3,083 2,896
Cash received from investors 310 165 145
Other cash related to financing activities 89 - 89
Net cash flow arising from financing activities -9,289 459 -9,748
Unit: RMB million
Unit: RMB million
Principal business by industry
IndustryOperating revenues
Operating costs Gross marginYoY change in
revenueYoY change in
costYoY Change in gross
margin
Steel manufacturing 120,608 108,556 10.00% -6.00% -6.50% Up by 0.5 ppts
Processing and distribution 163,105 158,825 2.60% -8.70% -9.10% Up by 0.4 ppts
Information technology 4,072 2,932 28.00% 13.70% 7.40% Up by 4.2 ppts
E-commerce 15,109 15,036 0.50% 330.90% 333.40% Down by 0.6 ppts
Chemical industry 9,219 8,401 8.90% -15.70% -15.10% Down by 0.6 ppts
Finance 619 291 53.00% 6.00% 7.40% Down by 0.6 ppts
Offset between segments -124,859 -124,851 0.00% -7.90% -7.70% 0
Total 187,873 169,189 9.90% -1.20% -1.60% Up by 0.4 ppts
Principal business by products
ProductsOperating
revenueOperating cost Gross margin (%)
YoY change in revenue (%)
YoY change in cost (%)
YoY change in gross margin (%)
Cold-rolled carbon steel sheets and coils
51,369 43,989 14.40% 1.00% 1.20% Down by 0.2 ppts
Hot-rolled carbon steel sheets and coils
28,816 24,456 15.10% -8.00% -8.20% Up by 0.2 ppts
Heavy plates 4,971 5,121 -3.00% 1.60% -0.10% Up by 1.7 ppts
Steel tubes and pipes 9,116 9,139 -0.30% -7.30% -3.50% Down by 3.9 ppts
Other steel products 4,849 4,631 4.50% -31.80% -34.20% Up by 3.5 ppts
Total 99,121 87,335 11.90% -4.70% -4.80% Up by 0.1 ppts
12
Section IV. Board of Directors’ Report
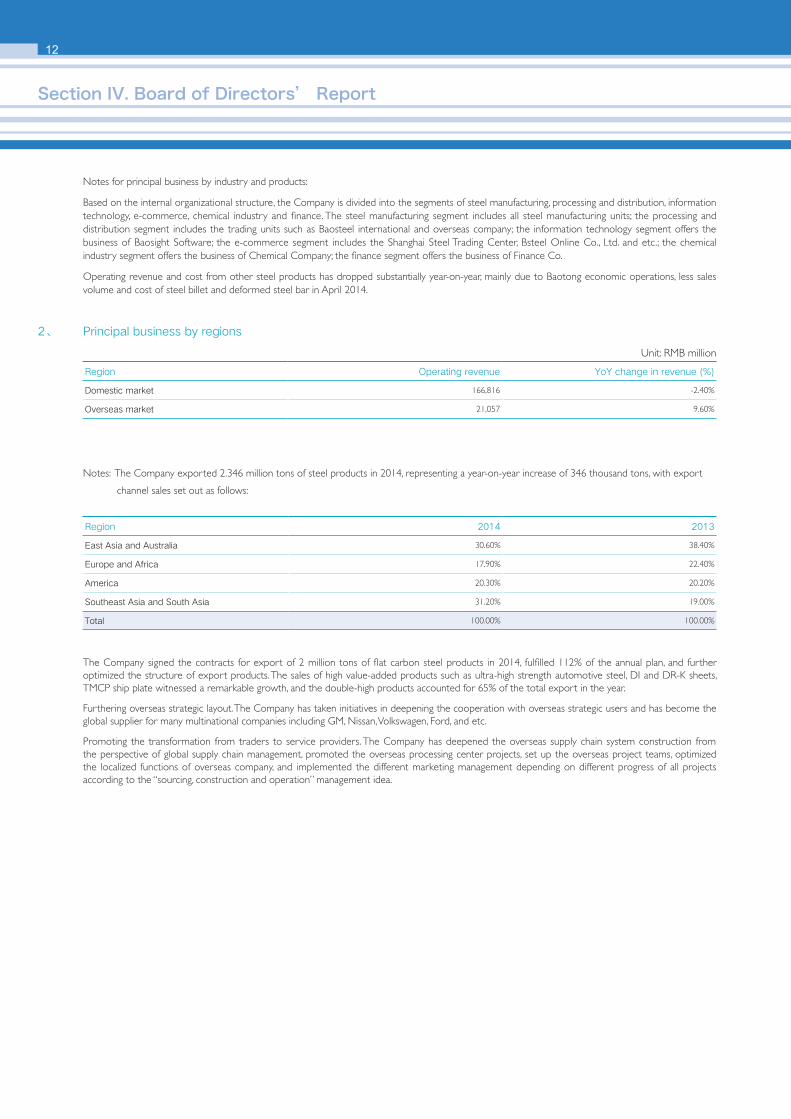
2、 Principal business by regions
Region Operating revenue YoY change in revenue (%)
Domestic market 166,816 -2.40%
Overseas market 21,057 9.60%
Region 2014 2013
East Asia and Australia 30.60% 38.40%
Europe and Africa 17.90% 22.40%
America 20.30% 20.20%
Southeast Asia and South Asia 31.20% 19.00%
Total 100.00% 100.00%
Unit: RMB million
Notes: The Company exported 2.346 million tons of steel products in 2014, representing a year-on-year increase of 346 thousand tons, with export
channel sales set out as follows:
The Company signed the contracts for export of 2 million tons of flat carbon steel products in 2014, fulfilled 112% of the annual plan, and further optimized the structure of export products. The sales of high value-added products such as ultra-high strength automotive steel, DI and DR-K sheets, TMCP ship plate witnessed a remarkable growth, and the double-high products accounted for 65% of the total export in the year.
Furthering overseas strategic layout. The Company has taken initiatives in deepening the cooperation with overseas strategic users and has become the global supplier for many multinational companies including GM, Nissan, Volkswagen, Ford, and etc.
Promoting the transformation from traders to service providers. The Company has deepened the overseas supply chain system construction from the perspective of global supply chain management, promoted the overseas processing center projects, set up the overseas project teams, optimized the localized functions of overseas company, and implemented the different marketing management depending on different progress of all projects according to the “sourcing, construction and operation” management idea.
Notes for principal business by industry and products:
Based on the internal organizational structure, the Company is divided into the segments of steel manufacturing, processing and distribution, information technology, e-commerce, chemical industry and finance. The steel manufacturing segment includes all steel manufacturing units; the processing and distribution segment includes the trading units such as Baosteel international and overseas company; the information technology segment offers the business of Baosight Software; the e-commerce segment includes the Shanghai Steel Trading Center, Bsteel Online Co., Ltd. and etc.; the chemical industry segment offers the business of Chemical Company; the finance segment offers the business of Finance Co.
Operating revenue and cost from other steel products has dropped substantially year-on-year, mainly due to Baotong economic operations, less sales volume and cost of steel billet and deformed steel bar in April 2014.
13
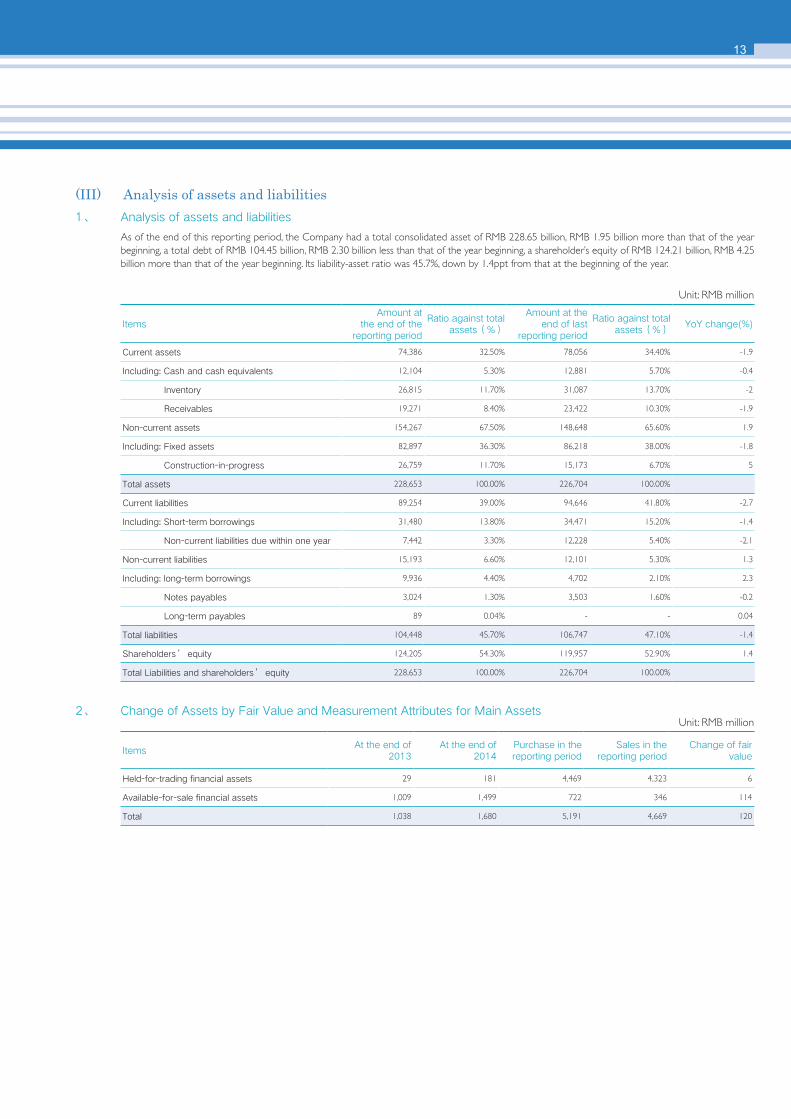
2、 Change of Assets by Fair Value and Measurement Attributes for Main Assets
ItemsAt the end of
2013At the end of
2014Purchase in the reporting period
Sales in the reporting period
Change of fair value
Held-for-trading financial assets 29 181 4,469 4,323 6
Available-for-sale financial assets 1,009 1,499 722 346 114
Total 1,038 1,680 5,191 4,669 120
Unit: RMB million
(III) Analysis of assets and liabilities1、 Analysis of assets and liabilities
As of the end of this reporting period, the Company had a total consolidated asset of RMB 228.65 billion, RMB 1.95 billion more than that of the year beginning, a total debt of RMB 104.45 billion, RMB 2.30 billion less than that of the year beginning, a shareholder’s equity of RMB 124.21 billion, RMB 4.25 billion more than that of the year beginning. Its liability-asset ratio was 45.7%, down by 1.4ppt from that at the beginning of the year.
Unit: RMB million
ItemsAmount at
the end of the reporting period
Ratio against total assets(%)
Amount at the end of last
reporting period
Ratio against total assets(%)
YoY change(%)
Current assets 74,386 32.50% 78,056 34.40% -1.9
Including: Cash and cash equivalents 12,104 5.30% 12,881 5.70% -0.4
Inventory 26,815 11.70% 31,087 13.70% -2
Receivables 19,271 8.40% 23,422 10.30% -1.9
Non-current assets 154,267 67.50% 148,648 65.60% 1.9
Including: Fixed assets 82,897 36.30% 86,218 38.00% -1.8
Construction-in-progress 26,759 11.70% 15,173 6.70% 5
Total assets 228,653 100.00% 226,704 100.00%
Current liabilities 89,254 39.00% 94,646 41.80% -2.7
Including: Short-term borrowings 31,480 13.80% 34,471 15.20% -1.4
Non-current liabilities due within one year 7,442 3.30% 12,228 5.40% -2.1
Non-current liabilities 15,193 6.60% 12,101 5.30% 1.3
Including: long-term borrowings 9,936 4.40% 4,702 2.10% 2.3
Notes payables 3,024 1.30% 3,503 1.60% -0.2
Long-term payables 89 0.04% - - 0.04
Total liabilities 104,448 45.70% 106,747 47.10% -1.4
Shareholders’ equity 124,205 54.30% 119,957 52.90% 1.4
Total Liabilities and shareholders’ equity 228,653 100.00% 226,704 100.00%
14
(IV). Analysis of core competitivenessSticking to its “Premium Product” strategy, establishing and making use of its leading advantage in technology, the Company has been committed to environment friendly operation and innovation. It has been continuously raising its capacity in the differentiated competition, and continued to maintain the best performance among its domestic peers.
1、 Innovation in technologies
The Company continued the premium product development strategy characterized by technological leadership. The world debut of new generation advanced high strength steel QP steel (QP1180CR) for automobiles and other four new products were realized in 2014. The Company became the first one in achieving industrial trial manufacturing of medium manganese steel in the world, keeping the leading technological advantages in research and development of automotive sheet; the super-high strength high-tenacity casing BG150V was successfully descended in the well in Zhongyuan Oil Field, achieving the first engineering application under heavily-stressed complicated geological conditions; Marketing promotion of the debut of new products was actively carried out to transfer the technology leadership advantage of debut products into operation contribution.
With a view to expand the market of new products and enhance the capability of differentiated competition, the Company sped up the development and marketing of high-end new products, and expanded the market share and profitability of exclusive new products. 81 new product grades were successfully trial-manufactured and brought to market in 2014. Stable supply in batches of NSGO for “double million” extra-high voltage transformer was realized, the proportion of high-grade oriented silicon steel increased 10% year-on-year ; stable manufacturing process of high-grade pipeline steel was developed successfully, and products were exported to oversea markets in batches.
The Company deepened university-industry cooperation depending on improved technology innovation system. Also the Company fully consolidated and applied external science and technology resources, devised and formed the overall program for scientific research cooperation with ten universities and colleges including Shanghai Jiaotong University, Central South University, etc., organized and implemented many key cooperation projects such as “Steel for ultra-supercritical boilers” with Central Iron & Steel Research Institute, which effectively supported the research and development progress of key process and products of the Company; it also explored new path of international cooperation, initiated international science and technology cooperation with Ohio State University, University of Illinois, Colorado School of Mines successively, elevated the foothold of the company's technology innovation strategy, and expanded external science and technology cooperation network and technical knowledge sources.
Many scientific research achievements of the Company won government awards. Among them, Development of Core Technology and Outfit of Cold-rolled Hot-dip Aluminizing and Galvanizing Unit won the first prize of 2014 metallurgical science and technology progress award; two achievements won the second prize of metallurgical science and technology progress award, and two achievements won the third prize of metallurgical science and technology progress award; Development and Industrialization of High-grade Non-oriented Silicon Steel Manufacturing Technology won the first prize of Shanghai science and technology progress award; Development of Plate and Welded Pile for X80 Large-diameter Longitudinal Submerged-arc Welded (LSAW) Pipe and other three achievements won the second prize of Shanghai science and technology progress award.
2、 Products and manufacturing
The Company energetically pushed forward the application of APQP and other quality tools when tackling quality problems, decomposed the critical process of key working procedure, analyzed the end factors, and found the key improvement points to enhance variety quality and working procedure technical capacity together. In 2014, the Company completed a series of technical revamping projects, elevating the manufacturing capacity of high value-added products through technology upgrade.
From design perspective, the Company planned and executed overall improvement solutions of user’s demands, and solved over 10 problems at user end regarding GA exposed panel and bullet-proof steel, etc. The application failure rate of typical users for automotive sheets, etc. scored remarkable improvement by means of strengthening objection cause analysis, quality judgment, corrective measures establishment, and corrective verification management. Focusing on the key products such as GA/GI exposed panels, cold-rolled ultra-high strength steel, OA products, the Company carried out cross-process collaborative improvement, so the substandard rate due to steel quality defects of GA exposed panels reduced by 2.6%, the yield of GA exposed panels was up by 1.0 % than that of last year, and the yield of GI exposed panels increased by 1.1%.Focusing on product quality and meticulously organizing production, the Company made breakthroughs in bottleneck capacity of automotive sheet and other key products, improved effective capacity of hot-dip galvanizing and electro-galvanizing, and promoted futures warehousing capacity further ; the stable batch production of oriented silicon steel B20R070 was realized, and the distribution transformer with level 1 efficiency was successfully made, with performance results equivalent to that of Nippon Steel; more than 20 users in Jiangsu, Fujian, Nanyang and Qingdao were developed for non-oriented silicon steel 50AE-1 products. The Company won all of the thick plate orders for the worldwide largest LNG project, filling in the gap in supply references of the Company’s products in Arctic Circle.
The output of strategic advantageous products such as automotive high-strength steel, thick plate pipeline steel, oriented laser scribing silicon steel, non-oriented high-grade silicon steel was over fulfilled, maximizing the overall benefit of the Company’s effective resources.
3、 Innovations in service
With increased homogeneity competition, the Company focused on customer value, adhered to differentiated marketing, and took the customer value as the basis to devise customer solution, optimize product mix and increase service value. The Company has established more than 100 marketing outlets at home, with business spread in 25 provinces, municipality directly under the Central Government, and autonomous regions. The Company had above 50 steel service centers. The sales volume of both strategic and advantageous products of the Company exceeded 12 million tons in 2014, and percentage of steel oversea sales kept more than 10%.
Section IV. Board of Directors’ Report
15
Based on customer value analysis, by enhancing service system construction, improving customer visiting management, increasing customer representative service frequency, formulating differentiated customer maintenance strategy and personalized solutions, the Company has delivered service value to customers effectively, and realized customer value promotion. The Company re-devised the key account management program, comprehensively promoted key account supervisor (manager) system, which has been provided to 18 customers in automobile manufacturing, shipbuilding, power transmission and distribution, packaging, petroleum refining and other industries, built special team for concierge service, and implemented an innovation mode of upstream and downstream win-win technology marketing.
The Company continued the efforts to deepen the EVI service for automotive sheets, kept boosting the system support ability, and increased the influence of automotive sheet bands. The Company explored EVI mode in non-automobile industry on the basis of summing up the EVI achievements and practices of automotive sheets, implemented 22 non-automobile EVI projects, and initially formed the EVI technological marketing mode for household appliance products represented by Haier, Dachangjiang Motorcycle and Midea Water Heater.
4、 Two-wing business development
The Company kept improving e-commerce business mode. The national first banking chattel mortgage information platform-Shanghai banking chattel mortgage information platform was formally put into operation on March 25, 2014, and the first warehouse receipt pledge business was completed with this platform on April 18. Having signed framework cooperation agreement with 14 banks, the platform will subsequently cover all chattel mortgage business with steel pledge as the entry point to explore new industry opportunity for e-commerce industrialization.
The steel transaction center focused on promotion of user experience, and increased resource classification, online financing, online logistics and other online transaction service new mode, developed steel plant and industrial users stably, forming certain industrial influence and e-commerce radiation capacity. Advance e-commerce supporting ability in physical storage and logistics to promote growth of e-commerce sales volume. The sales volume for e-commerce platform was 4.51 million tons in 2014.
The e-commerce financial service developed in depth and breadth. In terms of online payment, the third party payment function of Easternpay was connected with “Wanxiangjie” settlement system of Finance Co. The annual settlement of Easternpay breaks RMB 30 billion, with over 5 times more than that of last year.
In IT field, Baosight signed customized data center service contract and further deepened strategic cooperation agreement with China Mobile, escorting Shanghai “Four Centers” construction; cloud service and solution of Baosight was included in the first batch of national standard qualification certification.
5、 Environmental management
The Company took the lead to implement the environmental management in China, and implemented the concept in the whole operation process of the Company, and therefore achieved the advantages for the technical research and application of low-carbon economics and green product manufacture, and has become the pioneer of domestic environmental-friendly enterprises.
Faced with the tighter resource and environment capacity, and the challenge and opportunity brought by stricter environmental protection and energy saving and emission reduction of the government and society, on one hand, the Company intensified construction of basic control ability, actively explored the practice and developed energy and environmental protection management technology with Baosteel characteristics; on the other hand, the Company boosted the improvement and promotion of energy saving and environmental protection control system with high senses of responsibility, crisis and urgency.
Built green industrial chain, strengthened hazardous substance control with suppliers and customers, and specified hazardous substance control list about more than 300 purchasing materials; analyzed product environmental needs of over 50 customers in the fields of automobile, household appliance, and electricity energy, generated the first customer green needs list of the Company, which acted as a guidance document for implementing internal control. Winning the recommendation of hazardous substance management system (QC080000) certification of British Standards Institution, an international authoritative certification organization, the Company became the first steel enterprise that passes this certification in China.
6、 Brand, credit and employee
The Company enjoys high brand recognition and reputation, and has obtained high recognition from the users and the society through the construction of connotation value and external image of company brand. In 2014, the Company planned iron and steel product brands for end users for the first time by combining with the reality of industrial products marketing, putting the construction of product brand to the height of company marketing strategy.
The Company ranked No. 25 in the list of “China's Top 500 Enterprises 2014” on the Chinese Fortune website. The Company has been included in the list of “China's Top 100 Enterprises with Social Responsibility” in American Fortune (Chinese version) for 3 successive years. The Company has won the prize of “Most Admired Knowledge Organization in China” for 4 consecutive years and “Most Admired Knowledge Enterprise in Asia” for 3 years in a row and became the only domestic manufacturing enterprise winning this prize; the Company was awarded as class-A company in information disclosure of listed companies by Shanghai Stock Exchange, and as preferred steel stock for global analysts by Bloomberg News, and gained the title of “Top Mainboard Listing Company of Investor Relationship” on the Wisdom and Finance Peak List, and the board won the prize of “Gold round table best board” given by Directors & Boards.
16
The Company boasts a team of employees that are passionate, energetic, responsible and innovative. “Becoming the corporate model in common development of employees and company” is one of the 3 visions of the Company. In order to inspire the enthusiasm and creativity of employees and enhance company cohesion better, the Company formulated Three-year Action Plan of Common Development of Employees and Enterprise centering on concerns of employees such as career development, remuneration and welfare, corporate culture and working environment, also focusing on specific action measures. The plan was implemented effectively in 2014, the employee engagement level improved substantially, and salary per capita rose with together profit per capita.
Section IV. Board of Directors’ Report
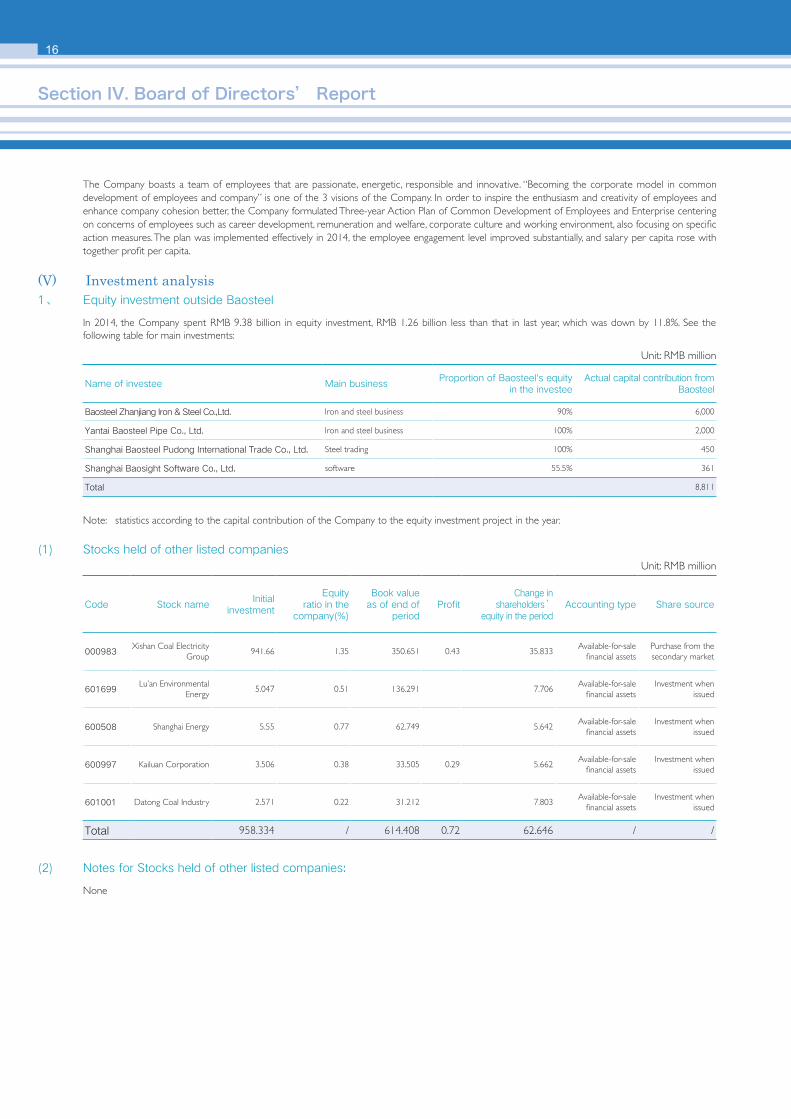
(V) Investment analysis1、 Equity investment outside Baosteel
In 2014, the Company spent RMB 9.38 billion in equity investment, RMB 1.26 billion less than that in last year, which was down by 11.8%. See the following table for main investments:
Note: statistics according to the capital contribution of the Company to the equity investment project in the year.
Name of investee Main businessProportion of Baosteel's equity
in the investeeActual capital contribution from
Baosteel
Baosteel Zhanjiang Iron & Steel Co.,Ltd. Iron and steel business 90% 6,000
Yantai Baosteel Pipe Co., Ltd. Iron and steel business 100% 2,000
Shanghai Baosteel Pudong International Trade Co., Ltd. Steel trading 100% 450
Shanghai Baosight Software Co., Ltd. software 55.5% 361
Total 8,811
Unit: RMB million
(1) Stocks held of other listed companiesUnit: RMB million
Code Stock nameInitial
investment
Equity ratio in the
company(%)
Book value as of end of
periodProfit
Change in shareholders’
equity in the periodAccounting type Share source
000983Xishan Coal Electricity
Group941.66 1.35 350.651 0.43 35.833
Available-for-sale financial assets
Purchase from the secondary market
601699Lu’an Environmental
Energy5.047 0.51 136.291 7.706
Available-for-sale financial assets
Investment when issued
600508 Shanghai Energy 5.55 0.77 62.749 5.642Available-for-sale
financial assetsInvestment when
issued
600997 Kailuan Corporation 3.506 0.38 33.505 0.29 5.662Available-for-sale
financial assetsInvestment when
issued
601001 Datong Coal Industry 2.571 0.22 31.212 7.803Available-for-sale
financial assetsInvestment when
issued
Total 958.334 / 614.408 0.72 62.646 / /
(2) Notes for Stocks held of other listed companies:
None

17
Unit: RMB million
Partner NameProducts
TypeAmount
Starting Date
Expiration Date
Determined Payment Method
Anticipated Income
Actual Principal
Withdrawn
Actual Gain
Legal Proceedings
Provision Depreciation
Reserves
Related Transactions
Involvement in lawsuits
Capital from
financing
Industrial and Commercial Bank of China Ltd.
ICBC financial product
-win-win
1,000.002014
/11/132015/5/11
Annual interest rate
5.05%24.77 0 0 Yes No No No
China Construction Bank Corporation
Profit 1,000.002014
/11/212015/8/18
Annual interest rate
5.2%38.47 0 0 Yes No No No
Bank of Communications Co., Ltd.
Win of Fortune
5002014
/11/272015/2/27
Annual interest rate
5.2%6.55 0 0 Yes No No No
Hwabao Trust Co., Ltd.
Baoying Safety
Portfolio165.5
2014/11/28
2015/4/10
Annual interest rate
7.5%4.52 0 0 Yes Yes No No
Hwabao Trust Co., Ltd.
Baoying Safety
Portfolio100
2014/12/9
2015/1/16
Annual interest rate
6.5%0.68 0 0 Yes Yes No No
Total / 2,765.50 / / / 74.99 / / / /
2、 Investment in Entrusted Financial Management Products and the Derivative Products by Non-financial Companies
(1) Entrusted financial management
(2) Other Investing, Financing and Derivation Investment
Type Capital source Signing partyShares of
investmentInvestment term Product type
Anticipated gains
ProfitInvolvement in
lawsuits
I. Other investment
Available-for-sale financial assets
Policy financial bond Equity fund Inter bank market 3.3 Over one year Bond 7.95 10.82 No
Corporate bond Equity fund Inter bank market 2 Less than one year Bond 1.5 No
Corporate bond Equity fund Inter bank market 5.9 Over one year Bond 14.76 20.74 No
Subtotal 11.2 24.21 31.56
Held-to-maturity investment
Trust plan Equity fund Trust company 858.8 Less than one year Trust 17.41 No
Subtotal 858.8 17.41
Tradable financial assets
Money fund Equity fund Fund company 4,450.01 Less than one year Fund 0.02 20.85 No
Corporate bond Equity fund Shanghai Stock Exchange 0.3 Over one year Bond -0.18 1.74 No
Subtotal 4,450.31 -0.16 30.04
Total 5,320.31 24.06 79.01
II. Investment in derivative products
Forward and swap Equity fund Bank 1,448.56 Less than one year Derivative products 10.89 -98.29 No
Unit: RMB million
Note: 1) All of the above financial management businesses were carried out by the Company’s subsidiary, the Finance Co., a financial subsidiary controlled by the Company. The financial management was within its business scope.
2) The “Shares of investment” listed above consisted of the book value as of the end of the previous year and the capital investment in this reporting year, other than the shares of investment corresponding to the products held at the end of the period.
3) The derivative investment was the forward business carried out by the Company and its subsidiary, to avoid the exchange risk of asset liabilities calculated by foreign currencies, and the swap transaction was carried out to evade the risk from fluctuation in iron ore prices.
18
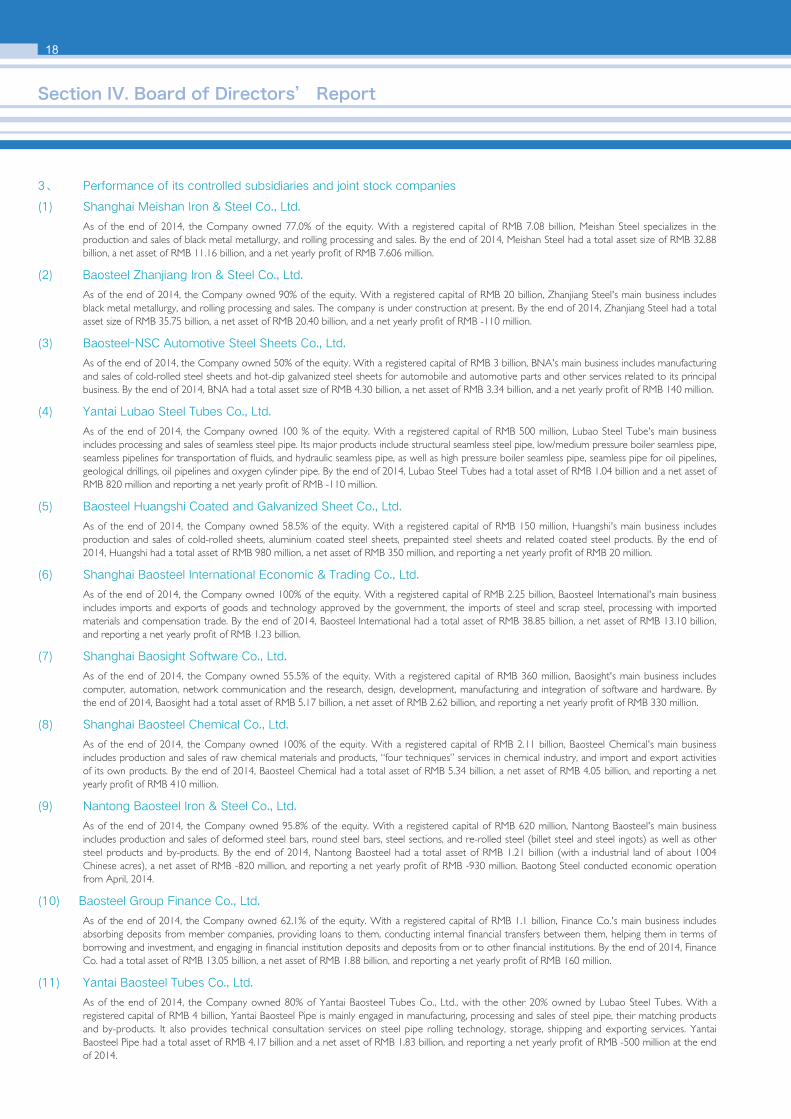
3、 Performance of its controlled subsidiaries and joint stock companies
(1) Shanghai Meishan Iron & Steel Co., Ltd.
As of the end of 2014, the Company owned 77.0% of the equity. With a registered capital of RMB 7.08 billion, Meishan Steel specializes in the production and sales of black metal metallurgy, and rolling processing and sales. By the end of 2014, Meishan Steel had a total asset size of RMB 32.88 billion, a net asset of RMB 11.16 billion, and a net yearly profit of RMB 7.606 million.
(2) Baosteel Zhanjiang Iron & Steel Co., Ltd.
As of the end of 2014, the Company owned 90% of the equity. With a registered capital of RMB 20 billion, Zhanjiang Steel's main business includes black metal metallurgy, and rolling processing and sales. The company is under construction at present. By the end of 2014, Zhanjiang Steel had a total asset size of RMB 35.75 billion, a net asset of RMB 20.40 billion, and a net yearly profit of RMB -110 million.
(3) Baosteel-NSC Automotive Steel Sheets Co., Ltd.
As of the end of 2014, the Company owned 50% of the equity. With a registered capital of RMB 3 billion, BNA's main business includes manufacturing and sales of cold-rolled steel sheets and hot-dip galvanized steel sheets for automobile and automotive parts and other services related to its principal business. By the end of 2014, BNA had a total asset size of RMB 4.30 billion, a net asset of RMB 3.34 billion, and a net yearly profit of RMB 140 million.
(4) Yantai Lubao Steel Tubes Co., Ltd.
As of the end of 2014, the Company owned 100 % of the equity. With a registered capital of RMB 500 million, Lubao Steel Tube's main business includes processing and sales of seamless steel pipe. Its major products include structural seamless steel pipe, low/medium pressure boiler seamless pipe, seamless pipelines for transportation of fluids, and hydraulic seamless pipe, as well as high pressure boiler seamless pipe, seamless pipe for oil pipelines, geological drillings, oil pipelines and oxygen cylinder pipe. By the end of 2014, Lubao Steel Tubes had a total asset of RMB 1.04 billion and a net asset of RMB 820 million and reporting a net yearly profit of RMB -110 million.
(5) Baosteel Huangshi Coated and Galvanized Sheet Co., Ltd.
As of the end of 2014, the Company owned 58.5% of the equity. With a registered capital of RMB 150 million, Huangshi's main business includes production and sales of cold-rolled sheets, aluminium coated steel sheets, prepainted steel sheets and related coated steel products. By the end of 2014, Huangshi had a total asset of RMB 980 million, a net asset of RMB 350 million, and reporting a net yearly profit of RMB 20 million.
(6) Shanghai Baosteel International Economic & Trading Co., Ltd.
As of the end of 2014, the Company owned 100% of the equity. With a registered capital of RMB 2.25 billion, Baosteel International's main business includes imports and exports of goods and technology approved by the government, the imports of steel and scrap steel, processing with imported materials and compensation trade. By the end of 2014, Baosteel International had a total asset of RMB 38.85 billion, a net asset of RMB 13.10 billion, and reporting a net yearly profit of RMB 1.23 billion.
(7) Shanghai Baosight Software Co., Ltd.
As of the end of 2014, the Company owned 55.5% of the equity. With a registered capital of RMB 360 million, Baosight's main business includes computer, automation, network communication and the research, design, development, manufacturing and integration of software and hardware. By the end of 2014, Baosight had a total asset of RMB 5.17 billion, a net asset of RMB 2.62 billion, and reporting a net yearly profit of RMB 330 million.
(8) Shanghai Baosteel Chemical Co., Ltd.
As of the end of 2014, the Company owned 100% of the equity. With a registered capital of RMB 2.11 billion, Baosteel Chemical's main business includes production and sales of raw chemical materials and products, “four techniques” services in chemical industry, and import and export activities of its own products. By the end of 2014, Baosteel Chemical had a total asset of RMB 5.34 billion, a net asset of RMB 4.05 billion, and reporting a net yearly profit of RMB 410 million.
(9) Nantong Baosteel Iron & Steel Co., Ltd.
As of the end of 2014, the Company owned 95.8% of the equity. With a registered capital of RMB 620 million, Nantong Baosteel's main business includes production and sales of deformed steel bars, round steel bars, steel sections, and re-rolled steel (billet steel and steel ingots) as well as other steel products and by-products. By the end of 2014, Nantong Baosteel had a total asset of RMB 1.21 billion (with a industrial land of about 1004 Chinese acres), a net asset of RMB -820 million, and reporting a net yearly profit of RMB -930 million. Baotong Steel conducted economic operation from April, 2014.
(10) Baosteel Group Finance Co., Ltd.
As of the end of 2014, the Company owned 62.1% of the equity. With a registered capital of RMB 1.1 billion, Finance Co.'s main business includes absorbing deposits from member companies, providing loans to them, conducting internal financial transfers between them, helping them in terms of borrowing and investment, and engaging in financial institution deposits and deposits from or to other financial institutions. By the end of 2014, Finance Co. had a total asset of RMB 13.05 billion, a net asset of RMB 1.88 billion, and reporting a net yearly profit of RMB 160 million.
(11) Yantai Baosteel Tubes Co., Ltd.
As of the end of 2014, the Company owned 80% of Yantai Baosteel Tubes Co., Ltd., with the other 20% owned by Lubao Steel Tubes. With a registered capital of RMB 4 billion, Yantai Baosteel Pipe is mainly engaged in manufacturing, processing and sales of steel pipe, their matching products and by-products. It also provides technical consultation services on steel pipe rolling technology, storage, shipping and exporting services. Yantai Baosteel Pipe had a total asset of RMB 4.17 billion and a net asset of RMB 1.83 billion, and reporting a net yearly profit of RMB -500 million at the end of 2014.
Section IV. Board of Directors’ Report
19
(12) Overseas subsidiaries
As of the end of 2014, the Company had overseas subsidiary companies in U.S.A., Japan, Germany, Singapore, and Hong Kong. These overseas subsidiaries extended the Company’s sales and purchase networks, and played a critical role in enhancing the Company’s international competitiveness.
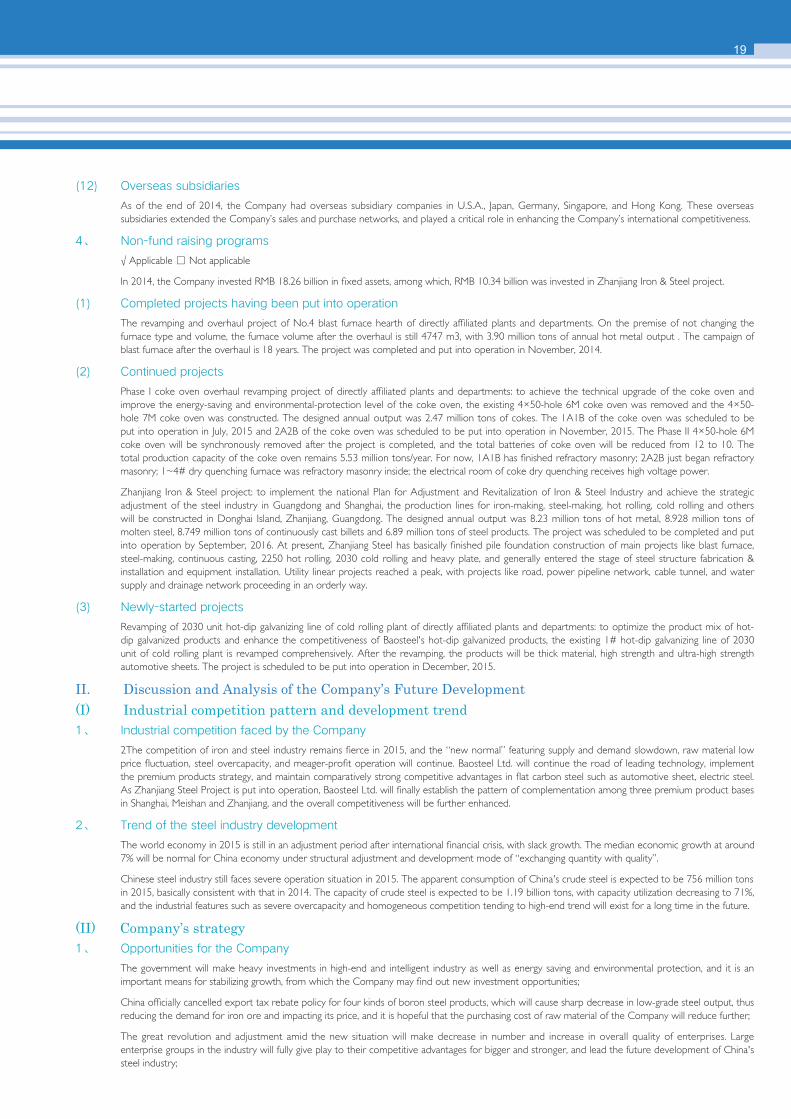
4、 Non-fund raising programs
√ Applicable □ Not applicable
In 2014, the Company invested RMB 18.26 billion in fixed assets, among which, RMB 10.34 billion was invested in Zhanjiang Iron & Steel project.
(1) Completed projects having been put into operation
The revamping and overhaul project of No.4 blast furnace hearth of directly affiliated plants and departments. On the premise of not changing the furnace type and volume, the furnace volume after the overhaul is still 4747 m3, with 3.90 million tons of annual hot metal output . The campaign of blast furnace after the overhaul is 18 years. The project was completed and put into operation in November, 2014.
(2) Continued projects
Phase I coke oven overhaul revamping project of directly affiliated plants and departments: to achieve the technical upgrade of the coke oven and improve the energy-saving and environmental-protection level of the coke oven, the existing 4×50-hole 6M coke oven was removed and the 4×50-hole 7M coke oven was constructed. The designed annual output was 2.47 million tons of cokes. The 1A1B of the coke oven was scheduled to be put into operation in July, 2015 and 2A2B of the coke oven was scheduled to be put into operation in November, 2015. The Phase II 4×50-hole 6M coke oven will be synchronously removed after the project is completed, and the total batteries of coke oven will be reduced from 12 to 10. The total production capacity of the coke oven remains 5.53 million tons/year. For now, 1A1B has finished refractory masonry; 2A2B just began refractory masonry; 1~4# dry quenching furnace was refractory masonry inside; the electrical room of coke dry quenching receives high voltage power.
Zhanjiang Iron & Steel project: to implement the national Plan for Adjustment and Revitalization of Iron & Steel Industry and achieve the strategic adjustment of the steel industry in Guangdong and Shanghai, the production lines for iron-making, steel-making, hot rolling, cold rolling and others will be constructed in Donghai Island, Zhanjiang, Guangdong. The designed annual output was 8.23 million tons of hot metal, 8.928 million tons of molten steel, 8.749 million tons of continuously cast billets and 6.89 million tons of steel products. The project was scheduled to be completed and put into operation by September, 2016. At present, Zhanjiang Steel has basically finished pile foundation construction of main projects like blast furnace, steel-making, continuous casting, 2250 hot rolling, 2030 cold rolling and heavy plate, and generally entered the stage of steel structure fabrication & installation and equipment installation. Utility linear projects reached a peak, with projects like road, power pipeline network, cable tunnel, and water supply and drainage network proceeding in an orderly way.
(3) Newly-started projects
Revamping of 2030 unit hot-dip galvanizing line of cold rolling plant of directly affiliated plants and departments: to optimize the product mix of hot-dip galvanized products and enhance the competitiveness of Baosteel's hot-dip galvanized products, the existing 1# hot-dip galvanizing line of 2030 unit of cold rolling plant is revamped comprehensively. After the revamping, the products will be thick material, high strength and ultra-high strength automotive sheets. The project is scheduled to be put into operation in December, 2015.
II. Discussion and Analysis of the Company’s Future Development(I) Industrial competition pattern and development trend1、 Industrial competition faced by the Company
2The competition of iron and steel industry remains fierce in 2015, and the “new normal” featuring supply and demand slowdown, raw material low price fluctuation, steel overcapacity, and meager-profit operation will continue. Baosteel Ltd. will continue the road of leading technology, implement the premium products strategy, and maintain comparatively strong competitive advantages in flat carbon steel such as automotive sheet, electric steel. As Zhanjiang Steel Project is put into operation, Baosteel Ltd. will finally establish the pattern of complementation among three premium product bases in Shanghai, Meishan and Zhanjiang, and the overall competitiveness will be further enhanced.
2、 Trend of the steel industry development
The world economy in 2015 is still in an adjustment period after international financial crisis, with slack growth. The median economic growth at around 7% will be normal for China economy under structural adjustment and development mode of “exchanging quantity with quality”.
Chinese steel industry still faces severe operation situation in 2015. The apparent consumption of China's crude steel is expected to be 756 million tons in 2015, basically consistent with that in 2014. The capacity of crude steel is expected to be 1.19 billion tons, with capacity utilization decreasing to 71%, and the industrial features such as severe overcapacity and homogeneous competition tending to high-end trend will exist for a long time in the future.
(II) Company’s strategy1、 Opportunities for the Company
The government will make heavy investments in high-end and intelligent industry as well as energy saving and environmental protection, and it is an important means for stabilizing growth, from which the Company may find out new investment opportunities;
China officially cancelled export tax rebate policy for four kinds of boron steel products, which will cause sharp decrease in low-grade steel output, thus reducing the demand for iron ore and impacting its price, and it is hopeful that the purchasing cost of raw material of the Company will reduce further;
The great revolution and adjustment amid the new situation will make decrease in number and increase in overall quality of enterprises. Large enterprise groups in the industry will fully give play to their competitive advantages for bigger and stronger, and lead the future development of China's steel industry;
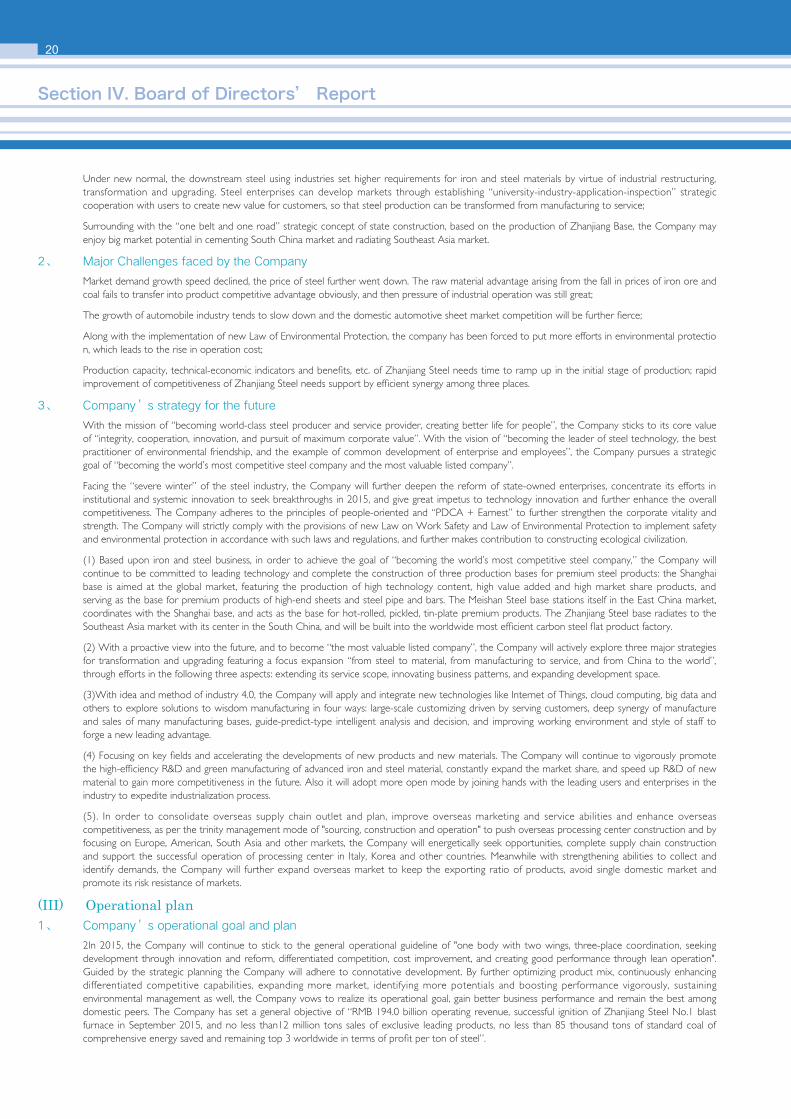
20
Under new normal, the downstream steel using industries set higher requirements for iron and steel materials by virtue of industrial restructuring, transformation and upgrading. Steel enterprises can develop markets through establishing “university-industry-application-inspection” strategic cooperation with users to create new value for customers, so that steel production can be transformed from manufacturing to service;
Surrounding with the “one belt and one road” strategic concept of state construction, based on the production of Zhanjiang Base, the Company may enjoy big market potential in cementing South China market and radiating Southeast Asia market.
2、 Major Challenges faced by the Company
Market demand growth speed declined, the price of steel further went down. The raw material advantage arising from the fall in prices of iron ore and coal fails to transfer into product competitive advantage obviously, and then pressure of industrial operation was still great;
The growth of automobile industry tends to slow down and the domestic automotive sheet market competition will be further fierce;
Along with the implementation of new Law of Environmental Protection, the company has been forced to put more efforts in environmental protection, which leads to the rise in operation cost;
Production capacity, technical-economic indicators and benefits, etc. of Zhanjiang Steel needs time to ramp up in the initial stage of production; rapid improvement of competitiveness of Zhanjiang Steel needs support by efficient synergy among three places.
3、 Company’s strategy for the future
With the mission of “becoming world-class steel producer and service provider, creating better life for people”, the Company sticks to its core value of “integrity, cooperation, innovation, and pursuit of maximum corporate value”. With the vision of “becoming the leader of steel technology, the best practitioner of environmental friendship, and the example of common development of enterprise and employees”, the Company pursues a strategic goal of “becoming the world’s most competitive steel company and the most valuable listed company”.
Facing the “severe winter” of the steel industry, the Company will further deepen the reform of state-owned enterprises, concentrate its efforts in institutional and systemic innovation to seek breakthroughs in 2015, and give great impetus to technology innovation and further enhance the overall competitiveness. The Company adheres to the principles of people-oriented and “PDCA + Earnest” to further strengthen the corporate vitality and strength. The Company will strictly comply with the provisions of new Law on Work Safety and Law of Environmental Protection to implement safety and environmental protection in accordance with such laws and regulations, and further makes contribution to constructing ecological civilization.
(1) Based upon iron and steel business, in order to achieve the goal of “becoming the world’s most competitive steel company,” the Company will continue to be committed to leading technology and complete the construction of three production bases for premium steel products: the Shanghai base is aimed at the global market, featuring the production of high technology content, high value added and high market share products, and serving as the base for premium products of high-end sheets and steel pipe and bars. The Meishan Steel base stations itself in the East China market, coordinates with the Shanghai base, and acts as the base for hot-rolled, pickled, tin-plate premium products. The Zhanjiang Steel base radiates to the Southeast Asia market with its center in the South China, and will be built into the worldwide most efficient carbon steel flat product factory.
(2) With a proactive view into the future, and to become “the most valuable listed company”, the Company will actively explore three major strategies for transformation and upgrading featuring a focus expansion “from steel to material, from manufacturing to service, and from China to the world”, through efforts in the following three aspects: extending its service scope, innovating business patterns, and expanding development space.
(3)With idea and method of industry 4.0, the Company will apply and integrate new technologies like Internet of Things, cloud computing, big data and others to explore solutions to wisdom manufacturing in four ways: large-scale customizing driven by serving customers, deep synergy of manufacture and sales of many manufacturing bases, guide-predict-type intelligent analysis and decision, and improving working environment and style of staff to forge a new leading advantage.
(4) Focusing on key fields and accelerating the developments of new products and new materials. The Company will continue to vigorously promote the high-efficiency R&D and green manufacturing of advanced iron and steel material, constantly expand the market share, and speed up R&D of new material to gain more competitiveness in the future. Also it will adopt more open mode by joining hands with the leading users and enterprises in the industry to expedite industrialization process.
(5). In order to consolidate overseas supply chain outlet and plan, improve overseas marketing and service abilities and enhance overseas competitiveness, as per the trinity management mode of "sourcing, construction and operation" to push overseas processing center construction and by focusing on Europe, American, South Asia and other markets, the Company will energetically seek opportunities, complete supply chain construction and support the successful operation of processing center in Italy, Korea and other countries. Meanwhile with strengthening abilities to collect and identify demands, the Company will further expand overseas market to keep the exporting ratio of products, avoid single domestic market and promote its risk resistance of markets.
(III) Operational plan1、 Company’s operational goal and plan
2In 2015, the Company will continue to stick to the general operational guideline of "one body with two wings, three-place coordination, seeking development through innovation and reform, differentiated competition, cost improvement, and creating good performance through lean operation". Guided by the strategic planning the Company will adhere to connotative development. By further optimizing product mix, continuously enhancing differentiated competitive capabilities, expanding more market, identifying more potentials and boosting performance vigorously, sustaining environmental management as well, the Company vows to realize its operational goal, gain better business performance and remain the best among domestic peers. The Company has set a general objective of “RMB 194.0 billion operating revenue, successful ignition of Zhanjiang Steel No.1 blast furnace in September 2015, and no less than12 million tons sales of exclusive leading products, no less than 85 thousand tons of standard coal of comprehensive energy saved and remaining top 3 worldwide in terms of profit per ton of steel”.
Section IV. Board of Directors’ Report
21
In 2015, the Company plans to produce 23.08 and 23.60 million tons of iron and steel respectively; sell 22.96 million tons of steel, achieve a gross operating revenue of RMB 194 billion and an operation cost of RMB 175.7 billion. The management team of the Company will detail and implement the measures of various key work, and strive to continue the best performance among global peers in a intensively competitive market.
2、 Work of priority
Guided by the Company’s overall operational principle and goal in 2015, and in line with the requirements of the planning as well as the implementation of three plans implemented by the Group Corporation, that is, the leaders plan, the drivers plan and the common growth plan, the Company will promote the following work:
(1) Push the development of new products and keep differentiation competitive advantage. Accelerate the development and marketization process of high-end new products around the automotive steel and speed up the research and development progress of debuted products and original technology; also strengthen the research, development and planning of products involving in great range such as common cold technology and plating and coating technology to ensure the continuous leading of superior products in the future; meanwhile, enhance the market competitiveness of homogenized products, under the guidelines of solution to technical quality problems and final value contribution.
(2) Strengthen cooperation of multi-base and promote manufacturing capability of premium products. Accelerate butt connection between market and production site and further intensify collaborative production and marketing, focus on bottleneck process capacity of directly affiliated plants and departments. Speed up first grade enterprise construction of Meishan Steel, and the performance improvement of Steel Tube, Pipe and Bar Business Unit. Strengthen cooperation among three areas to support overall efficiency of the Company and promote the business performance of Meishan Steel, Ltd and Zhanjiang Steel.
(3) Practise the concept of environmental protection and construct clean factories. Strengthen management and control of environmental protection risks, carry out efficient public communication, set up favorable social image; promote the management capacity of energy and environmental protection system, intensify efficient collaboration of construction production and environmental protection management, increase environmental awareness of all employees and call on all employees participate in “Green Baosteel”; meanwhile, positively boost industrialized application of energy saving and emission reduction technology.
(4) Strengthen market exploration and innovate marketing mode. Strengthen innovation and increase the intensity of market development through EVI and service mode; plan coordination pattern of supply chain so as to form core competitiveness of Baosteel; promote overseas marketing service capacity according to trinity management mode of “sourcing, construction and operation”.
(5) Dig internal potential to form the sustained capability of cost reduction and efficiency improvement. Develop the potential of cost reduction and efficiency improvement by following the principle of reversed push by the market; intensify linkage between purchase and sale so as to increase the response speed of the market and ensure stable performance of the Company persistently. Improve the efficiency of working capital, combining market environment and customer analysis to release high-quality resource to the high-quality customers and reduce fund risks of the Company.
(6) Inspire the creativity of employees and enhance the cohesion of the Company. Continue to promote the vitality of management, technology and skill talent team, and persist in enhancing all-round efficiency of labor in multiple channels; intensify remuneration analysis and keep enhancing incentive effects.
(7) Pool the strength of the whole company to ensure successful ignition of Zhanjiang Steel on September 2015. Make overall planning, arrange the three lines for the operation centering around “15·9” ignition milestone and make elaborate plan for various preparations of production before operation to ensure safe operation on schedule. Pull together and cooperate to lay the foundation of smooth operation of Zhanjiang Steel.
(8) Push the two-wing business to scale a new stage. Accelerate the industrial development of E-commerce and develop cloud computing, Internet of Things, etc.
(9) Explore and propel intelligent manufacturing. Realize the transfer from data warehouse to big data center in decision-making analysis, transformation from partial collaboration to overall optimization in the supply chain and transition from automation to intelligentization in production equipment through deep integration of new technologies such as the Internet, cloud computing and big data and whole supply chain.
(IV). Capital Demands to Maintain Current Business and Complete Investment Projects under ConstructionThe Company’s 2015 budget includes RMB 24.68 billion in fixed asset investment, among which RMB15.99 billion is for Zhanjiang Steel Project.
It is mainly used for the construction of Zhanjiang Steel Project, strip-to-silo revamping of coal yard E&F strip and Phase I coke oven overhaul project of the directly affiliated plants and department, No.3 sintering plant revamping project of Iron-making Plant, hot-dip galvanizing revamping project of Cold Rolling Plant 2030 Unit, etc. Also, a certain amount of capital will be invested in technical revamping.
(V) Possible Risks1、 Major risks
In 2015, Zhanjiang Steel will carry out“project construction”, “production preparation” and “production operation” collaboratively and focus on progress of iron and steel production startup, project environmental acceptance risk, equipment quality risk, employee turnover risk, and teamwork personnel skill training, safety education risk, etc.
In 2015, the markets of downstream industries of the Company will slow down in growth speed, bringing downward pressure on prices of the Company’s major products. Along with the increasingly fierce homogeneity competition, the space of price gap between major products of the Company and those of the competitors will narrow gradually. Meanwhile, with the improvement of manufacturing capability of iron and steel peers, it will be a great challenge for the Company to stabilize and maintain the market share of major products.
22
As the new Law of Environmental Protection was put into force on January 1, 2015, the environmental protection pressure of steel industry will increase and it will be a comparatively large challenge for the Company to complete goals of SASAC and the “12th Five-Year Plan” of Shanghai; for the urban steel plant construction, it will be necessary for the Company to further strengthen the efficiency assessment and operation and maintenance status assessment on environmental protection project after going into operation.
2、 Counter-measures
Carefully plan the Zhanjiang Steel project construction, and schedule relevant project operation, production preparation and “four-reaches” in advance; Bring the Purchasing and Marketing Departments’ system advantages into play to support operation and production preparation, and innovate and optimize multi-base management and collaboration mode; increase environmental acceptance risk identification, establish and track early-warning indicators about employee turnover rate risk and the like, also establish step-by-step response measures to ensure a successful ignition of Zhanjiang No.1 blast furnace in September 2015.
Explore and build new mode of integrated solution to application of non-automotive iron and steel materials, and improve differentiated customer service strategy and individualized solution; scheme personalized marketing plan for key customers, research and gradually form marketing patterns for different kinds of customers based on customer value analysis; continue to follow the key risk indicators of “market share” in order to stabilize the share, strive to establish risk control model in terms of output, inventory, sales of different varieties, price, etc., and improve the risk response measures.
Strengthen environmental protection risk control, integrate environmental protection risk control into business process, deepen preventive management of environmental protection, enhance basic management and process control and improve the ability to handle emergency caused by abnormal emergency equipment and operation combining with environmental management requirements in different area such as Shanghai, Nanjing and Zhanjiang; strengthen the effective coordination among construction, production and environmental protection management, grasp the compliance of environmental protection procedure for construction project; deepen research and development of key technology in energy conservation, wastewater treatment, solid waste deep treatment and utilization, atmospheric pollution control and other fields to promote industrial application of energy conservation and emission reduction technology.
III. Proposed Profit Appropriation or Capitalizing of Capital Reserves Plan(I) Making, Implementation or Adjustment of Cash Dividend Policy
The Company’s dividend distribution plans in previous years were all in line with the Company’s constitution and were approved by the shareholders’ meeting. The cash dividend stipulated by the Company followed clear standard and percentage requirement, and the related decision-making procedure and mechanism were self-contained. The independent directors have fulfilled their obligations and played active roles in the dividend distribution planning. It was also ensured that the medium and small shareholders could fully air their views and concerns. Measures were taken to protect the legal rights of the medium and small shareholders.
In 2014, since the Company recorded a net profit of RMB 6,712,135,976.63, plus the undistributed profit of RMB 30,493,492,245.89 at the beginning of 2014 and minus the cash dividend of RMB 1,647,172,492.40 distributed in 2013, it is predicted that the Company’s distributable profit would amount to RMB 35,558,455,730.12 at the end of 2014. In order to realize the long-term sustainable development, and better repay the investors, the Board of Directors proposed the following profit appropriation scheme for the year:
1. Ten percent of the net profit, or RMB 671,213,597.66, was allocated as statutory earnings reserves for the year 2014;
2. Ten per cent of the net profit, or RMB 671,213,597.66, was allocated as discretionary earnings reserves for the year 2014;
3. According to the Proposal of Baoshan Iron & Steel Co., Ltd. on Modification of Articles of Association approved by the General Meeting of Shareholders in 2012, the annual cash dividend to be distributed should not be less than 50% of the net profit attributable to the parent company in the consolidated statements audited in that year, therefore the total cash dividend in 2014 that should be distributed shall not be less than RMB 2,896,174,530.45. However, in view that the Company always attaches importance to rewarding shareholders and adheres to the long-term cash dividends polices, the Company intended to allot the cash dividend at RMB 0.18 per share (incl. tax). Based on the Company’s total share in 2014, total amount reached RMB 2,964,784,684.32 (incl. tax) for all shareholders registered on the equity registration date recognized in the Dividend Payout Announcement, accounting for 51.2 % of the net profit attributable to the parent company in the audited consolidated statements.
4. Other models of distribution, such as capitalizing of capital reserves, would not be adopted.
5. Cash dividend-net profit ratios from 2011 to 2014:
Section IV. Board of Directors’ Report
23
Items 2014 2013 2012 2011
1 Cash dividend per share (incl. tax) (RMB)(Note) 0.18 0.10 0.138 0.20
2 Total amount of cash for repurchase(RMB 100 million) 30.83 19.17
3Total amount of cash dividend(incl. cash for repurchase) (RMB 100 million )
29.65 47.31 41.95 35.02
4Net profit for legal person presented in the statements according to corporation(RMB 100 million)
67.12 64.92 104.87 50.60
5Net profit attributable to parent company in consolidated statements (RMB 100 million)
57.92 58.18 100.90 73.62
6 Cash dividend against net profit for legal person 44.17% 72.87% 40.00% 69.22%
7Cash dividend against net profit attributable to parent company in consolidated statements
51.19% 81.30% 41.58% 47.57%
Note: The cash dividend for 2014 was the proposed profit appropriation by the Board of Directors, which was subject to approval at the 2014 Shareholders’ Meeting.
(II) Profit Appropriation and Capitalizing of Capital Reserves Plan or Proposal in Last Three Years (Including the reporting period)
YearBonus share
per 10 shares (share)
Dividends per 10 shares
(RMB) (Incl. tax)
Capitalizing of capital reserves
Per 10 shares (share)
Cash dividends (incl. tax)
Net profit attributable to shareholders of listed
company in consolidated statements
Ratio against net profit attributable to shareholder of
listed company in consolidated statements (%)
2014 2,965 5,792 51.19
2013 4,731 5,818 81.3
2012 4,195 10,090 41.58
Unit: RMB million
IV. Active Performance of Social Responsibilities(I) Performance of social responsibility
Please refer to the sustainability report disclosed by the Company at http: //www.sse.com.cn for details.
(II) Environmental Protection of listed Companies and Their Subsidiaries Classified as Heavy Pollution Industry by the State Environmental Protection DepartmentFor environmental protection of the Company, please refer to the sustainability report disclosed by the Company at http: //www.sse.com.cn for details.
Section V Significant Events
24
I. Legal Litigation, Arbitration and Wide Criticism from the MediaThe Company was not involved in any material litigation, arbitration, or wide criticism from the media in the reporting period.
II. Capital Occupancy and Debt Settlement in the Reporting Period□ Applicable √ Not applicableThe Company was not involved in any non-operation capital occupancy in the reporting period.
III. Bankruptcies and RestructuringNo bankruptcies and restructuring were experienced in the reporting period.
IV. Asset Transaction and Corporate MergerEquity Acquisition of Yantai Lubao Steel Tube Co., Ltd.
In August, 2014, the Company paid RMB 110 million to acquire 20.18% equity of Yantai Lubao Steel Tube Co., Ltd. held by Laisteel Group Yantai Steel Tube Co., Ltd. The Company holds 100% equity of Yantai Lubao Steel Tube Co., Ltd after this acquisition.
V. Progress of “Share Incentive Scheme” and Its ImpactTo establish and perfect the medium and long term incentive mechanism of Baosteel Ltd., and to tightly combine the interest of executives of the Company and core technical personnel and management leaders who have direct impact on the Company’s overall performance and sustainable development with the interest of the Company, the investor and all stockholders to better realize the performance goal of the Company and operating development, according to relevant laws and regulations and provisions of superior competent departments, the first awarding of Share Incentive Scheme was performed on May 22, 2014, with 136 incentive objects and 47,446,100 shares in total, which were the Company’s A shares purchased back from Shanghai Stock Exchange by the Company through public bidding. The Company’s total share capital and share-holding rate of stockholders remained unchanged after the awarding. Relevant matters in regard to share incentive are as follows:
From March 27 to 28 of 2014, the 13th Meeting of Fifth Board of Directors of Baosteel Ltd. reviewed and approved the restricted stock plan and the
first awarding scheme, agreeing to submit the restricted stock plan and other related documents to General Meeting of Shareholders for review.
On March 28, 2014, independent directors of Baosteel Ltd. gave independent opinions that the Company was free from conditions prohibiting the implementation of restricted share incentive plan as regulated by laws and regulations and the Company had the qualification of entity in implementing restricted stock plan; incentive objects conformed to conditions stipulated by laws and regulations; restricted stock plan and the first awarding scheme had no prejudice on the interest of the Company and all shareholders.
After verification on March 28, 2014, the 11th Meeting of the Fifth Board of Supervisors of Baosteel Ltd. believed that the 136 incentive objects are in
line with conditions for incentive objects stipulated by laws, regulations and normative documents, thus legitimate and effective as incentive objects
On April 21, 2014, Baosteel Group Corporation received the Reply on the Implementation of Restricted Share Incentive Scheme by Baoshan Iron & Steel Co., Ltd. from SASAC, allowing Baosteel Ltd. to implement restricted share incentive plan and relevant performance assessment objectives.
On April 28, 2014, China Securities Regulatory Commission had no objection to the restricted stock plan and first awarding scheme and put on records.
On April 29, 2014, the 14th Meeting of the Fifth Board of Directors and the 12th Meeting of the Fifth Board of Supervisors of Baoshan Iron & Steel Co., Ltd. separately reviewed and approved the first awarding scheme (revised draft).
On May 20, 2014, 2014 First Extraordinary General Meeting of Shareholders of Baoshan Iron & Steel Co., Ltd. reviewed and approved the restricted stock plan, the first awarding scheme and related management measures.
On May 22, 2014, the 15th Meeting of the Fifth Board of Directors of Baoshan Iron & Steel Co., Ltd. reviewed and approved the Proposal about Determining Incentive Objects and Awarding Quantity Regarding A Share Restricted stock plan and Proposal about First Awarding of A Share Restricted stock plan First Implementation Scheme, and determined May 22, 2014 as the awarding date. Independent directors gave independent opinions; the 13th Meeting of the Fifth Board of Supervisors verified and approved the adjusted incentive objects list.
From May 23 to June 11 of 2014, through repeated buy-back, the number of shares repurchased was 47,446,100 in total, accounting for about 0.3% of the Company’s total share capital, with total payment amounting to RMB 187,734,750.08 (including commission and the like), the top price of the repurchase was RMB 3.99/share, and RMB 3.87/ share for the bottom price and RMB 3.96 / share for the average price.
On June 19, 2014, the 47,446,100 shares repurchased by the Company changed from tradable shares into shares subject to conditional sales.
The number of incentive objects of the share incentive scheme this time was 136 in total, quantity of awarding shares was 47,446,100 in total, and awarding price was RMB 1.91/ share. According to the capital verification report issued by Deloitte Touche Tohmatsu, as of June 17, 2014, the Company’s designated account had received a total of RMB 90,622,051 from 136 incentives objects.
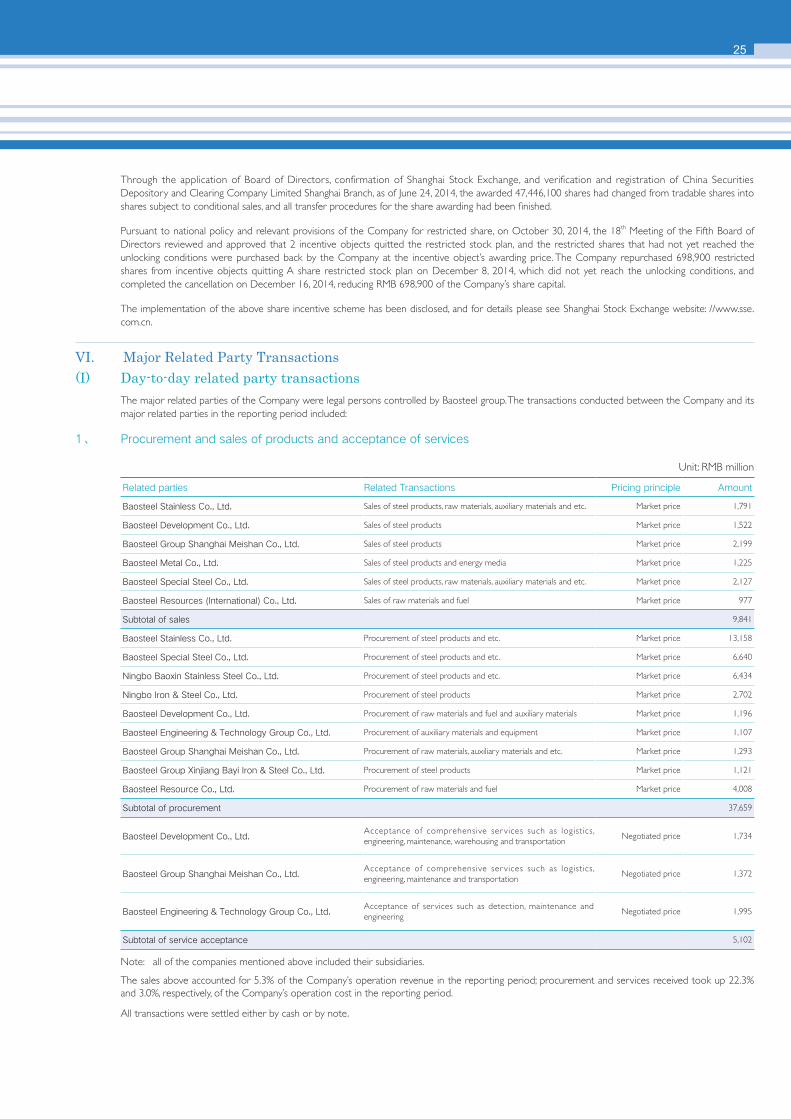
25
Through the application of Board of Directors, confirmation of Shanghai Stock Exchange, and verification and registration of China Securities Depository and Clearing Company Limited Shanghai Branch, as of June 24, 2014, the awarded 47,446,100 shares had changed from tradable shares into shares subject to conditional sales, and all transfer procedures for the share awarding had been finished.
Pursuant to national policy and relevant provisions of the Company for restricted share, on October 30, 2014, the 18th Meeting of the Fifth Board of Directors reviewed and approved that 2 incentive objects quitted the restricted stock plan, and the restricted shares that had not yet reached the unlocking conditions were purchased back by the Company at the incentive object’s awarding price. The Company repurchased 698,900 restricted shares from incentive objects quitting A share restricted stock plan on December 8, 2014, which did not yet reach the unlocking conditions, and completed the cancellation on December 16, 2014, reducing RMB 698,900 of the Company’s share capital.
The implementation of the above share incentive scheme has been disclosed, and for details please see Shanghai Stock Exchange website: //www.sse.com.cn.
VI. Major Related Party Transactions(I) Day-to-day related party transactions
The major related parties of the Company were legal persons controlled by Baosteel group. The transactions conducted between the Company and its major related parties in the reporting period included:
1、 Procurement and sales of products and acceptance of services
Related parties Related Transactions Pricing principle Amount
Baosteel Stainless Co., Ltd. Sales of steel products, raw materials, auxiliary materials and etc. Market price 1,791
Baosteel Development Co., Ltd. Sales of steel products Market price 1,522
Baosteel Group Shanghai Meishan Co., Ltd. Sales of steel products Market price 2,199
Baosteel Metal Co., Ltd. Sales of steel products and energy media Market price 1,225
Baosteel Special Steel Co., Ltd. Sales of steel products, raw materials, auxiliary materials and etc. Market price 2,127
Baosteel Resources (International) Co., Ltd. Sales of raw materials and fuel Market price 977
Subtotal of sales 9,841
Baosteel Stainless Co., Ltd. Procurement of steel products and etc. Market price 13,158
Baosteel Special Steel Co., Ltd. Procurement of steel products and etc. Market price 6,640
Ningbo Baoxin Stainless Steel Co., Ltd. Procurement of steel products and etc. Market price 6,434
Ningbo Iron & Steel Co., Ltd. Procurement of steel products Market price 2,702
Baosteel Development Co., Ltd. Procurement of raw materials and fuel and auxiliary materials Market price 1,196
Baosteel Engineering & Technology Group Co., Ltd. Procurement of auxiliary materials and equipment Market price 1,107
Baosteel Group Shanghai Meishan Co., Ltd. Procurement of raw materials, auxiliary materials and etc. Market price 1,293
Baosteel Group Xinjiang Bayi Iron & Steel Co., Ltd. Procurement of steel products Market price 1,121
Baosteel Resource Co., Ltd. Procurement of raw materials and fuel Market price 4,008
Subtotal of procurement 37,659
Baosteel Development Co., Ltd.Acceptance of comprehensive ser vices such as logistics, engineering, maintenance, warehousing and transportation
Negotiated price 1,734
Baosteel Group Shanghai Meishan Co., Ltd.Acceptance of comprehensive ser vices such as logistics, engineering, maintenance and transportation
Negotiated price 1,372
Baosteel Engineering & Technology Group Co., Ltd.Acceptance of services such as detection, maintenance and engineering
Negotiated price 1,995
Subtotal of service acceptance 5,102
Unit: RMB million
Note: all of the companies mentioned above included their subsidiaries.
The sales above accounted for 5.3% of the Company’s operation revenue in the reporting period; procurement and services received took up 22.3% and 3.0%, respectively, of the Company’s operation cost in the reporting period.
All transactions were settled either by cash or by note.
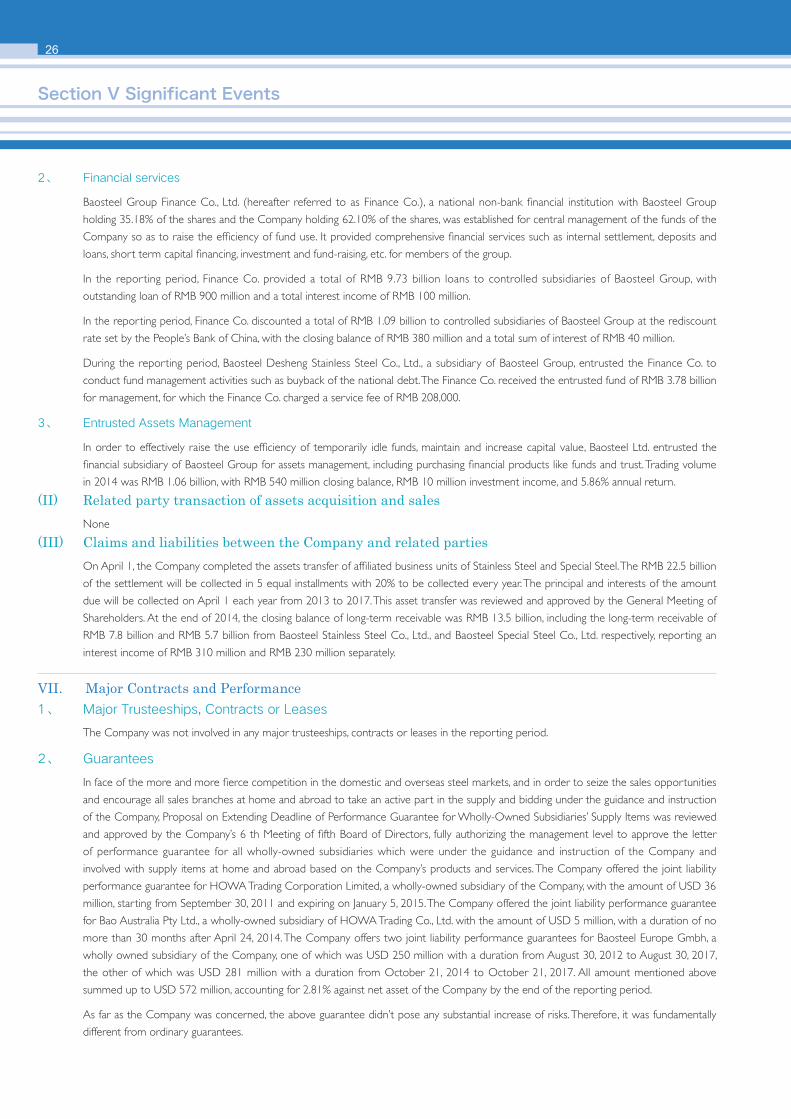
26
2、 Financial services
Baosteel Group Finance Co., Ltd. (hereafter referred to as Finance Co.), a national non-bank financial institution with Baosteel Group
holding 35.18% of the shares and the Company holding 62.10% of the shares, was established for central management of the funds of the
Company so as to raise the efficiency of fund use. It provided comprehensive financial services such as internal settlement, deposits and
loans, short term capital financing, investment and fund-raising, etc. for members of the group.
In the reporting period, Finance Co. provided a total of RMB 9.73 billion loans to controlled subsidiaries of Baosteel Group, with
outstanding loan of RMB 900 million and a total interest income of RMB 100 million.
In the reporting period, Finance Co. discounted a total of RMB 1.09 billion to controlled subsidiaries of Baosteel Group at the rediscount
rate set by the People’s Bank of China, with the closing balance of RMB 380 million and a total sum of interest of RMB 40 million.
During the reporting period, Baosteel Desheng Stainless Steel Co., Ltd., a subsidiary of Baosteel Group, entrusted the Finance Co. to
conduct fund management activities such as buyback of the national debt. The Finance Co. received the entrusted fund of RMB 3.78 billion
for management, for which the Finance Co. charged a service fee of RMB 208,000.
3、 Entrusted Assets Management
In order to effectively raise the use efficiency of temporarily idle funds, maintain and increase capital value, Baosteel Ltd. entrusted the
financial subsidiary of Baosteel Group for assets management, including purchasing financial products like funds and trust. Trading volume
in 2014 was RMB 1.06 billion, with RMB 540 million closing balance, RMB 10 million investment income, and 5.86% annual return.
(II) Related party transaction of assets acquisition and salesNone
(III) Claims and liabilities between the Company and related partiesOn April 1, the Company completed the assets transfer of affiliated business units of Stainless Steel and Special Steel. The RMB 22.5 billion
of the settlement will be collected in 5 equal installments with 20% to be collected every year. The principal and interests of the amount
due will be collected on April 1 each year from 2013 to 2017. This asset transfer was reviewed and approved by the General Meeting of
Shareholders. At the end of 2014, the closing balance of long-term receivable was RMB 13.5 billion, including the long-term receivable of
RMB 7.8 billion and RMB 5.7 billion from Baosteel Stainless Steel Co., Ltd., and Baosteel Special Steel Co., Ltd. respectively, reporting an
interest income of RMB 310 million and RMB 230 million separately.
VII. Major Contracts and Performance1、 Major Trusteeships, Contracts or Leases
The Company was not involved in any major trusteeships, contracts or leases in the reporting period.
2、 Guarantees
In face of the more and more fierce competition in the domestic and overseas steel markets, and in order to seize the sales opportunities
and encourage all sales branches at home and abroad to take an active part in the supply and bidding under the guidance and instruction
of the Company, Proposal on Extending Deadline of Performance Guarantee for Wholly-Owned Subsidiaries’ Supply Items was reviewed
and approved by the Company’s 6 th Meeting of fifth Board of Directors, fully authorizing the management level to approve the letter
of performance guarantee for all wholly-owned subsidiaries which were under the guidance and instruction of the Company and
involved with supply items at home and abroad based on the Company’s products and services. The Company offered the joint liability
performance guarantee for HOWA Trading Corporation Limited, a wholly-owned subsidiary of the Company, with the amount of USD 36
million, starting from September 30, 2011 and expiring on January 5, 2015. The Company offered the joint liability performance guarantee
for Bao Australia Pty Ltd., a wholly-owned subsidiary of HOWA Trading Co., Ltd. with the amount of USD 5 million, with a duration of no
more than 30 months after April 24, 2014. The Company offers two joint liability performance guarantees for Baosteel Europe Gmbh, a
wholly owned subsidiary of the Company, one of which was USD 250 million with a duration from August 30, 2012 to August 30, 2017,
the other of which was USD 281 million with a duration from October 21, 2014 to October 21, 2017. All amount mentioned above
summed up to USD 572 million, accounting for 2.81% against net asset of the Company by the end of the reporting period.
As far as the Company was concerned, the above guarantee didn’t pose any substantial increase of risks. Therefore, it was fundamentally
different from ordinary guarantees.
Section V Significant Events

27
3、 Other Major Contracts
None
VIII. Commitments and Performance
(I) Commitments of Listed Companies, Shareholders with over 5% Stock, Controlling Shareholders and Actual Controllers in and Continuing to the Reporting Period
1. Commitments related with the initial public offering (IPO)
Baosteel Group undertook the following two commitments as at the establishment of the Company:
(1) All related party transactions with the Company will be carried out in compliance with relevant laws, regulations and rules set by the
authorities and will not damage the legitimate interest of the Company nor its minority shareholders.
(2) Baosteel Group will not directly participate in any business activity or directly own an interest in any business activity or entity that
might pose competition to the Company’s current operating business. However, Baosteel Group can maintain its existing shares
in the Company, as well as manage and develop the existing business which may or may not be in competition with the Company.
Should Baosteel Group (including its wholly-owned and holding subsidiaries or other associates) engage in any new business,
investment or research that might be in competition with the principal products or services of the Company in the future, Baosteel
Group has agreed to grant the Company pre-emptive rights to develop or acquire the said business.
These commitments will stay in force under two conditions: A. the Company is listed on the Hong Kong Stock Exchange and domestic
stock exchange of China; and, B. Baosteel Group owns no less than 30% of the Company’s issued shares.
In addition, on June 13, 2001, and September 6, 2002, Baosteel Group further pledged to uphold these two commitments after the
Company’s acquisition of the assets related to construction of its phase three project and all remaining assets thereof.
These commitments were published on China Securities News, Shanghai Securities News and Securities Times dated 21st June 2001 and
12th September 2002 and the official website of Shanghai Stock Exchange (http://www.sse.com.cn) as well.
2. Commitments related with re-financing
Commitments made in the Prospectus of additional public offering by Baosteel Group:
(1) The Company has the right to acquire, at any time it thinks appropriate, Baosteel Group’s assets and businesses which may be in
competition with the Company.
(2) The Company shall enjoy the priority of similar business opportunities acquired by Baosteel Group, who will not invest until the
Company gives up the commercial opportunities.
(3) Baosteel Group is committed to helping dealing with the relevant property certificates for buildings and lands after the Company
completed the mergers and acquisitions.
These commitments were publicly posted on official website of the Shanghai Stock Exchange (http://www.sse.com.cn) in April 2005.
3. Other commitments
Commitments Baosteel Group undertook about Luojing Land:
Baosteel Group Shanghai Pudong Iron and Steel Co., Ltd. (hereafter, Pudong Steel), a wholly owned subsidiary of Baosteel Group, was
offering its construction-in-progress and related fixed assets in Luojing (hereafter, Luojing Assets), which the Company intended to
purchase. Luojing Assets cover an area of 3.228 million m2, for which Pudong Steel has paid some initial expenses, but not the land
transfer expense. When the assets are to be purchased, the unpaid land transfer expense and the Pudong Steel’s initial expenses as on
the asset-assessing day (30 September 2007), RMB 2.8 billion as preliminarily estimated, shall be paid by the Company. Baosteel Group
promises:
28
Change another accounting firm No
Original Now
Name of accounting firm in ChinaDeloitte Touche Tohmatsu Certified Public Accountants LLP
(special general partnership)Deloitte Touche Tohmatsu Certified Public Accountants LLP
(special general partnership)
Compensation of accounting firm in China 288
Audit Year Limit of accounting firm in China Five years
Name Compensation
Accounting Firm for Internal Control Audit Deloitte Touche Tohmatsu Certified Public Accountants LLP
(special general partnership)110
Financial Advisor
Sponsor
Unit: 10,000 RMB
Section V Significant Events
IX. Engagement and/or Termination of Accounting Firm
(1) If the Company intends to purchase the Luojing assets, Baosteel Group and/or Pudong Steel would help the Company to go through
the transfer procedures and other matters as required by the Company.
(2) In the event of the total actual expense exceeding RMB 2.8 billion for the procedures, Baosteel Group and/or Pudong Steel shall fully
cover the exceeding amount in time, by means of paying the Company and/or the government (as is required). The aforementioned
commitments were published on China Securities News, Shanghai Securities News and Securities Times and the official website of
Shanghai Stock Exchange (http://www.sse.com.cn) of 12 December 2007.
The aforementioned commitments were published on China Securities News, Shanghai Securities News and Securities Times and the
official website of Shanghai Stock Exchange (http://www.sse.com.cn) of December 12, 2007.
Commitments Baosteel Group undertook about Desheng Nickel Project:
Baosteel Group sought the Company’s opinion of investment in the Desheng Nickel Project on December 16, 2010 in written form of
“Solicit Letter about Investment on Desheng Nickel Project”, “Commitments about Desheng Nickel Project”. The Company agreed that
Baosteel Group could invest in the project, but retained the right to purchase the equity of the project. Baosteel Group promises: When
the Company wants to acquire the equity of the project, it would transfer its share of equity of the project at a fair price in line with
relative laws, regulations, and other documents and on basis of asset evaluation results as conducted by an individual assets evaluation
agency.
These commitments stay in force under two conditions: (a) the company is listed at a stock exchange and (b) Baosteel Group owns no
less than 30% of the Company’s issued shares.
The aforementioned commitments were published on China Securities News, Shanghai Securities News and Securities Times and the
official website of Shanghai Stock Exchange (http://www.sse.com.cn) of December 23, 2010.
During the reporting period, Baosteel Group and the Company did not breach any of the aforementioned commitments.
29
Notes for Engagement and/or Termination of accounting firm:
The Company continued to use the services of Deloitte Touche Tohmatsu (Deloitte) in 2014. The compensation paid to the accounting firm was detailed below:
1. The approach and amount of the compensation payable to the accounting firm for services was determined by the Shareholders’ Meeting. Meanwhile, compensation for auditing services employed by the Board of Directors was determined by the Board. Independent directors gave their unanimous consent to the compensation for the accounting firm.
2. As approved by 2013 Annual Shareholders’ Meeting, the auditing fees payable to Deloitte in 2013 was RMB 2.88 million. In addition, the Company paid Deloitte RMB 1.1 million for its internal control auditing work in 2014, which did not influence Deloitte’s independent audit, as the Board of Directors believed.
3. Until the year 2014, Deloitte has been continuously providing auditing service to the Company for five years. Signatory auditors to the Company’s 2014 Financial Statements were Zhu Xiaolan and Jiang Jian. The former has been providing auditing service to the Company for five consecutive years, and the latter for two consecutive years.
X. Punishment and Rectification of the Listed Company and Its Director, Supervisor, Senior Executives, Shareholders with over 5%, Actual Controller and Acquirer
None of the Company, its Board of Directors, directors, senior managers, shareholders or actual controllers was the subject of an investigation by the China Securities Regulatory Commission in the reporting year, neither were they posed to administrative punishment or cited or denounced by any Stock Exchange for any wrongdoing.
XI. Convertible Corporation Bonds√ Applicable □ Not applicable
(I) Issuance of convertible bondsApproved by China Securities Regulatory Commission (CSRC) in the document [2008] 739, the Company issued, on June 20, 2008, RMB 10 billion convertible bonds with attached warrants (hereinafter referred to as “convertible bonds”) with par value of RMB 100 per bond and a duration of six years. The coupon rate was 0.80%. On June 30, 2008, the convertible bond with warrants was separated into 100 million corporate bonds (a worth of RMB 10 billion) and 1.6 billion stock warrants.
Approved by Shanghai Stock Exchange in the document [2008] 81, corporate bonds of RMB 10 billion convertible bonds were listed and traded in Shanghai Stock Exchange from July 4, 2008. The bond was abbreviated as “08 Baosteel Bond” with the code of “126016”. The duration is from July 4, 2008 to June 19, 2014, with a payment date of five trading days later than June 19, 2014. “08 Baosteel Bond” was delisted and remove from Shanghai Stock Exchange from June 20, 2014.
Approved by Shanghai Stock Exchange in the document [2008]11, a total of 1.6 billion stock warrants after separation were listed in Shanghai Stock Exchange on July 4, 2008. The stock warrant was abbreviated as “Baosteel CWB1” with the code “580024”. The duration was from July 4, 2008 to July 3, 2010 and the exercising period was the trading days from June 28, 2010 to July 3, 2010, during which the warrants were to cease trading.
As of the market close on July 2, 2010, the exercise schedule for “Baosteel CWB1” was ended with 113,785 stock warrants exercised, resulting in an increase of 48,088 shares of the Company, and a total capital of RMB 567,438.40 raised. The raised capital has been used as disclosed in the prospectus. From July 7, 2010, the “Baosteel CWB1” stock warrants were delisted in Shanghai Stock Exchange.
Date of AdjustmentPrice after
AdjustmentDisclosure Date Disclosure Media Notes
June 15, 2009 12.16 June 15, 2009
China Securities News, Shanghai Securities News and Securities Times and the official
website of Shanghai Stock Exchange (http://www.sse.com.cn)
Dividend distribution
May 24, 2010 11.8 May 24, 2010
China Securities News, Shanghai Securities News and Securities Times and the official
website of Shanghai Stock Exchange (http://www.sse.com.cn)
Dividend distribution
Closing price for the convertible bond of the period
Unit: RMB
The exercise for “Baosteel CWB1” was ended.
(II) Changes of the Convertible Bond Price
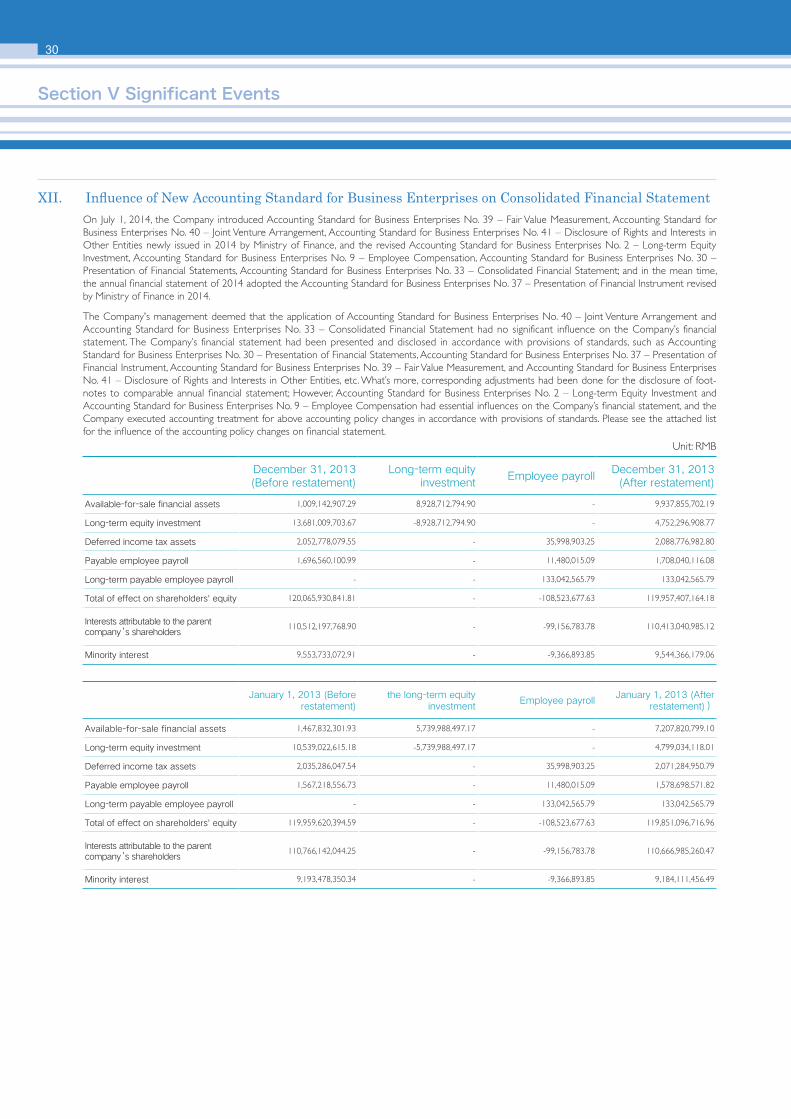
30
January 1, 2013 (Before restatement)
the long-term equity investment
Employee payrollJanuary 1, 2013 (After
restatement))
Available-for-sale financial assets 1,467,832,301.93 5,739,988,497.17 - 7,207,820,799.10
Long-term equity investment 10,539,022,615.18 -5,739,988,497.17 - 4,799,034,118.01
Deferred income tax assets 2,035,286,047.54 - 35,998,903.25 2,071,284,950.79
Payable employee payroll 1,567,218,556.73 - 11,480,015.09 1,578,698,571.82
Long-term payable employee payroll - - 133,042,565.79 133,042,565.79
Total of effect on shareholders' equity 119,959,620,394.59 - -108,523,677.63 119,851,096,716.96
Interests attributable to the parent company’s shareholders
110,766,142,044.25 - -99,156,783.78 110,666,985,260.47
Minority interest 9,193,478,350.34 - -9,366,893.85 9,184,111,456.49
December 31, 2013 (Before restatement)
Long-term equity investment
Employee payrollDecember 31, 2013
(After restatement)
Available-for-sale financial assets 1,009,142,907.29 8,928,712,794.90 - 9,937,855,702.19
Long-term equity investment 13,681,009,703.67 -8,928,712,794.90 - 4,752,296,908.77
Deferred income tax assets 2,052,778,079.55 - 35,998,903.25 2,088,776,982.80
Payable employee payroll 1,696,560,100.99 - 11,480,015.09 1,708,040,116.08
Long-term payable employee payroll - - 133,042,565.79 133,042,565.79
Total of effect on shareholders' equity 120,065,930,841.81 - -108,523,677.63 119,957,407,164.18
Interests attributable to the parent company’s shareholders
110,512,197,768.90 - -99,156,783.78 110,413,040,985.12
Minority interest 9,553,733,072.91 - -9,366,893.85 9,544,366,179.06
Unit: RMB
XII. Influence of New Accounting Standard for Business Enterprises on Consolidated Financial StatementOn July 1, 2014, the Company introduced Accounting Standard for Business Enterprises No. 39 – Fair Value Measurement, Accounting Standard for Business Enterprises No. 40 – Joint Venture Arrangement, Accounting Standard for Business Enterprises No. 41 – Disclosure of Rights and Interests in Other Entities newly issued in 2014 by Ministry of Finance, and the revised Accounting Standard for Business Enterprises No. 2 – Long-term Equity Investment, Accounting Standard for Business Enterprises No. 9 – Employee Compensation, Accounting Standard for Business Enterprises No. 30 – Presentation of Financial Statements, Accounting Standard for Business Enterprises No. 33 – Consolidated Financial Statement; and in the mean time, the annual financial statement of 2014 adopted the Accounting Standard for Business Enterprises No. 37 – Presentation of Financial Instrument revised by Ministry of Finance in 2014.
The Company's management deemed that the application of Accounting Standard for Business Enterprises No. 40 – Joint Venture Arrangement and Accounting Standard for Business Enterprises No. 33 – Consolidated Financial Statement had no significant influence on the Company’s financial statement. The Company’s financial statement had been presented and disclosed in accordance with provisions of standards, such as Accounting Standard for Business Enterprises No. 30 – Presentation of Financial Statements, Accounting Standard for Business Enterprises No. 37 – Presentation of Financial Instrument, Accounting Standard for Business Enterprises No. 39 – Fair Value Measurement, and Accounting Standard for Business Enterprises No. 41 – Disclosure of Rights and Interests in Other Entities, etc. What’s more, corresponding adjustments had been done for the disclosure of foot-notes to comparable annual financial statement; However, Accounting Standard for Business Enterprises No. 2 – Long-term Equity Investment and Accounting Standard for Business Enterprises No. 9 – Employee Compensation had essential influences on the Company’s financial statement, and the Company executed accounting treatment for above accounting policy changes in accordance with provisions of standards. Please see the attached list for the influence of the accounting policy changes on financial statement.
Section V Significant Events
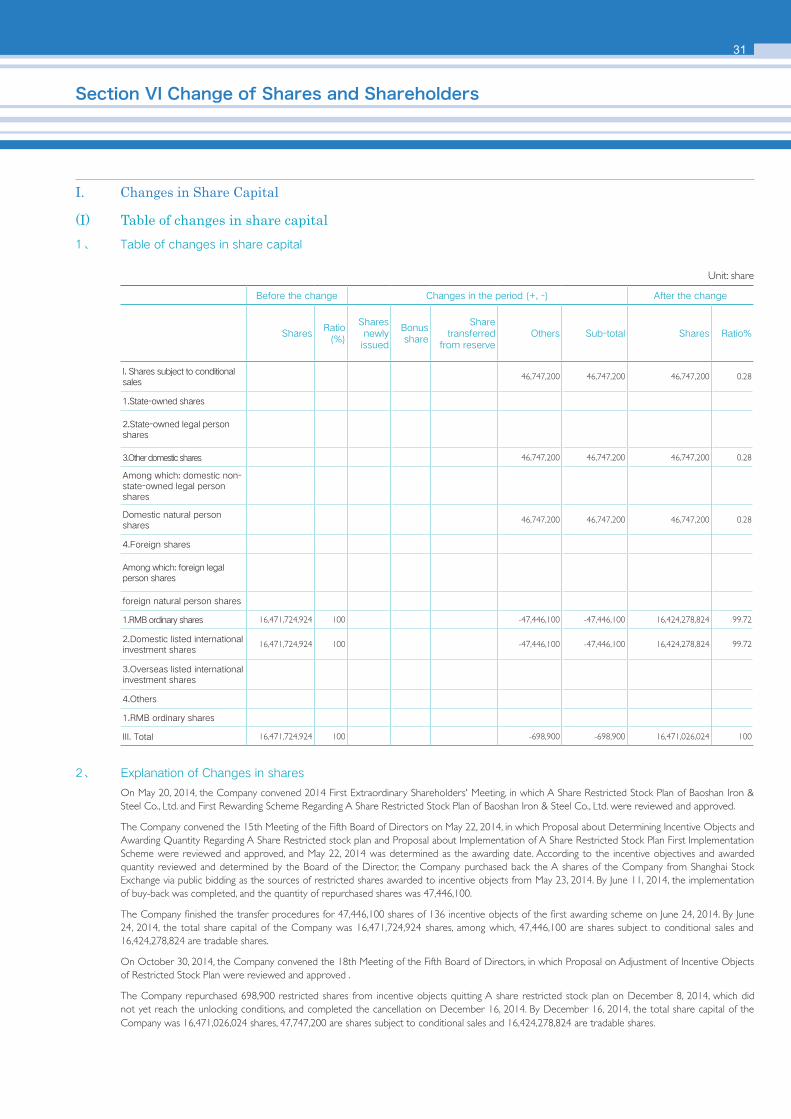
31
Section VI Change of Shares and Shareholders
Unit: share
I. Changes in Share Capital
(I) Table of changes in share capital1、 Table of changes in share capital
Before the change Changes in the period (+, -) After the change
SharesRatio
(%)
Shares newly
issued
Bonus share
Share transferred
from reserveOthers Sub-total Shares Ratio%
I. Shares subject to conditional sales
46,747,200 46,747,200 46,747,200 0.28
1.State-owned shares
2.State-owned legal person shares
3.Other domestic shares 46,747,200 46,747,200 46,747,200 0.28
Among which: domestic non-state-owned legal person shares
Domestic natural person shares
46,747,200 46,747,200 46,747,200 0.28
4.Foreign shares
Among which: foreign legal person shares
foreign natural person shares
1.RMB ordinary shares 16,471,724,924 100 -47,446,100 -47,446,100 16,424,278,824 99.72
2.Domestic listed international investment shares
16,471,724,924 100 -47,446,100 -47,446,100 16,424,278,824 99.72
3.Overseas listed international investment shares
4.Others
1.RMB ordinary shares
III. Total 16,471,724,924 100 -698,900 -698,900 16,471,026,024 100
2、 Explanation of Changes in shares
On May 20, 2014, the Company convened 2014 First Extraordinary Shareholders' Meeting, in which A Share Restricted Stock Plan of Baoshan Iron & Steel Co., Ltd. and First Rewarding Scheme Regarding A Share Restricted Stock Plan of Baoshan Iron & Steel Co., Ltd. were reviewed and approved.
The Company convened the 15th Meeting of the Fifth Board of Directors on May 22, 2014, in which Proposal about Determining Incentive Objects and Awarding Quantity Regarding A Share Restricted stock plan and Proposal about Implementation of A Share Restricted Stock Plan First Implementation Scheme were reviewed and approved, and May 22, 2014 was determined as the awarding date. According to the incentive objectives and awarded quantity reviewed and determined by the Board of the Director, the Company purchased back the A shares of the Company from Shanghai Stock Exchange via public bidding as the sources of restricted shares awarded to incentive objects from May 23, 2014. By June 11, 2014, the implementation of buy-back was completed, and the quantity of repurchased shares was 47,446,100.
The Company finished the transfer procedures for 47,446,100 shares of 136 incentive objects of the first awarding scheme on June 24, 2014. By June 24, 2014, the total share capital of the Company was 16,471,724,924 shares, among which, 47,446,100 are shares subject to conditional sales and 16,424,278,824 are tradable shares.
On October 30, 2014, the Company convened the 18th Meeting of the Fifth Board of Directors, in which Proposal on Adjustment of Incentive Objects of Restricted Stock Plan were reviewed and approved .
The Company repurchased 698,900 restricted shares from incentive objects quitting A share restricted stock plan on December 8, 2014, which did not yet reach the unlocking conditions, and completed the cancellation on December 16, 2014. By December 16, 2014, the total share capital of the Company was 16,471,026,024 shares, 47,747,200 are shares subject to conditional sales and 16,424,278,824 are tradable shares.
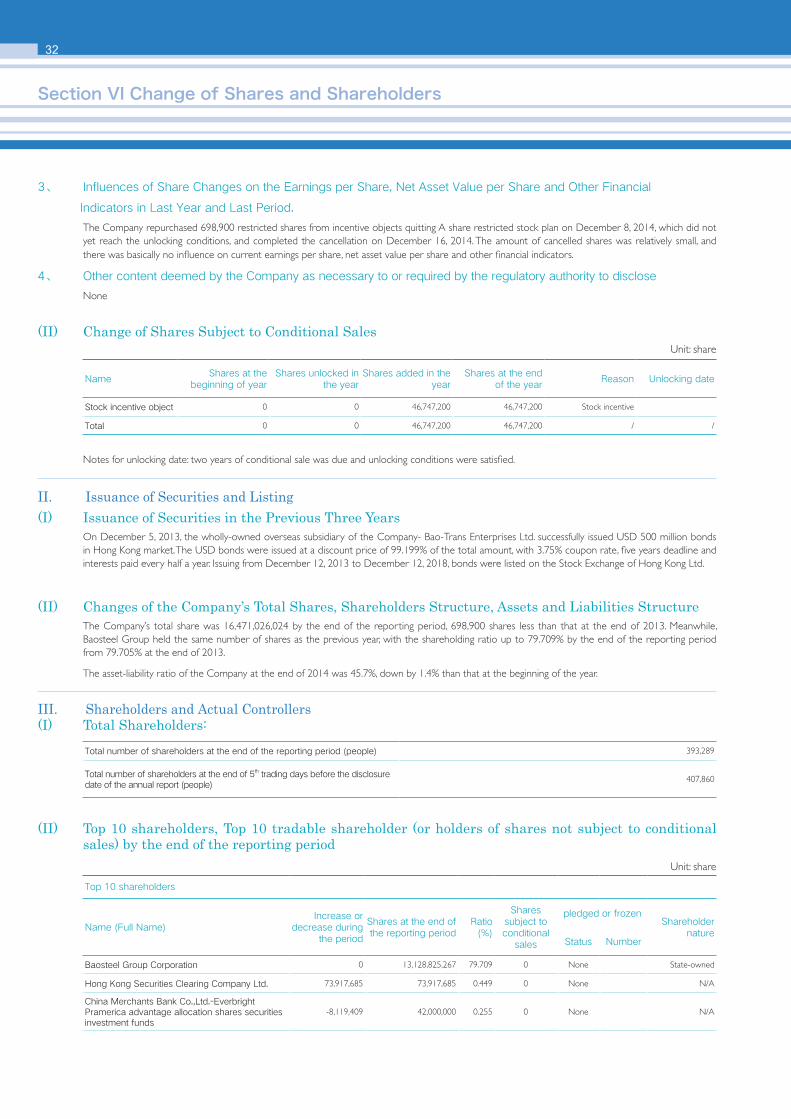
32
3、 Influences of Share Changes on the Earnings per Share, Net Asset Value per Share and Other Financial
Indicators in Last Year and Last Period.
The Company repurchased 698,900 restricted shares from incentive objects quitting A share restricted stock plan on December 8, 2014, which did not yet reach the unlocking conditions, and completed the cancellation on December 16, 2014. The amount of cancelled shares was relatively small, and there was basically no influence on current earnings per share, net asset value per share and other financial indicators.
4、 Other content deemed by the Company as necessary to or required by the regulatory authority to disclose
None
(II) Change of Shares Subject to Conditional Sales
Name Shares at the
beginning of yearShares unlocked in
the yearShares added in the
yearShares at the end
of the yearReason Unlocking date
Stock incentive object 0 0 46,747,200 46,747,200 Stock incentive
Total 0 0 46,747,200 46,747,200 / /
Total number of shareholders at the end of the reporting period (people) 393,289
Total number of shareholders at the end of 5th trading days before the disclosure date of the annual report (people)
407,860
Unit: share
Notes for unlocking date: two years of conditional sale was due and unlocking conditions were satisfied.
II. Issuance of Securities and Listing(I) Issuance of Securities in the Previous Three Years
On December 5, 2013, the wholly-owned overseas subsidiary of the Company- Bao-Trans Enterprises Ltd. successfully issued USD 500 million bonds in Hong Kong market. The USD bonds were issued at a discount price of 99.199% of the total amount, with 3.75% coupon rate, five years deadline and interests paid every half a year. Issuing from December 12, 2013 to December 12, 2018, bonds were listed on the Stock Exchange of Hong Kong Ltd.
(II) Changes of the Company’s Total Shares, Shareholders Structure, Assets and Liabilities StructureThe Company’s total share was 16,471,026,024 by the end of the reporting period, 698,900 shares less than that at the end of 2013. Meanwhile, Baosteel Group held the same number of shares as the previous year, with the shareholding ratio up to 79.709% by the end of the reporting period from 79.705% at the end of 2013.
The asset-liability ratio of the Company at the end of 2014 was 45.7%, down by 1.4% than that at the beginning of the year.
III. Shareholders and Actual Controllers (I) Total Shareholders:
Unit: share
(II) Top 10 shareholders, Top 10 tradable shareholder (or holders of shares not subject to conditional sales) by the end of the reporting period
Top 10 shareholders
Name (Full Name)Increase or
decrease during the period
Shares at the end of the reporting period
Ratio (%)
Shares subject to conditional
sales
pledged or frozenShareholder
natureStatus Number
Baosteel Group Corporation 0 13,128,825,267 79.709 0 None State-owned
Hong Kong Securities Clearing Company Ltd. 73,917,685 73,917,685 0.449 0 None N/A
China Merchants Bank Co.,Ltd.-Everbright Pramerica advantage allocation shares securities investment funds
-8,119,409 42,000,000 0.255 0 None N/A
Section VI Change of Shares and Shareholders
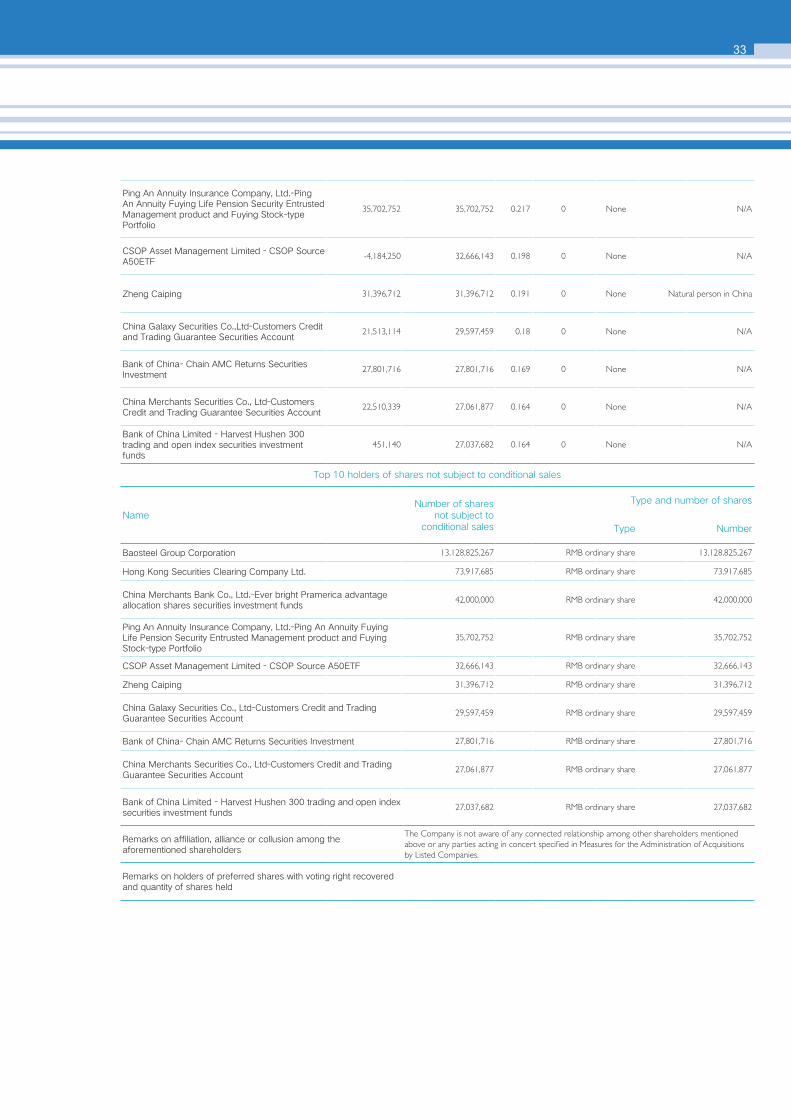
33
Ping An Annuity Insurance Company, Ltd.-Ping An Annuity Fuying Life Pension Security Entrusted Management product and Fuying Stock-type Portfolio
35,702,752 35,702,752 0.217 0 None N/A
CSOP Asset Management Limited - CSOP Source A50ETF
-4,184,250 32,666,143 0.198 0 None N/A
Zheng Caiping 31,396,712 31,396,712 0.191 0 None Natural person in China
China Galaxy Securities Co.,Ltd-Customers Credit and Trading Guarantee Securities Account
21,513,114 29,597,459 0.18 0 None N/A
Bank of China- Chain AMC Returns Securities Investment
27,801,716 27,801,716 0.169 0 None N/A
China Merchants Securities Co., Ltd-Customers Credit and Trading Guarantee Securities Account
22,510,339 27,061,877 0.164 0 None N/A
Bank of China Limited - Harvest Hushen 300 trading and open index securities investment funds
451,140 27,037,682 0.164 0 None N/A
Top 10 holders of shares not subject to conditional sales
NameNumber of shares
not subject to conditional sales
Type and number of shares
Type Number
Baosteel Group Corporation 13,128,825,267 RMB ordinary share 13,128,825,267
Hong Kong Securities Clearing Company Ltd. 73,917,685 RMB ordinary share 73,917,685
China Merchants Bank Co., Ltd.-Ever bright Pramerica advantage allocation shares securities investment funds
42,000,000 RMB ordinary share 42,000,000
Ping An Annuity Insurance Company, Ltd.-Ping An Annuity Fuying Life Pension Security Entrusted Management product and Fuying Stock-type Portfolio
35,702,752 RMB ordinary share 35,702,752
CSOP Asset Management Limited - CSOP Source A50ETF 32,666,143 RMB ordinary share 32,666,143
Zheng Caiping 31,396,712 RMB ordinary share 31,396,712
China Galaxy Securities Co., Ltd-Customers Credit and Trading Guarantee Securities Account
29,597,459 RMB ordinary share 29,597,459
Bank of China- Chain AMC Returns Securities Investment 27,801,716 RMB ordinary share 27,801,716
China Merchants Securities Co., Ltd-Customers Credit and Trading Guarantee Securities Account
27,061,877 RMB ordinary share 27,061,877
Bank of China Limited - Harvest Hushen 300 trading and open index securities investment funds
27,037,682 RMB ordinary share 27,037,682
Remarks on affiliation, alliance or collusion among the aforementioned shareholders
The Company is not aware of any connected relationship among other shareholders mentioned above or any parties acting in concert specified in Measures for the Administration of Acquisitions by Listed Companies.
Remarks on holders of preferred shares with voting right recovered and quantity of shares held
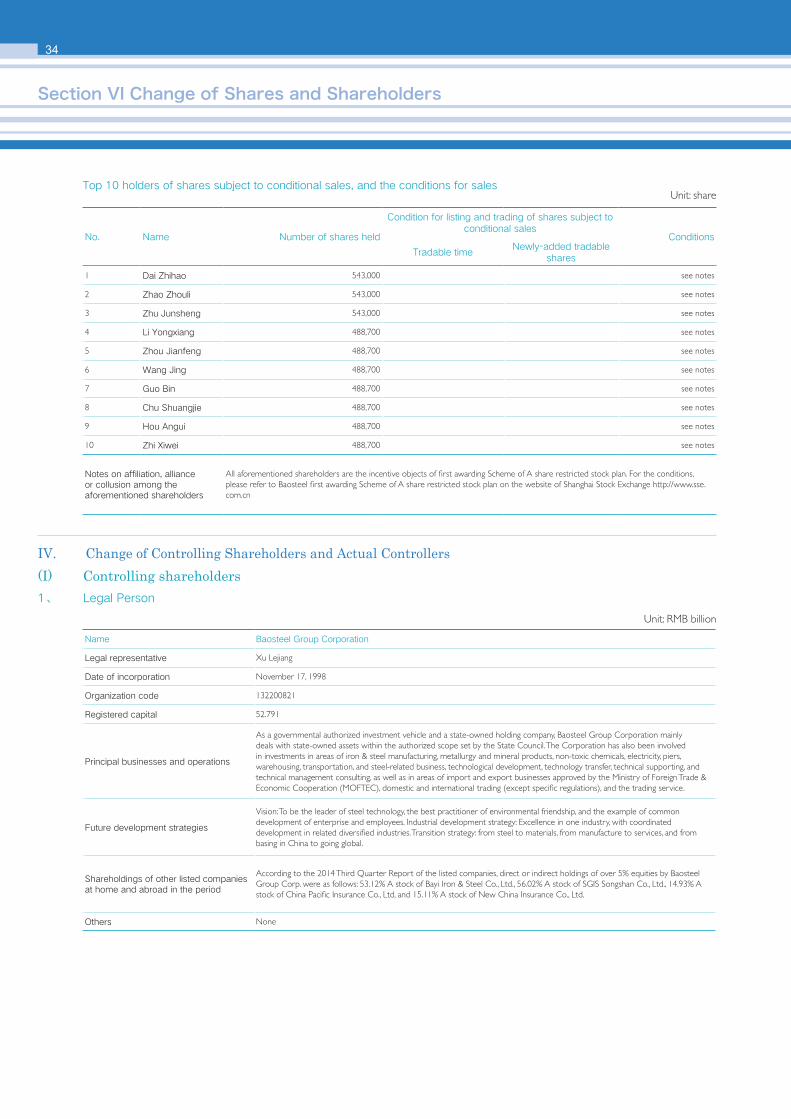
34
Top 10 holders of shares subject to conditional sales, and the conditions for sales
No. Name Number of shares held
Condition for listing and trading of shares subject to conditional sales
Conditions
Tradable timeNewly-added tradable
shares
1 Dai Zhihao 543,000 see notes
2 Zhao Zhouli 543,000 see notes
3 Zhu Junsheng 543,000 see notes
4 Li Yongxiang 488,700 see notes
5 Zhou Jianfeng 488,700 see notes
6 Wang Jing 488,700 see notes
7 Guo Bin 488,700 see notes
8 Chu Shuangjie 488,700 see notes
9 Hou Angui 488,700 see notes
10 Zhi Xiwei 488,700 see notes
Notes on affiliation, alliance or collusion among the aforementioned shareholders
All aforementioned shareholders are the incentive objects of first awarding Scheme of A share restricted stock plan. For the conditions, please refer to Baosteel first awarding Scheme of A share restricted stock plan on the website of Shanghai Stock Exchange http://www.sse.com.cn
Unit: share
Unit: RMB billion
IV. Change of Controlling Shareholders and Actual Controllers(I) Controlling shareholders1、 Legal Person
Name Baosteel Group Corporation
Legal representative Xu Lejiang
Date of incorporation November 17, 1998
Organization code 132200821
Registered capital 52.791
Principal businesses and operations
As a governmental authorized investment vehicle and a state-owned holding company, Baosteel Group Corporation mainly deals with state-owned assets within the authorized scope set by the State Council. The Corporation has also been involved in investments in areas of iron & steel manufacturing, metallurgy and mineral products, non-toxic chemicals, electricity, piers, warehousing, transportation, and steel-related business, technological development, technology transfer, technical supporting, and technical management consulting, as well as in areas of import and export businesses approved by the Ministry of Foreign Trade & Economic Cooperation (MOFTEC), domestic and international trading (except specific regulations), and the trading service.
Future development strategies
Vision: To be the leader of steel technology, the best practitioner of environmental friendship, and the example of common development of enterprise and employees. Industrial development strategy: Excellence in one industry, with coordinated development in related diversified industries. Transition strategy: from steel to materials, from manufacture to services, and from basing in China to going global.
Shareholdings of other listed companies at home and abroad in the period
According to the 2014 Third Quarter Report of the listed companies, direct or indirect holdings of over 5% equities by Baosteel Group Corp. were as follows: 53.12% A stock of Bayi Iron & Steel Co., Ltd., 56.02% A stock of SGIS Songshan Co., Ltd., 14.93% A stock of China Pacific Insurance Co., Ltd, and 15.11% A stock of New China Insurance Co., Ltd.
Others None
Section VI Change of Shares and Shareholders
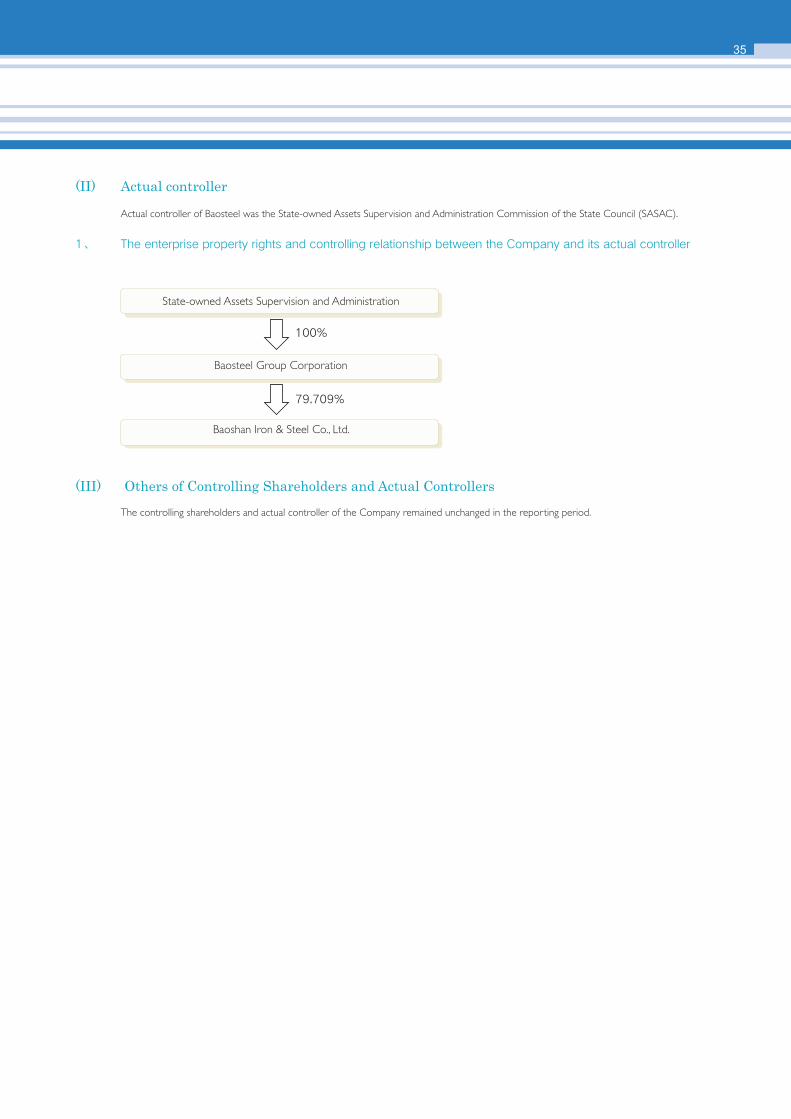
35
(II) Actual controller
Actual controller of Baosteel was the State-owned Assets Supervision and Administration Commission of the State Council (SASAC).
1、 The enterprise property rights and controlling relationship between the Company and its actual controller
(III) Others of Controlling Shareholders and Actual Controllers
The controlling shareholders and actual controller of the Company remained unchanged in the reporting period.
79.709%
100%
State-owned Assets Supervision and Administration
Baosteel Group Corporation
Baoshan Iron & Steel Co., Ltd.

Section VII Preferred Stock
36
Not applicable to the Company.
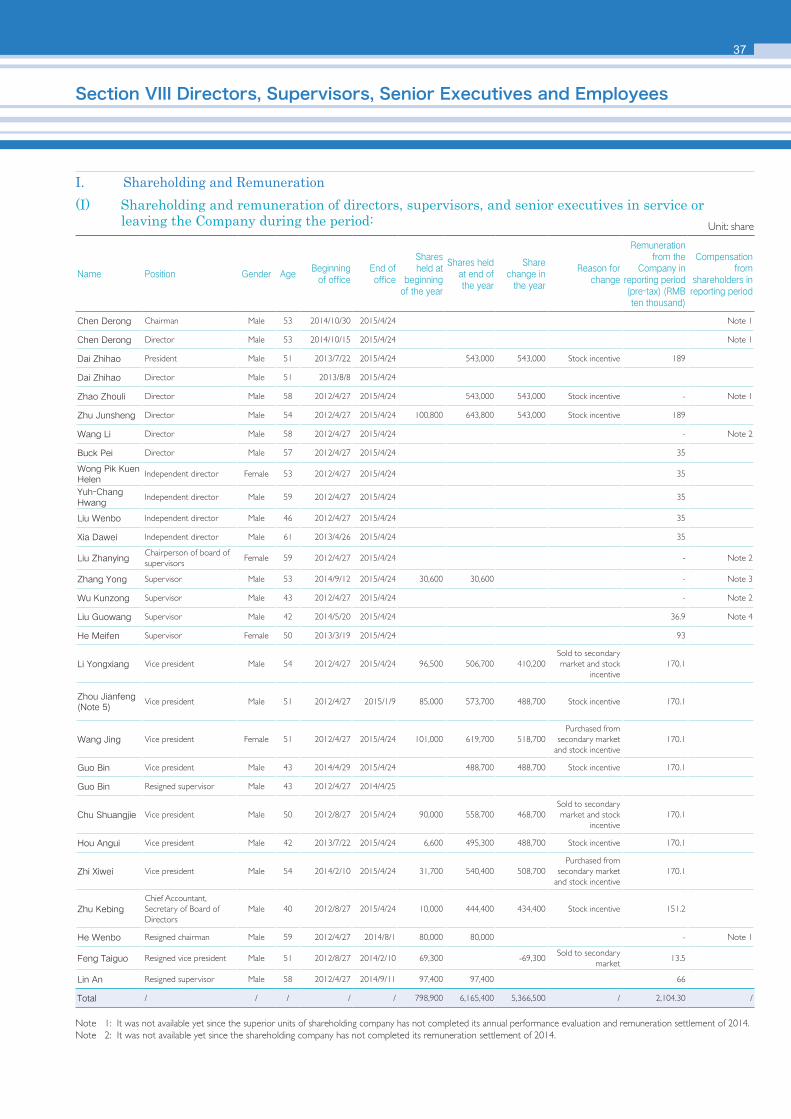
37
Section VIII Directors, Supervisors, Senior Executives and Employees
I. Shareholding and Remuneration(I) Shareholding and remuneration of directors, supervisors, and senior executives in service or leaving the Company during the period:
Name Position Gender AgeBeginning
of officeEnd of office
Shares held at
beginning of the year
Shares held at end of the year
Share change in
the year
Reason for change
Remuneration from the
Company in reporting period (pre-tax) (RMB ten thousand)
Compensation from
shareholders in reporting period
Chen Derong Chairman Male 53 2014/10/30 2015/4/24 Note 1
Chen Derong Director Male 53 2014/10/15 2015/4/24 Note 1
Dai Zhihao President Male 51 2013/7/22 2015/4/24 543,000 543,000 Stock incentive 189
Dai Zhihao Director Male 51 2013/8/8 2015/4/24
Zhao Zhouli Director Male 58 2012/4/27 2015/4/24 543,000 543,000 Stock incentive - Note 1
Zhu Junsheng Director Male 54 2012/4/27 2015/4/24 100,800 643,800 543,000 Stock incentive 189
Wang Li Director Male 58 2012/4/27 2015/4/24 - Note 2
Buck Pei Director Male 57 2012/4/27 2015/4/24 35
Wong Pik Kuen Helen
Independent director Female 53 2012/4/27 2015/4/24 35
Yuh-Chang Hwang
Independent director Male 59 2012/4/27 2015/4/24 35
Liu Wenbo Independent director Male 46 2012/4/27 2015/4/24 35
Xia Dawei Independent director Male 61 2013/4/26 2015/4/24 35
Liu ZhanyingChairperson of board of supervisors
Female 59 2012/4/27 2015/4/24 - Note 2
Zhang Yong Supervisor Male 53 2014/9/12 2015/4/24 30,600 30,600 - Note 3
Wu Kunzong Supervisor Male 43 2012/4/27 2015/4/24 - Note 2
Liu Guowang Supervisor Male 42 2014/5/20 2015/4/24 36.9 Note 4
He Meifen Supervisor Female 50 2013/3/19 2015/4/24 93
Li Yongxiang Vice president Male 54 2012/4/27 2015/4/24 96,500 506,700 410,200Sold to secondary market and stock
incentive170.1
Zhou Jianfeng (Note 5)
Vice president Male 51 2012/4/27 2015/1/9 85,000 573,700 488,700 Stock incentive 170.1
Wang Jing Vice president Female 51 2012/4/27 2015/4/24 101,000 619,700 518,700Purchased from
secondary market and stock incentive
170.1
Guo Bin Vice president Male 43 2014/4/29 2015/4/24 488,700 488,700 Stock incentive 170.1
Guo Bin Resigned supervisor Male 43 2012/4/27 2014/4/25
Chu Shuangjie Vice president Male 50 2012/8/27 2015/4/24 90,000 558,700 468,700Sold to secondary market and stock
incentive170.1
Hou Angui Vice president Male 42 2013/7/22 2015/4/24 6,600 495,300 488,700 Stock incentive 170.1
Zhi Xiwei Vice president Male 54 2014/2/10 2015/4/24 31,700 540,400 508,700Purchased from
secondary market and stock incentive
170.1
Zhu KebingChief Accountant, Secretary of Board of Directors
Male 40 2012/8/27 2015/4/24 10,000 444,400 434,400 Stock incentive 151.2
He Wenbo Resigned chairman Male 59 2012/4/27 2014/8/1 80,000 80,000 - Note 1
Feng Taiguo Resigned vice president Male 51 2012/8/27 2014/2/10 69,300 -69,300Sold to secondary
market 13.5
Lin An Resigned supervisor Male 58 2012/4/27 2014/9/11 97,400 97,400 66
Total / / / / / 798,900 6,165,400 5,366,500 / 2,104.30 /
Unit: share
Note 1: It was not available yet since the superior units of shareholding company has not completed its annual performance evaluation and remuneration settlement of 2014.Note 2: It was not available yet since the shareholding company has not completed its remuneration settlement of 2014.
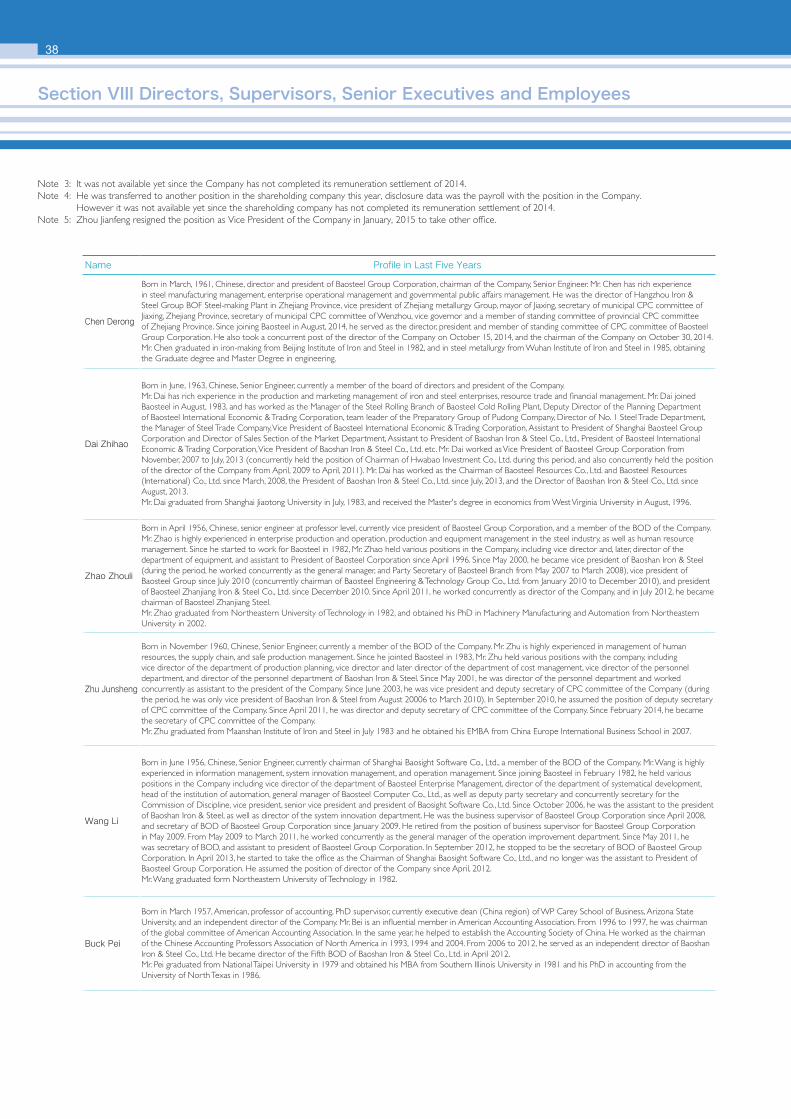
38
Name Profile in Last Five Years
Chen Derong
Born in March, 1961, Chinese, director and president of Baosteel Group Corporation, chairman of the Company, Senior Engineer. Mr. Chen has rich experience in steel manufacturing management, enterprise operational management and governmental public affairs management. He was the director of Hangzhou Iron & Steel Group BOF Steel-making Plant in Zhejiang Province, vice president of Zhejiang metallurgy Group, mayor of Jiaxing, secretary of municipal CPC committee of Jiaxing, Zhejiang Province, secretary of municipal CPC committee of Wenzhou, vice governor and a member of standing committee of provincial CPC committee of Zhejiang Province. Since joining Baosteel in August, 2014, he served as the director, president and member of standing committee of CPC committee of Baosteel Group Corporation. He also took a concurrent post of the director of the Company on October 15, 2014, and the chairman of the Company on October 30, 2014.Mr. Chen graduated in iron-making from Beijing Institute of Iron and Steel in 1982, and in steel metallurgy from Wuhan Institute of Iron and Steel in 1985, obtaining the Graduate degree and Master Degree in engineering.
Dai Zhihao
Born in June, 1963, Chinese, Senior Engineer, currently a member of the board of directors and president of the Company. Mr. Dai has rich experience in the production and marketing management of iron and steel enterprises, resource trade and financial management. Mr. Dai joined Baosteel in August, 1983, and has worked as the Manager of the Steel Rolling Branch of Baosteel Cold Rolling Plant, Deputy Director of the Planning Department of Baosteel International Economic & Trading Corporation, team leader of the Preparatory Group of Pudong Company, Director of No. 1 Steel Trade Department, the Manager of Steel Trade Company, Vice President of Baosteel International Economic & Trading Corporation, Assistant to President of Shanghai Baosteel Group Corporation and Director of Sales Section of the Market Department, Assistant to President of Baoshan Iron & Steel Co., Ltd., President of Baosteel International Economic & Trading Corporation, Vice President of Baoshan Iron & Steel Co., Ltd. etc. Mr. Dai worked as Vice President of Baosteel Group Corporation from November, 2007 to July, 2013 (concurrently held the position of Chairman of Hwabao Investment Co., Ltd. during this period, and also concurrently held the position of the director of the Company from April, 2009 to April, 2011). Mr. Dai has worked as the Chairman of Baosteel Resources Co., Ltd. and Baosteel Resources (International) Co., Ltd. since March, 2008, the President of Baoshan Iron & Steel Co., Ltd. since July, 2013, and the Director of Baoshan Iron & Steel Co., Ltd. since August, 2013.Mr. Dai graduated from Shanghai Jiaotong University in July, 1983, and received the Master's degree in economics from West Virginia University in August, 1996.
Zhao Zhouli
Born in April 1956, Chinese, senior engineer at professor level, currently vice president of Baosteel Group Corporation, and a member of the BOD of the Company. Mr. Zhao is highly experienced in enterprise production and operation, production and equipment management in the steel industry, as well as human resource management. Since he started to work for Baosteel in 1982, Mr. Zhao held various positions in the Company, including vice director and, later, director of the department of equipment, and assistant to President of Baosteel Corporation since April 1996. Since May 2000, he became vice president of Baoshan Iron & Steel (during the period, he worked concurrently as the general manager, and Party Secretary of Baosteel Branch from May 2007 to March 2008), vice president of Baosteel Group since July 2010 (concurrently chairman of Baosteel Engineering & Technology Group Co., Ltd. from January 2010 to December 2010), and president of Baosteel Zhanjiang Iron & Steel Co., Ltd. since December 2010. Since April 2011, he worked concurrently as director of the Company, and in July 2012, he became chairman of Baosteel Zhanjiang Steel. Mr. Zhao graduated from Northeastern University of Technology in 1982, and obtained his PhD in Machinery Manufacturing and Automation from Northeastern University in 2002.
Zhu Junsheng
Born in November 1960, Chinese, Senior Engineer, currently a member of the BOD of the Company. Mr. Zhu is highly experienced in management of human resources, the supply chain, and safe production management. Since he jointed Baosteel in 1983, Mr. Zhu held various positions with the company, including vice director of the department of production planning, vice director and later director of the department of cost management, vice director of the personnel department, and director of the personnel department of Baoshan Iron & Steel. Since May 2001, he was director of the personnel department and worked concurrently as assistant to the president of the Company. Since June 2003, he was vice president and deputy secretary of CPC committee of the Company (during the period, he was only vice president of Baoshan Iron & Steel from August 20006 to March 2010). In September 2010, he assumed the position of deputy secretary of CPC committee of the Company. Since April 2011, he was director and deputy secretary of CPC committee of the Company. Since February 2014, he became the secretary of CPC committee of the Company.Mr. Zhu graduated from Maanshan Institute of Iron and Steel in July 1983 and he obtained his EMBA from China Europe International Business School in 2007.
Wang Li
Born in June 1956, Chinese, Senior Engineer, currently chairman of Shanghai Baosight Software Co., Ltd., a member of the BOD of the Company. Mr. Wang is highly experienced in information management, system innovation management, and operation management. Since joining Baosteel in February 1982, he held various positions in the Company including vice director of the department of Baosteel Enterprise Management, director of the department of systematical development, head of the institution of automation, general manager of Baosteel Computer Co., Ltd., as well as deputy party secretary and concurrently secretary for the Commission of Discipline, vice president, senior vice president and president of Baosight Software Co., Ltd. Since October 2006, he was the assistant to the president of Baoshan Iron & Steel, as well as director of the system innovation department. He was the business supervisor of Baosteel Group Corporation since April 2008, and secretary of BOD of Baosteel Group Corporation since January 2009. He retired from the position of business supervisor for Baosteel Group Corporation in May 2009. From May 2009 to March 2011, he worked concurrently as the general manager of the operation improvement department. Since May 2011, he was secretary of BOD, and assistant to president of Baosteel Group Corporation. In September 2012, he stopped to be the secretary of BOD of Baosteel Group Corporation. In April 2013, he started to take the office as the Chairman of Shanghai Baosight Software Co., Ltd., and no longer was the assistant to President of Baosteel Group Corporation. He assumed the position of director of the Company since April, 2012. Mr. Wang graduated form Northeastern University of Technology in 1982.
Buck Pei
Born in March 1957, American, professor of accounting, PhD supervisor, currently executive dean (China region) of WP Carey School of Business, Arizona State University, and an independent director of the Company. Mr. Bei is an influential member in American Accounting Association. From 1996 to 1997, he was chairman of the global committee of American Accounting Association. In the same year, he helped to establish the Accounting Society of China. He worked as the chairman of the Chinese Accounting Professors Association of North America in 1993, 1994 and 2004. From 2006 to 2012, he served as an independent director of Baoshan Iron & Steel Co., Ltd. He became director of the Fifth BOD of Baoshan Iron & Steel Co., Ltd. in April 2012. Mr. Pei graduated from National Taipei University in 1979 and obtained his MBA from Southern Illinois University in 1981 and his PhD in accounting from the University of North Texas in 1986.
Note 3: It was not available yet since the Company has not completed its remuneration settlement of 2014.Note 4: He was transferred to another position in the shareholding company this year, disclosure data was the payroll with the position in the Company. However it was not available yet since the shareholding company has not completed its remuneration settlement of 2014.Note 5: Zhou Jianfeng resigned the position as Vice President of the Company in January, 2015 to take other office.
Section VIII Directors, Supervisors, Senior Executives and Employees
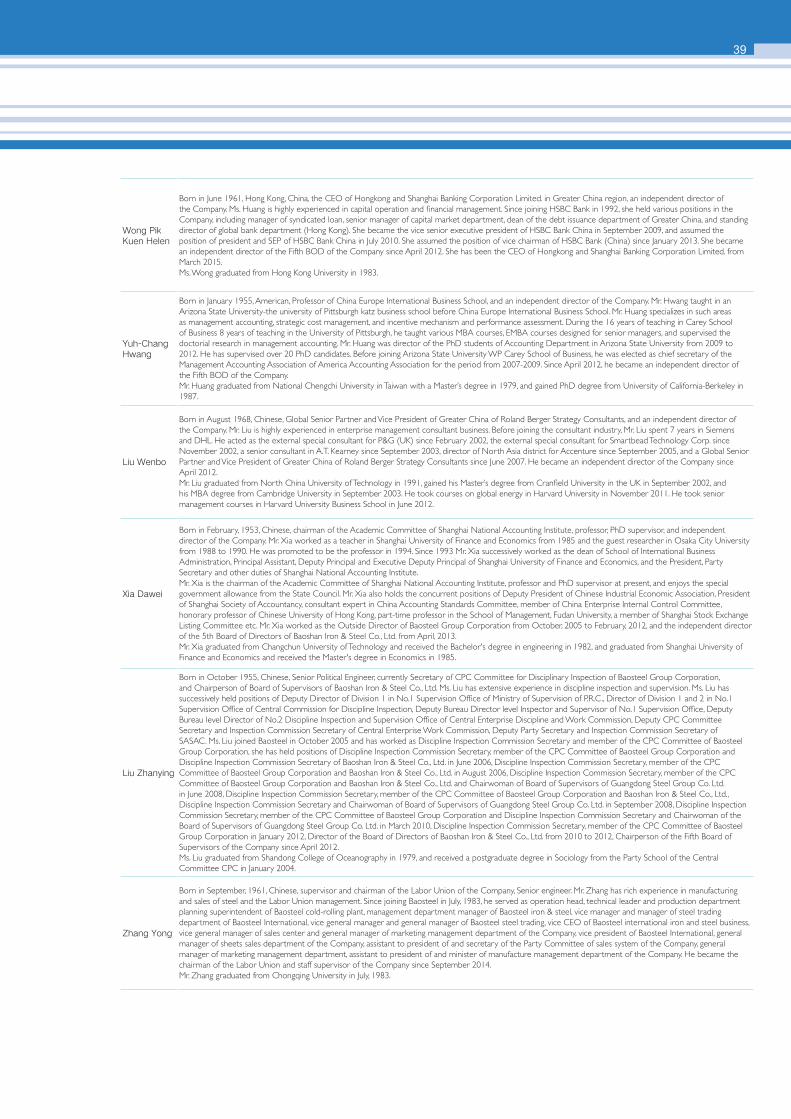
39
Wong Pik Kuen Helen
Born in June 1961, Hong Kong, China, the CEO of Hongkong and Shanghai Banking Corporation Limited. in Greater China region, an independent director of the Company. Ms. Huang is highly experienced in capital operation and financial management. Since joining HSBC Bank in 1992, she held various positions in the Company, including manager of syndicated loan, senior manager of capital market department, dean of the debt issuance department of Greater China, and standing director of global bank department (Hong Kong). She became the vice senior executive president of HSBC Bank China in September 2009, and assumed the position of president and SEP of HSBC Bank China in July 2010. She assumed the position of vice chairman of HSBC Bank (China) since January 2013. She became an independent director of the Fifth BOD of the Company since April 2012. She has been the CEO of Hongkong and Shanghai Banking Corporation Limited. from March 2015.Ms. Wong graduated from Hong Kong University in 1983.
Yuh-Chang Hwang
Born in January 1955, American, Professor of China Europe International Business School, and an independent director of the Company. Mr. Hwang taught in an Arizona State University-the university of Pittsburgh katz business school before China Europe International Business School. Mr. Huang specializes in such areas as management accounting, strategic cost management, and incentive mechanism and performance assessment. During the 16 years of teaching in Carey School of Business 8 years of teaching in the University of Pittsburgh, he taught various MBA courses, EMBA courses designed for senior managers, and supervised the doctorial research in management accounting. Mr. Huang was director of the PhD students of Accounting Department in Arizona State University from 2009 to 2012. He has supervised over 20 PhD candidates. Before joining Arizona State University WP Carey School of Business, he was elected as chief secretary of the Management Accounting Association of America Accounting Association for the period from 2007-2009. Since April 2012, he became an independent director of the Fifth BOD of the Company. Mr. Huang graduated from National Chengchi University in Taiwan with a Master’s degree in 1979, and gained PhD degree from University of California-Berkeley in 1987.
Liu Wenbo
Born in August 1968, Chinese, Global Senior Partner and Vice President of Greater China of Roland Berger Strategy Consultants, and an independent director of the Company. Mr. Liu is highly experienced in enterprise management consultant business. Before joining the consultant industry, Mr. Liu spent 7 years in Siemens and DHL. He acted as the external special consultant for P&G (UK) since February 2002, the external special consultant for Smartbead Technology Corp. since November 2002, a senior consultant in A.T. Kearney since September 2003, director of North Asia district for Accenture since September 2005, and a Global Senior Partner and Vice President of Greater China of Roland Berger Strategy Consultants since June 2007. He became an independent director of the Company since April 2012. Mr. Liu graduated from North China University of Technology in 1991, gained his Master’s degree from Cranfield University in the UK in September 2002, and his MBA degree from Cambridge University in September 2003. He took courses on global energy in Harvard University in November 2011. He took senior management courses in Harvard University Business School in June 2012.
Xia Dawei
Born in February, 1953, Chinese, chairman of the Academic Committee of Shanghai National Accounting Institute, professor, PhD supervisor, and independent director of the Company. Mr. Xia worked as a teacher in Shanghai University of Finance and Economics from 1985 and the guest researcher in Osaka City University from 1988 to 1990. He was promoted to be the professor in 1994. Since 1993 Mr. Xia successively worked as the dean of School of International Business Administration, Principal Assistant, Deputy Principal and Executive Deputy Principal of Shanghai University of Finance and Economics, and the President, Party Secretary and other duties of Shanghai National Accounting Institute. Mr. Xia is the chairman of the Academic Committee of Shanghai National Accounting Institute, professor and PhD supervisor at present, and enjoys the special government allowance from the State Council. Mr. Xia also holds the concurrent positions of Deputy President of Chinese Industrial Economic Association, President of Shanghai Society of Accountancy, consultant expert in China Accounting Standards Committee, member of China Enterprise Internal Control Committee, honorary professor of Chinese University of Hong Kong, part-time professor in the School of Management, Fudan University, a member of Shanghai Stock Exchange Listing Committee etc. Mr. Xia worked as the Outside Director of Baosteel Group Corporation from October, 2005 to February, 2012, and the independent director of the 5th Board of Directors of Baoshan Iron & Steel Co., Ltd. from April, 2013.Mr. Xia graduated from Changchun University of Technology and received the Bachelor's degree in engineering in 1982, and graduated from Shanghai University of Finance and Economics and received the Master's degree in Economics in 1985.
Liu Zhanying
Born in October 1955, Chinese, Senior Political Engineer, currently Secretary of CPC Committee for Disciplinary Inspection of Baosteel Group Corporation, and Chairperson of Board of Supervisors of Baoshan Iron & Steel Co., Ltd. Ms. Liu has extensive experience in discipline inspection and supervision. Ms. Liu has successively held positions of Deputy Director of Division 1 in No.1 Supervision Office of Ministry of Supervision of P.R.C., Director of Division 1 and 2 in No.1 Supervision Office of Central Commission for Discipline Inspection, Deputy Bureau Director level Inspector and Supervisor of No.1 Supervision Office, Deputy Bureau level Director of No.2 Discipline Inspection and Supervision Office of Central Enterprise Discipline and Work Commission, Deputy CPC Committee Secretary and Inspection Commission Secretary of Central Enterprise Work Commission, Deputy Party Secretary and Inspection Commission Secretary of SASAC. Ms. Liu joined Baosteel in October 2005 and has worked as Discipline Inspection Commission Secretary and member of the CPC Committee of Baosteel Group Corporation, she has held positions of Discipline Inspection Commission Secretary, member of the CPC Committee of Baosteel Group Corporation and Discipline Inspection Commission Secretary of Baoshan Iron & Steel Co., Ltd. in June 2006, Discipline Inspection Commission Secretary, member of the CPC Committee of Baosteel Group Corporation and Baoshan Iron & Steel Co., Ltd. in August 2006, Discipline Inspection Commission Secretary, member of the CPC Committee of Baosteel Group Corporation and Baoshan Iron & Steel Co., Ltd. and Chairwoman of Board of Supervisors of Guangdong Steel Group Co. Ltd. in June 2008, Discipline Inspection Commission Secretary, member of the CPC Committee of Baosteel Group Corporation and Baoshan Iron & Steel Co., Ltd., Discipline Inspection Commission Secretary and Chairwoman of Board of Supervisors of Guangdong Steel Group Co. Ltd. in September 2008, Discipline Inspection Commission Secretary, member of the CPC Committee of Baosteel Group Corporation and Discipline Inspection Commission Secretary and Chairwoman of the Board of Supervisors of Guangdong Steel Group Co. Ltd. in March 2010, Discipline Inspection Commission Secretary, member of the CPC Committee of Baosteel Group Corporation in January 2012, Director of the Board of Directors of Baoshan Iron & Steel Co., Ltd. from 2010 to 2012, Chairperson of the Fifth Board of Supervisors of the Company since April 2012.Ms. Liu graduated from Shandong College of Oceanography in 1979, and received a postgraduate degree in Sociology from the Party School of the Central Committee CPC in January 2004.
Zhang Yong
Born in September, 1961, Chinese, supervisor and chairman of the Labor Union of the Company, Senior engineer. Mr. Zhang has rich experience in manufacturing and sales of steel and the Labor Union management. Since joining Baosteel in July, 1983, he served as operation head, technical leader and production department planning superintendent of Baosteel cold-rolling plant, management department manager of Baosteel iron & steel, vice manager and manager of steel trading department of Baosteel International, vice general manager and general manager of Baosteel steel trading, vice CEO of Baosteel international iron and steel business, vice general manager of sales center and general manager of marketing management department of the Company, vice president of Baosteel International, general manager of sheets sales department of the Company, assistant to president of and secretary of the Party Committee of sales system of the Company, general manager of marketing management department, assistant to president of and minister of manufacture management department of the Company. He became the chairman of the Labor Union and staff supervisor of the Company since September 2014.Mr. Zhang graduated from Chongqing University in July, 1983.
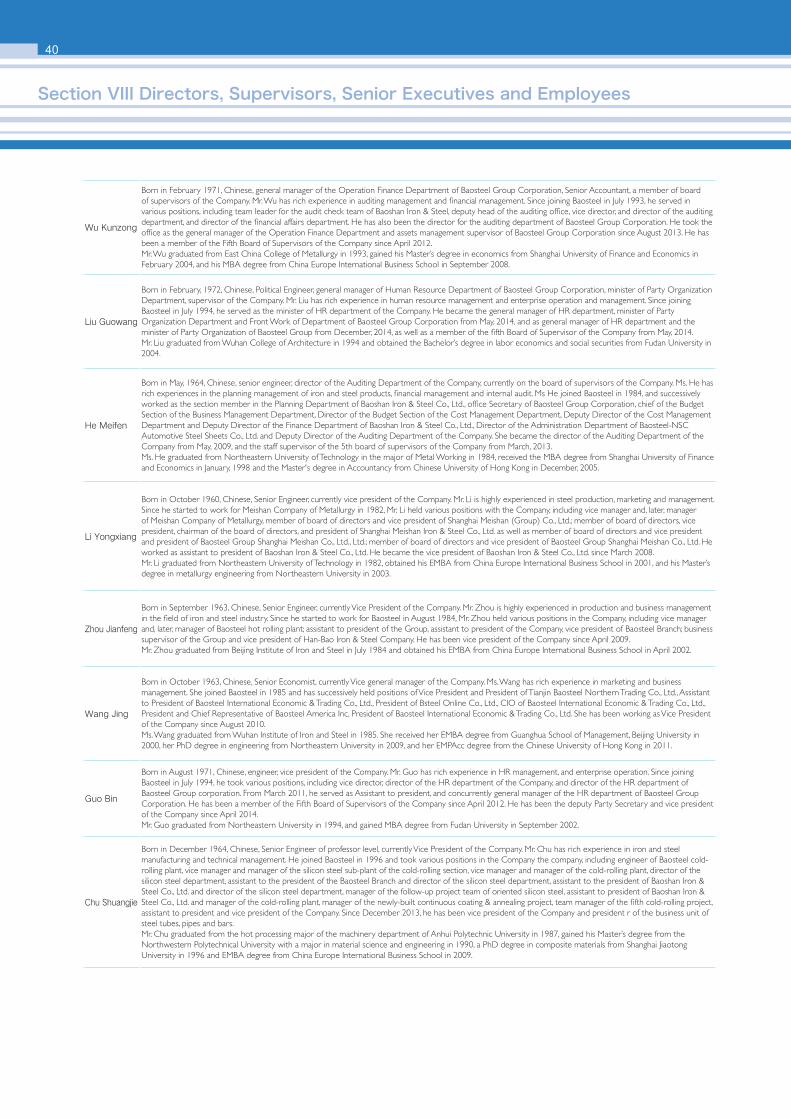
40
Wu Kunzong
Born in February 1971, Chinese, general manager of the Operation Finance Department of Baosteel Group Corporation, Senior Accountant, a member of board of supervisors of the Company. Mr. Wu has rich experience in auditing management and financial management. Since joining Baosteel in July 1993, he served in various positions, including team leader for the audit check team of Baoshan Iron & Steel, deputy head of the auditing office, vice director, and director of the auditing department, and director of the financial affairs department. He has also been the director for the auditing department of Baosteel Group Corporation. He took the office as the general manager of the Operation Finance Department and assets management supervisor of Baosteel Group Corporation since August 2013. He has been a member of the Fifth Board of Supervisors of the Company since April 2012. Mr. Wu graduated from East China College of Metallurgy in 1993, gained his Master’s degree in economics from Shanghai University of Finance and Economics in February 2004, and his MBA degree from China Europe International Business School in September 2008.
Liu Guowang
Born in February, 1972, Chinese, Political Engineer, general manager of Human Resource Department of Baosteel Group Corporation, minister of Party Organization Department, supervisor of the Company. Mr. Liu has rich experience in human resource management and enterprise operation and management. Since joining Baosteel in July 1994, he served as the minister of HR department of the Company. He became the general manager of HR department, minister of Party Organization Department and Front Work of Department of Baosteel Group Corporation from May, 2014, and as general manager of HR department and the minister of Party Organization of Baosteel Group from December, 2014, as well as a member of the fifth Board of Supervisor of the Company from May, 2014.Mr. Liu graduated from Wuhan College of Architecture in 1994 and obtained the Bachelor’s degree in labor economics and social securities from Fudan University in 2004.
He Meifen
Born in May, 1964, Chinese, senior engineer, director of the Auditing Department of the Company, currently on the board of supervisors of the Company. Ms. He has rich experiences in the planning management of iron and steel products, financial management and internal audit. Ms He joined Baosteel in 1984, and successively worked as the section member in the Planning Department of Baoshan Iron & Steel Co., Ltd., office Secretary of Baosteel Group Corporation, chief of the Budget Section of the Business Management Department, Director of the Budget Section of the Cost Management Department, Deputy Director of the Cost Management Department and Deputy Director of the Finance Department of Baoshan Iron & Steel Co., Ltd., Director of the Administration Department of Baosteel-NSC Automotive Steel Sheets Co., Ltd. and Deputy Director of the Auditing Department of the Company. She became the director of the Auditing Department of the Company from May, 2009, and the staff supervisor of the 5th board of supervisors of the Company from March, 2013. Ms. He graduated from Northeastern University of Technology in the major of Metal Working in 1984, received the MBA degree from Shanghai University of Finance and Economics in January, 1998 and the Master's degree in Accountancy from Chinese University of Hong Kong in December, 2005.
Li Yongxiang
Born in October 1960, Chinese, Senior Engineer, currently vice president of the Company. Mr. Li is highly experienced in steel production, marketing and management. Since he started to work for Meishan Company of Metallurgy in 1982, Mr. Li held various positions with the Company, including vice manager and, later, manager of Meishan Company of Metallurgy, member of board of directors and vice president of Shanghai Meishan (Group) Co., Ltd.; member of board of directors, vice president, chairman of the board of directors, and president of Shanghai Meishan Iron & Steel Co., Ltd. as well as member of board of directors and vice president and president of Baosteel Group Shanghai Meishan Co., Ltd., Ltd.; member of board of directors and vice president of Baosteel Group Shanghai Meishan Co., Ltd. He worked as assistant to president of Baoshan Iron & Steel Co., Ltd. He became the vice president of Baoshan Iron & Steel Co., Ltd. since March 2008.Mr. Li graduated from Northeastern University of Technology in 1982, obtained his EMBA from China Europe International Business School in 2001, and his Master’s degree in metallurgy engineering from Northeastern University in 2003.
Zhou Jianfeng
Born in September 1963, Chinese, Senior Engineer, currently Vice President of the Company. Mr. Zhou is highly experienced in production and business management in the field of iron and steel industry. Since he started to work for Baosteel in August 1984, Mr. Zhou held various positions in the Company, including vice manager and, later, manager of Baosteel hot rolling plant; assistant to president of the Group, assistant to president of the Company, vice president of Baosteel Branch; business supervisor of the Group and vice president of Han-Bao Iron & Steel Company. He has been vice president of the Company since April 2009.Mr. Zhou graduated from Beijing Institute of Iron and Steel in July 1984 and obtained his EMBA from China Europe International Business School in April 2002.
Wang Jing
Born in October 1963, Chinese, Senior Economist, currently Vice general manager of the Company. Ms. Wang has rich experience in marketing and business management. She joined Baosteel in 1985 and has successively held positions of Vice President and President of Tianjin Baosteel Northern Trading Co., Ltd., Assistant to President of Baosteel International Economic & Trading Co., Ltd., President of Bsteel Online Co., Ltd., CIO of Baosteel International Economic & Trading Co., Ltd., President and Chief Representative of Baosteel America Inc, President of Baosteel International Economic & Trading Co., Ltd. She has been working as Vice President of the Company since August 2010. Ms. Wang graduated from Wuhan Institute of Iron and Steel in 1985. She received her EMBA degree from Guanghua School of Management, Beijing University in 2000, her PhD degree in engineering from Northeastern University in 2009, and her EMPAcc degree from the Chinese University of Hong Kong in 2011.
Guo Bin
Born in August 1971, Chinese, engineer, vice president of the Company. Mr. Guo has rich experience in HR management, and enterprise operation. Since joining Baosteel in July 1994, he took various positions, including vice director, director of the HR department of the Company, and director of the HR department of Baosteel Group corporation. From March 2011, he served as Assistant to president, and concurrently general manager of the HR department of Baosteel Group Corporation. He has been a member of the Fifth Board of Supervisors of the Company since April 2012. He has been the deputy Party Secretary and vice president of the Company since April 2014.Mr. Guo graduated from Northeastern University in 1994, and gained MBA degree from Fudan University in September 2002.
Chu Shuangjie
Born in December 1964, Chinese, Senior Engineer of professor level, currently Vice President of the Company. Mr. Chu has rich experience in iron and steel manufacturing and technical management. He joined Baosteel in 1996 and took various positions in the Company the company, including engineer of Baosteel cold-rolling plant, vice manager and manager of the silicon steel sub-plant of the cold-rolling section, vice manager and manager of the cold-rolling plant, director of the silicon steel department, assistant to the president of the Baosteel Branch and director of the silicon steel department, assistant to the president of Baoshan Iron & Steel Co., Ltd. and director of the silicon steel department, manager of the follow-up project team of oriented silicon steel, assistant to president of Baoshan Iron & Steel Co., Ltd. and manager of the cold-rolling plant, manager of the newly-built continuous coating & annealing project, team manager of the fifth cold-rolling project, assistant to president and vice president of the Company. Since December 2013, he has been vice president of the Company and president r of the business unit of steel tubes, pipes and bars. Mr. Chu graduated from the hot processing major of the machinery department of Anhui Polytechnic University in 1987, gained his Master’s degree from the Northwestern Polytechnical University with a major in material science and engineering in 1990, a PhD degree in composite materials from Shanghai Jiaotong University in 1996 and EMBA degree from China Europe International Business School in 2009.
Section VIII Directors, Supervisors, Senior Executives and Employees
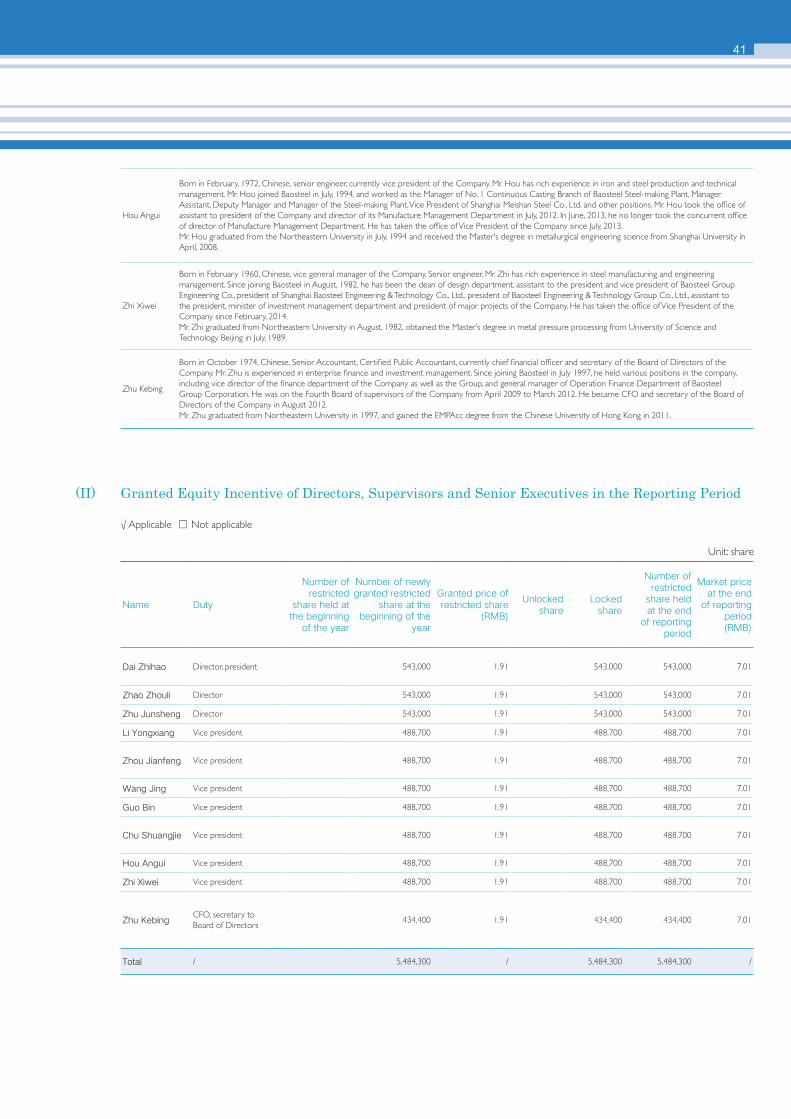
41
Hou Angui
Born in February, 1972, Chinese, senior engineer, currently vice president of the Company. Mr. Hou has rich experience in iron and steel production and technical management. Mr. Hou joined Baosteel in July, 1994, and worked as the Manager of No. 1 Continuous Casting Branch of Baosteel Steel-making Plant, Manager Assistant, Deputy Manager and Manager of the Steel-making Plant, Vice President of Shanghai Meishan Steel Co., Ltd. and other positions. Mr. Hou took the office of assistant to president of the Company and director of its Manufacture Management Department in July, 2012. In June, 2013, he no longer took the concurrent office of director of Manufacture Management Department. He has taken the office of Vice President of the Company since July, 2013.Mr. Hou graduated from the Northeastern University in July, 1994 and received the Master's degree in metallurgical engineering science from Shanghai University in April, 2008.
Zhi Xiwei
Born in February 1960, Chinese, vice general manager of the Company, Senior engineer. Mr. Zhi has rich experience in steel manufacturing and engineering management. Since joining Baosteel in August, 1982, he has been the dean of design department, assistant to the president and vice president of Baosteel Group Engineering Co., president of Shanghai Baosteel Engineering & Technology Co., Ltd., president of Baosteel Engineering & Technology Group Co., Ltd., assistant to the president, minister of investment management department and president of major projects of the Company. He has taken the office of Vice President of the Company since February, 2014.Mr. Zhi graduated from Northeastern University in August, 1982, obtained the Master’s degree in metal pressure processing from University of Science and Technology Beijing in July, 1989.
Zhu Kebing
Born in October 1974, Chinese, Senior Accountant, Certified Public Accountant, currently chief financial officer and secretary of the Board of Directors of the Company. Mr. Zhu is experienced in enterprise finance and investment management. Since joining Baosteel in July 1997, he held various positions in the company, including vice director of the finance department of the Company as well as the Group, and general manager of Operation Finance Department of Baosteel Group Corporation. He was on the Fourth Board of supervisors of the Company from April 2009 to March 2012. He became CFO and secretary of the Board of Directors of the Company in August 2012.Mr. Zhu graduated from Northeastern University in 1997, and gained the EMPAcc degree from the Chinese University of Hong Kong in 2011.
(II) Granted Equity Incentive of Directors, Supervisors and Senior Executives in the Reporting Period
√ Applicable □ Not applicable
Name Duty
Number of restricted
share held at the beginning
of the year
Number of newly granted restricted
share at the beginning of the
year
Granted price of restricted share
(RMB)
Unlocked share
Locked share
Number of restricted
share held at the end
of reporting period
Market price at the end
of reporting period (RMB)
Dai Zhihao Director, president 543,000 1.91 543,000 543,000 7.01
Zhao Zhouli Director 543,000 1.91 543,000 543,000 7.01
Zhu Junsheng Director 543,000 1.91 543,000 543,000 7.01
Li Yongxiang Vice president 488,700 1.91 488,700 488,700 7.01
Zhou Jianfeng Vice president 488,700 1.91 488,700 488,700 7.01
Wang Jing Vice president 488,700 1.91 488,700 488,700 7.01
Guo Bin Vice president 488,700 1.91 488,700 488,700 7.01
Chu Shuangjie Vice president 488,700 1.91 488,700 488,700 7.01
Hou Angui Vice president 488,700 1.91 488,700 488,700 7.01
Zhi Xiwei Vice president 488,700 1.91 488,700 488,700 7.01
Zhu KebingCFO, secretary toBoard of Directors
434,400 1.91 434,400 434,400 7.01
Total / 5,484,300 / 5,484,300 5,484,300 /
Unit: share
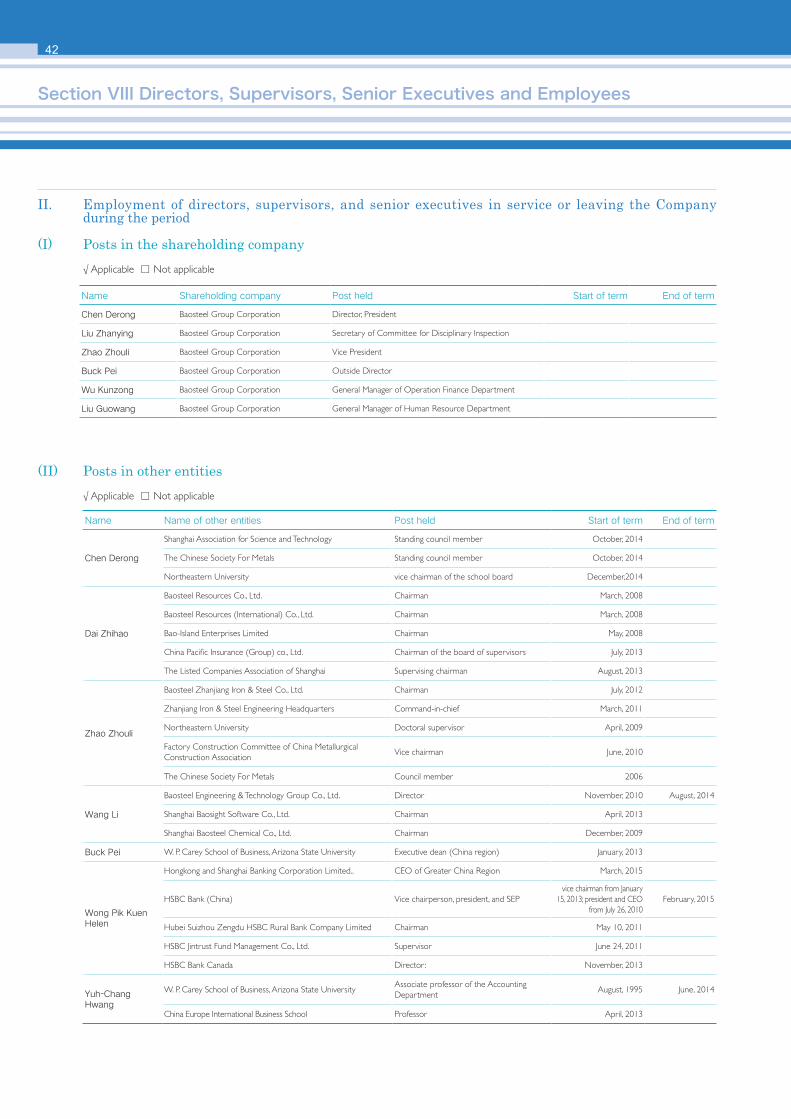
42
Name Shareholding company Post held Start of term End of term
Chen Derong Baosteel Group Corporation Director, President
Liu Zhanying Baosteel Group Corporation Secretary of Committee for Disciplinary Inspection
Zhao Zhouli Baosteel Group Corporation Vice President
Buck Pei Baosteel Group Corporation Outside Director
Wu Kunzong Baosteel Group Corporation General Manager of Operation Finance Department
Liu Guowang Baosteel Group Corporation General Manager of Human Resource Department
II. Employment of directors, supervisors, and senior executives in service or leaving the Company during the period
(I) Posts in the shareholding company√ Applicable □ Not applicable
Section VIII Directors, Supervisors, Senior Executives and Employees
(II) Posts in other entities√ Applicable □ Not applicable
Name Name of other entities Post held Start of term End of term
Chen Derong
Shanghai Association for Science and Technology Standing council member October, 2014
The Chinese Society For Metals Standing council member October, 2014
Northeastern University vice chairman of the school board December,2014
Dai Zhihao
Baosteel Resources Co., Ltd. Chairman March, 2008
Baosteel Resources (International) Co., Ltd. Chairman March, 2008
Bao-Island Enterprises Limited Chairman May, 2008
China Pacific Insurance (Group) co., Ltd. Chairman of the board of supervisors July, 2013
The Listed Companies Association of Shanghai Supervising chairman August, 2013
Zhao Zhouli
Baosteel Zhanjiang Iron & Steel Co., Ltd. Chairman July, 2012
Zhanjiang Iron & Steel Engineering Headquarters Command-in-chief March, 2011
Northeastern University Doctoral supervisor April, 2009
Factory Construction Committee of China Metallurgical Construction Association
Vice chairman June, 2010
The Chinese Society For Metals Council member 2006
Wang Li
Baosteel Engineering & Technology Group Co., Ltd. Director November, 2010 August, 2014
Shanghai Baosight Software Co., Ltd. Chairman April, 2013
Shanghai Baosteel Chemical Co., Ltd. Chairman December, 2009
Buck Pei W. P. Carey School of Business, Arizona State University Executive dean (China region) January, 2013
Wong Pik Kuen Helen
Hongkong and Shanghai Banking Corporation Limited.. CEO of Greater China Region March, 2015
HSBC Bank (China) Vice chairperson, president, and SEPvice chairman from January
15, 2013; president and CEO from July 26, 2010
February, 2015
Hubei Suizhou Zengdu HSBC Rural Bank Company Limited Chairman May 10, 2011
HSBC Jintrust Fund Management Co., Ltd. Supervisor June 24, 2011
HSBC Bank Canada Director: November, 2013
Yuh-Chang Hwang
W. P. Carey School of Business, Arizona State UniversityAssociate professor of the Accounting Department
August, 1995 June, 2014
China Europe International Business School Professor April, 2013

43
Name Name of other entities Post held Start of term End of term
Liu Wenbo Roland Berger Strategy ConsultantsMember of the Global Strategy Committee, Global Senior Partner and Vice President of Greater China Area
June, 2007
Xia Dawei
China United Network Communications Limited Independent Director November, 2009
Shanghai Electric Power Co., Ltd. Independent Director November, 2009
Lianhua Supermarket Co., Ltd. Independent Director September, 2004
China Rongsheng Heavy Industry Group Holdings Co., Ltd. Independent Director December, 2012
Zhang Yong Bsteel Online Co., Ltd. Director November, 2011
Wu Kunzong
Baosteel Special Steel Co., Ltd. Supervisor April. 2012
Baosteel Stainless Steel Co., Ltd., Supervisor April, 2012
Shanghai Baosteel Stainless Steel Co.,Ltd. Supervisor April, 2012
Baosteel Group Xinjiang Bayi Iron & Steel Co., Ltd. Supervisor May, 2011
New China Life Insurance Co., Ltd. Director July, 2014
Liu Guowang Baosteel Group Finance Co., Ltd. Director May, 2014 May, 2017
He Meifen
Shanghai Baosight Software Co., Ltd. Supervisor April, 2010
Baosteel Group Finance Co., Ltd. Director March, 2014
Baosteel Zhanjiang Iron & Steel Co., Ltd. Supervisor November, 2012
Zhou Jianfeng
Shanghai Society for Advanced Materials Vice Chairman of the Third Session 2012
The Ninth Council of the Chinese Society For Metals Council member 2012
The ninth committee of Shanghai Association for Science & Technology
Committee member 2012
The Ninth Council of Shanghai Society For Metals Vice Chairman 2012
Wang Jing
Baosteel-NSC Automotive Steel Sheets Co., Ltd. Vice Chairman August, 2012
Baosteel Singapore Pte Ltd Chairman December, 2014
HOWA Trading Co., Ltd. Chairman December, 2014
Baosteel Europe GmbH Chairman February, 2015
Shanghai Jiangnan-Changxing Shipbuilding Co., Ltd. Vice Chairman April, 2011
Shanghai Jiangnan-Changxing Heavy Industry Co., Ltd. Vice Chairman April, 2011
Guo Bin
Baosteel Resource Co., Ltd. Director August, 2008
Baosteel Resource (International) Co.,Ltd. Director December, 2010
Baosteel Development Co., Ltd. Chairman August, 2014
Chu Shuangjie
Baosteel Zhanjiang Iron & Steel Co.,Ltd. Director 2012
Baosteel America Inc. Director January, 2015
Baosteel Europe GmbH Director January, 2015
PetroChina northwest United Pipe Co.,Ltd. Director January, 2015
Bayi Iron & Steel Group Director 2012
Branch Society for Metals electrical steel of China (SMEB) Committee vice chairman 2011
Shanghai Jiaotong University Part-time professor, MA student adviser 2006
Hou Angui Baosteel-NSC Automotive Steel Sheets Co., Ltd. Director February, 2014
Zhi Xiwei Baosteel Engineering & Technology Group Co., Ltd. Director May, 2013
Zhu Kebing
Baosteel Zhanjiang Iron & Steel Co., Ltd. Director December, 2012
Baosteel Group Finance Co., Ltd. Chairman February, 2014
Bsteel Online Co., Ltd. Director November, 2011
Hwabao Trust Co., Ltd. Chairman of board of supervisors November, 2008
Shanghai Baosight Software Co., Ltd. Director April, 2013
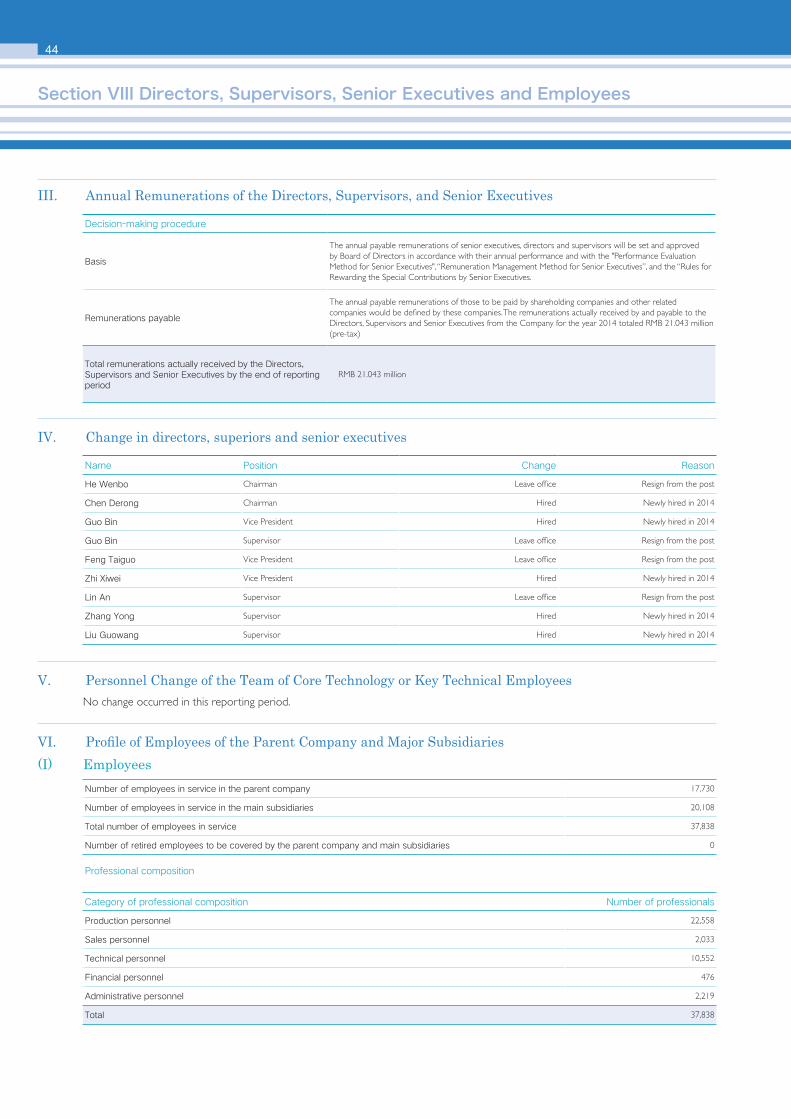
44
III. Annual Remunerations of the Directors, Supervisors, and Senior Executives
IV. Change in directors, superiors and senior executives
V. Personnel Change of the Team of Core Technology or Key Technical EmployeesNo change occurred in this reporting period.
Decision-making procedure
Basis
The annual payable remunerations of senior executives, directors and supervisors will be set and approved by Board of Directors in accordance with their annual performance and with the "Performance Evaluation Method for Senior Executives", “Remuneration Management Method for Senior Executives”, and the “Rules for Rewarding the Special Contributions by Senior Executives.
Remunerations payable
The annual payable remunerations of those to be paid by shareholding companies and other related companies would be defined by these companies. The remunerations actually received by and payable to the Directors, Supervisors and Senior Executives from the Company for the year 2014 totaled RMB 21.043 million (pre-tax)
Total remunerations actually received by the Directors, Supervisors and Senior Executives by the end of reporting period
RMB 21.043 million
Name Position Change Reason
He Wenbo Chairman Leave office Resign from the post
Chen Derong Chairman Hired Newly hired in 2014
Guo Bin Vice President Hired Newly hired in 2014
Guo Bin Supervisor Leave office Resign from the post
Feng Taiguo Vice President Leave office Resign from the post
Zhi Xiwei Vice President Hired Newly hired in 2014
Lin An Supervisor Leave office Resign from the post
Zhang Yong Supervisor Hired Newly hired in 2014
Liu Guowang Supervisor Hired Newly hired in 2014
VI. Profile of Employees of the Parent Company and Major Subsidiaries(I) Employees
Number of employees in service in the parent company 17,730
Number of employees in service in the main subsidiaries 20,108
Total number of employees in service 37,838
Number of retired employees to be covered by the parent company and main subsidiaries 0
Professional composition
Category of professional composition Number of professionals
Production personnel 22,558
Sales personnel 2,033
Technical personnel 10,552
Financial personnel 476
Administrative personnel 2,219
Total 37,838
Section VIII Directors, Supervisors, Senior Executives and Employees
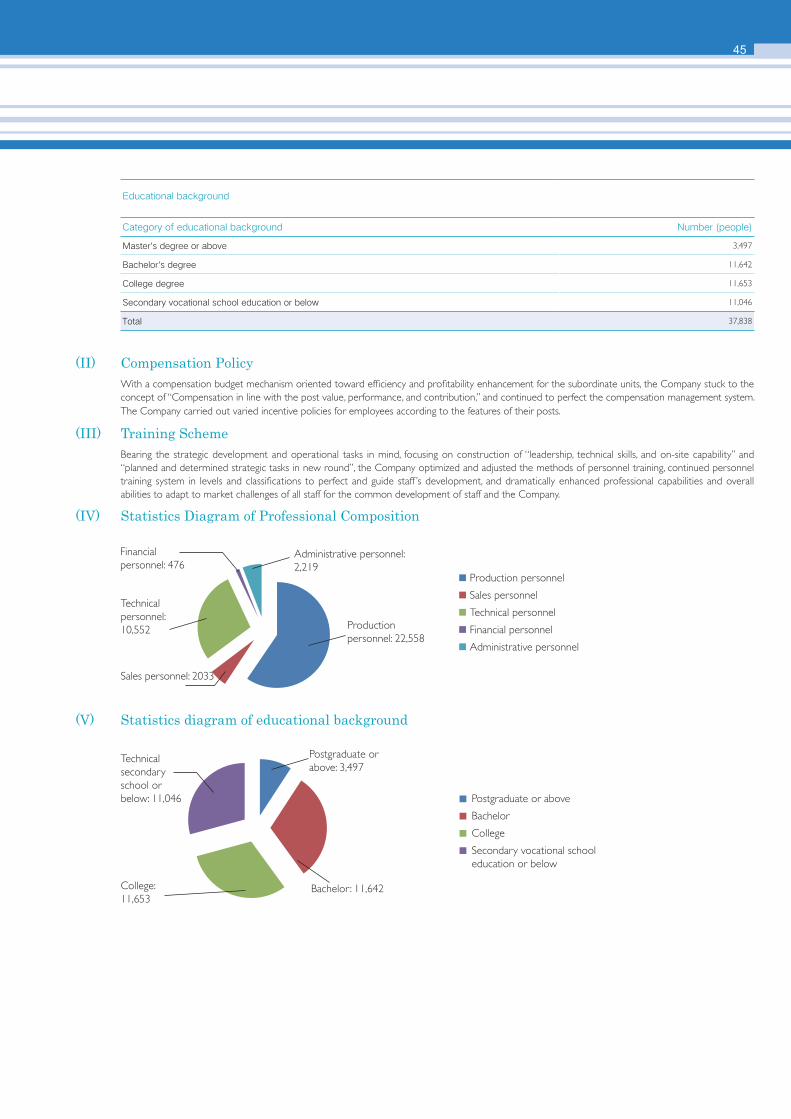
45
(II) Compensation PolicyWith a compensation budget mechanism oriented toward efficiency and profitability enhancement for the subordinate units, the Company stuck to the concept of “Compensation in line with the post value, performance, and contribution,” and continued to perfect the compensation management system. The Company carried out varied incentive policies for employees according to the features of their posts.
(III) Training SchemeBearing the strategic development and operational tasks in mind, focusing on construction of “leadership, technical skills, and on-site capability” and “planned and determined strategic tasks in new round”, the Company optimized and adjusted the methods of personnel training, continued personnel training system in levels and classifications to perfect and guide staff ’s development, and dramatically enhanced professional capabilities and overall abilities to adapt to market challenges of all staff for the common development of staff and the Company.
(IV) Statistics Diagram of Professional Composition
(V) Statistics diagram of educational background
Educational background
Category of educational background Number (people)
Master's degree or above 3,497
Bachelor's degree 11,642
College degree 11,653
Secondary vocational school education or below 11,046
Total 37,838
Financial personnel: 476
Technical secondary school or below: 11,046
College: 11,653
Postgraduate or above: 3,497
Bachelor : 11,642
Technical personnel: 10,552
Sales personnel: 2033
Administrative personnel: 2,219
Production personnel
Sales personnel
Technical personnel
Financial personnel
Administrative personnel
Postgraduate or above
Bachelor
College
Secondary vocational school
education or below
Production personnel: 22,558
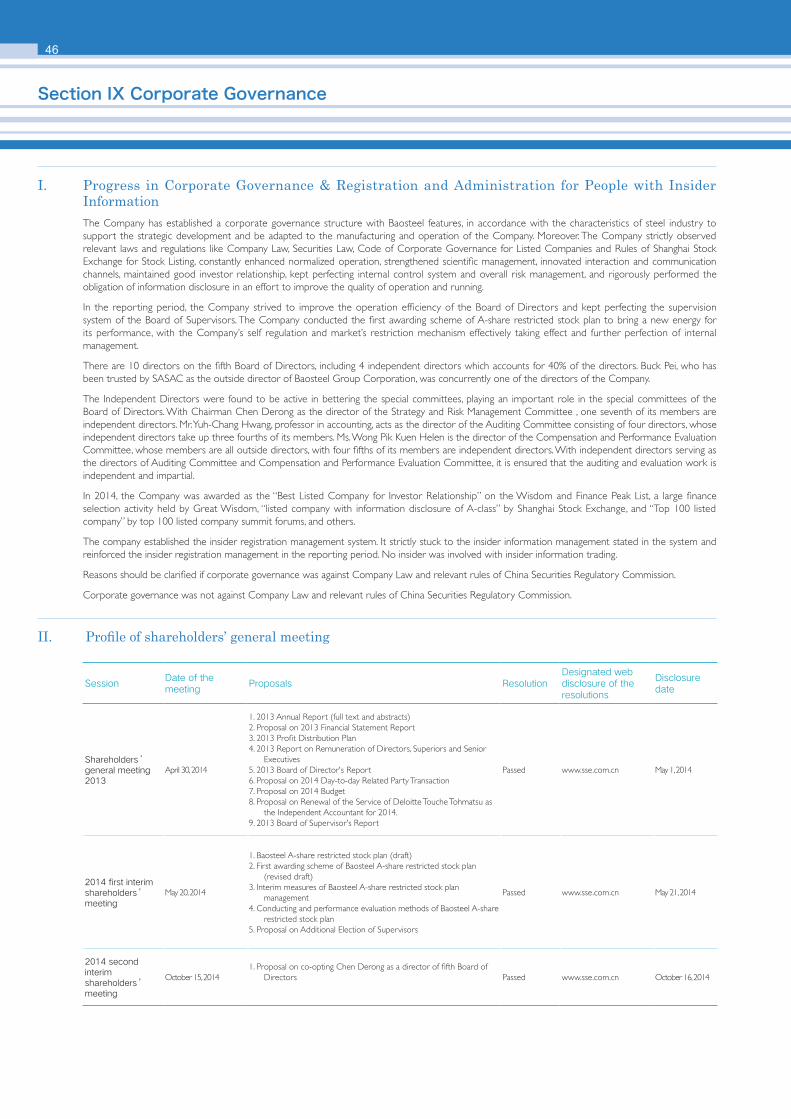
46
Section IX Corporate Governance
I. Progress in Corporate Governance & Registration and Administration for People with Insider Information The Company has established a corporate governance structure with Baosteel features, in accordance with the characteristics of steel industry to support the strategic development and be adapted to the manufacturing and operation of the Company. Moreover. The Company strictly observed relevant laws and regulations like Company Law, Securities Law, Code of Corporate Governance for Listed Companies and Rules of Shanghai Stock Exchange for Stock Listing, constantly enhanced normalized operation, strengthened scientific management, innovated interaction and communication channels, maintained good investor relationship, kept perfecting internal control system and overall risk management, and rigorously performed the obligation of information disclosure in an effort to improve the quality of operation and running.
In the reporting period, the Company strived to improve the operation efficiency of the Board of Directors and kept perfecting the supervision system of the Board of Supervisors. The Company conducted the first awarding scheme of A-share restricted stock plan to bring a new energy for its performance, with the Company’s self regulation and market’s restriction mechanism effectively taking effect and further perfection of internal management.
There are 10 directors on the fifth Board of Directors, including 4 independent directors which accounts for 40% of the directors. Buck Pei, who has been trusted by SASAC as the outside director of Baosteel Group Corporation, was concurrently one of the directors of the Company.
The Independent Directors were found to be active in bettering the special committees, playing an important role in the special committees of the Board of Directors. With Chairman Chen Derong as the director of the Strategy and Risk Management Committee , one seventh of its members are independent directors. Mr. Yuh-Chang Hwang, professor in accounting, acts as the director of the Auditing Committee consisting of four directors, whose independent directors take up three fourths of its members. Ms. Wong Pik Kuen Helen is the director of the Compensation and Performance Evaluation Committee, whose members are all outside directors, with four fifths of its members are independent directors. With independent directors serving as the directors of Auditing Committee and Compensation and Performance Evaluation Committee, it is ensured that the auditing and evaluation work is independent and impartial.
In 2014, the Company was awarded as the “Best Listed Company for Investor Relationship” on the Wisdom and Finance Peak List, a large finance selection activity held by Great Wisdom, “listed company with information disclosure of A-class” by Shanghai Stock Exchange, and “Top 100 listed company” by top 100 listed company summit forums, and others.
The company established the insider registration management system. It strictly stuck to the insider information management stated in the system and reinforced the insider registration management in the reporting period. No insider was involved with insider information trading.
Reasons should be clarified if corporate governance was against Company Law and relevant rules of China Securities Regulatory Commission.
Corporate governance was not against Company Law and relevant rules of China Securities Regulatory Commission.
II. Profile of shareholders’ general meeting
SessionDate of the meeting
Proposals ResolutionDesignated web disclosure of the resolutions
Disclosure date
Shareholders’ general meeting 2013
April 30, 2014
1. 2013 Annual Report (full text and abstracts)2. Proposal on 2013 Financial Statement Report 3. 2013 Profit Distribution Plan 4. 2013 Report on Remuneration of Directors, Superiors and Senior
Executives5. 2013 Board of Director's Report 6. Proposal on 2014 Day-to-day Related Party Transaction7. Proposal on 2014 Budget8. Proposal on Renewal of the Service of Deloitte Touche Tohmatsu as
the Independent Accountant for 2014.9. 2013 Board of Supervisor's Report
Passed www.sse.com.cn May 1, 2014
2014 first interim shareholders’ meeting
May 20, 2014
1. Baosteel A-share restricted stock plan (draft)2. First awarding scheme of Baosteel A-share restricted stock plan
(revised draft)3. Interim measures of Baosteel A-share restricted stock plan
management 4. Conducting and performance evaluation methods of Baosteel A-share
restricted stock plan 5. Proposal on Additional Election of Supervisors
Passed www.sse.com.cn May 21, 2014
2014 second interim shareholders’ meeting
October 15, 2014 1. Proposal on co-opting Chen Derong as a director of fifth Board of
Directors Passed www.sse.com.cn October 16, 2014
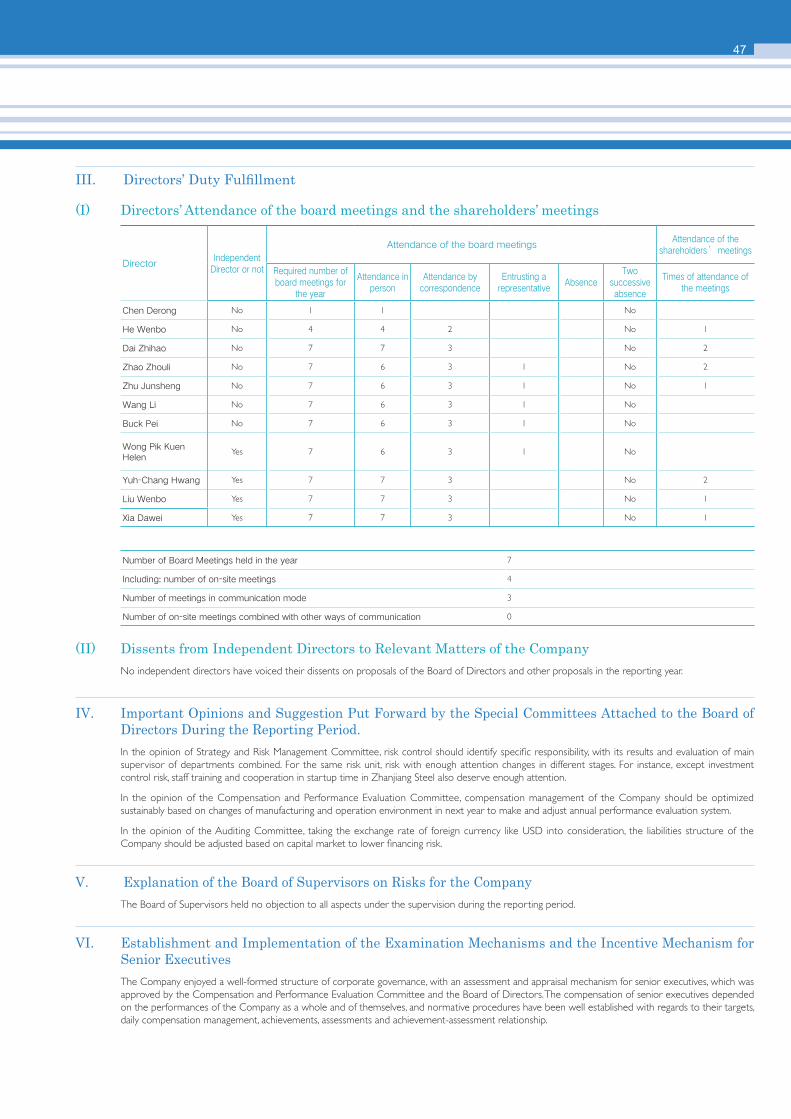
47
(II) Dissents from Independent Directors to Relevant Matters of the Company
No independent directors have voiced their dissents on proposals of the Board of Directors and other proposals in the reporting year.
IV. Important Opinions and Suggestion Put Forward by the Special Committees Attached to the Board of Directors During the Reporting Period.In the opinion of Strategy and Risk Management Committee, risk control should identify specific responsibility, with its results and evaluation of main supervisor of departments combined. For the same risk unit, risk with enough attention changes in different stages. For instance, except investment control risk, staff training and cooperation in startup time in Zhanjiang Steel also deserve enough attention.
In the opinion of the Compensation and Performance Evaluation Committee, compensation management of the Company should be optimized sustainably based on changes of manufacturing and operation environment in next year to make and adjust annual performance evaluation system.
In the opinion of the Auditing Committee, taking the exchange rate of foreign currency like USD into consideration, the liabilities structure of the Company should be adjusted based on capital market to lower financing risk.
V. Explanation of the Board of Supervisors on Risks for the CompanyThe Board of Supervisors held no objection to all aspects under the supervision during the reporting period.
VI. Establishment and Implementation of the Examination Mechanisms and the Incentive Mechanism for Senior ExecutivesThe Company enjoyed a well-formed structure of corporate governance, with an assessment and appraisal mechanism for senior executives, which was approved by the Compensation and Performance Evaluation Committee and the Board of Directors. The compensation of senior executives depended on the performances of the Company as a whole and of themselves, and normative procedures have been well established with regards to their targets, daily compensation management, achievements, assessments and achievement-assessment relationship.
III. Directors’ Duty Fulfillment
(I) Directors’ Attendance of the board meetings and the shareholders’ meetings
Number of Board Meetings held in the year 7
Including: number of on-site meetings 4
Number of meetings in communication mode 3
Number of on-site meetings combined with other ways of communication 0
DirectorIndependent
Director or not
Attendance of the board meetingsAttendance of the
shareholders’ meetings
Required number of board meetings for
the year
Attendance in person
Attendance by correspondence
Entrusting a representative
AbsenceTwo
successive absence
Times of attendance of the meetings
Chen Derong No 1 1 No
He Wenbo No 4 4 2 No 1
Dai Zhihao No 7 7 3 No 2
Zhao Zhouli No 7 6 3 1 No 2
Zhu Junsheng No 7 6 3 1 No 1
Wang Li No 7 6 3 1 No
Buck Pei No 7 6 3 1 No
Wong Pik Kuen Helen
Yes 7 6 3 1 No
Yuh-Chang Hwang Yes 7 7 3 No 2
Liu Wenbo Yes 7 7 3 No 1
Xia Dawei Yes 7 7 3 No 1
48
Section X Internal Control
I. Responsibility Statements and Construction of Internal ControlIt has been the responsibility of the Board of Directors to establish, perfect and effectively implement the internal control system, evaluate its effectiveness, and truthfully disclose the internal control evaluation report. The Board of Supervisors supervise the establishment and implementation of internal control by the Board of Directors and control it internally. The Managements organize and lead the day-to-day excise of internal control.
Internal control aimed to reasonably make sure that the operation and management were in lines with laws and regulations, capital was safe, financial statements and relevant information were complete and true, improve operational efficiency and performance and promote the realization of development strategies. Inherent limitation of internal control only made a reasonable guarantee for aforementioned objectives. In addition, changes of facts may lead to inappropriate internal control, less obedience to controlling policies and procedures. Therefore, it was risky to predict the effectiveness of future internal control based on the evaluation results.
The Company further optimized system management in 2014. First of all, the Company added 29 more management systems focusing on marketing, financial affairs, manufacturing and others. The Company constantly perfected all kinds of financial management systems, set standards for accounting, and continuously strengthened basic accounting to ensure accounting information was complete and accurate and to keep a standard and clean profile of a listed company. Secondly, the Company revised 51 management documents as per external supervisions and regulations, and according to demands of compliance, management development of the Company’s own business and organization structure adjustments.
Taking the construction and optimization of Zhanjiang Steel's internal control as a pilot, the Company focused on risks identification, critical control activities and implementation of work responsibilities so as to keep perfecting internal control environment of Zhanjiang Steel.
The Company carried out the internal control evaluation work according to the Basic Standard for Enterprise Internal Control and Guide for Enterprise Internal Control Evaluation and formed the internal control evaluation report. No major flaw was found for the internal control of the Company in the reporting period, and the Evaluation Report has been approved by the 21st meeting of the 5th Board Meeting of the Company and disclosed to the public, with disclosure information available at: www.sse.com.cn.
Whether the self-assessment report for internal control has been disclosed or not: yes
II. Audit Report for the Company’s Internal ControlDeloitte Touche Tohmatsu Certified Public Accountants LLP (special general partnership) conducted the internal control audit and gave its audit report for the Company, and the content of the report was disclosed at www.sse.com.cn.
If the internal control auditing report has been disclosed: yes
III. The Accountability System for Major Mistakes in the Disclosure of Information in the Company's Annual Report and Its ImplementationThe 4th meeting of the 4th Board of the Company held on March 30-31, 2010 examined and passed the revision of Methods of Information Disclosure Management pursuant to CSRC Document [2009] No.34 Circular on Properly Handling the 2009 Annual Reports of Listed companies and the Related Work, and the accountability system for major mistakes in information disclosure of annual reports was added.
According to the accountability system for major mistakes in information disclosure of annual reports, if the person liable violated the stipulations of such state laws and regulations as Company Law, Securities Law, Administrative Measures on Information Disclosure by Listed Companies, the Rules of Shanghai Stock Exchange for Stock Listing, Accounting Standards for Business Enterprises, intentionally or due to gross negligence, which has resulted in the false record, misleading statement, or major omission in the annual report, the Board of Directors would punish the person(s) directly liable and other persons liable dependent upon the seriousness of the case and would disclose the reasons for the correction, supplement and revision as well as the influences thus caused truthfully following the relevant stipulations by China Securities Regulatory Commission and Shanghai Stock Exchange. It would also disclose information about the accountability measures and punishment of the relevant liable persons by the Board of Directors.
No correction of major accounting mistakes, no statement of major information omission, and no correction of advance notice of annual performance occurred in the reporting period
49
Section XI Financial Statements
Contents Page
Auditor's report 50
The Company’s and consolidated balance sheets 51-54
The Company’s and consolidated income statements 55-56
The Company’s and consolidated cash flow statements 57-59
The Company’s and consolidated statements of changes in shareholders' equity 60-63
Notes to the financial statements 64-152
50
AUDITOR'S REPORTDe Shi Bao (Shen) Zi (15) No.P0595
To the Shareholders of Baoshan Iron & Steel Co., Ltd.
We have audited the accompanying financial statements of Baoshan Iron & Steel Co., Ltd. (the "Company"), which comprise the Company's and consolidated balance sheets as at 31 December 2014, and the Company's and consolidated income statements, the Company's and consolidated statements of changes in shareholders' equity, and the Company's and consolidated cash flow statements for the year then ended, and the notes to the financial statements.
1. Management's responsibility for the financial statements
Management of the Company is responsible for the preparation and fair presentation of these financial statements. This responsibility includes: (1) preparing the financial statements in accordance with Accounting Standards for Business Enterprises to achieve fair presentation of the financial statements; (2) designing, implementing and maintaining internal control which is necessary to enable that the financial statements are free from material misstatement, whether due to fraud or error.
2. Auditor's responsibility
Our responsibility is to express an opinion on these financial statements based on our audit. We conducted our audit in accordance with China Standards on Auditing. China Standards on Auditing require that we comply with the Code of Ethics for Chinese Certified Public Accountants, and plan and perform the audit to obtain reasonable assurance about whether the financial statements are free from material misstatement.
An audit involves performing procedures to obtain audit evidence about the amounts and disclosures in the financial statements. The procedures selected depend on the auditor's judgment, including the assessment of the risks of material misstatement of the financial statements, whether due to fraud or error. In making those risk assessments, Certified Public Accountants consider the internal control relevant to the preparation and fair presentation of the financial statements in order to design audit procedures that are appropriate in the circumstances. An audit also includes evaluating the appropriateness of accounting policies used and the reasonableness of accounting estimates made by management, as well as evaluating the overall presentation of the financial statements.
We believe that the audit evidence we have obtained is sufficient and appropriate to provide a basis for our audit opinion.
3. Opinion
In our opinion, the financial statements of the Company present fairly, in all material respects, the Company's and consolidated financial position as of 31 December 2014, and the Company's and consolidated results of operations and cash flows for the year then ended in accordance with Accounting Standards for Business Enterprises.
Deloitte Touche Tohmatsu CPA LLP Chinese Certified Public Accountant:
Shanghai, China
26 March 2015
The auditor’s report and the accompanying financial statements are English translations of the Chinese auditor’s report and statutory financial statements prepared under accounting principles and practices generally accepted in the People’s Republic of China. These financial statements are not intended to present the financial position and results of operations and cash flows in accordance with accounting principles and practices generally accepted in other countries and jurisdictions. Where the English version does not conform to the Chinese version, the Chinese version prevails.
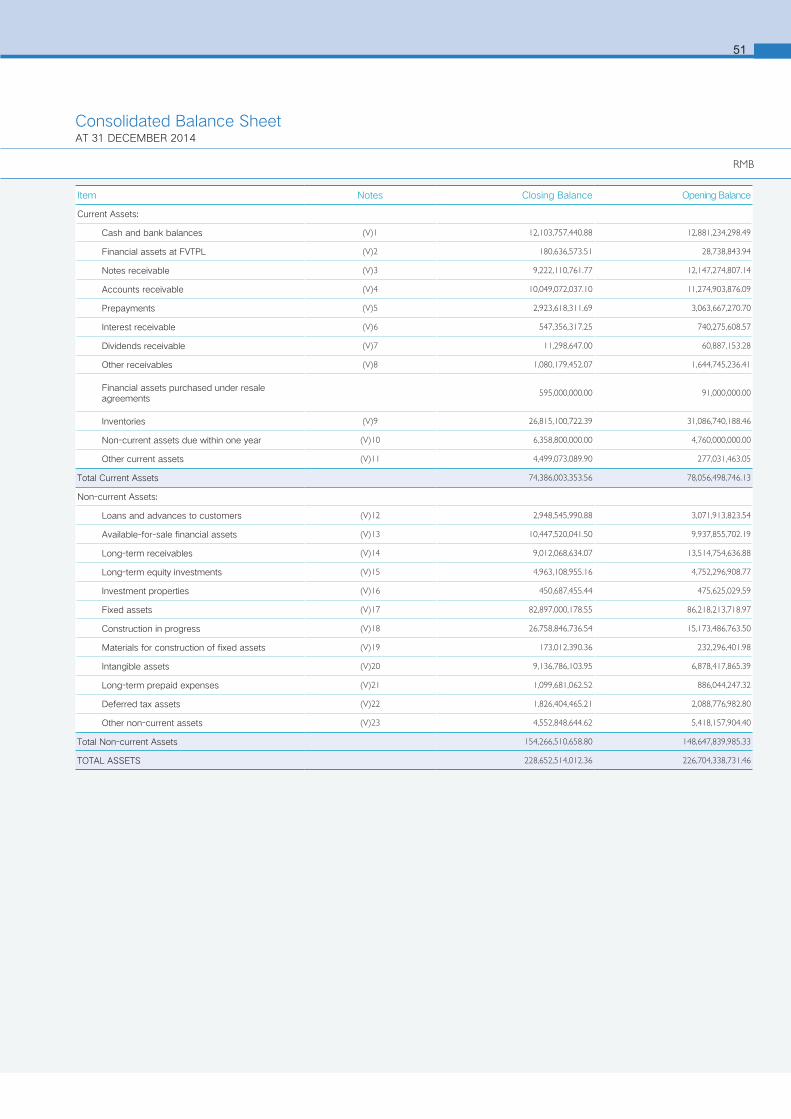
51
Consolidated Balance SheetAT 31 DECEMBER 2014
RMB
Item Notes Closing Balance Opening Balance
Current Assets:
Cash and bank balances (V)1 12,103,757,440.88 12,881,234,298.49
Financial assets at FVTPL (V)2 180,636,573.51 28,738,843.94
Notes receivable (V)3 9,222,110,761.77 12,147,274,807.14
Accounts receivable (V)4 10,049,072,037.10 11,274,903,876.09
Prepayments (V)5 2,923,618,311.69 3,063,667,270.70
Interest receivable (V)6 547,356,317.25 740,275,608.57
Dividends receivable (V)7 11,298,647.00 60,887,153.28
Other receivables (V)8 1,080,179,452.07 1,644,745,236.41
Financial assets purchased under resale agreements
595,000,000.00 91,000,000.00
Inventories (V)9 26,815,100,722.39 31,086,740,188.46
Non-current assets due within one year (V)10 6,358,800,000.00 4,760,000,000.00
Other current assets (V)11 4,499,073,089.90 277,031,463.05
Total Current Assets 74,386,003,353.56 78,056,498,746.13
Non-current Assets:
Loans and advances to customers (V)12 2,948,545,990.88 3,071,913,823.54
Available-for-sale financial assets (V)13 10,447,520,041.50 9,937,855,702.19
Long-term receivables (V)14 9,012,068,634.07 13,514,754,636.88
Long-term equity investments (V)15 4,963,108,955.16 4,752,296,908.77
Investment properties (V)16 450,687,455.44 475,625,029.59
Fixed assets (V)17 82,897,000,178.55 86,218,213,718.97
Construction in progress (V)18 26,758,846,736.54 15,173,486,763.50
Materials for construction of fixed assets (V)19 173,012,390.36 232,296,401.98
Intangible assets (V)20 9,136,786,103.95 6,878,417,865.39
Long-term prepaid expenses (V)21 1,099,681,062.52 886,044,247.32
Deferred tax assets (V)22 1,826,404,465.21 2,088,776,982.80
Other non-current assets (V)23 4,552,848,644.62 5,418,157,904.40
Total Non-current Assets 154,266,510,658.80 148,647,839,985.33
TOTAL ASSETS 228,652,514,012.36 226,704,338,731.46
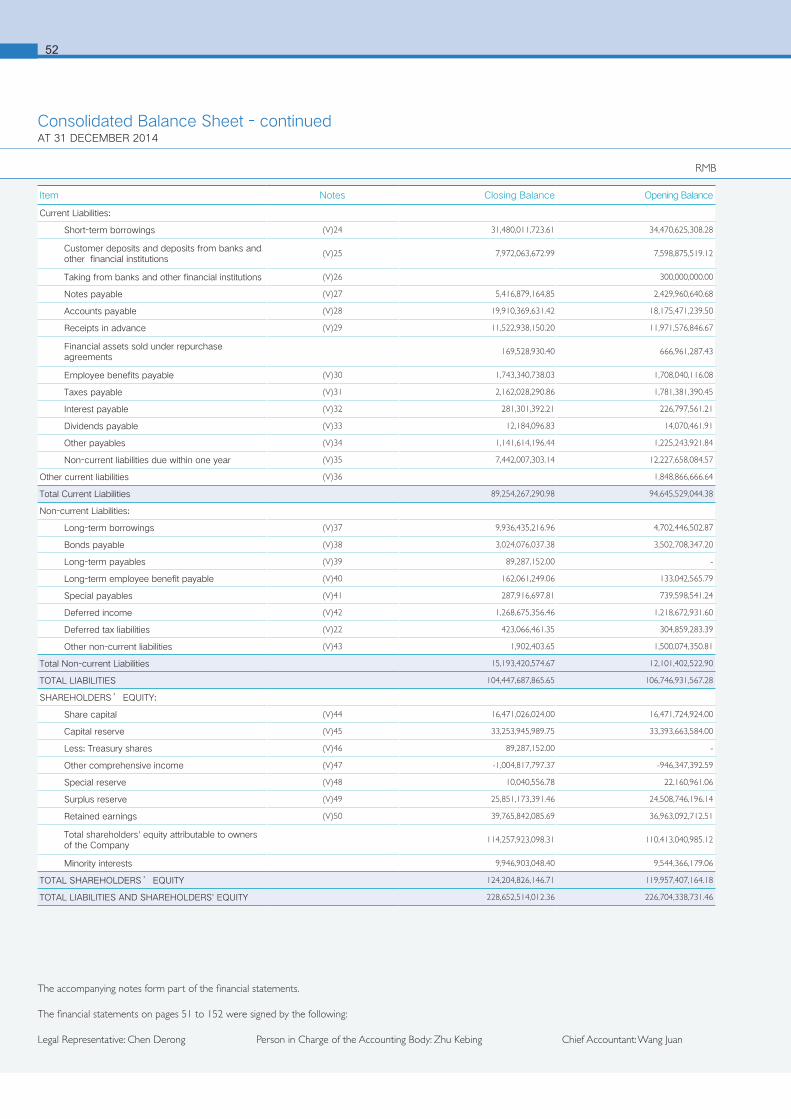
652
Item Notes Closing Balance Opening Balance
Current Liabilities:
Short-term borrowings (V)24 31,480,011,723.61 34,470,625,308.28
Customer deposits and deposits from banks and other financial institutions
(V)25 7,972,063,672.99 7,598,875,519.12
Taking from banks and other financial institutions (V)26 300,000,000.00
Notes payable (V)27 5,416,879,164.85 2,429,960,640.68
Accounts payable (V)28 19,910,369,631.42 18,175,471,239.50
Receipts in advance (V)29 11,522,938,150.20 11,971,576,846.67
Financial assets sold under repurchase agreements
169,528,930.40 666,961,287.43
Employee benefits payable (V)30 1,743,340,738.03 1,708,040,116.08
Taxes payable (V)31 2,162,028,290.86 1,781,381,390.45
Interest payable (V)32 281,301,392.21 226,797,561.21
Dividends payable (V)33 12,184,096.83 14,070,461.91
Other payables (V)34 1,141,614,196.44 1,225,243,921.84
Non-current liabilities due within one year (V)35 7,442,007,303.14 12,227,658,084.57
Other current liabilities (V)36 1,848,866,666.64
Total Current Liabilities 89,254,267,290.98 94,645,529,044.38
Non-current Liabilities:
Long-term borrowings (V)37 9,936,435,216.96 4,702,446,502.87
Bonds payable (V)38 3,024,076,037.38 3,502,708,347.20
Long-term payables (V)39 89,287,152.00 -
Long-term employee benefit payable (V)40 162,061,249.06 133,042,565.79
Special payables (V)41 287,916,697.81 739,598,541.24
Deferred income (V)42 1,268,675,356.46 1,218,672,931.60
Deferred tax liabilities (V)22 423,066,461.35 304,859,283.39
Other non-current liabilities (V)43 1,902,403.65 1,500,074,350.81
Total Non-current Liabilities 15,193,420,574.67 12,101,402,522.90
TOTAL LIABILITIES 104,447,687,865.65 106,746,931,567.28
SHAREHOLDERS’ EQUITY:
Share capital (V)44 16,471,026,024.00 16,471,724,924.00
Capital reserve (V)45 33,253,945,989.75 33,393,663,584.00
Less: Treasury shares (V)46 89,287,152.00 -
Other comprehensive income (V)47 -1,004,817,797.37 -946,347,392.59
Special reserve (V)48 10,040,556.78 22,160,961.06
Surplus reserve (V)49 25,851,173,391.46 24,508,746,196.14
Retained earnings (V)50 39,765,842,085.69 36,963,092,712.51
Total shareholders' equity attributable to owners of the Company
114,257,923,098.31 110,413,040,985.12
Minority interests 9,946,903,048.40 9,544,366,179.06
TOTAL SHAREHOLDERS’ EQUITY 124,204,826,146.71 119,957,407,164.18
TOTAL LIABILITIES AND SHAREHOLDERS' EQUITY 228,652,514,012.36 226,704,338,731.46
RMB
Consolidated Balance Sheet - continuedAT 31 DECEMBER 2014
The accompanying notes form part of the financial statements.
The financial statements on pages 51 to 152 were signed by the following:
Legal Representative: Chen Derong Person in Charge of the Accounting Body: Zhu Kebing Chief Accountant: Wang Juan

53
Balance Sheet of The CompanyAT 31 DECEMBER 2014
RMB
Item Notes Closing Balance Opening Balance
Current asset:
Cash and bank balances 6,283,129,815.02 6,290,586,489.64
Financial assets at FVTPL 6,102,202.15 -
Notes receivable 13,011,611,433.29 12,214,208,950.73
Accounts receivable (XIV)1 9,695,871,978.90 10,715,045,629.19
Prepayments 942,442,509.53 1,079,542,213.71
Interest receivable 624,864,604.91 729,665,753.38
Other receivables (XIV)2 250,571,482.39 327,858,990.20
Inventories 12,690,611,402.54 17,033,352,986.60
Non-current assets due within one year 4,500,000,000.00 4,730,392,547.84
Other current assets 3,265,500,000.00 -
Total Current Assets 51,270,705,428.73 53,120,653,561.29
Non-current Assets:
Available-for-sale financial assets 8,200,996,309.00 8,195,996,309.00
Long-term receivables 11,073,532,930.56 15,573,532,930.56
Long-term equity investments (XIV)3 45,216,589,326.30 36,711,176,253.46
Fixed assets 50,017,975,436.43 51,969,984,620.58
Construction in progress 3,611,532,901.23 2,798,593,355.74
Materials for construction of fixed assets 32,088,334.38 25,174,314.02
Intangible assets 3,788,628,679.26 1,505,904,482.93
Long-term prepaid expenses 98,970,720.56 1,511,118.40
Deferred tax assets 722,797,843.64 690,899,564.03
Other non-current assets 849,017,843.49 1,096,036,325.53
Total Non-current Assets 123,612,130,324.85 118,568,809,274.25
TOTAL ASSETS 174,882,835,753.58 171,689,462,835.54
Current Liabilities:
Short-term borrowings 11,540,228,080.29 8,496,748,388.00
Notes payable 1,673,935,753.74 223,523,900.29
Accounts payable 25,957,352,170.04 27,193,534,207.87
Receipts in advance 11,502,863,539.67 9,032,674,462.93
Employee benefits payable 1,228,950,124.09 1,205,968,148.94
Taxes payable 2,067,147,371.26 2,111,635,461.99
Interest payable 37,402,811.31 69,588,411.99
Other payables 405,000,081.16 467,707,218.89
Non-current liabilities due within one year 5,201,150,000.00 11,003,934,462.35
Other current liabilities 3,123,327,438.98 1,690,778,800.40
Total Current Liabilities 62,737,357,370.54 61,496,093,463.65
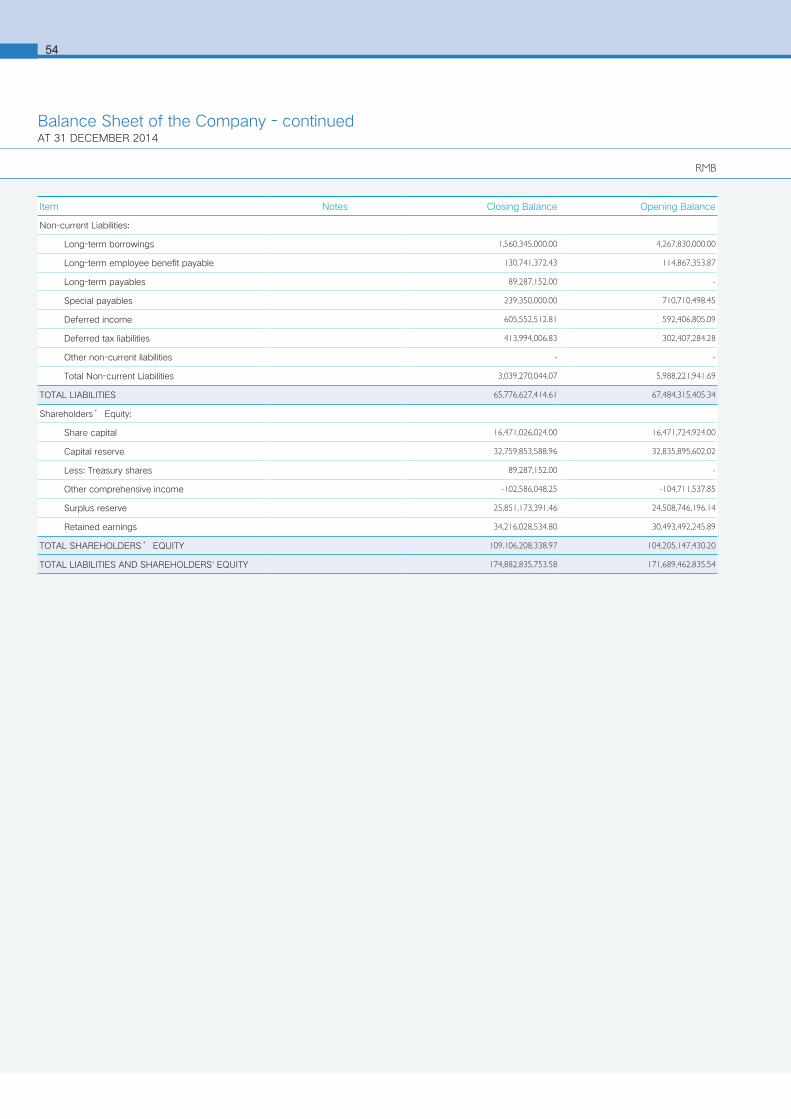
6
RMB
54
Item Notes Closing Balance Opening Balance
Non-current Liabilities:
Long-term borrowings 1,560,345,000.00 4,267,830,000.00
Long-term employee benefit payable 130,741,372.43 114,867,353.87
Long-term payables 89,287,152.00 -
Special payables 239,350,000.00 710,710,498.45
Deferred income 605,552,512.81 592,406,805.09
Deferred tax liabilities 413,994,006.83 302,407,284.28
Other non-current liabilities - -
Total Non-current Liabilities 3,039,270,044.07 5,988,221,941.69
TOTAL LIABILITIES 65,776,627,414.61 67,484,315,405.34
Shareholders’ Equity:
Share capital 16,471,026,024.00 16,471,724,924.00
Capital reserve 32,759,853,588.96 32,835,895,602.02
Less: Treasury shares 89,287,152.00 -
Other comprehensive income -102,586,048.25 -104,711,537.85
Surplus reserve 25,851,173,391.46 24,508,746,196.14
Retained earnings 34,216,028,534.80 30,493,492,245.89
TOTAL SHAREHOLDERS’ EQUITY 109,106,208,338.97 104,205,147,430.20
TOTAL LIABILITIES AND SHAREHOLDERS' EQUITY 174,882,835,753.58 171,689,462,835.54
Balance Sheet of the Company - continuedAT 31 DECEMBER 2014

55
Consolidated Income StatementFOR THE YEAR ENDED 31 DECEMBER 2014
Item Notes Amount for the current period Amount for the prior period
I.Total operating income 187,789,009,928.26 190,025,966,573.58
Including: Operating income (V)51 187,413,640,104.33 189,688,379,683.22
Interest income 371,566,288.84 334,537,837.59
Fee and commission income 3,803,535.09 3,049,052.77
Less: Total operating costs 180,550,515,935.21 183,054,058,733.43
Including: Operating costs (V)51 168,931,135,501.45 171,718,199,823.29
Interest expenses 256,830,557.42 233,629,976.26
Fee and commission expenses 622,101.30 604,451.35
Business taxes and levies (V)52 470,502,745.64 413,666,506.19
Selling expenses (V)53 2,200,347,423.93 1,963,040,971.61
Administrative expenses (V)54 7,728,236,209.78 6,880,731,290.07
Financial expenses (V)55 487,713,867.87 -544,131,554.59
Impairment losses of assets (V)56 475,127,527.82 2,388,317,269.25
Add: Gains from changes in fair values (V)57 23,346,786.23 27,585,736.16
Investment income (V)58 378,905,995.20 684,054,175.06
Including: Income from investments in associates and joint ventures 154,890,243.84 174,802,410.63
II.Operating profit 7,640,746,774.48 7,683,547,751.37
Add: Non-operating income (V)59 1,180,620,074.47 882,372,341.19
Including: Income from disposal of non-current assets 468,705,992.56 360,318,736.82
Less: Non-operating expenses (V)60 543,593,096.02 556,158,742.00
Including: Losses from disposal of non-current assets 422,747,874.64 472,234,905.84
III.Total profit 8,277,773,752.93 8,009,761,350.56
Less: Income tax expenses (V)61 2,187,081,535.04 1,969,426,727.34
IV.Net profit 6,090,692,217.89 6,040,334,623.22
Net profit attributable to owners of the Company 5,792,349,060.90 5,818,471,202.97
Profit or loss attributable to minority interests 298,343,156.99 221,863,420.25
V. Other comprehensive income, net of income tax (V)62 -47,779,813.44 -651,599,826.28
attributable to owners of the company -58,470,404.78 -622,276,378.20
(I) Items that will not be reclassified subsequently to profit or loss
(II) Items that may be reclassified subsequently to profit or loss -58,470,404.78 -622,276,378.20
1. Amounts of other comprehensive income attributable to investees that are to be reclassified into profit or loss under equity method
-3,770,776.83 -28,678,273.63
2 Fair value gain/loss on available-for-sale financial assets 75,537,973.06 -373,821,760.96
3. Exchange differences on translating foreign operations -130,237,601.01 -219,772,343.61
4. Others - -4,000.00
Attributable to minority interest 10,690,591.34 -29,323,448.08
VI. Total comprehensive income 6,042,912,404.45 5,388,734,796.94
Total comprehensive income attributable to owners of the Company 5,733,878,656.12 5,196,194,824.77
Total comprehensive income attributable to minority interests 309,033,748.33 192,539,972.17
VII. Earnings per share
(I) Basic earnings per share 0.35 0.35
RMB

656
Income Statement of The CompanyFOR THE YEAR ENDED 31 DECEMBER 2014
RMB
Item NotesAmount for the current
periodAmount for the
prior period
I.Operating income (XIV)4 106,018,047,280.89 114,822,648,812.83
Less: Operating costs (XIV)4 95,147,177,965.01 103,299,412,868.12
Business taxes and levies 224,874,152.27 227,193,200.29
Selling expenses 683,150,896.49 633,150,695.94
Administrative expenses 5,065,663,648.24 4,829,208,781.20
Financial expenses -690,251,334.45 -1,504,010,301.21
Impairment losses of assets -37,344,257.83 113,905,152.00
Add:Gains from changes in fair values 6,102,202.15 20,789,685.96
Investment income (XIV)5 1,717,204,237.36 1,154,332,320.86
Including: Income from investments in associates and joint ventures 84,270,441.26 73,461,094.80
II.Operating profit 7,348,082,650.67 8,398,910,423.31
Add: , Non-operating income 909,651,316.01 494,367,912.92
Including: Income from disposal of non-current assets 460,231,043.45 350,799,851.89
Less: ,Non-operating expenses 416,942,978.13 1,230,071,805.87
Including: Losses from disposal of non-current assets 376,473,454.16 1,191,296,479.38
III.Total profit 7,840,790,988.55 7,663,206,530.36
Less: Income tax expenses 1,128,655,011.92 1,170,772,680.98
IV.Net profit 6,712,135,976.63 6,492,433,849.38
V. Other comprehensive income, net of income tax 2,125,489.60 -13,870,928.84
(I) Items that will not be reclassified subsequently to profit or loss
(II) items that may be reclassified subsequently to profit or loss 2,125,489.60 -13,870,928.84
1.Amounts of other comprehensive income attributes to investees that are to be reclassified into profit or loss under equity method
2,125,489.60 -13,870,928.84
VI. Total comprehensive income 6,714,261,466.23 6,478,562,920.54
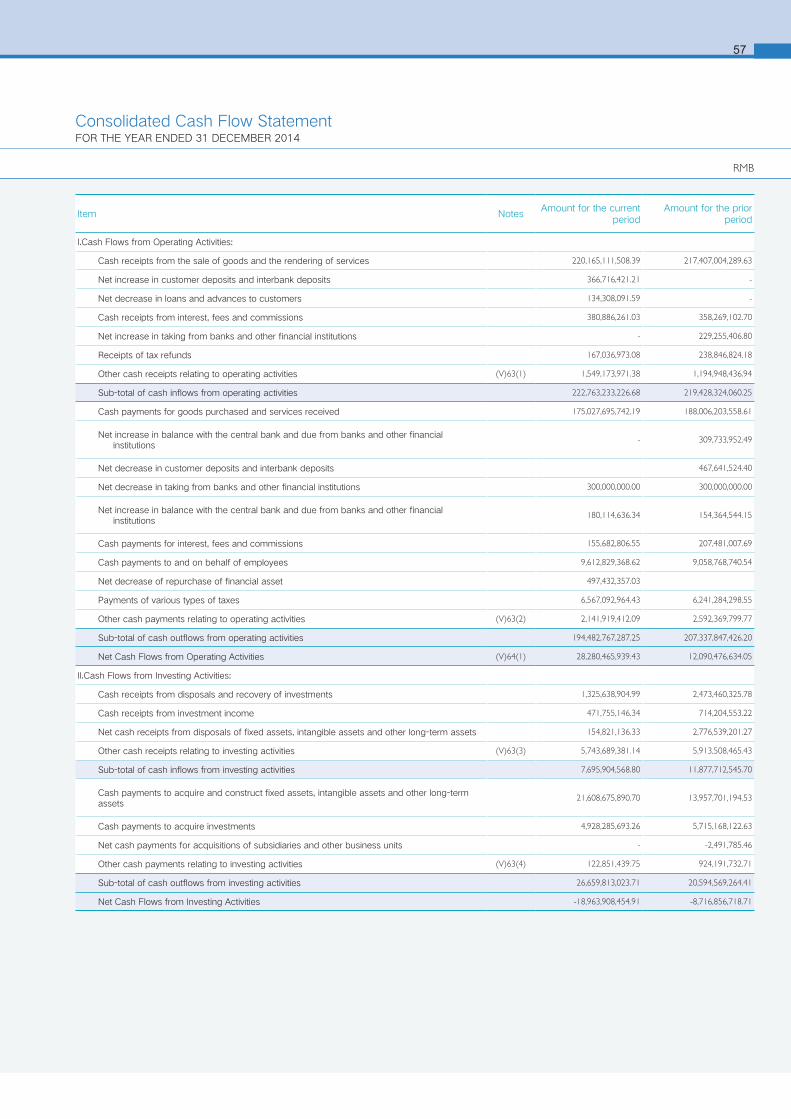
57
Consolidated Cash Flow StatementFOR THE YEAR ENDED 31 DECEMBER 2014
RMB
Item NotesAmount for the current
periodAmount for the prior
period
I.Cash Flows from Operating Activities:
Cash receipts from the sale of goods and the rendering of services 220,165,111,508.39 217,407,004,289.63
Net increase in customer deposits and interbank deposits 366,716,421.21 -
Net decrease in loans and advances to customers 134,308,091.59 -
Cash receipts from interest, fees and commissions 380,886,261.03 358,269,102.70
Net increase in taking from banks and other financial institutions - 229,255,406.80
Receipts of tax refunds 167,036,973.08 238,846,824.18
Other cash receipts relating to operating activities (V)63(1) 1,549,173,971.38 1,194,948,436.94
Sub-total of cash inflows from operating activities 222,763,233,226.68 219,428,324,060.25
Cash payments for goods purchased and services received 175,027,695,742.19 188,006,203,558.61
Net increase in balance with the central bank and due from banks and other financial institutions
- 309,733,952.49
Net decrease in customer deposits and interbank deposits 467,641,524.40
Net decrease in taking from banks and other financial institutions 300,000,000.00 300,000,000.00
Net increase in balance with the central bank and due from banks and other financial institutions
180,114,636.34 154,364,544.15
Cash payments for interest, fees and commissions 155,682,806.55 207,481,007.69
Cash payments to and on behalf of employees 9,612,829,368.62 9,058,768,740.54
Net decrease of repurchase of financial asset 497,432,357.03
Payments of various types of taxes 6,567,092,964.43 6,241,284,298.55
Other cash payments relating to operating activities (V)63(2) 2,141,919,412.09 2,592,369,799.77
Sub-total of cash outflows from operating activities 194,482,767,287.25 207,337,847,426.20
Net Cash Flows from Operating Activities (V)64(1) 28,280,465,939.43 12,090,476,634.05
II.Cash Flows from Investing Activities:
Cash receipts from disposals and recovery of investments 1,325,638,904.99 2,473,460,325.78
Cash receipts from investment income 471,755,146.34 714,204,553.22
Net cash receipts from disposals of fixed assets, intangible assets and other long-term assets 154,821,136.33 2,776,539,201.27
Other cash receipts relating to investing activities (V)63(3) 5,743,689,381.14 5,913,508,465.43
Sub-total of cash inflows from investing activities 7,695,904,568.80 11,877,712,545.70
Cash payments to acquire and construct fixed assets, intangible assets and other long-term assets
21,608,675,890.70 13,957,701,194.53
Cash payments to acquire investments 4,928,285,693.26 5,715,168,122.63
Net cash payments for acquisitions of subsidiaries and other business units - -2,491,785.46
Other cash payments relating to investing activities (V)63(4) 122,851,439.75 924,191,732.71
Sub-total of cash outflows from investing activities 26,659,813,023.71 20,594,569,264.41
Net Cash Flows from Investing Activities -18,963,908,454.91 -8,716,856,718.71
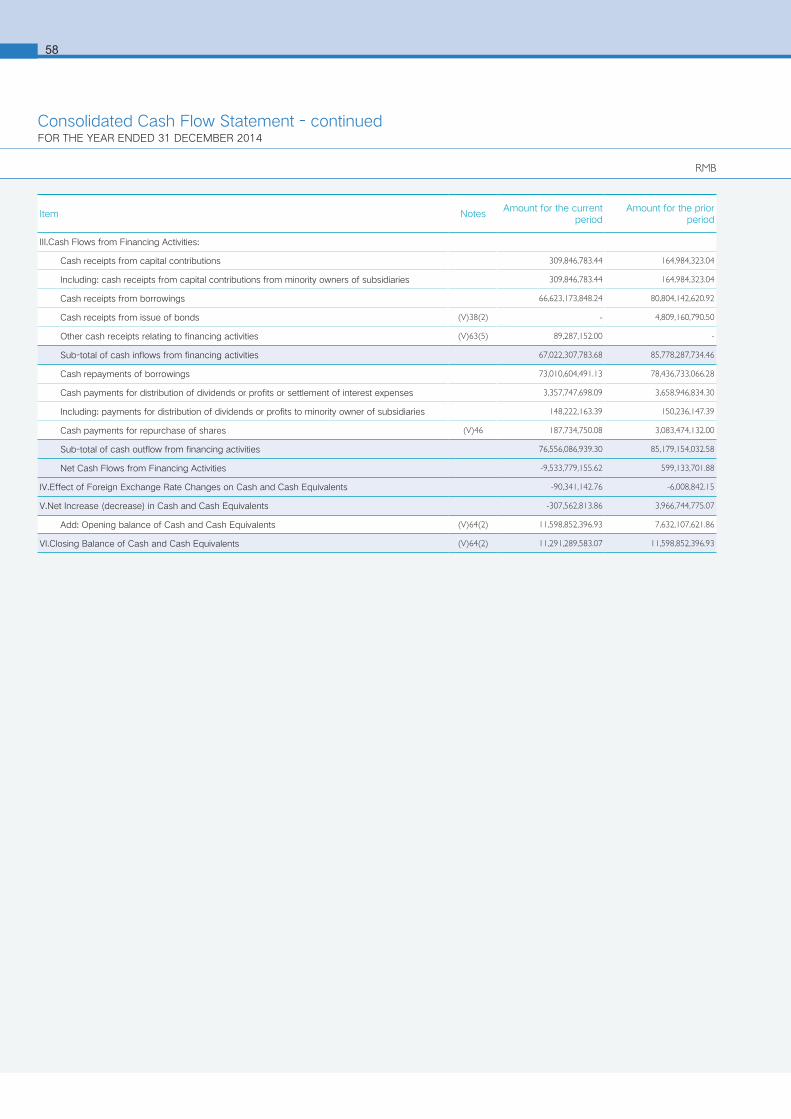
658
RMB
Item NotesAmount for the current
periodAmount for the prior
period
III.Cash Flows from Financing Activities:
Cash receipts from capital contributions 309,846,783.44 164,984,323.04
Including: cash receipts from capital contributions from minority owners of subsidiaries 309,846,783.44 164,984,323.04
Cash receipts from borrowings 66,623,173,848.24 80,804,142,620.92
Cash receipts from issue of bonds (V)38(2) - 4,809,160,790.50
Other cash receipts relating to financing activities (V)63(5) 89,287,152.00 -
Sub-total of cash inflows from financing activities 67,022,307,783.68 85,778,287,734.46
Cash repayments of borrowings 73,010,604,491.13 78,436,733,066.28
Cash payments for distribution of dividends or profits or settlement of interest expenses 3,357,747,698.09 3,658,946,834.30
Including: payments for distribution of dividends or profits to minority owner of subsidiaries 148,222,163.39 150,236,147.39
Cash payments for repurchase of shares (V)46 187,734,750.08 3,083,474,132.00
Sub-total of cash outflow from financing activities 76,556,086,939.30 85,179,154,032.58
Net Cash Flows from Financing Activities -9,533,779,155.62 599,133,701.88
IV.Effect of Foreign Exchange Rate Changes on Cash and Cash Equivalents -90,341,142.76 -6,008,842.15
V.Net Increase (decrease) in Cash and Cash Equivalents -307,562,813.86 3,966,744,775.07
Add: Opening balance of Cash and Cash Equivalents (V)64(2) 11,598,852,396.93 7,632,107,621.86
VI.Closing Balance of Cash and Cash Equivalents (V)64(2) 11,291,289,583.07 11,598,852,396.93
Consolidated Cash Flow Statement - continuedFOR THE YEAR ENDED 31 DECEMBER 2014
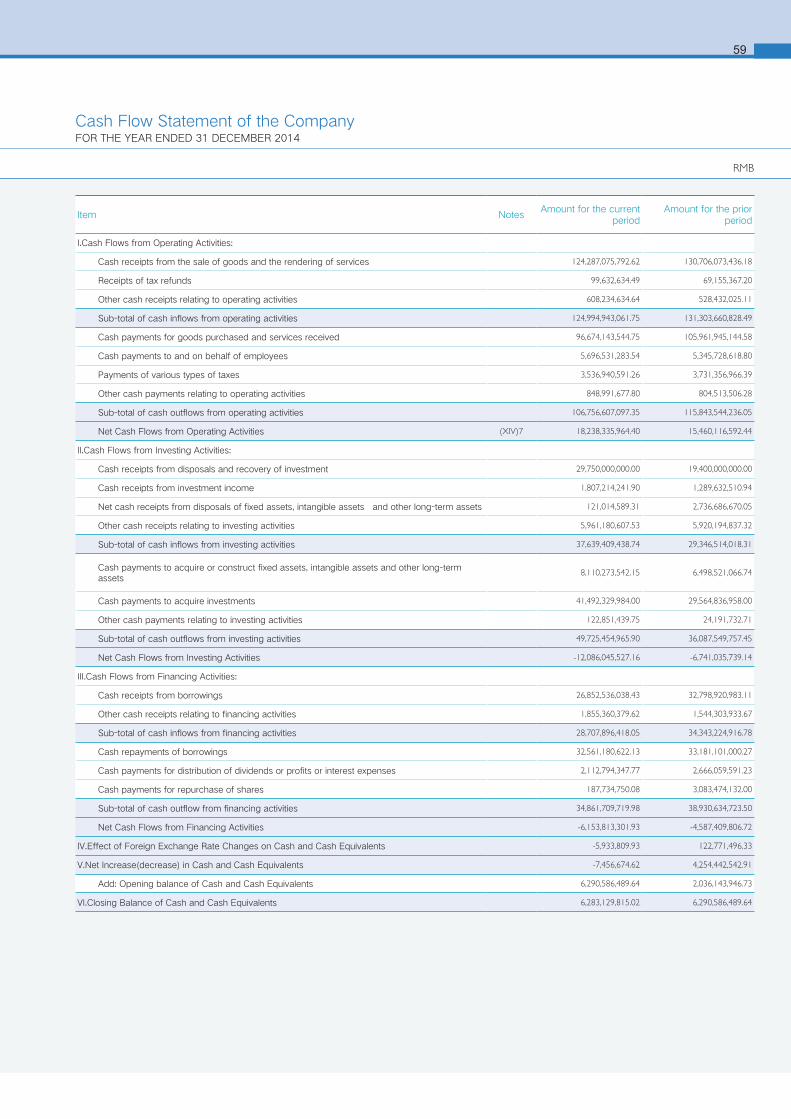
59
Cash Flow Statement of the CompanyFOR THE YEAR ENDED 31 DECEMBER 2014
Item NotesAmount for the current
periodAmount for the prior
period
I.Cash Flows from Operating Activities:
Cash receipts from the sale of goods and the rendering of services 124,287,075,792.62 130,706,073,436.18
Receipts of tax refunds 99,632,634.49 69,155,367.20
Other cash receipts relating to operating activities 608,234,634.64 528,432,025.11
Sub-total of cash inflows from operating activities 124,994,943,061.75 131,303,660,828.49
Cash payments for goods purchased and services received 96,674,143,544.75 105,961,945,144.58
Cash payments to and on behalf of employees 5,696,531,283.54 5,345,728,618.80
Payments of various types of taxes 3,536,940,591.26 3,731,356,966.39
Other cash payments relating to operating activities 848,991,677.80 804,513,506.28
Sub-total of cash outflows from operating activities 106,756,607,097.35 115,843,544,236.05
Net Cash Flows from Operating Activities (XIV)7 18,238,335,964.40 15,460,116,592.44
II.Cash Flows from Investing Activities:
Cash receipts from disposals and recovery of investment 29,750,000,000.00 19,400,000,000.00
Cash receipts from investment income 1,807,214,241.90 1,289,632,510.94
Net cash receipts from disposals of fixed assets, intangible assets and other long-term assets 121,014,589.31 2,736,686,670.05
Other cash receipts relating to investing activities 5,961,180,607.53 5,920,194,837.32
Sub-total of cash inflows from investing activities 37,639,409,438.74 29,346,514,018.31
Cash payments to acquire or construct fixed assets, intangible assets and other long-term assets
8,110,273,542.15 6,498,521,066.74
Cash payments to acquire investments 41,492,329,984.00 29,564,836,958.00
Other cash payments relating to investing activities 122,851,439.75 24,191,732.71
Sub-total of cash outflows from investing activities 49,725,454,965.90 36,087,549,757.45
Net Cash Flows from Investing Activities -12,086,045,527.16 -6,741,035,739.14
III.Cash Flows from Financing Activities:
Cash receipts from borrowings 26,852,536,038.43 32,798,920,983.11
Other cash receipts relating to financing activities 1,855,360,379.62 1,544,303,933.67
Sub-total of cash inflows from financing activities 28,707,896,418.05 34,343,224,916.78
Cash repayments of borrowings 32,561,180,622.13 33,181,101,000.27
Cash payments for distribution of dividends or profits or interest expenses 2,112,794,347.77 2,666,059,591.23
Cash payments for repurchase of shares 187,734,750.08 3,083,474,132.00
Sub-total of cash outflow from financing activities 34,861,709,719.98 38,930,634,723.50
Net Cash Flows from Financing Activities -6,153,813,301.93 -4,587,409,806.72
IV.Effect of Foreign Exchange Rate Changes on Cash and Cash Equivalents -5,933,809.93 122,771,496.33
V.Net Increase(decrease) in Cash and Cash Equivalents -7,456,674.62 4,254,442,542.91
Add: Opening balance of Cash and Cash Equivalents 6,290,586,489.64 2,036,143,946.73
VI.Closing Balance of Cash and Cash Equivalents 6,283,129,815.02 6,290,586,489.64
RMB
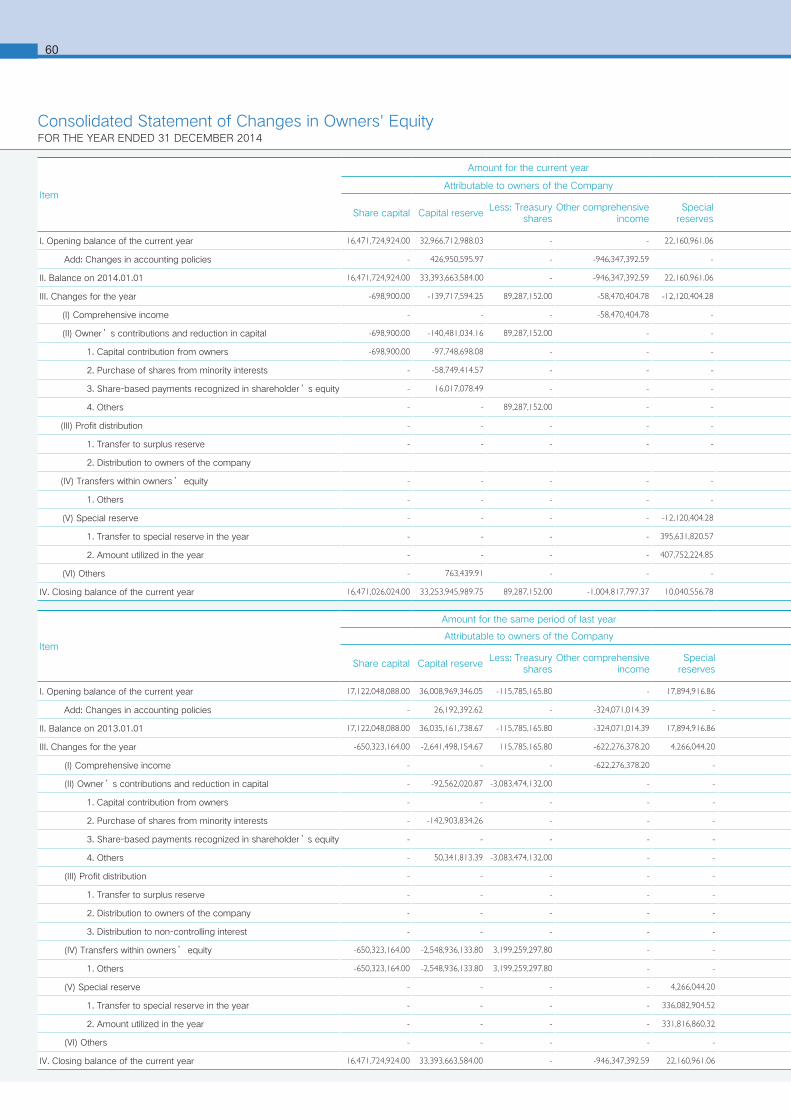
6
Consolidated Statement of Changes in Owners' EquityFOR THE YEAR ENDED 31 DECEMBER 2014
Item
Amount for the same period of last year Amount for the same period of last year
Attributable to owners of the Company Attributable to owners of the Company
Minority interest Total owners' equityShare capital Capital reserve
Less: Treasury shares
Other comprehensive income
Special reserves
Surplus reservesGeneral reserve
Retained earningsTranslation differences arising on translation of financial statements
denominated in foreign currenciesSubtotal
I. Opening balance of the current year 17,122,048,088.00 36,008,969,346.05 -115,785,165.80 - 17,894,916.86 23,229,714,608.04 - 34,802,934,026.47 -299,633,775.37 110,766,142,044.25 9,193,478,350.34 119,959,620,394.59
Add: Changes in accounting policies - 26,192,392.62 - -324,071,014.39 - -19,455,181.78 - -81,456,755.60 299,633,775.37 -99,156,783.78 -9,366,893.85 -108,523,677.63
II. Balance on 2013.01.01 17,122,048,088.00 36,035,161,738.67 -115,785,165.80 -324,071,014.39 17,894,916.86 23,210,259,426.26 - 34,721,477,270.87 - 110,666,985,260.47 9,184,111,456.49 119,851,096,716.96
III. Changes for the year -650,323,164.00 -2,641,498,154.67 115,785,165.80 -622,276,378.20 4,266,044.20 1,298,486,769.88 - 2,241,615,441.64 - -253,944,275.35 360,254,722.57 106,310,447.22
(I) Comprehensive income - - - -622,276,378.20 - - - 5,818,471,202.97 - 5,196,194,824.77 192,539,972.17 5,388,734,796.94
(II) Owner’s contributions and reduction in capital - -92,562,020.87 -3,083,474,132.00 - - - - - - -3,176,036,152.87 310,045,796.73 -2,865,990,356.14
1. Capital contribution from owners - - - - - - - - - - 343,232,523.21 343,232,523.21
2. Purchase of shares from minority interests - -142,903,834.26 - - - - - - - -142,903,834.26 -33,186,726.48 -176,090,560.74
3. Share-based payments recognized in shareholder’s equity - - - - - - - - - - - -
4. Others - 50,341,813.39 -3,083,474,132.00 - - - - - - -3,033,132,318.61 -3,033,132,318.61
(III) Profit distribution - - - - - 1,298,486,769.88 - -3,576,855,761.33 - -2,278,368,991.45 -143,887,860.22 -2,422,256,851.67
1. Transfer to surplus reserve - - - - - 1,298,486,769.88 - -1,298,486,769.88 - - - -
2. Distribution to owners of the company - - - - - - - -2,278,368,991.45 - -2,278,368,991.45 -2,278,368,991.45
3. Distribution to non-controlling interest - - - - - - - - - - -143,887,860.22 -143,887,860.22
(IV) Transfers within owners’ equity -650,323,164.00 -2,548,936,133.80 3,199,259,297.80 - - - - - - - - -
1. Others -650,323,164.00 -2,548,936,133.80 3,199,259,297.80 - - - - - - - - -
(V) Special reserve - - - - 4,266,044.20 - - - - 4,266,044.20 1,556,813.89 5,822,858.09
1. Transfer to special reserve in the year - - - - 336,082,904.52 - - - - 336,082,904.52 9,421,821.58 345,504,726.10
2. Amount utilized in the year - - - - 331,816,860.32 - - - - -331,816,860.32 7,865,007.69 339,681,868.01
(VI) Others - - - - - - - - - - - -
IV. Closing balance of the current year 16,471,724,924.00 33,393,663,584.00 - -946,347,392.59 22,160,961.06 24,508,746,196.14 - 36,963,092,712.51 - 110,413,040,985.12 9,544,366,179.06 119,957,407,164.18
60
Item
Amount for the current year Amount for the current year
Attributable to owners of the Company Attributable to owners of the Company
Minority interest Total owners' equityShare capital Capital reserve
Less: Treasury shares
Other comprehensive income
Special reserves
Surplus reservesGeneral reserve
Retained earningsTranslation differences arising on translation of financial statements
denominated in foreign currenciesSubtotal
I. Opening balance of the current year 16,471,724,924.00 32,966,712,988.03 - - 22,160,961.06 24,528,201,377.92 - 37,044,549,468.11 -521,151,950.22 110,512,197,768.90 9,553,733,072.91 120,065,930,841.81
Add: Changes in accounting policies - 426,950,595.97 - -946,347,392.59 - -19,455,181.78 - -81,456,755.60 521,151,950.22 (99,156,783.78) -9,366,893.85 -108,523,677.63
II. Balance on 2014.01.01 16,471,724,924.00 33,393,663,584.00 - -946,347,392.59 22,160,961.06 24,508,746,196.14 - 36,963,092,712.51 - 110,413,040,985.12 9,544,366,179.06 119,957,407,164.18
III. Changes for the year -698,900.00 -139,717,594.25 89,287,152.00 -58,470,404.78 -12,120,404.28 1,342,427,195.32 - 2,802,749,373.18 - 3,844,882,113.19 402,536,869.34 4,247,418,982.53
(I) Comprehensive income - - - -58,470,404.78 - - - 5,792,349,060.90 - 5,733,878,656.12 309,033,748.33 6,042,912,404.45
(II) Owner’s contributions and reduction in capital -698,900.00 -140,481,034.16 89,287,152.00 - - - - - - -230,467,086.16 257,516,198.01 27,049,111.85
1. Capital contribution from owners -698,900.00 -97,748,698.08 - - - - - - - -98,447,598.08 309,846,783.44 211,399,185.36
2. Purchase of shares from minority interests - -58,749,414.57 - - - - - - - -58,749,414.57 -52,330,585.43 -111,080,000.00
3. Share-based payments recognized in shareholder’s equity - 16,017,078.49 - - - - - - - 16,017,078.49 - 16,017,078.49
4. Others - - 89,287,152.00 - - - - - - -89,287,152.00 - -89,287,152.00
(III) Profit distribution - - - - - 1,342,427,195.32 - -2,989,599,687.72 - -1,647,172,492.40 -147,297,033.12 -1,794,469,525.52
1. Transfer to surplus reserve - - - - - 1,342,427,195.32 - -1,342,427,195.32 - -
2. Distribution to owners of the company -1,647,172,492.40
(IV) Transfers within owners’ equity - - - - - - - - - - - -
1. Others - - - - - - - - - - - -
(V) Special reserve - - - - -12,120,404.28 - - - - -12,120,404.28 112,920.62 -12,007,483.66
1. Transfer to special reserve in the year - - - - 395,631,820.57 - - - - 395,631,820.57 189,334.28 395,821,154.85
2. Amount utilized in the year - - - - 407,752,224.85 - - - - -407,752,224.85 76,413.66 407,828,638.51
(VI) Others - 763,439.91 - - - - - - - 763,439.91 -16,828,964.50 -16,065,524.59
IV. Closing balance of the current year 16,471,026,024.00 33,253,945,989.75 89,287,152.00 -1,004,817,797.37 10,040,556.78 25,851,173,391.46 - 39,765,842,085.69 - 114,257,923,098.31 9,946,903,048.40 124,204,826,146.71
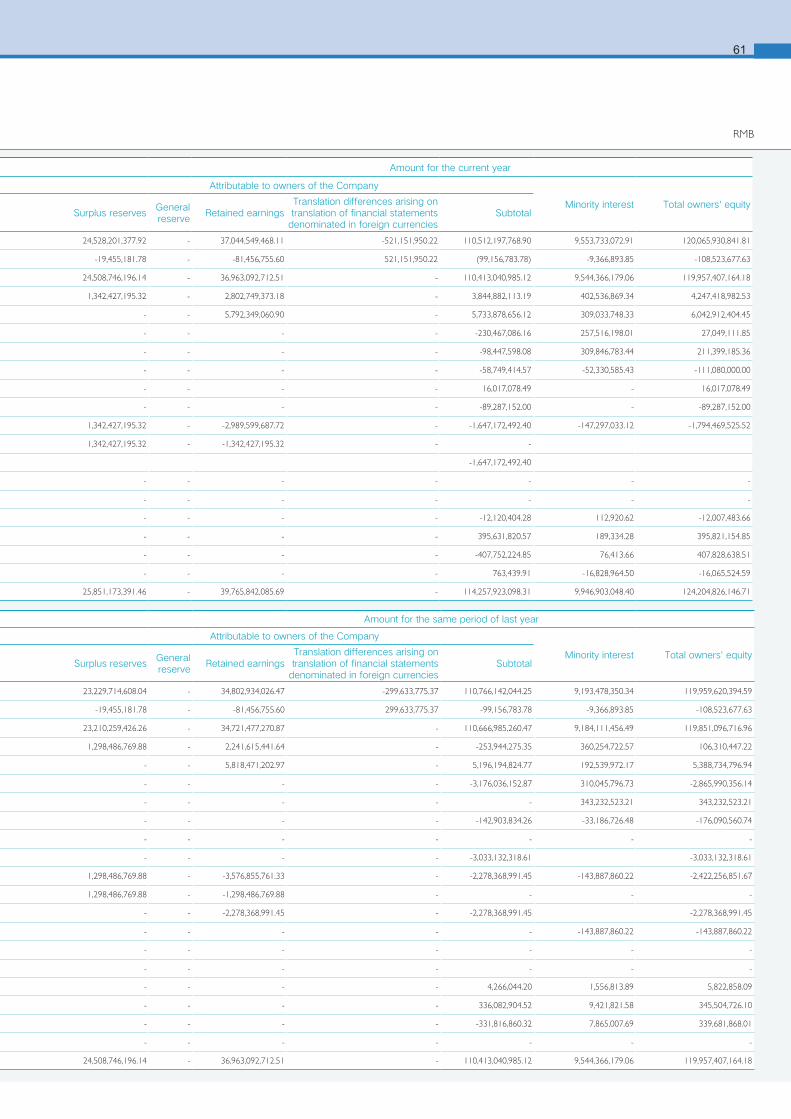
61
RMB
Item
Amount for the same period of last year Amount for the same period of last year
Attributable to owners of the Company Attributable to owners of the Company
Minority interest Total owners' equityShare capital Capital reserve
Less: Treasury shares
Other comprehensive income
Special reserves
Surplus reservesGeneral reserve
Retained earningsTranslation differences arising on translation of financial statements
denominated in foreign currenciesSubtotal
I. Opening balance of the current year 17,122,048,088.00 36,008,969,346.05 -115,785,165.80 - 17,894,916.86 23,229,714,608.04 - 34,802,934,026.47 -299,633,775.37 110,766,142,044.25 9,193,478,350.34 119,959,620,394.59
Add: Changes in accounting policies - 26,192,392.62 - -324,071,014.39 - -19,455,181.78 - -81,456,755.60 299,633,775.37 -99,156,783.78 -9,366,893.85 -108,523,677.63
II. Balance on 2013.01.01 17,122,048,088.00 36,035,161,738.67 -115,785,165.80 -324,071,014.39 17,894,916.86 23,210,259,426.26 - 34,721,477,270.87 - 110,666,985,260.47 9,184,111,456.49 119,851,096,716.96
III. Changes for the year -650,323,164.00 -2,641,498,154.67 115,785,165.80 -622,276,378.20 4,266,044.20 1,298,486,769.88 - 2,241,615,441.64 - -253,944,275.35 360,254,722.57 106,310,447.22
(I) Comprehensive income - - - -622,276,378.20 - - - 5,818,471,202.97 - 5,196,194,824.77 192,539,972.17 5,388,734,796.94
(II) Owner’s contributions and reduction in capital - -92,562,020.87 -3,083,474,132.00 - - - - - - -3,176,036,152.87 310,045,796.73 -2,865,990,356.14
1. Capital contribution from owners - - - - - - - - - - 343,232,523.21 343,232,523.21
2. Purchase of shares from minority interests - -142,903,834.26 - - - - - - - -142,903,834.26 -33,186,726.48 -176,090,560.74
3. Share-based payments recognized in shareholder’s equity - - - - - - - - - - - -
4. Others - 50,341,813.39 -3,083,474,132.00 - - - - - - -3,033,132,318.61 -3,033,132,318.61
(III) Profit distribution - - - - - 1,298,486,769.88 - -3,576,855,761.33 - -2,278,368,991.45 -143,887,860.22 -2,422,256,851.67
1. Transfer to surplus reserve - - - - - 1,298,486,769.88 - -1,298,486,769.88 - - - -
2. Distribution to owners of the company - - - - - - - -2,278,368,991.45 - -2,278,368,991.45 -2,278,368,991.45
3. Distribution to non-controlling interest - - - - - - - - - - -143,887,860.22 -143,887,860.22
(IV) Transfers within owners’ equity -650,323,164.00 -2,548,936,133.80 3,199,259,297.80 - - - - - - - - -
1. Others -650,323,164.00 -2,548,936,133.80 3,199,259,297.80 - - - - - - - - -
(V) Special reserve - - - - 4,266,044.20 - - - - 4,266,044.20 1,556,813.89 5,822,858.09
1. Transfer to special reserve in the year - - - - 336,082,904.52 - - - - 336,082,904.52 9,421,821.58 345,504,726.10
2. Amount utilized in the year - - - - 331,816,860.32 - - - - -331,816,860.32 7,865,007.69 339,681,868.01
(VI) Others - - - - - - - - - - - -
IV. Closing balance of the current year 16,471,724,924.00 33,393,663,584.00 - -946,347,392.59 22,160,961.06 24,508,746,196.14 - 36,963,092,712.51 - 110,413,040,985.12 9,544,366,179.06 119,957,407,164.18
Item
Amount for the current year Amount for the current year
Attributable to owners of the Company Attributable to owners of the Company
Minority interest Total owners' equityShare capital Capital reserve
Less: Treasury shares
Other comprehensive income
Special reserves
Surplus reservesGeneral reserve
Retained earningsTranslation differences arising on translation of financial statements
denominated in foreign currenciesSubtotal
I. Opening balance of the current year 16,471,724,924.00 32,966,712,988.03 - - 22,160,961.06 24,528,201,377.92 - 37,044,549,468.11 -521,151,950.22 110,512,197,768.90 9,553,733,072.91 120,065,930,841.81
Add: Changes in accounting policies - 426,950,595.97 - -946,347,392.59 - -19,455,181.78 - -81,456,755.60 521,151,950.22 (99,156,783.78) -9,366,893.85 -108,523,677.63
II. Balance on 2014.01.01 16,471,724,924.00 33,393,663,584.00 - -946,347,392.59 22,160,961.06 24,508,746,196.14 - 36,963,092,712.51 - 110,413,040,985.12 9,544,366,179.06 119,957,407,164.18
III. Changes for the year -698,900.00 -139,717,594.25 89,287,152.00 -58,470,404.78 -12,120,404.28 1,342,427,195.32 - 2,802,749,373.18 - 3,844,882,113.19 402,536,869.34 4,247,418,982.53
(I) Comprehensive income - - - -58,470,404.78 - - - 5,792,349,060.90 - 5,733,878,656.12 309,033,748.33 6,042,912,404.45
(II) Owner’s contributions and reduction in capital -698,900.00 -140,481,034.16 89,287,152.00 - - - - - - -230,467,086.16 257,516,198.01 27,049,111.85
1. Capital contribution from owners -698,900.00 -97,748,698.08 - - - - - - - -98,447,598.08 309,846,783.44 211,399,185.36
2. Purchase of shares from minority interests - -58,749,414.57 - - - - - - - -58,749,414.57 -52,330,585.43 -111,080,000.00
3. Share-based payments recognized in shareholder’s equity - 16,017,078.49 - - - - - - - 16,017,078.49 - 16,017,078.49
4. Others - - 89,287,152.00 - - - - - - -89,287,152.00 - -89,287,152.00
(III) Profit distribution - - - - - 1,342,427,195.32 - -2,989,599,687.72 - -1,647,172,492.40 -147,297,033.12 -1,794,469,525.52
1. Transfer to surplus reserve - - - - - 1,342,427,195.32 - -1,342,427,195.32 - -
2. Distribution to owners of the company -1,647,172,492.40
(IV) Transfers within owners’ equity - - - - - - - - - - - -
1. Others - - - - - - - - - - - -
(V) Special reserve - - - - -12,120,404.28 - - - - -12,120,404.28 112,920.62 -12,007,483.66
1. Transfer to special reserve in the year - - - - 395,631,820.57 - - - - 395,631,820.57 189,334.28 395,821,154.85
2. Amount utilized in the year - - - - 407,752,224.85 - - - - -407,752,224.85 76,413.66 407,828,638.51
(VI) Others - 763,439.91 - - - - - - - 763,439.91 -16,828,964.50 -16,065,524.59
IV. Closing balance of the current year 16,471,026,024.00 33,253,945,989.75 89,287,152.00 -1,004,817,797.37 10,040,556.78 25,851,173,391.46 - 39,765,842,085.69 - 114,257,923,098.31 9,946,903,048.40 124,204,826,146.71
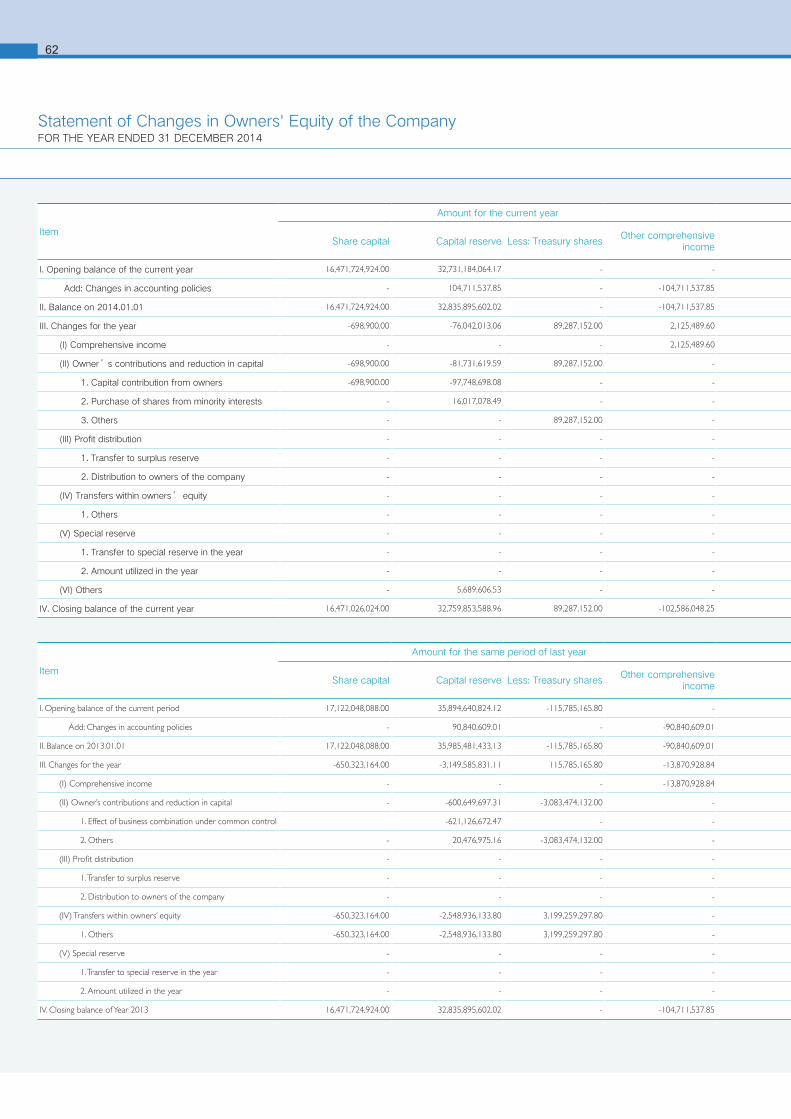
6
Statement of Changes in Owners' Equity of the CompanyFOR THE YEAR ENDED 31 DECEMBER 2014
Item
Amount for the current year Amount for the current year
Share capital Capital reserve Less: Treasury sharesOther comprehensive
incomeSpecial reserve Surplus reserves
General reserve
Retained earnings Total owners' equity
I. Opening balance of the current year 16,471,724,924.00 32,731,184,064.17 - - - 24,528,201,377.92 - 30,571,312,973.03 104,302,423,339.12
Add: Changes in accounting policies - 104,711,537.85 - -104,711,537.85 - -19,455,181.78 - -77,820,727.14 -97,275,908.92
II. Balance on 2014.01.01 16,471,724,924.00 32,835,895,602.02 - -104,711,537.85 - 24,508,746,196.14 - 30,493,492,245.89 104,205,147,430.20
III. Changes for the year -698,900.00 -76,042,013.06 89,287,152.00 2,125,489.60 - 1,342,427,195.32 - 3,722,536,288.91 4,901,060,908.77
(I) Comprehensive income - - - 2,125,489.60 - - - 6,712,135,976.63 6,714,261,466.23
(II) Owner’s contributions and reduction in capital -698,900.00 -81,731,619.59 89,287,152.00 - - - - - -171,717,671.59
1. Capital contribution from owners -698,900.00 -97,748,698.08 - - - - - - -98,447,598.08
2. Purchase of shares from minority interests - 16,017,078.49 - - - - - - 16,017,078.49
3. Others - - 89,287,152.00 - - - - - -89,287,152.00
(III) Profit distribution - - - - - 1,342,427,195.32 - -2,989,599,687.72 -1,647,172,492.40
1. Transfer to surplus reserve - - - - - 1,342,427,195.32 - -1,342,427,195.32 -
2. Distribution to owners of the company - - - - - - - -1,647,172,492.40 -1,647,172,492.40
(IV) Transfers within owners’ equity - - - - - - - - -
1. Others - - - - - - - - -
(V) Special reserve - - - - - - - - -
1. Transfer to special reserve in the year - - - - 348,301,699.10 - - - 348,301,699.10
2. Amount utilized in the year - - - - 348,301,699.10 - - - 348,301,699.10
(VI) Others - 5,689,606.53 - - - - - - 5,689,606.53
IV. Closing balance of the current year 16,471,026,024.00 32,759,853,588.96 89,287,152.00 -102,586,048.25 - 25,851,173,391.46 - 34,216,028,534.80 109,106,208,338.97
Item
Amount for the same period of last year Amount for the same period of last year
Share capital Capital reserve Less: Treasury sharesOther comprehensive
incomeSpecial reserve Surplus reserves
General reserve
Retained earnings Total owners' equity
I. Opening balance of the current period 17,122,048,088.00 35,894,640,824.12 -115,785,165.80 - - 23,229,714,608.04 - 27,655,734,884.98 103,786,353,239.34
Add: Changes in accounting policies - 90,840,609.01 - -90,840,609.01 - -19,455,181.78 - -77,820,727.14 -97,275,908.92
II. Balance on 2013.01.01 17,122,048,088.00 35,985,481,433.13 -115,785,165.80 -90,840,609.01 - 23,210,259,426.26 - 27,577,914,157.84 103,689,077,330.42
III. Changes for the year -650,323,164.00 -3,149,585,831.11 115,785,165.80 -13,870,928.84 - 1,298,486,769.88 - 2,915,578,088.05 516,070,099.78
(I) Comprehensive income - - - -13,870,928.84 - - - 6,492,433,849.38 6,478,562,920.54
(II) Owner’s contributions and reduction in capital - -600,649,697.31 -3,083,474,132.00 - - - - - -3,684,123,829.31
1. Effect of business combination under common control -621,126,672.47 - - - - - - -621,126,672.47
2. Others - 20,476,975.16 -3,083,474,132.00 - - - - - -3,062,997,156.84
(III) Profit distribution - - - - - 1,298,486,769.88 - -3,576,855,761.33 -2,278,368,991.45
1. Transfer to surplus reserve - - - - - 1,298,486,769.88 - -1,298,486,769.88 -
2. Distribution to owners of the company - - - - - - - -2,278,368,991.45 -2,278,368,991.45
(IV) Transfers within owners’ equity -650,323,164.00 -2,548,936,133.80 3,199,259,297.80 - - - - - -
1. Others -650,323,164.00 -2,548,936,133.80 3,199,259,297.80 - - - - - -
(V) Special reserve - - - - - - - - -
1. Transfer to special reserve in the year - - - - 248,583,387.38 - - - 248,583,387.38
2. Amount utilized in the year - - - - 248,583,387.38 - - - 248,583,387.38
IV. Closing balance of Year 2013 16,471,724,924.00 32,835,895,602.02 - -104,711,537.85 - 24,508,746,196.14 - 30,493,492,245.89 104,205,147,430.20
62
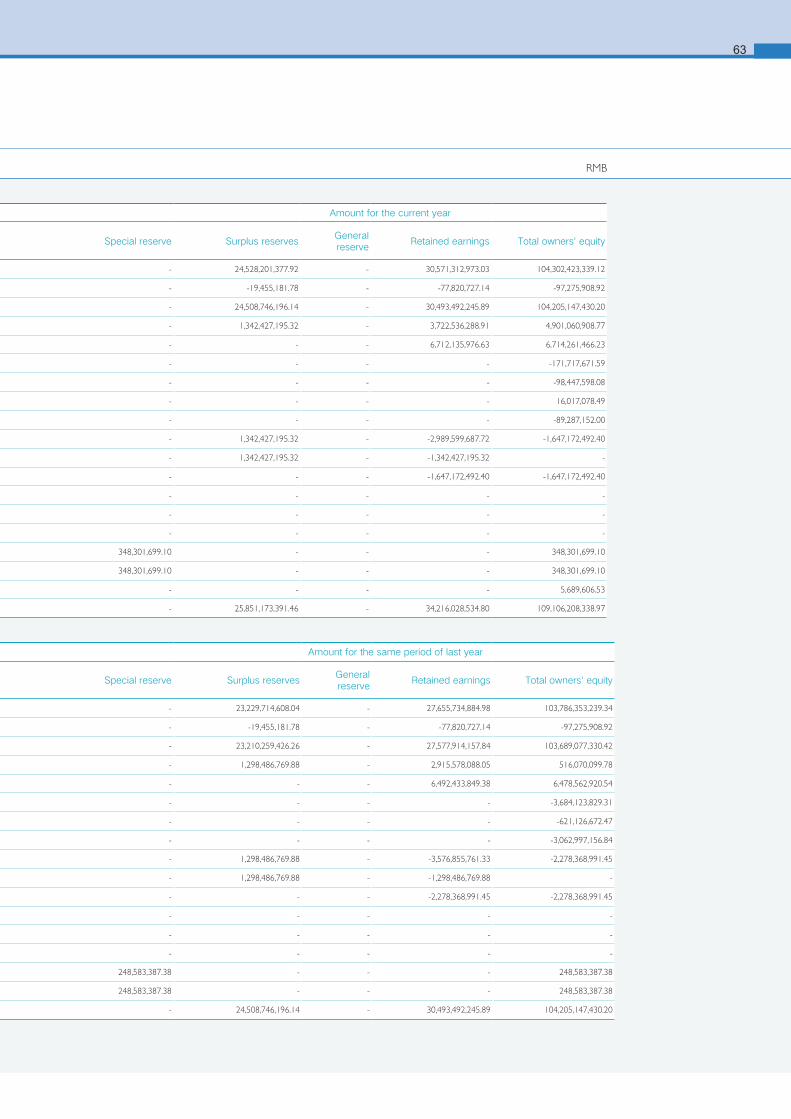
63
Item
Amount for the current year Amount for the current year
Share capital Capital reserve Less: Treasury sharesOther comprehensive
incomeSpecial reserve Surplus reserves
General reserve
Retained earnings Total owners' equity
I. Opening balance of the current year 16,471,724,924.00 32,731,184,064.17 - - - 24,528,201,377.92 - 30,571,312,973.03 104,302,423,339.12
Add: Changes in accounting policies - 104,711,537.85 - -104,711,537.85 - -19,455,181.78 - -77,820,727.14 -97,275,908.92
II. Balance on 2014.01.01 16,471,724,924.00 32,835,895,602.02 - -104,711,537.85 - 24,508,746,196.14 - 30,493,492,245.89 104,205,147,430.20
III. Changes for the year -698,900.00 -76,042,013.06 89,287,152.00 2,125,489.60 - 1,342,427,195.32 - 3,722,536,288.91 4,901,060,908.77
(I) Comprehensive income - - - 2,125,489.60 - - - 6,712,135,976.63 6,714,261,466.23
(II) Owner’s contributions and reduction in capital -698,900.00 -81,731,619.59 89,287,152.00 - - - - - -171,717,671.59
1. Capital contribution from owners -698,900.00 -97,748,698.08 - - - - - - -98,447,598.08
2. Purchase of shares from minority interests - 16,017,078.49 - - - - - - 16,017,078.49
3. Others - - 89,287,152.00 - - - - - -89,287,152.00
(III) Profit distribution - - - - - 1,342,427,195.32 - -2,989,599,687.72 -1,647,172,492.40
1. Transfer to surplus reserve - - - - - 1,342,427,195.32 - -1,342,427,195.32 -
2. Distribution to owners of the company - - - - - - - -1,647,172,492.40 -1,647,172,492.40
(IV) Transfers within owners’ equity - - - - - - - - -
1. Others - - - - - - - - -
(V) Special reserve - - - - - - - - -
1. Transfer to special reserve in the year - - - - 348,301,699.10 - - - 348,301,699.10
2. Amount utilized in the year - - - - 348,301,699.10 - - - 348,301,699.10
(VI) Others - 5,689,606.53 - - - - - - 5,689,606.53
IV. Closing balance of the current year 16,471,026,024.00 32,759,853,588.96 89,287,152.00 -102,586,048.25 - 25,851,173,391.46 - 34,216,028,534.80 109,106,208,338.97
Item
Amount for the same period of last year Amount for the same period of last year
Share capital Capital reserve Less: Treasury sharesOther comprehensive
incomeSpecial reserve Surplus reserves
General reserve
Retained earnings Total owners' equity
I. Opening balance of the current period 17,122,048,088.00 35,894,640,824.12 -115,785,165.80 - - 23,229,714,608.04 - 27,655,734,884.98 103,786,353,239.34
Add: Changes in accounting policies - 90,840,609.01 - -90,840,609.01 - -19,455,181.78 - -77,820,727.14 -97,275,908.92
II. Balance on 2013.01.01 17,122,048,088.00 35,985,481,433.13 -115,785,165.80 -90,840,609.01 - 23,210,259,426.26 - 27,577,914,157.84 103,689,077,330.42
III. Changes for the year -650,323,164.00 -3,149,585,831.11 115,785,165.80 -13,870,928.84 - 1,298,486,769.88 - 2,915,578,088.05 516,070,099.78
(I) Comprehensive income - - - -13,870,928.84 - - - 6,492,433,849.38 6,478,562,920.54
(II) Owner’s contributions and reduction in capital - -600,649,697.31 -3,083,474,132.00 - - - - - -3,684,123,829.31
1. Effect of business combination under common control -621,126,672.47 - - - - - - -621,126,672.47
2. Others - 20,476,975.16 -3,083,474,132.00 - - - - - -3,062,997,156.84
(III) Profit distribution - - - - - 1,298,486,769.88 - -3,576,855,761.33 -2,278,368,991.45
1. Transfer to surplus reserve - - - - - 1,298,486,769.88 - -1,298,486,769.88 -
2. Distribution to owners of the company - - - - - - - -2,278,368,991.45 -2,278,368,991.45
(IV) Transfers within owners’ equity -650,323,164.00 -2,548,936,133.80 3,199,259,297.80 - - - - - -
1. Others -650,323,164.00 -2,548,936,133.80 3,199,259,297.80 - - - - - -
(V) Special reserve - - - - - - - - -
1. Transfer to special reserve in the year - - - - 248,583,387.38 - - - 248,583,387.38
2. Amount utilized in the year - - - - 248,583,387.38 - - - 248,583,387.38
IV. Closing balance of Year 2013 16,471,724,924.00 32,835,895,602.02 - -104,711,537.85 - 24,508,746,196.14 - 30,493,492,245.89 104,205,147,430.20
RMB
664
(I) COMPANY PROFILEBaoshan Iron & Steel Company Limited (the "Company") was incorporated and registered on 3 February 2000 in Shanghai, the People’s Republic of China ("PRC"), as a limited company, with the registration number of 310000000074519, under the law of the PRC. The Company was established by Shanghai Baosteel Group Corporation Ltd. (formerly "Shanghai Baosteel Group Corporation"; hereinafter "Baosteel Group") as the sole investor, under the official approval document No. [1999] 1266, as issued by the State Economic & Trade Commission of China.
The Company took over related businesses, assets and liabilities from Baosteel Group by means of issuing 10,635,000,000 ordinary shares to Baosteel Group with a par value of RMB 1.00 each on the date of establishment.
The Company issued 1,877,000,000 ordinary shares (A shares) to the general public with a par value of RMB1 each and an offer price of RMB4.18 by means of on-line stock exchange listing coupled with off-line rationed subscription, from 6 to 24 November 2000, in compliance with the approval document No. [2000] 140, issued by the China Securities Regulatory Commission (the "CSRC").
Following the approval by the CSRC, as provided in the approval document No. [2005]15, during 21 to 26 of April 2005, the Company issued five billion shares with a par value of RMB1.00 each and an offer price of RMB5.12 per share, including three billion state-owned shares to Shanghai Baosteel Group Corporation and two billion to the general public, with the latter on a combinatory basis of preferential claiming, pro-rata and online and off-line bidding inquiry.
Approved by the CSRC (No. 739 document in 2008), the Company issued RMB 10 billion convertible loan notes featuring the separation between liability and conversion option components on 20 June 2008. In this issuance, the original circulating shareholders for unlimited sale (of shares) conditions were given the priority for placing, and the rest of the notes were sold to institutional investors through price inquiry and to online applicants. The notes were issued based on the face value, which was RMB 100.00 per stock. The dividend was paid once a year and the principal was returned once and for all when the time expired. The annual contract interest rate was 0.8% per annum. The purchaser of the note was able to obtain 16 copies of stock purchase components issued by the issuer, the duration of the component was 24 months from the day when it was listed, and the exercising period was the last 5 trading days of the duration. The exercise proportion was 2:1 and the initial exercise price was RMB 12.50 per stock. The liability and conversion option components were listed and traded on Shanghai Stock Exchange on 4 July 2008. The exercise price was then adjusted to RMB11.80 per stock due to dividend. The exercising period was from 28 June to 3 July 2010. A total of 113,785 components were successfully exercised before the stock market closed on 2 July 2010, the last effective exercise date for "Baosteel CWB1", increasing 48,088 shares of the Company.
According to "The Board's Resolution on the motion of repurchase shares of the company by centralized bidding", "The creditors' notice about repurchase shares of Baoshan Iron & Steel Co., Ltd.", "The 2012 second Resolution of extraordinary shareholders meeting of Baoshan Iron & Steel Co., Ltd." and the Company's revised articles of association, the Company repurchased A-shares on Shanghai Stock Exchange by centralized bidding with price of no more than RMB 5 per share and amount of no more than RMB 5 billion in total. The first repurchase began since 21 September 2012, and the Company has repurchased 414,055,508 shares by the end of 2012. According to the resolution and the Company’s revised articles of association, the Company applied for reduction of share capital RMB 0.39 billion and finished all procedures with China Securities Depository and Clearing Corporation Limited., Shanghai Branch on 20 December 2012. The Company renewed all commercial registration in December 2012, and the updated registered share capital RMB 17,122,048,088 as at 31 December 2012.
The Company repurchased 626,267,656 shares in year of 2013, and completed the implementation of the repurchase scheme. In accordance with the resolution of the general shareholders’ meeting of the Company and the regulations of the revised articles of association, the Company has applied for the decrease of the capital of RMB 650,323,164 and completed the cancellation of 650,323,164 shares with the Shanghai Branch of China Securities Depository and Clearing Corporation Limited (CSDC) on 23 May, 2013. The Company completed procedures on industrial and commercial registration on 24 June, 2013, and the updated registered share capital was RMB 16,471,724,924.
The Company reduced the share capital by 698,900 shares due to the repurchase of restricted stock as the vesting conditions have not been met. Refer to note (V) 44 for details.
By the end of the reporting period, the Company had a registered capital and share capital of RMB 16,471,026,024, among which, out of the RMB 16,471,724,924 ordinary shares without sales restriction of the Company, Baosteel Group has held 13,128,825,267 shares with an equity interest of 79.71%.
The business scope of the Company covers iron and steel production and its related processing, power generation, coal, industrial-gas generation, port terminals, warehouse storage and transport. It is also engaged in technology development and transfer, technology services and consulting, automobile maintenance, exports of steel products and technology, imports of related materials, machinery, equipment, parts and components, as well as technology(except for restricted items, i.e. where imports and exports are prohibited by the Government).
The Company is also engaged in import processing as well as a subsidized trading business. In summary, the principal activities of the Company are the manufacture and sales of iron and steel products as well as the sales and services of the by-products generated during the process of steel production and sales.
The controlling shareholder of the Company is Baosteel Group, while its actual controller is the State-owned Assets Supervision and Administration Commission of the State Council (SASAC).
The Company and its subsidiaries hereinafter refer to as the Group.
The Company and consolidated financial statements have been approved by Board of Directors on 26 March 2015.
The detailed scope of consolidated financial statements demonstrates in Notes (VI) “Interests in Other Entities”.
Notes To The Financial StatementsFOR THE YEAR ENDED 31 DECEMBER 2014
The consolidated financial statements of the Group have been prepared in accordance with Accounting Standards for Business Enterprises (hereinafter refer to “ASBE” or “CASs”, interchangeable) issued by Ministry of Finance of People’s Republic of China, including a number of new and revised CASs issued in 2014. In addition, the Group has prepared the notes to the consolidated financial in accordance with the amendments to Disclosure Requirements for Listed Companies No.15 General Requirement for Financial Statements (as revised in 2014).
The Group’s consolidated financial statements have been prepared on the basis that it will continue as a going concern, since the Group has evaluated its ability to operate on a going concern basis for the next twelve months since 31 December, 2014 and no significant doubt was found.
1、 Statement of compliance with the ASBEThe financial statements of the Company and Group have been prepared in accordance with Accounting Standards for Business Enterprises, and present truly and completely, the Company's and the Group's financial position as of 31 December, 2014, and the Company's and the Group's results of operations and cash flows for the year then ended.
2、 Basis of accounting and principle of measurementThe Group adopts the accrual basis of accounting. Except for certain financial instruments which are measured at fair value, the Group adopts the historical cost as the principle of measurement of the financial statements. Where assets are impaired, provisions for assets impairment are made in accordance with relevant requirements.
In according with the historical cost method, the assets' value should be the same with the fair value of cash or cash equivalents paid for those assets. The liabilities should be the same amount with the cash or cash equivalents received the contract amount or the future payment for the present obligations.
Fair value is the amount received by selling assets or paid for transferring liabilities in orderly transaction held by market participants on measuring day. Whether fair value is observable or estimated by measurement technology, it was determined on this base in the financial statements for measurement or disclosure.
The fair value was separated into three levels based on observable degree of value inputted and the importance of those inputted value:
Level 1: the inputted value is the same with an unadjusted price of the same assets or liabilities which could be obtained on measuring day;
Level 2: the inputted value is directly or indirectly observable for related assets or liabilities but other than the Level 1 value;
Level 3: the inputted value is unobservable for related assets or liabilities.
3、 Accounting yearThe Group adopts the calendar year as its accounting year, i.e. from 1 January to 31 December.
4、 Operating cycleOperating cycle is the time period between the purchase of raw material for production and the collection of cash from receivable created by the sale of inventory. The Company's operating cycle is twelve months.
5、 Functional currencyRenminbi ("RMB") is the currency of the primary economic environment in which the Company and its domestic subsidiaries operate. Therefore, the Company and its domestic subsidiaries choose RMB as their functional currency. The Company's foreign subsidiaries choose their functional currencies on the basis of the primary economic environment in which they operate. The Group adopts RMB to prepare its financial statements.
6、 The accounting treatment of business combinations involving enterprises under common control and business combinations not involving enterprises under common control
Business combinations are categorized as business combinations involving enterprises under common control and business combinations not involving enterprises under common control.
6.1 Business combinations involving enterprises under common control
A business combination involving enterprises under common control is a business combination in which all of the combining enterprises are ultimately controlled by the same party or parties both before and after the combination, and that control is not transitory.
Assets and liabilities obtained shall be measured at their respective carrying amounts as recorded by the combining entities at the date of the combination. The difference between the carrying amount of the net assets obtained and the carrying amount of the consideration paid for the combination (or the aggregate face value of shares issued as consideration) is adjusted to the capital premium in capital reserve. If the capital premium is not sufficient to absorb the difference, any excess shall be adjusted against retained earnings. Costs that are directly attributable to the combination are charged to profit or loss in the period in which they are incurred.
65
(II) BASIS OF PREPARATION OF FINANCIAL STATEMENTS
(III) THE COMPANY'S SIGNIFICANT ACCOUNTING POLICIES, ACCOUNTING ESTIMATES AND PRIOR PERIOD ADJUSTMENTS
Notes To The Financial Statements– continuedFOR THE YEAR ENDED 31 DECEMBER 2014
6
6.2 Business combinations involving enterprises not under common control
A business combination not involving enterprises under common control is a business combination in which all of the combining enterprises are not ultimately controlled by the same party or parties before and after the combination.
The cost of combination is the aggregate of the fair values, at the acquisition date, of the assets given, liabilities incurred or assumed, and equity securities issued by the acquirer in exchange for control of the acquiree. The intermediary expenses incurred by the acquirer in respect of auditing, legal services, valuation and consultancy services, etc. and other associated administrative expenses attributable to the business combination are recognized in profit or loss when they are incurred. Where a business combination not involving enterprises under common control is achieved in stages that involve multiple transactions, the cost of combination is the sum of the consideration paid at the acquisition date and the fair value at the acquisition date of the acquirer's previously held interest in the acquiree. The equity interest in the acquiree held before the acquisition date is remeasured at its fair value at the acquisition date, with any difference between its fair value and its carrying amount being recognized as investment income. The other comprehensive income of the acquiree before the acquisition date relating to the previously held interest in the acquiree is transferred to investment income.
The acquiree's identifiable assets, liabilities and contingent liabilities that satisfy the recognition criteria, which are acquired in a business combination not involving enterprises under common control, are measured at their fair value at the acquisition date. Where the cost of combination exceeds the acquirer's interest in the fair value of the acquiree's identifiable net assets, the difference is recognized as goodwill as an asset and measured at cost. Where the cost of combination is less than the acquirer’s interest in the fair value of the acquiree's identifiable net assets, the difference is accounted for as follows: firstly, the acquirer reassesses the measurement of the fair values of the acquiree's identifiable assets, liabilities and contingent liabilities and measurement of the cost of combination; then, if after that reassessment, the cost of combination is still less than the acquirer's interest in the fair value of the acquiree's identifiable net assets, the acquirer recognizes the remaining difference immediately in profit or loss for the current period.
7、 Preparation of consolidated financial statements
The scope of consolidated financial statements is determined on the basis of control. "Control" exists when the investor has all the following: power over the investee; exposure or rights to variable returns from its involvement with the investee; and the ability to use its power over the investee to affect the amount of the investee's returns.
For a subsidiary disposed of by the Group, the operating results and cash flows before the date of disposal (the date when control is lost) are included in the consolidated income statement and consolidated statement of cash flows, as appropriate.
For a subsidiary acquired through a business combination not involving enterprises under common control, the operating results and cash flows from the acquisition date (the date when control is obtained) are included in the consolidated income statement and consolidated statement of cash flows, as appropriate, and no adjustment is made to the opening balances and comparative figures in the consolidated financial statements.
No matter when the business combination occurs in the reporting period, subsidiaries acquired through a business combination involving enterprises under common control are included in the Group's scope of consolidation as if they had been included in the scope of consolidation from the date when they first came under the common control of the ultimate controlling party. Their operating results and cash flows from the beginning of the earliest reporting period are included in the consolidated income statement and consolidated statement of cash flows, as appropriate.
The significant accounting policies and accounting periods adopted by the subsidiaries are determined based on the uniform accounting policies and accounting periods set out by the Company.
All significant intra-group balances and transactions are eliminated on consolidation.
The portion of subsidiaries' equity that is not attributable to the Company is treated as minority interests and presented as "minority interests" in the consolidated balance sheet within shareholders' equity. The portion of net profits or losses of subsidiaries for the period attributable to minority interests is presented as "minority interests" in the consolidated income statement below the "net profit" line item.
When the amount of loss for the period attributable to the minority shareholders of a subsidiary exceeds the minority shareholders' portion of the opening balance of owners' equity of the subsidiary, the excess amount are still allocated against minority interests.
Acquisition of minority interests or disposal of interest in a subsidiary that does not result in the loss of control over the subsidiary is accounted for as equity transactions. The carrying amounts of the Company's interests and minority interests are adjusted to reflect the changes in their relative interests in the subsidiary. The difference between the amount by which the minority interests are adjusted and the fair value of the consideration paid or received is adjusted to capital reserve under owners' equity. If the capital reserve is not sufficient to absorb the difference, the excess is adjusted against retained earnings.
When the Group loses control over a subsidiary due to disposal of certain equity interest or other reasons, any retained interest is re-measured at its fair value at the date when control is lost. The difference between (i) the aggregate of the consideration received on disposal and the fair value of any retained interest and (ii) the share of the former subsidiary's net assets cumulatively calculated from the acquisition date according to the original proportion of equity interest is recognized as investment income in the period in which control is lost. Other comprehensive income associated with investment in the former subsidiary is reclassified to investment income in the period in which control is lost.
8、 The classification of joint arrangements and the treatment for joint operations
Join arrangement can be classified into either a joint operation or a joint venture according to rights and obligations of each joint operator entitled based on the structure, the legal form and the detail clause of the joint arrangement. A joint venture is a joint arrangement whereby the parties that have joint control of the arrangement have rights to the net assets of the joint arrangement. Joint control is the contractually agreed sharing of control of an arrangement, which exists only when decisions about the relevant activities require unanimous consent of the parties sharing control. For more details please refer to the Note (III) "14.3.2 - Long-term equity investment accounted for using the equity method".
66
(III) THE COMPANY'S SIGNIFICANT ACCOUNTING POLICIES, ACCOUNTING ESTIMATES AND PRIOR PERIOD ADJUSTMENTS – continued
Notes To The Financial Statements– continuedFOR THE YEAR ENDED 31 DECEMBER 2014

67
9、 Recognition criteria of cash and cash equivalents
Cash comprises cash on hand and deposits that can be readily withdrawn on demand. Cash equivalents are the Group's short-term, highly liquid investments that are readily convertible to known amounts of cash and which are subject to an insignificant risk of change in value.
10、 Translation of transactions and financial statements denominated in foreign currencies
10.1 Transactions denominated in foreign currencies
A foreign currency transaction is recorded, on initial recognition, by applying the spot exchange rate on the date of the transaction.
At the balance sheet date, foreign currency monetary items are translated into RMB using the spot exchange rates at the balance sheet date. Exchange differences arising from the differences between thespot exchange rates prevailing at the balance sheet date and those on initial recognition or at the previous balance sheet date are recognized in profit or loss for the period, except that (1) exchange differences related to a specific-purpose borrowing denominated in foreign currency that qualify for capitalization are capitalized as part of the cost of the qualifying asset during the capitalization period; (2) exchange differences related to hedging instruments for the purpose of hedging against foreign currency risks are accounted for using hedge accounting; (3) exchange differences arising from available-for-sale non-monetary items (such as shares) denominated in foreign currencies and changes in the carrying amounts (other than the amortized cost) of available-for-sale monetary items are recognized as other comprehensive income and included in capital reserve.
When the consolidated financial statements include foreign operations, if there is foreign currency monetary item constituting a net investment in a foreign operation, exchange difference arising from changes in exchange rates are recognized as "exchange differences arising on translation of financial statements denominated in foreign currencies" in owners' equity, and in profit and loss for the period upon disposal of the foreign operation.
Foreign currency non-monetary items measured at historical cost are translated to the amounts in functional currency at the spot exchange rates on the dates of the transactions and the amounts in functional currency
remain unchanged. Foreign currency non-monetary items measured at fair value are re-translated at the spot exchange rate on the date the fair value is determined. Difference between the re-translated functional currency amount and the original functional currency amount is treated as changes in fair value (including changes of exchange rate) and is recognized in profit and loss or as other comprehensive income included in capital reserve.
10.2 Translation of financial statements denominated in foreign currencies
For the purpose of preparing the consolidated financial statements, financial statements of a foreign operation are translated from the foreign currency into RMB using the following method: assets and liabilities on the balance sheet are translated at the spot exchange rate prevailing at the balance sheet date; shareholders' equity items except for retained earnings are translated at the spot exchange rates at the dates on which such items arose; all items in the income statement as well as items reflecting the distribution of profits are translated at the average exchange rate of the transaction period; the opening balance of retained earnings is the translated closing balance of the previous year's retained earnings; the closing balance of retained earnings is calculated and presented on the basis of each translated income statement and profit distribution item. The difference between the translated assets and the aggregate of liabilities and shareholders' equity items is separately presented as the exchange differences arising on translation of financial statements denominated in foreign currencies under the shareholders' equity in the balance sheet.
Cash flows arising from a transaction in foreign currency and the cash flows of a foreign subsidiary are translated at the average exchange rate in the period of the cash flows. The effect of exchange rate changes on cash and cash equivalents is regarded as a reconciling item and presented separately in the cash flow statement as "effect of exchange rate changes on cash and cash equivalents".
The opening balances and the comparative figures of previous year are presented at the translated amounts in the previous year's financial statements.
11、 Financial instruments
Financial assets and financial liabilities are recognized when the Group becomes a party to the contractual provisions of the instrument.
Financial assets and financial liabilities are initially measured at fair value. For financial assets and financial liabilities at fair value through profit or loss, transaction costs are immediately recognized in profit or loss.
For other financial assets and financial liabilities, transaction costs are included in their initial recognized amounts.
11.1 Effective interest method
The effective interest method is a method of calculating the amortized cost of a financial asset or a financial liability (or a group of financial assets or financial liabilities) and of allocating the interest income or interest expense over the relevant period, using the effective interest rate. The effective interest rate is the rate that exactly discounts estimated future cash flows through the expected life of the financial asset or financial liability or, where appropriate, a shorter period to the net carrying amount of the financial asset or financial liability.
When calculating the effective interest rate, the Group estimates future cash flows considering all contractual terms of the financial asset or financial liability (without considering future credit losses), and also considers all fees paid or received between the parties to the contract giving rise to the financial asset and financial liability that are an integral part of the effective interest rate, transaction costs, and premiums or discounts, etc.
11.2 Classification, recognition and measurement of financial assets
On initial recognition, financial assets are classified into one of the four categories, including financial assets at fair value through profit or loss, held-to-maturity investments, loans and receivables, and available-for-sale financial assets. All regular way purchases or sales of financial assets are recognized and derecognized on a trade date basis.
(III) THE COMPANY'S SIGNIFICANT ACCOUNTING POLICIES, ACCOUNTING ESTIMATES AND PRIOR PERIOD ADJUSTMENTS – continued
Notes To The Financial Statements– continuedFOR THE YEAR ENDED 31 DECEMBER 2014
(III) THE COMPANY'S SIGNIFICANT ACCOUNTING POLICIES, ACCOUNTING ESTIMATES AND PRIOR PERIOD ADJUSTMENTS – continued
6
11.2.1 Financial Assets at Fair Value through Profit or Loss ("FVTPL")
Financial assets at FVTPL include financial assets held for trading and those designated as at fair value through profit or loss.
A financial asset is classified as held for trading if one of the following conditions is satisfied: (1) It has been acquired principally for the purpose of selling in the near term; or (2) On initial recognition it is part of a portfolio of identified financial instruments that the Group manages together and there is objective evidence that the Group has a recent actual pattern of short-term profit-taking; or (3) It is a derivative that is not designated and effective as a hedging instrument, or a financial guarantee contract, or a derivative that is linked to and must be settled by delivery of an unquoted equity instrument (without a quoted price in an active market) whose fair value cannot be reliably measured.
A financial asset may be designated as at FVTPL upon initial recognition only when one of the following conditions is satisfied: (1)Such designation eliminates or significantly reduces a measurement or recognition inconsistency that would otherwise result from measuring assets or recognizing the gains or losses on them on different bases; or (2) The financial asset forms part of a group of financial assets or a group of financial assets and financial liabilities, which is managed and its performance is evaluated on a fair value basis, in accordance with the Group's documented risk management or investment strategy, and information about the grouping is reported to key management personnel on that basis; or (3) Financial assets that are designated at fair value through profit or loss and hybrid instruments related to embedded derivatives allowed under Accounting Standard for Business Enterprises NO. 22.
Financial assets at FVTPL are subsequently measured at fair value. Any gains or losses arising from changes in the fair value and any dividend or interest income earned on the financial assets are recognized in profit or loss.
11.2.2 Held-to-maturity investments
Held-to-maturity investments are non-derivative financial assets with fixed or determinable payments and fixed maturity dates that the Group's management has the positive intention and ability to hold to maturity.
Held-to-maturity investments are subsequently measured at amortized cost using the effective interest method. Gain or loss arising from derecognition, impairment or amortization is recognized in profit or loss.
11.2.3 Loans and receivables
Loans and receivables are non-derivative financial assets with fixed or determinable payments that are not quoted in an active market. Financial assets classified as loans and receivables by the Group include notes receivable, accounts receivable, interest receivable, dividends receivable, other receivables and loans and advances to customers.
Loans and receivables are subsequently measured at amortized cost using the effective interest method. Gains or losses arising from derecognition, impairment or amortization are recognized in profit or loss for the current period.
11.2.4 Available-for-sale financial assets
Available-for-sale financial assets include non-derivative financial assets that are designated on initial recognition as available for sale and financial assets that are not classified as financial assets at fair value through profit or loss, loans and receivables or held-to-maturity investments.
Available-for-sale financial assets are subsequently measured at fair value, and gains or losses arising from changes in the fair value are recognized as other comprehensive income and included in the capital reserve, except that impairment losses and exchange differences related to amortized cost of monetary financial assets denominated in foreign currencies are recognized in profit or loss, until the financial assets are derecognized, at which time the gains or losses are released and recognized in profit or loss.
Interests obtained and the dividends declared by the investee during the period in which the available-for-sale financial assets are held, are recognized in investment gains.
For investments in equity instruments that do not have a quoted market price in an active market and whose fair value cannot be reliably measured, and derivative financial assets that are linked to and must be settled by delivery of such unquoted equity instruments, they are measured at cost.
11.3 Impairment of financial assets
The Group assesses at each balance sheet date the carrying amounts of financial assets other than those at fair value through profit or loss. If there is objective evidence that a financial asset is impaired, the Group determines the amount of any impairment loss. Objective evidence that a financial asset is impaired is evidence that, arising from one or more events that occurred after the initial recognition of the asset, the estimated future cash flows of the financial asset, which can be reliably measured, have been affected.
Objective evidence that a financial asset is impaired includes the following observable events:
(1) Significant financial difficulty of the issuers or the debtors;
(2) A breach of contract by the debtors, such as a default or delay in interest or principal payments;
(3) The Group, for economic or legal reasons relating to the debtors' financial difficulty, grants a concession to debtors;(4) It becoming probable that the borrower will enter bankruptcy or other financial reorganizations;
(5) The disappearance of an active market for that financial asset because of financial difficulties of the issuer;
(6) Upon an overall assessment of a group of financial assets, observable data indicates that there is a measurable decrease in the estimated future cash flows from the group of financial assets since the initial recognition of those assets, although the decrease cannot yet be identified with the individual financial asset in the group. Such observable data includes:
68
Notes To The Financial Statements– continuedFOR THE YEAR ENDED 31 DECEMBER 2014
(III) THE COMPANY'S SIGNIFICANT ACCOUNTING POLICIES, ACCOUNTING ESTIMATES AND PRIOR PERIOD ADJUSTMENTS – continued
69
- Adverse changes in the payment status of borrower in the group of assets;
- Economic conditions in the country or region of the borrower which may lead to a failure to pay the group of assets;
(7) Significant adverse changes in the technological, market, economic or legal environment in which the issuer operates, indicating that the cost of the investment in the equity instrument may not be recovered by the investor;
(8) A significant or prolonged decline in the fair value of an investment in an equity instrument below its cost;
(9) Other objective evidence indicates that there is an impairment of a financial asset.
-Impairment of financial assets measured at amortized cost
If financial assets carried at amortized cost are impaired, the carrying amounts of the financial assets are reduced to the present value of estimated future cash flows (excluding future credit losses that have not been incurred) discounted at the financial asset's original effective interest rate. The amount of reduction is recognized as an impairment loss in profit or loss. If, subsequent to the recognition of an impairment loss on financial assets carried at amortized cost, there is objective evidence of a recovery in value of the financial assets which can be related objectively to an event occurring after the impairment is recognized, the previously recognized impairment loss is reversed. However, the reversal is made to the extent that the carrying amount of the financial asset at the date the impairment is reversed does not exceed what the amortized cost would have been had the impairment not been recognized.
For a financial asset that is individually significant, the Group assesses the asset individually for impairment. For a financial asset that is not individually significant, the Group assesses the asset individually for impairment or includes the asset in a group of financial assets with similar credit risk characteristics and collectively assesses them for impairment. If the Group determines that no objective evidence of impairment exists for an individually assessed financial asset (whether significant or not), it includes the asset in a group of financial assets with similar credit risk characteristics and collectively reassesses them for impairment. Assets for which an impairment loss is individually recognised are not included in a collective assessment of impairment.
- Impairment of available-for-sale financial assets
The objective evidence of impairment of available-for-sale equity instruments includes the continuous or significant drop of their fair value. Impairment of available-for-sale equity instruments should be determined by the analysis of relevant information. The Fair value of available-for-sale equity instruments falling below their cost does not constitute the indication of impairment.
Impairment of available-for-sale equity instruments, which are held for strategic purpose and will not be sold based on the fluctuation of the stock price, should be determined by the analysis of the investees’ operation. If the investee is suffering from a seriously deteriorated situation, such as the minimum 10% annual decreases of revenue or minimum 20% decrease of EBITDA for three consecutive years, impairment of available-for-sale equity instrument in such an investee should be considered.
Impairment of available-for-sale equity instruments which are held for trading should be considered when the fair value of such instruments falls below 50% of their original investment or the fair value of suchinstruments fall below their original investment for longer than 24 months.
When an available-for-sale financial asset is impaired, the cumulative loss arising from decline in fair value previously recognized directly in capital reserve is reclassified from the capital reserve to profit or loss. The amount of the cumulative loss that is reclassified from capital reserve to profit or loss is the difference between the acquisition cost (net of any principal repayment and amortization) and the current fair value, less any impairment loss on that financial asset previously recognized in profit or loss.
If, subsequent to the recognition of an impairment loss on available-for-sale financial assets, there is objective evidence of a recovery in value of the financial assets which can be related objectively to an event occurring after the impairment is recognized, the previously recognized impairment loss is reversed. The amount of reversal of impairment loss on available-for-sale equity instruments is recognized as other comprehensive income and included in the capital reserve, while the amount of reversal of impairment loss on available-for-sale debt instruments is recognized in profit or loss.
- Impairment of financial assets measured at cost
If an impairment loss has been incurred on an investment in unquoted equity instrument (without a quoted price in an active market) whose fair value cannot be reliably measured, or on a derivative financial asset that is linked to and must be settled by delivery of such an unquoted equity instrument, the carrying amount of the financial asset is reduced to the present value of estimated future cash flows discounted at the current market rate of return for a similar financial asset. The amount of reduction is recognized as an impairment loss in profit or loss. The impairment loss on such financial asset is not reversed once it is recognized.
11.4 Transfer of financial assets
The Group derecognizes a financial asset if one of the following conditions is satisfied: (1) the contractual rights to the cash flows from the financial asset expire; or (2) the financial asset has been transferred and substantially all the risks and rewards of ownership of the financial asset are transferred to the transferee; or (3) although the financial asset has been transferred, the Group neither transfers nor retains substantially all the risks and rewards of ownership of the financial asset but has not retained control of the financial asset.
If the Group neither transfers nor retains substantially all the risks and rewards of ownership of a financial asset, and it retains control of the financial asset, it recognizes the financial asset to the extent of its continuing involvement in the transferred financial asset and recognizes an associated liability. The extent of the Group’s continuing involvement in the transferred asset is the extent to which it is exposed to changes in the value of the transferred asset.
For a transfer of a financial asset in its entirety that satisfies the derecognition criteria, the difference between (1) the carrying amount of the financial asset transferred; and (2) the sum of the consideration received from the transfer and any cumulative gain or loss that has been recognized in other comprehensive income, is recognized in profit or loss.
Notes To The Financial Statements– continuedFOR THE YEAR ENDED 31 DECEMBER 2014
(III) THE COMPANY'S SIGNIFICANT ACCOUNTING POLICIES, ACCOUNTING ESTIMATES AND PRIOR PERIOD ADJUSTMENTS – continued
6
If a part of the transferred financial asset qualifies for derecognition, the carrying amount of the transferred financial asset is allocated between the part that continues to be recognized and the part that is derecognized, based on the respective fair values of those parts. The difference between (1) the carrying amount allocated to the part derecognized; and (2) the sum of the consideration received for the part derecognized and any cumulative gain or loss allocated to the part derecognized which has been previously recognized in other comprehensive income, is recognized in profit or loss.
11.5 Classification, recognition and measurement of financial liabilities
Debt and equity instruments issued by the Group are classified into financial liabilities or equity on the basis of the substance of the contractual arrangements and definitions of financial liability and equity instrument.
On initial recognition, financial liabilities are classified into financial liabilities at fair value through profit or loss and other financial liabilities.
11.5.1 Financial liabilities at fair value through profit or loss
Financial liabilities at FVTPL consist of financial liabilities held for trading and those designated as at FVTPL on initial recognition.
A financial liability is classified as held for trading if one of the following conditions is satisfied: (1) It has been acquired principally for the purpose of repurchasing in the near term; or (2) On initial recognition it is part of a portfolio of identified financial instruments that the Group manages together and there is objective evidence that the Group has a recent actual pattern of short-term profit-taking; or (3) It is a derivative, except for a derivative that is a designated and effective hedging instrument, or a financial guarantee contract, or a derivative that is linked to and must be settled by delivery of an unquoted equity instrument (without a quoted price in an active market) whose fair value cannot be reliably measured.
A financial liability may be designated as at FVTPL upon initial recognition only when one of the following conditions is satisfied: (1) Such designation eliminates or significantly reduces a measurement or recognition inconsistency that would otherwise result from measuring liabilities or recognizing the gains or losses on them on different bases; or (2) The financial liability forms part of a group of financial liabilities or a group of financial assets and financial liabilities, which is managed and its performance is evaluated on a fair value basis, in accordance with the Group's documented risk management or investment strategy, and information about the grouping is reported to key management personnel on that basis; or (3) Financial assets that are designated at fair value through profit or loss and hybrid instruments related to embedded derivatives allowed under Accounting Standard for Business Enterprises NO. 22.
Financial liabilities at FVTPL are subsequently measured at fair value. Any gains or losses arising from changes in the fair value or any dividend or interest expenses related to the financial liabilities are recognised in profit or loss.
11.5.2 Other financial liabilities
For a derivative liability that is linked to and must be settled by delivery of an unquoted equity instrument (without a quoted price in an active market) whose fair value cannot be reliably measured, it is subsequently measured at cost. Other financial liabilities are subsequently measured at amortized cost using the effective interest method, with gain or loss arising from derecognition or amortization recognized in profit or loss.
11.6 Derecognition of Financial Liabilities
The Group derecognizes a financial liability (or part of it) only when the underlying present obligation (or part of it) is discharged. An agreement between the Group (an existing borrower) and an existing lender to replace the original financial liability with a new financial liability with substantially different terms is accounted for as an extinguishment of the original financial liability and the recognition of a new financial liability.
When the Group derecognizes a financial liability or a part of it, it recognizes the difference between the carrying amount of the financial liability (or part of the financial liability) derecognized and the consideration paid (including any non-cash assets transferred or new financial liabilities assumed) in profit or loss.
11.7 Derivatives and embedded derivatives
consideration paid (including any non-cash assets transferred or new financial liabilities assumed) in profit or loss.
Derivative financial instruments include forward contracts, interest rate swaps, etc. Derivatives are initially measured at fair value at the date when the derivative contracts are entered into and are subsequently re-measured at fair value. The resulting gain or loss is recognized in profit or loss.
An embedded derivative is separated from the hybrid instrument, where the hybrid instrument is not designated as a financial asset or financial liability at fair value through profit or loss, and treated as a standalone derivative if the economic characteristics and risks of the embedded derivative are not closely related to the economic characteristics and risks of the host contract; and a separate instrument with the same terms as the embedded derivative would meet the definition of a derivative. If the Group is unable to measure the embedded derivative separately either at acquisition or at a subsequent balance sheet date, it designates the entire hybrid instrument as a financial asset or financial liability at fair value through profit or loss.
11.8 Offsetting financial assets and a financial liabilities
Where the Group has a legal right that is currently enforceable to set off the recognized financial assets and financial liabilities, and intends either to settle on a net basis, or to realize the financial asset and settle the financial liability simultaneously, a financial asset and a financial liability shall be offset and the net amount is presented in the balance sheet. Except for the above circumstances, financial assets and financial liabilities shall be presented separately in the balance sheet and shall not be offset.
11.9 Equity instruments
An equity instrument is any contract that evidences a residual interest in the assets of the Group after deducting all of its liabilities. The consideration received from issuing equity instruments, net of transaction costs, are added to shareholders' equity.
All types of distributions (excluding stock dividends) made by the Group to holders of equity instruments are deducted from shareholders' equity. The Group does not recognize any changes in the fair value of equity instruments.
70
Notes To The Financial Statements– continuedFOR THE YEAR ENDED 31 DECEMBER 2014
(III) THE COMPANY'S SIGNIFICANT ACCOUNTING POLICIES, ACCOUNTING ESTIMATES AND PRIOR PERIOD ADJUSTMENTS – continued
71
11.9.1 Repurchase of share capital
The consideration and transaction costs paid to repurchase share capital are deducted from shareholders' equity. No gain or loss is recognized in profit or loss on the repurchase, sale or cancellation of the Company's share capital. Repurchased share capital is presented as treasury share before cancellation or sale, and all the expenditure occurred in repurchase is accounted for at cost of treasury shares. Treasury shares are not counted in profit appropriation. The Company presents treasury shares as the reserve item of shareholders' equity in the balance sheet. When the Company reduces the capital by means of repurchasing ordinary shares in accordance with statutory procedure, it reduces the share capital in the face value of cancelled shares. The Company recognizes the difference between the consideration paid (including transaction costs) and face value of shares in equity. When the amount of consideration paid exceeds total face value, the difference is offset against capital reserve (capital premium), surplus reserve and retained earnings in consequence, when the amount of consideration paid is less than total face value, the difference is recognized in the capital reserve (capital premium).
11.10 Convertible loan notes
The Group confirms whether the issued convertible loan notes contain both liability and conversion optioncomponents. Convertible loan notes issued by the Group that contain both the liability and conversion option components are classified separately into respective items on initial recognition.
On initial recognition, the fair value of the liability component is determined using the prevailing market interest of similar non-convertible debts. The difference between the gross proceeds of the issue of the convertible loan notes and the fair value assigned to the liability component, representing the conversion option for the holder to convert the loan notes into equity instrument, is included in capital reserve (other capital reserve - share conversion option). In subsequent periods, the liability component of the convertible loan notes is carried at amortized cost using the effective interest method. The conversion option classified as equity remains in equity. Transaction costs incurred for the issue of convertible loan notes are allocated to the liability component and equity component in proportion to their respective fair values. In subsequent periods, the liability component of the convertible loan notes is carried as liability at amortized cost. The conversion option classified as equity remains in equity and does not need subsequent measurement.
Where the conversion option components remain unexercised at the maturity date of the convertible loan notes issued by the Group, the balance recognized in capital reserve (other capital reserve) will be transferred to capital reserve (capital premium). Once the conversion option components are exercised, the equity component recognized in capital reserve (other capital reserve) will be transferred to capital reserve (capital premium); the aggregate nominal amount of shares are credited to share capital at par value of the stock multiplied by the number of shares; the difference between the total funds raised by conversion option components and share capital is credited to capital reserve (capital premium).
12、 Accounts receivable
(1) Receivables that are individually significant and for which bad debt provision is individually assessed
(2) Receivables for which bad debt provision is collectively assessed on a portfolio basis - continued:
Portfolios that aging analysis is used for bad debt provision:
Notes To The Financial Statements– continuedFOR THE YEAR ENDED 31 DECEMBER 2014
Basis for determining an individually significant receivable
A receivable that ranks top five largest is deemed as an individually significant receivable by the Group.
Method of determining provision for receivables that are individually significant and for which bad debt provision is individually assessed
The Group assessing the receivables individually on third party companies who are individually significant and receivables from Baosteel Group in the scope of consolidated statements, assesses the receivables individually on third party companies without impairment, is included in doing impairment assessment on the financial assets with similar credit risk characteristics ;Assessing the receivables from Baosteel Group in the scope of consolidated statements without impairment is no longer included in a collective assessment by aging analysis method. Assessing the receivables which had confirmed impairment is no longer included in doing impairment assessment on the financial assets with similar credit risk characteristics.
Method of determining provision for receivables that are not individually significant and receivables that are individually significant but are not impaired individually
The Group regards age of accounts receivable as credit risk characteristics and divide the balance of accounts receivables into several aging groups according to the same or similar credit risk characteristics of aging group of accounts receivable of previous year, determines the bad debts rate for each aging group on the basis of the actual loss rate combined with the current situation of the aging group, and makes bad debts provision on the basis of calculation.Individual significant or insignificant accounts receivable with no credit risk and that can be collected within short term is not assessed.
Aging Provision as a proportion of accounts receivable (%) Provision as a proportion of other receivables (%)
Within 1 year (inclusive) 5 5
More than 1 year but not exceeding 2 years 30 30
More than 2 years but not exceeding 3 years 60 60
More than 3 years 100 100
(3) Receivables that are individually not significant but for which bad debt provision is individually assessed:
13、 Inventories
13.1 Categories of inventories
The Group's inventories mainly include raw materials, work in progress, finished goods, spare parts and others, etc. Inventories are initially measured at cost. Cost of inventories comprises all costs of purchase, costs of conversion and other expenditures incurred in bringing the inventories to their present location and condition.
13.2 Valuation method of inventories upon delivery
The actual cost of inventories upon delivery is calculated using the weighted average method.
13.3 Basis for determining net realizable value of inventories and provision methods for decline in value of inventories
At the balance sheet date, inventories are measured at the lower of cost and net realizable value. If the net realizable value is below the cost of inventories, a provision for decline in value of inventories is made. Net realizable value is the estimated selling price in the ordinary course of business less the estimated costs of completion, the estimated costs necessary to make the sale and relevant taxes. Net realizable value is determined on the basis of clear evidence obtained, and takes into consideration of the purposes of holding inventories and effect of post balance sheet events.
Provision for decline in value of other inventories is made based on the excess of cost of inventory over its net realizable value on an item-by-item basis.
After the provision for decline in value of inventories is made, if the circumstances that previously caused inventories to be written down below cost no longer exist so that the net realizable value of inventories is higher than their cost, the original provision for decline in value is reversed and the reversal is included in profit or loss for the period.
13.4 Stock count system
The perpetual inventory system is maintained for stock system.
13.5 Amortization method for low cost and short-lived consumable items and packaging materials
Packaging materials and low cost and short-lived consumable items are amortized using the immediate write-off method.
14、 Long-term equity investments
14.1 Criteria of determinating significant influence over the investee
Control is defined as power over the investee, exposed or having the rights to variable returns from its involvement with the investee and having the ability to use its power to affect its returns. Joint control is defined as the contractually agreed sharing of control of an arrangement. Joint control exists only when decisions about the relevant activities require the unanimous consent of the parties sharing control. Significant influence is defined as the power to participate in the financial and operating policy decisions of the investee but is not control or joint control of those policies. When deciding if the investor can exert control or significant influence over the investee, potential factors for voting rights shall be taken into consideration. The factors are not limited to investee's convertible bonds, stock warrants executable currently possessed by the investors and by other holders.
14.2 Determination of investment cost
For a long-term equity investment acquired through a business combination involving enterprises under common control, the investment cost of the long-term equity investment is the attributable share of the carrying amount of the shareholders' equity of the acquiree at the date of combination. For a long-term equity investment acquired through business combination not involving enterprises under common control, theinvestment cost of the long-term equity investment is the cost of acquisition. For a long-term equity investment acquired through business combination not involving enterprises under common control and achieved in stages, the investment cost of the long-term equity investment is the aggregate of the carrying amount of the equity interest held in the acquiree prior to the acquisition date and the cost of the additional investment at the acquisition date. The long-term equity investment acquired otherwise than through a business combination is initially measured at its cost.
14.3 Subsequent measurement and recognition of profit or loss
14.3.1 Long-term equity investment accounted for using the cost method
For long-term equity investments over which the Group does not have joint control or significant influence and without quoted prices in an active market and that fair values cannot be reliably measured, the Group accounts for such long-term equity investments using the cost method. Besides, long-term equity investments in subsidiaries are accounted for using the cost method in the Company's separate financial statements. A subsidiary is an investee that is controlled by the Group.
Under the cost method, a long-term equity investment is measured at initial investment cost. Except for cash dividends or profits already declared but not yet paid that are included in the price or consideration actually paid upon acquisition of the long-term equity investment, investment income is recognized in the period in accordance with the attributable share of cash dividends or profit distributions declared by the investee.
(III) THE COMPANY'S SIGNIFICANT ACCOUNTING POLICIES, ACCOUNTING ESTIMATES AND PRIOR PERIOD ADJUSTMENTS – continued
672
Reasons for determining individual provision for receivables There is objective evidence of impairment.
Method of determining provision for receivables The difference between the estimated recoverable amount and the book value is recognized as bad debt.
Notes To The Financial Statements– continuedFOR THE YEAR ENDED 31 DECEMBER 2014
(III) THE COMPANY'S SIGNIFICANT ACCOUNTING POLICIES, ACCOUNTING ESTIMATES AND PRIOR PERIOD ADJUSTMENTS – continued
73
Notes To The Financial Statements– continuedFOR THE YEAR ENDED 31 DECEMBER 2014
14.3.2 Long-term equity investment accounted for using the equity method
The Group accounts for investment in associates and joint ventures using the equity method. An associate is an entity over which the Group has significant influence and a joint venture is an entity over which the Group exercises joint control along with other investors.
Under the equity method, where the initial investment cost of a long-term equity investment exceeds the Group’s share of the fair value of the investee’s identifiable net assets at the time of acquisition, no adjustment is made to the initial investment cost. Where the initial investment cost is less than the Group’s share of the fair value of the investee’s identifiable net assets at the time of acquisition, the difference is recognized in profit or loss for the period, and the cost of the long-term equity investment is adjusted accordingly.
Under the equity method, the Group recognizes its share of the net profit or loss of the investee for the period as investment income or loss for the period. The Group recognizes its share of the investee’s net profit or loss based on the fair value of the investee’s individual separately identifiable assets at the acquisition date after making appropriate adjustments to conform with the Group's accounting policies and accounting period. Unrealized profits or losses resulting from the Group's transactions with its associates and joint ventures are recognized as investment income or loss to the extent that those attributable to the Group's equity interest are eliminated. However, unrealized losses resulting from the Group's transactions with its associates and joint ventures which represent impairment losses on the transferred assets are not eliminated. Changes in owners' equity of the investee other than net profit or loss are correspondingly adjusted to the carrying amount of the long-term equity investment, and recognized as other comprehensive income which is included in the capital reserve.
The Group discontinues recognizing its share of net losses of the investee after the carrying amount of the long-term equity investment together with any long-term interests that in substance form part of its net investment in the investee is reduced to zero. If the Group has incurred obligations to assume additional losses of the investee, a provision is recognized according to the expected obligation, and recorded as investment loss for the period. Where net profits are subsequently made by the investee, the Group resumes recognizing its share of those profits only after its share of the profits exceeds the share of losses previously not recognized.For long-term equity investments in associates and joint ventures which had been held by the Group before its first-time adoption of Accounting Standards for Business Enterprises on 1 January 2007, where the initial investment cost of a long-term equity investment exceeds the Group’s interest in the investee’s net assets at the time of acquisition, the excess is amortized and is recognized in profit or loss on a straight line basis over the original remaining life.
14.4 Disposal of long-term equity investments
On disposal of a long term equity investment, the difference between the proceeds actually received and receivable and the carrying amount is recognized in profit or loss for the period. For a long-term equity investment accounted for using the equity method, the amount included in the shareholders' equity attributable to the percentage interest disposed is transferred to profit or loss for the period.
15、 Investment properties
Investment property is property held to earn rentals or for capital appreciation or both. It includes a land use right that is leased out and a building that is leased out.
An investment property is measured initially at cost. Subsequent expenditures incurred for such investment property are included in the cost of the investment property if it is probable that economic benefits associated with an investment property will flow to the Group and the subsequent expenditures can be measured reliably. Other subsequent expenditures are recognized in profit or loss in the period in which they are incurred.
The Group uses the cost model for subsequent measurement of investment property, and adopts a depreciation or amortization policy for the investment property which is consistent with that for buildings or land use rights.
The Group reviews the investment properties at each balance sheet date to determine whether there is any indication that they have suffered an impairment loss. If there is any indication that such assets may be impaired, the recoverable amounts are estimated for such assets. Recoverable amount is estimated on individual basis. If it is not practical to estimate the recoverable amount of an individual asset, the recoverable amount of the asset group to which the asset belongs will be estimated. If the recoverable amount of an asset or an asset group is less than its carrying amount, the deficit is accounted for as an impairment loss and is recognized in profit or loss for the period.
When an investment property is sold, transferred, retired or damaged, the Group recognizes the amount of any proceeds on disposal net of the carrying amount and related taxes in profit or loss for the period.
16、 Fixed assets
16.1 Recognition criteria for fixed assets
Fixed assets are tangible assets that are held for use in the production or supply of goods or services, for rental to others, or for administrative purposes, and have useful lives of more than one accounting year. A fixed asset is recognized only when it is probable that economic benefits associated with the asset will flow to the Group and the cost of the asset can be measured reliably. Fixed assets are initially measured at cost.
Subsequent expenditures incurred for the fixed asset are included in the cost of the fixed asset and if it is probable that economic benefits associated with the asset will flow to the Group and the subsequent expenditures can be measured reliably. Meanwhile the carrying amount of the replaced part is derecognized. Other subsequent expenditures are recognized in profit or loss in the period in which they are incurred.
16.2 Depreciation of each category of fixed assets
A fixed asset is depreciated over its useful life using the straight-line method since the month subsequent to the one in which it is ready for intended use. The useful life, estimated net residual value rate and annual depreciation rate of each category of fixed assets are as follows:
Estimated net residual value of a fixed asset is the estimated amount that the Group would currently obtain from disposal of the asset, after deducting the estimated costs of disposal, if the asset were already of the age and in the condition expected at the end of its useful life.
16.3 Other explanations
The Group reviews the useful life and estimated net residual value of a fixed asset and the depreciation method applied at least once at each financial year end, and accounts for any change as a change in an accounting estimate.
If a fixed asset is upon disposal or no future economic benefits are expected to be generated from its use or disposal, the fixed asset is derecognized. When a fixed asset is sold, transferred, retired or damaged, the amount of any proceeds on disposal of the asset net of the carrying amount and related taxes is recognized in profit or loss for the period.
17、 Construction in progress
Construction in progress is measured at its actual costs. The actual costs include various construction expenditures during the construction period, borrowing costs capitalized before it is ready for intended use and other relevant costs. Construction in progress is not depreciated. Construction in progress is transferred to a fixed asset when it is ready for intended use.
The Group assesses at each balance sheet date whether there is any indication that construction in progress may be impaired. If there is any indication that such assets may be impaired, recoverable amounts are estimated for such assets. Recoverable amount is estimated on individual basis. If it is not practical to estimate the recoverable amount of an individual asset, the recoverable amount of the asset group to which the asset belongs will be estimated. If the recoverable amount of an asset or an asset group is less than its carrying amount, the deficit is accounted for as an impairment loss and is recognized in profit or loss for the period.
Once the impairment loss of construction in progress is recognized, it is not be reversed in any subsequent period.
18、 Borrowing costs
Borrowing costs directly attributable to the acquisition, construction or production of qualifying asset are capitalized when expenditures for such asset and borrowing costs are incurred and activities relating to the acquisition, construction or production of the asset that are necessary to prepare the asset for its intended use or sale have commenced. Capitalization of borrowing costs ceases when the qualifying asset being acquired, constructed or produced becomes ready for its intended use or sale. Other borrowing costs are recognized as an expense in the period in which they are incurred.
Where funds are borrowed under a specific-purpose borrowing, the amount of interest to be capitalized is the actual interest expense incurred on that borrowing for the period less any bank interest earned from depositing the borrowed funds before being used on the asset or any investment income on the temporary investment of those funds. Where funds are borrowed under general-purpose borrowings, the Group determines the amount of interest to be capitalized on such borrowings by applying a capitalization rate to the weighted average of the excess of cumulative expenditures on the asset over the amounts of specific-purpose borrowings. The capitalization rate is the weighted average of the interest rates applicable to the general-purpose borrowings.
19、 Intangible assets
19.1 Intangible assets
Intangible asset includes land use rights, software, and etc.
An intangible asset is measured initially at cost. When an intangible asset with a finite useful life is available for use, its original cost less net residual value and any accumulated impairment losses is amortized over its estimated useful life using the straight-line method. An intangible asset with an indefinite useful life is not amortized. The useful life, estimated net residual value rate and amortization method of each category of intangible assets are as follows:
For an intangible asset with a finite useful life, the Group reviews the useful life and amortization method at the end of the period, and makes adjustments when necessary.
(III) THE COMPANY'S SIGNIFICANT ACCOUNTING POLICIES, ACCOUNTING ESTIMATES AND PRIOR PERIOD ADJUSTMENTS – continued
674
Category of fixed assets Depreciation period (years) Residual value (%) Annual depreciation rate (%)
Buildings 15-35 4 2.7-6.4
Machinery and equipment 7-15 4 6.4-13.7
Transportation vehicles 5-10 4 9.6-19.2
Office and other equipment 4-9 4 10.7-24.0
Notes To The Financial Statements– continuedFOR THE YEAR ENDED 31 DECEMBER 2014
Category of intangible assets Amortization method Useful life (year) Residual value rate (%)
Land use rights Straight-line 40 - 70 0%
Software Straight-line 5 0%
(III) THE COMPANY'S SIGNIFICANT ACCOUNTING POLICIES, ACCOUNTING ESTIMATES AND PRIOR PERIOD ADJUSTMENTS – continued
75
Notes To The Financial Statements– continuedFOR THE YEAR ENDED 31 DECEMBER 2014
19.2 Research and development expenditure
Expenditure during the research phase is recognized as an expense in the period in which it is incurred
Expenditure during the development phase that meets all of the following conditions at the same time is recognized as intangible asset. Expenditure during development phase that does not meet the following conditions is recognized in profit or loss for the period
(1) it is technically feasible to complete the intangible asset so that it will be available for use or sale;
(2) the Group has the intention to complete the intangible asset and use or sell it;
(3) the Group can demonstrate the ways in which the intangible asset will generate economic benefits, including the evidence of the existence of a market for the output of the intangible asset or the intangible asset itself or, if it is to be used internally, the usefulness of the intangible asset; (4) the availability of adequate technical, financial and other resources to complete the development and the ability to use or sell the intangible asset; and
(5) the expenditure attributable to the intangible asset during its development phase can be reliably measured.
If the expenditures cannot be distinguished between the research phase and development phase, the Group recognizes all of them in profit or loss for the period.
20、 Impairment of long-term assets
The Group assesses at each balance sheet date whether there is any indication that the long-term equity investments, investment properties measured at cost, fixed assets, construction in progress and intangible assets with a finite useful life may be impaired. If there is any indication that such assets may be impaired, recoverable amounts are estimated for such assets. Recoverable amount is estimated on individual basis. Intangible assets with indefinite useful life and intangible assets not yet available for use are tested for impairment annually, irrespective of whether there is any indication that the assets may be impaired.
If it is not practical to estimate the recoverable amount of an individual asset, the recoverable amount of the asset group to which the asset belongs will be estimated. If the recoverable amount of an asset or an asset group is less than its carrying amount, the deficit is accounted for as an impairment loss and is recognized in profit or loss for the period.
Once the impairment loss of such assets is recognized, it is not be reversed in any subsequent period.
21、 Long-term prepaid expenses
Long-term prepaid expenses represent expenses incurred that should be borne and amortized over the current and subsequent periods of more than one year. Long-term prepaid expenses are amortized using the straight-line method over the expected periods in which benefits are derived.
22、 Assets transferred under repurchase agreements
22.1 Financial assets purchased under resale agreements
Financial assets that have been purchased under agreements with a commitment to resell at a specific future date are not recognized in the balance sheet. The cost of purchasing such assets is presented under "financial assets purchased under resale agreements" in the balance sheet. The difference between the purchasing price and reselling price is recognized as interest income during the term of the agreement using the effective interest method.
22.2 Financial assets sold under repurchase agreements
Financial assets sold subject to agreements with a commitment to repurchase at a specific future date are not derecognized in the balance sheet. The proceeds from selling such assets are presented under "financial assets sold under repurchase agreements" in the balance sheet. The difference between the selling price and repurchasing price is recognized as interest expense during the term of the agreement using the effective interest method.
23、 Employee benefit
(1) Accounting treatment for short-term employee benefits
In an accounting period in which an employee has rendered service to the Group, the Group recognizes the employee benefits for that service as a liability, except for compensation for termination of employment relationship with the employees.
(2) Accounting treatment for post-employment benefits
The post-employment benefits of the Group are defined contribution plan. The contribution payable to a defined contribution plan is recognized as a liability with a corresponding charge to the profit or loss for the current period or the cost of a relevant asset.
(3) Accounting treatment for termination benefits
When the Group terminates the employment relationship with employees before the expiry of the employment contracts or provides compensation as an offer to encourage employees to accept voluntary redundancy, if the Group has a formal plan for termination of employment relationship or has made an offer for voluntary redundancy which will be implemented immediately, and the Group cannot unilaterally withdraw from the termination plan or the redundancy offer, a provision for the compensation payable arising from the termination of employment relationship with employees is recognized with a corresponding charge to the profit or loss for the period.
An internal retirement plan is accounted for using the same principles as described above. Salaries and social insurance contributions to be paid to the internally retired employees by the Group during the period from the date when the employee ceases to provide services to the normal retirement date are recognized in profit or loss for the period when the recognition criteria for provisions are met with termination benefits.
(III) THE COMPANY'S SIGNIFICANT ACCOUNTING POLICIES, ACCOUNTING ESTIMATES AND PRIOR PERIOD ADJUSTMENTS – continued
676
(4) Accounting treatment other long-term employee benefit
When other long-term employee benefits satisfied the conditions for classifying as a defined contribution plan, whose benefits shall be accounted for in accordance with the requirements related to defined contribution plan
24、 Provisions
Provisions are recognized when the Group has a present obligation related to a contingency. It is probable that an outflow of economic benefits will be required to settle the obligation, and the amount of the obligation can be measured reliably.
The amount recognized as a provision is the best estimate of the consideration required to settle the present obligation at the balance sheet date, taking into account factors pertaining to a contingency such as the risks, uncertainties and time value of money. Where the effect of the time value of money is material, the amount of the provision is determined by discounting the related future cash outflows.
25、 Share-based payments and equity instruments
A share-based payment is a transaction which the Group grants equity instruments, or incurs liabilities for amounts that are determined based on the price of equity instruments, in return for services rendered by employees. The Group's share-based payments are equity-settled share-based payments.
25.1 Equity-settled share-based payments
Equity-settled share-based payments in exchange for services rendered by employees are measured at the fair value of the equity instruments granted to employees at the grant date. Such amount is recognized as related costs or expenses on a straight-line basis over the vesting period, based on the best estimate of the number of equity instruments expected to vest at the grant date, if the equity instruments vest immediately, with a corresponding increase in capital reserve. At each balance sheet date during the vesting period, the Group makes the best estimate according to the subsequent latest information of change in the number of employees who are granted with options that may vest, etc and revises the number of equity instruments expected to vest. The effect of the above estimate is recognized as related costs or expenses, with a corresponding adjustment to capital reserve.
25.2 Accounting treatment related to implementation, modification and termination of share-based payment arrangement
In case the Group modifies a share-based payment arrangement, if the modification increases the fair value of the equity instruments granted, the Group will include the incremental fair value of the equity instruments granted in the measurement of the amount recognised for services received. If the modification increases the number of the equity instruments granted, the Group will include the fair value of additional equity instruments granted in the measurement of the amount recognised for services received.
The increase in the fair value of the equity instruments granted is the difference between fair value of the equity instruments before and after the modification on the date of the modification. If the Group modifies the terms or conditions of the share-based payment arrangement in a manner that reduces the total fair value of the share-based payment arrangement, or is not otherwise beneficial to the employee, the Group will continue to account for the services received as if that modification had not occurred (other than a cancellation of some or all the equity instruments granted).
If cancellation of the equity instruments granted occurs during the vesting period, the Group will account for the cancellation of the equity instruments granted as an acceleration of vesting, and recognise immediately the amount that otherwise would have been recognised over the remainder of the vesting period in profit or loss for the period, with a corresponding recognition in capital reserve.When the employee or counterparty can choose whether to meet the non-vesting condition but the condition is not met during the vesting period, the Group treats it as a cancellation of the equity instruments granted.
25.3 Others
The consideration received from employees will be returned due to the cancellation of the equity instruments when the terms or conditions of the share-based payment arrangement are not met. The group increases its paid-in capital and capital reserve when receives such consideration and recognizes liability and treasury shares for the repurchase obligation.
26、 Revenu
26.1 Revenue from sales of goods
Revenue from sale of goods is recognized when the Group has transferred to the buyer the significant risks and rewards of ownership of the goods; the Group retains neither continuing managerial involvement to the degree usually associated with ownership nor effective control over the goods sold; the amount of revenue can be measured reliably; it is probable that the associated economic benefits will flow to the Group; and the associated costs incurred or to be incurred can be measured reliably.
26.2 Revenue arising from the rendering of services
Revenue from rendering of services is recognized when (1) the amount of revenue can be measured reliably; (2) it is probable that the associated economic benefits will flow to the enterprise; (3) the stage of completion of the transaction can be determined reliably; and (4) the associated costs incurred or to be incurred can be measured reliably. Revenue from rendering of services is recognized using the percentage of completion method at the balance sheet date. The stage of completion of a transaction for rendering for services is determined based on the proportion that costs incurred to date bear to the estimated total costs of the transaction.
When the outcome of the transaction involving the rendering of services cannot be estimated reliably, revenue is recognized only to the extent of the costs incurred that will be recoverable, and the costs incurred are recognized as expenses for the period. When it is not probable that the costs incurred will be recovered, revenue is not recognized.
When a contract or agreement signed between the Group and another enterprise contains both sales of goods and rendering of services, the sales of goods and the rendering of services are distinguished from each other and measured separately. If the sales of goods and the rendering of services cannot be distinguished from each other, or when the two can be distinguished from each other but cannot be measured respectively, they are treated as the sales of goods.
Notes To The Financial Statements– continuedFOR THE YEAR ENDED 31 DECEMBER 2014
(III) THE COMPANY'S SIGNIFICANT ACCOUNTING POLICIES, ACCOUNTING ESTIMATES AND PRIOR PERIOD ADJUSTMENTS – continued
77
Notes To The Financial Statements– continuedFOR THE YEAR ENDED 31 DECEMBER 2014
26.3 Royalty Revenue
The amount of royalty revenue is measured and confirmed in accordance with the period and method of charging as stipulated in the relevant contract or agreement.
26.4 Interest Revenue
The amount of interest revenue is measured and confirmed in accordance with the length of time for which the Group's monetary funds is used by others and the effective interest rates.
27、 Government grants
Government grants are transfer of monetary assets and non-monetary assets from the government to the Group at no consideration. A government grant is recognized only when the Group can comply with the conditions attaching to the grant and the Group will receive the grant.
If a government grant is in the form of a transfer of a monetary asset, it is measured at the amount received or receivable.
(1) Basis for determining government grants related to an asset and accounting treatment
A government grant related to an asset is recognized as deferred income, and evenly amortized to profit or loss over the useful life of the related asset.
(2) Basis for determining government grants related to an income and accounting treatment
For a government grant related to income, if the grant is a compensation for related expenses or losses to be incurred in subsequent periods, the grant is recognized as deferred income, and recognized in profit or loss over the periods in which the related costs are recognized. If the grant is a compensation for related expenses or losses already incurred, the grant is recognized immediately in profit or loss for the period.
For repayment of a government grant already recognized, if there is related deferred income, the repayment is offset against the carrying amount of the deferred income, and any excess is recognized in profit or loss for the period. If there is no related deferred income, the repayment is recognized immediately in profit or loss for the period.
Relocation compensation received for relocation in public interests
If the Group relocates for the benefits of the public interests such as overall planning of urban and rural areas and receives relocation compensation appropriated by the government directly from its fiscal budget, it recognizes such income as special payable. The income attributable to compensation for losses of fixed assets and intangible assets, related expenses, losses from suspension of production incurred during the relocation and reconstruction period, and purchases of assets after the relocation is transferred from special payable to deferred income and is accounted for as either a government grant related to an asset or a government grant related to income based on its nature. Any surplus of relocation compensation after deducting the amount transferred to deferred income is recognized as capital reserve.
28、 Deferred tax assets / deferred tax liabilitie
The income tax expenses include current income tax and deferred income tax
28.1 Current income tax
At the balance sheet date, current income tax liabilities (or assets) for the current and prior periods are measured at the amount expected to be paid (or recovered) according to the requirements of tax laws.
28.2 Deferred tax assets and deferred tax liabilities
For temporary differences between the carrying amounts of certain assets or liabilities and their tax base, or between the nil carrying amount of those items that are not recognized as assets or liabilities and their tax base that can be determined according to tax laws, deferred tax assets and liabilities are recognized using the balance sheet liability method.
Deferred tax is generally recognized for all temporary differences. Deferred tax assets for deductible temporary differences are recognized to the extent that it is probable that taxable profits will be available against which the deductible temporary differences can be utilized. However, for temporary differences associated with the initial recognition of goodwill and the initial recognition of an asset or liability arising from a transaction (not a business combination) that affects neither the accounting profit nor taxable profits (or deductible losses) at the time of transaction, no deferred tax asset or liability is recognized.
For deductible losses and tax credits that can be carried forward, deferred tax assets are recognized to the extent that it is probable that future taxable profits will be available against which the deductible losses and tax credits can be utilized.
Deferred tax liabilities are recognized for taxable temporary differences associated with investments in subsidiaries and associates, and interests in joint ventures, except where the Group is able to control the timing of the reversal of the temporary difference and it is probable that the temporary difference will not reverse in the foreseeable future. Deferred tax assets arising from deductible temporary differences associated with such investments and interests are only recognized to the extent that it is probable that there will be taxable profits against which to utilize the benefits of the temporary differences and they are expected to reverse in the foreseeable future. At the balance sheet date, deferred tax assets and liabilities are measured at the tax rates, according to tax laws, that are expected to apply in the period in which the asset is realized or the liability is settled.
Current and deferred tax expenses or income are recognized in profit or loss for the period, except when they arise from transactions or events that are directly recognized in other comprehensive income or in shareholders' equity, in which case they are recognized in other comprehensive income or in shareholders' equity; and when they arise from business combinations, in which case they adjust the carrying amount of goodwill.
At the balance sheet date, the carrying amount of deferred tax assets is reviewed and reduced if it is no longer probable that sufficient taxable profits will be available in the future to allow the benefit of deferred tax assets to be utilized. Such reduction in amount is reversed when it becomes probable that sufficient taxable profits will be available.
(III) THE COMPANY'S SIGNIFICANT ACCOUNTING POLICIES, ACCOUNTING ESTIMATES AND PRIOR PERIOD ADJUSTMENTS – continued
678
28.3 Offset of Income Tax
When the Group has a legal right to settle on a net basis and intends either to settle on a net basis or to realize the assets and settle the liabilities simultaneously, current tax assets and current tax liabilities are offset and presented on a net basis.
When the Group has a legal right to settle current tax assets and liabilities on a net basis, and deferred tax assets and deferred tax liabilities relate to income taxes levied by the same taxation authority on either the same taxable entity or different taxable entities which intend either to settle current tax assets and liabilities on a net basis or to realize the assets and liabilities simultaneously, in each future period in which significant amounts of deferred tax assets or liabilities are expected to be reversed, deferred tax assets and deferred tax liabilities are offset and presented on a net basis.
29、 Operating leases
29.1 Accounting treatment for operating leases
Leases are classified as finance leases whenever the terms of the lease transfer substantially all the risks and rewards of ownership to the lessee. All other leases are classified as operating leases.
29.1.1 The Group as lessee under operating leases
Operating lease payments are recognized on a straight-line basis over the term of the relevant lease, and are either included in the cost of related asset or charged to profit or loss for the period. Initial direct costs incurred are charged to profit or loss for the period. Contingent rents are charged to profit or loss in the period in which they are actually incurred.
29.1.2 The Group as lessor under operating leases
Rental income from operating leases is recognized in profit or loss on a straight-line basis over the term of the relevant lease. Initial direct costs with more than an insignificant amount are capitalized when incurred, and are recognized in profit or loss on the same basis as rental income over the lease term. Other initial direct costs with an insignificant amount are charged to profit or loss in the period in which they are incurred. Contingent rents are charged to profit or loss in the period in which they actually arise.
29.2 Accounting treatment of financing leases
29.2.1 The Group as lessor under finance leases
At the commencement of the lease term, the aggregate of the minimum lease receivable at the inception of the lease and the initial direct costs is recognized as a finance lease receivable, and the unguaranteed residual value is recorded at the same time. The difference between the aggregate of the minimum lease receivable, the initial direct costs and the unguaranteed residual value, and the aggregate of their present values is recognized as unearned finance income. Unearned finance income is recognized as finance income for the period using the effective interest method over the lease term. Contingent rents are credited to profit or loss in the period in which they are actually incurred.
The net amount of financial lease receivables less unearned finance income is separated into long-term debts receivable and the portion of long-term debts receivable due within one year for presentation.
30、 Changes in accounting policies
The Group has applied a number of new and revised CASs issued by the Ministry of Finance of People’s Republic of China (“MOF”) since 1 July 2014, which comprise:
- Amendment to ASBE 2 – Long term equity investments.
- Amendment to ASBE 9 – Employee benefits.
- Amendment to ASBE 30 – Presentation of financial statements.
- Amendment to ASBE 33 – Consolidated financial statements.
- ASBE 39 – Fair value measurement.
- ASBE 40 – Joint arrangements.
- ASBE 41 – Disclosure of interests in other entities
Meanwhile, the Group also applies the Amendment to ASBE 37– Presentation of financial instruments issued by MOF in the financial statements. Above-mentioned application of new and revised CASs has been approved by the 18th Meeting of the 5th board of the Group.
Long term equity investments
Amendment to ASBE 2 – Long term equity investments stipulates that for long-term equity investments over which the Group does not have joint control or significant influence and without quoted prices in an active market and that fair values cannot be reliably measured the Group accounts for such long-term equity investments as available-for-sale financial assets. The Group has accounted for the above change in accounting policy retrospectively.
Employee benefits
Amendment to ASBE 9 – Employee benefits adds definitions and categories of short-term employee benefits, paid absences, accumulated paid absences, profit-sharing plan, post-employment benefits, termination benefits and other long term employee benefits, and specifies the accounting for defined contribution plan and defined benefit plan in termination benefits. The Group has accounted for the above change in accounting policy retrospectively.
Notes To The Financial Statements– continuedFOR THE YEAR ENDED 31 DECEMBER 2014
(III) THE COMPANY'S SIGNIFICANT ACCOUNTING POLICIES, ACCOUNTING ESTIMATES AND PRIOR PERIOD ADJUSTMENTS – continued
79
Notes To The Financial Statements– continuedFOR THE YEAR ENDED 31 DECEMBER 2014
Joint venture arrangement
ASBE 40 – Joint arrangements classifies joint arrangement as either a joint operation or a joint venture based on the rights and obligations of the relevant parties in the arrangement. When assessing whether an enterprise has joint control of an arrangement, the enterprise shall consider the structure of the arrangement, the legal form of the joint arrangement, the terms of the arrangement contract and other relevant factors. A joint operation is a joint arrangement whereby the joint operators have rights to the assets, and obligation for the liabilities, relating to the arrangement. A joint venture is a joint arrangement whereby the joint ventures have rights only to the net assets of the arrangement. The above change of accounting policies does not have any significant impact on the financial statements of the Group.
Consolidated financial statements
Amendment to ASBE 33 – Consolidated financial statements revises the definition of "control" where control exists when the investor has all the following: power over the investee; exposure or rights to variable returns from its involvement with the investee; and the ability to use its power over the investee to affect the amount of the investee's returns. It also clearly stipulates the accounting treatment for special transactions. The above change of accounting policies does not have any significant impact on the financial statements of the Group.
Presentation of financial instruments
Amendment to ASBE 37 - Presentation of financial instruments adds the related requirements in relation to the requirement of offsetting of financial asset and financial liability and disclosure. It also specifies how to disclose the transfer of financial asset as well as the disclosure of maturity analysis of financial assets and financial liabilities. This financial statement has been disclosed according to ASBE 37 and corresponding adjustment to the notes to financial statement in comparative periods has been made.
Presentation of financial statements
Amendment to ASBE 30 - Presentation of Financial statements specifies that items of other comprehensive income shall be presented into two categories: 1) other comprehensive income which will not be reclassified subsequently to profit or loss; 2) other comprehensive income which will be reclassified subsequently to profit or loss when specific conditions are met. In addition, it also stipulates the disclosure of held for sale assets and other financial items. This financial statement has been disclosed according to ASBE 37 and corresponding adjustment to the notes to financial statement in comparative periods has been made.
Fair value measurement
ASBE 39 - Fair value measurement stipulates the measurement and disclosure requirements of fair value. The above change in accounting policies does not have any significant impact on the financial statements of the Group but will lead to more detailed disclosure in the financial statement. This financial statement has been disclosed according to ASBE 39.
Disclosure of interests in other entities
ASBE 40 – Disclosure of interests in other entities is applicable to disclosure of an enterprise's interest in subsidiaries, joint arrangement, associates and unconsolidated structured entities. The above change in accounting policies will lead to more detailed disclosure in the financial statement of the Group and this financial statement has been disclosed according to ASBE 40.
The Group has accounted for the above changes in accounting policies retrospectively and restated financial statements in comparative periods. The impact of above changes in accounting policies on assets, liabilities and shareholders' equities as of 31 December, 2013 are presented as follows:
31 December, 2013(Before restated)
Long-term equity investments
Employee benefits31 December, 2013
(After restated)
Available-for-sale financial assets 1,009,142,907.29 8,928,712,794.90 - 9,937,855,702.19
Long-term equity investment 13,681,009,703.67 -8,928,712,794.90 - 4,752,296,908.77
Deferred tax asset 2,052,778,079.55 - 35,998,903.25 2,088,776,982.80
Employee benefits payable 1,696,560,100.99 - 11,480,015.09 1,708,040,116.08
Long-term employee benefits payable - - 133,042,565.79 133,042,565.79
Total shareholder’s equity 120,065,930,841.81 - -108,523,677.63 119,957,407,164.18
Total shareholder’s equity attributable to owners of the company
110,512,197,768.90 - -99,156,783.78 110,413,040,985.12
Minority interest 9,553,733,072.91 - -9,366,893.85 9,544,366,179.06
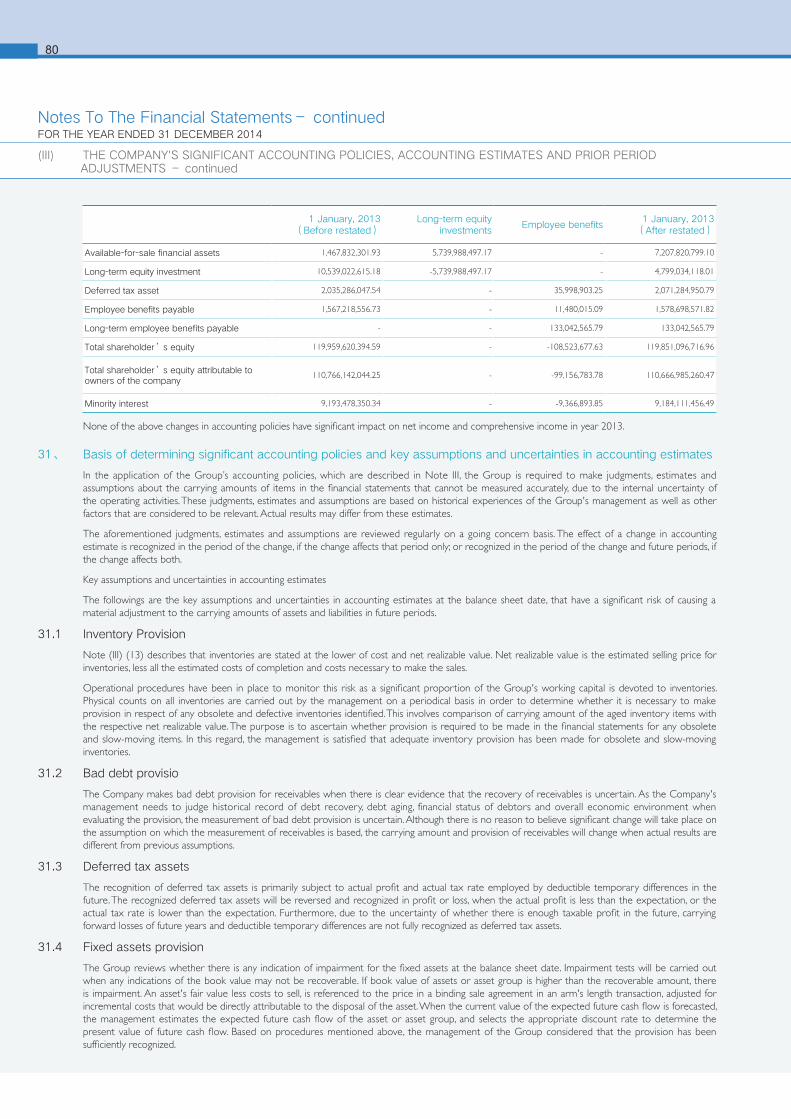
(III) THE COMPANY'S SIGNIFICANT ACCOUNTING POLICIES, ACCOUNTING ESTIMATES AND PRIOR PERIOD ADJUSTMENTS – continued
680
Notes To The Financial Statements– continuedFOR THE YEAR ENDED 31 DECEMBER 2014
1 January, 2013(Before restated)
Long-term equity investments
Employee benefits1 January, 2013
(After restated)
Available-for-sale financial assets 1,467,832,301.93 5,739,988,497.17 - 7,207,820,799.10
Long-term equity investment 10,539,022,615.18 -5,739,988,497.17 - 4,799,034,118.01
Deferred tax asset 2,035,286,047.54 - 35,998,903.25 2,071,284,950.79
Employee benefits payable 1,567,218,556.73 - 11,480,015.09 1,578,698,571.82
Long-term employee benefits payable - - 133,042,565.79 133,042,565.79
Total shareholder’s equity 119,959,620,394.59 - -108,523,677.63 119,851,096,716.96
Total shareholder’s equity attributable to owners of the company
110,766,142,044.25 - -99,156,783.78 110,666,985,260.47
Minority interest 9,193,478,350.34 - -9,366,893.85 9,184,111,456.49
None of the above changes in accounting policies have significant impact on net income and comprehensive income in year 2013.
31、 Basis of determining significant accounting policies and key assumptions and uncertainties in accounting estimates
In the application of the Group’s accounting policies, which are described in Note III, the Group is required to make judgments, estimates and assumptions about the carrying amounts of items in the financial statements that cannot be measured accurately, due to the internal uncertainty of the operating activities. These judgments, estimates and assumptions are based on historical experiences of the Group's management as well as other factors that are considered to be relevant. Actual results may differ from these estimates.
The aforementioned judgments, estimates and assumptions are reviewed regularly on a going concern basis. The effect of a change in accounting estimate is recognized in the period of the change, if the change affects that period only; or recognized in the period of the change and future periods, if the change affects both.
Key assumptions and uncertainties in accounting estimates
The followings are the key assumptions and uncertainties in accounting estimates at the balance sheet date, that have a significant risk of causing a material adjustment to the carrying amounts of assets and liabilities in future periods.
31.1 Inventory Provision
Note (III) (13) describes that inventories are stated at the lower of cost and net realizable value. Net realizable value is the estimated selling price for inventories, less all the estimated costs of completion and costs necessary to make the sales.
Operational procedures have been in place to monitor this risk as a significant proportion of the Group's working capital is devoted to inventories. Physical counts on all inventories are carried out by the management on a periodical basis in order to determine whether it is necessary to make provision in respect of any obsolete and defective inventories identified. This involves comparison of carrying amount of the aged inventory items with the respective net realizable value. The purpose is to ascertain whether provision is required to be made in the financial statements for any obsolete and slow-moving items. In this regard, the management is satisfied that adequate inventory provision has been made for obsolete and slow-moving inventories.
31.2 Bad debt provisio
The Company makes bad debt provision for receivables when there is clear evidence that the recovery of receivables is uncertain. As the Company's management needs to judge historical record of debt recovery, debt aging, financial status of debtors and overall economic environment when evaluating the provision, the measurement of bad debt provision is uncertain. Although there is no reason to believe significant change will take place on the assumption on which the measurement of receivables is based, the carrying amount and provision of receivables will change when actual results are different from previous assumptions.
31.3 Deferred tax assets
The recognition of deferred tax assets is primarily subject to actual profit and actual tax rate employed by deductible temporary differences in the future. The recognized deferred tax assets will be reversed and recognized in profit or loss, when the actual profit is less than the expectation, or the actual tax rate is lower than the expectation. Furthermore, due to the uncertainty of whether there is enough taxable profit in the future, carrying forward losses of future years and deductible temporary differences are not fully recognized as deferred tax assets.
31.4 Fixed assets provision
The Group reviews whether there is any indication of impairment for the fixed assets at the balance sheet date. Impairment tests will be carried out when any indications of the book value may not be recoverable. If book value of assets or asset group is higher than the recoverable amount, there is impairment. An asset's fair value less costs to sell, is referenced to the price in a binding sale agreement in an arm's length transaction, adjusted for incremental costs that would be directly attributable to the disposal of the asset. When the current value of the expected future cash flow is forecasted, the management estimates the expected future cash flow of the asset or asset group, and selects the appropriate discount rate to determine the present value of future cash flow. Based on procedures mentioned above, the management of the Group considered that the provision has been sufficiently recognized.
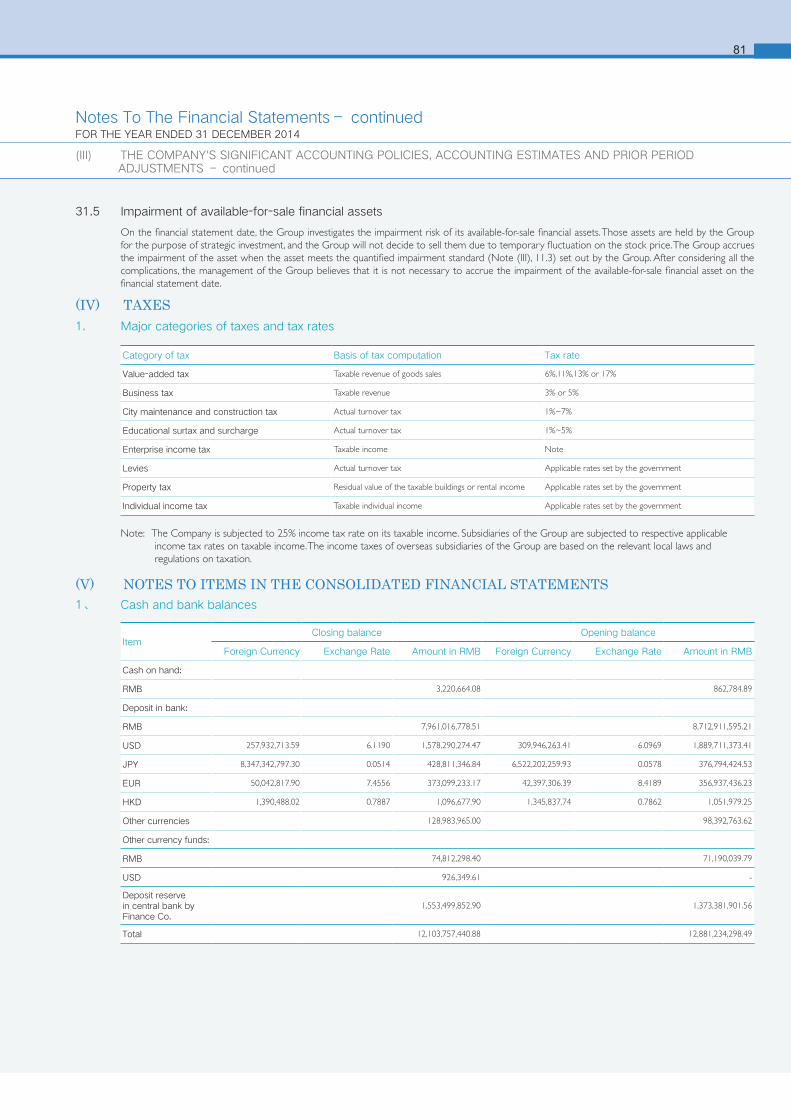
(III) THE COMPANY'S SIGNIFICANT ACCOUNTING POLICIES, ACCOUNTING ESTIMATES AND PRIOR PERIOD ADJUSTMENTS – continued
81
Notes To The Financial Statements– continuedFOR THE YEAR ENDED 31 DECEMBER 2014
31.5 Impairment of available-for-sale financial assets
On the financial statement date, the Group investigates the impairment risk of its available-for-sale financial assets. Those assets are held by the Group for the purpose of strategic investment, and the Group will not decide to sell them due to temporary fluctuation on the stock price. The Group accrues the impairment of the asset when the asset meets the quantified impairment standard (Note (III), 11.3) set out by the Group. After considering all the complications, the management of the Group believes that it is not necessary to accrue the impairment of the available-for-sale financial asset on the financial statement date.
(IV) TAXES
Category of tax Basis of tax computation Tax rate
Value-added tax Taxable revenue of goods sales 6%,11%,13% or 17%
Business tax Taxable revenue 3% or 5%
City maintenance and construction tax Actual turnover tax 1%~7%
Educational surtax and surcharge Actual turnover tax 1%~5%
Enterprise income tax Taxable income Note
Levies Actual turnover tax Applicable rates set by the government
Property tax Residual value of the taxable buildings or rental income Applicable rates set by the government
Individual income tax Taxable individual income Applicable rates set by the government
1. Major categories of taxes and tax rates
Note: The Company is subjected to 25% income tax rate on its taxable income. Subsidiaries of the Group are subjected to respective applicable income tax rates on taxable income. The income taxes of overseas subsidiaries of the Group are based on the relevant local laws and regulations on taxation.
(V) NOTES TO ITEMS IN THE CONSOLIDATED FINANCIAL STATEMENTS1、 Cash and bank balances
ItemClosing balance Opening balance
Foreign Currency Exchange Rate Amount in RMB Foreign Currency Exchange Rate Amount in RMB
Cash on hand:
RMB 3,220,664.08 862,784.89
Deposit in bank:
RMB 7,961,016,778.51 8,712,911,595.21
USD 257,932,713.59 6.1190 1,578,290,274.47 309,946,263.41 6.0969 1,889,711,373.41
JPY 8,347,342,797.30 0.0514 428,811,346.84 6,522,202,259.93 0.0578 376,794,424.53
EUR 50,042,817.90 7.4556 373,099,233.17 42,397,306.39 8.4189 356,937,436.23
HKD 1,390,488.02 0.7887 1,096,677.90 1,345,837.74 0.7862 1,051,979.25
Other currencies 128,983,965.00 98,392,763.62
Other currency funds:
RMB 74,812,298.40 71,190,039.79
USD 926,349.61 -
Deposit reserve in central bank by Finance Co.
1,553,499,852.90 1,373,381,901.56
Total 12,103,757,440.88 12,881,234,298.49
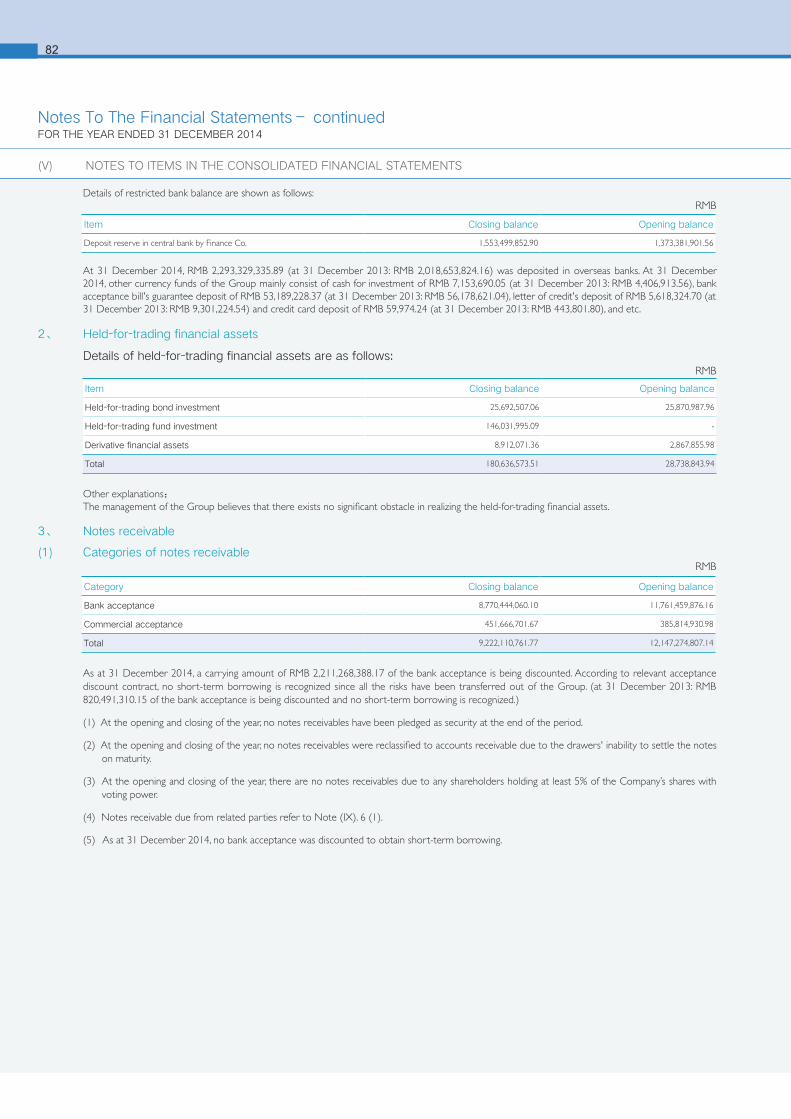
682
Item Closing balance Opening balance
Held-for-trading bond investment 25,692,507.06 25,870,987.96
Held-for-trading fund investment 146,031,995.09 -
Derivative financial assets 8,912,071.36 2,867,855.98
Total 180,636,573.51 28,738,843.94
Category Closing balance Opening balance
Bank acceptance 8,770,444,060.10 11,761,459,876.16
Commercial acceptance 451,666,701.67 385,814,930.98
Total 9,222,110,761.77 12,147,274,807.14
Other explanations:The management of the Group believes that there exists no significant obstacle in realizing the held-for-trading financial assets.
As at 31 December 2014, a carrying amount of RMB 2,211,268,388.17 of the bank acceptance is being discounted. According to relevant acceptance discount contract, no short-term borrowing is recognized since all the risks have been transferred out of the Group. (at 31 December 2013: RMB 820,491,310.15 of the bank acceptance is being discounted and no short-term borrowing is recognized.)
(1) At the opening and closing of the year, no notes receivables have been pledged as security at the end of the period.
(2) At the opening and closing of the year, no notes receivables were reclassified to accounts receivable due to the drawers' inability to settle the notes on maturity.
(3) At the opening and closing of the year, there are no notes receivables due to any shareholders holding at least 5% of the Company’s shares with voting power.
(4) Notes receivable due from related parties refer to Note (IX). 6 (1).
(5) As at 31 December 2014, no bank acceptance was discounted to obtain short-term borrowing.
3、 Notes receivable
(1) Categories of notes receivable
(V) NOTES TO ITEMS IN THE CONSOLIDATED FINANCIAL STATEMENTS
2、 Held-for-trading financial assets
Details of held-for-trading financial assets are as follows: RMB
RMB
Notes To The Financial Statements– continuedFOR THE YEAR ENDED 31 DECEMBER 2014
Item Closing balance Opening balance
Deposit reserve in central bank by Finance Co. 1,553,499,852.90 1,373,381,901.56
RMBDetails of restricted bank balance are shown as follows:
At 31 December 2014, RMB 2,293,329,335.89 (at 31 December 2013: RMB 2,018,653,824.16) was deposited in overseas banks. At 31 December 2014, other currency funds of the Group mainly consist of cash for investment of RMB 7,153,690.05 (at 31 December 2013: RMB 4,406,913.56), bank acceptance bill's guarantee deposit of RMB 53,189,228.37 (at 31 December 2013: RMB 56,178,621.04), letter of credit's deposit of RMB 5,618,324.70 (at 31 December 2013: RMB 9,301,224.54) and credit card deposit of RMB 59,974.24 (at 31 December 2013: RMB 443,801.80), and etc.
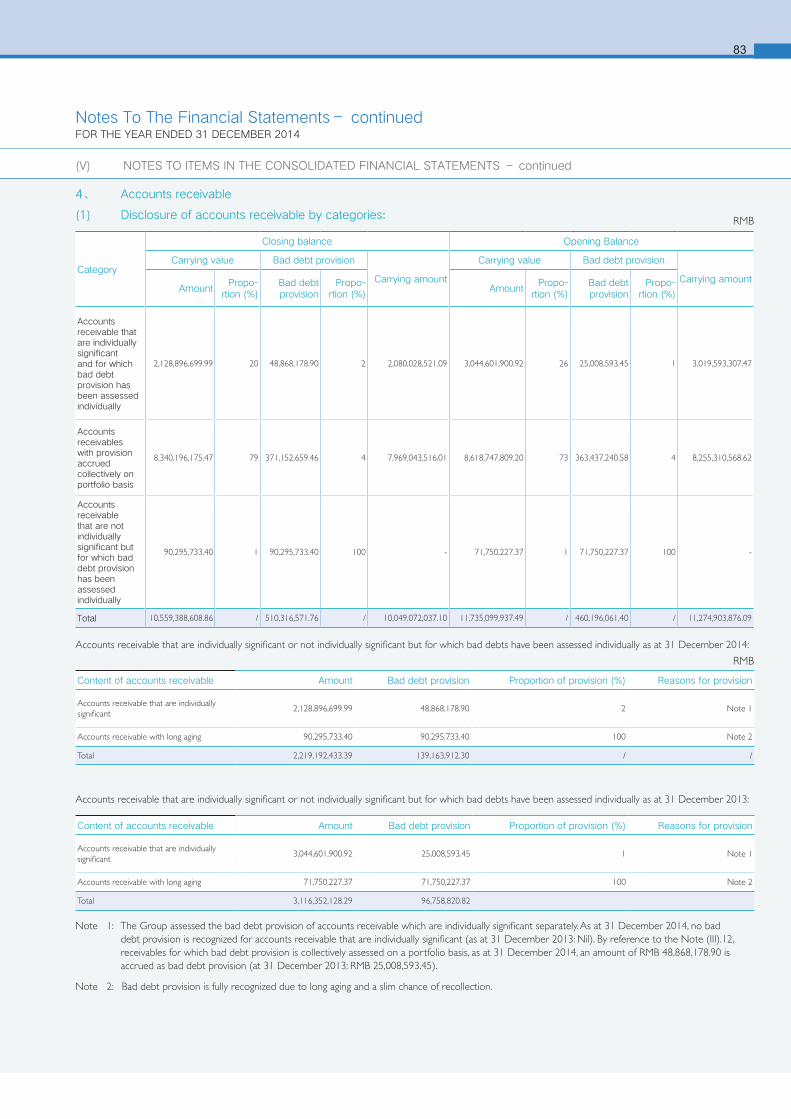
83
RMB
RMB
4、 Accounts receivable
(1) Disclosure of accounts receivable by categories:
Category
Closing balance Opening Balance
Carrying value Bad debt provision
Carrying amount
Carrying value Bad debt provision
Carrying amountAmount
Propo-rtion (%)
Bad debt provision
Propo-rtion (%)
AmountPropo-
rtion (%)Bad debt provision
Propo-rtion (%)
Accounts receivable that are individually significant and for which bad debt provision has been assessed individually
2,128,896,699.99 20 48,868,178.90 2 2,080,028,521.09 3,044,601,900.92 26 25,008,593.45 1 3,019,593,307.47
Accounts receivables with provision accrued collectively on portfolio basis
8,340,196,175.47 79 371,152,659.46 4 7,969,043,516.01 8,618,747,809.20 73 363,437,240.58 4 8,255,310,568.62
Accounts receivable that are not individually significant but for which bad debt provision has been assessed individually
90,295,733.40 1 90,295,733.40 100 - 71,750,227.37 1 71,750,227.37 100 -
Total 10,559,388,608.86 / 510,316,571.76 / 10,049,072,037.10 11,735,099,937.49 / 460,196,061.40 / 11,274,903,876.09
Accounts receivable that are individually significant or not individually significant but for which bad debts have been assessed individually as at 31 December 2014:
Accounts receivable that are individually significant or not individually significant but for which bad debts have been assessed individually as at 31 December 2013:
Content of accounts receivable Amount Bad debt provision Proportion of provision (%) Reasons for provision
Accounts receivable that are individually significant
2,128,896,699.99 48,868,178.90 2 Note 1
Accounts receivable with long aging 90,295,733.40 90,295,733.40 100 Note 2
Total 2,219,192,433.39 139,163,912.30 / /
Content of accounts receivable Amount Bad debt provision Proportion of provision (%) Reasons for provision
Accounts receivable that are individually significant
3,044,601,900.92 25,008,593.45 1 Note 1
Accounts receivable with long aging 71,750,227.37 71,750,227.37 100 Note 2
Total 3,116,352,128.29 96,758,820.82
Note 1: The Group assessed the bad debt provision of accounts receivable which are individually significant separately. As at 31 December 2014, no bad debt provision is recognized for accounts receivable that are individually significant (as at 31 December 2013: Nil). By reference to the Note (III).12, receivables for which bad debt provision is collectively assessed on a portfolio basis, as at 31 December 2014, an amount of RMB 48,868,178.90 is accrued as bad debt provision (at 31 December 2013: RMB 25,008,593.45).
Note 2: Bad debt provision is fully recognized due to long aging and a slim chance of recollection.
(V) NOTES TO ITEMS IN THE CONSOLIDATED FINANCIAL STATEMENTS – continued
Notes To The Financial Statements– continuedFOR THE YEAR ENDED 31 DECEMBER 2014
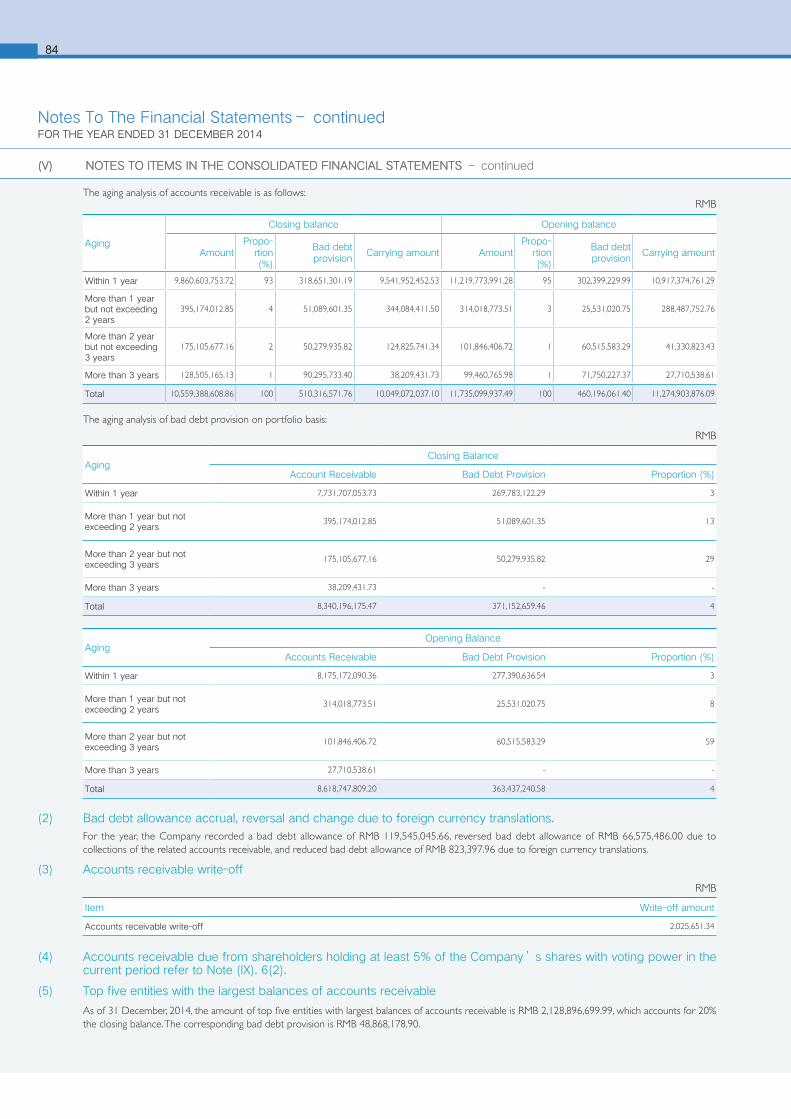
684
Aging
Closing balance Opening balance
AmountPropo-
rtion (%)
Bad debt provision
Carrying amount AmountPropo-
rtion (%)
Bad debt provision
Carrying amount
Within 1 year 9,860,603,753.72 93 318,651,301.19 9,541,952,452.53 11,219,773,991.28 95 302,399,229.99 10,917,374,761.29
More than 1 year but not exceeding 2 years
395,174,012.85 4 51,089,601.35 344,084,411.50 314,018,773.51 3 25,531,020.75 288,487,752.76
More than 2 year but not exceeding 3 years
175,105,677.16 2 50,279,935.82 124,825,741.34 101,846,406.72 1 60,515,583.29 41,330,823.43
More than 3 years 128,505,165.13 1 90,295,733.40 38,209,431.73 99,460,765.98 1 71,750,227.37 27,710,538.61
Total 10,559,388,608.86 100 510,316,571.76 10,049,072,037.10 11,735,099,937.49 100 460,196,061.40 11,274,903,876.09
The aging analysis of accounts receivable is as follows:
The aging analysis of bad debt provision on portfolio basis:
RMB
RMB
RMB
AgingClosing Balance
Account Receivable Bad Debt Provision Proportion (%)
Within 1 year 7,731,707,053.73 269,783,122.29 3
More than 1 year but not exceeding 2 years
395,174,012.85 51,089,601.35 13
More than 2 year but not exceeding 3 years
175,105,677.16 50,279,935.82 29
More than 3 years 38,209,431.73 - -
Total 8,340,196,175.47 371,152,659.46 4
AgingOpening Balance
Accounts Receivable Bad Debt Provision Proportion (%)
Within 1 year 8,175,172,090.36 277,390,636.54 3
More than 1 year but not exceeding 2 years
314,018,773.51 25,531,020.75 8
More than 2 year but not exceeding 3 years
101,846,406.72 60,515,583.29 59
More than 3 years 27,710,538.61 - -
Total 8,618,747,809.20 363,437,240.58 4
Item Write-off amount
Accounts receivable write-off 2,025,651.34
(2) Bad debt allowance accrual, reversal and change due to foreign currency translations.
For the year, the Company recorded a bad debt allowance of RMB 119,545,045.66, reversed bad debt allowance of RMB 66,575,486.00 due to collections of the related accounts receivable, and reduced bad debt allowance of RMB 823,397.96 due to foreign currency translations.
(3) Accounts receivable write-off
(4) Accounts receivable due from shareholders holding at least 5% of the Company’s shares with voting power in the current period refer to Note (IX). 6(2).
(5) Top five entities with the largest balances of accounts receivable
As of 31 December, 2014, the amount of top five entities with largest balances of accounts receivable is RMB 2,128,896,699.99, which accounts for 20% the closing balance. The corresponding bad debt provision is RMB 48,868,178.90.
(V) NOTES TO ITEMS IN THE CONSOLIDATED FINANCIAL STATEMENTS(V) NOTES TO ITEMS IN THE CONSOLIDATED FINANCIAL STATEMENTS – continued
Notes To The Financial Statements– continuedFOR THE YEAR ENDED 31 DECEMBER 2014
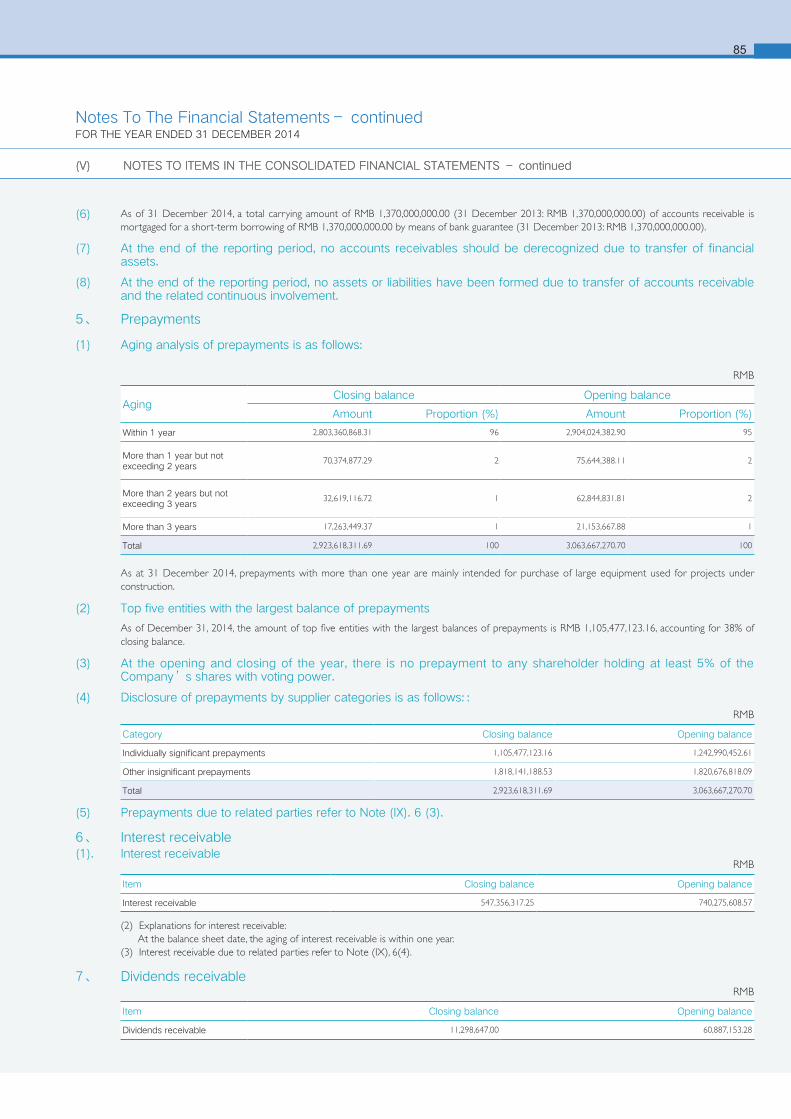
85
RMB
RMB
Category Closing balance Opening balance
Individually significant prepayments 1,105,477,123.16 1,242,990,452.61
Other insignificant prepayments 1,818,141,188.53 1,820,676,818.09
Total 2,923,618,311.69 3,063,667,270.70
AgingClosing balance Opening balance
Amount Proportion (%) Amount Proportion (%)
Within 1 year 2,803,360,868.31 96 2,904,024,382.90 95
More than 1 year but not exceeding 2 years
70,374,877.29 2 75,644,388.11 2
More than 2 years but not exceeding 3 years
32,619,116.72 1 62,844,831.81 2
More than 3 years 17,263,449.37 1 21,153,667.88 1
Total 2,923,618,311.69 100 3,063,667,270.70 100
As at 31 December 2014, prepayments with more than one year are mainly intended for purchase of large equipment used for projects under construction.
(2) Top five entities with the largest balance of prepayments
As of December 31, 2014, the amount of top five entities with the largest balances of prepayments is RMB 1,105,477,123.16, accounting for 38% of closing balance.
(3) At the opening and closing of the year, there is no prepayment to any shareholder holding at least 5% of the Company’s shares with voting power.
(4) Disclosure of prepayments by supplier categories is as follows::
(5) Prepayments due to related parties refer to Note (IX). 6 (3).
(V) NOTES TO ITEMS IN THE CONSOLIDATED FINANCIAL STATEMENTS – continued(V) NOTES TO ITEMS IN THE CONSOLIDATED FINANCIAL STATEMENTS – continued
(6) As of 31 December 2014, a total carrying amount of RMB 1,370,000,000.00 (31 December 2013: RMB 1,370,000,000.00) of accounts receivable is mortgaged for a short-term borrowing of RMB 1,370,000,000.00 by means of bank guarantee (31 December 2013: RMB 1,370,000,000.00).
(7) At the end of the reporting period, no accounts receivables should be derecognized due to transfer of financial assets.
(8) At the end of the reporting period, no assets or liabilities have been formed due to transfer of accounts receivable and the related continuous involvement.
5、 Prepayments
(1) Aging analysis of prepayments is as follows:
6、 Interest receivable(1). Interest receivable
(2) Explanations for interest receivable: At the balance sheet date, the aging of interest receivable is within one year. (3) Interest receivable due to related parties refer to Note (IX), 6(4).
Item Closing balance Opening balance
Interest receivable 547,356,317.25 740,275,608.57
RMB
7、 Dividends receivable
Item Closing balance Opening balance
Dividends receivable 11,298,647.00 60,887,153.28
RMB
Notes To The Financial Statements– continuedFOR THE YEAR ENDED 31 DECEMBER 2014
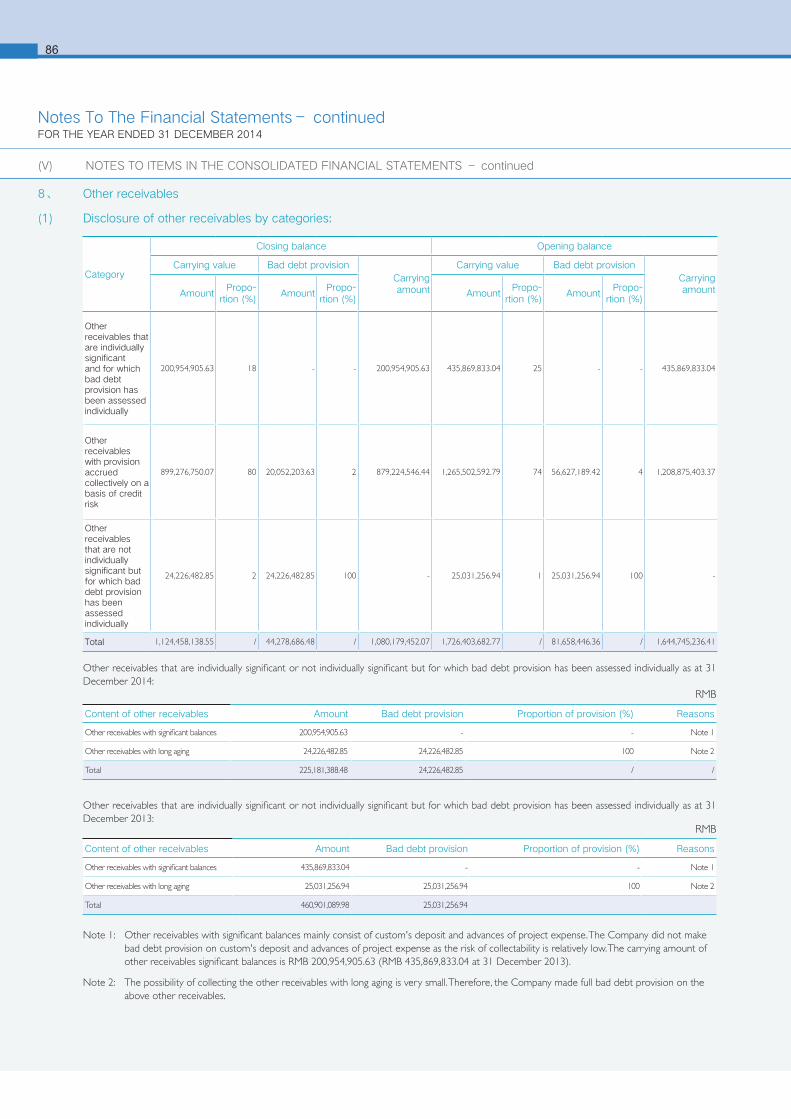
686
Other receivables that are individually significant or not individually significant but for which bad debt provision has been assessed individually as at 31 December 2014:
Other receivables that are individually significant or not individually significant but for which bad debt provision has been assessed individually as at 31 December 2013:
Note 1: Other receivables with significant balances mainly consist of custom's deposit and advances of project expense. The Company did not make bad debt provision on custom's deposit and advances of project expense as the risk of collectability is relatively low. The carrying amount of other receivables significant balances is RMB 200,954,905.63 (RMB 435,869,833.04 at 31 December 2013).
Note 2: The possibility of collecting the other receivables with long aging is very small. Therefore, the Company made full bad debt provision on the above other receivables.
8、 Other receivables
(1) Disclosure of other receivables by categories:
Category
Closing balance Opening balance
Carrying value Bad debt provisionCarrying amount
Carrying value Bad debt provisionCarrying amountAmount
Propo-rtion (%)
AmountPropo-
rtion (%)Amount
Propo-rtion (%)
AmountPropo-
rtion (%)
Other receivables that are individually significant and for which bad debt provision has been assessed individually
200,954,905.63 18 - - 200,954,905.63 435,869,833.04 25 - - 435,869,833.04
Other receivables with provision accrued collectively on a basis of credit risk
899,276,750.07 80 20,052,203.63 2 879,224,546.44 1,265,502,592.79 74 56,627,189.42 4 1,208,875,403.37
Other receivables that are not individually significant but for which bad debt provision has been assessed individually
24,226,482.85 2 24,226,482.85 100 - 25,031,256.94 1 25,031,256.94 100 -
Total 1,124,458,138.55 / 44,278,686.48 / 1,080,179,452.07 1,726,403,682.77 / 81,658,446.36 / 1,644,745,236.41
RMB
RMB
Content of other receivables Amount Bad debt provision Proportion of provision (%) Reasons
Other receivables with significant balances 200,954,905.63 - - Note 1
Other receivables with long aging 24,226,482.85 24,226,482.85 100 Note 2
Total 225,181,388.48 24,226,482.85 / /
Content of other receivables Amount Bad debt provision Proportion of provision (%) Reasons
Other receivables with significant balances 435,869,833.04 - - Note 1
Other receivables with long aging 25,031,256.94 25,031,256.94 100 Note 2
Total 460,901,089.98 25,031,256.94
(V) NOTES TO ITEMS IN THE CONSOLIDATED FINANCIAL STATEMENTS – continued
Notes To The Financial Statements– continuedFOR THE YEAR ENDED 31 DECEMBER 2014
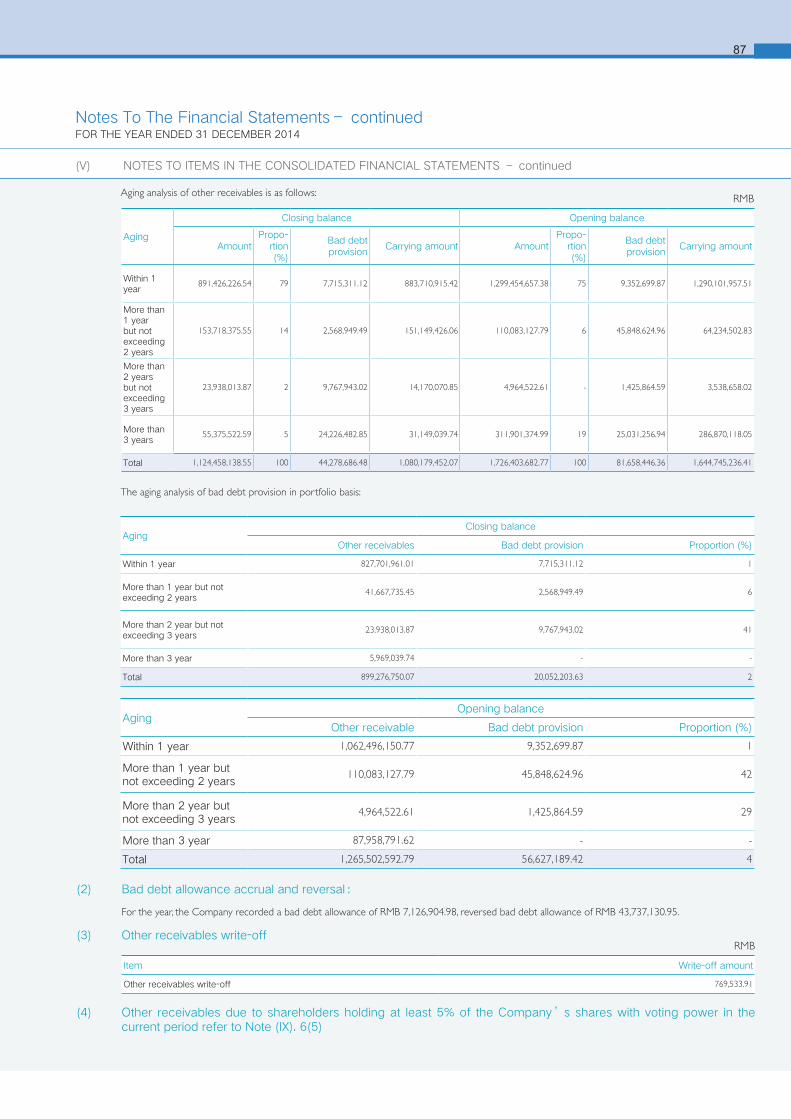
87
Aging analysis of other receivables is as follows:
The aging analysis of bad debt provision in portfolio basis:
Aging
Closing balance Opening balance
AmountPropo-
rtion (%)
Bad debt provision
Carrying amount AmountPropo-
rtion (%)
Bad debt provision
Carrying amount
Within 1 year
891,426,226.54 79 7,715,311.12 883,710,915.42 1,299,454,657.38 75 9,352,699.87 1,290,101,957.51
More than 1 year but not exceeding 2 years
153,718,375.55 14 2,568,949.49 151,149,426.06 110,083,127.79 6 45,848,624.96 64,234,502.83
More than 2 years but not exceeding 3 years
23,938,013.87 2 9,767,943.02 14,170,070.85 4,964,522.61 - 1,425,864.59 3,538,658.02
More than 3 years
55,375,522.59 5 24,226,482.85 31,149,039.74 311,901,374.99 19 25,031,256.94 286,870,118.05
Total 1,124,458,138.55 100 44,278,686.48 1,080,179,452.07 1,726,403,682.77 100 81,658,446.36 1,644,745,236.41
RMB
AgingClosing balance
Other receivables Bad debt provision Proportion (%)
Within 1 year 827,701,961.01 7,715,311.12 1
More than 1 year but not exceeding 2 years
41,667,735.45 2,568,949.49 6
More than 2 year but not exceeding 3 years
23,938,013.87 9,767,943.02 41
More than 3 year 5,969,039.74 - -
Total 899,276,750.07 20,052,203.63 2
AgingOpening balance
Other receivable Bad debt provision Proportion (%)
Within 1 year 1,062,496,150.77 9,352,699.87 1
More than 1 year but not exceeding 2 years
110,083,127.79 45,848,624.96 42
More than 2 year but not exceeding 3 years
4,964,522.61 1,425,864.59 29
More than 3 year 87,958,791.62 - -
Total 1,265,502,592.79 56,627,189.42 4
(V) NOTES TO ITEMS IN THE CONSOLIDATED FINANCIAL STATEMENTS – continued
(2) Bad debt allowance accrual and reversal:
For the year, the Company recorded a bad debt allowance of RMB 7,126,904.98, reversed bad debt allowance of RMB 43,737,130.95.
(3) Other receivables write-off
(4) Other receivables due to shareholders holding at least 5% of the Company’s shares with voting power in the current period refer to Note (IX). 6(5)
RMB
Item Write-off amount
Other receivables write-off 769,533.91
Notes To The Financial Statements– continuedFOR THE YEAR ENDED 31 DECEMBER 2014
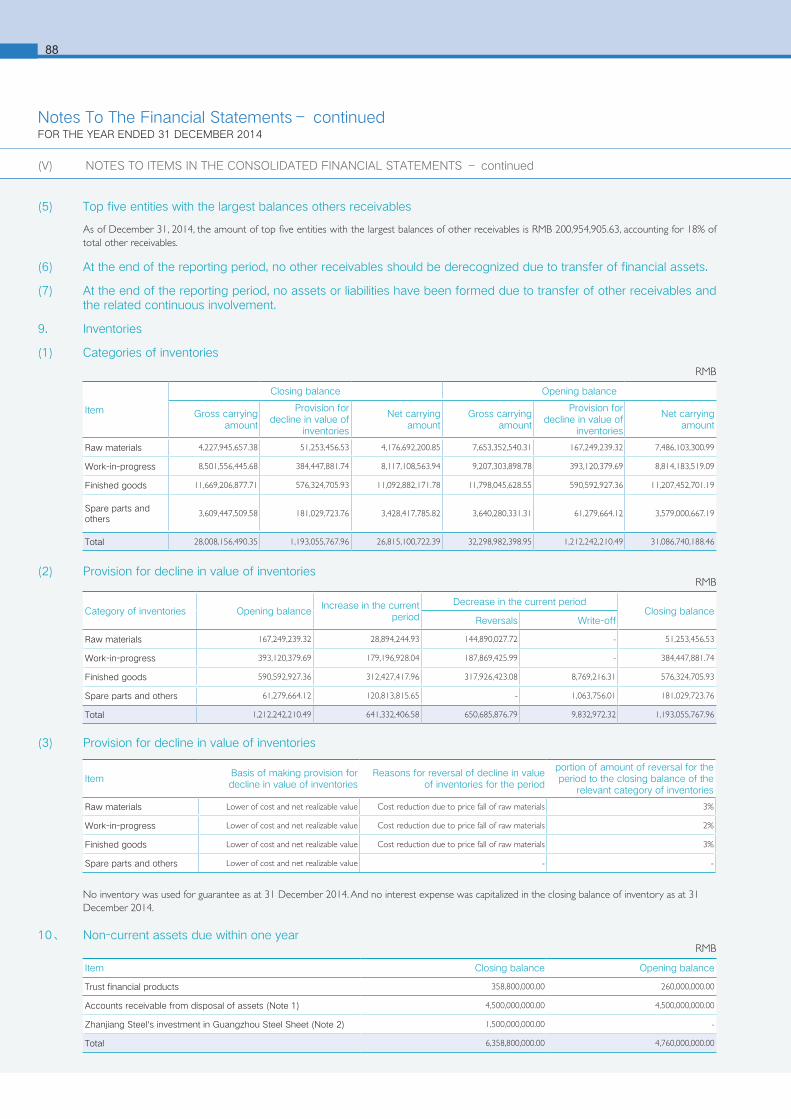
688
(2) Provision for decline in value of inventories
(3) Provision for decline in value of inventories
10、 Non-current assets due within one year
ItemBasis of making provision for decline in value of inventories
Reasons for reversal of decline in value of inventories for the period
portion of amount of reversal for the period to the closing balance of the
relevant category of inventories
Raw materials Lower of cost and net realizable value Cost reduction due to price fall of raw materials 3%
Work-in-progress Lower of cost and net realizable value Cost reduction due to price fall of raw materials 2%
Finished goods Lower of cost and net realizable value Cost reduction due to price fall of raw materials 3%
Spare parts and others Lower of cost and net realizable value - -
RMB
RMB
Item
Closing balance Opening balance
Gross carrying amount
Provision for decline in value of
inventories
Net carrying amount
Gross carrying amount
Provision for decline in value of
inventories
Net carrying amount
Raw materials 4,227,945,657.38 51,253,456.53 4,176,692,200.85 7,653,352,540.31 167,249,239.32 7,486,103,300.99
Work-in-progress 8,501,556,445.68 384,447,881.74 8,117,108,563.94 9,207,303,898.78 393,120,379.69 8,814,183,519.09
Finished goods 11,669,206,877.71 576,324,705.93 11,092,882,171.78 11,798,045,628.55 590,592,927.36 11,207,452,701.19
Spare parts and others
3,609,447,509.58 181,029,723.76 3,428,417,785.82 3,640,280,331.31 61,279,664.12 3,579,000,667.19
Total 28,008,156,490.35 1,193,055,767.96 26,815,100,722.39 32,298,982,398.95 1,212,242,210.49 31,086,740,188.46
Category of inventories Opening balanceIncrease in the current
period
Decrease in the current periodClosing balance
Reversals Write-off
Raw materials 167,249,239.32 28,894,244.93 144,890,027.72 - 51,253,456.53
Work-in-progress 393,120,379.69 179,196,928.04 187,869,425.99 - 384,447,881.74
Finished goods 590,592,927.36 312,427,417.96 317,926,423.08 8,769,216.31 576,324,705.93
Spare parts and others 61,279,664.12 120,813,815.65 - 1,063,756.01 181,029,723.76
Total 1,212,242,210.49 641,332,406.58 650,685,876.79 9,832,972.32 1,193,055,767.96
RMB
Item Closing balance Opening balance
Trust financial products 358,800,000.00 260,000,000.00
Accounts receivable from disposal of assets (Note 1) 4,500,000,000.00 4,500,000,000.00
Zhanjiang Steel's investment in Guangzhou Steel Sheet (Note 2) 1,500,000,000.00 -
Total 6,358,800,000.00 4,760,000,000.00
(V) NOTES TO ITEMS IN THE CONSOLIDATED FINANCIAL STATEMENTS – continued
(5) Top five entities with the largest balances others receivables
As of December 31, 2014, the amount of top five entities with the largest balances of other receivables is RMB 200,954,905.63, accounting for 18% of total other receivables.
(6) At the end of the reporting period, no other receivables should be derecognized due to transfer of financial assets.
(7) At the end of the reporting period, no assets or liabilities have been formed due to transfer of other receivables and the related continuous involvement.
9. Inventories
(1) Categories of inventories
No inventory was used for guarantee as at 31 December 2014. And no interest expense was capitalized in the closing balance of inventory as at 31 December 2014.
Notes To The Financial Statements– continuedFOR THE YEAR ENDED 31 DECEMBER 2014

89
11、 Other current assets
12、 Loans and advances to customers
(1) Category of loans and advances to customers
RMB
RMB
Item Closing balance Opening balance
Loans 1,029,014,041.90 2,192,214,717.69
Discounts 2,039,396,647.98 1,005,039,105.85
Provision for loan loss -119,864,699.00 -125,340,000.00
Total 2,948,545,990.88 3,071,913,823.54
Item Closing balance Opening balance
Deductible VAT input 1,363,573,089.90 -
Financial products 3,135,500,000.00 277,031,463.05
Total 4,499,073,089.90 277,031,463.05
(V) NOTES TO ITEMS IN THE CONSOLIDATED FINANCIAL STATEMENTS – continued
Note 1: Accounts receivable from disposal of assets due within one year is RMB 4.5 billion, including RMB 2.6 billion from Shanghai Baosteel Stainless Co., Ltd. and RMB 1.9 billion from Baosteel Special Steel Co., Ltd. refer to Note (V), 14(1).
Note 2: In December 2011, Baosteel Zhanjiang Iron & Steel Co., Ltd. ("Zhanjiang Steel") set up a joint venture, Guangzhou Steel Sheet Co., Ltd. with Guangzhou Iron & Steel Enterprise Group. According to the JV contract, the registered capital of Guangzhou Steel Sheet Co., Ltd. is RMB 3.251 billion, whereby Zhanjiang Steel will contribute RMB 1.658 billion in cash in exchange for 51% of the equity of Guangzhou Steel Sheet Co., Ltd.. According to restructure arrangement of the iron and steel industry in Guangzhou between Baosteel Group and Guangzhou SASAC, Guangzhou Iron & Steel Enterprise Group transferred its 46.14% equity in Guangzhou Steel Sheet Co., Ltd. to Zhanjiang Iron & Steel at the price of RMB 1.5 billion in April 2012 with the option to repurchase such equity at the same price three years later. This payment will be due in April 2015; therefore the corresponding obligatory rights and liabilities are accounted for as a non-current assets and liability due within a year.
Accounts receivable due from related parties in non-current assets due within one year refer to Note (IX).6(6).
(2) Provision for short-term, medium-term, and long-term loans
There are no loans and advances to customers due to shareholders holding at least 5% of the Company’s shares with voting power at the beginning and closing of the current period.
Loans and advances to customers due to related party at the beginning and closing of the current period refer to Note (IX). 6(7).
RMB
Item
Restated opening carrying amount after business combination
involving entities under common control
Increase in the current period
Decrease in the current period
Exchange differences arising
on translation of financial statements
denominated in foreign currencies
Closing carrying amount
Reversals Write-off
Provision for short-term, medium-term, and long-term loans losses
125,340,000.00 - 5,475,301.00 - - 119,864,699.00
Notes To The Financial Statements– continuedFOR THE YEAR ENDED 31 DECEMBER 2014
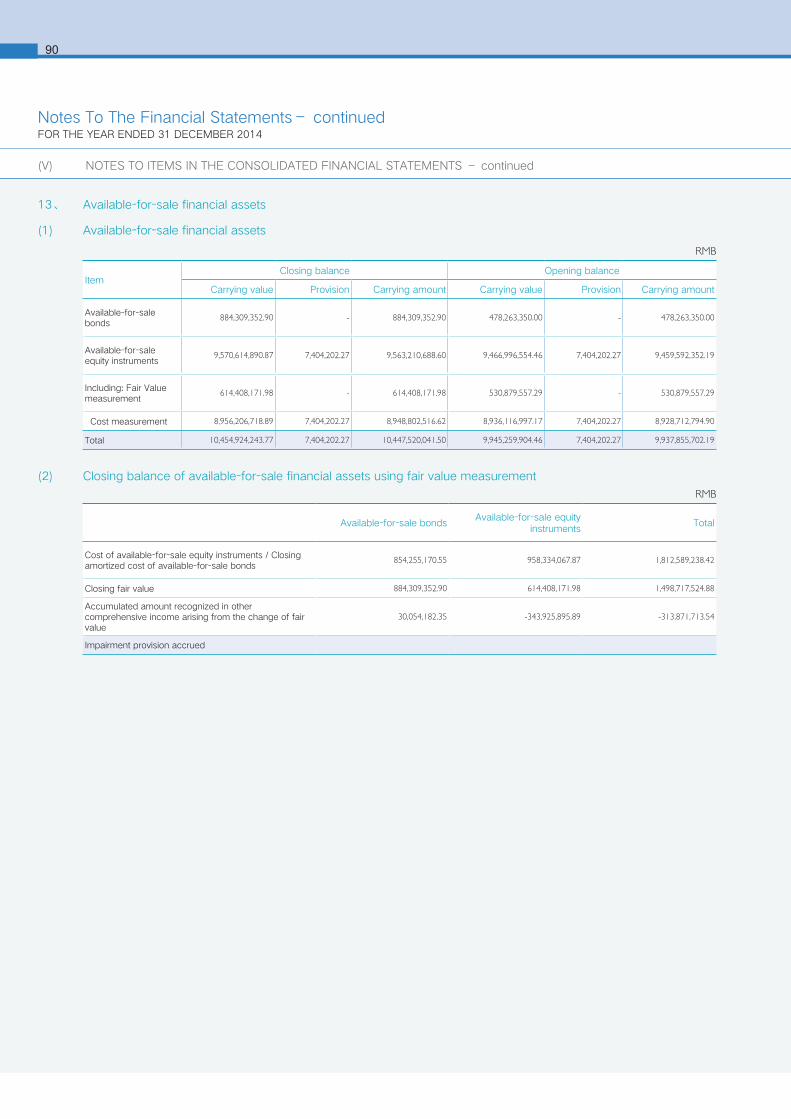
690
13、 Available-for-sale financial assets
(1) Available-for-sale financial assets
(2) Closing balance of available-for-sale financial assets using fair value measurement
RMB
ItemClosing balance Opening balance
Carrying value Provision Carrying amount Carrying value Provision Carrying amount
Available-for-sale bonds
884,309,352.90 - 884,309,352.90 478,263,350.00 - 478,263,350.00
Available-for-sale equity instruments
9,570,614,890.87 7,404,202.27 9,563,210,688.60 9,466,996,554.46 7,404,202.27 9,459,592,352.19
Including: Fair Value measurement
614,408,171.98 - 614,408,171.98 530,879,557.29 - 530,879,557.29
Cost measurement 8,956,206,718.89 7,404,202.27 8,948,802,516.62 8,936,116,997.17 7,404,202.27 8,928,712,794.90
Total 10,454,924,243.77 7,404,202.27 10,447,520,041.50 9,945,259,904.46 7,404,202.27 9,937,855,702.19
RMB
Available-for-sale bondsAvailable-for-sale equity
instrumentsTotal
Cost of available-for-sale equity instruments / Closing amortized cost of available-for-sale bonds
854,255,170.55 958,334,067.87 1,812,589,238.42
Closing fair value 884,309,352.90 614,408,171.98 1,498,717,524.88
Accumulated amount recognized in other comprehensive income arising from the change of fair value
30,054,182.35 -343,925,895.89 -313,871,713.54
Impairment provision accrued
(V) NOTES TO ITEMS IN THE CONSOLIDATED FINANCIAL STATEMENTS – continued
Notes To The Financial Statements– continuedFOR THE YEAR ENDED 31 DECEMBER 2014

91
(3) Closing balance of available-for-sale financial assets using cost measurement
RMB
The Invested entity
Carrying balance ProvisionProportion in the invested
entity (%)Cash dividendOpening
balanceIncrease
Decr-ease
Closing balanceOpening balance
Incr-ease
Decr-ease
Closing balance
CISDI Engineering Co., Ltd. 9,508,999.34 - - 9,508,999.34 - - - - 6.28% 11,298,647.00
Jinchuan Group Automation Engineering Co., Ltd.
1,000,000.00 - - 1,000,000.00 - - - - 7.13% -
Shanghai Huayi Information Technology Co., Ltd
3,000,000.00 - - 3,000,000.00 - - - - 15.00% -
Henan Longyu energy Limited 370,269,254.56 - - 370,269,254.56 - - - - 12.96% 102,384,745.72
Yongcheng Coal (Group) Co., Ltd.
279,000,000.00 - - 279,000,000.00 - - - - 7.78% -
Henan Zhenglong Coal Industry Co., Ltd
45,569,714.27 - - 45,569,714.27 - - - - 4.91% -
China Technology & Economy Investment Consulting Co.,Ltd.
3,000,000.00 - - 3,000,000.00 -666,024.47 - - -666,024.47 5.00% -
Yantai Tiezhongbao Steel Processing Co.,Ltd.
5,600,000.00 - - 5,600,000.00 - - - - 10.00%
China Resources Land Limited (Beijing)
1,618,750.00 - - 1,618,750.00 - - - - 0.09%
Anhui Huishang Co., Ltd. 3,000,000.00 - - 3,000,000.00 - - - - 3.53%
Hanyang Components Co., Ltd. 3,311,720.00 - - 3,311,720.00 -3,311,720.00 - - -3,311,720.00 20.00%
Baovale Mining Co., Ltd. 103,282,213.00 - - 103,282,213.00 - - - - 50.00% 17,436,100.50
Shanghai Luojing Ore Terminal Co., Ltd.
88,734,096.00 - - 88,734,096.00 - - - - 12.00% 7,194,838.62
Yangtze River Economic United Development (Group) Co., Ltd.
980,000.00 - - 980,000.00 - - - - 0.15% 27,300.00
Guoqi(Beijing) Automotive Lightweight Technology Research Co., Ltd.
3,000,000.00 - - 3,000,000.00 - - - - 6.90% -
PetroChina Northwest Joint Pipeline Company Limited
8,000,000,000.00 - - 8,000,000,000.00 - - - - 12.80% 99,474,885.33
Corex - 5,000,000.00 - 5,000,000.00 - - - - 6.25% -
Globalore Pte Ltd. 15,242,250.00 42,829.80 15,285,079.80 -3,426,457.80 - - -3,426,457.80 14.29% -
Baometal S.r.L - 15,046,891.92 - 15,046,891.92 - - - - 10.00% -
Total 8,936,116,997.17 20,089,721.72 - 8,956,206,718.89 -7,404,202.27 - - -7,404,202.27 / 237,816,517.17
(V) NOTES TO ITEMS IN THE CONSOLIDATED FINANCIAL STATEMENTS – continued
Notes To The Financial Statements– continuedFOR THE YEAR ENDED 31 DECEMBER 2014

692
(4) Changes in impairment of available-for-sale financial assets during the reporting period
(5) Relevant explanation on available-for-sale equity instrument with serious drop or non-temporary drop of fair value but with no impairment recognized
Note 1: The abovementioned available-for-sale equity instruments primarily consisted of the 42,658,306 shares of equity investment in Shanxi Xishan Coal Electricity LLC (“Xishan CE”) (000983), which was purchased by Baosteel International, a subsidiary of the Company, gradually since 2010 from Shenzhen Stock Exchange with a total cost of RMB 941,660,003.69 at RMB 22.10 per share. As of 31 December 2014, the closing stock price of Xishan CE dropped to RMB 8.22 per share with the accumulated decline of RMB 591,008,728.37. The closing balance of the investment is RMB 350,651,275.32. Such equity investment in Xishan CE is held for strategic purpose and will not be traded based on the temporary fluctuation of stock price. Therefore, the Group accounts for the equity investment as available-for-sale financial assets.
According to ASBE, as available-for-sale financial assets, the Group recognized the price fluctuation in capital surplus. In assessing whether there is any objective evidence of impairment on such available-for-sale financial assets, the Company mainly analyzed the operation of the investee. The management of the Company believes that no impairment shall be recognized on 31 December, 2014 for such available-for-sale financial assets based on the predetermined criteria of available-for-sale financial assets impairment (Note III (11).3) by considering the following relevant factors:
1) Xishan CE is the biggest giant in the coal industry with dominance of high quality metallurgical coking coal;
2) In addition to coal industry, Xishan CE developed two industry chains, coal-electricity-material chain and coal-carbon-chemistry chain, separately;
3) The decline of price of Xishan CE was primarily due to the bear capital market. And the decline was random and temporary;
4) The operation of Xishan CE has been stable for the past several years. No significant drop of revenue and EBITDA or significant deterioration of operation has occurred to Xishan CE during the past three years, and;
5) The strategic purpose of the Company to hold the equity investment in Xishan CE remains unchanged.
Categories Available-for-sale bonds Available-for-sale equity instruments Total
Opening balance -7,404,202.27 -7,404,202.27
Accrued in this current period
Including: transfer from other comprehensive income
Decrease amount
Including: transfer from fair value rebound
Closing balance -7,404,202.27 -7,404,202.27
RMB
Available for sale equity instrument item
Investment costFair value of closing
balance
Declining rate of fair value relative to
cost(%)
Continuing declining period
Impairment amount
Reasons for not been impaired
Shanxi Xishan Coal Electricity LLC
941,660,003.69 350,651,275.32 62.76% Exceed 12 months - Note 1
14. Long-term receivablesRMB
Item
Closing balance Opening balance
Carrying balanceImpairment
provisionBook value Carrying balance
Impairment provision
Book value
Finance leases receivables 9,222,500.00 -175,000.00 9,047,500.00 13,648,375.00 -1,950,000.00 11,698,375.00
Including: Unrealized finance income (472,500.00) - -472,500.00 -648,375.00 - -648,375.00
Accounts receivable from disposal of assets (Note 1)
13,500,000,000.00 - 13,500,000,000.00 18,000,000,000.00 - 18,000,000,000.00
Less: Accounts receivable from disposal of assets due within one year (Note 1)
4,500,000,000.00 - 4,500,000,000.00 4,500,000,000.00 - 4,500,000,000.00
Others 3,493,634.07 - 3,493,634.07 3,704,636.88 - 3,704,636.88
Total 9,012,243,634.07 -175,000.00 9,012,068,634.07 13,516,704,636.88 -1,950,000.00 13,514,754,636.88
(V) NOTES TO ITEMS IN THE CONSOLIDATED FINANCIAL STATEMENTS – continued
Notes To The Financial Statements– continuedFOR THE YEAR ENDED 31 DECEMBER 2014

93
Bad debt provision, amounting to RMB 1,775,000.00 has been reversed in this current period.
Note 1: In accordance with the Connected Transaction Bulletin (Lin 2012-05) issued by the Company on February 29, 2012, and the Supplementary bulletin of Proposal on Sales of Related Assets of Stainless steel and Special Steel Business Units issued by the Company on March 14, 2012, the Company transferred the assets and equities of the Stainless and Special Steel Business Units at the evaluation value based on 31 December 2011 on the asset evaluation report issued by China Assets Appraisal Co., Ltd.The Company completed the above-mentioned assets transfer on April 1, 2012. The accounts receivable from disposal of assets is RMB22.5 billion and will be paid in five equal instalments in five years. From 2013 onwards, the Company will receive both the interest and principal on the accounts receivable from disposal of assets on April 1 every year and the final payment on April 1, 2017. As of December 31, 2014, the closing balance of accounts receivable from disposal of assets is RMB 13.5 billion, RMB 7.8 billion from Baosteel Stainless and RMB 5.7 billion from Baosteel Special Steel. RMB 4.5 billion of the accounts receivable mentioned above from disposal of assets will be due within one year, RMB 2.6 billion from Baosteel Stainless and RMB 1.9 billion from Baosteel Special Steel, respectively.
Note 2: There are no long-term receivables due from shareholders holding at least 5% of the Company’s shares with voting power in beginning and end of the current period.
Note 3: Long-term receivables due from related parties in beginning and end of the current period refer to Note (IX). 6(8).
Note 4: In this reporting period, no long term account receivable is recognized due to transferring of financial asset.
Note 5: In this reporting period, no asset and liability are formed due to long-term accounts receivable continuous involvement.
(V) NOTES TO ITEMS IN THE CONSOLIDATED FINANCIAL STATEMENTS – continued
Notes To The Financial Statements– continuedFOR THE YEAR ENDED 31 DECEMBER 2014
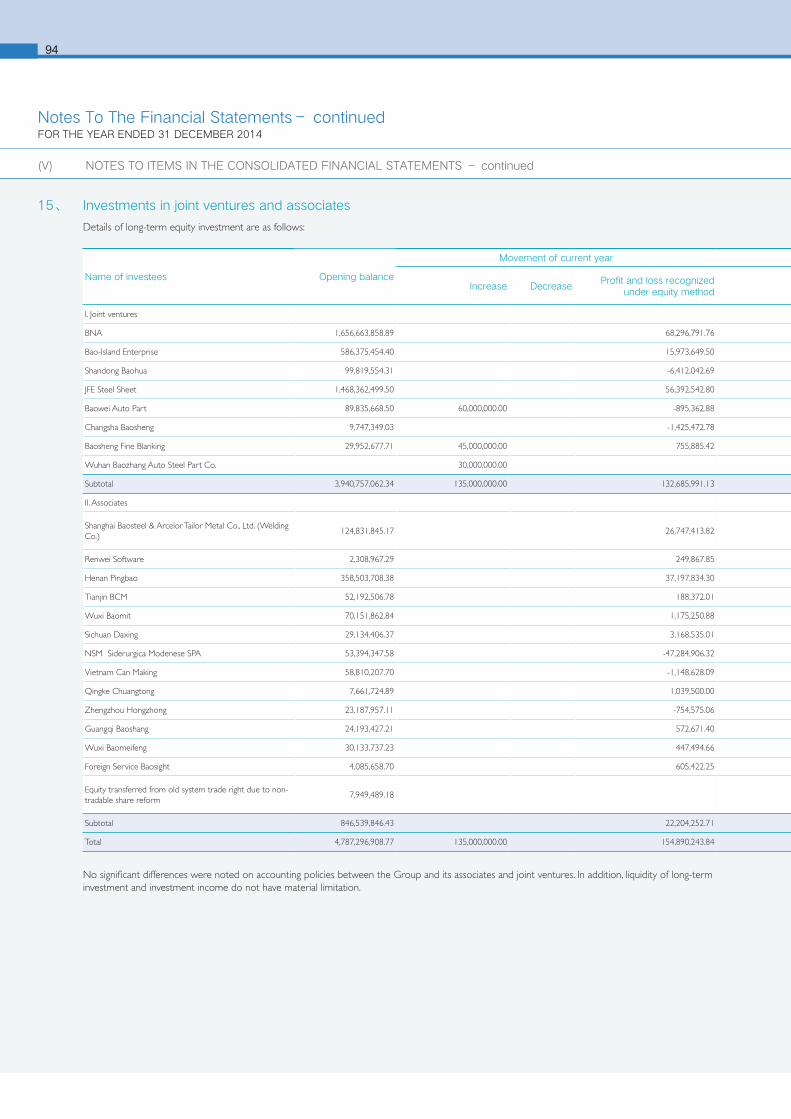
694
Name of investees Opening balance
Movement of current year Movement of current year
Closing balanceClosing balance of
impairmentIncrease DecreaseProfit and loss recognized
under equity methodOther comprehensive
adjustmentOther equity
movementCash dividend and profits
when announcedProvision for impairment
Others
I. Joint ventures
BNA 1,656,663,858.89 68,296,791.76 -1,316,293.47 51,496,548.55 1,672,147,808.63
Bao-Island Enterprise 586,375,454.40 15,973,649.50 2,125,489.60 604,474,593.50
Shandong Baohua 99,819,554.31 -6,412,042.69 93,407,511.62
JFE Steel Sheet 1,468,362,499.50 56,392,542.80 1,524,755,042.30 35,000,000.00
Baowei Auto Part 89,835,668.50 60,000,000.00 -895,362.88 148,940,305.62
Changsha Baosheng 9,747,349.03 -1,425,472.78 8,321,876.25
Baosheng Fine Blanking 29,952,677.71 45,000,000.00 755,885.42 75,708,563.13
Wuhan Baozhang Auto Steel Part Co. 30,000,000.00 30,000,000.00
Subtotal 3,940,757,062.34 135,000,000.00 132,685,991.13 2,125,489.60 -1,316,293.47 51,496,548.55 4,157,755,701.05 35,000,000.00
II. Associates
Shanghai Baosteel & Arcelor Tailor Metal Co., Ltd. (Welding Co.)
124,831,845.17 26,747,413.82 19,617,338.86 131,961,920.13
Renwei Software 2,308,967.29 249,867.85 2,558,835.14
Henan Pingbao 358,503,708.38 37,197,834.30 239,887.44 395,941,430.12
Tianjin BCM 52,192,506.78 188,372.01 52,380,878.79
Wuxi Baomit 70,151,862.84 1,175,250.88 2,166,054.04 69,161,059.68
Sichuan Daxing 29,134,406.37 3,168,535.01 1,298,926.86 2,250,000.00 31,351,868.24
NSM Siderurgica Modenese SPA 53,394,347.58 -47,284,906.32 -6,109,441.26 0
Vietnam Can Making 58,810,207.70 -1,148,628.09 213,174.83 57,874,754.44
Qingke Chuangtong 7,661,724.89 1,039,500.00 8,701,224.89
Zhengzhou Hongzhong 23,187,957.11 -754,575.06 22,433,382.05
Guangqi Baoshang 24,193,427.21 572,671.40 24,766,098.61
Wuxi Baomeifeng 30,133,737.23 447,494.66 30,581,231.89
Foreign Service Baosight 4,085,658.70 605,422.25 4,691,080.95
Equity transferred from old system trade right due to non-tradable share reform
7,949,489.18 7,949,489.18
Subtotal 846,539,846.43 22,204,252.71 -5,896,266.43 1,538,814.30 24,033,392.90 840,353,254.11
Total 4,787,296,908.77 135,000,000.00 154,890,243.84 -3,770,776.83 222,520.83 75,529,941.45 4,998,108,955.16 35,000,000.00
15、 Investments in joint ventures and associates
Details of long-term equity investment are as follows:
No significant differences were noted on accounting policies between the Group and its associates and joint ventures. In addition, liquidity of long-term investment and investment income do not have material limitation.
(V) NOTES TO ITEMS IN THE CONSOLIDATED FINANCIAL STATEMENTS – continued
Notes To The Financial Statements– continuedFOR THE YEAR ENDED 31 DECEMBER 2014
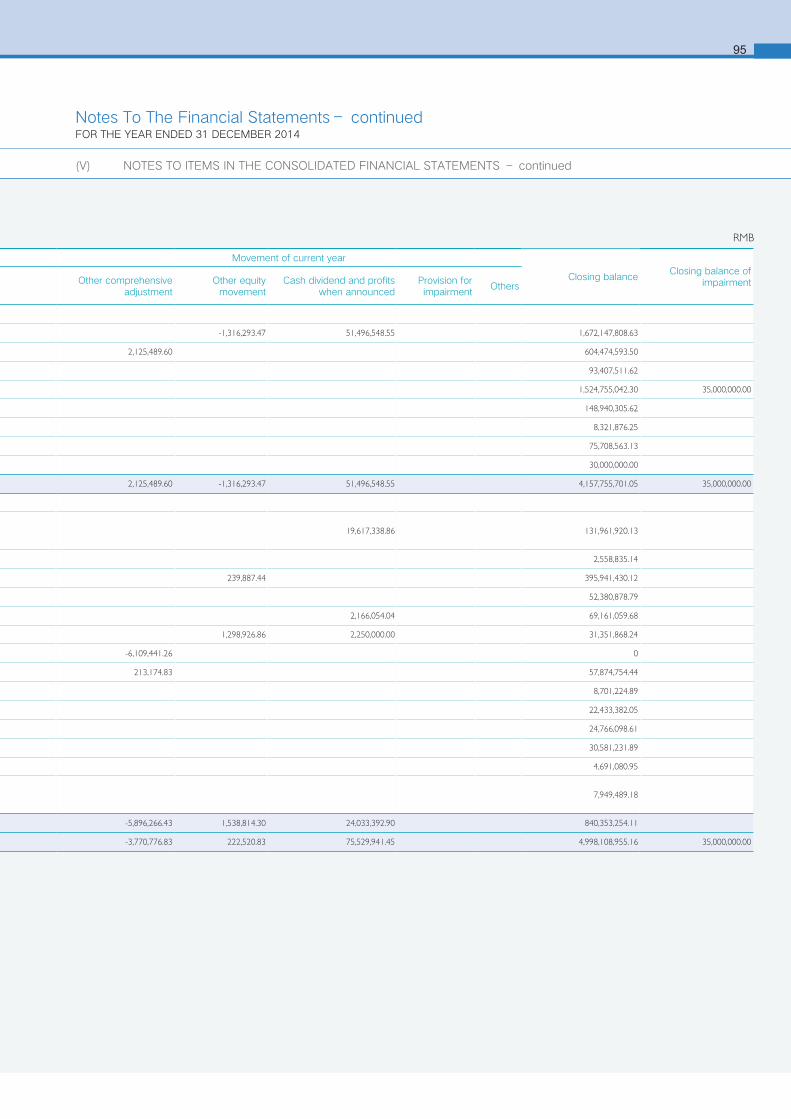
95
Name of investees Opening balance
Movement of current year Movement of current year
Closing balanceClosing balance of
impairmentIncrease DecreaseProfit and loss recognized
under equity methodOther comprehensive
adjustmentOther equity
movementCash dividend and profits
when announcedProvision for impairment
Others
I. Joint ventures
BNA 1,656,663,858.89 68,296,791.76 -1,316,293.47 51,496,548.55 1,672,147,808.63
Bao-Island Enterprise 586,375,454.40 15,973,649.50 2,125,489.60 604,474,593.50
Shandong Baohua 99,819,554.31 -6,412,042.69 93,407,511.62
JFE Steel Sheet 1,468,362,499.50 56,392,542.80 1,524,755,042.30 35,000,000.00
Baowei Auto Part 89,835,668.50 60,000,000.00 -895,362.88 148,940,305.62
Changsha Baosheng 9,747,349.03 -1,425,472.78 8,321,876.25
Baosheng Fine Blanking 29,952,677.71 45,000,000.00 755,885.42 75,708,563.13
Wuhan Baozhang Auto Steel Part Co. 30,000,000.00 30,000,000.00
Subtotal 3,940,757,062.34 135,000,000.00 132,685,991.13 2,125,489.60 -1,316,293.47 51,496,548.55 4,157,755,701.05 35,000,000.00
II. Associates
Shanghai Baosteel & Arcelor Tailor Metal Co., Ltd. (Welding Co.)
124,831,845.17 26,747,413.82 19,617,338.86 131,961,920.13
Renwei Software 2,308,967.29 249,867.85 2,558,835.14
Henan Pingbao 358,503,708.38 37,197,834.30 239,887.44 395,941,430.12
Tianjin BCM 52,192,506.78 188,372.01 52,380,878.79
Wuxi Baomit 70,151,862.84 1,175,250.88 2,166,054.04 69,161,059.68
Sichuan Daxing 29,134,406.37 3,168,535.01 1,298,926.86 2,250,000.00 31,351,868.24
NSM Siderurgica Modenese SPA 53,394,347.58 -47,284,906.32 -6,109,441.26 0
Vietnam Can Making 58,810,207.70 -1,148,628.09 213,174.83 57,874,754.44
Qingke Chuangtong 7,661,724.89 1,039,500.00 8,701,224.89
Zhengzhou Hongzhong 23,187,957.11 -754,575.06 22,433,382.05
Guangqi Baoshang 24,193,427.21 572,671.40 24,766,098.61
Wuxi Baomeifeng 30,133,737.23 447,494.66 30,581,231.89
Foreign Service Baosight 4,085,658.70 605,422.25 4,691,080.95
Equity transferred from old system trade right due to non-tradable share reform
7,949,489.18 7,949,489.18
Subtotal 846,539,846.43 22,204,252.71 -5,896,266.43 1,538,814.30 24,033,392.90 840,353,254.11
Total 4,787,296,908.77 135,000,000.00 154,890,243.84 -3,770,776.83 222,520.83 75,529,941.45 4,998,108,955.16 35,000,000.00
RMB
(V) NOTES TO ITEMS IN THE CONSOLIDATED FINANCIAL STATEMENTS – continued
Notes To The Financial Statements– continuedFOR THE YEAR ENDED 31 DECEMBER 2014
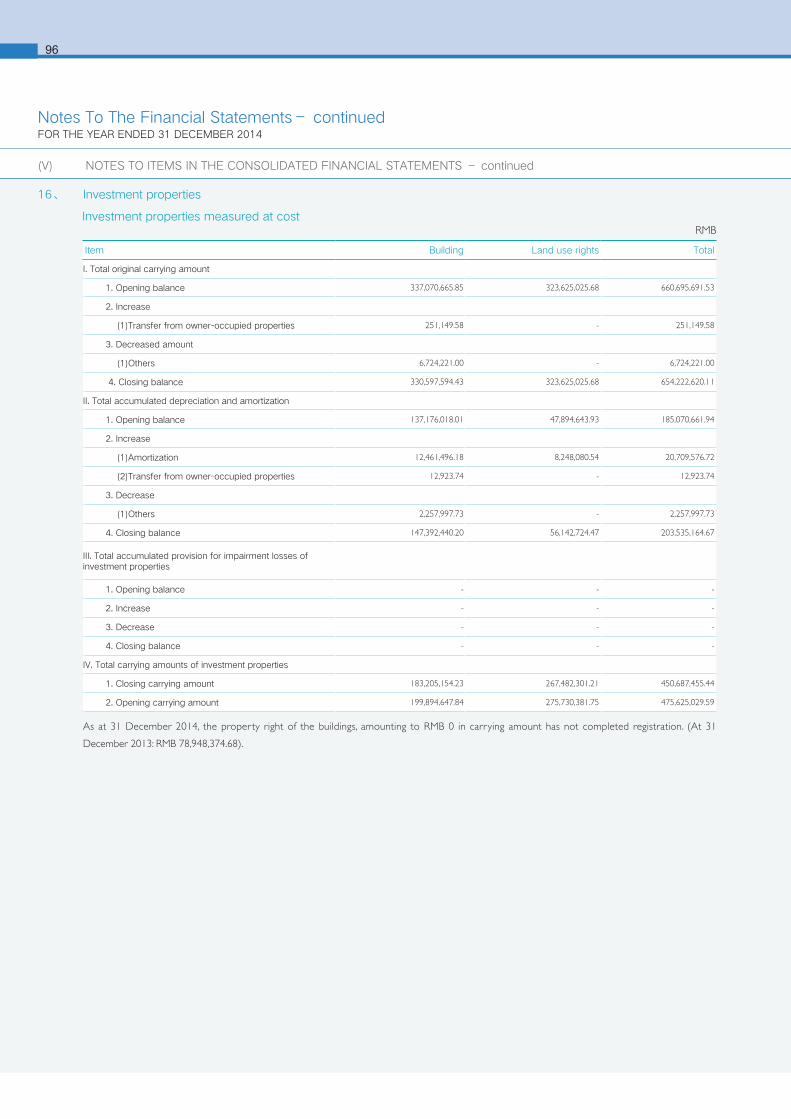
696
16、 Investment properties
Investment properties measured at costRMB
Item Building Land use rights Total
I. Total original carrying amount
1. Opening balance 337,070,665.85 323,625,025.68 660,695,691.53
2. Increase
(1)Transfer from owner-occupied properties 251,149.58 - 251,149.58
3. Decreased amount
(1)Others 6,724,221.00 - 6,724,221.00
4. Closing balance 330,597,594.43 323,625,025.68 654,222,620.11
II. Total accumulated depreciation and amortization
1. Opening balance 137,176,018.01 47,894,643.93 185,070,661.94
2. Increase
(1)Amortization 12,461,496.18 8,248,080.54 20,709,576.72
(2)Transfer from owner-occupied properties 12,923.74 - 12,923.74
3. Decrease
(1)Others 2,257,997.73 - 2,257,997.73
4. Closing balance 147,392,440.20 56,142,724.47 203,535,164.67
III. Total accumulated provision for impairment losses of investment properties
1. Opening balance - - -
2. Increase - - -
3. Decrease - - -
4. Closing balance - - -
IV. Total carrying amounts of investment properties
1. Closing carrying amount 183,205,154.23 267,482,301.21 450,687,455.44
2. Opening carrying amount 199,894,647.84 275,730,381.75 475,625,029.59
As at 31 December 2014, the property right of the buildings, amounting to RMB 0 in carrying amount has not completed registration. (At 31
December 2013: RMB 78,948,374.68).
(V) NOTES TO ITEMS IN THE CONSOLIDATED FINANCIAL STATEMENTS – continued
Notes To The Financial Statements– continuedFOR THE YEAR ENDED 31 DECEMBER 2014

97
Item BuildingMachinery and
EquipmentTransportation
vehiclesOffice and other
equipmentTotal
I. Total original carrying amount
1. Opening balance 51,516,881,676.70 143,682,351,816.21 17,734,967,022.66 17,577,607,675.50 230,511,808,191.07
2. Increase
(1)Purchase 46,218,926.67 121,163,790.01 51,561,538.41 238,119,977.25 457,064,232.34
(2)Transferred from construction in progress 569,838,400.55 4,670,346,493.98 647,624,750.88 1,041,770,176.33 6,929,579,821.74
(3)Reclassification 156,762,052.12 335,974,338.82 44,466,471.05 (537,202,861.99) -
I. Total original carrying amount
3.Decrease
(1)Disposal 265,491,508.20 2,834,912,718.19 736,165,093.22 989,315,688.77 4,825,885,008.38
(2)Transfer into construction in progress 4,618,711.02 25,612,604.35 19,817,615.63 31,446,435.59 81,495,366.59
(3)Transfer into investment properties 251,149.58 - - - 251,149.58
(4)Translation differences arising on translation of financial statements denominated in foreign currencies
10,165,605.47 -5,976,999.60 435,703.19 1,684,340.68 6,308,649.74
4.Closing balance 52,009,174,081.77 145,955,288,116.08 17,722,201,370.96 17,297,848,502.05 232,984,512,070.86
II. Total accumulated depreciation:
1.Opening balance 24,532,093,826.13 90,737,877,271.60 14,643,958,385.47 14,008,882,689.79 143,922,812,172.99
2.Addition for the year
(1)Accrued 2,029,100,837.31 6,449,980,279.23 625,544,253.95 1,082,130,356.29 10,186,755,726.78
(2)Reclassification 49,831,253.47 83,683,839.04 1,534,703.83 -135,049,796.34 -
3.Deduction for the year
(1)Disposal 218,254,617.45 2,610,281,463.67 691,295,236.62 934,982,387.77 4,454,813,705.51
(2)Less: transfer into construction in progress 1,536,659.77 11,618,181.40 18,116,070.43 16,550,187.50 47,821,099.10
(3)Transfer into investment properties 12,923.74 - - - 12,923.74
(4)Translation differences arising on translation of financial statements denominated in foreign currencies
3,362,366.21 259,028.66 374,748.42 1,202,849.40 5,198,992.69
4.Closing balance 26,387,859,349.74 94,649,382,716.14 14,561,251,287.78 14,003,227,825.07 149,601,721,178.73
III. Total provision for impairment losses
1.Opening balance 295,671.34 368,978,001.46 168,951.73 1,339,674.58 370,782,299.11
2.Addition for the year
(1)Accrued 69,544,300.42 50,109,124.06 519,297.40 872,657.82 121,045,379.70
(2)Transfer from other non-current asset - 1,534,544.63 23,283.90 1,531,657.65 3,089,486.18
3.Deduction for the year
(1) Disposal - 8,449,410.92 6,504.60 670,535.89 9,126,451.41
4.Closing balance 69,839,971.76 412,172,259.23 705,028.43 3,073,454.16 485,790,713.58
IV. Total carrying amount of fixed assets
1.Closing balance 25,551,474,760.27 50,893,733,140.71 3,160,245,054.75 3,291,547,222.82 82,897,000,178.55
2.Opening balance 26,984,492,179.23 52,575,496,543.15 3,090,839,685.46 3,567,385,311.13 86,218,213,718.97
(2) Temporarily idle fixed assets
As at 31 December 2014 and at 31 December 2013, the total carrying amount of temporarily idle fixed assets is Nil.
17、 Fixed assets
(1) Fixed assetsRMB
(V) NOTES TO ITEMS IN THE CONSOLIDATED FINANCIAL STATEMENTS – continued
Notes To The Financial Statements– continuedFOR THE YEAR ENDED 31 DECEMBER 2014
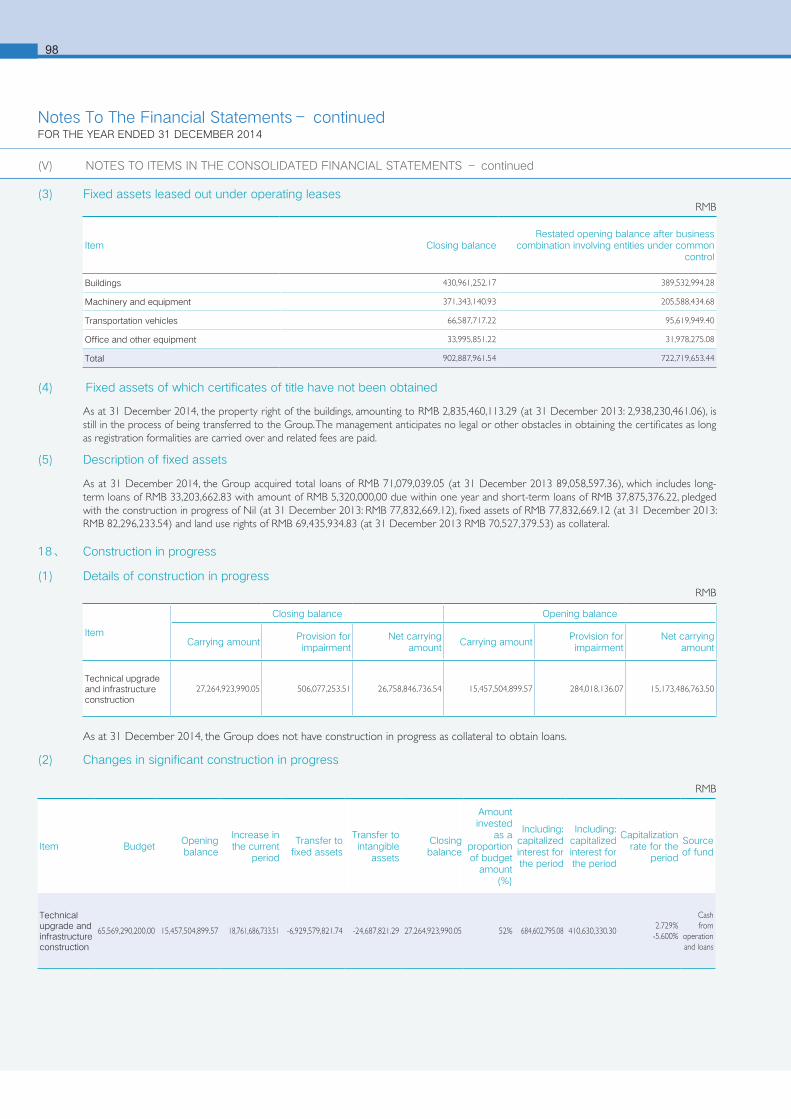
698
(3) Fixed assets leased out under operating leases
(4) Fixed assets of which certificates of title have not been obtained
As at 31 December 2014, the property right of the buildings, amounting to RMB 2,835,460,113.29 (at 31 December 2013: 2,938,230,461.06), is still in the process of being transferred to the Group. The management anticipates no legal or other obstacles in obtaining the certificates as long as registration formalities are carried over and related fees are paid.
(5) Description of fixed assets
As at 31 December 2014, the Group acquired total loans of RMB 71,079,039.05 (at 31 December 2013 89,058,597.36), which includes long-term loans of RMB 33,203,662.83 with amount of RMB 5,320,000,00 due within one year and short-term loans of RMB 37,875,376.22, pledged with the construction in progress of Nil (at 31 December 2013: RMB 77,832,669.12), fixed assets of RMB 77,832,669.12 (at 31 December 2013: RMB 82,296,233.54) and land use rights of RMB 69,435,934.83 (at 31 December 2013 RMB 70,527,379.53) as collateral.
18、 Construction in progress
(1) Details of construction in progress
As at 31 December 2014, the Group does not have construction in progress as collateral to obtain loans.
(2) Changes in significant construction in progress
RMB
Item Closing balanceRestated opening balance after business
combination involving entities under common control
Buildings 430,961,252.17 389,532,994.28
Machinery and equipment 371,343,140.93 205,588,434.68
Transportation vehicles 66,587,717.22 95,619,949.40
Office and other equipment 33,995,851.22 31,978,275.08
Total 902,887,961.54 722,719,653.44
RMB
Item BudgetOpening balance
Increase in the current
period
Transfer to fixed assets
Transfer to intangible
assets
Closing balance
Amount invested
as a proportion of budget
amount (%)
Including: capitalized interest for the period
Including: capitalized interest for the period
Capitalization rate for the
period
Source of fund
Technical upgrade and infrastructure construction
65,569,290,200.00 15,457,504,899.57 18,761,686,733.51 -6,929,579,821.74 -24,687,821.29 27,264,923,990.05 52% 684,602,795.08 410,630,330.302.729%
-5.600%
Cash from
operation and loans
RMB
Item
Closing balance Opening balance
Carrying amountProvision for impairment
Net carrying amount
Carrying amountProvision for impairment
Net carrying amount
Technical upgrade and infrastructure construction
27,264,923,990.05 506,077,253.51 26,758,846,736.54 15,457,504,899.57 284,018,136.07 15,173,486,763.50
(V) NOTES TO ITEMS IN THE CONSOLIDATED FINANCIAL STATEMENTS – continued
Notes To The Financial Statements– continuedFOR THE YEAR ENDED 31 DECEMBER 2014
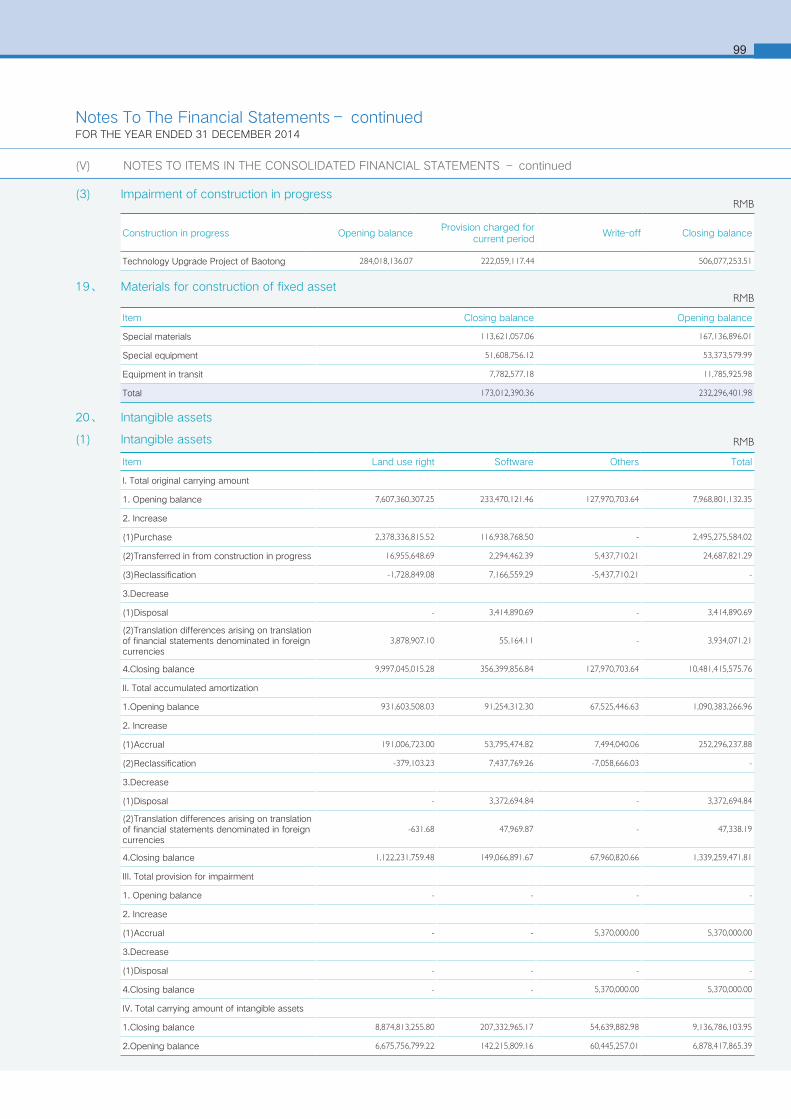
99
(3) Impairment of construction in progress
19、 Materials for construction of fixed assetRMB
RMB
Construction in progress Opening balanceProvision charged for
current periodWrite-off Closing balance
Technology Upgrade Project of Baotong 284,018,136.07 222,059,117.44 506,077,253.51
Item Land use right Software Others Total
I. Total original carrying amount
1. Opening balance 7,607,360,307.25 233,470,121.46 127,970,703.64 7,968,801,132.35
2. Increase
(1)Purchase 2,378,336,815.52 116,938,768.50 - 2,495,275,584.02
(2)Transferred in from construction in progress 16,955,648.69 2,294,462.39 5,437,710.21 24,687,821.29
(3)Reclassification -1,728,849.08 7,166,559.29 -5,437,710.21 -
3.Decrease
(1)Disposal - 3,414,890.69 - 3,414,890.69
(2)Translation differences arising on translation of financial statements denominated in foreign currencies
3,878,907.10 55,164.11 - 3,934,071.21
4.Closing balance 9,997,045,015.28 356,399,856.84 127,970,703.64 10,481,415,575.76
II. Total accumulated amortization
1.Opening balance 931,603,508.03 91,254,312.30 67,525,446.63 1,090,383,266.96
2. Increase
(1)Accrual 191,006,723.00 53,795,474.82 7,494,040.06 252,296,237.88
(2)Reclassification -379,103.23 7,437,769.26 -7,058,666.03 -
3.Decrease
(1)Disposal - 3,372,694.84 - 3,372,694.84
(2)Translation differences arising on translation of financial statements denominated in foreign currencies
-631.68 47,969.87 - 47,338.19
4.Closing balance 1,122,231,759.48 149,066,891.67 67,960,820.66 1,339,259,471.81
III. Total provision for impairment
1. Opening balance - - - -
2. Increase
(1)Accrual - - 5,370,000.00 5,370,000.00
3.Decrease
(1)Disposal - - - -
4.Closing balance - - 5,370,000.00 5,370,000.00
IV. Total carrying amount of intangible assets
1.Closing balance 8,874,813,255.80 207,332,965.17 54,639,882.98 9,136,786,103.95
2.Opening balance 6,675,756,799.22 142,215,809.16 60,445,257.01 6,878,417,865.39
20、 Intangible assets
(1) Intangible assets
(V) NOTES TO ITEMS IN THE CONSOLIDATED FINANCIAL STATEMENTS – continued
Item Closing balance Opening balance
Special materials 113,621,057.06 167,136,896.01
Special equipment 51,608,756.12 53,373,579.99
Equipment in transit 7,782,577.18 11,785,925.98
Total 173,012,390.36 232,296,401.98
RMB
Notes To The Financial Statements– continuedFOR THE YEAR ENDED 31 DECEMBER 2014
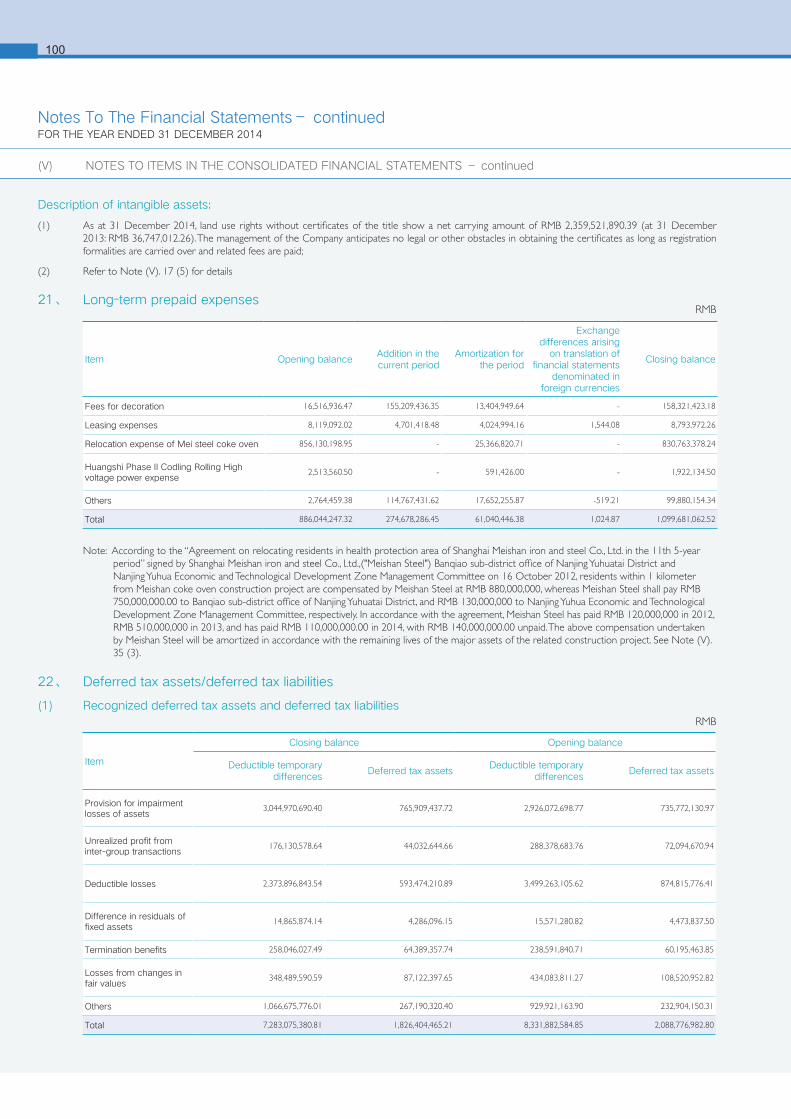
6100
Description of intangible assets:
(1) As at 31 December 2014, land use rights without certificates of the title show a net carrying amount of RMB 2,359,521,890.39 (at 31 December 2013: RMB 36,747,012.26). The management of the Company anticipates no legal or other obstacles in obtaining the certificates as long as registration formalities are carried over and related fees are paid;
(2) Refer to Note (V). 17 (5) for details
21、 Long-term prepaid expenses
Note: According to the “Agreement on relocating residents in health protection area of Shanghai Meishan iron and steel Co., Ltd. in the 11th 5-year period” signed by Shanghai Meishan iron and steel Co., Ltd.,("Meishan Steel") Banqiao sub-district office of Nanjing Yuhuatai District and Nanjing Yuhua Economic and Technological Development Zone Management Committee on 16 October 2012, residents within 1 kilometer from Meishan coke oven construction project are compensated by Meishan Steel at RMB 880,000,000, whereas Meishan Steel shall pay RMB 750,000,000.00 to Banqiao sub-district office of Nanjing Yuhuatai District, and RMB 130,000,000 to Nanjing Yuhua Economic and Technological Development Zone Management Committee, respectively. In accordance with the agreement, Meishan Steel has paid RMB 120,000,000 in 2012, RMB 510,000,000 in 2013, and has paid RMB 110,000,000.00 in 2014, with RMB 140,000,000.00 unpaid. The above compensation undertaken by Meishan Steel will be amortized in accordance with the remaining lives of the major assets of the related construction project. See Note (V). 35 (3).
RMB
Item Opening balanceAddition in the current period
Amortization for the period
Exchange differences arising
on translation of financial statements
denominated in foreign currencies
Closing balance
Fees for decoration 16,516,936.47 155,209,436.35 13,404,949.64 - 158,321,423.18
Leasing expenses 8,119,092.02 4,701,418.48 4,024,994.16 1,544.08 8,793,972.26
Relocation expense of Mei steel coke oven 856,130,198.95 - 25,366,820.71 - 830,763,378.24
Huangshi Phase II Codling Rolling High voltage power expense
2,513,560.50 - 591,426.00 - 1,922,134.50
Others 2,764,459.38 114,767,431.62 17,652,255.87 -519.21 99,880,154.34
Total 886,044,247.32 274,678,286.45 61,040,446.38 1,024.87 1,099,681,062.52
22、 Deferred tax assets/deferred tax liabilities
(1) Recognized deferred tax assets and deferred tax liabilitiesRMB
Item
Closing balance Opening balance
Deductible temporary differences
Deferred tax assetsDeductible temporary
differencesDeferred tax assets
Provision for impairment losses of assets
3,044,970,690.40 765,909,437.72 2,926,072,698.77 735,772,130.97
Unrealized profit from inter-group transactions
176,130,578.64 44,032,644.66 288,378,683.76 72,094,670.94
Deductible losses 2,373,896,843.54 593,474,210.89 3,499,263,105.62 874,815,776.41
Difference in residuals of fixed assets
14,865,874.14 4,286,096.15 15,571,280.82 4,473,837.50
Termination benefits 258,046,027.49 64,389,357.74 238,591,840.71 60,195,463.85
Losses from changes in fair values
348,489,590.59 87,122,397.65 434,083,811.27 108,520,952.82
Others 1,066,675,776.01 267,190,320.40 929,921,163.90 232,904,150.31
Total 7,283,075,380.81 1,826,404,465.21 8,331,882,584.85 2,088,776,982.80
(V) NOTES TO ITEMS IN THE CONSOLIDATED FINANCIAL STATEMENTS – continued
Notes To The Financial Statements– continuedFOR THE YEAR ENDED 31 DECEMBER 2014
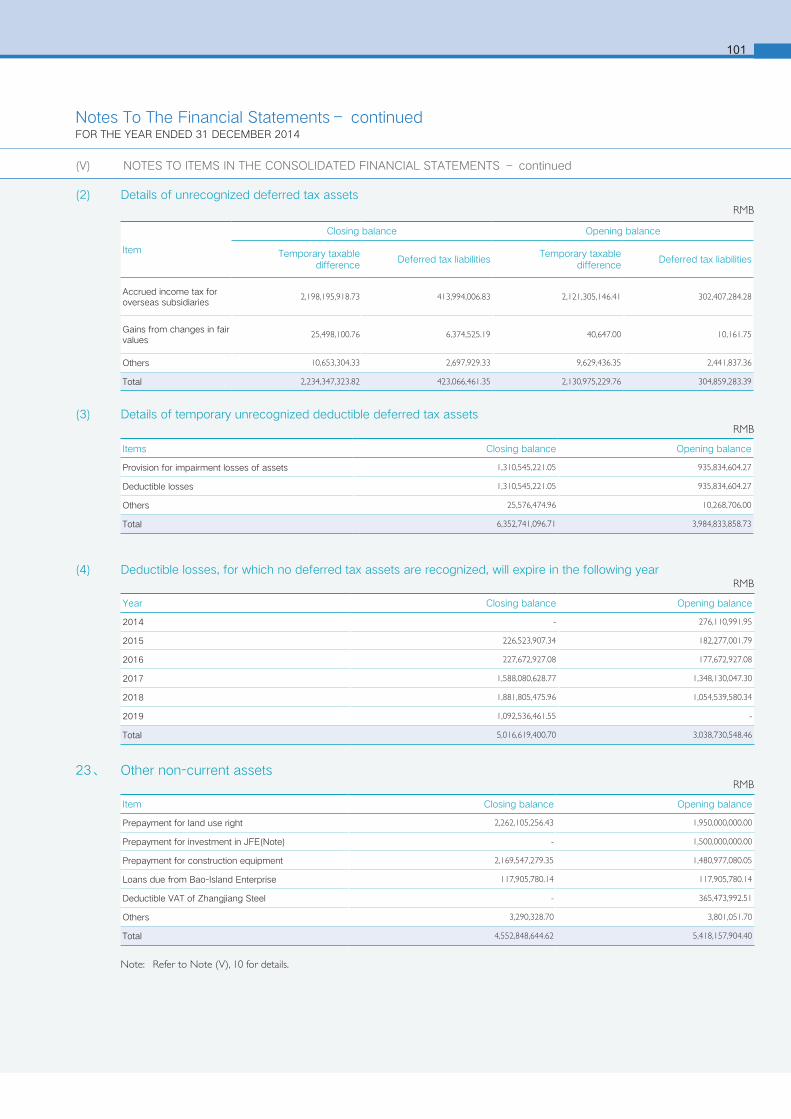
101
(3) Details of temporary unrecognized deductible deferred tax assets
(4) Deductible losses, for which no deferred tax assets are recognized, will expire in the following year
RMB
Items Closing balance Opening balance
Provision for impairment losses of assets 1,310,545,221.05 935,834,604.27
Deductible losses 1,310,545,221.05 935,834,604.27
Others 25,576,474.96 10,268,706.00
Total 6,352,741,096.71 3,984,833,858.73
Year Closing balance Opening balance
2014 - 276,110,991.95
2015 226,523,907.34 182,277,001.79
2016 227,672,927.08 177,672,927.08
2017 1,588,080,628.77 1,348,130,047.30
2018 1,881,805,475.96 1,054,539,580.34
2019 1,092,536,461.55 -
Total 5,016,619,400.70 3,038,730,548.46
RMB
23、 Other non-current assetsRMB
Item Closing balance Opening balance
Prepayment for land use right 2,262,105,256.43 1,950,000,000.00
Prepayment for investment in JFE(Note) - 1,500,000,000.00
Prepayment for construction equipment 2,169,547,279.35 1,480,977,080.05
Loans due from Bao-Island Enterprise 117,905,780.14 117,905,780.14
Deductible VAT of Zhangjiang Steel - 365,473,992.51
Others 3,290,328.70 3,801,051.70
Total 4,552,848,644.62 5,418,157,904.40
Note: Refer to Note (V), 10 for details.
Item
Closing balance Opening balance
Temporary taxable difference
Deferred tax liabilitiesTemporary taxable
differenceDeferred tax liabilities
Accrued income tax for overseas subsidiaries
2,198,195,918.73 413,994,006.83 2,121,305,146.41 302,407,284.28
Gains from changes in fair values
25,498,100.76 6,374,525.19 40,647.00 10,161.75
Others 10,653,304.33 2,697,929.33 9,629,436.35 2,441,837.36
Total 2,234,347,323.82 423,066,461.35 2,130,975,229.76 304,859,283.39
(2) Details of unrecognized deferred tax assetsRMB
(V) NOTES TO ITEMS IN THE CONSOLIDATED FINANCIAL STATEMENTS – continued
Notes To The Financial Statements– continuedFOR THE YEAR ENDED 31 DECEMBER 2014
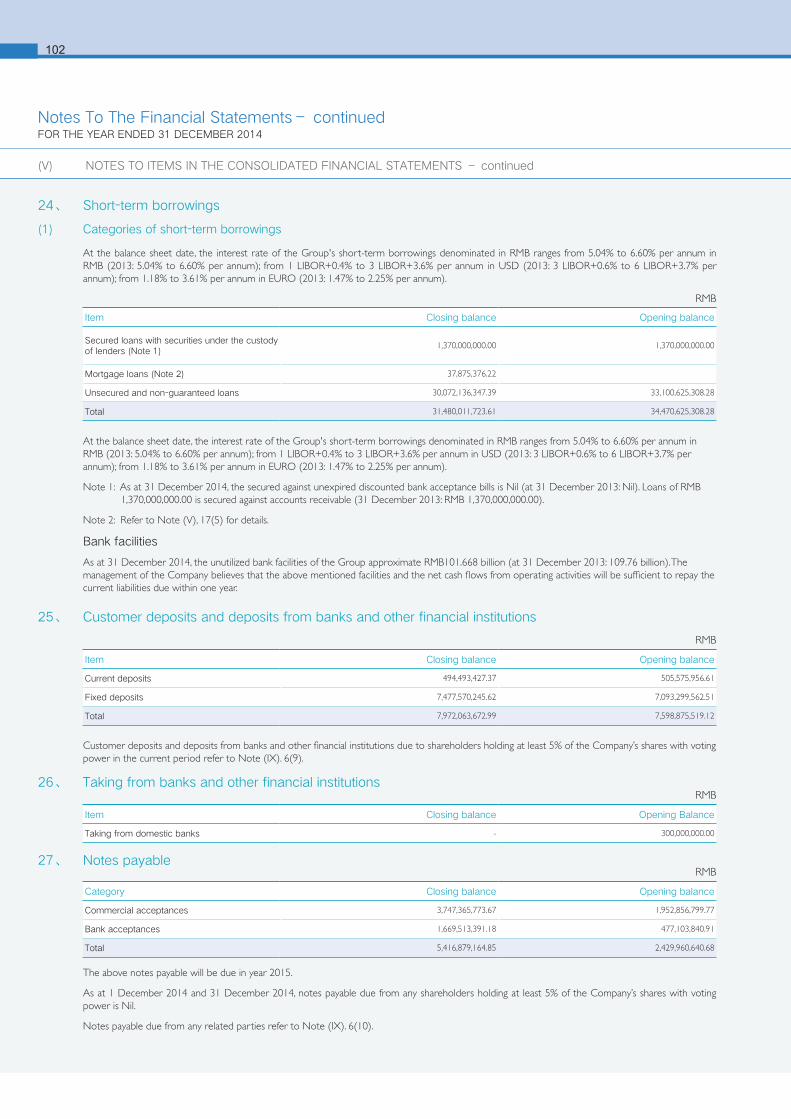
6102
24、 Short-term borrowings
(1) Categories of short-term borrowings
At the balance sheet date, the interest rate of the Group's short-term borrowings denominated in RMB ranges from 5.04% to 6.60% per annum in RMB (2013: 5.04% to 6.60% per annum); from 1 LIBOR+0.4% to 3 LIBOR+3.6% per annum in USD (2013: 3 LIBOR+0.6% to 6 LIBOR+3.7% per annum); from 1.18% to 3.61% per annum in EURO (2013: 1.47% to 2.25% per annum).
At the balance sheet date, the interest rate of the Group's short-term borrowings denominated in RMB ranges from 5.04% to 6.60% per annum in RMB (2013: 5.04% to 6.60% per annum); from 1 LIBOR+0.4% to 3 LIBOR+3.6% per annum in USD (2013: 3 LIBOR+0.6% to 6 LIBOR+3.7% per annum); from 1.18% to 3.61% per annum in EURO (2013: 1.47% to 2.25% per annum).
Note 1: As at 31 December 2014, the secured against unexpired discounted bank acceptance bills is Nil (at 31 December 2013: Nil). Loans of RMB 1,370,000,000.00 is secured against accounts receivable (31 December 2013: RMB 1,370,000,000.00).
Note 2: Refer to Note (V), 17(5) for details.
Bank facilities
As at 31 December 2014, the unutilized bank facilities of the Group approximate RMB101.668 billion (at 31 December 2013: 109.76 billion). The management of the Company believes that the above mentioned facilities and the net cash flows from operating activities will be sufficient to repay the current liabilities due within one year.
RMB
25、 Customer deposits and deposits from banks and other financial institutions
RMB
Customer deposits and deposits from banks and other financial institutions due to shareholders holding at least 5% of the Company’s shares with voting power in the current period refer to Note (IX). 6(9).
Item Closing balance Opening balance
Secured loans with securities under the custody of lenders (Note 1)
1,370,000,000.00 1,370,000,000.00
Mortgage loans (Note 2) 37,875,376.22
Unsecured and non-guaranteed loans 30,072,136,347.39 33,100,625,308.28
Total 31,480,011,723.61 34,470,625,308.28
Item Closing balance Opening balance
Current deposits 494,493,427.37 505,575,956.61
Fixed deposits 7,477,570,245.62 7,093,299,562.51
Total 7,972,063,672.99 7,598,875,519.12
26、 Taking from banks and other financial institutionsRMB
Item Closing balance Opening Balance
Taking from domestic banks - 300,000,000.00
27、 Notes payable
The above notes payable will be due in year 2015.
As at 1 December 2014 and 31 December 2014, notes payable due from any shareholders holding at least 5% of the Company’s shares with voting power is Nil.
Notes payable due from any related parties refer to Note (IX). 6(10).
RMB
Category Closing balance Opening balance
Commercial acceptances 3,747,365,773.67 1,952,856,799.77
Bank acceptances 1,669,513,391.18 477,103,840.91
Total 5,416,879,164.85 2,429,960,640.68
(V) NOTES TO ITEMS IN THE CONSOLIDATED FINANCIAL STATEMENTS – continued
Notes To The Financial Statements– continuedFOR THE YEAR ENDED 31 DECEMBER 2014
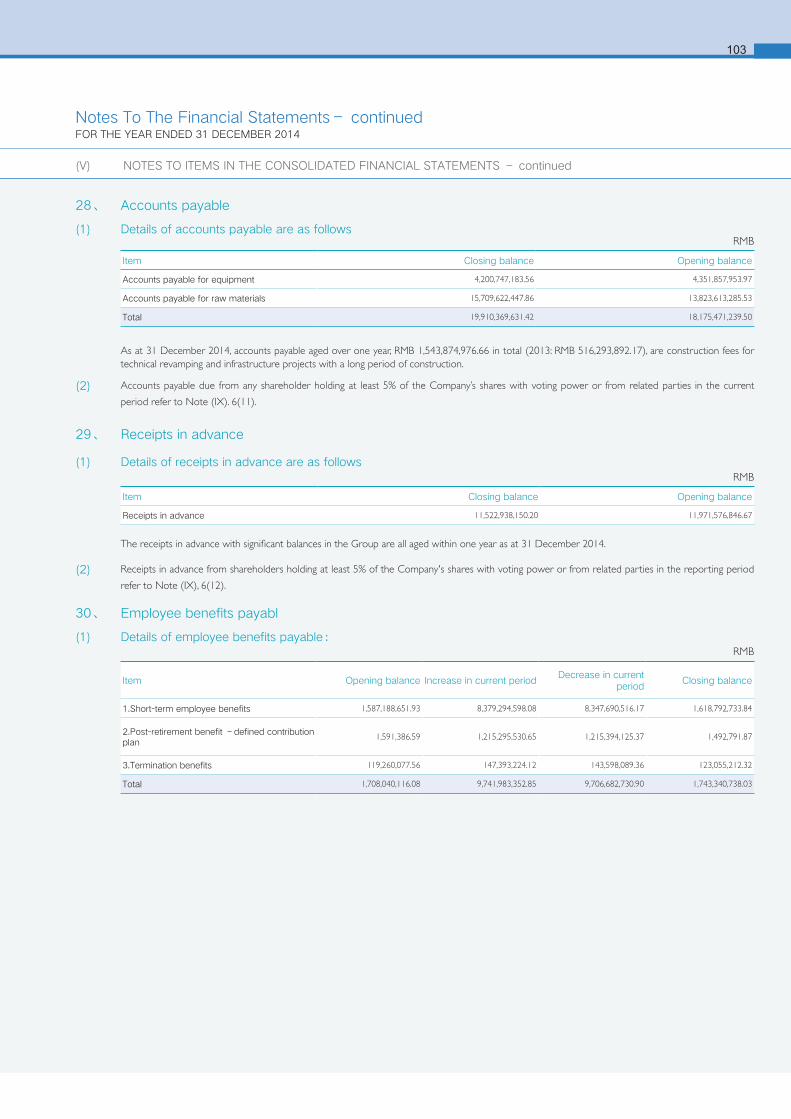
103
Item Closing balance Opening balance
Accounts payable for equipment 4,200,747,183.56 4,351,857,953.97
Accounts payable for raw materials 15,709,622,447.86 13,823,613,285.53
Total 19,910,369,631.42 18,175,471,239.50
Item Closing balance Opening balance
Receipts in advance 11,522,938,150.20 11,971,576,846.67
28、 Accounts payable
(1) Details of accounts payable are as follows
As at 31 December 2014, accounts payable aged over one year, RMB 1,543,874,976.66 in total (2013: RMB 516,293,892.17), are construction fees for technical revamping and infrastructure projects with a long period of construction.
(2) Accounts payable due from any shareholder holding at least 5% of the Company’s shares with voting power or from related parties in the current
period refer to Note (IX). 6(11).
The receipts in advance with significant balances in the Group are all aged within one year as at 31 December 2014.
(2) Receipts in advance from shareholders holding at least 5% of the Company's shares with voting power or from related parties in the reporting period
refer to Note (IX), 6(12).
29、 Receipts in advance
(1) Details of receipts in advance are as follows
RMB
RMB
30、 Employee benefits payabl
(1) Details of employee benefits payable:RMB
Item Opening balance Increase in current periodDecrease in current
periodClosing balance
1.Short-term employee benefits 1,587,188,651.93 8,379,294,598.08 8,347,690,516.17 1,618,792,733.84
2.Post-retirement benefit –defined contribution plan
1,591,386.59 1,215,295,530.65 1,215,394,125.37 1,492,791.87
3.Termination benefits 119,260,077.56 147,393,224.12 143,598,089.36 123,055,212.32
Total 1,708,040,116.08 9,741,983,352.85 9,706,682,730.90 1,743,340,738.03
(V) NOTES TO ITEMS IN THE CONSOLIDATED FINANCIAL STATEMENTS – continued
Notes To The Financial Statements– continuedFOR THE YEAR ENDED 31 DECEMBER 2014
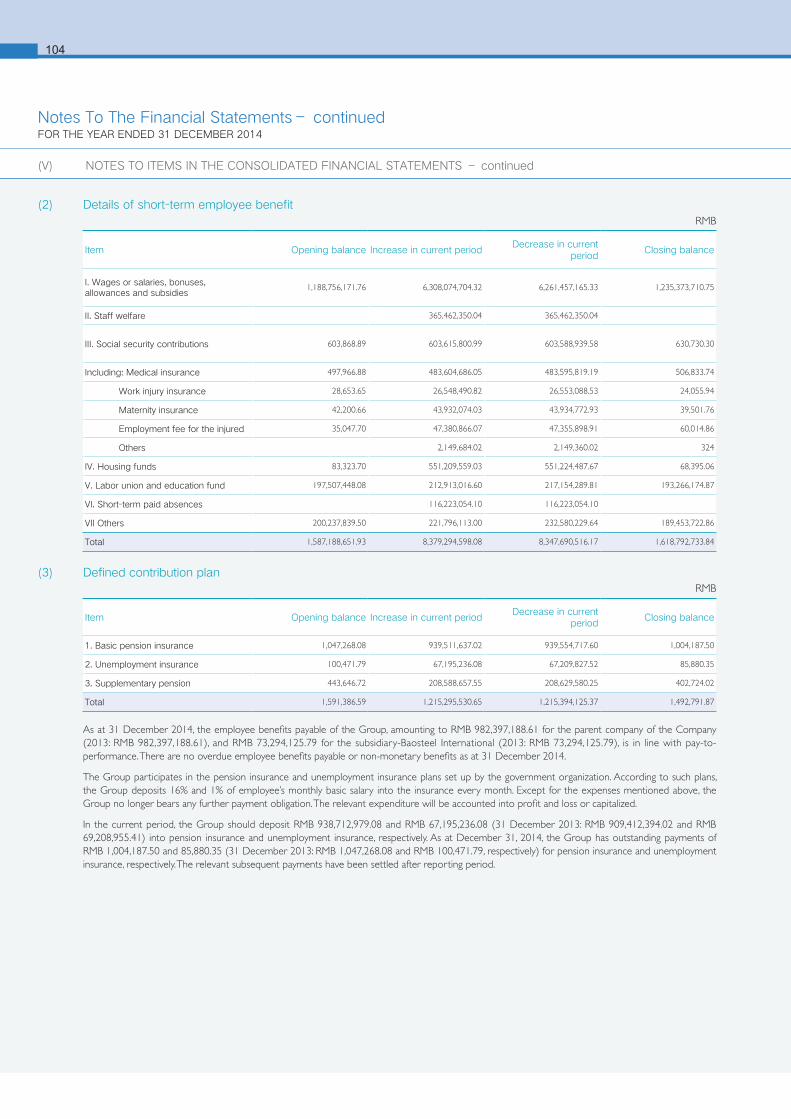
6104
RMB
(2) Details of short-term employee benefit
Item Opening balance Increase in current periodDecrease in current
periodClosing balance
I. Wages or salaries, bonuses, allowances and subsidies
1,188,756,171.76 6,308,074,704.32 6,261,457,165.33 1,235,373,710.75
II. Staff welfare 365,462,350.04 365,462,350.04
III. Social security contributions 603,868.89 603,615,800.99 603,588,939.58 630,730.30
Including: Medical insurance 497,966.88 483,604,686.05 483,595,819.19 506,833.74
Work injury insurance 28,653.65 26,548,490.82 26,553,088.53 24,055.94
Maternity insurance 42,200.66 43,932,074.03 43,934,772.93 39,501.76
Employment fee for the injured 35,047.70 47,380,866.07 47,355,898.91 60,014.86
Others 2,149,684.02 2,149,360.02 324
IV. Housing funds 83,323.70 551,209,559.03 551,224,487.67 68,395.06
V. Labor union and education fund 197,507,448.08 212,913,016.60 217,154,289.81 193,266,174.87
VI. Short-term paid absences 116,223,054.10 116,223,054.10
VII Others 200,237,839.50 221,796,113.00 232,580,229.64 189,453,722.86
Total 1,587,188,651.93 8,379,294,598.08 8,347,690,516.17 1,618,792,733.84
As at 31 December 2014, the employee benefits payable of the Group, amounting to RMB 982,397,188.61 for the parent company of the Company (2013: RMB 982,397,188.61), and RMB 73,294,125.79 for the subsidiary-Baosteel International (2013: RMB 73,294,125.79), is in line with pay-to-performance. There are no overdue employee benefits payable or non-monetary benefits as at 31 December 2014.
The Group participates in the pension insurance and unemployment insurance plans set up by the government organization. According to such plans, the Group deposits 16% and 1% of employee’s monthly basic salary into the insurance every month. Except for the expenses mentioned above, the Group no longer bears any further payment obligation. The relevant expenditure will be accounted into profit and loss or capitalized.
In the current period, the Group should deposit RMB 938,712,979.08 and RMB 67,195,236.08 (31 December 2013: RMB 909,412,394.02 and RMB 69,208,955.41) into pension insurance and unemployment insurance, respectively. As at December 31, 2014, the Group has outstanding payments of RMB 1,004,187.50 and 85,880.35 (31 December 2013: RMB 1,047,268.08 and RMB 100,471.79, respectively) for pension insurance and unemployment insurance, respectively. The relevant subsequent payments have been settled after reporting period.
RMB(3) Defined contribution plan
Item Opening balance Increase in current periodDecrease in current
periodClosing balance
1. Basic pension insurance 1,047,268.08 939,511,637.02 939,554,717.60 1,004,187.50
2. Unemployment insurance 100,471.79 67,195,236.08 67,209,827.52 85,880.35
3. Supplementary pension 443,646.72 208,588,657.55 208,629,580.25 402,724.02
Total 1,591,386.59 1,215,295,530.65 1,215,394,125.37 1,492,791.87
(V) NOTES TO ITEMS IN THE CONSOLIDATED FINANCIAL STATEMENTS – continued
Notes To The Financial Statements– continuedFOR THE YEAR ENDED 31 DECEMBER 2014
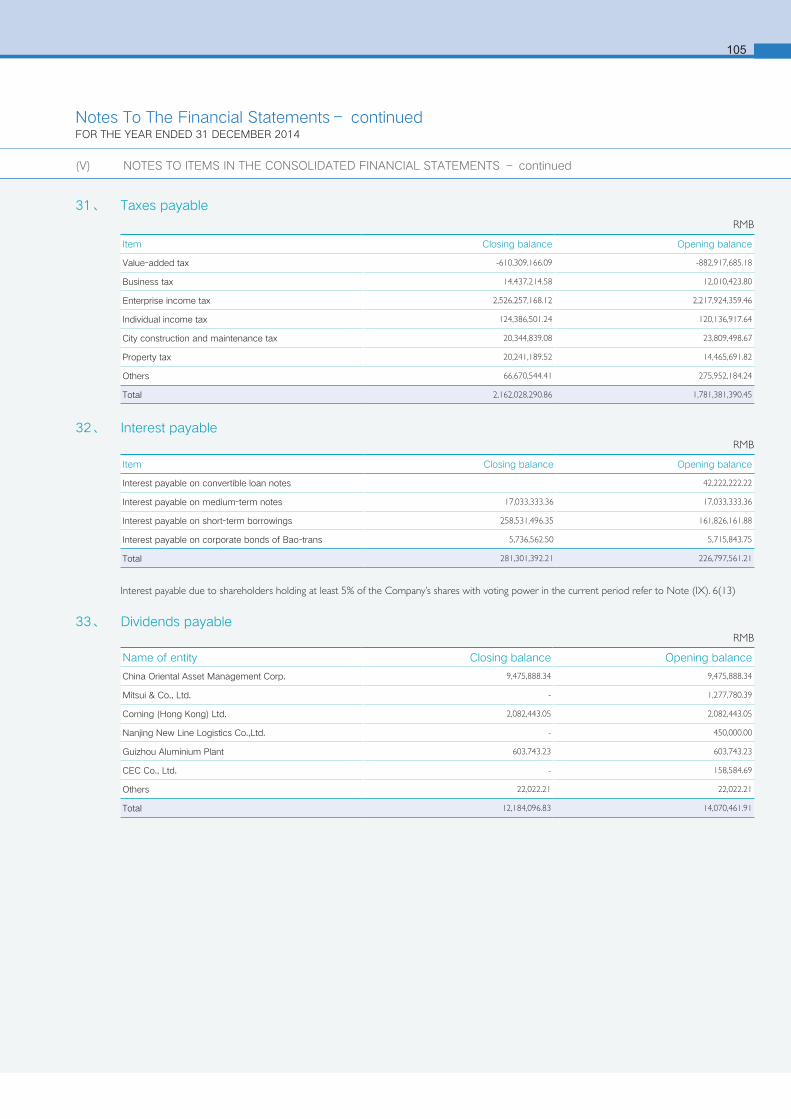
105
31、 Taxes payableRMB
Item Closing balance Opening balance
Value-added tax -610,309,166.09 -882,917,685.18
Business tax 14,437,214.58 12,010,423.80
Enterprise income tax 2,526,257,168.12 2,217,924,359.46
Individual income tax 124,386,501.24 120,136,917.64
City construction and maintenance tax 20,344,839.08 23,809,498.67
Property tax 20,241,189.52 14,465,691.82
Others 66,670,544.41 275,952,184.24
Total 2,162,028,290.86 1,781,381,390.45
32、 Interest payable
Interest payable due to shareholders holding at least 5% of the Company’s shares with voting power in the current period refer to Note (IX). 6(13)
RMB
Item Closing balance Opening balance
Interest payable on convertible loan notes 42,222,222.22
Interest payable on medium-term notes 17,033,333.36 17,033,333.36
Interest payable on short-term borrowings 258,531,496.35 161,826,161.88
Interest payable on corporate bonds of Bao-trans 5,736,562.50 5,715,843.75
Total 281,301,392.21 226,797,561.21
33、 Dividends payableRMB
Name of entity Closing balance Opening balance
China Oriental Asset Management Corp. 9,475,888.34 9,475,888.34
Mitsui & Co., Ltd. - 1,277,780.39
Corning (Hong Kong) Ltd. 2,082,443.05 2,082,443.05
Nanjing New Line Logistics Co.,Ltd. - 450,000.00
Guizhou Aluminium Plant 603,743.23 603,743.23
CEC Co., Ltd. - 158,584.69
Others 22,022.21 22,022.21
Total 12,184,096.83 14,070,461.91
(V) NOTES TO ITEMS IN THE CONSOLIDATED FINANCIAL STATEMENTS – continued
Notes To The Financial Statements– continuedFOR THE YEAR ENDED 31 DECEMBER 2014
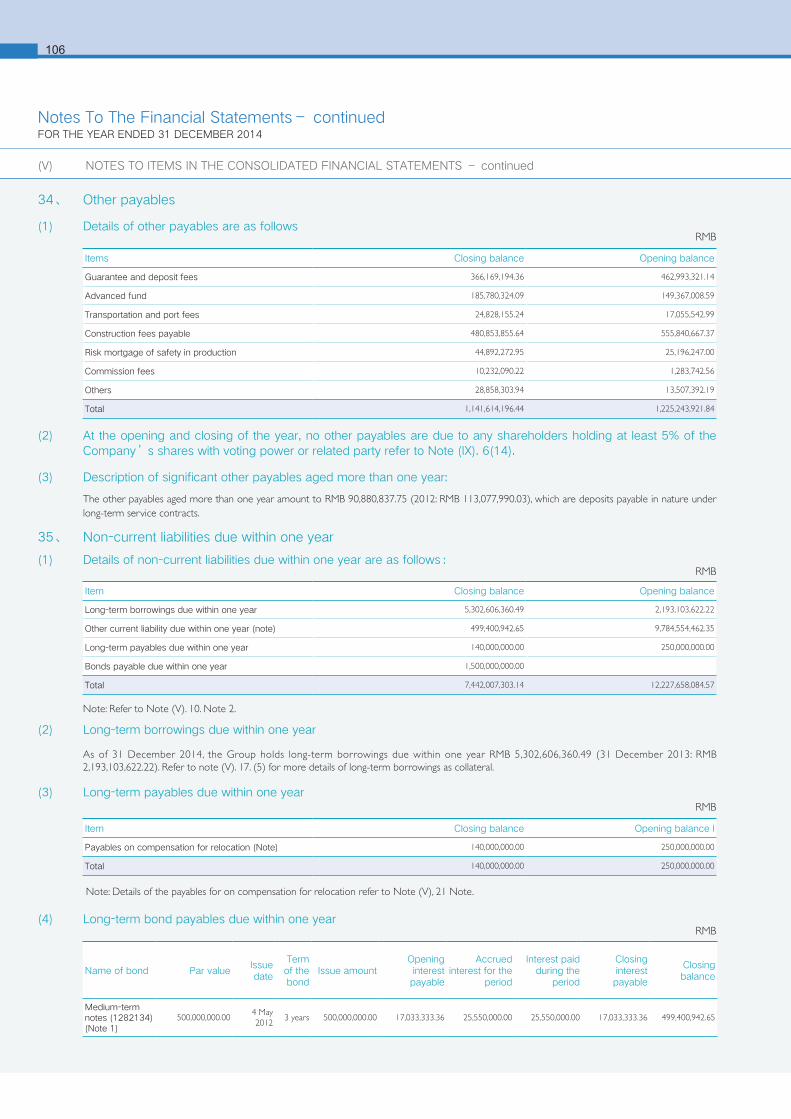
6106
RMB
(2) At the opening and closing of the year, no other payables are due to any shareholders holding at least 5% of the Company’s shares with voting power or related party refer to Note (IX). 6(14).
(3) Description of significant other payables aged more than one year:
The other payables aged more than one year amount to RMB 90,880,837.75 (2012: RMB 113,077,990.03), which are deposits payable in nature under long-term service contracts.
35、 Non-current liabilities due within one year
(1) Details of non-current liabilities due within one year are as follows:
Note: Refer to Note (V). 10. Note 2.
34、 Other payables
(1) Details of other payables are as followsRMB
Items Closing balance Opening balance
Guarantee and deposit fees 366,169,194.36 462,993,321.14
Advanced fund 185,780,324.09 149,367,008.59
Transportation and port fees 24,828,155.24 17,055,542.99
Construction fees payable 480,853,855.64 555,840,667.37
Risk mortgage of safety in production 44,892,272.95 25,196,247.00
Commission fees 10,232,090.22 1,283,742.56
Others 28,858,303.94 13,507,392.19
Total 1,141,614,196.44 1,225,243,921.84
Item Closing balance Opening balance
Long-term borrowings due within one year 5,302,606,360.49 2,193,103,622.22
Other current liability due within one year (note) 499,400,942.65 9,784,554,462.35
Long-term payables due within one year 140,000,000.00 250,000,000.00
Bonds payable due within one year 1,500,000,000.00
Total 7,442,007,303.14 12,227,658,084.57
(2) Long-term borrowings due within one year
As of 31 December 2014, the Group holds long-term borrowings due within one year RMB 5,302,606,360.49 (31 December 2013: RMB 2,193,103,622.22). Refer to note (V). 17. (5) for more details of long-term borrowings as collateral.
(3) Long-term payables due within one year
Item Closing balance Opening balance l
Payables on compensation for relocation (Note) 140,000,000.00 250,000,000.00
Total 140,000,000.00 250,000,000.00
RMB
Note: Details of the payables for on compensation for relocation refer to Note (V), 21 Note.
(4) Long-term bond payables due within one yearRMB
Name of bond Par valueIssue date
Term of the bond
Issue amountOpening interest payable
Accrued interest for the
period
Interest paid during the
period
Closing interest payable
Closing balance
Medium-term notes (1282134) (Note 1)
500,000,000.004 May 2012
3 years 500,000,000.00 17,033,333.36 25,550,000.00 25,550,000.00 17,033,333.36 499,400,942.65
(V) NOTES TO ITEMS IN THE CONSOLIDATED FINANCIAL STATEMENTS – continued
Notes To The Financial Statements– continuedFOR THE YEAR ENDED 31 DECEMBER 2014
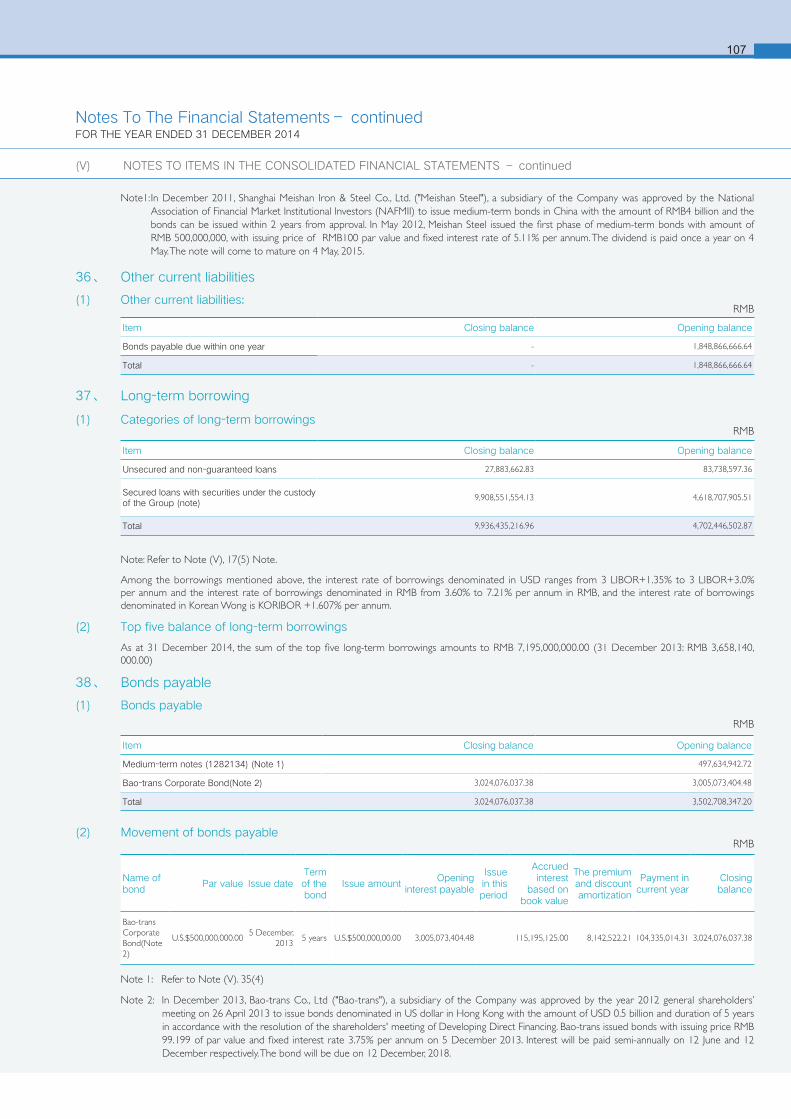
107
Note1: In December 2011, Shanghai Meishan Iron & Steel Co., Ltd. ("Meishan Steel"), a subsidiary of the Company was approved by the National Association of Financial Market Institutional Investors (NAFMII) to issue medium-term bonds in China with the amount of RMB4 billion and the bonds can be issued within 2 years from approval. In May 2012, Meishan Steel issued the first phase of medium-term bonds with amount of RMB 500,000,000, with issuing price of RMB100 par value and fixed interest rate of 5.11% per annum. The dividend is paid once a year on 4 May. The note will come to mature on 4 May, 2015.
36、 Other current liabilities
(1) Other current liabilities:
37、 Long-term borrowing
(1) Categories of long-term borrowings
RMB
Item Closing balance Opening balance
Bonds payable due within one year - 1,848,866,666.64
Total - 1,848,866,666.64
RMB
Item Closing balance Opening balance
Unsecured and non-guaranteed loans 27,883,662.83 83,738,597.36
Secured loans with securities under the custody of the Group (note)
9,908,551,554.13 4,618,707,905.51
Total 9,936,435,216.96 4,702,446,502.87
Item Closing balance Opening balance
Medium-term notes (1282134) (Note 1) 497,634,942.72
Bao-trans Corporate Bond(Note 2) 3,024,076,037.38 3,005,073,404.48
Total 3,024,076,037.38 3,502,708,347.20
Note: Refer to Note (V), 17(5) Note.
Among the borrowings mentioned above, the interest rate of borrowings denominated in USD ranges from 3 LIBOR+1.35% to 3 LIBOR+3.0% per annum and the interest rate of borrowings denominated in RMB from 3.60% to 7.21% per annum in RMB, and the interest rate of borrowings denominated in Korean Wong is KORIBOR +1.607% per annum.
(2) Top five balance of long-term borrowings
As at 31 December 2014, the sum of the top five long-term borrowings amounts to RMB 7,195,000,000.00 (31 December 2013: RMB 3,658,140, 000.00)
38、 Bonds payable
(1) Bonds payable
RMB
(V) NOTES TO ITEMS IN THE CONSOLIDATED FINANCIAL STATEMENTS – continued
(2) Movement of bonds payable
Note 1: Refer to Note (V). 35(4)
Note 2: In December 2013, Bao-trans Co., Ltd ("Bao-trans"), a subsidiary of the Company was approved by the year 2012 general shareholders’ meeting on 26 April 2013 to issue bonds denominated in US dollar in Hong Kong with the amount of USD 0.5 billion and duration of 5 years in accordance with the resolution of the shareholders' meeting of Developing Direct Financing. Bao-trans issued bonds with issuing price RMB 99.199 of par value and fixed interest rate 3.75% per annum on 5 December 2013. Interest will be paid semi-annually on 12 June and 12 December respectively. The bond will be due on 12 December, 2018.
RMB
Name of bond
Par value Issue dateTerm of the bond
Issue amountOpening
interest payable
Issue in this period
Accrued interest
based on book value
The premium and discount amortization
Payment in current year
Closing balance
Bao-trans Corporate Bond(Note 2)
U.S.$500,000,000.00 5 December,
20135 years U.S.$500,000,00.00 3,005,073,404.48 115,195,125.00 8,142,522.21 104,335,014.31 3,024,076,037.38
Notes To The Financial Statements– continuedFOR THE YEAR ENDED 31 DECEMBER 2014
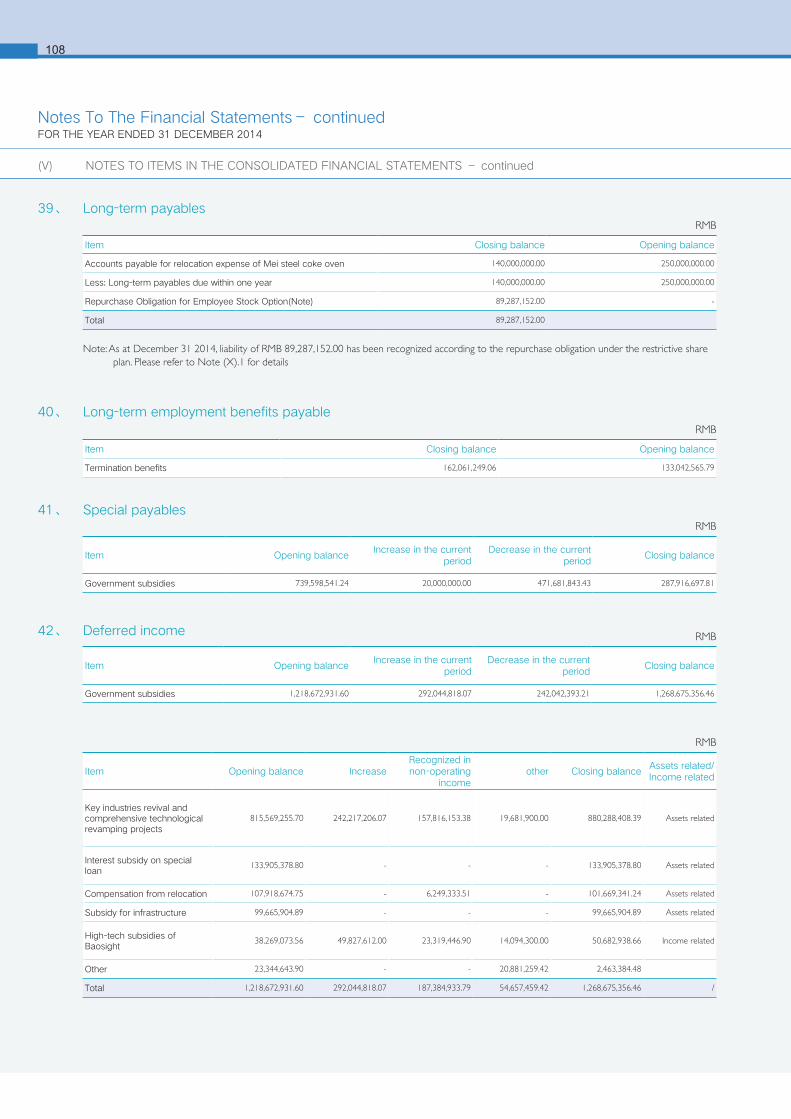
6108
RMB
39、 Long-term payablesRMB
Note: As at December 31 2014, liability of RMB 89,287,152.00 has been recognized according to the repurchase obligation under the restrictive share plan. Please refer to Note (X).1 for details
Item Closing balance Opening balance
Accounts payable for relocation expense of Mei steel coke oven 140,000,000.00 250,000,000.00
Less: Long-term payables due within one year 140,000,000.00 250,000,000.00
Repurchase Obligation for Employee Stock Option(Note) 89,287,152.00 -
Total 89,287,152.00
40、 Long-term employment benefits payable
41、 Special payables
42、 Deferred income
RMB
Item Closing balance Opening balance
Termination benefits 162,061,249.06 133,042,565.79
RMB
RMB
Item Opening balanceIncrease in the current
periodDecrease in the current
periodClosing balance
Government subsidies 739,598,541.24 20,000,000.00 471,681,843.43 287,916,697.81
Item Opening balanceIncrease in the current
periodDecrease in the current
periodClosing balance
Government subsidies 1,218,672,931.60 292,044,818.07 242,042,393.21 1,268,675,356.46
Item Opening balance IncreaseRecognized in non-operating
incomeother Closing balance
Assets related/Income related
Key industries revival and comprehensive technological revamping projects
815,569,255.70 242,217,206.07 157,816,153.38 19,681,900.00 880,288,408.39 Assets related
Interest subsidy on special loan
133,905,378.80 - - - 133,905,378.80 Assets related
Compensation from relocation 107,918,674.75 - 6,249,333.51 - 101,669,341.24 Assets related
Subsidy for infrastructure 99,665,904.89 - - - 99,665,904.89 Assets related
High-tech subsidies of Baosight
38,269,073.56 49,827,612.00 23,319,446.90 14,094,300.00 50,682,938.66 Income related
Other 23,344,643.90 - - 20,881,259.42 2,463,384.48
Total 1,218,672,931.60 292,044,818.07 187,384,933.79 54,657,459.42 1,268,675,356.46 /
(V) NOTES TO ITEMS IN THE CONSOLIDATED FINANCIAL STATEMENTS – continued
Notes To The Financial Statements– continuedFOR THE YEAR ENDED 31 DECEMBER 2014

109
Opening balance
Changes for the period
Closing balanceNew issue of shares
Bonus issue
Capitalization of surplus reserve
Others Subtotal
2014:
I. Shares subject to conditional sales
- - - - 46,747,200.00 46,747,200.00 46,747,200.00
II. Tradable shares - - - - -
1.Ordinary shares denominated in RMB
16,471,724,924.00 - - - -47,446,100.00 -47,446,100.00 16,424,278,824.00
III. Total shares 16,471,724,924.00 - - - -698,900.00 -698,900.00 16,471,026,024.00
2013:
II. Tradable shares
1.Ordinary shares denominated in RMB
17,122,048,088.00 - - - -650,323,164.00 -650,323,164.00 16,471,724,924.00
III. Total shares 17,122,048,088.00 - - - -650,323,164.00 -650,323,164.00 16,471,724,924.00
43、 Other non-current liabilities
Note1: Refer to Note (V). (10) Note 2.
RMB
Item Closing balance Opening balance
Interest free loan from Baosteel Group (Note1) - 1,500,000,000.00
Other 1,902,403.65 74,350.81
Total 1,902,403.65 1,500,074,350.81
44、 Share capital
As at 31 December 2014, the registered and paid-in capital of the Company totals at RMB 16,471,724,924.00 with par value of RMB1.00 each. The share class and structure are set out as follows:
According to “The Board’s Resolution on the motion of repurchase shares of the Company by centralized bidding”, “The notice to creditors about the shares repurchase of Baoshan Iron & Steel Co., Ltd.”, “The 2012 second Resolution of extraordinary shareholders meeting of Baoshan Iron & Steel Co., Ltd.” and the Company’s revised Articles of Association, the Company repurchased A-shares on Shanghai Stock Exchange by centralized bidding with price of no more than RMB 5 per share and amount of no more than RMB5 billion in total. The first repurchase began on 21 September 2012, and the Company has repurchased 414,055,508 shares by the end of 2012. According to the resolution and the Company’s revised Articles of Association, the Company applied for reduction of share capital of RMB0.39 billion, and finished all procedures in China Securities Depository and Clearing Corporation Limited., Shanghai Branch on 20 December 2012. The Company updated all commercial registration in December, 2012, and the updated registered share capital is RMB 17,122,048,088.00 as at 31 December 2012. Deloitte Touche Tohmatsu CPA LLP. has verified the change in share capital and issued the capital verification report.
Up to 21 May 2013, the Company has completed the implementation of the share repurchase scheme, whereby the Company repurchased 1,040,323,164 shares, and the quantity of repurchased shares is 650,323,164 shares after deducting the 390,000,000 cancelled shares. According to the resolution and the Company’s revised Articles of Association, the Company applied for reduction of share capital by RMB 650,323,164 and finished all procedures of cancellation of 650,323,164 shares in China Securities Depository and Clearing Corporation Limited., Shanghai Branch on 23 May 2013. The Company completed the above-mentioned procedures on 24 June, 2013 and the registered capital of the Company was updated to RMB 16,471,724,924.00. The change in registered capital has been verified by Deloitte Touche Tohmatsu CPA LLP.
The share capital of the Company has decreased by 698,900 shares. Please refer to the detailed movement in Note (X). As at 31 December 2014, Baosteel Group held 13,128,825,267 shares of the ordinary shares without selling restrictions, and the equity interest held by Baosteel Group reached 79.71%.
(V) NOTES TO ITEMS IN THE CONSOLIDATED FINANCIAL STATEMENTS – continued
Notes To The Financial Statements– continuedFOR THE YEAR ENDED 31 DECEMBER 2014
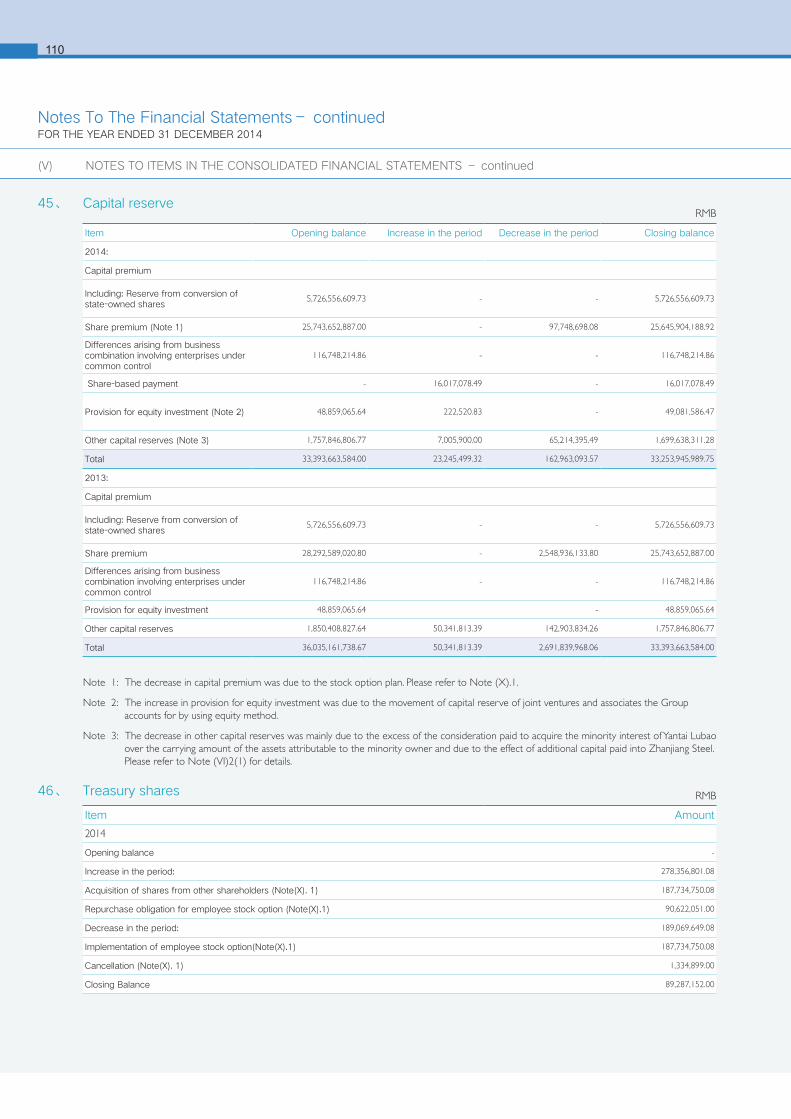
6110
45、 Capital reserve
Note 1: The decrease in capital premium was due to the stock option plan. Please refer to Note (X).1.
Note 2: The increase in provision for equity investment was due to the movement of capital reserve of joint ventures and associates the Group accounts for by using equity method.
Note 3: The decrease in other capital reserves was mainly due to the excess of the consideration paid to acquire the minority interest of Yantai Lubao over the carrying amount of the assets attributable to the minority owner and due to the effect of additional capital paid into Zhanjiang Steel. Please refer to Note (VI)2(1) for details.
46、 Treasury shares
RMB
Item Opening balance Increase in the period Decrease in the period Closing balance
2014:
Capital premium
Including: Reserve from conversion of state-owned shares
5,726,556,609.73 - - 5,726,556,609.73
Share premium (Note 1) 25,743,652,887.00 - 97,748,698.08 25,645,904,188.92
Differences arising from business combination involving enterprises under common control
116,748,214.86 - - 116,748,214.86
Share-based payment - 16,017,078.49 - 16,017,078.49
Provision for equity investment (Note 2) 48,859,065.64 222,520.83 - 49,081,586.47
Other capital reserves (Note 3) 1,757,846,806.77 7,005,900.00 65,214,395.49 1,699,638,311.28
Total 33,393,663,584.00 23,245,499.32 162,963,093.57 33,253,945,989.75
2013:
Capital premium
Including: Reserve from conversion of state-owned shares
5,726,556,609.73 - - 5,726,556,609.73
Share premium 28,292,589,020.80 - 2,548,936,133.80 25,743,652,887.00
Differences arising from business combination involving enterprises under common control
116,748,214.86 - - 116,748,214.86
Provision for equity investment 48,859,065.64 - 48,859,065.64
Other capital reserves 1,850,408,827.64 50,341,813.39 142,903,834.26 1,757,846,806.77
Total 36,035,161,738.67 50,341,813.39 2,691,839,968.06 33,393,663,584.00
RMB
Item Amount
2014
Opening balance -
Increase in the period: 278,356,801.08
Acquisition of shares from other shareholders (Note(X). 1) 187,734,750.08
Repurchase obligation for employee stock option (Note(X).1) 90,622,051.00
Decrease in the period: 189,069,649.08
Implementation of employee stock option(Note(X).1) 187,734,750.08
Cancellation (Note(X). 1) 1,334,899.00
Closing Balance 89,287,152.00
(V) NOTES TO ITEMS IN THE CONSOLIDATED FINANCIAL STATEMENTS – continued
Notes To The Financial Statements– continuedFOR THE YEAR ENDED 31 DECEMBER 2014
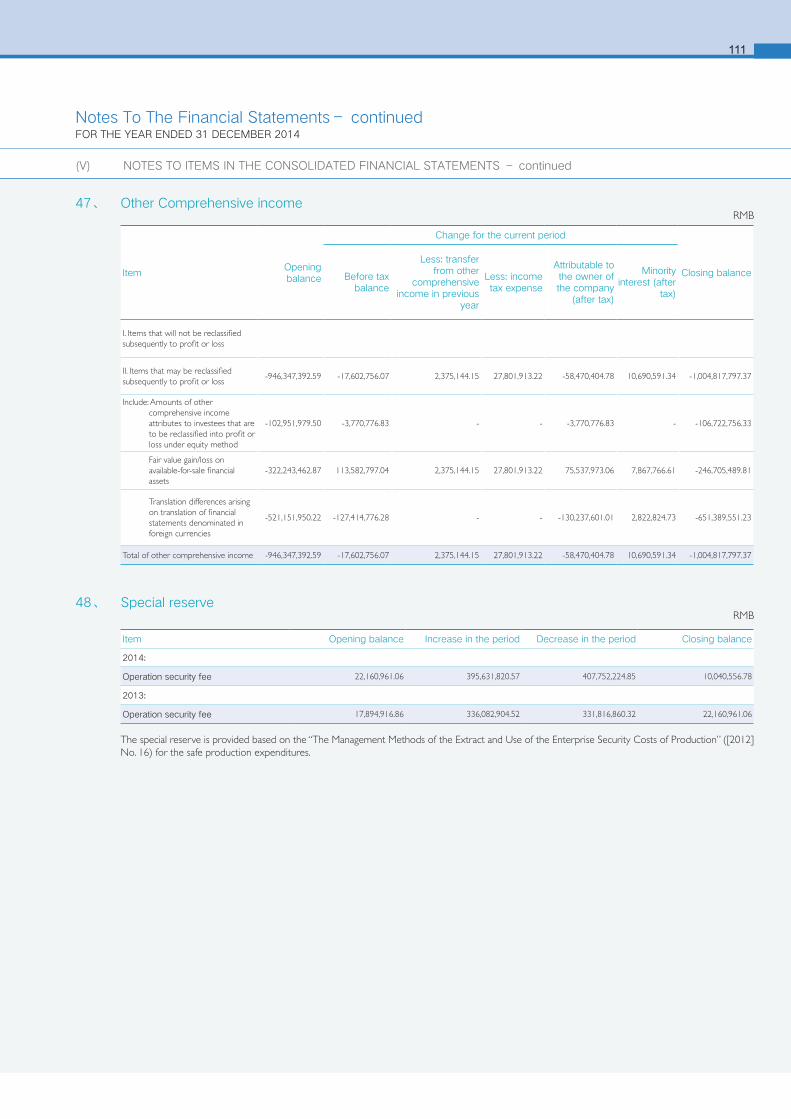
111
47、 Other Comprehensive income
48、 Special reserve
The special reserve is provided based on the “The Management Methods of the Extract and Use of the Enterprise Security Costs of Production” ([2012] No. 16) for the safe production expenditures.
RMB
RMB
Item Opening balance Increase in the period Decrease in the period Closing balance
2014:
Operation security fee 22,160,961.06 395,631,820.57 407,752,224.85 10,040,556.78
2013:
Operation security fee 17,894,916.86 336,082,904.52 331,816,860.32 22,160,961.06
ItemOpening balance
Change for the current period
Closing balanceBefore tax balance
Less: transfer from other
comprehensive income in previous
year
Less: income tax expense
Attributable to the owner of the company
(after tax)
Minority interest (after
tax)
I. Items that will not be reclassified subsequently to profit or loss
II. Items that may be reclassified subsequently to profit or loss
-946,347,392.59 -17,602,756.07 2,375,144.15 27,801,913.22 -58,470,404.78 10,690,591.34 -1,004,817,797.37
Include: Amounts of other comprehensive income attributes to investees that are to be reclassified into profit or loss under equity method
-102,951,979.50 -3,770,776.83 - - -3,770,776.83 - -106,722,756.33
Fair value gain/loss on available-for-sale financial assets
-322,243,462.87 113,582,797.04 2,375,144.15 27,801,913.22 75,537,973.06 7,867,766.61 -246,705,489.81
Translation differences arising on translation of financial statements denominated in foreign currencies
-521,151,950.22 -127,414,776.28 - - -130,237,601.01 2,822,824.73 -651,389,551.23
Total of other comprehensive income -946,347,392.59 -17,602,756.07 2,375,144.15 27,801,913.22 -58,470,404.78 10,690,591.34 -1,004,817,797.37
(V) NOTES TO ITEMS IN THE CONSOLIDATED FINANCIAL STATEMENTS – continued
Notes To The Financial Statements– continuedFOR THE YEAR ENDED 31 DECEMBER 2014
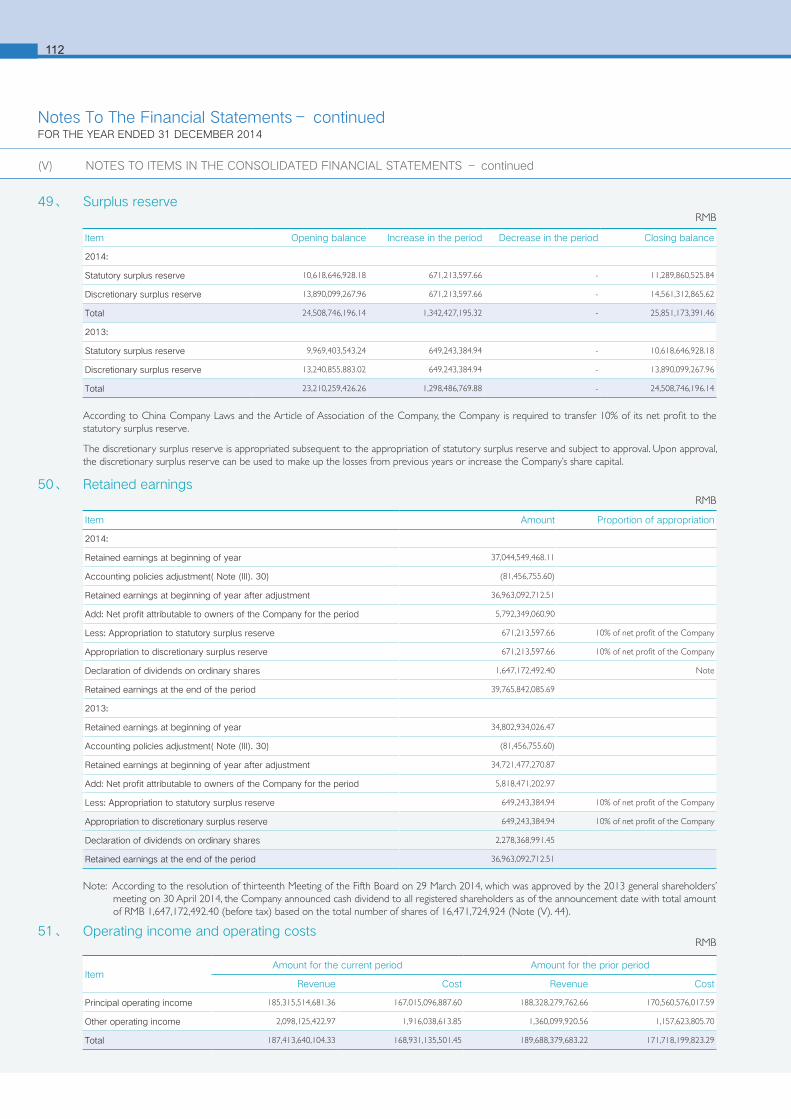
6112
51、 Operating income and operating costsRMB
ItemAmount for the current period Amount for the prior period
Revenue Cost Revenue Cost
Principal operating income 185,315,514,681.36 167,015,096,887.60 188,328,279,762.66 170,560,576,017.59
Other operating income 2,098,125,422.97 1,916,038,613.85 1,360,099,920.56 1,157,623,805.70
Total 187,413,640,104.33 168,931,135,501.45 189,688,379,683.22 171,718,199,823.29
(V) NOTES TO ITEMS IN THE CONSOLIDATED FINANCIAL STATEMENTS – continued
49、 Surplus reserve
According to China Company Laws and the Article of Association of the Company, the Company is required to transfer 10% of its net profit to the statutory surplus reserve.
The discretionary surplus reserve is appropriated subsequent to the appropriation of statutory surplus reserve and subject to approval. Upon approval, the discretionary surplus reserve can be used to make up the losses from previous years or increase the Company’s share capital.
50、 Retained earnings
Note: According to the resolution of thirteenth Meeting of the Fifth Board on 29 March 2014, which was approved by the 2013 general shareholders’ meeting on 30 April 2014, the Company announced cash dividend to all registered shareholders as of the announcement date with total amount of RMB 1,647,172,492.40 (before tax) based on the total number of shares of 16,471,724,924 (Note (V). 44).
RMB
RMB
Item Amount Proportion of appropriation
2014:
Retained earnings at beginning of year 37,044,549,468.11
Accounting policies adjustment( Note (III). 30) (81,456,755.60)
Retained earnings at beginning of year after adjustment 36,963,092,712.51
Add: Net profit attributable to owners of the Company for the period 5,792,349,060.90
Less: Appropriation to statutory surplus reserve 671,213,597.66 10% of net profit of the Company
Appropriation to discretionary surplus reserve 671,213,597.66 10% of net profit of the Company
Declaration of dividends on ordinary shares 1,647,172,492.40 Note
Retained earnings at the end of the period 39,765,842,085.69
2013:
Retained earnings at beginning of year 34,802,934,026.47
Accounting policies adjustment( Note (III). 30) (81,456,755.60)
Retained earnings at beginning of year after adjustment 34,721,477,270.87
Add: Net profit attributable to owners of the Company for the period 5,818,471,202.97
Less: Appropriation to statutory surplus reserve 649,243,384.94 10% of net profit of the Company
Appropriation to discretionary surplus reserve 649,243,384.94 10% of net profit of the Company
Declaration of dividends on ordinary shares 2,278,368,991.45
Retained earnings at the end of the period 36,963,092,712.51
Item Opening balance Increase in the period Decrease in the period Closing balance
2014:
Statutory surplus reserve 10,618,646,928.18 671,213,597.66 - 11,289,860,525.84
Discretionary surplus reserve 13,890,099,267.96 671,213,597.66 - 14,561,312,865.62
Total 24,508,746,196.14 1,342,427,195.32 - 25,851,173,391.46
2013:
Statutory surplus reserve 9,969,403,543.24 649,243,384.94 - 10,618,646,928.18
Discretionary surplus reserve 13,240,855,883.02 649,243,384.94 - 13,890,099,267.96
Total 23,210,259,426.26 1,298,486,769.88 - 24,508,746,196.14
Notes To The Financial Statements– continuedFOR THE YEAR ENDED 31 DECEMBER 2014
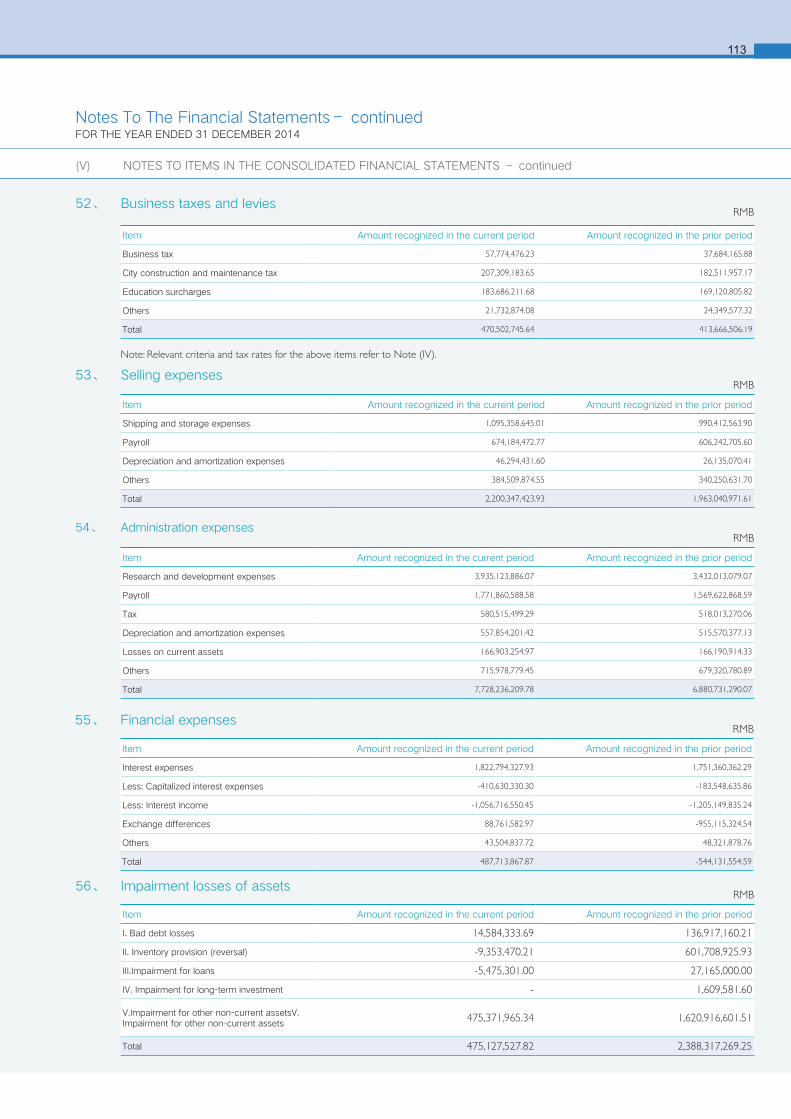
113
55、 Financial expensesRMB
52、 Business taxes and levies
53、 Selling expenses
Note: Relevant criteria and tax rates for the above items refer to Note (IV).
54、 Administration expenses
RMB
RMB
RMB
Item Amount recognized in the current period Amount recognized in the prior period
Shipping and storage expenses 1,095,358,645.01 990,412,563.90
Payroll 674,184,472.77 606,242,705.60
Depreciation and amortization expenses 46,294,431.60 26,135,070.41
Others 384,509,874.55 340,250,631.70
Total 2,200,347,423.93 1,963,040,971.61
Item Amount recognized in the current period Amount recognized in the prior period
Business tax 57,774,476.23 37,684,165.88
City construction and maintenance tax 207,309,183.65 182,511,957.17
Education surcharges 183,686,211.68 169,120,805.82
Others 21,732,874.08 24,349,577.32
Total 470,502,745.64 413,666,506.19
Item Amount recognized in the current period Amount recognized in the prior period
Research and development expenses 3,935,123,886.07 3,432,013,079.07
Payroll 1,771,860,588.58 1,569,622,868.59
Tax 580,515,499.29 518,013,270.06
Depreciation and amortization expenses 557,854,201.42 515,570,377.13
Losses on current assets 166,903,254.97 166,190,914.33
Others 715,978,779.45 679,320,780.89
Total 7,728,236,209.78 6,880,731,290.07
Item Amount recognized in the current period Amount recognized in the prior period
Interest expenses 1,822,794,327.93 1,751,360,362.29
Less: Capitalized interest expenses -410,630,330.30 -183,548,635.86
Less: Interest income -1,056,716,550.45 -1,205,149,835.24
Exchange differences 88,761,582.97 -955,115,324.54
Others 43,504,837.72 48,321,878.76
Total 487,713,867.87 -544,131,554.59
56、 Impairment losses of assetsRMB
Item Amount recognized in the current period Amount recognized in the prior period
I. Bad debt losses 14,584,333.69 136,917,160.21
II. Inventory provision (reversal) -9,353,470.21 601,708,925.93
III.Impairment for loans -5,475,301.00 27,165,000.00
IV. Impairment for long-term investment - 1,609,581.60
V.Impairment for other non-current assetsV. Impairment for other non-current assets 475,371,965.34 1,620,916,601.51
Total 475,127,527.82 2,388,317,269.25
(V) NOTES TO ITEMS IN THE CONSOLIDATED FINANCIAL STATEMENTS – continued
Notes To The Financial Statements– continuedFOR THE YEAR ENDED 31 DECEMBER 2014
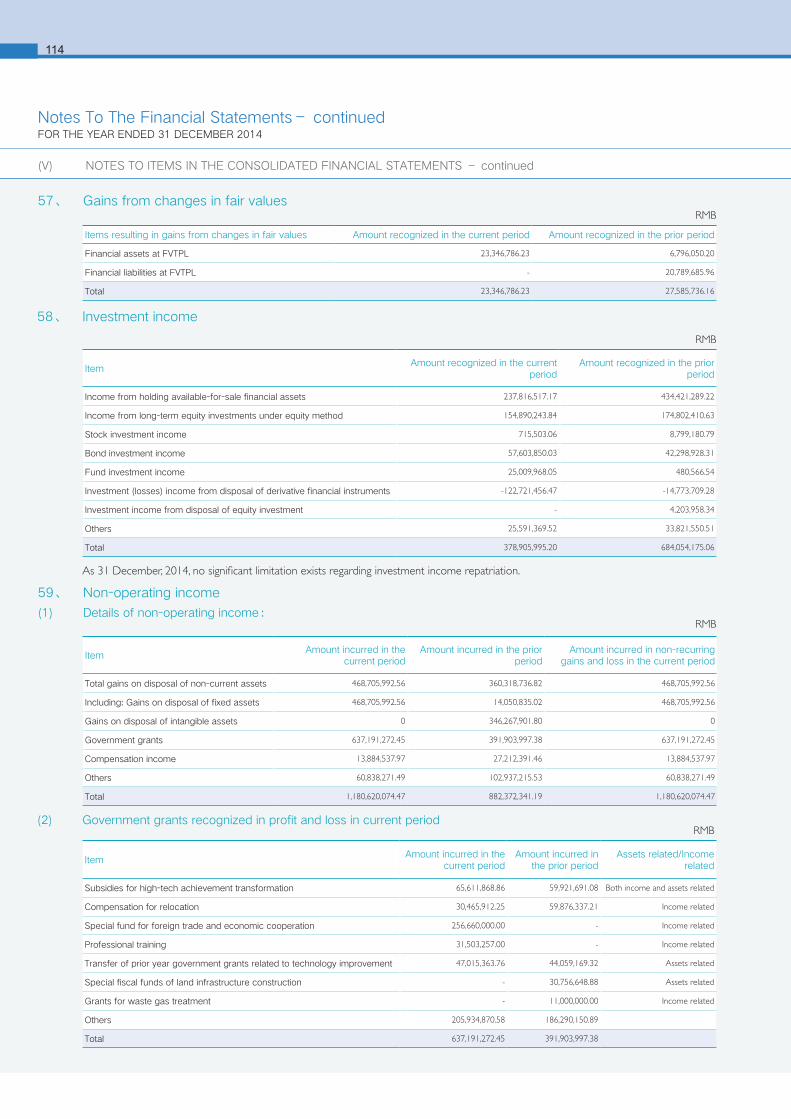
6114
59、 Non-operating income
(1) Details of non-operating income:RMB
ItemAmount incurred in the
current periodAmount incurred in the prior
periodAmount incurred in non-recurring
gains and loss in the current period
Total gains on disposal of non-current assets 468,705,992.56 360,318,736.82 468,705,992.56
Including: Gains on disposal of fixed assets 468,705,992.56 14,050,835.02 468,705,992.56
Gains on disposal of intangible assets 0 346,267,901.80 0
Government grants 637,191,272.45 391,903,997.38 637,191,272.45
Compensation income 13,884,537.97 27,212,391.46 13,884,537.97
Others 60,838,271.49 102,937,215.53 60,838,271.49
Total 1,180,620,074.47 882,372,341.19 1,180,620,074.47
(2) Government grants recognized in profit and loss in current periodRMB
ItemAmount incurred in the
current periodAmount incurred in
the prior periodAssets related/Income
related
Subsidies for high-tech achievement transformation 65,611,868.86 59,921,691.08 Both income and assets related
Compensation for relocation 30,465,912.25 59,876,337.21 Income related
Special fund for foreign trade and economic cooperation 256,660,000.00 - Income related
Professional training 31,503,257.00 - Income related
Transfer of prior year government grants related to technology improvement 47,015,363.76 44,059,169.32 Assets related
Special fiscal funds of land infrastructure construction - 30,756,648.88 Assets related
Grants for waste gas treatment - 11,000,000.00 Income related
Others 205,934,870.58 186,290,150.89
Total 637,191,272.45 391,903,997.38
(V) NOTES TO ITEMS IN THE CONSOLIDATED FINANCIAL STATEMENTS – continued
57、 Gains from changes in fair values
58、 Investment income
As 31 December, 2014, no significant limitation exists regarding investment income repatriation.
RMB
RMB
Items resulting in gains from changes in fair values Amount recognized in the current period Amount recognized in the prior period
Financial assets at FVTPL 23,346,786.23 6,796,050.20
Financial liabilities at FVTPL - 20,789,685.96
Total 23,346,786.23 27,585,736.16
ItemAmount recognized in the current
periodAmount recognized in the prior
period
Income from holding available-for-sale financial assets 237,816,517.17 434,421,289.22
Income from long-term equity investments under equity method 154,890,243.84 174,802,410.63
Stock investment income 715,503.06 8,799,180.79
Bond investment income 57,603,850.03 42,298,928.31
Fund investment income 25,009,968.05 480,566.54
Investment (losses) income from disposal of derivative financial instruments -122,721,456.47 -14,773,709.28
Investment income from disposal of equity investment - 4,203,958.34
Others 25,591,369.52 33,821,550.51
Total 378,905,995.20 684,054,175.06
Notes To The Financial Statements– continuedFOR THE YEAR ENDED 31 DECEMBER 2014
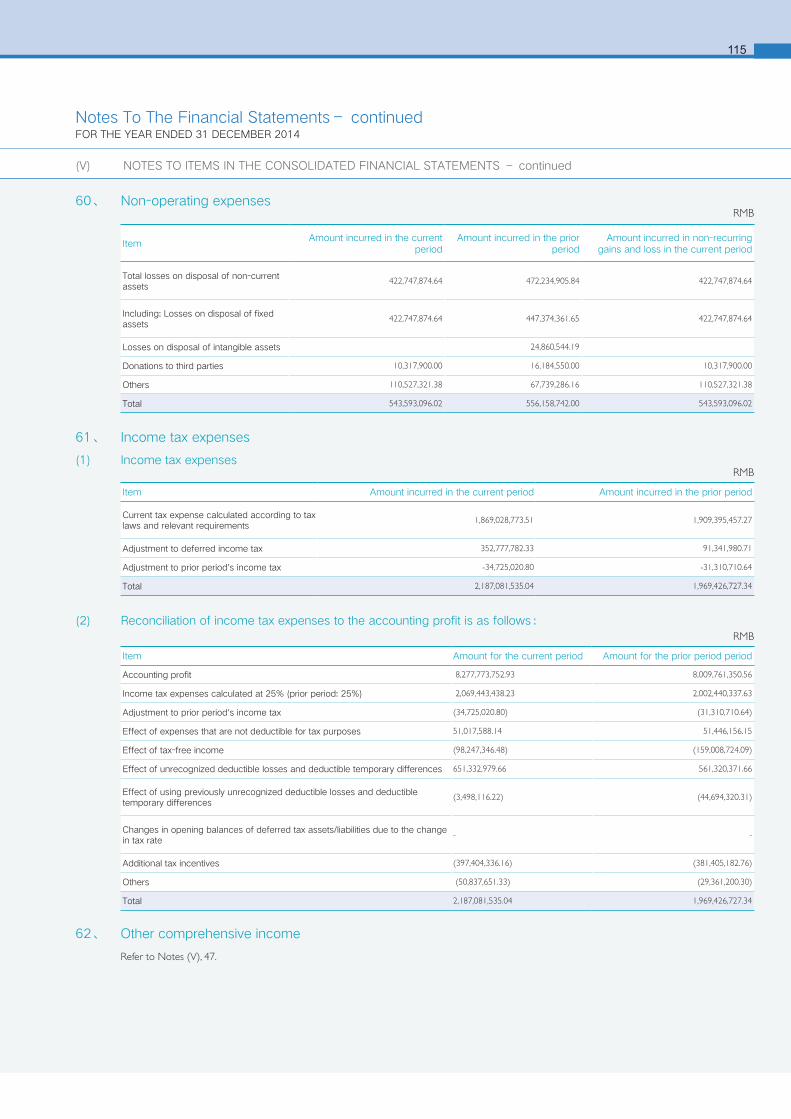
115
(2) Reconciliation of income tax expenses to the accounting profit is as follows:
62、 Other comprehensive income
Refer to Notes (V), 47.
RMB
61、 Income tax expenses
(1) Income tax expenses
60、 Non-operating expensesRMB
ItemAmount incurred in the current
periodAmount incurred in the prior
periodAmount incurred in non-recurring
gains and loss in the current period
Total losses on disposal of non-current assets
422,747,874.64 472,234,905.84 422,747,874.64
Including: Losses on disposal of fixed assets
422,747,874.64 447,374,361.65 422,747,874.64
Losses on disposal of intangible assets 24,860,544.19
Donations to third parties 10,317,900.00 16,184,550.00 10,317,900.00
Others 110,527,321.38 67,739,286.16 110,527,321.38
Total 543,593,096.02 556,158,742.00 543,593,096.02
RMB
Item Amount incurred in the current period Amount incurred in the prior period
Current tax expense calculated according to tax laws and relevant requirements
1,869,028,773.51 1,909,395,457.27
Adjustment to deferred income tax 352,777,782.33 91,341,980.71
Adjustment to prior period's income tax -34,725,020.80 -31,310,710.64
Total 2,187,081,535.04 1,969,426,727.34
Item Amount for the current period Amount for the prior period period
Accounting profit 8,277,773,752.93 8,009,761,350.56
Income tax expenses calculated at 25% (prior period: 25%) 2,069,443,438.23 2,002,440,337.63
Adjustment to prior period's income tax (34,725,020.80) (31,310,710.64)
Effect of expenses that are not deductible for tax purposes 51,017,588.14 51,446,156.15
Effect of tax-free income (98,247,346.48) (159,008,724.09)
Effect of unrecognized deductible losses and deductible temporary differences 651,332,979.66 561,320,371.66
Effect of using previously unrecognized deductible losses and deductible temporary differences
(3,498,116.22) (44,694,320.31)
Changes in opening balances of deferred tax assets/liabilities due to the change in tax rate
- -
Additional tax incentives (397,404,336.16) (381,405,182.76)
Others (50,837,651.33) (29,361,200.30)
Total 2,187,081,535.04 1,969,426,727.34
(V) NOTES TO ITEMS IN THE CONSOLIDATED FINANCIAL STATEMENTS – continued
Notes To The Financial Statements– continuedFOR THE YEAR ENDED 31 DECEMBER 2014

6116
(4) Other cash payments relating to investing activities
(5) Other cash receipts relating to financing activities
Refer to Notes (V), 46.
(3) Other cash receipts relating to investing activitiesRMB
RMB
RMB
Item Amount for the current period Amount for the prior period
Proceeds on disposal of assets and investments in Wusong area
5,471,999,999.96 5,740,942,191.82
Interest income 271,689,381.18 172,566,273.61
Total 5,743,689,381.14 5,913,508,465.43
Item Amount for the current period Amount for the prior period
Cash receipt from restricted stock incentive plan 89,287,152.00 -
Item Amount for the current period Amount for the prior period
Payment for acquisition of equity interests 900,000,000.00
Cash payment upon settlement of derivative instruments 122,851,439.75 24,191,732.71
Total 122,851,439.75 924,191,732.71
(V) NOTES TO ITEMS IN THE CONSOLIDATED FINANCIAL STATEMENTS – continued
63、 Notes to items in the cash flow statement
(1) Other cash receipts relating to operating activitiesRMB
Item Amount for the current period Amount for the prior period
Non-operating income, government grant and etc. 1,549,173,971.38 1,194,948,436.94
(2) Other cash payments relating to operating activitiesRMB
Item Amount for the current period Amount for the prior period
Selling expenses 900,869,565.32 1,099,280,251.62
Administrative expenses 1,101,684,633.98 1,368,390,520.21
Others 139,365,212.79 124,699,027.94
Total 2,141,919,412.09 2,592,369,799.77
Notes To The Financial Statements– continuedFOR THE YEAR ENDED 31 DECEMBER 2014

117
64、 Supplementary information to the cash flow statement
(1) Supplementary information to the cash flow statementRMB
Supplementary information Current period Prior period
1.Reconciliation of net profit to cash flow from operating activities:
Net profit 6,090,692,217.89 6,040,334,623.22
Add: Provision for impairment losses of assets 475,127,527.82 2,388,317,269.25
Depreciation of fixed assets and investment properties 10,207,465,303.50 10,095,998,605.08
Amortization of intangible assets 252,296,237.88 189,392,175.05
Amortization of long-term prepaid expenses 61,040,446.38 30,612,921.36
Losses on disposal of fixed assets, intangible assets and other long-term assets (gains are indicated by "-")
-45,958,117.92 111,916,169.02
Losses on changes in fair values (gains are indicated by "-") -23,346,786.23 -27,585,736.16
Financial expenses (income is indicated by "-") 444,297,742.29 -591,287,147.33
Losses arising from investments (gains are indicated by "-") -378,905,995.20 -684,054,175.06
Decrease in deferred tax assets (increase is indicated by "-") 240,929,342.20 88,407,809.63
Increase in deferred tax liabilities (decrease is indicated by "-") 111,848,440.13 2,934,171.08
Decrease in inventories (increase is indicated by "-") 4,280,992,936.28 -2,816,025,425.18
Decrease in receivables from operating activities (increase is indicated by "-") 3,944,315,077.53 -2,605,556,062.93
Increase in payables from operating activities (decrease is indicated by "-") 2,619,671,566.88 -132,928,562.98
Net cash flow from operating activities 28,280,465,939.43 12,090,476,634.05
2.Net changes in cash and cash equivalents:
Closing balance of cash 10,550,257,587.98 11,507,852,396.93
Less: Opening balance of cash 11,507,852,396.93 7,632,107,621.86
Add: Closing balance of cash equivalents 741,031,995.09 91,000,000.00
Less: Opening balance of cash equivalents 91,000,000.00
Net increase in cash and cash equivalents -307,562,813.86 3,966,744,775.07
(2) Composition of cash and cash equivalents
Cash and cash equivalents exclude restricted cash and cash equivalents of the Company or subsidiaries within the Group.
RMB
Item Closing balance Opening balance
I. Cash 10,550,257,587.98 11,507,852,396.93
Including: Cash on hand 3,220,664.08 862,784.89
Bank deposits 10,490,797,381.05 11,435,799,572.25
Other monetary funds 56,239,542.85 71,190,039.79
II. Cash equivalents 741,031,995.09 91,000,000.00
Including: Funds from monetary market 146,031,995.09 -
III. Closing balance of cash and cash equivalents 11,291,289,583.07 11,598,852,396.93
(V) NOTES TO ITEMS IN THE CONSOLIDATED FINANCIAL STATEMENTS – continued
Notes To The Financial Statements– continuedFOR THE YEAR ENDED 31 DECEMBER 2014
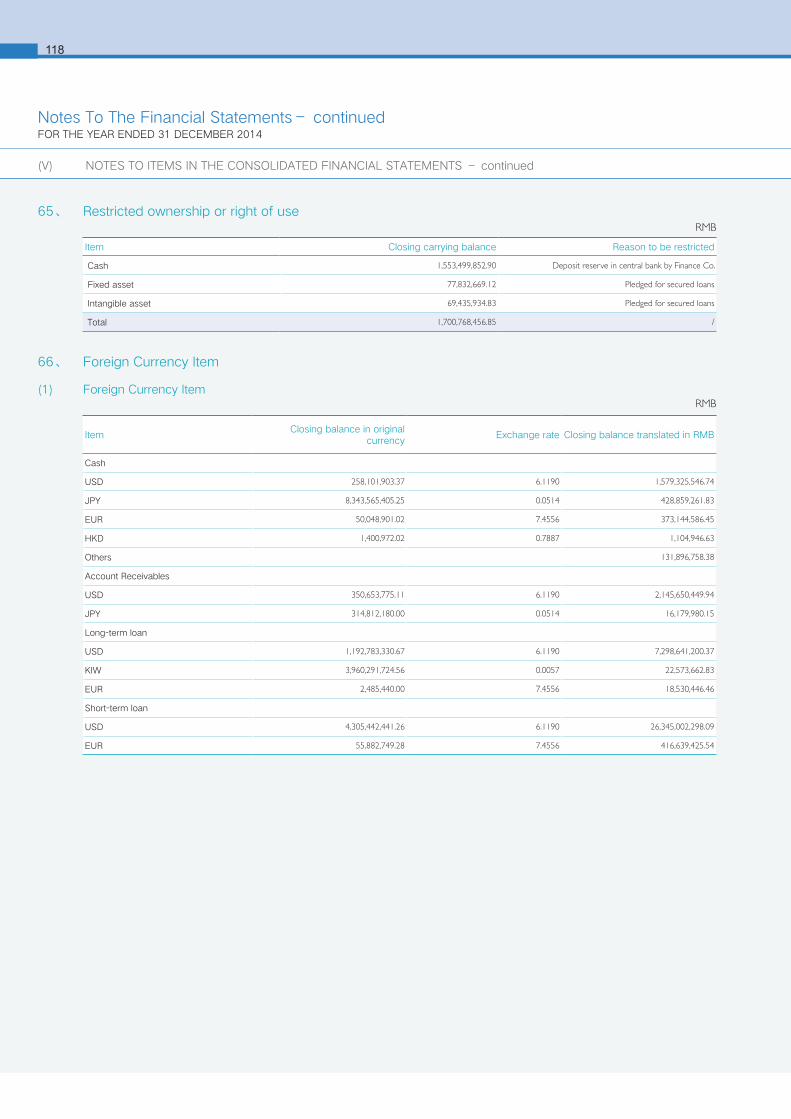
6118
66、 Foreign Currency Item
(1) Foreign Currency Item
65、 Restricted ownership or right of useRMB
Item Closing carrying balance Reason to be restricted
Cash 1,553,499,852.90 Deposit reserve in central bank by Finance Co.
Fixed asset 77,832,669.12 Pledged for secured loans
Intangible asset 69,435,934.83 Pledged for secured loans
Total 1,700,768,456.85 /
RMB
ItemClosing balance in original
currencyExchange rate Closing balance translated in RMB
Cash
USD 258,101,903.37 6.1190 1,579,325,546.74
JPY 8,343,565,405.25 0.0514 428,859,261.83
EUR 50,048,901.02 7.4556 373,144,586.45
HKD 1,400,972.02 0.7887 1,104,946.63
Others 131,896,758.38
Account Receivables
USD 350,653,775.11 6.1190 2,145,650,449.94
JPY 314,812,180.00 0.0514 16,179,980.15
Long-term loan
USD 1,192,783,330.67 6.1190 7,298,641,200.37
KIW 3,960,291,724.56 0.0057 22,573,662.83
EUR 2,485,440.00 7.4556 18,530,446.46
Short-term loan
USD 4,305,442,441.26 6.1190 26,345,002,298.09
EUR 55,882,749.28 7.4556 416,639,425.54
(V) NOTES TO ITEMS IN THE CONSOLIDATED FINANCIAL STATEMENTS – continued
Notes To The Financial Statements– continuedFOR THE YEAR ENDED 31 DECEMBER 2014
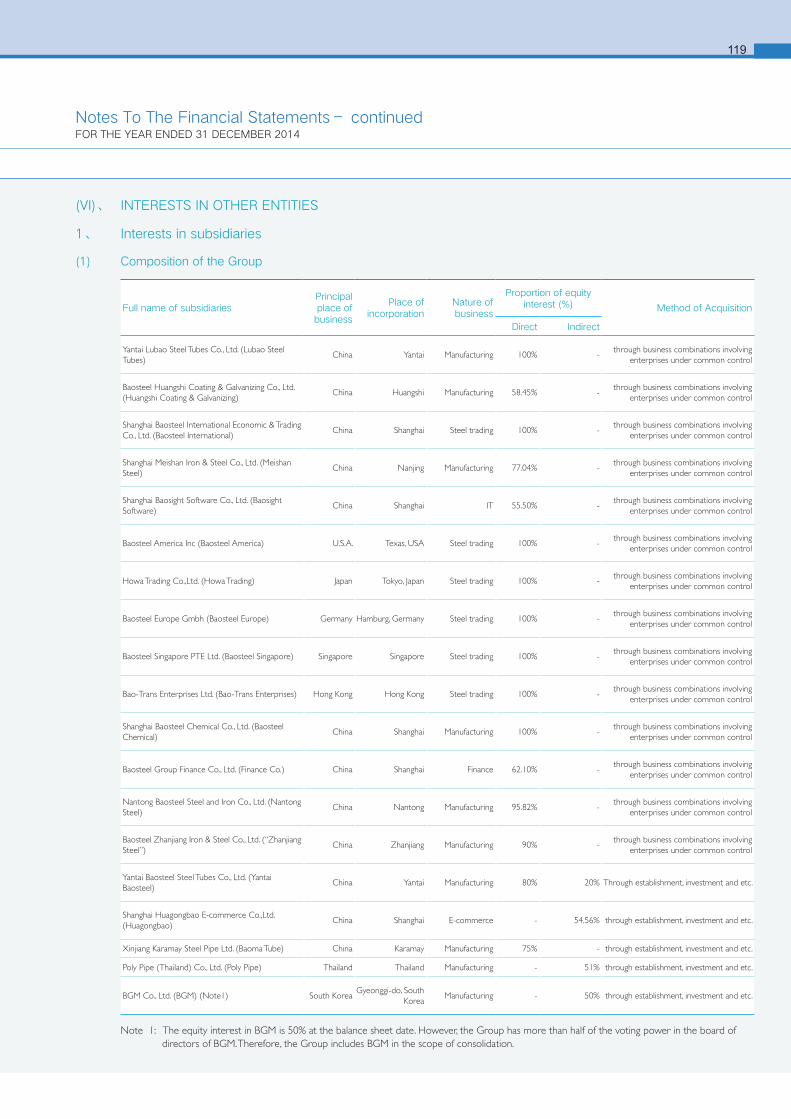
119
(VI)、 INTERESTS IN OTHER ENTITIES
1、 Interests in subsidiaries
(1) Composition of the Group
Note 1: The equity interest in BGM is 50% at the balance sheet date. However, the Group has more than half of the voting power in the board of directors of BGM. Therefore, the Group includes BGM in the scope of consolidation.
Full name of subsidiariesPrincipal place of business
Place of incorporation
Nature of business
Proportion of equity interest (%) Method of Acquisition
Direct Indirect
Yantai Lubao Steel Tubes Co., Ltd. (Lubao Steel Tubes)
China Yantai Manufacturing 100% -through business combinations involving
enterprises under common control
Baosteel Huangshi Coating & Galvanizing Co., Ltd. (Huangshi Coating & Galvanizing)
China Huangshi Manufacturing 58.45% -through business combinations involving
enterprises under common control
Shanghai Baosteel International Economic & Trading Co., Ltd. (Baosteel International)
China Shanghai Steel trading 100% -through business combinations involving
enterprises under common control
Shanghai Meishan Iron & Steel Co., Ltd. (Meishan Steel)
China Nanjing Manufacturing 77.04% -through business combinations involving
enterprises under common control
Shanghai Baosight Software Co., Ltd. (Baosight Software)
China Shanghai IT 55.50% -through business combinations involving
enterprises under common control
Baosteel America Inc (Baosteel America) U.S.A. Texas, USA Steel trading 100% -through business combinations involving
enterprises under common control
Howa Trading Co.,Ltd. (Howa Trading) Japan Tokyo, Japan Steel trading 100% -through business combinations involving
enterprises under common control
Baosteel Europe Gmbh (Baosteel Europe) Germany Hamburg, Germany Steel trading 100% -through business combinations involving
enterprises under common control
Baosteel Singapore PTE Ltd. (Baosteel Singapore) Singapore Singapore Steel trading 100% -through business combinations involving
enterprises under common control
Bao-Trans Enterprises Ltd. (Bao-Trans Enterprises) Hong Kong Hong Kong Steel trading 100% -through business combinations involving
enterprises under common control
Shanghai Baosteel Chemical Co., Ltd. (Baosteel Chemical)
China Shanghai Manufacturing 100% -through business combinations involving
enterprises under common control
Baosteel Group Finance Co., Ltd. (Finance Co.) China Shanghai Finance 62.10% -through business combinations involving
enterprises under common control
Nantong Baosteel Steel and Iron Co., Ltd. (Nantong Steel)
China Nantong Manufacturing 95.82% -through business combinations involving
enterprises under common control
Baosteel Zhanjiang Iron & Steel Co., Ltd. (“Zhanjiang Steel”)
China Zhanjiang Manufacturing 90% -through business combinations involving
enterprises under common control
Yantai Baosteel Steel Tubes Co., Ltd. (Yantai Baosteel)
China Yantai Manufacturing 80% 20% Through establishment, investment and etc.
Shanghai Huagongbao E-commerce Co.,Ltd. (Huagongbao)
China Shanghai E-commerce - 54.56% through establishment, investment and etc.
Xinjiang Karamay Steel Pipe Ltd. (Baoma Tube) China Karamay Manufacturing 75% - through establishment, investment and etc.
Poly Pipe (Thailand) Co., Ltd. (Poly Pipe) Thailand Thailand Manufacturing - 51% through establishment, investment and etc.
BGM Co., Ltd. (BGM) (Note1) South KoreaGyeonggi-do, South
KoreaManufacturing - 50% through establishment, investment and etc.
Notes To The Financial Statements– continuedFOR THE YEAR ENDED 31 DECEMBER 2014
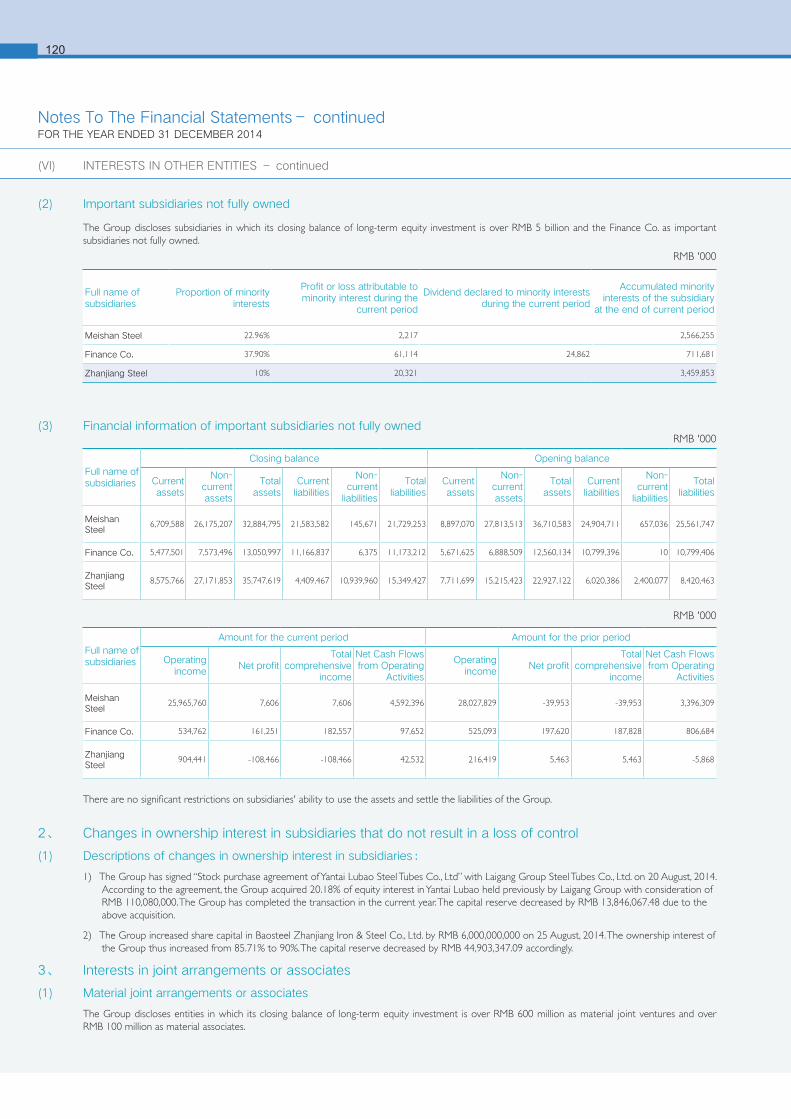
6120
(3) Financial information of important subsidiaries not fully owned
There are no significant restrictions on subsidiaries' ability to use the assets and settle the liabilities of the Group.
2、 Changes in ownership interest in subsidiaries that do not result in a loss of control
(1) Descriptions of changes in ownership interest in subsidiaries:
1) The Group has signed “Stock purchase agreement of Yantai Lubao Steel Tubes Co., Ltd” with Laigang Group Steel Tubes Co., Ltd. on 20 August, 2014. According to the agreement, the Group acquired 20.18% of equity interest in Yantai Lubao held previously by Laigang Group with consideration of RMB 110,080,000. The Group has completed the transaction in the current year. The capital reserve decreased by RMB 13,846,067.48 due to the above acquisition.
2) The Group increased share capital in Baosteel Zhanjiang Iron & Steel Co., Ltd. by RMB 6,000,000,000 on 25 August, 2014. The ownership interest of the Group thus increased from 85.71% to 90%. The capital reserve decreased by RMB 44,903,347.09 accordingly.
3、 Interests in joint arrangements or associates
(1) Material joint arrangements or associates
The Group discloses entities in which its closing balance of long-term equity investment is over RMB 600 million as material joint ventures and over RMB 100 million as material associates.
(2) Important subsidiaries not fully owned
The Group discloses subsidiaries in which its closing balance of long-term equity investment is over RMB 5 billion and the Finance Co. as important subsidiaries not fully owned.
RMB '000
RMB '000
RMB '000
Full name of subsidiaries
Proportion of minority interests
Profit or loss attributable to minority interest during the
current period
Dividend declared to minority interests during the current period
Accumulated minority interests of the subsidiary
at the end of current period
Meishan Steel 22.96% 2,217 2,566,255
Finance Co. 37.90% 61,114 24,862 711,681
Zhanjiang Steel 10% 20,321 3,459,853
Full name of subsidiaries
Closing balance Opening balance
Current assets
Non-current assets
Total assets
Current liabilities
Non-current
liabilities
Total liabilities
Current assets
Non-current assets
Total assets
Current liabilities
Non-current
liabilities
Total liabilities
Meishan Steel
6,709,588 26,175,207 32,884,795 21,583,582 145,671 21,729,253 8,897,070 27,813,513 36,710,583 24,904,711 657,036 25,561,747
Finance Co. 5,477,501 7,573,496 13,050,997 11,166,837 6,375 11,173,212 5,671,625 6,888,509 12,560,134 10,799,396 10 10,799,406
Zhanjiang Steel
8,575,766 27,171,853 35,747,619 4,409,467 10,939,960 15,349,427 7,711,699 15,215,423 22,927,122 6,020,386 2,400,077 8,420,463
Full name of subsidiaries
Amount for the current period Amount for the prior period
Operating income
Net profitTotal
comprehensive income
Net Cash Flows from Operating
Activities
Operating income
Net profitTotal
comprehensive income
Net Cash Flows from Operating
Activities
Meishan Steel
25,965,760 7,606 7,606 4,592,396 28,027,829 -39,953 -39,953 3,396,309
Finance Co. 534,762 161,251 182,557 97,652 525,093 197,620 187,828 806,684
Zhanjiang Steel
904,441 -108,466 -108,466 42,532 216,419 5,463 5,463 -5,868
(VI) INTERESTS IN OTHER ENTITIES – continued
Notes To The Financial Statements– continuedFOR THE YEAR ENDED 31 DECEMBER 2014
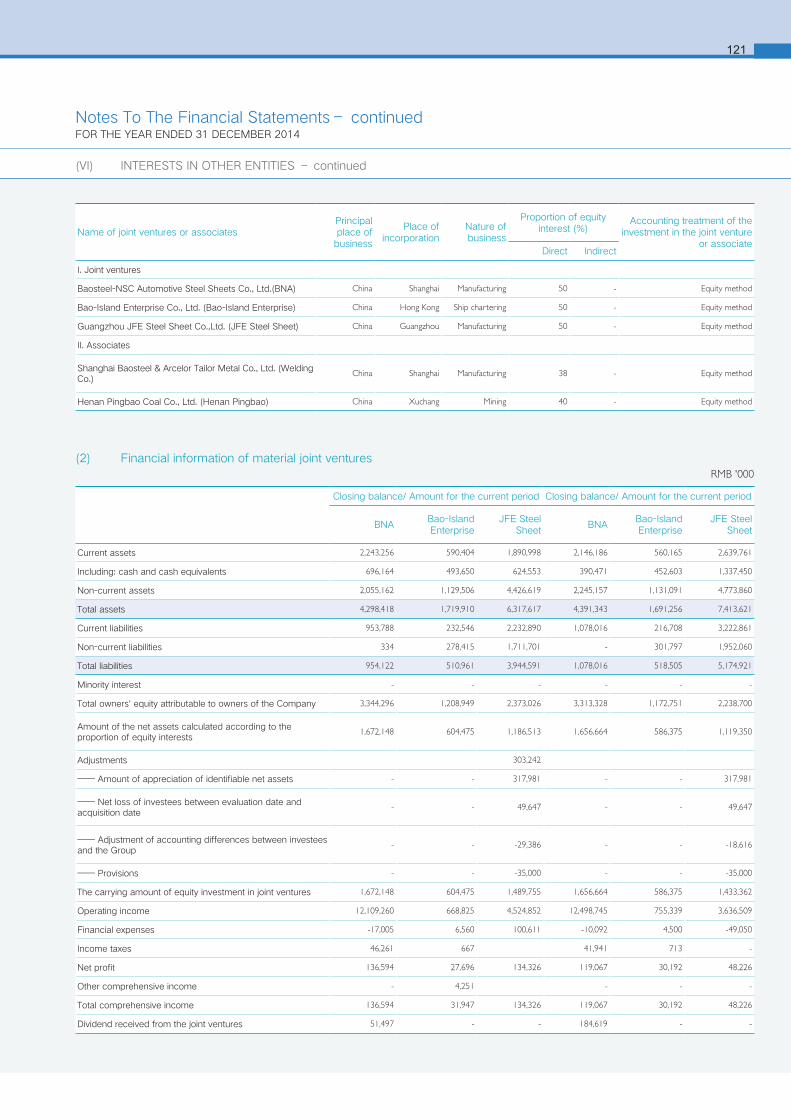
121
(2) Financial information of material joint venturesRMB '000
Name of joint ventures or associatesPrincipal place of business
Place of incorporation
Nature of business
Proportion of equity interest (%)
Accounting treatment of the investment in the joint venture
or associateDirect Indirect
I. Joint ventures
Baosteel-NSC Automotive Steel Sheets Co., Ltd.(BNA) China Shanghai Manufacturing 50 - Equity method
Bao-Island Enterprise Co., Ltd. (Bao-Island Enterprise) China Hong Kong Ship chartering 50 - Equity method
Guangzhou JFE Steel Sheet Co.,Ltd. (JFE Steel Sheet) China Guangzhou Manufacturing 50 - Equity method
II. Associates
Shanghai Baosteel & Arcelor Tailor Metal Co., Ltd. (Welding Co.)
China Shanghai Manufacturing 38 - Equity method
Henan Pingbao Coal Co., Ltd. (Henan Pingbao) China Xuchang Mining 40 - Equity method
Closing balance/ Amount for the current period Closing balance/ Amount for the current period
BNABao-Island Enterprise
JFE Steel Sheet
BNABao-Island Enterprise
JFE Steel Sheet
Current assets 2,243,256 590,404 1,890,998 2,146,186 560,165 2,639,761
Including: cash and cash equivalents 696,164 493,650 624,553 390,471 452,603 1,337,450
Non-current assets 2,055,162 1,129,506 4,426,619 2,245,157 1,131,091 4,773,860
Total assets 4,298,418 1,719,910 6,317,617 4,391,343 1,691,256 7,413,621
Current liabilities 953,788 232,546 2,232,890 1,078,016 216,708 3,222,861
Non-current liabilities 334 278,415 1,711,701 - 301,797 1,952,060
Total liabilities 954,122 510,961 3,944,591 1,078,016 518,505 5,174,921
Minority interest - - - - - -
Total owners' equity attributable to owners of the Company 3,344,296 1,208,949 2,373,026 3,313,328 1,172,751 2,238,700
Amount of the net assets calculated according to the proportion of equity interests
1,672,148 604,475 1,186,513 1,656,664 586,375 1,119,350
Adjustments 303,242
—— Amount of appreciation of identifiable net assets - - 317,981 - - 317,981
—— Net loss of investees between evaluation date and acquisition date
- - 49,647 - - 49,647
—— Adjustment of accounting differences between investees and the Group
- - -29,386 - - -18,616
—— Provisions - - -35,000 - - -35,000
The carrying amount of equity investment in joint ventures 1,672,148 604,475 1,489,755 1,656,664 586,375 1,433,362
Operating income 12,109,260 668,825 4,524,852 12,498,745 755,339 3,636,509
Financial expenses -17,005 6,560 100,611 -10,092 4,500 -49,050
Income taxes 46,261 667 41,941 713 -
Net profit 136,594 27,696 134,326 119,067 30,192 48,226
Other comprehensive income - 4,251 - - -
Total comprehensive income 136,594 31,947 134,326 119,067 30,192 48,226
Dividend received from the joint ventures 51,497 - - 184,619 - -
(VI) INTERESTS IN OTHER ENTITIES – continued
Notes To The Financial Statements– continuedFOR THE YEAR ENDED 31 DECEMBER 2014
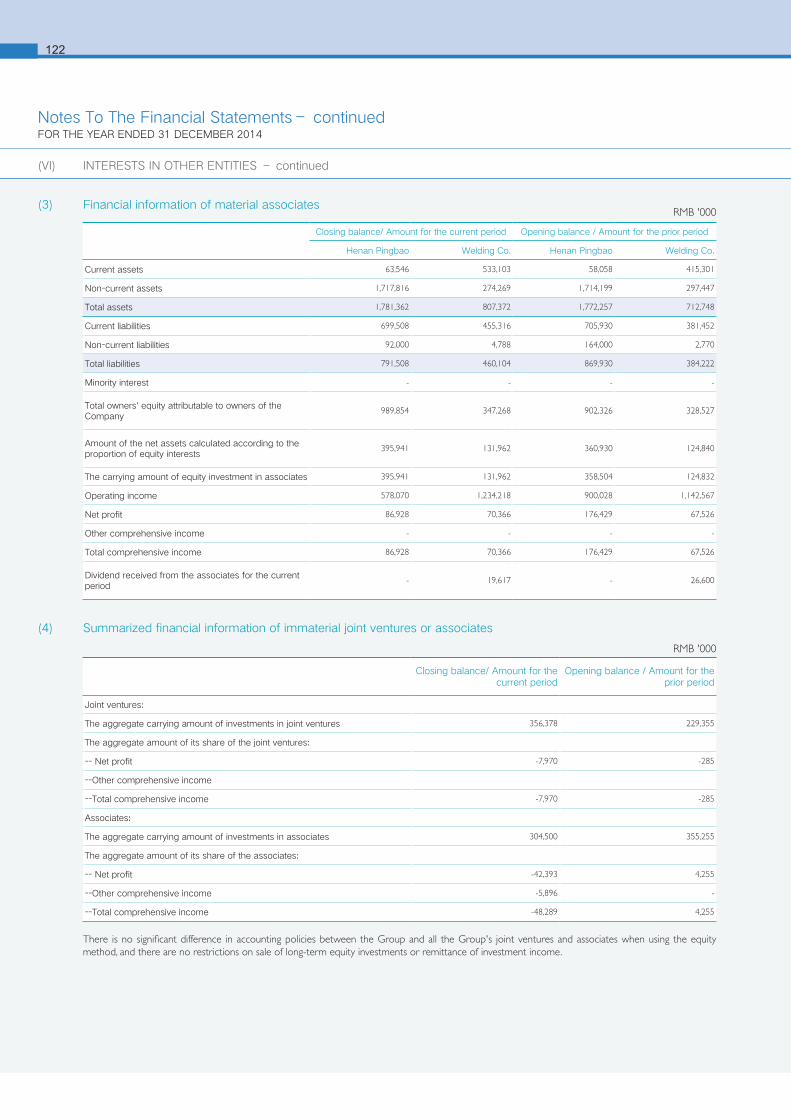
6122
(3) Financial information of material associates
(4) Summarized financial information of immaterial joint ventures or associates
There is no significant difference in accounting policies between the Group and all the Group's joint ventures and associates when using the equity method, and there are no restrictions on sale of long-term equity investments or remittance of investment income.
RMB '000
RMB '000
Closing balance/ Amount for the current period Opening balance / Amount for the prior period
Henan Pingbao Welding Co. Henan Pingbao Welding Co.
Current assets 63,546 533,103 58,058 415,301
Non-current assets 1,717,816 274,269 1,714,199 297,447
Total assets 1,781,362 807,372 1,772,257 712,748
Current liabilities 699,508 455,316 705,930 381,452
Non-current liabilities 92,000 4,788 164,000 2,770
Total liabilities 791,508 460,104 869,930 384,222
Minority interest - - - -
Total owners' equity attributable to owners of the Company
989,854 347,268 902,326 328,527
Amount of the net assets calculated according to the proportion of equity interests
395,941 131,962 360,930 124,840
The carrying amount of equity investment in associates 395,941 131,962 358,504 124,832
Operating income 578,070 1,234,218 900,028 1,142,567
Net profit 86,928 70,366 176,429 67,526
Other comprehensive income - - - -
Total comprehensive income 86,928 70,366 176,429 67,526
Dividend received from the associates for the current period
- 19,617 - 26,600
Closing balance/ Amount for the current period
Opening balance / Amount for the prior period
Joint ventures:
The aggregate carrying amount of investments in joint ventures 356,378 229,355
The aggregate amount of its share of the joint ventures:
-- Net profit -7,970 -285
--Other comprehensive income
--Total comprehensive income -7,970 -285
Associates:
The aggregate carrying amount of investments in associates 304,500 355,255
The aggregate amount of its share of the associates:
-- Net profit -42,393 4,255
--Other comprehensive income -5,896 -
--Total comprehensive income -48,289 4,255
(VI) INTERESTS IN OTHER ENTITIES – continued
Notes To The Financial Statements– continuedFOR THE YEAR ENDED 31 DECEMBER 2014
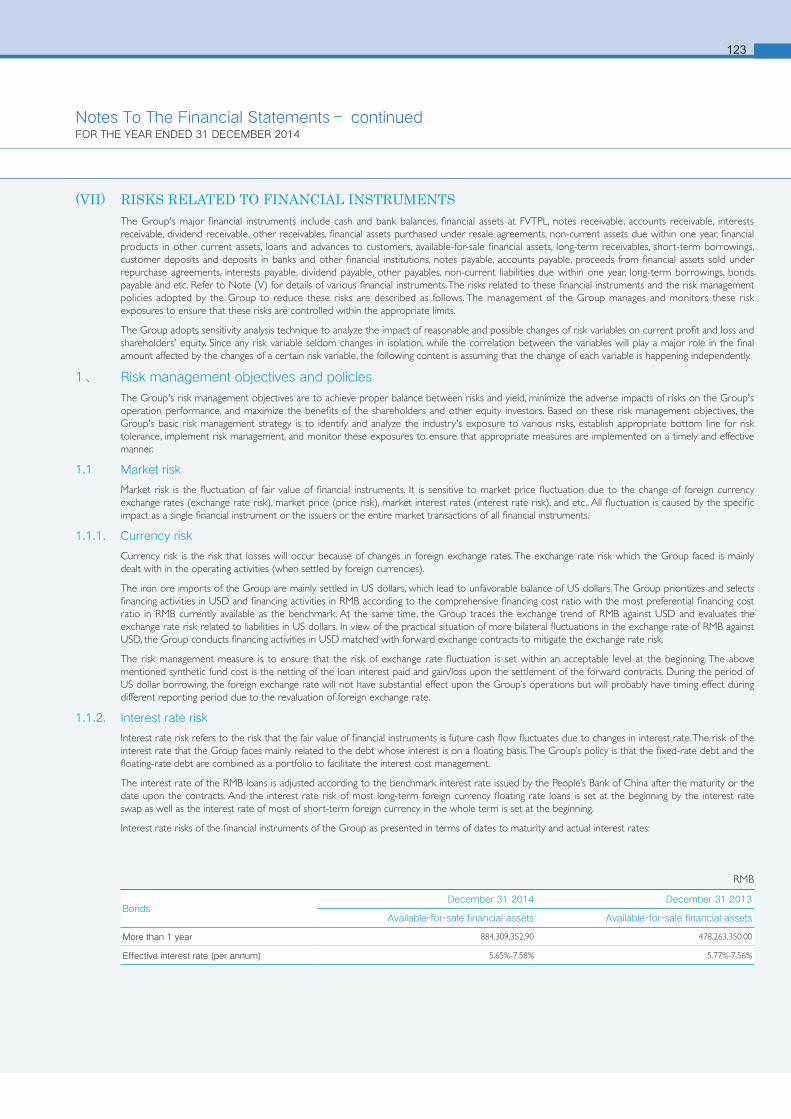
123
(VII) RISKS RELATED TO FINANCIAL INSTRUMENTS The Group's major financial instruments include cash and bank balances, financial assets at FVTPL, notes receivable, accounts receivable, interests receivable, dividend receivable, other receivables, financial assets purchased under resale agreements, non-current assets due within one year, financial products in other current assets, loans and advances to customers, available-for-sale financial assets, long-term receivables, short-term borrowings, customer deposits and deposits in banks and other financial institutions, notes payable, accounts payable, proceeds from financial assets sold under repurchase agreements, interests payable, dividend payable, other payables, non-current liabilities due within one year, long-term borrowings, bonds payable and etc. Refer to Note (V) for details of various financial instruments. The risks related to these financial instruments and the risk management policies adopted by the Group to reduce these risks are described as follows. The management of the Group manages and monitors these risk exposures to ensure that these risks are controlled within the appropriate limits.
The Group adopts sensitivity analysis technique to analyze the impact of reasonable and possible changes of risk variables on current profit and loss and shareholders' equity. Since any risk variable seldom changes in isolation, while the correlation between the variables will play a major role in the final amount affected by the changes of a certain risk variable, the following content is assuming that the change of each variable is happening independently.
1、 Risk management objectives and policies
The Group's risk management objectives are to achieve proper balance between risks and yield, minimize the adverse impacts of risks on the Group's operation performance, and maximize the benefits of the shareholders and other equity investors. Based on these risk management objectives, the Group's basic risk management strategy is to identify and analyze the industry's exposure to various risks, establish appropriate bottom line for risk tolerance, implement risk management, and monitor these exposures to ensure that appropriate measures are implemented on a timely and effective manner.
1.1 Market risk
Market risk is the fluctuation of fair value of financial instruments. It is sensitive to market price fluctuation due to the change of foreign currency exchange rates (exchange rate risk), market price (price risk), market interest rates (interest rate risk), and etc.. All fluctuation is caused by the specific impact as a single financial instrument or the issuers or the entire market transactions of all financial instruments.
1.1.1. Currency risk
Currency risk is the risk that losses will occur because of changes in foreign exchange rates. The exchange rate risk which the Group faced is mainly dealt with in the operating activities (when settled by foreign currencies).
The iron ore imports of the Group are mainly settled in US dollars, which lead to unfavorable balance of US dollars. The Group prioritizes and selects financing activities in USD and financing activities in RMB according to the comprehensive financing cost ratio with the most preferential financing cost ratio in RMB currently available as the benchmark. At the same time, the Group traces the exchange trend of RMB against USD and evaluates the exchange rate risk related to liabilities in US dollars. In view of the practical situation of more bilateral fluctuations in the exchange rate of RMB against USD, the Group conducts financing activities in USD matched with forward exchange contracts to mitigate the exchange rate risk.
The risk management measure is to ensure that the risk of exchange rate fluctuation is set within an acceptable level at the beginning. The above mentioned synthetic fund cost is the netting of the loan interest paid and gain/loss upon the settlement of the forward contracts. During the period of US dollar borrowing, the foreign exchange rate will not have substantial effect upon the Group’s operations but will probably have timing effect during different reporting period due to the revaluation of foreign exchange rate.
1.1.2. Interest rate risk
Interest rate risk refers to the risk that the fair value of financial instruments is future cash flow fluctuates due to changes in interest rate. The risk of the interest rate that the Group faces mainly related to the debt whose interest is on a floating basis. The Group’s policy is that the fixed-rate debt and the floating-rate debt are combined as a portfolio to facilitate the interest cost management.
The interest rate of the RMB loans is adjusted according to the benchmark interest rate issued by the People’s Bank of China after the maturity or the date upon the contracts. And the interest rate risk of most long-term foreign currency floating rate loans is set at the beginning by the interest rate swap as well as the interest rate of most of short-term foreign currency in the whole term is set at the beginning.
Interest rate risks of the financial instruments of the Group as presented in terms of dates to maturity and actual interest rates:
RMB
BondsDecember 31 2014 December 31 2013
Available-for-sale financial assets Available-for-sale financial assets
More than 1 year 884,309,352.90 478,263,350.00
Effective interest rate (per annum) 5.65%-7.58% 5.77%-7.56%
Notes To The Financial Statements– continuedFOR THE YEAR ENDED 31 DECEMBER 2014
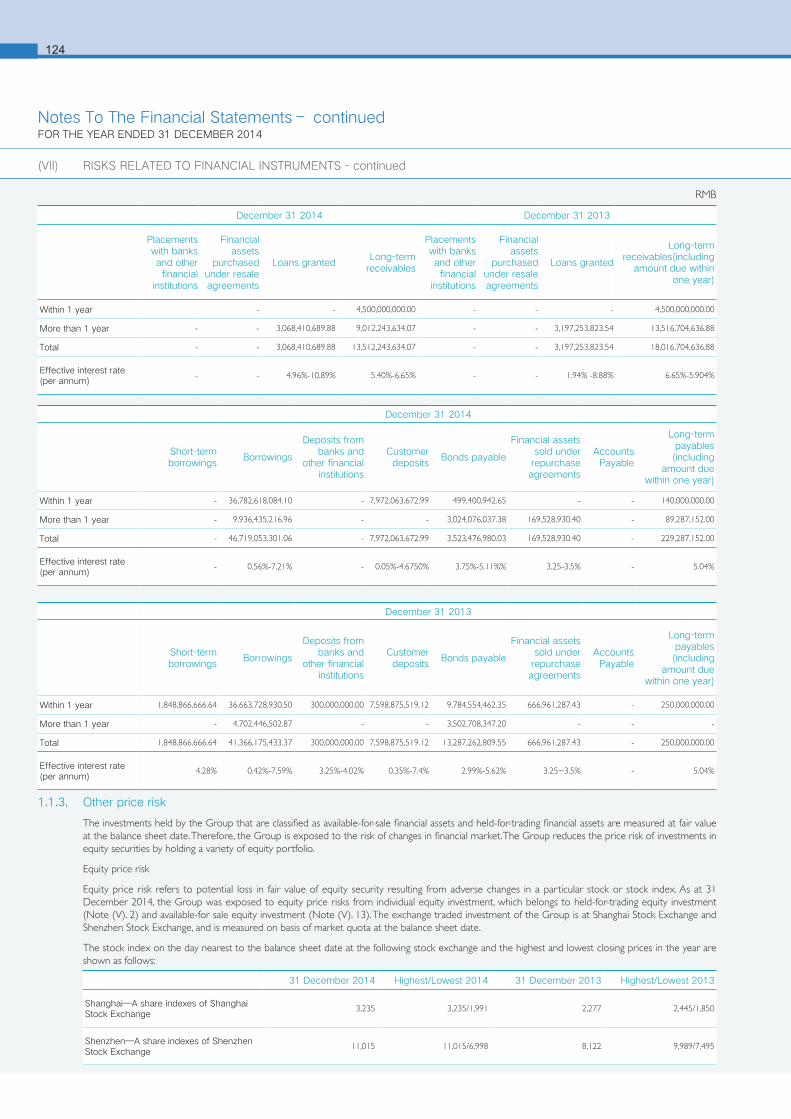
6124
1.1.3. Other price risk
The investments held by the Group that are classified as available-for-sale financial assets and held-for-trading financial assets are measured at fair value at the balance sheet date. Therefore, the Group is exposed to the risk of changes in financial market. The Group reduces the price risk of investments in equity securities by holding a variety of equity portfolio.
Equity price risk
Equity price risk refers to potential loss in fair value of equity security resulting from adverse changes in a particular stock or stock index. As at 31 December 2014, the Group was exposed to equity price risks from individual equity investment, which belongs to held-for-trading equity investment (Note (V). 2) and available-for sale equity investment (Note (V). 13). The exchange traded investment of the Group is at Shanghai Stock Exchange and Shenzhen Stock Exchange, and is measured on basis of market quota at the balance sheet date.
The stock index on the day nearest to the balance sheet date at the following stock exchange and the highest and lowest closing prices in the year are shown as follows:
RMB
December 31 2014 December 31 2013
Placements with banks and other financial
institutions
Financial assets
purchased under resale agreements
Loans grantedLong-term
receivables
Placements with banks and other financial
institutions
Financial assets
purchased under resale agreements
Loans granted
Long-term receivables(including
amount due within one year)
Within 1 year - - 4,500,000,000.00 - - - 4,500,000,000.00
More than 1 year - - 3,068,410,689.88 9,012,243,634.07 - - 3,197,253,823.54 13,516,704,636.88
Total - - 3,068,410,689.88 13,512,243,634.07 - - 3,197,253,823.54 18,016,704,636.88
Effective interest rate (per annum)
- - 4.96%-10.89% 5.40%-6.65% - - 1.94% -8.88% 6.65%-5.904%
December 31 2014
Short-term borrowings
Borrowings
Deposits from banks and
other financial institutions
Customer deposits
Bonds payable
Financial assets sold under
repurchase agreements
Accounts Payable
Long-term payables(including
amount due within one year)
Within 1 year - 36,782,618,084.10 - 7,972,063,672.99 499,400,942.65 - - 140,000,000.00
More than 1 year - 9,936,435,216.96 - - 3,024,076,037.38 169,528,930.40 - 89,287,152.00
Total - 46,719,053,301.06 - 7,972,063,672.99 3,523,476,980.03 169,528,930.40 - 229,287,152.00
Effective interest rate (per annum)
- 0.56%-7.21% - 0.05%-4.6750% 3.75%-5.11%% 3.25-3.5% - 5.04%
December 31 2013
Short-term borrowings
Borrowings
Deposits from banks and
other financial institutions
Customer deposits
Bonds payable
Financial assets sold under
repurchase agreements
Accounts Payable
Long-term payables(including
amount due within one year)
Within 1 year 1,848,866,666.64 36,663,728,930.50 300,000,000.00 7,598,875,519.12 9,784,554,462.35 666,961,287.43 - 250,000,000.00
More than 1 year - 4,702,446,502.87 - - 3,502,708,347.20 - - -
Total 1,848,866,666.64 41,366,175,433.37 300,000,000.00 7,598,875,519.12 13,287,262,809.55 666,961,287.43 - 250,000,000.00
Effective interest rate (per annum)
4.28% 0.42%-7.59% 3.25%-4.02% 0.35%-7.4% 2.99%-5.62% 3.25~3.5% - 5.04%
31 December 2014 Highest/Lowest 2014 31 December 2013 Highest/Lowest 2013
Shanghai—A share indexes of Shanghai Stock Exchange
3,235 3,235/1,991 2,277 2,445/1,850
Shenzhen—A share indexes of Shenzhen Stock Exchange
11,015 11,015/6,998 8,122 9,989/7,495
Notes To The Financial Statements– continuedFOR THE YEAR ENDED 31 DECEMBER 2014
(VII) RISKS RELATED TO FINANCIAL INSTRUMENTS - continued
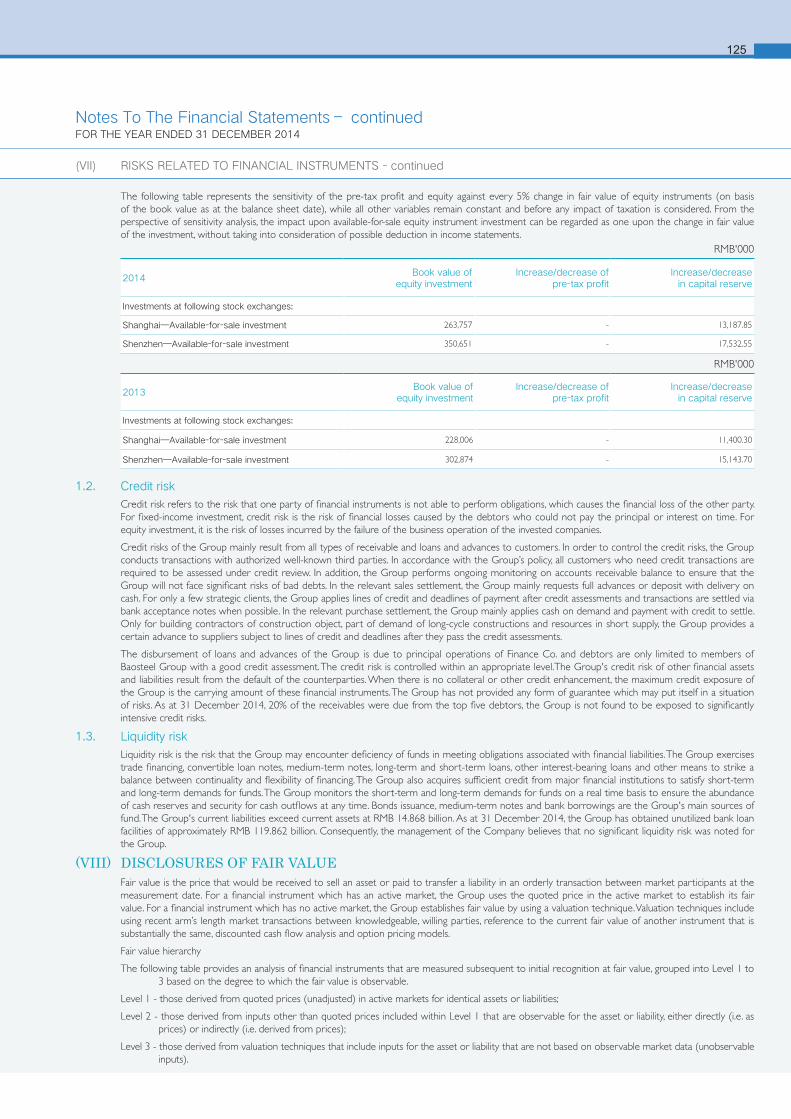
125
The following table represents the sensitivity of the pre-tax profit and equity against every 5% change in fair value of equity instruments (on basis of the book value as at the balance sheet date), while all other variables remain constant and before any impact of taxation is considered. From the perspective of sensitivity analysis, the impact upon available-for-sale equity instrument investment can be regarded as one upon the change in fair value of the investment, without taking into consideration of possible deduction in income statements.
1.2. Credit risk
Credit risk refers to the risk that one party of financial instruments is not able to perform obligations, which causes the financial loss of the other party. For fixed-income investment, credit risk is the risk of financial losses caused by the debtors who could not pay the principal or interest on time. For equity investment, it is the risk of losses incurred by the failure of the business operation of the invested companies.
Credit risks of the Group mainly result from all types of receivable and loans and advances to customers. In order to control the credit risks, the Group conducts transactions with authorized well-known third parties. In accordance with the Group’s policy, all customers who need credit transactions are required to be assessed under credit review. In addition, the Group performs ongoing monitoring on accounts receivable balance to ensure that the Group will not face significant risks of bad debts. In the relevant sales settlement, the Group mainly requests full advances or deposit with delivery on cash. For only a few strategic clients, the Group applies lines of credit and deadlines of payment after credit assessments and transactions are settled via bank acceptance notes when possible. In the relevant purchase settlement, the Group mainly applies cash on demand and payment with credit to settle. Only for building contractors of construction object, part of demand of long-cycle constructions and resources in short supply, the Group provides a certain advance to suppliers subject to lines of credit and deadlines after they pass the credit assessments.
The disbursement of loans and advances of the Group is due to principal operations of Finance Co. and debtors are only limited to members of Baosteel Group with a good credit assessment. The credit risk is controlled within an appropriate level.The Group's credit risk of other financial assets and liabilities result from the default of the counterparties. When there is no collateral or other credit enhancement, the maximum credit exposure of the Group is the carrying amount of these financial instruments. The Group has not provided any form of guarantee which may put itself in a situation of risks. As at 31 December 2014, 20% of the receivables were due from the top five debtors, the Group is not found to be exposed to significantly intensive credit risks.
1.3. Liquidity risk
Liquidity risk is the risk that the Group may encounter deficiency of funds in meeting obligations associated with financial liabilities. The Group exercises trade financing, convertible loan notes, medium-term notes, long-term and short-term loans, other interest-bearing loans and other means to strike a balance between continuality and flexibility of financing. The Group also acquires sufficient credit from major financial institutions to satisfy short-term and long-term demands for funds. The Group monitors the short-term and long-term demands for funds on a real time basis to ensure the abundance of cash reserves and security for cash outflows at any time. Bonds issuance, medium-term notes and bank borrowings are the Group's main sources of fund. The Group's current liabilities exceed current assets at RMB 14.868 billion. As at 31 December 2014, the Group has obtained unutilized bank loan facilities of approximately RMB 119.862 billion. Consequently, the management of the Company believes that no significant liquidity risk was noted for the Group.
(VIII) DISCLOSURES OF FAIR VALUEFair value is the price that would be received to sell an asset or paid to transfer a liability in an orderly transaction between market participants at the measurement date. For a financial instrument which has an active market, the Group uses the quoted price in the active market to establish its fair value. For a financial instrument which has no active market, the Group establishes fair value by using a valuation technique. Valuation techniques include using recent arm’s length market transactions between knowledgeable, willing parties, reference to the current fair value of another instrument that is substantially the same, discounted cash flow analysis and option pricing models.
Fair value hierarchy
The following table provides an analysis of financial instruments that are measured subsequent to initial recognition at fair value, grouped into Level 1 to 3 based on the degree to which the fair value is observable.
Level 1 - those derived from quoted prices (unadjusted) in active markets for identical assets or liabilities;
Level 2 - those derived from inputs other than quoted prices included within Level 1 that are observable for the asset or liability, either directly (i.e. as prices) or indirectly (i.e. derived from prices);
Level 3 - those derived from valuation techniques that include inputs for the asset or liability that are not based on observable market data (unobservable inputs).
2014Book value of
equity investmentIncrease/decrease of
pre-tax profitIncrease/decrease
in capital reserve
Investments at following stock exchanges:
Shanghai—Available-for-sale investment 263,757 - 13,187.85
Shenzhen—Available-for-sale investment 350,651 - 17,532.55
2013Book value of
equity investmentIncrease/decrease of
pre-tax profitIncrease/decrease
in capital reserve
Investments at following stock exchanges:
Shanghai—Available-for-sale investment 228,006 - 11,400.30
Shenzhen—Available-for-sale investment 302,874 - 15,143.70
RMB'000
RMB'000
Notes To The Financial Statements– continuedFOR THE YEAR ENDED 31 DECEMBER 2014
(VII) RISKS RELATED TO FINANCIAL INSTRUMENTS - continued
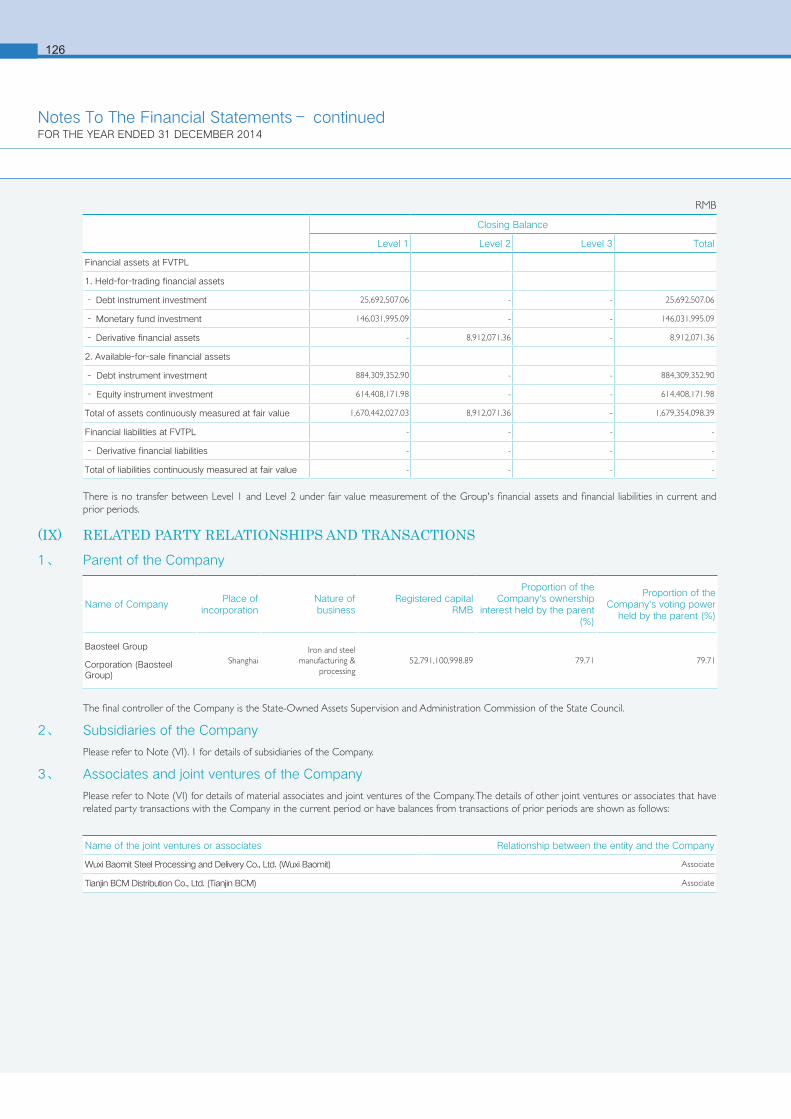
6126
There is no transfer between Level 1 and Level 2 under fair value measurement of the Group's financial assets and financial liabilities in current and prior periods.
(IX) RELATED PARTY RELATIONSHIPS AND TRANSACTIONS1、 Parent of the Company
The final controller of the Company is the State-Owned Assets Supervision and Administration Commission of the State Council.
2、 Subsidiaries of the Company
Please refer to Note (VI). 1 for details of subsidiaries of the Company.
3、 Associates and joint ventures of the Company
Please refer to Note (VI) for details of material associates and joint ventures of the Company. The details of other joint ventures or associates that have related party transactions with the Company in the current period or have balances from transactions of prior periods are shown as follows:
Closing Balance
Level 1 Level 2 Level 3 Total
Financial assets at FVTPL
1. Held-for-trading financial assets
- Debt instrument investment 25,692,507.06 - - 25,692,507.06
- Monetary fund investment 146,031,995.09 - - 146,031,995.09
- Derivative financial assets - 8,912,071.36 - 8,912,071.36
2. Available-for-sale financial assets
- Debt instrument investment 884,309,352.90 - - 884,309,352.90
- Equity instrument investment 614,408,171.98 - - 614,408,171.98
Total of assets continuously measured at fair value 1,670,442,027.03 8,912,071.36 - 1,679,354,098.39
Financial liabilities at FVTPL - - - -
- Derivative financial liabilities - - - -
Total of liabilities continuously measured at fair value - - - -
Name of the joint ventures or associates Relationship between the entity and the Company
Wuxi Baomit Steel Processing and Delivery Co., Ltd. (Wuxi Baomit) Associate
Tianjin BCM Distribution Co., Ltd. (Tianjin BCM) Associate
RMB
Name of CompanyPlace of
incorporationNature of business
Registered capitalRMB
Proportion of the Company's ownership
interest held by the parent (%)
Proportion of the Company's voting power
held by the parent (%)
Baosteel Group
Corporation (Baosteel Group)
ShanghaiIron and steel
manufacturing & processing
52,791,100,998.89 79.71 79.71
Notes To The Financial Statements– continuedFOR THE YEAR ENDED 31 DECEMBER 2014
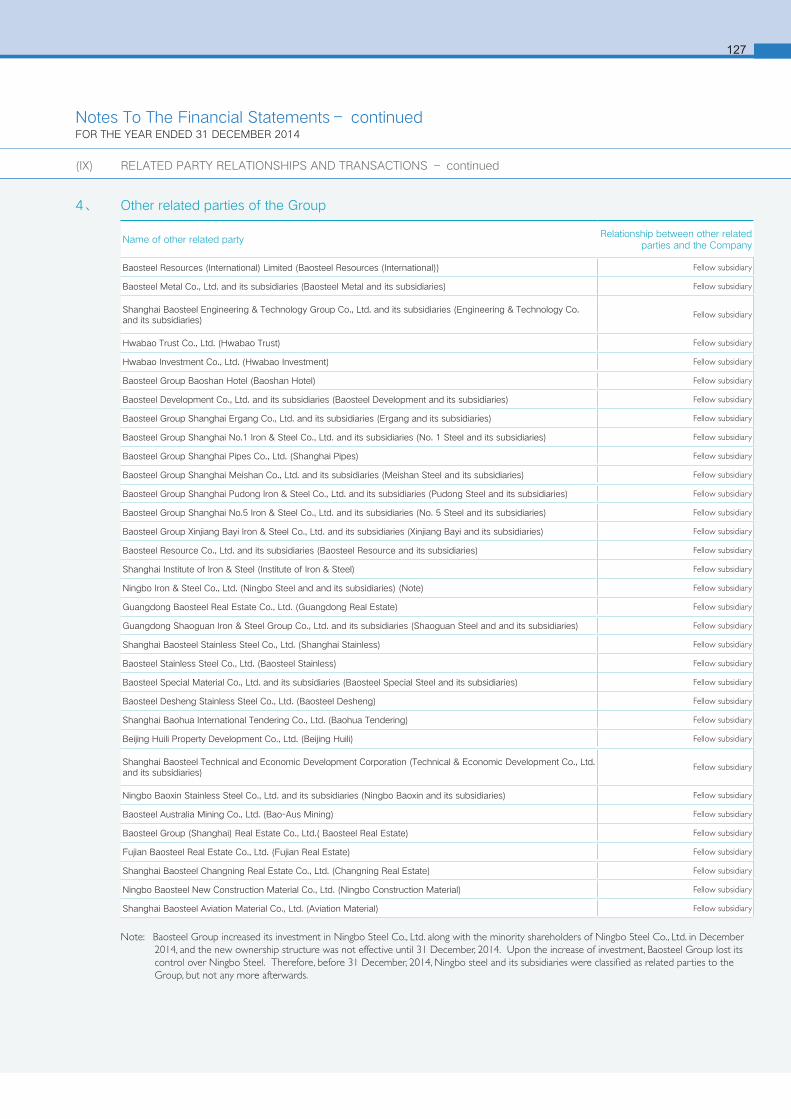
127
4、 Other related parties of the Group
Note: Baosteel Group increased its investment in Ningbo Steel Co., Ltd. along with the minority shareholders of Ningbo Steel Co., Ltd. in December 2014, and the new ownership structure was not effective until 31 December, 2014. Upon the increase of investment, Baosteel Group lost its control over Ningbo Steel. Therefore, before 31 December, 2014, Ningbo steel and its subsidiaries were classified as related parties to the Group, but not any more afterwards.
Name of other related partyRelationship between other related
parties and the Company
Baosteel Resources (International) Limited (Baosteel Resources (International)) Fellow subsidiary
Baosteel Metal Co., Ltd. and its subsidiaries (Baosteel Metal and its subsidiaries) Fellow subsidiary
Shanghai Baosteel Engineering & Technology Group Co., Ltd. and its subsidiaries (Engineering & Technology Co. and its subsidiaries)
Fellow subsidiary
Hwabao Trust Co., Ltd. (Hwabao Trust) Fellow subsidiary
Hwabao Investment Co., Ltd. (Hwabao Investment) Fellow subsidiary
Baosteel Group Baoshan Hotel (Baoshan Hotel) Fellow subsidiary
Baosteel Development Co., Ltd. and its subsidiaries (Baosteel Development and its subsidiaries) Fellow subsidiary
Baosteel Group Shanghai Ergang Co., Ltd. and its subsidiaries (Ergang and its subsidiaries) Fellow subsidiary
Baosteel Group Shanghai No.1 Iron & Steel Co., Ltd. and its subsidiaries (No. 1 Steel and its subsidiaries) Fellow subsidiary
Baosteel Group Shanghai Pipes Co., Ltd. (Shanghai Pipes) Fellow subsidiary
Baosteel Group Shanghai Meishan Co., Ltd. and its subsidiaries (Meishan Steel and its subsidiaries) Fellow subsidiary
Baosteel Group Shanghai Pudong Iron & Steel Co., Ltd. and its subsidiaries (Pudong Steel and its subsidiaries) Fellow subsidiary
Baosteel Group Shanghai No.5 Iron & Steel Co., Ltd. and its subsidiaries (No. 5 Steel and its subsidiaries) Fellow subsidiary
Baosteel Group Xinjiang Bayi Iron & Steel Co., Ltd. and its subsidiaries (Xinjiang Bayi and its subsidiaries) Fellow subsidiary
Baosteel Resource Co., Ltd. and its subsidiaries (Baosteel Resource and its subsidiaries) Fellow subsidiary
Shanghai Institute of Iron & Steel (Institute of Iron & Steel) Fellow subsidiary
Ningbo Iron & Steel Co., Ltd. (Ningbo Steel and and its subsidiaries) (Note) Fellow subsidiary
Guangdong Baosteel Real Estate Co., Ltd. (Guangdong Real Estate) Fellow subsidiary
Guangdong Shaoguan Iron & Steel Group Co., Ltd. and its subsidiaries (Shaoguan Steel and and its subsidiaries) Fellow subsidiary
Shanghai Baosteel Stainless Steel Co., Ltd. (Shanghai Stainless) Fellow subsidiary
Baosteel Stainless Steel Co., Ltd. (Baosteel Stainless) Fellow subsidiary
Baosteel Special Material Co., Ltd. and its subsidiaries (Baosteel Special Steel and its subsidiaries) Fellow subsidiary
Baosteel Desheng Stainless Steel Co., Ltd. (Baosteel Desheng) Fellow subsidiary
Shanghai Baohua International Tendering Co., Ltd. (Baohua Tendering) Fellow subsidiary
Beijing Huili Property Development Co., Ltd. (Beijing Huili) Fellow subsidiary
Shanghai Baosteel Technical and Economic Development Corporation (Technical & Economic Development Co., Ltd. and its subsidiaries)
Fellow subsidiary
Ningbo Baoxin Stainless Steel Co., Ltd. and its subsidiaries (Ningbo Baoxin and its subsidiaries) Fellow subsidiary
Baosteel Australia Mining Co., Ltd. (Bao-Aus Mining) Fellow subsidiary
Baosteel Group (Shanghai) Real Estate Co., Ltd.( Baosteel Real Estate) Fellow subsidiary
Fujian Baosteel Real Estate Co., Ltd. (Fujian Real Estate) Fellow subsidiary
Shanghai Baosteel Changning Real Estate Co., Ltd. (Changning Real Estate) Fellow subsidiary
Ningbo Baosteel New Construction Material Co., Ltd. (Ningbo Construction Material) Fellow subsidiary
Shanghai Baosteel Aviation Material Co., Ltd. (Aviation Material) Fellow subsidiary
Notes To The Financial Statements– continuedFOR THE YEAR ENDED 31 DECEMBER 2014
(IX) RELATED PARTY RELATIONSHIPS AND TRANSACTIONS – continued
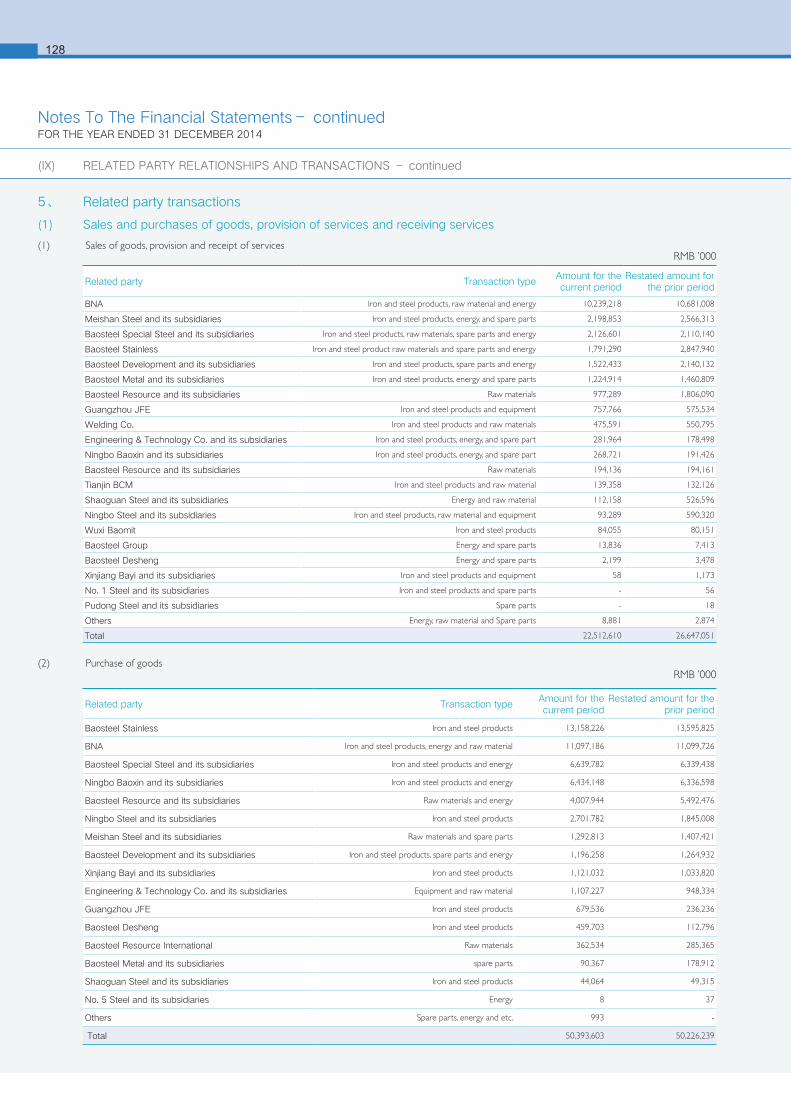
5、 Related party transactions
(1) Sales and purchases of goods, provision of services and receiving services
(1) Sales of goods, provision and receipt of services
Related party Transaction typeAmount for the current period
Restated amount for the prior period
BNA Iron and steel products, raw material and energy 10,239,218 10,681,008
Meishan Steel and its subsidiaries Iron and steel products, energy, and spare parts 2,198,853 2,566,313
Baosteel Special Steel and its subsidiaries Iron and steel products, raw materials, spare parts and energy 2,126,601 2,110,140
Baosteel Stainless Iron and steel product raw materials and spare parts and energy 1,791,290 2,847,940
Baosteel Development and its subsidiaries Iron and steel products, spare parts and energy 1,522,433 2,140,132
Baosteel Metal and its subsidiaries Iron and steel products, energy and spare parts 1,224,914 1,460,809
Baosteel Resource and its subsidiaries Raw materials 977,289 1,806,090
Guangzhou JFE Iron and steel products and equipment 757,766 575,534
Welding Co. Iron and steel products and raw materials 475,591 550,795
Engineering & Technology Co. and its subsidiaries Iron and steel products, energy, and spare part 281,964 178,498
Ningbo Baoxin and its subsidiaries Iron and steel products, energy, and spare part 268,721 191,426
Baosteel Resource and its subsidiaries Raw materials 194,136 194,161
Tianjin BCM Iron and steel products and raw material 139,358 132,126
Shaoguan Steel and its subsidiaries Energy and raw material 112,158 526,596
Ningbo Steel and its subsidiaries Iron and steel products, raw material and equipment 93,289 590,320
Wuxi Baomit Iron and steel products 84,055 80,151
Baosteel Group Energy and spare parts 13,836 7,413
Baosteel Desheng Energy and spare parts 2,199 3,478
Xinjiang Bayi and its subsidiaries Iron and steel products and equipment 58 1,173
No. 1 Steel and its subsidiaries Iron and steel products and spare parts - 56
Pudong Steel and its subsidiaries Spare parts - 18
Others Energy, raw material and Spare parts 8,881 2,874
Total 22,512,610 26,647,051
RMB ’000
6128
(2) Purchase of goods
Related party Transaction typeAmount for the current period
Restated amount for the prior period
Baosteel Stainless Iron and steel products 13,158,226 13,595,825
BNA Iron and steel products, energy and raw material 11,097,186 11,099,726
Baosteel Special Steel and its subsidiaries Iron and steel products and energy 6,639,782 6,339,438
Ningbo Baoxin and its subsidiaries Iron and steel products and energy 6,434,148 6,336,598
Baosteel Resource and its subsidiaries Raw materials and energy 4,007,944 5,492,476
Ningbo Steel and its subsidiaries Iron and steel products 2,701,782 1,845,008
Meishan Steel and its subsidiaries Raw materials and spare parts 1,292,813 1,407,421
Baosteel Development and its subsidiaries Iron and steel products, spare parts and energy 1,196,258 1,264,932
Xinjiang Bayi and its subsidiaries Iron and steel products 1,121,032 1,033,820
Engineering & Technology Co. and its subsidiaries Equipment and raw material 1,107,227 948,334
Guangzhou JFE Iron and steel products 679,536 236,236
Baosteel Desheng Iron and steel products 459,703 112,796
Baosteel Resource International Raw materials 362,534 285,365
Baosteel Metal and its subsidiaries spare parts 90,367 178,912
Shaoguan Steel and its subsidiaries Iron and steel products 44,064 49,315
No. 5 Steel and its subsidiaries Energy 8 37
Others Spare parts, energy and etc. 993 -
Total 50,393,603 50,226,239
RMB ’000
Notes To The Financial Statements– continuedFOR THE YEAR ENDED 31 DECEMBER 2014
(IX) RELATED PARTY RELATIONSHIPS AND TRANSACTIONS – continued
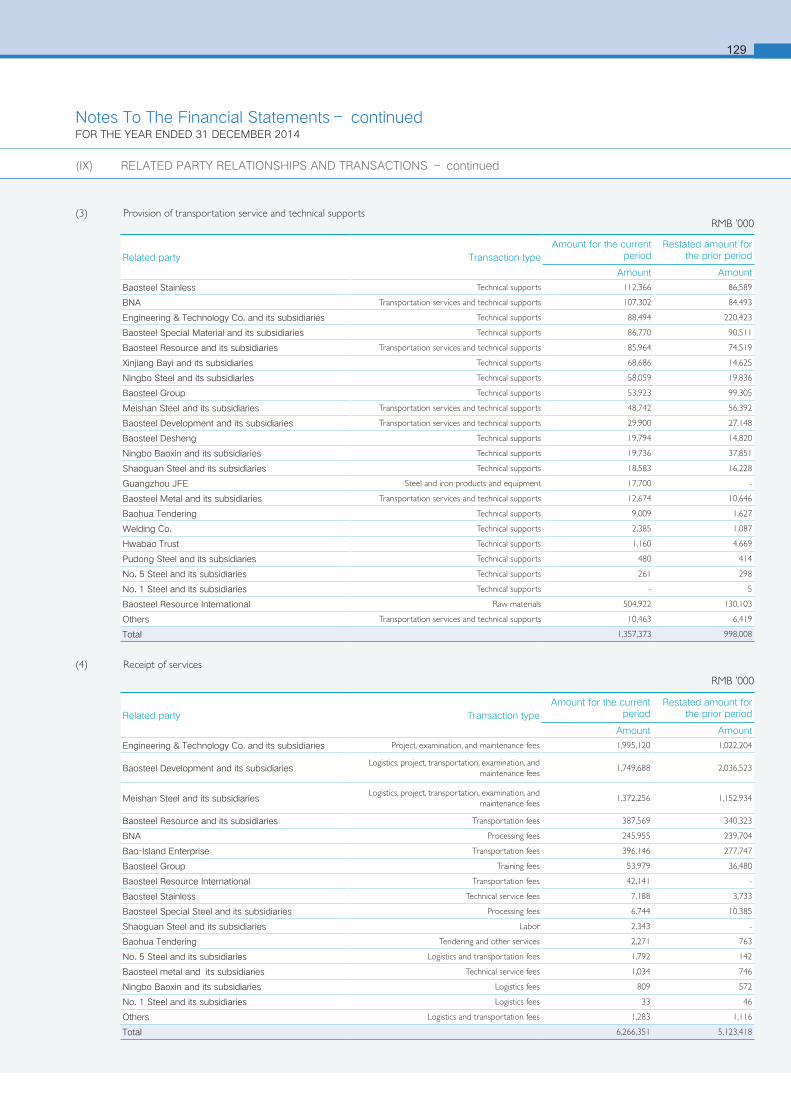
129
(3) Provision of transportation service and technical supports
(4) Receipt of services
Related party Transaction typeAmount for the current
periodRestated amount for
the prior period
Amount Amount
Engineering & Technology Co. and its subsidiaries Project, examination, and maintenance fees 1,995,120 1,022,204
Baosteel Development and its subsidiariesLogistics, project, transportation, examination, and
maintenance fees1,749,688 2,036,523
Meishan Steel and its subsidiariesLogistics, project, transportation, examination, and
maintenance fees1,372,256 1,152,934
Baosteel Resource and its subsidiaries Transportation fees 387,569 340,323
BNA Processing fees 245,955 239,704
Bao-Island Enterprise Transportation fees 396,146 277,747
Baosteel Group Training fees 53,979 36,480
Baosteel Resource International Transportation fees 42,141 -
Baosteel Stainless Technical service fees 7,188 3,733
Baosteel Special Steel and its subsidiaries Processing fees 6,744 10,385
Shaoguan Steel and its subsidiaries Labor 2,343 -
Baohua Tendering Tendering and other services 2,271 763
No. 5 Steel and its subsidiaries Logistics and transportation fees 1,792 142
Baosteel metal and its subsidiaries Technical service fees 1,034 746
Ningbo Baoxin and its subsidiaries Logistics fees 809 572
No. 1 Steel and its subsidiaries Logistics fees 33 46
Others Logistics and transportation fees 1,283 1,116
Total 6,266,351 5,123,418
Related party Transaction typeAmount for the current
periodRestated amount for
the prior period
Amount Amount
Baosteel Stainless Technical supports 112,366 86,589
BNA Transportation services and technical supports 107,302 84,493
Engineering & Technology Co. and its subsidiaries Technical supports 88,494 220,423
Baosteel Special Material and its subsidiaries Technical supports 86,770 90,511
Baosteel Resource and its subsidiaries Transportation services and technical supports 85,964 74,519
Xinjiang Bayi and its subsidiaries Technical supports 68,686 14,625
Ningbo Steel and its subsidiaries Technical supports 58,059 19,836
Baosteel Group Technical supports 53,923 99,305
Meishan Steel and its subsidiaries Transportation services and technical supports 48,742 56,392
Baosteel Development and its subsidiaries Transportation services and technical supports 29,900 27,148
Baosteel Desheng Technical supports 19,794 14,820
Ningbo Baoxin and its subsidiaries Technical supports 19,736 37,851
Shaoguan Steel and its subsidiaries Technical supports 18,583 16,228
Guangzhou JFE Steel and iron products and equipment 17,700 -
Baosteel Metal and its subsidiaries Transportation services and technical supports 12,674 10,646
Baohua Tendering Technical supports 9,009 1,627
Welding Co. Technical supports 2,385 1,087
Hwabao Trust Technical supports 1,160 4,669
Pudong Steel and its subsidiaries Technical supports 480 414
No. 5 Steel and its subsidiaries Technical supports 261 298
No. 1 Steel and its subsidiaries Technical supports - 5
Baosteel Resource International Raw materials 504,922 130,103
Others Transportation services and technical supports 10,463 6,419
Total 1,357,373 998,008
RMB ’000
RMB ’000
Notes To The Financial Statements– continuedFOR THE YEAR ENDED 31 DECEMBER 2014
(IX) RELATED PARTY RELATIONSHIPS AND TRANSACTIONS – continued
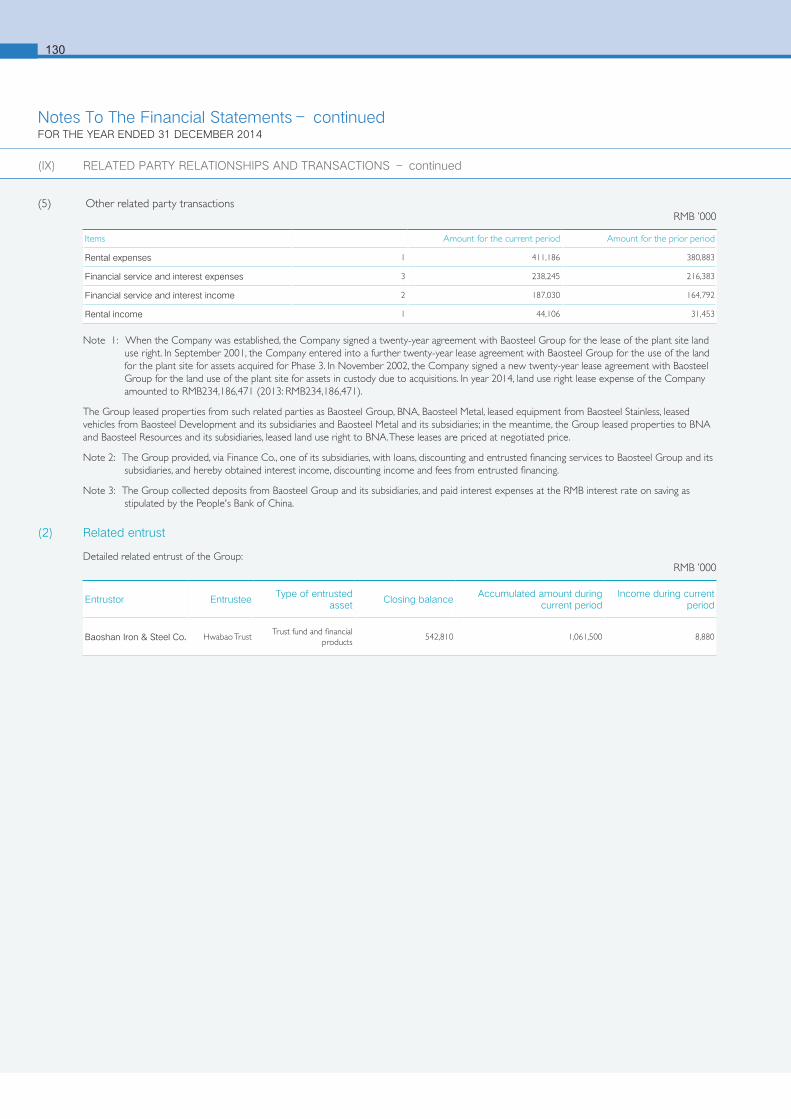
6130
(5) Other related party transactions
Note 1: When the Company was established, the Company signed a twenty-year agreement with Baosteel Group for the lease of the plant site land use right. In September 2001, the Company entered into a further twenty-year lease agreement with Baosteel Group for the use of the land for the plant site for assets acquired for Phase 3. In November 2002, the Company signed a new twenty-year lease agreement with Baosteel Group for the land use of the plant site for assets in custody due to acquisitions. In year 2014, land use right lease expense of the Company amounted to RMB234,186,471 (2013: RMB234,186,471).
The Group leased properties from such related parties as Baosteel Group, BNA, Baosteel Metal, leased equipment from Baosteel Stainless, leased vehicles from Baosteel Development and its subsidiaries and Baosteel Metal and its subsidiaries; in the meantime, the Group leased properties to BNA and Baosteel Resources and its subsidiaries, leased land use right to BNA. These leases are priced at negotiated price.
Note 2: The Group provided, via Finance Co., one of its subsidiaries, with loans, discounting and entrusted financing services to Baosteel Group and its subsidiaries, and hereby obtained interest income, discounting income and fees from entrusted financing.
Note 3: The Group collected deposits from Baosteel Group and its subsidiaries, and paid interest expenses at the RMB interest rate on saving as stipulated by the People's Bank of China.
(2) Related entrust
Detailed related entrust of the Group:
Items Amount for the current period Amount for the prior period
Rental expenses 1 411,186 380,883
Financial service and interest expenses 3 238,245 216,383
Financial service and interest income 2 187,030 164,792
Rental income 1 44,106 31,453
Entrustor EntrusteeType of entrusted
assetClosing balance
Accumulated amount during current period
Income during current period
Baoshan Iron & Steel Co. Hwabao TrustTrust fund and financial
products542,810 1,061,500 8,880
RMB ’000
RMB ’000
Notes To The Financial Statements– continuedFOR THE YEAR ENDED 31 DECEMBER 2014
(IX) RELATED PARTY RELATIONSHIPS AND TRANSACTIONS – continued
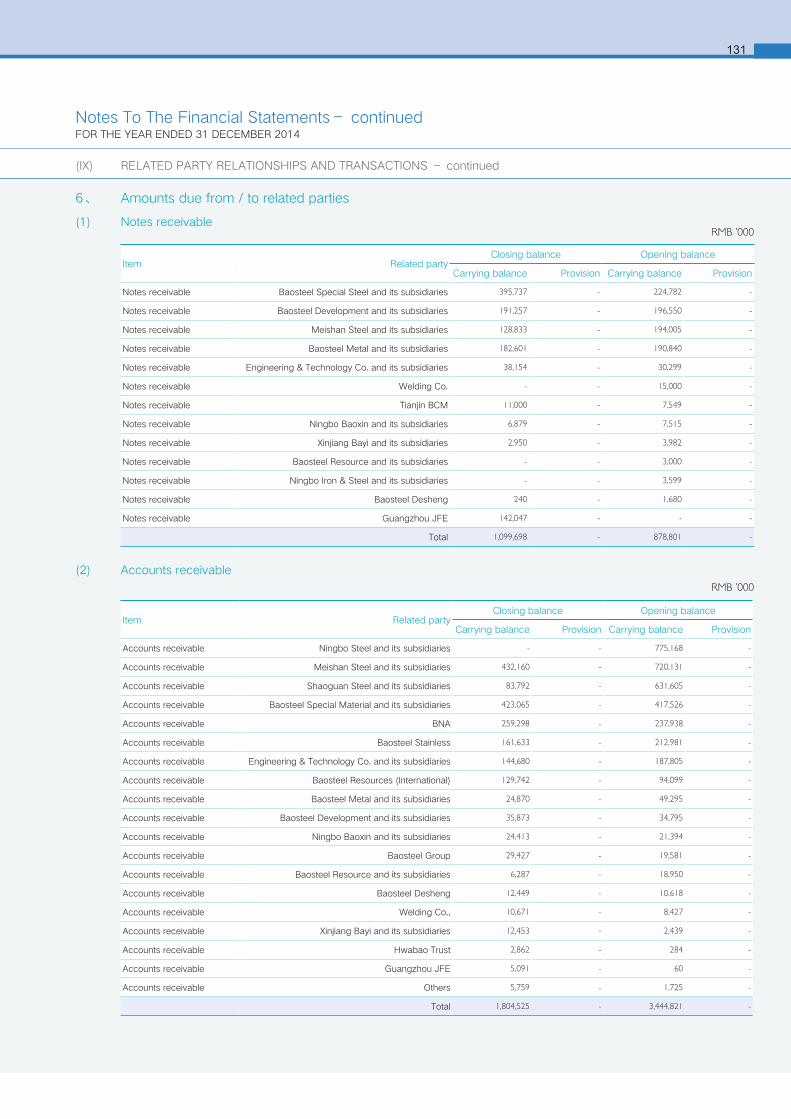
131
6、 Amounts due from / to related parties
(1) Notes receivable
(2) Accounts receivable
Item Related partyClosing balance Opening balance
Carrying balance Provision Carrying balance Provision
Notes receivable Baosteel Special Steel and its subsidiaries 395,737 - 224,782 -
Notes receivable Baosteel Development and its subsidiaries 191,257 - 196,550 -
Notes receivable Meishan Steel and its subsidiaries 128,833 - 194,005 -
Notes receivable Baosteel Metal and its subsidiaries 182,601 - 190,840 -
Notes receivable Engineering & Technology Co. and its subsidiaries 38,154 - 30,299 -
Notes receivable Welding Co. - - 15,000 -
Notes receivable Tianjin BCM 11,000 - 7,549 -
Notes receivable Ningbo Baoxin and its subsidiaries 6,879 - 7,515 -
Notes receivable Xinjiang Bayi and its subsidiaries 2,950 - 3,982 -
Notes receivable Baosteel Resource and its subsidiaries - - 3,000 -
Notes receivable Ningbo Iron & Steel and its subsidiaries - - 3,599 -
Notes receivable Baosteel Desheng 240 - 1,680 -
Notes receivable Guangzhou JFE 142,047 - - -
Total 1,099,698 - 878,801 -
Item Related partyClosing balance Opening balance
Carrying balance Provision Carrying balance Provision
Accounts receivable Ningbo Steel and its subsidiaries - - 775,168 -
Accounts receivable Meishan Steel and its subsidiaries 432,160 - 720,131 -
Accounts receivable Shaoguan Steel and its subsidiaries 83,792 - 631,605 -
Accounts receivable Baosteel Special Material and its subsidiaries 423,065 - 417,526 -
Accounts receivable BNA 259,298 - 237,938 -
Accounts receivable Baosteel Stainless 161,633 - 212,981 -
Accounts receivable Engineering & Technology Co. and its subsidiaries 144,680 - 187,805 -
Accounts receivable Baosteel Resources (International) 129,742 - 94,099 -
Accounts receivable Baosteel Metal and its subsidiaries 24,870 - 49,295 -
Accounts receivable Baosteel Development and its subsidiaries 35,873 - 34,795 -
Accounts receivable Ningbo Baoxin and its subsidiaries 24,413 - 21,394 -
Accounts receivable Baosteel Group 29,427 - 19,581 -
Accounts receivable Baosteel Resource and its subsidiaries 6,287 - 18,950 -
Accounts receivable Baosteel Desheng 12,449 - 10,618 -
Accounts receivable Welding Co., 10,671 - 8,427 -
Accounts receivable Xinjiang Bayi and its subsidiaries 12,453 - 2,439 -
Accounts receivable Hwabao Trust 2,862 - 284 -
Accounts receivable Guangzhou JFE 5,091 - 60 -
Accounts receivable Others 5,759 - 1,725 -
Total 1,804,525 - 3,444,821 -
RMB ’000
RMB ’000
Notes To The Financial Statements– continuedFOR THE YEAR ENDED 31 DECEMBER 2014
(IX) RELATED PARTY RELATIONSHIPS AND TRANSACTIONS – continued
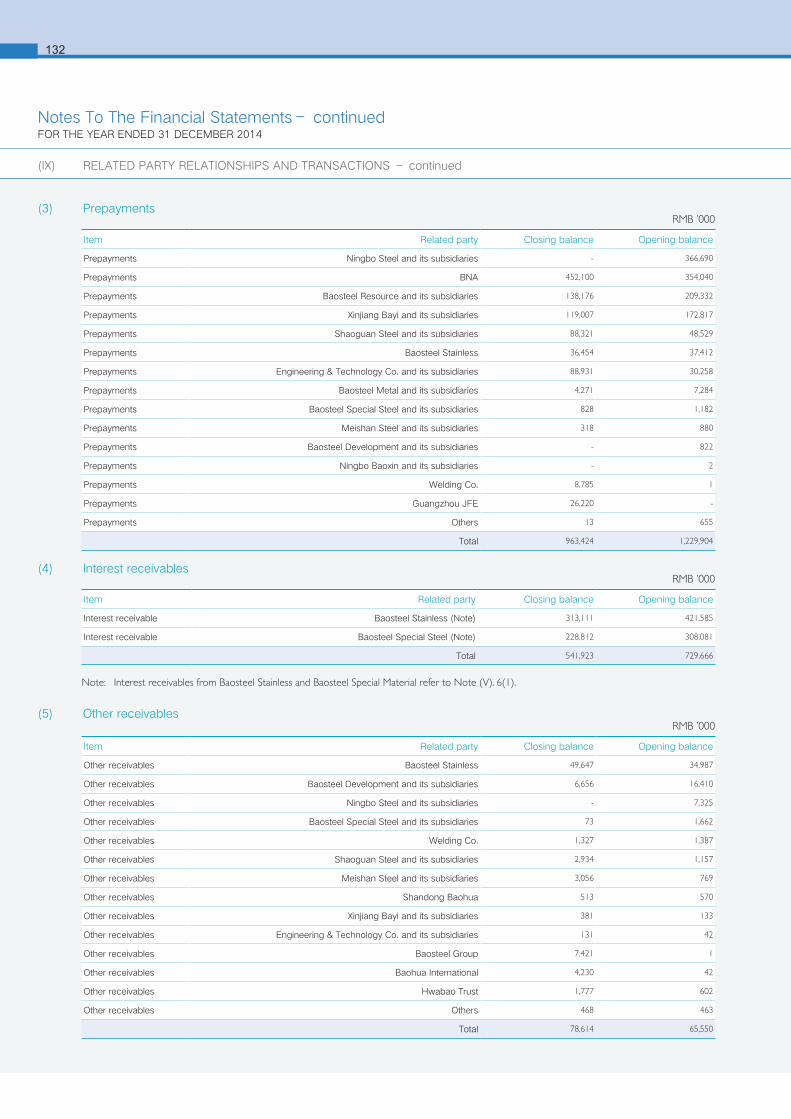
6132
(5) Other receivables
(3) Prepayments
(4) Interest receivables
Note: Interest receivables from Baosteel Stainless and Baosteel Special Material refer to Note (V). 6(1).
Item Related party Closing balance Opening balance
Prepayments Ningbo Steel and its subsidiaries - 366,690
Prepayments BNA 452,100 354,040
Prepayments Baosteel Resource and its subsidiaries 138,176 209,332
Prepayments Xinjiang Bayi and its subsidiaries 119,007 172,817
Prepayments Shaoguan Steel and its subsidiaries 88,321 48,529
Prepayments Baosteel Stainless 36,454 37,412
Prepayments Engineering & Technology Co. and its subsidiaries 88,931 30,258
Prepayments Baosteel Metal and its subsidiaries 4,271 7,284
Prepayments Baosteel Special Steel and its subsidiaries 828 1,182
Prepayments Meishan Steel and its subsidiaries 318 880
Prepayments Baosteel Development and its subsidiaries - 822
Prepayments Ningbo Baoxin and its subsidiaries - 2
Prepayments Welding Co. 8,785 1
Prepayments Guangzhou JFE 26,220 -
Prepayments Others 13 655
Total 963,424 1,229,904
Item Related party Closing balance Opening balance
Interest receivable Baosteel Stainless (Note) 313,111 421,585
Interest receivable Baosteel Special Steel (Note) 228,812 308,081
Total 541,923 729,666
Item Related party Closing balance Opening balance
Other receivables Baosteel Stainless 49,647 34,987
Other receivables Baosteel Development and its subsidiaries 6,656 16,410
Other receivables Ningbo Steel and its subsidiaries - 7,325
Other receivables Baosteel Special Steel and its subsidiaries 73 1,662
Other receivables Welding Co. 1,327 1,387
Other receivables Shaoguan Steel and its subsidiaries 2,934 1,157
Other receivables Meishan Steel and its subsidiaries 3,056 769
Other receivables Shandong Baohua 513 570
Other receivables Xinjiang Bayi and its subsidiaries 381 133
Other receivables Engineering & Technology Co. and its subsidiaries 131 42
Other receivables Baosteel Group 7,421 1
Other receivables Baohua International 4,230 42
Other receivables Hwabao Trust 1,777 602
Other receivables Others 468 463
Total 78,614 65,550
RMB ’000
RMB ’000
RMB ’000
Notes To The Financial Statements– continuedFOR THE YEAR ENDED 31 DECEMBER 2014
(IX) RELATED PARTY RELATIONSHIPS AND TRANSACTIONS – continued
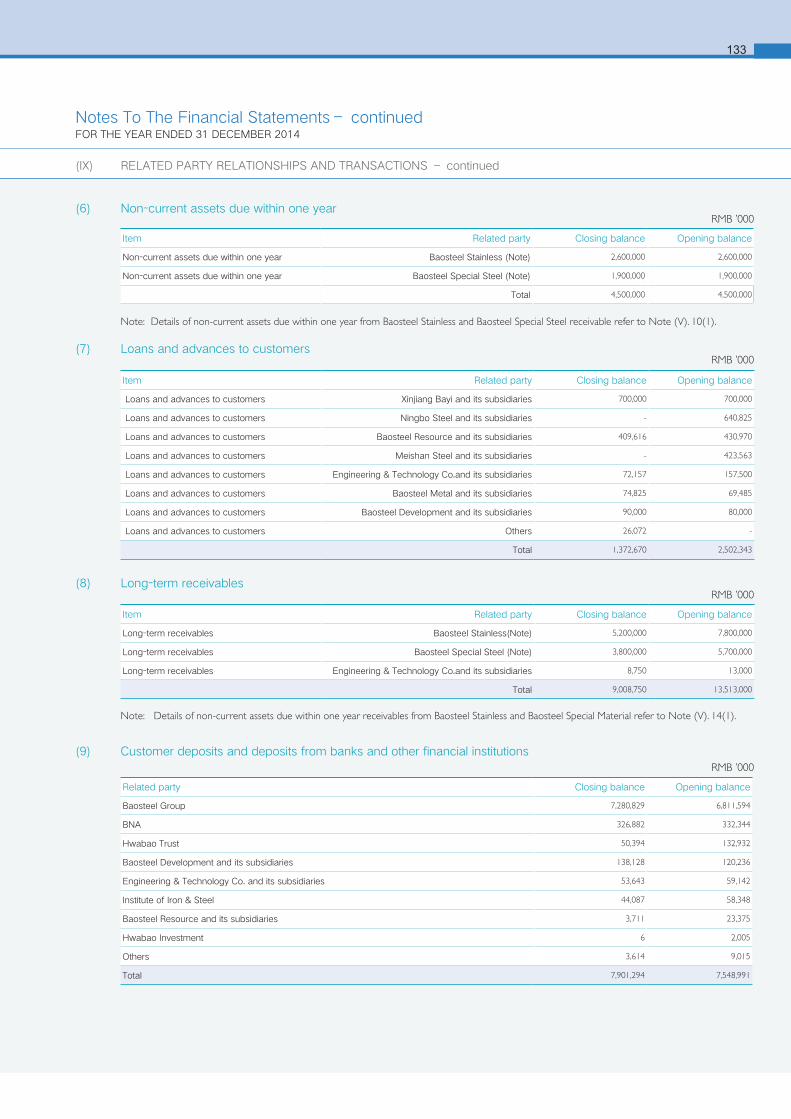
133
(6) Non-current assets due within one year
Note: Details of non-current assets due within one year from Baosteel Stainless and Baosteel Special Steel receivable refer to Note (V). 10(1).
(7) Loans and advances to customers
(8) Long-term receivables
Note: Details of non-current assets due within one year receivables from Baosteel Stainless and Baosteel Special Material refer to Note (V). 14(1).
(9) Customer deposits and deposits from banks and other financial institutions
Item Related party Closing balance Opening balance
Non-current assets due within one year Baosteel Stainless (Note) 2,600,000 2,600,000
Non-current assets due within one year Baosteel Special Steel (Note) 1,900,000 1,900,000
Total 4,500,000 4,500,000
Item Related party Closing balance Opening balance
Loans and advances to customers Xinjiang Bayi and its subsidiaries 700,000 700,000
Loans and advances to customers Ningbo Steel and its subsidiaries - 640,825
Loans and advances to customers Baosteel Resource and its subsidiaries 409,616 430,970
Loans and advances to customers Meishan Steel and its subsidiaries - 423,563
Loans and advances to customers Engineering & Technology Co.and its subsidiaries 72,157 157,500
Loans and advances to customers Baosteel Metal and its subsidiaries 74,825 69,485
Loans and advances to customers Baosteel Development and its subsidiaries 90,000 80,000
Loans and advances to customers Others 26,072 -
Total 1,372,670 2,502,343
RMB ’000
RMB ’000
Item Related party Closing balance Opening balance
Long-term receivables Baosteel Stainless(Note) 5,200,000 7,800,000
Long-term receivables Baosteel Special Steel (Note) 3,800,000 5,700,000
Long-term receivables Engineering & Technology Co.and its subsidiaries 8,750 13,000
Total 9,008,750 13,513,000
Related party Closing balance Opening balance
Baosteel Group 7,280,829 6,811,594
BNA 326,882 332,344
Hwabao Trust 50,394 132,932
Baosteel Development and its subsidiaries 138,128 120,236
Engineering & Technology Co. and its subsidiaries 53,643 59,142
Institute of Iron & Steel 44,087 58,348
Baosteel Resource and its subsidiaries 3,711 23,375
Hwabao Investment 6 2,005
Others 3,614 9,015
Total 7,901,294 7,548,991
RMB ’000
RMB ’000
Notes To The Financial Statements– continuedFOR THE YEAR ENDED 31 DECEMBER 2014
(IX) RELATED PARTY RELATIONSHIPS AND TRANSACTIONS – continued
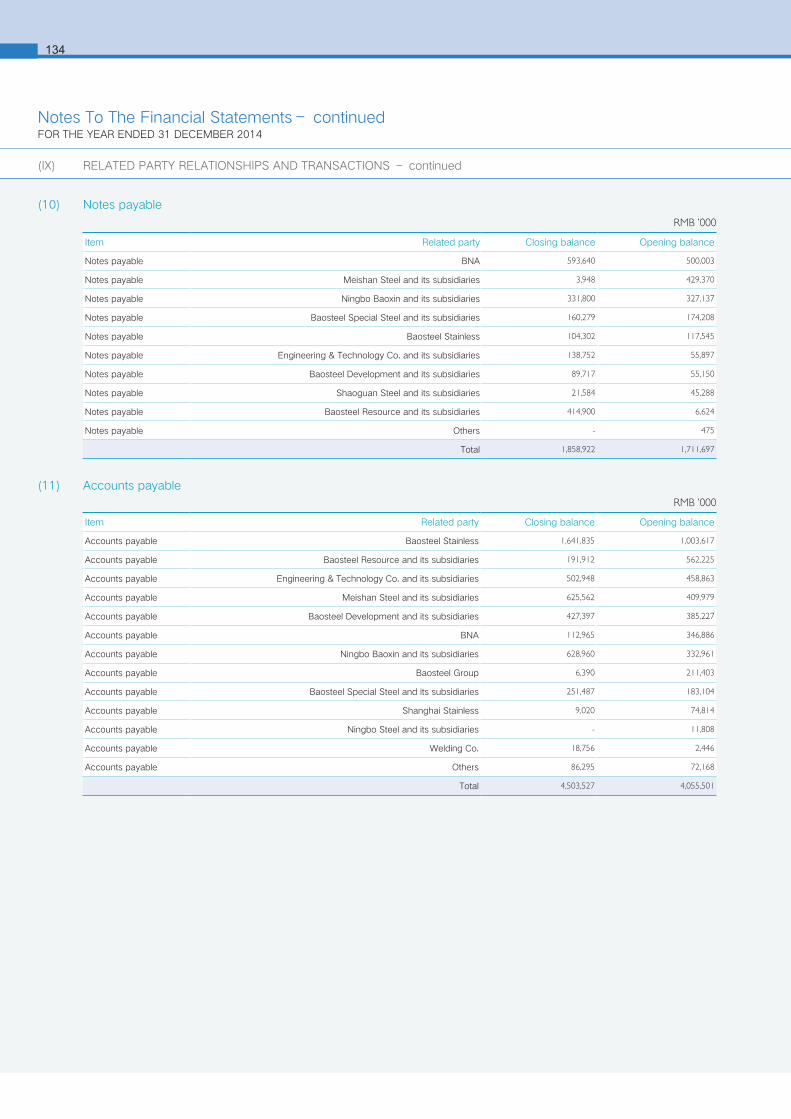
6134
(11) Accounts payable
(10) Notes payable
Item Related party Closing balance Opening balance
Notes payable BNA 593,640 500,003
Notes payable Meishan Steel and its subsidiaries 3,948 429,370
Notes payable Ningbo Baoxin and its subsidiaries 331,800 327,137
Notes payable Baosteel Special Steel and its subsidiaries 160,279 174,208
Notes payable Baosteel Stainless 104,302 117,545
Notes payable Engineering & Technology Co. and its subsidiaries 138,752 55,897
Notes payable Baosteel Development and its subsidiaries 89,717 55,150
Notes payable Shaoguan Steel and its subsidiaries 21,584 45,288
Notes payable Baosteel Resource and its subsidiaries 414,900 6,624
Notes payable Others - 475
Total 1,858,922 1,711,697
Item Related party Closing balance Opening balance
Accounts payable Baosteel Stainless 1,641,835 1,003,617
Accounts payable Baosteel Resource and its subsidiaries 191,912 562,225
Accounts payable Engineering & Technology Co. and its subsidiaries 502,948 458,863
Accounts payable Meishan Steel and its subsidiaries 625,562 409,979
Accounts payable Baosteel Development and its subsidiaries 427,397 385,227
Accounts payable BNA 112,965 346,886
Accounts payable Ningbo Baoxin and its subsidiaries 628,960 332,961
Accounts payable Baosteel Group 6,390 211,403
Accounts payable Baosteel Special Steel and its subsidiaries 251,487 183,104
Accounts payable Shanghai Stainless 9,020 74,814
Accounts payable Ningbo Steel and its subsidiaries - 11,808
Accounts payable Welding Co. 18,756 2,446
Accounts payable Others 86,295 72,168
Total 4,503,527 4,055,501
RMB ’000
RMB ’000
Notes To The Financial Statements– continuedFOR THE YEAR ENDED 31 DECEMBER 2014
(IX) RELATED PARTY RELATIONSHIPS AND TRANSACTIONS – continued
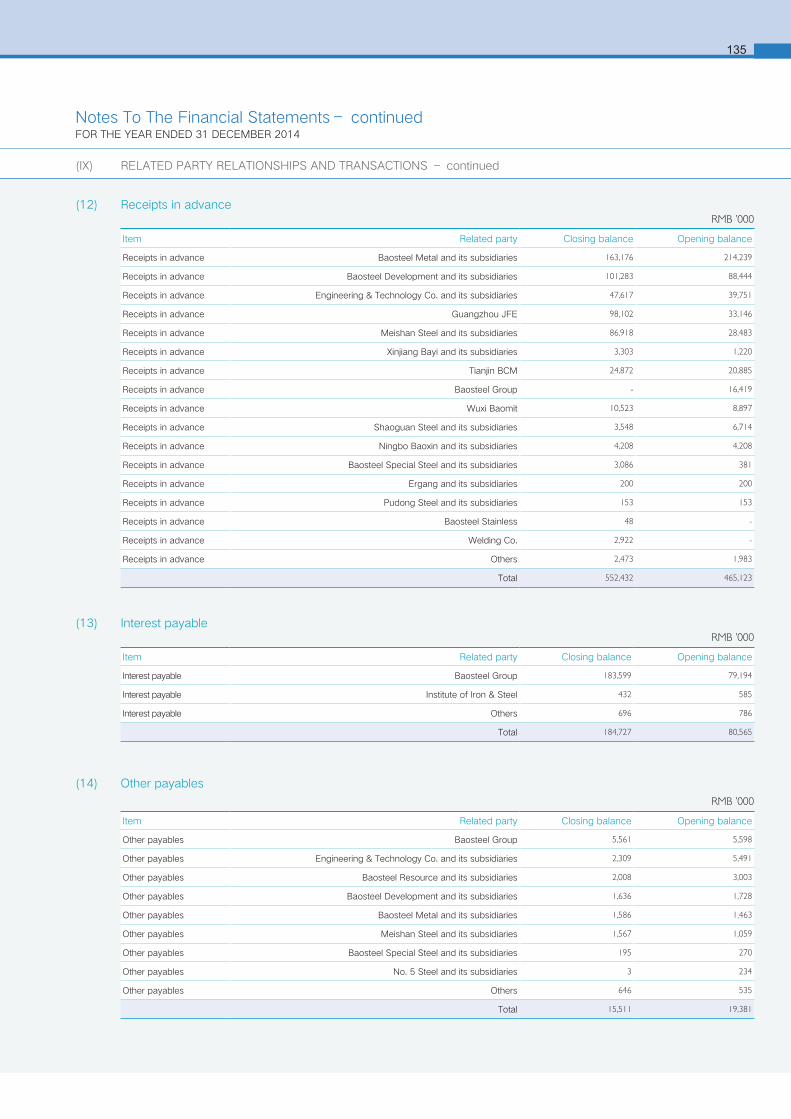
135
(12) Receipts in advance
(13) Interest payable
Item Related party Closing balance Opening balance
Receipts in advance Baosteel Metal and its subsidiaries 163,176 214,239
Receipts in advance Baosteel Development and its subsidiaries 101,283 88,444
Receipts in advance Engineering & Technology Co. and its subsidiaries 47,617 39,751
Receipts in advance Guangzhou JFE 98,102 33,146
Receipts in advance Meishan Steel and its subsidiaries 86,918 28,483
Receipts in advance Xinjiang Bayi and its subsidiaries 3,303 1,220
Receipts in advance Tianjin BCM 24,872 20,885
Receipts in advance Baosteel Group - 16,419
Receipts in advance Wuxi Baomit 10,523 8,897
Receipts in advance Shaoguan Steel and its subsidiaries 3,548 6,714
Receipts in advance Ningbo Baoxin and its subsidiaries 4,208 4,208
Receipts in advance Baosteel Special Steel and its subsidiaries 3,086 381
Receipts in advance Ergang and its subsidiaries 200 200
Receipts in advance Pudong Steel and its subsidiaries 153 153
Receipts in advance Baosteel Stainless 48 -
Receipts in advance Welding Co. 2,922 -
Receipts in advance Others 2,473 1,983
Total 552,432 465,123
Item Related party Closing balance Opening balance
Interest payable Baosteel Group 183,599 79,194
Interest payable Institute of Iron & Steel 432 585
Interest payable Others 696 786
Total 184,727 80,565
Item Related party Closing balance Opening balance
Other payables Baosteel Group 5,561 5,598
Other payables Engineering & Technology Co. and its subsidiaries 2,309 5,491
Other payables Baosteel Resource and its subsidiaries 2,008 3,003
Other payables Baosteel Development and its subsidiaries 1,636 1,728
Other payables Baosteel Metal and its subsidiaries 1,586 1,463
Other payables Meishan Steel and its subsidiaries 1,567 1,059
Other payables Baosteel Special Steel and its subsidiaries 195 270
Other payables No. 5 Steel and its subsidiaries 3 234
Other payables Others 646 535
Total 15,511 19,381
RMB ’000
RMB ’000
RMB ’000
(14) Other payables
Notes To The Financial Statements– continuedFOR THE YEAR ENDED 31 DECEMBER 2014
(IX) RELATED PARTY RELATIONSHIPS AND TRANSACTIONS – continued
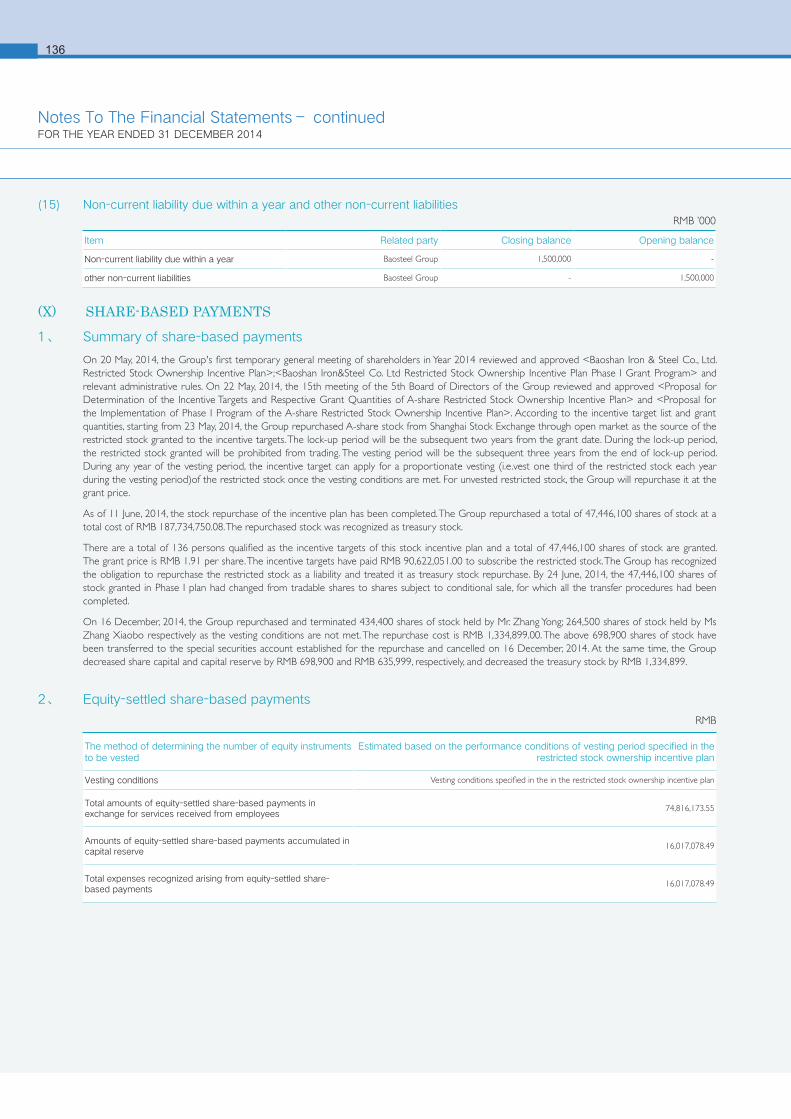
6136
(15) Non-current liability due within a year and other non-current liabilities
2、 Equity-settled share-based payments
Item Related party Closing balance Opening balance
Non-current liability due within a year Baosteel Group 1,500,000 -
other non-current liabilities Baosteel Group - 1,500,000
RMB ’000
The method of determining the number of equity instruments to be vested
Estimated based on the performance conditions of vesting period specified in the restricted stock ownership incentive plan
Vesting conditions Vesting conditions specified in the in the restricted stock ownership incentive plan
Total amounts of equity-settled share-based payments in exchange for services received from employees
74,816,173.55
Amounts of equity-settled share-based payments accumulated in capital reserve
16,017,078.49
Total expenses recognized arising from equity-settled share-based payments
16,017,078.49
RMB
(X) SHARE-BASED PAYMENTS1、 Summary of share-based payments
On 20 May, 2014, the Group's first temporary general meeting of shareholders in Year 2014 reviewed and approved <Baoshan Iron & Steel Co., Ltd. Restricted Stock Ownership Incentive Plan>;<Baoshan Iron&Steel Co. Ltd Restricted Stock Ownership Incentive Plan Phase I Grant Program> and relevant administrative rules. On 22 May, 2014, the 15th meeting of the 5th Board of Directors of the Group reviewed and approved <Proposal for Determination of the Incentive Targets and Respective Grant Quantities of A-share Restricted Stock Ownership Incentive Plan> and <Proposal for the Implementation of Phase I Program of the A-share Restricted Stock Ownership Incentive Plan>. According to the incentive target list and grant quantities, starting from 23 May, 2014, the Group repurchased A-share stock from Shanghai Stock Exchange through open market as the source of the restricted stock granted to the incentive targets. The lock-up period will be the subsequent two years from the grant date. During the lock-up period, the restricted stock granted will be prohibited from trading. The vesting period will be the subsequent three years from the end of lock-up period. During any year of the vesting period, the incentive target can apply for a proportionate vesting (i.e.vest one third of the restricted stock each year during the vesting period)of the restricted stock once the vesting conditions are met. For unvested restricted stock, the Group will repurchase it at the grant price.
As of 11 June, 2014, the stock repurchase of the incentive plan has been completed. The Group repurchased a total of 47,446,100 shares of stock at a total cost of RMB 187,734,750.08. The repurchased stock was recognized as treasury stock.
There are a total of 136 persons qualified as the incentive targets of this stock incentive plan and a total of 47,446,100 shares of stock are granted. The grant price is RMB 1.91 per share. The incentive targets have paid RMB 90,622,051.00 to subscribe the restricted stock. The Group has recognized the obligation to repurchase the restricted stock as a liability and treated it as treasury stock repurchase. By 24 June, 2014, the 47,446,100 shares of stock granted in Phase I plan had changed from tradable shares to shares subject to conditional sale, for which all the transfer procedures had been completed.
On 16 December, 2014, the Group repurchased and terminated 434,400 shares of stock held by Mr. Zhang Yong; 264,500 shares of stock held by Ms Zhang Xiaobo respectively as the vesting conditions are not met. The repurchase cost is RMB 1,334,899.00. The above 698,900 shares of stock have been transferred to the special securities account established for the repurchase and cancelled on 16 December, 2014. At the same time, the Group decreased share capital and capital reserve by RMB 698,900 and RMB 635,999, respectively, and decreased the treasury stock by RMB 1,334,899.
Notes To The Financial Statements– continuedFOR THE YEAR ENDED 31 DECEMBER 2014
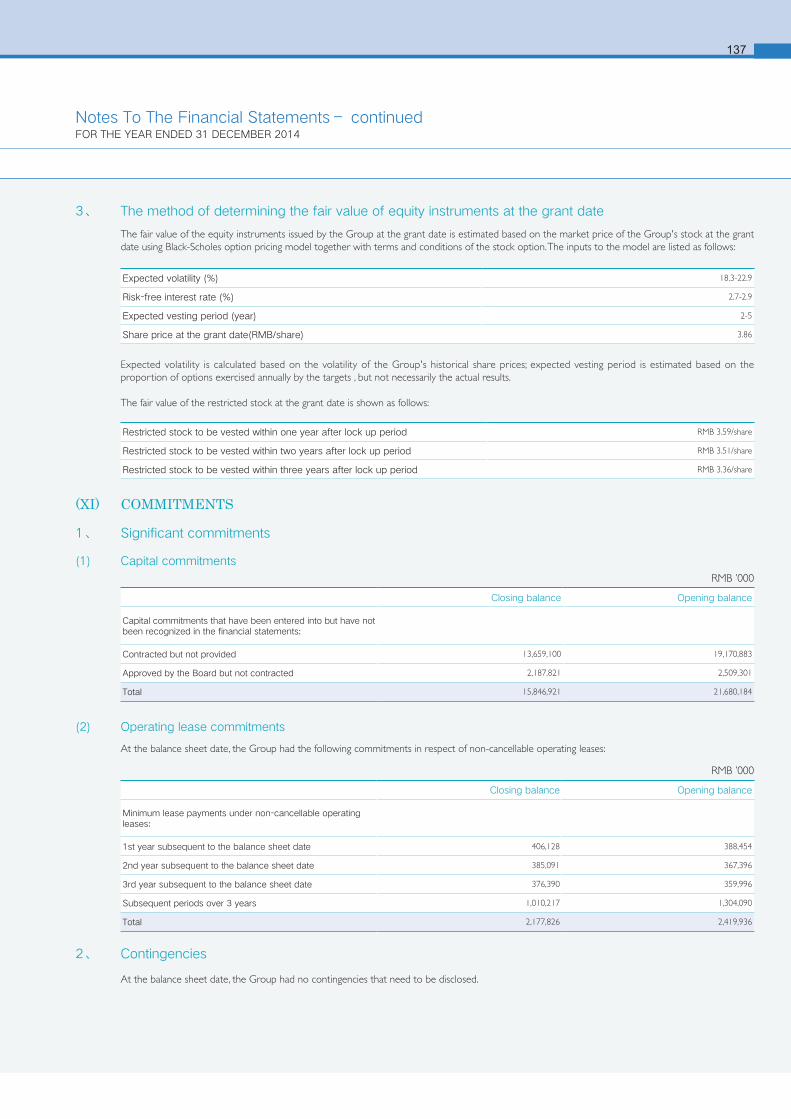
137
Expected volatility is calculated based on the volatility of the Group's historical share prices; expected vesting period is estimated based on the proportion of options exercised annually by the targets , but not necessarily the actual results. The fair value of the restricted stock at the grant date is shown as follows:
(XI) COMMITMENTS
1、 Significant commitments
(1) Capital commitments
(2) Operating lease commitments
At the balance sheet date, the Group had the following commitments in respect of non-cancellable operating leases:
2、 Contingencies
At the balance sheet date, the Group had no contingencies that need to be disclosed.
Expected volatility (%) 18.3-22.9
Risk-free interest rate (%) 2.7-2.9
Expected vesting period (year) 2-5
Share price at the grant date(RMB/share) 3.86
Restricted stock to be vested within one year after lock up period RMB 3.59/share
Restricted stock to be vested within two years after lock up period RMB 3.51/share
Restricted stock to be vested within three years after lock up period RMB 3.36/share
RMB ’000
RMB ’000
Closing balance Opening balance
Capital commitments that have been entered into but have not been recognized in the financial statements:
Contracted but not provided 13,659,100 19,170,883
Approved by the Board but not contracted 2,187,821 2,509,301
Total 15,846,921 21,680,184
Closing balance Opening balance
Minimum lease payments under non-cancellable operating leases:
1st year subsequent to the balance sheet date 406,128 388,454
2nd year subsequent to the balance sheet date 385,091 367,396
3rd year subsequent to the balance sheet date 376,390 359,996
Subsequent periods over 3 years 1,010,217 1,304,090
Total 2,177,826 2,419,936
3、 The method of determining the fair value of equity instruments at the grant date
The fair value of the equity instruments issued by the Group at the grant date is estimated based on the market price of the Group's stock at the grant date using Black-Scholes option pricing model together with terms and conditions of the stock option. The inputs to the model are listed as follows:
Notes To The Financial Statements– continuedFOR THE YEAR ENDED 31 DECEMBER 2014
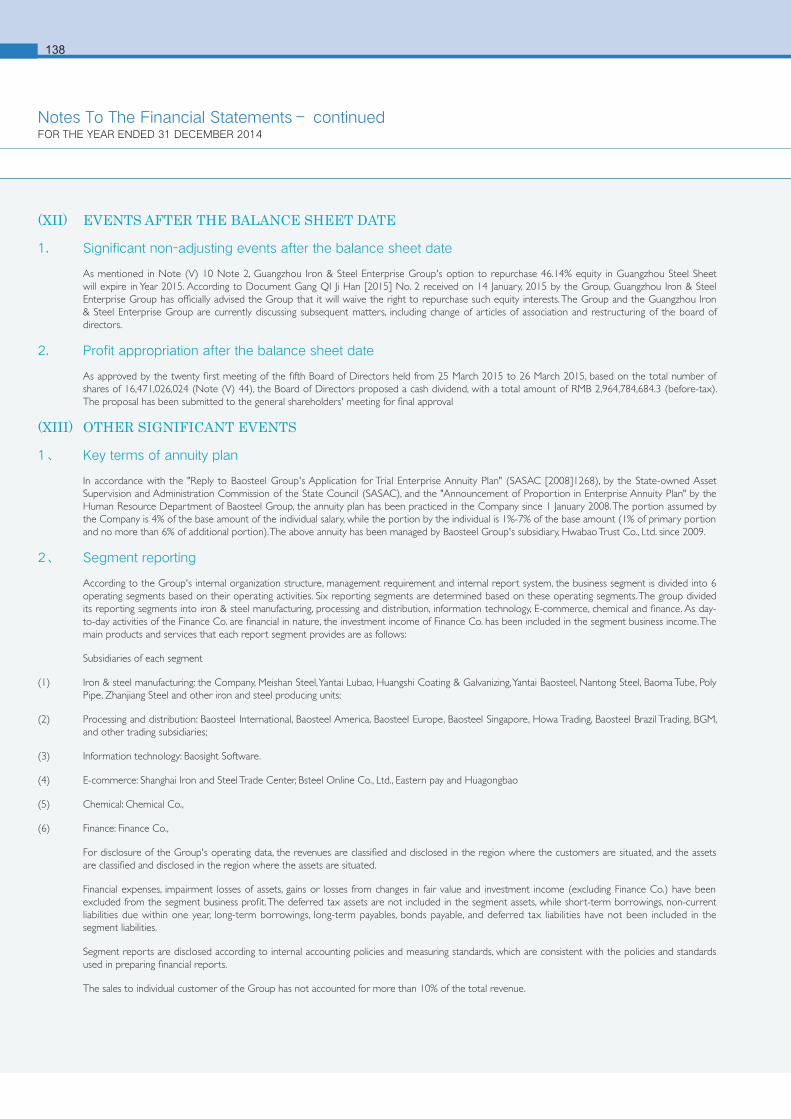
6138
(XII) EVENTS AFTER THE BALANCE SHEET DATE
1. Significant non-adjusting events after the balance sheet date
As mentioned in Note (V) 10 Note 2, Guangzhou Iron & Steel Enterprise Group's option to repurchase 46.14% equity in Guangzhou Steel Sheet will expire in Year 2015. According to Document Gang QI Ji Han [2015] No. 2 received on 14 January, 2015 by the Group, Guangzhou Iron & Steel Enterprise Group has officially advised the Group that it will waive the right to repurchase such equity interests. The Group and the Guangzhou Iron & Steel Enterprise Group are currently discussing subsequent matters, including change of articles of association and restructuring of the board of directors.
2. Profit appropriation after the balance sheet date
As approved by the twenty first meeting of the fifth Board of Directors held from 25 March 2015 to 26 March 2015, based on the total number of shares of 16,471,026,024 (Note (V) 44), the Board of Directors proposed a cash dividend, with a total amount of RMB 2,964,784,684.3 (before-tax). The proposal has been submitted to the general shareholders' meeting for final approval
(XIII) OTHER SIGNIFICANT EVENTS
1、 Key terms of annuity plan
In accordance with the "Reply to Baosteel Group's Application for Trial Enterprise Annuity Plan" (SASAC [2008]1268), by the State-owned Asset Supervision and Administration Commission of the State Council (SASAC), and the "Announcement of Proportion in Enterprise Annuity Plan" by the Human Resource Department of Baosteel Group, the annuity plan has been practiced in the Company since 1 January 2008. The portion assumed by the Company is 4% of the base amount of the individual salary, while the portion by the individual is 1%-7% of the base amount (1% of primary portion and no more than 6% of additional portion). The above annuity has been managed by Baosteel Group's subsidiary, Hwabao Trust Co., Ltd. since 2009.
2、 Segment reporting
According to the Group's internal organization structure, management requirement and internal report system, the business segment is divided into 6 operating segments based on their operating activities. Six reporting segments are determined based on these operating segments. The group divided its reporting segments into iron & steel manufacturing, processing and distribution, information technology, E-commerce, chemical and finance. As day-to-day activities of the Finance Co. are financial in nature, the investment income of Finance Co. has been included in the segment business income. The main products and services that each report segment provides are as follows:
Subsidiaries of each segment
(1) Iron & steel manufacturing: the Company, Meishan Steel, Yantai Lubao, Huangshi Coating & Galvanizing, Yantai Baosteel, Nantong Steel, Baoma Tube, Poly Pipe, Zhanjiang Steel and other iron and steel producing units;
(2) Processing and distribution: Baosteel International, Baosteel America, Baosteel Europe, Baosteel Singapore, Howa Trading, Baosteel Brazil Trading, BGM, and other trading subsidiaries;
(3) Information technology: Baosight Software.
(4) E-commerce: Shanghai Iron and Steel Trade Center, Bsteel Online Co., Ltd., Eastern pay and Huagongbao
(5) Chemical: Chemical Co.,
(6) Finance: Finance Co.,
For disclosure of the Group's operating data, the revenues are classified and disclosed in the region where the customers are situated, and the assets are classified and disclosed in the region where the assets are situated.
Financial expenses, impairment losses of assets, gains or losses from changes in fair value and investment income (excluding Finance Co.) have been excluded from the segment business profit. The deferred tax assets are not included in the segment assets, while short-term borrowings, non-current liabilities due within one year, long-term borrowings, long-term payables, bonds payable, and deferred tax liabilities have not been included in the segment liabilities.
Segment reports are disclosed according to internal accounting policies and measuring standards, which are consistent with the policies and standards used in preparing financial reports.
The sales to individual customer of the Group has not accounted for more than 10% of the total revenue.
Notes To The Financial Statements– continuedFOR THE YEAR ENDED 31 DECEMBER 2014

139
Notes To The Financial Statements– continuedFOR THE YEAR ENDED 31 DECEMBER 2014
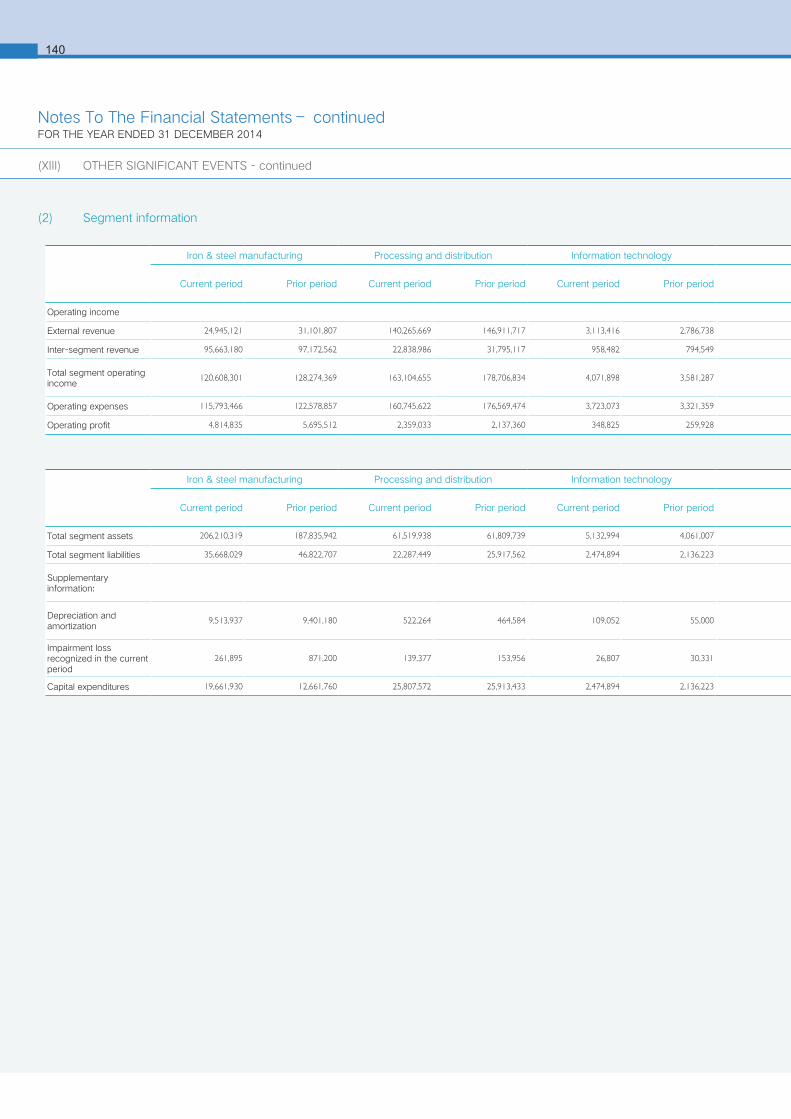
6140
(2) Segment information
Iron & steel manufacturing Processing and distribution Information technology E-commerce Chemical Finance Inter-segment eliminations Total
Current period Prior period Current period Prior period Current period Prior period Current period Prior period Current period Prior period Current period Prior period Current period Prior period Current period Prior period
Operating income
External revenue 24,945,121 31,101,807 140,265,669 146,911,717 3,113,416 2,786,738 15,071,369 3,479,019 4,012,246 5,401,893 465,577 403,811 - - 187,873,398 190,084,985
Inter-segment revenue 95,663,180 97,172,562 22,838,986 31,795,117 958,482 794,549 37,573 27,046 5,206,878 5,528,900 153,573 180,301 -124,858,672 -135,498,475 - -
Total segment operating income
120,608,301 128,274,369 163,104,655 178,706,834 4,071,898 3,581,287 15,108,942 3,506,065 9,219,124 10,930,793 619,150 584,112 -124,858,672 -135,498,475 187,873,398 190,084,985
Operating expenses 115,793,466 122,578,857 160,745,622 176,569,474 3,723,073 3,321,359 15,111,722 3,512,345 8,692,111 10,191,635 372,368 339,815 -124,850,687 -135,284,755 179,587,675 181,228,730
Operating profit 4,814,835 5,695,512 2,359,033 2,137,360 348,825 259,928 -2,780 -6,280 527,013 739,158 246,782 244,297 -7,985 -194,863 8,285,723 8,856,255
Iron & steel manufacturing Processing and distribution Information technology E-commerce Chemical Finance Inter-segment eliminations Total
Current period Prior period Current period Prior period Current period Prior period Current period Prior period Current period Prior period Current period Prior period Current period Prior period Current period Prior period
Total segment assets 206,210,319 187,835,942 61,519,938 61,809,739 5,132,994 4,061,007 639,636 467,533 5,287,354 5,852,465 13,008,550 12,528,655 -64,972,681 -47,939,779 226,826,110 224,615,562
Total segment liabilities 35,668,029 46,822,707 22,287,449 25,917,562 2,474,894 2,136,223 441,796 273,198 1,175,300 1,504,341 11,166,837 10,799,396 -21,161,501 -39,263,659 52,052,804 48,189,768
Supplementary information:
Depreciation and amortization
9,513,937 9,401,180 522,264 464,584 109,052 55,000 16,320 8,649 352,517 382,002 6,712 4,589 - - 10,520,802 10,316,004
Impairment loss recognized in the current period
261,895 871,200 139,377 153,956 26,807 30,331 60 -450 54,239 -6,181 47,215 -8,874 -54,465 1,348,335 475,128 2,388,317
Capital expenditures 19,661,930 12,661,760 25,807,572 25,913,433 2,474,894 2,136,223 42,787 18,032 508,231 273,500 8,833 11,840 - -11,638 48,504,247 41,003,150
(XIII) OTHER SIGNIFICANT EVENTS - continued
Notes To The Financial Statements– continuedFOR THE YEAR ENDED 31 DECEMBER 2014
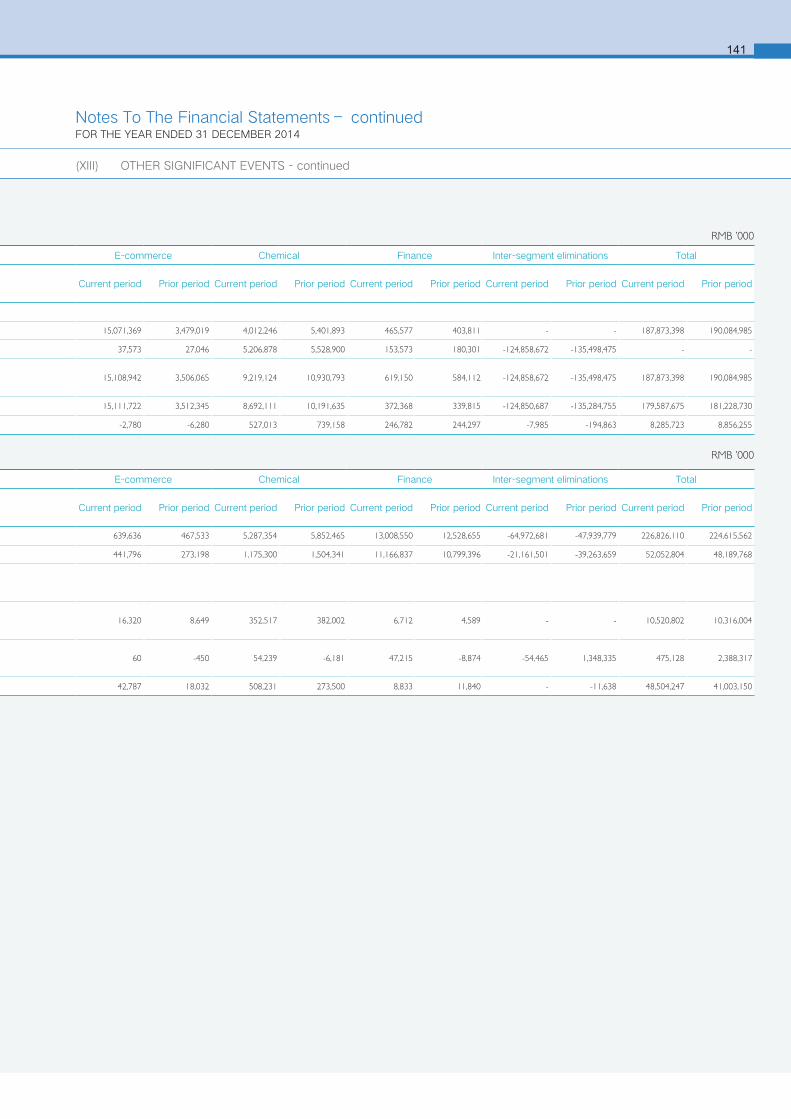
141
Iron & steel manufacturing Processing and distribution Information technology E-commerce Chemical Finance Inter-segment eliminations Total
Current period Prior period Current period Prior period Current period Prior period Current period Prior period Current period Prior period Current period Prior period Current period Prior period Current period Prior period
Operating income
External revenue 24,945,121 31,101,807 140,265,669 146,911,717 3,113,416 2,786,738 15,071,369 3,479,019 4,012,246 5,401,893 465,577 403,811 - - 187,873,398 190,084,985
Inter-segment revenue 95,663,180 97,172,562 22,838,986 31,795,117 958,482 794,549 37,573 27,046 5,206,878 5,528,900 153,573 180,301 -124,858,672 -135,498,475 - -
Total segment operating income
120,608,301 128,274,369 163,104,655 178,706,834 4,071,898 3,581,287 15,108,942 3,506,065 9,219,124 10,930,793 619,150 584,112 -124,858,672 -135,498,475 187,873,398 190,084,985
Operating expenses 115,793,466 122,578,857 160,745,622 176,569,474 3,723,073 3,321,359 15,111,722 3,512,345 8,692,111 10,191,635 372,368 339,815 -124,850,687 -135,284,755 179,587,675 181,228,730
Operating profit 4,814,835 5,695,512 2,359,033 2,137,360 348,825 259,928 -2,780 -6,280 527,013 739,158 246,782 244,297 -7,985 -194,863 8,285,723 8,856,255
Iron & steel manufacturing Processing and distribution Information technology E-commerce Chemical Finance Inter-segment eliminations Total
Current period Prior period Current period Prior period Current period Prior period Current period Prior period Current period Prior period Current period Prior period Current period Prior period Current period Prior period
Total segment assets 206,210,319 187,835,942 61,519,938 61,809,739 5,132,994 4,061,007 639,636 467,533 5,287,354 5,852,465 13,008,550 12,528,655 -64,972,681 -47,939,779 226,826,110 224,615,562
Total segment liabilities 35,668,029 46,822,707 22,287,449 25,917,562 2,474,894 2,136,223 441,796 273,198 1,175,300 1,504,341 11,166,837 10,799,396 -21,161,501 -39,263,659 52,052,804 48,189,768
Supplementary information:
Depreciation and amortization
9,513,937 9,401,180 522,264 464,584 109,052 55,000 16,320 8,649 352,517 382,002 6,712 4,589 - - 10,520,802 10,316,004
Impairment loss recognized in the current period
261,895 871,200 139,377 153,956 26,807 30,331 60 -450 54,239 -6,181 47,215 -8,874 -54,465 1,348,335 475,128 2,388,317
Capital expenditures 19,661,930 12,661,760 25,807,572 25,913,433 2,474,894 2,136,223 42,787 18,032 508,231 273,500 8,833 11,840 - -11,638 48,504,247 41,003,150
RMB ’000
RMB ’000
(XIII) OTHER SIGNIFICANT EVENTS - continued
Notes To The Financial Statements– continuedFOR THE YEAR ENDED 31 DECEMBER 2014

6142
(3) External revenue by geographical area of source and non-current assets by geographical location
External revenue includes:
The items excluding segment profit, segment assets and segment liabilities are set out as follows:
The segment profit does not include:
Segment assets do not include
Segment liabilities do not include:
RMB ’000
RMB ’000
RMB ’000
RMB ’000
RMB ’000
RMB ’000
Item Amount recognized in the current period Amount recognized in the prior period
External revenue from domestic customers 166,816,092 170,877,417
External revenue from foreign customers 21,057,306 19,207,568
Sub-total 187,873,398 190,084,985
Item Amount at the end of period Amount at the beginning of period
Non-current assets located in domestic country 152,880,035 147,242,094
Non-current assets located in foreign countries 1,386,476 1,405,745
Sub-total 154,266,511 148,647,839
Item Amount recognized in the current period Amount recognized in the prior period
Financial expenses 487,714 -544,132
Impairment losses of assets 475,128 2,388,317
Losses from changes in fair values -23,347 -27,586
Investment income (excluding Finance Co.) -294,518 -625,035
Total 644,977 1,191,564
Item Amount at the end of period Amount at the beginning of period
Short-term borrowings 31,480,012 34,470,625
Non-current liabilities due within one year 7,442,007 12,227,658
Other current liabilities - 1,848,867
Long-term borrowings 9,936,435 4,702,447
Long-term payables 89,287 -
Bonds payable 3,024,076 3,502,708
Deferred tax liabilities 423,067 304,859
Total 52,394,884 57,057,164
Item Amount recognized in the current period Amount recognized in the prior period
Investment income of Finance Co. 84,388 59,019
Item Amount at the end of period Amount at the beginning of period
Deferred tax assets 1,826,404 2,088,777
Note: Non-current assets belong to the region they are situated, excluding financial assets and deferred tax assets.
Notes To The Financial Statements– continuedFOR THE YEAR ENDED 31 DECEMBER 2014
(XIII) OTHER SIGNIFICANT EVENTS - continued
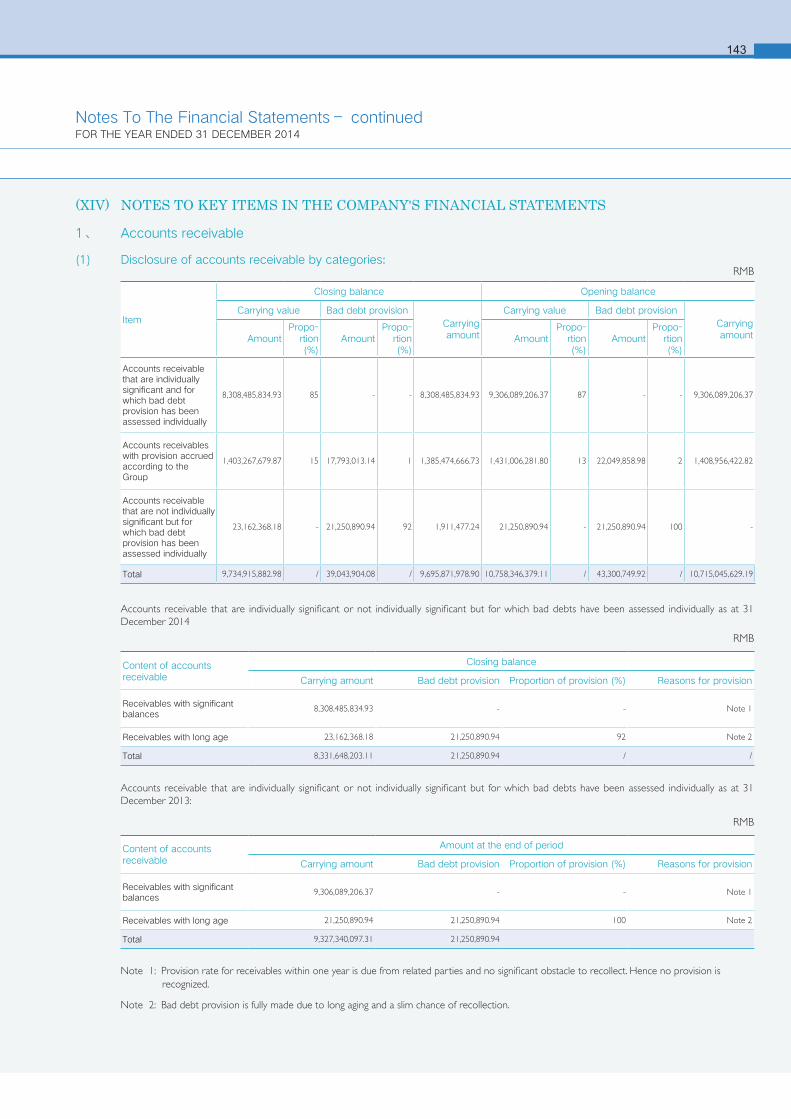
143
(XIV) NOTES TO KEY ITEMS IN THE COMPANY'S FINANCIAL STATEMENTS
1、 Accounts receivable
(1) Disclosure of accounts receivable by categories:
Accounts receivable that are individually significant or not individually significant but for which bad debts have been assessed individually as at 31 December 2014
Accounts receivable that are individually significant or not individually significant but for which bad debts have been assessed individually as at 31 December 2013:
Note 1: Provision rate for receivables within one year is due from related parties and no significant obstacle to recollect. Hence no provision is recognized.
Note 2: Bad debt provision is fully made due to long aging and a slim chance of recollection.
RMB
RMB
RMB
Item
Closing balance Opening balance
Carrying value Bad debt provisionCarrying amount
Carrying value Bad debt provisionCarrying amountAmount
Propo-rtion (%)
AmountPropo-
rtion (%)
AmountPropo-
rtion (%)
AmountPropo-
rtion (%)
Accounts receivable that are individually significant and for which bad debt provision has been assessed individually
8,308,485,834.93 85 - - 8,308,485,834.93 9,306,089,206.37 87 - - 9,306,089,206.37
Accounts receivables with provision accrued according to the Group
1,403,267,679.87 15 17,793,013.14 1 1,385,474,666.73 1,431,006,281.80 13 22,049,858.98 2 1,408,956,422.82
Accounts receivable that are not individually significant but for which bad debt provision has been assessed individually
23,162,368.18 - 21,250,890.94 92 1,911,477.24 21,250,890.94 - 21,250,890.94 100 -
Total 9,734,915,882.98 / 39,043,904.08 / 9,695,871,978.90 10,758,346,379.11 / 43,300,749.92 / 10,715,045,629.19
Content of accounts receivable
Closing balance
Carrying amount Bad debt provision Proportion of provision (%) Reasons for provision
Receivables with significant balances
8,308,485,834.93 - - Note 1
Receivables with long age 23,162,368.18 21,250,890.94 92 Note 2
Total 8,331,648,203.11 21,250,890.94 / /
Content of accounts receivable
Amount at the end of period
Carrying amount Bad debt provision Proportion of provision (%) Reasons for provision
Receivables with significant balances
9,306,089,206.37 - - Note 1
Receivables with long age 21,250,890.94 21,250,890.94 100 Note 2
Total 9,327,340,097.31 21,250,890.94
Notes To The Financial Statements– continuedFOR THE YEAR ENDED 31 DECEMBER 2014
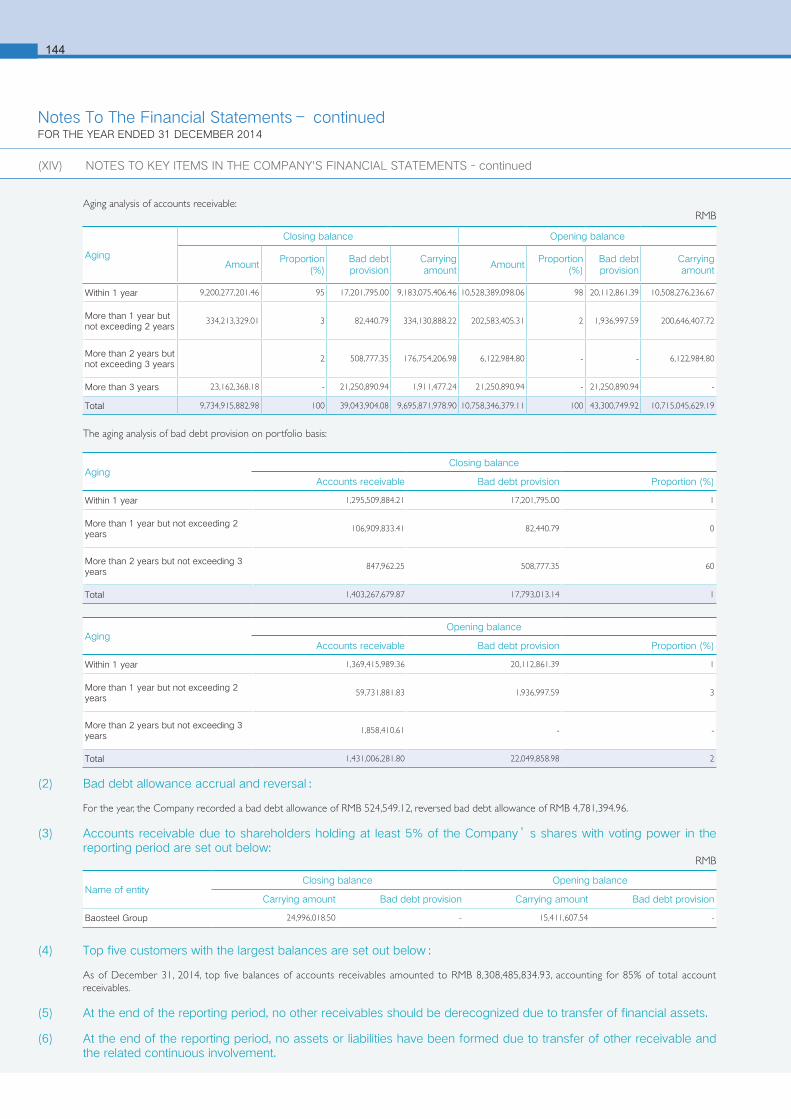
6144
Aging analysis of accounts receivable:
The aging analysis of bad debt provision on portfolio basis:
(2) Bad debt allowance accrual and reversal:
For the year, the Company recorded a bad debt allowance of RMB 524,549.12, reversed bad debt allowance of RMB 4,781,394.96.
(3) Accounts receivable due to shareholders holding at least 5% of the Company’s shares with voting power in the reporting period are set out below:
(4) Top five customers with the largest balances are set out below:
As of December 31, 2014, top five balances of accounts receivables amounted to RMB 8,308,485,834.93, accounting for 85% of total account receivables.
(5) At the end of the reporting period, no other receivables should be derecognized due to transfer of financial assets.
(6) At the end of the reporting period, no assets or liabilities have been formed due to transfer of other receivable and the related continuous involvement.
AgingClosing balance
Accounts receivable Bad debt provision Proportion (%)
Within 1 year 1,295,509,884.21 17,201,795.00 1
More than 1 year but not exceeding 2 years
106,909,833.41 82,440.79 0
More than 2 years but not exceeding 3 years
847,962.25 508,777.35 60
Total 1,403,267,679.87 17,793,013.14 1
AgingOpening balance
Accounts receivable Bad debt provision Proportion (%)
Within 1 year 1,369,415,989.36 20,112,861.39 1
More than 1 year but not exceeding 2 years
59,731,881.83 1,936,997.59 3
More than 2 years but not exceeding 3 years
1,858,410.61 - -
Total 1,431,006,281.80 22,049,858.98 2
RMB
RMB
Name of entityClosing balance Opening balance
Carrying amount Bad debt provision Carrying amount Bad debt provision
Baosteel Group 24,996,018.50 - 15,411,607.54 -
Aging
Closing balance Opening balance
AmountProportion
(%)Bad debt provision
Carrying amount
AmountProportion
(%)Bad debt provision
Carrying amount
Within 1 year 9,200,277,201.46 95 17,201,795.00 9,183,075,406.46 10,528,389,098.06 98 20,112,861.39 10,508,276,236.67
More than 1 year but not exceeding 2 years
334,213,329.01 3 82,440.79 334,130,888.22 202,583,405.31 2 1,936,997.59 200,646,407.72
More than 2 years but not exceeding 3 years
2 508,777.35 176,754,206.98 6,122,984.80 - - 6,122,984.80
More than 3 years 23,162,368.18 - 21,250,890.94 1,911,477.24 21,250,890.94 - 21,250,890.94 -
Total 9,734,915,882.98 100 39,043,904.08 9,695,871,978.90 10,758,346,379.11 100 43,300,749.92 10,715,045,629.19
(XIV) NOTES TO KEY ITEMS IN THE COMPANY'S FINANCIAL STATEMENTS - continued
Notes To The Financial Statements– continuedFOR THE YEAR ENDED 31 DECEMBER 2014
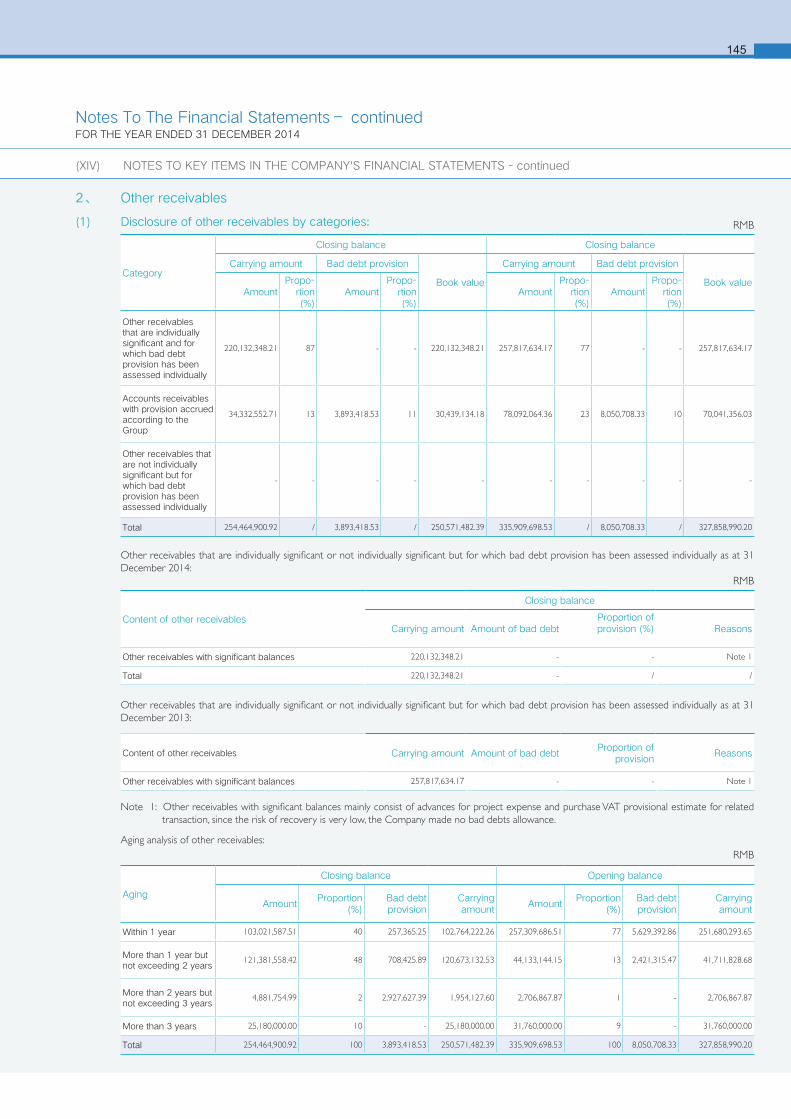
145
Other receivables that are individually significant or not individually significant but for which bad debt provision has been assessed individually as at 31 December 2014:
Other receivables that are individually significant or not individually significant but for which bad debt provision has been assessed individually as at 31 December 2013:
Note 1: Other receivables with significant balances mainly consist of advances for project expense and purchase VAT provisional estimate for related transaction, since the risk of recovery is very low, the Company made no bad debts allowance.
Aging analysis of other receivables:
Content of other receivables
Closing balance
Carrying amount Amount of bad debtProportion of provision (%) Reasons
Other receivables with significant balances 220,132,348.21 - - Note 1
Total 220,132,348.21 - / /
Content of other receivables Carrying amount Amount of bad debtProportion of
provisionReasons
Other receivables with significant balances 257,817,634.17 - - Note 1
RMB
RMB
2、 Other receivables
(1) Disclosure of other receivables by categories:
Category
Closing balance Closing balance
Carrying amount Bad debt provision
Book value
Carrying amount Bad debt provision
Book valueAmount
Propo-rtion (%)
AmountPropo-
rtion (%)
AmountPropo-
rtion (%)
AmountPropo-
rtion (%)
Other receivables that are individually significant and for which bad debt provision has been assessed individually
220,132,348.21 87 - - 220,132,348.21 257,817,634.17 77 - - 257,817,634.17
Accounts receivables with provision accrued according to the Group
34,332,552.71 13 3,893,418.53 11 30,439,134.18 78,092,064.36 23 8,050,708.33 10 70,041,356.03
Other receivables that are not individually significant but for which bad debt provision has been assessed individually
- - - - - - - - - -
Total 254,464,900.92 / 3,893,418.53 / 250,571,482.39 335,909,698.53 / 8,050,708.33 / 327,858,990.20
RMB
Aging
Closing balance Opening balance
AmountProportion
(%)Bad debt provision
Carrying amount
AmountProportion
(%)Bad debt provision
Carrying amount
Within 1 year 103,021,587.51 40 257,365.25 102,764,222.26 257,309,686.51 77 5,629,392.86 251,680,293.65
More than 1 year but not exceeding 2 years
121,381,558.42 48 708,425.89 120,673,132.53 44,133,144.15 13 2,421,315.47 41,711,828.68
More than 2 years but not exceeding 3 years
4,881,754.99 2 2,927,627.39 1,954,127.60 2,706,867.87 1 - 2,706,867.87
More than 3 years 25,180,000.00 10 - 25,180,000.00 31,760,000.00 9 - 31,760,000.00
Total 254,464,900.92 100 3,893,418.53 250,571,482.39 335,909,698.53 100 8,050,708.33 327,858,990.20
(XIV) NOTES TO KEY ITEMS IN THE COMPANY'S FINANCIAL STATEMENTS - continued
Notes To The Financial Statements– continuedFOR THE YEAR ENDED 31 DECEMBER 2014
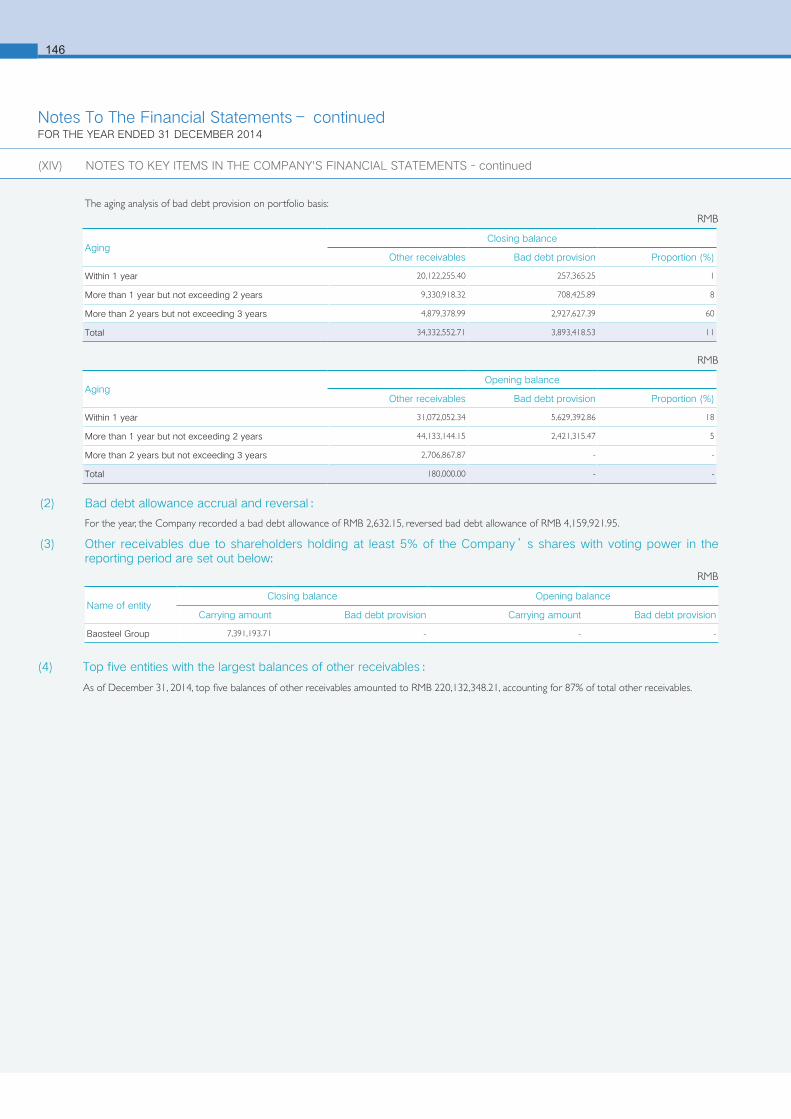
146
(4) Top five entities with the largest balances of other receivables:
As of December 31, 2014, top five balances of other receivables amounted to RMB 220,132,348.21, accounting for 87% of total other receivables.
(XIV) NOTES TO KEY ITEMS IN THE COMPANY'S FINANCIAL STATEMENTS - continued
The aging analysis of bad debt provision on portfolio basis:
(2) Bad debt allowance accrual and reversal:
For the year, the Company recorded a bad debt allowance of RMB 2,632.15, reversed bad debt allowance of RMB 4,159,921.95.
(3) Other receivables due to shareholders holding at least 5% of the Company’s shares with voting power in the reporting period are set out below:
AgingClosing balance
Other receivables Bad debt provision Proportion (%)
Within 1 year 20,122,255.40 257,365.25 1
More than 1 year but not exceeding 2 years 9,330,918.32 708,425.89 8
More than 2 years but not exceeding 3 years 4,879,378.99 2,927,627.39 60
Total 34,332,552.71 3,893,418.53 11
AgingOpening balance
Other receivables Bad debt provision Proportion (%)
Within 1 year 31,072,052.34 5,629,392.86 18
More than 1 year but not exceeding 2 years 44,133,144.15 2,421,315.47 5
More than 2 years but not exceeding 3 years 2,706,867.87 - -
Total 180,000.00 - -
Name of entityClosing balance Opening balance
Carrying amount Bad debt provision Carrying amount Bad debt provision
Baosteel Group 7,391,193.71 - - -
RMB
RMB
RMB
Notes To The Financial Statements– continuedFOR THE YEAR ENDED 31 DECEMBER 2014

147
Notes To The Financial Statements– continuedFOR THE YEAR ENDED 31 DECEMBER 2014
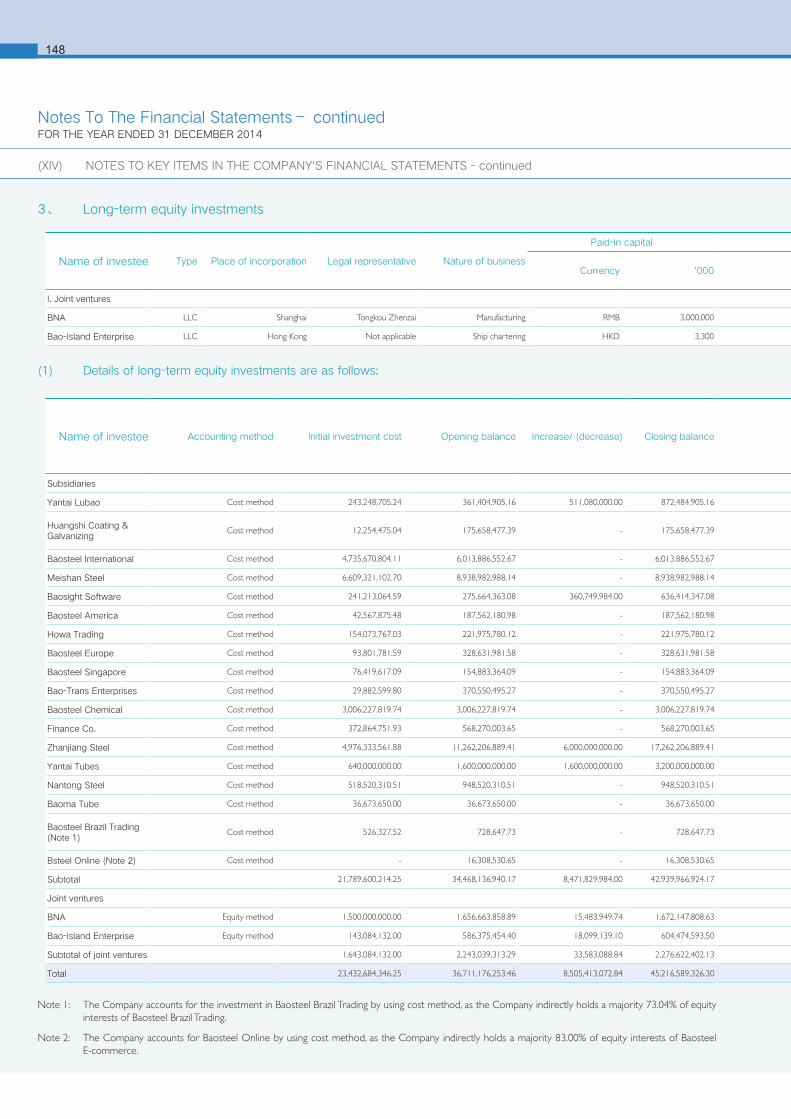
Name of investee Type Place of incorporation Legal representative Nature of business
Paid-in capitalProportion of equity interest held by the
Company (%)
Proportion of voting power in the investee held by the
Company (%)
Investee's total assets at the end
of the period
Investee's total liabilities at the end
of the period
Total net assets at the end of the
period
Total revenue for the period
Total net income for the periodCurrency '000
I. Joint ventures
BNA LLC Shanghai Tongkou Zhenzai Manufacturing RMB 3,000,000 50 50 4,298,417 957,671 3,344,296 12,109,260 136,594
Bao-Island Enterprise LLC Hong Kong Not applicable Ship chartering HKD 3,300 50 50 1,719,910 510,961 1,208,949 668,825 31,947
Name of investee Accounting method Initial investment cost Opening balance Increase/ (decrease) Closing balanceProportion of equity interest
held by the Company (%)
Proportion of voting power in the investee held by the
Company (%)
Explanation of the inconsistency between the
proportion of equity interest and the proportion of voting
power
Provision for impairment losses
Provision for impairment losses
for the period
Cash dividends for the period
Subsidiaries
Yantai Lubao Cost method 243,248,705.24 361,404,905.16 511,080,000.00 872,484,905.16 100 100 - - - -
Huangshi Coating & Galvanizing
Cost method 12,254,475.04 175,658,477.39 - 175,658,477.39 58.45 58.45 - - - 4,676,000.00
Baosteel International Cost method 4,735,670,804.11 6,013,886,552.67 - 6,013,886,552.67 100 100 - - - 942,759,744.45
Meishan Steel Cost method 6,609,321,102.70 8,938,982,988.14 - 8,938,982,988.14 77.04 77.04 - - - -
Baosight Software Cost method 241,213,064.59 275,664,363.08 360,749,984.00 636,414,347.08 55.5 55.5 - - - 48,505,636.56
Baosteel America Cost method 42,567,875.48 187,562,180.98 - 187,562,180.98 100 100 - - - -
Howa Trading Cost method 154,073,767.03 221,975,780.12 - 221,975,780.12 100 100 - - - -
Baosteel Europe Cost method 93,801,781.59 328,631,981.58 - 328,631,981.58 100 100 - - - -
Baosteel Singapore Cost method 76,419,617.09 154,883,364.09 - 154,883,364.09 100 100 - - - -
Bao-Trans Enterprises Cost method 29,882,599.80 370,550,495.27 - 370,550,495.27 100 100 - - - -
Baosteel Chemical Cost method 3,006,227,819.74 3,006,227,819.74 - 3,006,227,819.74 100 100 - - - 574,622,799.94
Finance Co. Cost method 372,864,751.93 568,270,003.65 - 568,270,003.65 62.1 62.1 - - - 40,737,600.00
Zhanjiang Steel Cost method 4,976,333,561.88 11,262,206,889.41 6,000,000,000.00 17,262,206,889.41 90 90 - - - -
Yantai Tubes Cost method 640,000,000.00 1,600,000,000.00 1,600,000,000.00 3,200,000,000.00 80 80 - - - -
Nantong Steel Cost method 518,520,310.51 948,520,310.51 - 948,520,310.51 95.82 95.82 - - - -
Baoma Tube Cost method 36,673,650.00 36,673,650.00 - 36,673,650.00 75 75 - - - -
Baosteel Brazil Trading (Note 1)
Cost method 526,327.52 728,647.73 - 728,647.73 26.96 26.96 - - - -
Bsteel Online (Note 2) Cost method - 16,308,530.65 - 16,308,530.65 17 17 - - - 1,519,414.63
Subtotal 21,789,600,214.25 34,468,136,940.17 8,471,829,984.00 42,939,966,924.17 1,612,821,195.58
Joint ventures
BNA Equity method 1,500,000,000.00 1,656,663,858.89 15,483,949.74 1,672,147,808.63 50 50 - - - 51,496,548.55
Bao-Island Enterprise Equity method 143,084,132.00 586,375,454.40 18,099,139.10 604,474,593.50 50 50 - - - -
Subtotal of joint ventures 1,643,084,132.00 2,243,039,313.29 33,583,088.84 2,276,622,402.13 51,496,548.55
Total 23,432,684,346.25 36,711,176,253.46 8,505,413,072.84 45,216,589,326.30 1,664,317,744.13
148
3、 Long-term equity investments
(1) Details of long-term equity investments are as follows:
(XIV) NOTES TO KEY ITEMS IN THE COMPANY'S FINANCIAL STATEMENTS - continued
Note 1: The Company accounts for the investment in Baosteel Brazil Trading by using cost method, as the Company indirectly holds a majority 73.04% of equity interests of Baosteel Brazil Trading.
Note 2: The Company accounts for Baosteel Online by using cost method, as the Company indirectly holds a majority 83.00% of equity interests of Baosteel E-commerce.
Notes To The Financial Statements– continuedFOR THE YEAR ENDED 31 DECEMBER 2014

Name of investee Type Place of incorporation Legal representative Nature of business
Paid-in capitalProportion of equity interest held by the
Company (%)
Proportion of voting power in the investee held by the
Company (%)
Investee's total assets at the end
of the period
Investee's total liabilities at the end
of the period
Total net assets at the end of the
period
Total revenue for the period
Total net income for the periodCurrency '000
I. Joint ventures
BNA LLC Shanghai Tongkou Zhenzai Manufacturing RMB 3,000,000 50 50 4,298,417 957,671 3,344,296 12,109,260 136,594
Bao-Island Enterprise LLC Hong Kong Not applicable Ship chartering HKD 3,300 50 50 1,719,910 510,961 1,208,949 668,825 31,947
Name of investee Accounting method Initial investment cost Opening balance Increase/ (decrease) Closing balanceProportion of equity interest
held by the Company (%)
Proportion of voting power in the investee held by the
Company (%)
Explanation of the inconsistency between the
proportion of equity interest and the proportion of voting
power
Provision for impairment losses
Provision for impairment losses
for the period
Cash dividends for the period
Subsidiaries
Yantai Lubao Cost method 243,248,705.24 361,404,905.16 511,080,000.00 872,484,905.16 100 100 - - - -
Huangshi Coating & Galvanizing
Cost method 12,254,475.04 175,658,477.39 - 175,658,477.39 58.45 58.45 - - - 4,676,000.00
Baosteel International Cost method 4,735,670,804.11 6,013,886,552.67 - 6,013,886,552.67 100 100 - - - 942,759,744.45
Meishan Steel Cost method 6,609,321,102.70 8,938,982,988.14 - 8,938,982,988.14 77.04 77.04 - - - -
Baosight Software Cost method 241,213,064.59 275,664,363.08 360,749,984.00 636,414,347.08 55.5 55.5 - - - 48,505,636.56
Baosteel America Cost method 42,567,875.48 187,562,180.98 - 187,562,180.98 100 100 - - - -
Howa Trading Cost method 154,073,767.03 221,975,780.12 - 221,975,780.12 100 100 - - - -
Baosteel Europe Cost method 93,801,781.59 328,631,981.58 - 328,631,981.58 100 100 - - - -
Baosteel Singapore Cost method 76,419,617.09 154,883,364.09 - 154,883,364.09 100 100 - - - -
Bao-Trans Enterprises Cost method 29,882,599.80 370,550,495.27 - 370,550,495.27 100 100 - - - -
Baosteel Chemical Cost method 3,006,227,819.74 3,006,227,819.74 - 3,006,227,819.74 100 100 - - - 574,622,799.94
Finance Co. Cost method 372,864,751.93 568,270,003.65 - 568,270,003.65 62.1 62.1 - - - 40,737,600.00
Zhanjiang Steel Cost method 4,976,333,561.88 11,262,206,889.41 6,000,000,000.00 17,262,206,889.41 90 90 - - - -
Yantai Tubes Cost method 640,000,000.00 1,600,000,000.00 1,600,000,000.00 3,200,000,000.00 80 80 - - - -
Nantong Steel Cost method 518,520,310.51 948,520,310.51 - 948,520,310.51 95.82 95.82 - - - -
Baoma Tube Cost method 36,673,650.00 36,673,650.00 - 36,673,650.00 75 75 - - - -
Baosteel Brazil Trading (Note 1)
Cost method 526,327.52 728,647.73 - 728,647.73 26.96 26.96 - - - -
Bsteel Online (Note 2) Cost method - 16,308,530.65 - 16,308,530.65 17 17 - - - 1,519,414.63
Subtotal 21,789,600,214.25 34,468,136,940.17 8,471,829,984.00 42,939,966,924.17 1,612,821,195.58
Joint ventures
BNA Equity method 1,500,000,000.00 1,656,663,858.89 15,483,949.74 1,672,147,808.63 50 50 - - - 51,496,548.55
Bao-Island Enterprise Equity method 143,084,132.00 586,375,454.40 18,099,139.10 604,474,593.50 50 50 - - - -
Subtotal of joint ventures 1,643,084,132.00 2,243,039,313.29 33,583,088.84 2,276,622,402.13 51,496,548.55
Total 23,432,684,346.25 36,711,176,253.46 8,505,413,072.84 45,216,589,326.30 1,664,317,744.13
149
RMB ’000
RMB ’000
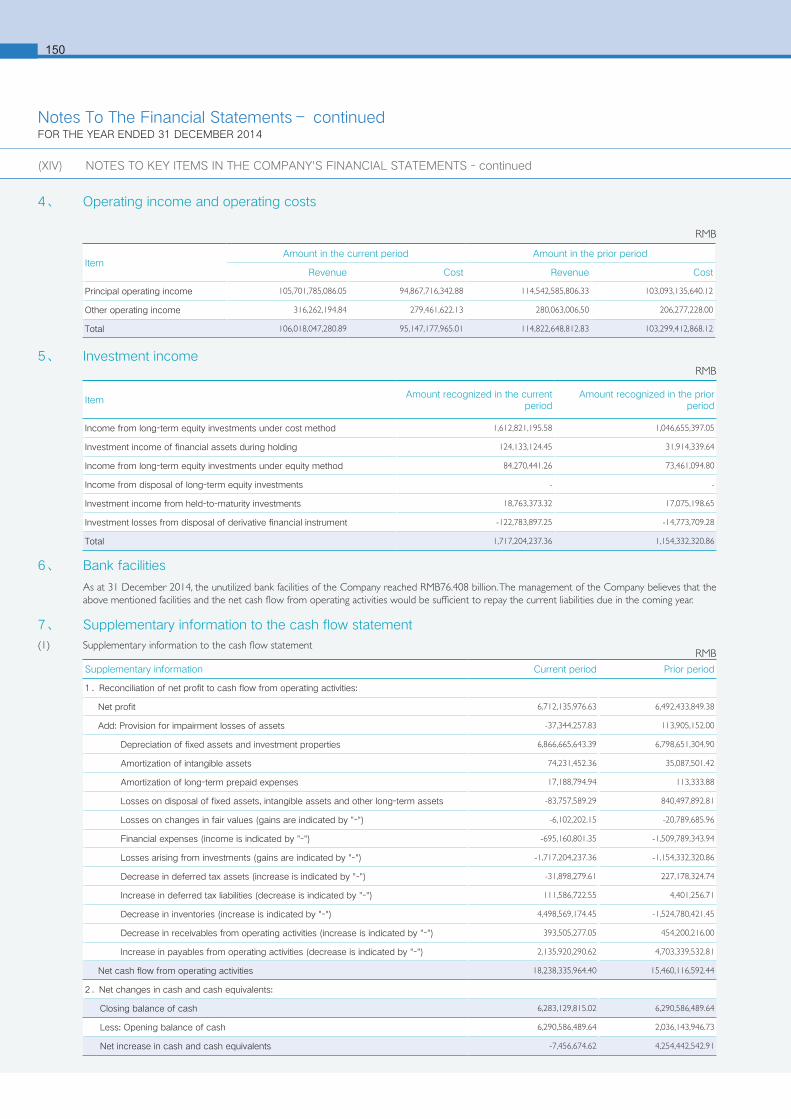
6150
RMBSupplementary information Current period Prior period
1.Reconciliation of net profit to cash flow from operating activities:
Net profit 6,712,135,976.63 6,492,433,849.38
Add: Provision for impairment losses of assets -37,344,257.83 113,905,152.00
Depreciation of fixed assets and investment properties 6,866,665,643.39 6,798,651,304.90
Amortization of intangible assets 74,231,452.36 35,087,501.42
Amortization of long-term prepaid expenses 17,188,794.94 113,333.88
Losses on disposal of fixed assets, intangible assets and other long-term assets -83,757,589.29 840,497,892.81
Losses on changes in fair values (gains are indicated by "-") -6,102,202.15 -20,789,685.96
Financial expenses (income is indicated by "-") -695,160,801.35 -1,509,789,343.94
Losses arising from investments (gains are indicated by "-") -1,717,204,237.36 -1,154,332,320.86
Decrease in deferred tax assets (increase is indicated by "-") -31,898,279.61 227,178,324.74
Increase in deferred tax liabilities (decrease is indicated by "-") 111,586,722.55 4,401,256.71
Decrease in inventories (increase is indicated by "-") 4,498,569,174.45 -1,524,780,421.45
Decrease in receivables from operating activities (increase is indicated by "-") 393,505,277.05 454,200,216.00
Increase in payables from operating activities (decrease is indicated by "-") 2,135,920,290.62 4,703,339,532.81
Net cash flow from operating activities 18,238,335,964.40 15,460,116,592.44
2.Net changes in cash and cash equivalents:
Closing balance of cash 6,283,129,815.02 6,290,586,489.64
Less: Opening balance of cash 6,290,586,489.64 2,036,143,946.73
Net increase in cash and cash equivalents -7,456,674.62 4,254,442,542.91
4、 Operating income and operating costs
5、 Investment income
6、 Bank facilities
As at 31 December 2014, the unutilized bank facilities of the Company reached RMB76.408 billion. The management of the Company believes that the above mentioned facilities and the net cash flow from operating activities would be sufficient to repay the current liabilities due in the coming year.
Item Amount in the current period Amount in the prior period
Revenue Cost Revenue Cost
Principal operating income 105,701,785,086.05 94,867,716,342.88 114,542,585,806.33 103,093,135,640.12
Other operating income 316,262,194.84 279,461,622.13 280,063,006.50 206,277,228.00
Total 106,018,047,280.89 95,147,177,965.01 114,822,648,812.83 103,299,412,868.12
RMB
RMB
ItemAmount recognized in the current
periodAmount recognized in the prior
period
Income from long-term equity investments under cost method 1,612,821,195.58 1,046,655,397.05
Investment income of financial assets during holding 124,133,124.45 31,914,339.64
Income from long-term equity investments under equity method 84,270,441.26 73,461,094.80
Income from disposal of long-term equity investments - -
Investment income from held-to-maturity investments 18,763,373.32 17,075,198.65
Investment losses from disposal of derivative financial instrument -122,783,897.25 -14,773,709.28
Total 1,717,204,237.36 1,154,332,320.86
7、 Supplementary information to the cash flow statement
(1) Supplementary information to the cash flow statement
Notes To The Financial Statements– continuedFOR THE YEAR ENDED 31 DECEMBER 2014
(XIV) NOTES TO KEY ITEMS IN THE COMPANY'S FINANCIAL STATEMENTS - continued
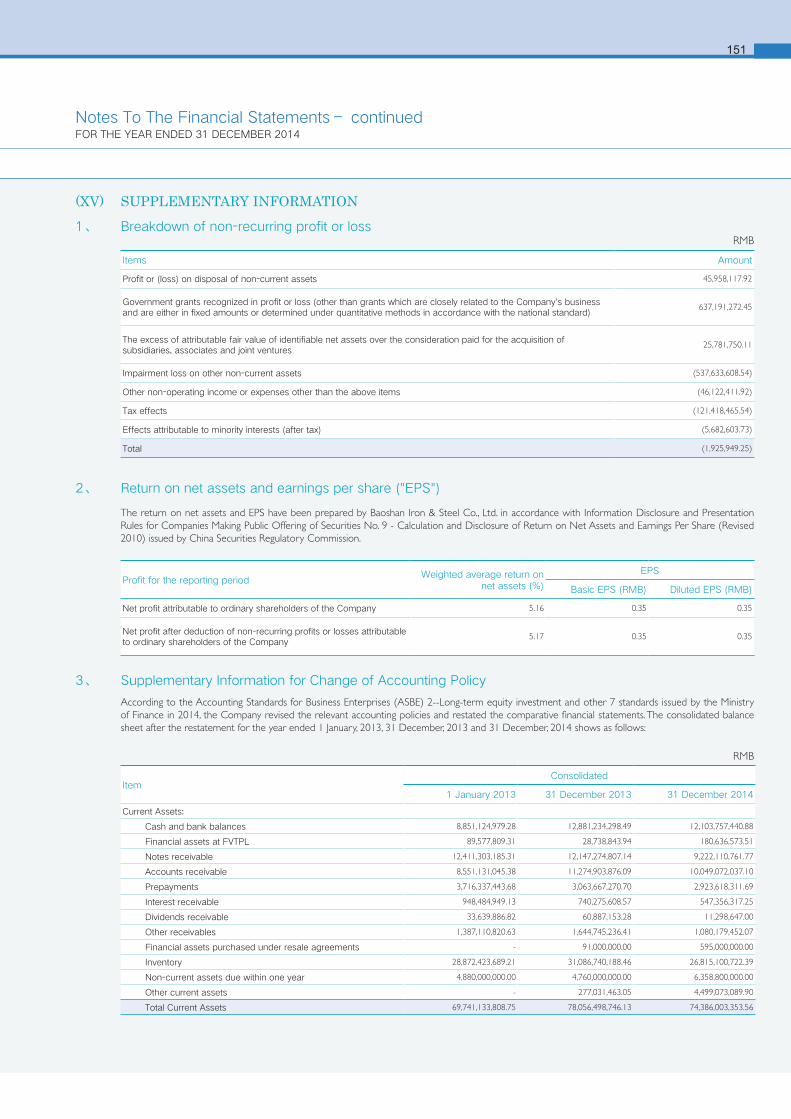
(XV) SUPPLEMENTARY INFORMATION1、 Breakdown of non-recurring profit or loss
2、 Return on net assets and earnings per share ("EPS")
RMB
Items Amount
Profit or (loss) on disposal of non-current assets 45,958,117.92
Government grants recognized in profit or loss (other than grants which are closely related to the Company's business and are either in fixed amounts or determined under quantitative methods in accordance with the national standard)
637,191,272.45
The excess of attributable fair value of identifiable net assets over the consideration paid for the acquisition of subsidiaries, associates and joint ventures
25,781,750.11
Impairment loss on other non-current assets (537,633,608.54)
Other non-operating income or expenses other than the above items (46,122,411.92)
Tax effects (121,418,465.54)
Effects attributable to minority interests (after tax) (5,682,603.73)
Total (1,925,949.25)
Profit for the reporting periodWeighted average return on
net assets (%)
EPS
Basic EPS (RMB) Diluted EPS (RMB)
Net profit attributable to ordinary shareholders of the Company 5.16 0.35 0.35
Net profit after deduction of non-recurring profits or losses attributable to ordinary shareholders of the Company
5.17 0.35 0.35
151
3、 Supplementary Information for Change of Accounting Policy
According to the Accounting Standards for Business Enterprises (ASBE) 2--Long-term equity investment and other 7 standards issued by the Ministry of Finance in 2014, the Company revised the relevant accounting policies and restated the comparative financial statements. The consolidated balance sheet after the restatement for the year ended 1 January, 2013, 31 December, 2013 and 31 December, 2014 shows as follows:
Item Consolidated
1 January 2013 31 December 2013 31 December 2014
Current Assets:
Cash and bank balances 8,851,124,979.28 12,881,234,298.49 12,103,757,440.88
Financial assets at FVTPL 89,577,809.31 28,738,843.94 180,636,573.51
Notes receivable 12,411,303,185.31 12,147,274,807.14 9,222,110,761.77
Accounts receivable 8,551,131,045.38 11,274,903,876.09 10,049,072,037.10
Prepayments 3,716,337,443.68 3,063,667,270.70 2,923,618,311.69
Interest receivable 948,484,949.13 740,275,608.57 547,356,317.25
Dividends receivable 33,639,886.82 60,887,153.28 11,298,647.00
Other receivables 1,387,110,820.63 1,644,745,236.41 1,080,179,452.07
Financial assets purchased under resale agreements - 91,000,000.00 595,000,000.00
Inventory 28,872,423,689.21 31,086,740,188.46 26,815,100,722.39
Non-current assets due within one year 4,880,000,000.00 4,760,000,000.00 6,358,800,000.00
Other current assets - 277,031,463.05 4,499,073,089.90
Total Current Assets 69,741,133,808.75 78,056,498,746.13 74,386,003,353.56
RMB
The return on net assets and EPS have been prepared by Baoshan Iron & Steel Co., Ltd. in accordance with Information Disclosure and Presentation Rules for Companies Making Public Offering of Securities No. 9 - Calculation and Disclosure of Return on Net Assets and Earnings Per Share (Revised 2010) issued by China Securities Regulatory Commission.
Notes To The Financial Statements– continuedFOR THE YEAR ENDED 31 DECEMBER 2014
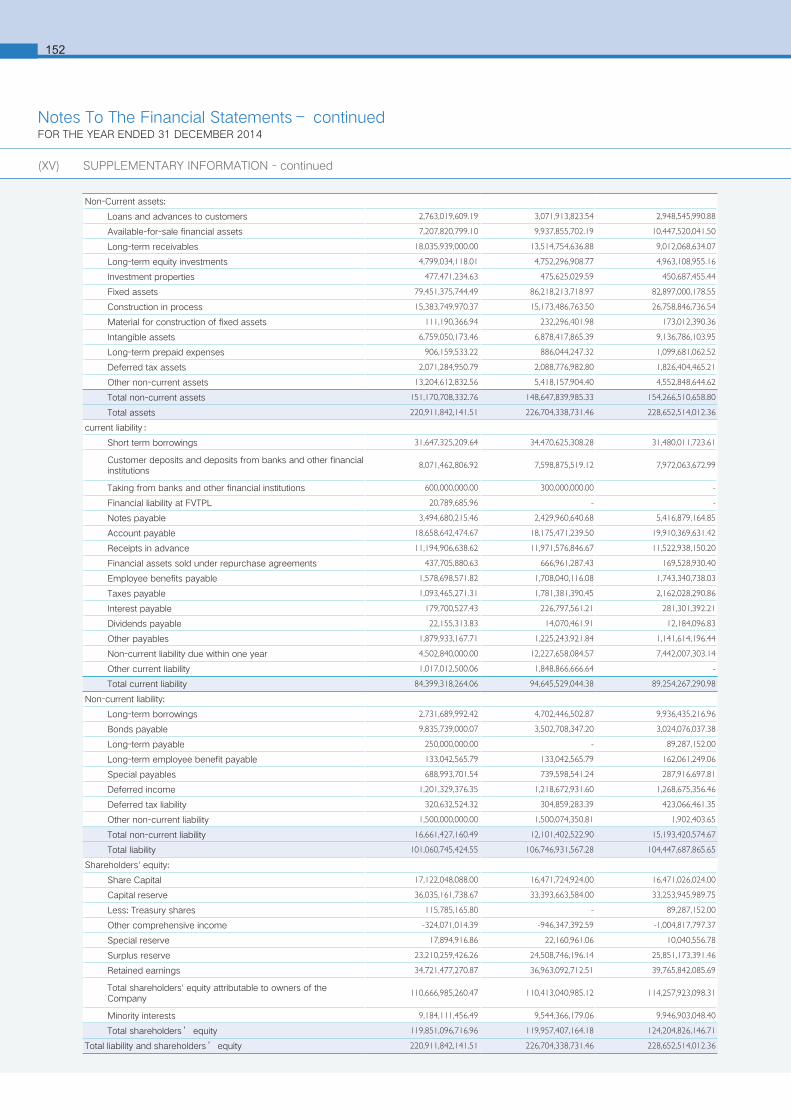
6152
Non-Current assets:
Loans and advances to customers 2,763,019,609.19 3,071,913,823.54 2,948,545,990.88
Available-for-sale financial assets 7,207,820,799.10 9,937,855,702.19 10,447,520,041.50
Long-term receivables 18,035,939,000.00 13,514,754,636.88 9,012,068,634.07
Long-term equity investments 4,799,034,118.01 4,752,296,908.77 4,963,108,955.16
Investment properties 477,471,234.63 475,625,029.59 450,687,455.44
Fixed assets 79,451,375,744.49 86,218,213,718.97 82,897,000,178.55
Construction in process 15,383,749,970.37 15,173,486,763.50 26,758,846,736.54
Material for construction of fixed assets 111,190,366.94 232,296,401.98 173,012,390.36
Intangible assets 6,759,050,173.46 6,878,417,865.39 9,136,786,103.95
Long-term prepaid expenses 906,159,533.22 886,044,247.32 1,099,681,062.52
Deferred tax assets 2,071,284,950.79 2,088,776,982.80 1,826,404,465.21
Other non-current assets 13,204,612,832.56 5,418,157,904.40 4,552,848,644.62
Total non-current assets 151,170,708,332.76 148,647,839,985.33 154,266,510,658.80
Total assets 220,911,842,141.51 226,704,338,731.46 228,652,514,012.36
current liability:
Short term borrowings 31,647,325,209.64 34,470,625,308.28 31,480,011,723.61
Customer deposits and deposits from banks and other financial institutions
8,071,462,806.92 7,598,875,519.12 7,972,063,672.99
Taking from banks and other financial institutions 600,000,000.00 300,000,000.00 -
Financial liability at FVTPL 20,789,685.96 - -
Notes payable 3,494,680,215.46 2,429,960,640.68 5,416,879,164.85
Account payable 18,658,642,474.67 18,175,471,239.50 19,910,369,631.42
Receipts in advance 11,194,906,638.62 11,971,576,846.67 11,522,938,150.20
Financial assets sold under repurchase agreements 437,705,880.63 666,961,287.43 169,528,930.40
Employee benefits payable 1,578,698,571.82 1,708,040,116.08 1,743,340,738.03
Taxes payable 1,093,465,271.31 1,781,381,390.45 2,162,028,290.86
Interest payable 179,700,527.43 226,797,561.21 281,301,392.21
Dividends payable 22,155,313.83 14,070,461.91 12,184,096.83
Other payables 1,879,933,167.71 1,225,243,921.84 1,141,614,196.44
Non-current liability due within one year 4,502,840,000.00 12,227,658,084.57 7,442,007,303.14
Other current liability 1,017,012,500.06 1,848,866,666.64 -
Total current liability 84,399,318,264.06 94,645,529,044.38 89,254,267,290.98
Non-current liability:
Long-term borrowings 2,731,689,992.42 4,702,446,502.87 9,936,435,216.96
Bonds payable 9,835,739,000.07 3,502,708,347.20 3,024,076,037.38
Long-term payable 250,000,000.00 - 89,287,152.00
Long-term employee benefit payable 133,042,565.79 133,042,565.79 162,061,249.06
Special payables 688,993,701.54 739,598,541.24 287,916,697.81
Deferred income 1,201,329,376.35 1,218,672,931.60 1,268,675,356.46
Deferred tax liability 320,632,524.32 304,859,283.39 423,066,461.35
Other non-current liability 1,500,000,000.00 1,500,074,350.81 1,902,403.65
Total non-current liability 16,661,427,160.49 12,101,402,522.90 15,193,420,574.67
Total liability 101,060,745,424.55 106,746,931,567.28 104,447,687,865.65
Shareholders' equity:
Share Capital 17,122,048,088.00 16,471,724,924.00 16,471,026,024.00
Capital reserve 36,035,161,738.67 33,393,663,584.00 33,253,945,989.75
Less: Treasury shares 115,785,165.80 - 89,287,152.00
Other comprehensive income -324,071,014.39 -946,347,392.59 -1,004,817,797.37
Special reserve 17,894,916.86 22,160,961.06 10,040,556.78
Surplus reserve 23,210,259,426.26 24,508,746,196.14 25,851,173,391.46
Retained earnings 34,721,477,270.87 36,963,092,712.51 39,765,842,085.69
Total shareholders' equity attributable to owners of the Company
110,666,985,260.47 110,413,040,985.12 114,257,923,098.31
Minority interests 9,184,111,456.49 9,544,366,179.06 9,946,903,048.40
Total shareholders’ equity 119,851,096,716.96 119,957,407,164.18 124,204,826,146.71
Total liability and shareholders’ equity 220,911,842,141.51 226,704,338,731.46 228,652,514,012.36
(XV) SUPPLEMENTARY INFORMATION - continued
Notes To The Financial Statements– continuedFOR THE YEAR ENDED 31 DECEMBER 2014
153
Section XII. Documents Available for Reference
Documents Available for Reference
1. Copy of the financial statements signed and sealed by the corporate representative, chief accountant
and person in charge of the accounting department;
2. The original copies of the Auditor’s Report sealed by the accounting firm and signed by the certified
public accountant;
3. All original copies of the documents and announcements published on the newspapers designated by
the China Securities Regulatory Committee during the reporting period.
Chairman: Chen Derong
Submission date approved by Board of Directors: March 26, 2015

Printed on recycled paper.


