Figure S1. Confirmation of LTB identify in BMDMs ... · TB 4) *** *** Fig. S3. RvD1 blocks...
19
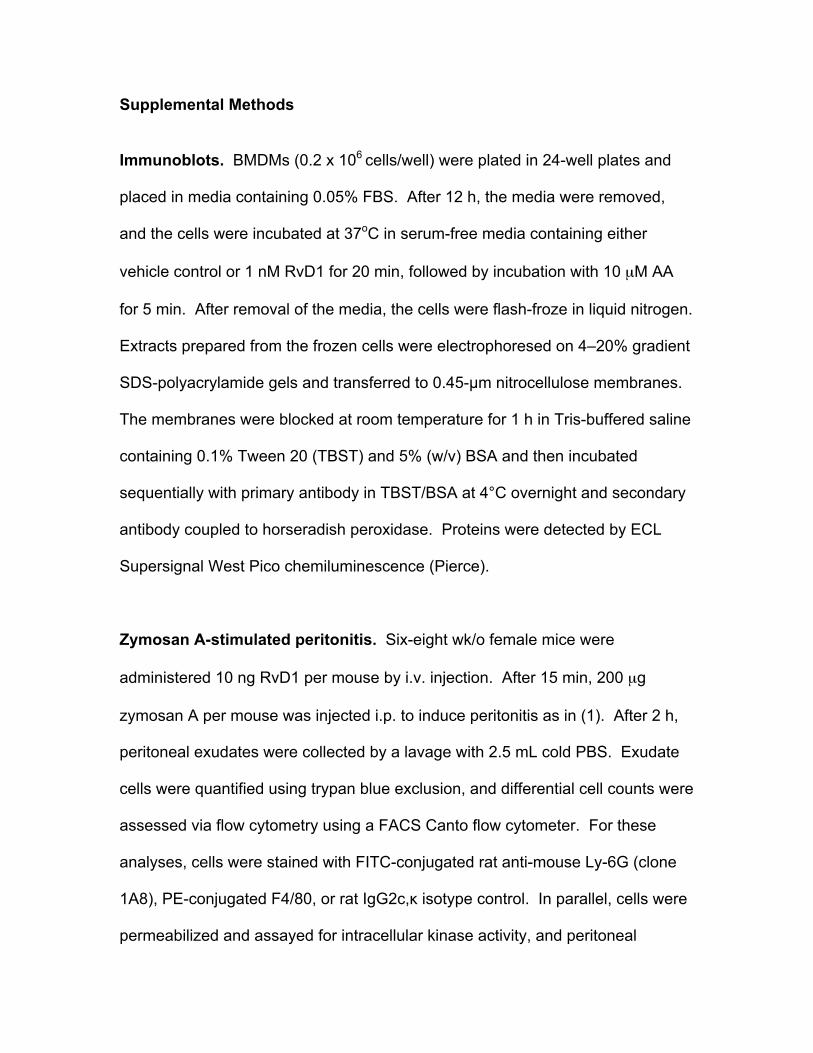
d4-LTB 4 6 trans-LTB 4 13.9 5 10 15 20 25 Time, min 0 14.2 LTB 4 Relative Intensity 0 0 100 100 100 14.2 A 0 100 200 300 400 500 600 0 5 10 15 Intensity, cps Time, min LTB 4 6 trans-LTB 4 B Figure S1. Confirmation of LTB 4 identify in BMDMs. (A) Representative MRM chromatograms of authentic standards of d4-LTB 4 (339>197), 6- trans-LTB 4 , and LTB 4 (335>195), with retention times indicated. (B) Representative MRM chromatogram of LTB 4 and 6-trans-LTB 4 (335>195) in BMDMs stimulated with AA.
Transcript of Figure S1. Confirmation of LTB identify in BMDMs ... · TB 4) *** *** Fig. S3. RvD1 blocks...

d4-LTB4
6 trans-LTB4
13.9
5 10 15 20 25 Time, min
0
14.2
LTB4
Rel
ativ
e In
tens
ity
0
0
100
100
100 14.2
A
0
100
200
300
400
500
600
0 5 10 15
Inte
nsity
, cps
Time, min
LTB4
6 trans-LTB4
B
Figure S1. Confirmation of LTB4 identify in BMDMs. (A) Representative
MRM chromatograms of authentic standards of d4-LTB4 (339>197), 6-
trans-LTB4, and LTB4 (335>195), with retention times indicated. (B)
Representative MRM chromatogram of LTB4 and 6-trans-LTB4 (335>195) in
BMDMs stimulated with AA.

0
50
100
150
200
250
300
350
400
LTB
4 (p
g/m
L)
*
ns
0
50
100
150
200
250
Veh AA AA+D1
LTB
4 (p
g/m
L)
*
B A
Fig. S2. RvD1 suppresses AA-stimulated LTB4 in elicited macrophages, requires
FPR2/ALX, and enhances LXA4 upstream of LTA4 hydrolase. (A) Peritoneal
macrophages were harvested from mice 72 h post i.p. zymosan and then incubated and
assayed for LTB4 as in Fig. 1B (n = 3; mean ± SEM; *P < 0.05 vs. AA). (B) BMDMs
were pre-treated the FPR2/ALX antagonist WRW4 (10 µM) for 20 min at 37oC and then
incubated and assayed for LTB4 as above (n = 3; mean ± SEM; *P < 0.05 vs. AA and
AA+D1+WR; n.s., non-significant). (C) BMDMs were incubated with 10 µM LTA4
instead of AA as in Fig. 1F, and LXA4 in the media was assayed (n = 3; n.s., non-
significant). NB: In this experiment, a PLA2 inhibitor was included in all incubations
ensure that LXA4 production was being driven by LTA4 rather than by AA released from
cellular phospholipids.
0
100
200
300
400
500
600
700
Veh D1 LTA4 LTA4+D1
LXA
4 (p
g/sa
mpl
e) ns C

0
10
20
30
40
50
60
70
80
0 0.01 0.1 1 10
Inhi
bitio
n of
LT
B4
by R
vD1
(%) ***
***
Fig. S3. RvD1 blocks AA-stimulated LTB4 in a dose-dependent
manner. BMDMs were preincubated with vehicle control, 0.01, 0.1, 1 or 10
nM RvD1 15 min, followed by incubation with 10 mM AA for 40 min. The
media were then assayed LTB4 by ELISA (n = 3 for ELISA; mean ± SEM;
***P < 0.001 vs. AA).

AA AA+ D1
AA+ Rp
AA+ D1+ Rp Rp V D1
p-MK2
β-actin
AA AA+ D1
AA+ 8-Br
AA+ D1+ 8-Br 8-Br V D1
p-MK2
β-actin
B
A
Fig. S4. Suppression of MK2 phosphorylation by RvD1 is mimicked by Rp-
cAMP and blocked by 8-bromo-cAMP. (A-B) BMDMs were preincubated for 15 mins
with vehicle control (V), RvD1 (D1), Rp-cAMP (Rp), 8-bromo-cAMP (8-Br), or the
indicated combinations. The cells were then incubated for 5 min with 10 µM AA. Cell
lysates were immunoblotted for phospho-MK2 and β-actin.

Fig. S5. RvD1 decreases nuclear localization of 5-LOX through
inhibition of P38 signaling. Incubations were carried out as in Fig 2C.
BMDMs were viewed by confocal microscopy at 40x magnification; the
macrophages in each image is outlined (bar = 5µM). 5-LOX is green and
the nuclear DAPI stain is blue.
Veh
AA
D1
AA+ D1
AA+ SB AA+ SB +D1

S271A 5-LOX- transfected cells
FITC-Myc-DKK
5-LOX- transfected cells
FITC-Myc-DKK
Cou
nt
IgG IgG
Fig. S6. Transfection of plasmids into macrophages. BMDMs were
transfected with a complex of FLAG-tagged 5-LOX or S271A 5-LOX plasmids
and Jet-Pei-Man reagent. After 72 h, the cells were subjected to flow
cytometric analysis for anti-FLAG fluorescence. Representative flow
cytometry histograms are shown.

Veh LXA4 AA AA + LXA4
p-CaMKII
β-actin
Veh LXA4 AA AA + LXA4
p-MK2
0.0
0.2
0.4
0.6
0.8
1.0
1.2
1.4
Veh LXA4 AA LXA4+AA P
hosp
ho-k
inas
e:β-
actin
(A
U) pCaMKII
pMK2
# **
Fig. S7. LXA4 suppresses activation of CaMKII and MK2 and decreases
LTB4 synthesis. (A) BMDMs were incubated with 1 nM LXA4 or vehicle for
20 min at 37oC and then treated with 10 µM AA or vehicle for 5 min at 37oC.
Cell lysates were subjected to immunoblotting for phospho-CaMKII and
phospho-MK2 and quantified by densitometry (n = 3; mean ± SEM; #P <
0.001 vs. AA).
β-actin

0.0
0.5
1.0
1.5
2.0
2.5
3.0
3.5
0 20 40 60 80
Flu
o 3
(M
FI)
Time (sec)
AA
AA+D1
A
1.0
1.5
2.0
2.5
3.0
3.5
4.0
4.5
5.0
0 20 40 60 80
Flu
o3
(MF
I)
ATP
ATP + D1
Time (sec)
C
D
3
4
5
6
7
8
9
10
0 50 100
Flu
o 3
(M
FI)
Time (sec)
fMLP
fMLP+D1
D1 alone
0
B
0
10
20
30
40
50
60
70
80
AA ATP fMLP
Pea
k ca
lciu
m r
elat
ive
to
RvD
1 (%
)
***
** **
+D1 +D1 +D1
Fig. S8. RvD1 suppresses AA- or ATP-stimulated intracellular
calcium increase. BMDMs were incubated with the calcium probe Fluo3
for 20 min in HBSS containing calcium, magnesium, 25 mM glucose, and
1:100 PowerLoadTM, which helps solubilize the Fluo3 dye and contains
probenicid for dye retention. Excess Fluo3 was removed, and BMDMs
were then stimulated with 1 nM of RvD1 or vehicle control for another 20
min. 10 µM AA (A), 10 µM ATP (B) or 1 µM fMLP (C) was added, and
intracellular calcium was monitored by flow cytometry. (D) Percent peak
intracellular calcium was quantified relative to RvD1 alone (n = 3, mean ±
SEM; ***P<0.0001, **P<0.01 vs. RvD1 alone).

Camk2gfl/fl Mo
use
bra
in
α
β
γ
δ
GAPDH
Camk2gfl/fl
LysMCre+/-
peritoneal macrophages
Fig. S9. CaMKIIγ is the CaMKII isoform expressed in
macrophages and is deleted in macrophages from
Camk2gflflLysMCre+/- mice. Peritoneal macrophages were
harvested from Camk2gflflLysMCre+/- and control Camk2gflfl mice and
assayed for the indicated isoforms of CaMKII by immunoblot. Mouse
brain homogenate were used as a positive control for all four
isoforms. GAPDH is the loading control.

A
0
50
100
150
200
250
300
Veh AA AA+D1
LTB
4 (p
g/m
L)
*
LacZ
CA-CaMKII
V D1 AA AA+ D1 V D1 AA AA+ D1
LacZ CA-CaMKII
p-MK2
β-actin
B
0.0
0.5
1.0
1.5
2.0
2.5
3.0
3.5
Veh AA AA+D1
Nuc
lear
: non
-nuc
lear
(M
FI r
atio
)
*
LacZ
CA-CaMKII
LacZ
CA-CaMKII
C
LacZ
CA-CaMKII
RvD1 AA AA + RvD1 Veh
0.0
0.2
0.4
0.6
0.8
1.0
Veh AA AA+D1
pMK
2:A
ctin
(A
U)
**
LacZ- Veh CA-CaMKII -Veh p-MK2
β-actin
Fig. S10. The suppressive action of RvD1 on AA-stimulated p-MK2 is abrogated in
macrophages overexpressing constitutively active CaMKII. BMDMs were transduced
with LacZ or a constitutively active CAMKII (CA-CaMKII). After 72 h, the cells were treated as
indicated. (A) Top blot is a representative p-MK2 immunoblot for all groups; because this blot
only shows 1 Veh lane for each group, a blot with multiple Veh lanes is shown underneath.
Densitometric ratio quantification is shown in the bar graph. (B) BMDMs were permeabilized
and stained with Alexa-488 anti-5-LOX antibody (green) and counterstained with the nuclear
stain DAPI (blue). Cells were viewed by confocal microscopy at 40x magnification; the
macrophage in each image is outlined (bar = 10 µm). Images were analyzed by ImageJ
software for MFI of nuclear vs. non-nuclear 5-LOX staining in 5-7 cells per field. (C) LTB4 was
monitored by ELISA. For all bar graphs, n = 3 separate experiment; mean ± SEM; **P < 0.01
and *P < 0.05 vs. AA .

0.0
0.2
0.4
0.6
0.8
1.0
1.2
1.4
AA AA+D1
LTB
4 (F
old
chan
ge)
0.0
0.2
0.4
0.6
0.8
1.0
1.2
AA AA+D1
LTB
4 (F
old
chan
ge)
**
IgG
Anti-GPR32
**
0
0.2
0.4
0.6
0.8
1
AA AA+D1
LTB
4 (F
old
chan
ge)
***
Veh D1 AA AA + D1
p-MK2
β-actin
0
200
400
600
800
1000
1200
Veh AA AA+D1
LTB
4 (p
g/m
L)
LacZ
K43A-CaMKII
* *
A B
C D
Fig. S11. RvD1 suppresses the CaMKII-MK2-LTB4 pathway in human
macrophages in a receptor dependent manner. (A) Top panel, Human monocyte-
derived macrophages were incubated with 1 nM RvD1 or vehicle for 20 min at 37oC
and then treated with 10 µM AA or vehicle for 5 min at 37oC. Cell lysates were
subjected to immunoblotting for phospho-MK2; the upper panel is a representative of
5 individual human donors, each analyzed in triplicate. Bottom panel, Incubations
and LTB4 ELISA were carried out as in Fig 1B (n = 5 ; mean ± SEM; ***P < 0.001 vs.
AA). (B,C) Incubations were carried out as above except that the cells were pre-
treated with antibodies against the FPR2/ALX and GPR32 receptors (n = 3 mean ±
SEM; * P < 0.05 vs. all other groups). (D) Human macrophages were transduced
with adenoviruses containing LacZ or dominant-negative K43A-CaMKII (each at 400
MOI) for 60 h and then incubated and assayed for LTB4 as above (n = 3 mean ± SEM;
* P < 0.05 vs. AA).
IgG
Anti-FPR2/ALX

0
50
100
150
200
250
Veh RvD1
LTB
4 (p
g/m
L)
*
D
0
0.2
0.4
0.6
0.8
1
Veh RvD1
Inh
ibit
ion
of
p-P
38
(F
old
ch
ang
e)
*
B
0
0.2
0.4
0.6
0.8
1
Veh RvD1
Inh
ibit
ion
of
p-M
K2
(F
old
Ch
ang
e) *
0.0
0.4
0.8
1.2
1.6
2.0
Veh RvD1
PM
N (
x106
cel
ls)
**
A
C
Fig. S12. RvD1 decreases macrophage p-MK2 and p-P38, LTB4, and
PMNs in zymosan peritonitis. Mice were injected i.v. with 10 ng RvD1 per
mouse or vehicle control, and 15 min later 200 µg zymosan A per mouse was
injected i.p. to induce peritonitis. Peritoneal lavages were obtained 2 h later.
(A,B) Leukocytes were collected and assayed for p-P38 and p-MK2 by flow
cytometry (n = 3, mean ± SEM; *P < 0.05. (C,D) Exudates were assayed for
LTB4 and PMN numbers (n = 4-5 mice/group, mean ± SEM; *P < 0.05 or **P <
0.01).

0
20
40
60
80
100
120
140
160
180
fl/fl Cre 5-
LOX
(M
FI)
n.s.
Ctrl
Camk2γfl/flLysMCre
Ctrl (Camk2γfl/fl)
FITC-5-LOX
Cou
nt
Fig. S13. 5-LOX protein levels are similar in CamK2γfl/fl and
CamK2γfl/flLysMCre+/- in zymosan-induced peritoneal exudate
cells. Peritoneal exudate cells from zymosan-injected CamK2γfl/fl (Ctrl)
and CamK2γfl/flLysMCre+/- (Cre) mice were analyzed by flow cytometry
for anti-5-LOX fluorescence. Representative flow cytometry histograms
and quantification of FITC-5-LOX expression are displayed (n = 3
separate mice, mean ± SEM; n.s., non-significant).

Ant
i-Ly6
G (
1A8)
Anti-FLAG Anti-FLAG
Ant
i-Ly6
G (
1A8)
2-h exudate No zymosan injection
Ly6G+Flag-
Ly6G-Flag+
Ly6G+Flag-
Ly6G-Flag+
Fig. S14. In-vivo transfection is specific to macrophages. Mice were
injected i.p. with a complex of FLAG-tagged Alox5 plasmid and Jet-Pei-Man
reagent. After 42 h, mice were inject i.p. with zymosan or vehicle control, and
2 h later, peritoneal cells were subjected to flow cytometric analysis for anti-
FLAG fluorescence in PMNs (Ly6G+) and macrophages (Ly6G-).
Representative flow cytometry histograms and dot plots are shown.

Fig. S15. Proposed scheme of RvD1-CaMKII-P38/MK2-LTB4 pathway. RvD1,
acting through the ALX or GPR32 receptor, decreases the increment in cytosolic
calcium stimulated by AA, thereby decreasing activation of CaMKII. As a result,
activation of the CaMKII-downstream kinases P38 and MK2 is suppressed, leading
to decreased phosphorylation of 5-LOX. The decrease in p-5-LOX promotes its
translocation from the nucleus to the cytoplasm, which leads to an decrease in LTB4
and an increase in LXA4. The scheme envisions the hypothesis, yet to be proven,
that nuclear 5-LOX favors LTB4 due to proximity to LTA4 hydrolase, while cytoplasmic
5-LOX favors LXA4 due to proximity to 12/15-LOX.
LTA4
LTA 4 hydrolase
LTB4 (pro-inflammatory)
P 5 - LOX
nucleus
MK2
FLAP
↑
↑
↑
RvD1
5 - LOX
LTA 4
12/15 - LOX
LXA 4 (pro-resolving)
X
X
X
↑CaMKII activity ↑P38/MK2 activity
X ↑ Ca2+i
arachidonic acid
arachidonic acid
arachidonic acid
ALX or
GPR32
LXA ↑ LTB4
Supplemental Methods Immunoblots. BMDMs (0.2 x 10⁶ cells/well) were plated in 24-well plates and
placed in media containing 0.05% FBS. After 12 h, the media were removed,
and the cells were incubated at 37oC in serum-free media containing either
vehicle control or 1 nM RvD1 for 20 min, followed by incubation with 10 µM AA
for 5 min. After removal of the media, the cells were flash-froze in liquid nitrogen.
Extracts prepared from the frozen cells were electrophoresed on 4–20% gradient
SDS-polyacrylamide gels and transferred to 0.45-µm nitrocellulose membranes.
The membranes were blocked at room temperature for 1 h in Tris-buffered saline
containing 0.1% Tween 20 (TBST) and 5% (w/v) BSA and then incubated
sequentially with primary antibody in TBST/BSA at 4°C overnight and secondary
antibody coupled to horseradish peroxidase. Proteins were detected by ECL
Supersignal West Pico chemiluminescence (Pierce).
Zymosan A-stimulated peritonitis. Six-eight wk/o female mice were
administered 10 ng RvD1 per mouse by i.v. injection. After 15 min, 200 µg
zymosan A per mouse was injected i.p. to induce peritonitis as in (1). After 2 h,
peritoneal exudates were collected by a lavage with 2.5 mL cold PBS. Exudate
cells were quantified using trypan blue exclusion, and differential cell counts were
assessed via flow cytometry using a FACS Canto flow cytometer. For these
analyses, cells were stained with FITC-conjugated rat anti-mouse Ly-6G (clone
1A8), PE-conjugated F4/80, or rat IgG2c,κ isotype control. In parallel, cells were
permeabilized and assayed for intracellular kinase activity, and peritoneal

exudate supernatants were subjected to LTB4 ELISA analysis. All procedures
were conducted in accordance with protocols approved by the Columbia
University Standing Committee on Animals guidelines for animal care (Protocol #
AC-AAAF7107).
Mice lacking macrophage CaMKIIγ . Camk2gfl/fl mice were generated by
flanking exon 1-2 with loxP sites and then crossed onto the C57BL/6J
background. LysMCre+/- mice were generated as described previously (2, 3).
Camk2gfl/fl and LysMCre+/- mice were crossed to generate the macrophage-
CaMKIIγ-deficient mice used for this study.
Identification and quantification of eicosanoids by LC-MS/MS. Inflammatory
exudates or activated BMDMs were collected and combined with 2 volumes of
cold (4°C) methanol. Samples were immediately frozen at -80°C to allow for
protein precipitation. After addition of internal deuterium-labeled standards (d4-
LTB4, d8-5-HETE, d4-PGE2; Cayman Chemical), lipid mediators were extracted
using solid-phase C18 columns. Butylated hydroxytoluene was added prior to
extraction to prevent non-enzymatic oxidation of lipids during sample preparation.
Methyl formate fractions were taken to dryness under N2 gas and suspended in
methanol for LC-MS/MS analysis. Lipid mediators of interest were profiled using
an HPLC system (Shimadzu Prominence) equipped with a reverse-phase (C18)
column (4.6mm x 50mm; 5.0µm particle size) coupled to a triple quadrupole
mass spectrometer (AB Sciex API2000), which was operated in negative

ionization mode. The mobile phase consisted of water:acetic acid (100:0.1 v/v)
and acetonitrile:methanol (4:1 v/v) at a ratio of 73:27, which was ramped to 30:70
over 11 minutes and to 20:80 over the next 10 min. After holding for 2 min, the
mobile phase was ramped to 0:100 for 2 min before returning to 73:27. The flow
rate was held constant at 300µL/min. Multiple reaction monitoring (MRM) was
used to identify and quantify LTB4 (335>195), 6-trans-LTB4 (335>195), 20-
hydroxy LTB4 (351>195), 5-HETE (319>115), 12-HETE (319>179) and LXA4
(351>115) (4). Quantification of lipid mediators was performed using external
calibration curves for each mediator based on authentic standards (Cayman
Chemical) and was normalized to recovery of internal deuterium-labeled
standards (see above).

1. Norling LV, Dalli J, Flower RJ, Serhan CN, & Perretti M (2012) Resolvin D1 Limits Polymorphonuclear Leukocytes Recruitment to Inflammatory Loci: Receptor-Dependent Actions. Arterioscler Thromb Vasc Biol.
2. Clausen BE, Burkhardt C, Reith W, Renkawitz R, & Forster I (1999) Conditional gene targeting in macrophages and granulocytes using LysMcre mice. Transgenic Res 8(4):265-277.
3. Ozcan L, et al. (2013) Activation of Calcium/Calmodulin-Dependent Protein Kinase II in Obesity Mediates Suppression of Hepatic Insulin Signaling. Cell Metab 18(6):803-815.
4. Yang R, Chiang N, Oh SF, & Serhan CN (2011) Metabolomics-lipidomics of eicosanoids and docosanoids generated by phagocytes. Curr Protoc Immunol Chapter 14:Unit 14 26.