Figure 4.1: Iron ore price, quarterly, FOB Australia and ... · Resources and Energy Quarterly June...
14
Transcript of Figure 4.1: Iron ore price, quarterly, FOB Australia and ... · Resources and Energy Quarterly June...
Resources and Energy Quarterly June 201729
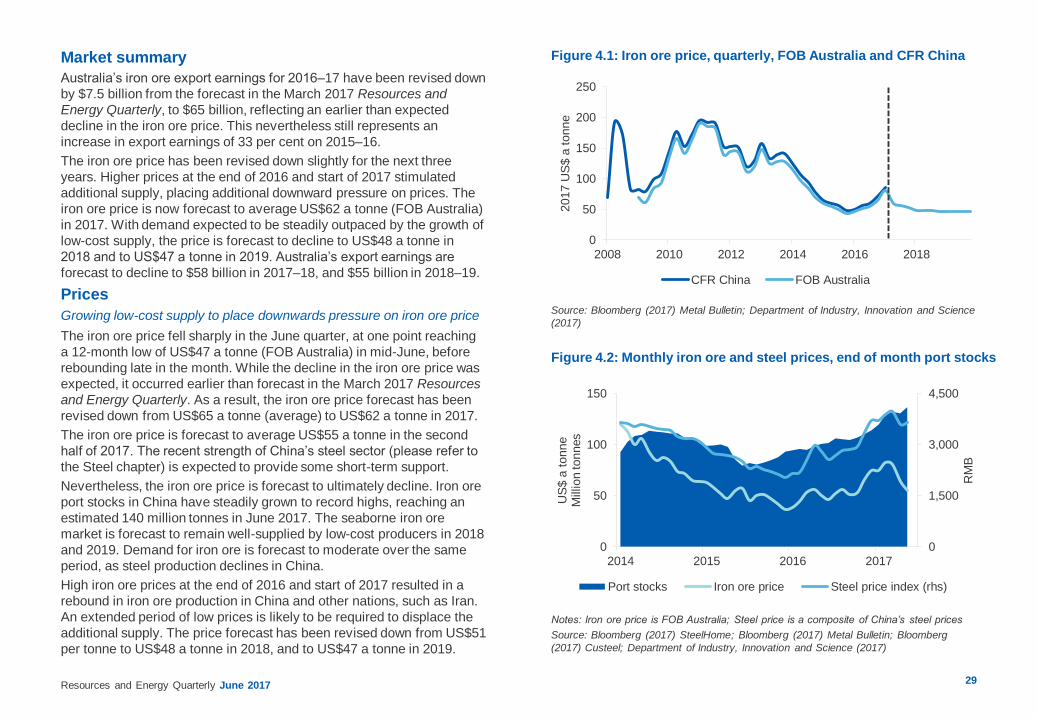
Figure 4.1: Iron ore price, quarterly, FOB Australia and CFR China
Figure 4.2: Monthly iron ore and steel prices, end of month port stocks
Source: Bloomberg (2017) Metal Bulletin; Department of Industry, Innovation and Science
(2017)
Notes: Iron ore price is FOB Australia; Steel price is a composite of China’s steel prices
Source: Bloomberg (2017) SteelHome; Bloomberg (2017) Metal Bulletin; Bloomberg
(2017) Custeel; Department of Industry, Innovation and Science (2017)
Market summary
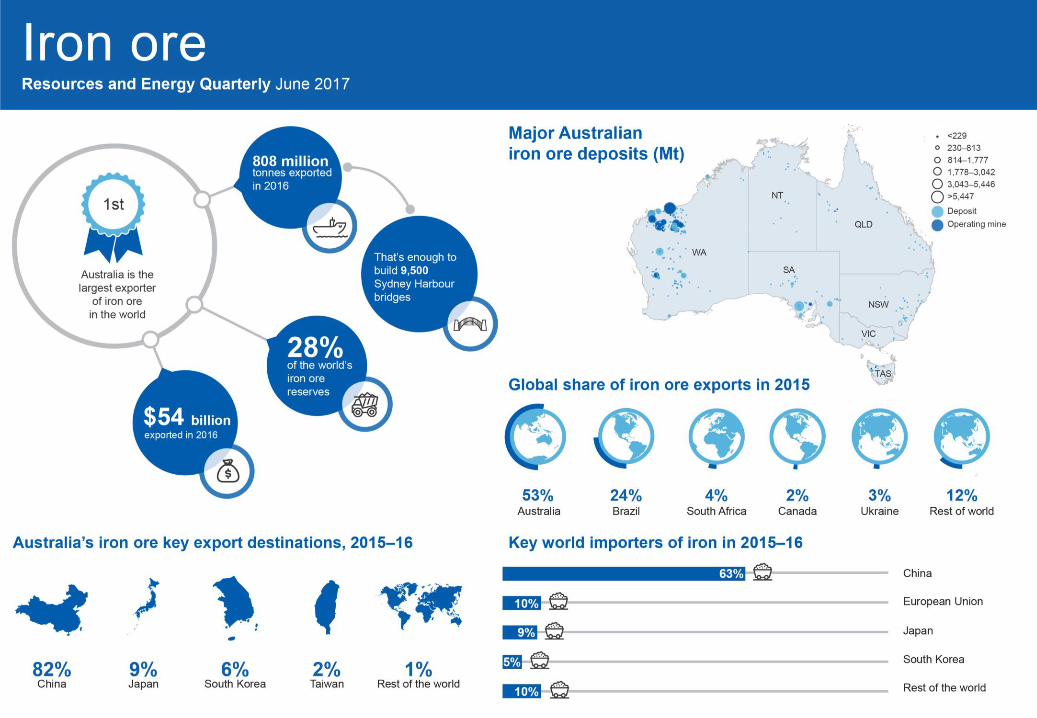
Australia’s iron ore export earnings for 2016–17 have been revised down
by $7.5 billion from the forecast in the March 2017 Resources and
Energy Quarterly, to $65 billion, reflecting an earlier than expected
decline in the iron ore price. This nevertheless still represents an
increase in export earnings of 33 per cent on 2015–16.
The iron ore price has been revised down slightly for the next three
years. Higher prices at the end of 2016 and start of 2017 stimulated
additional supply, placing additional downward pressure on prices. The
iron ore price is now forecast to average US$62 a tonne (FOB Australia)
in 2017. With demand expected to be steadily outpaced by the growth of
low-cost supply, the price is forecast to decline to US$48 a tonne in
2018 and to US$47 a tonne in 2019. Australia’s export earnings are
forecast to decline to $58 billion in 2017–18, and $55 billion in 2018–19.
Prices
Growing low-cost supply to place downwards pressure on iron ore price
The iron ore price fell sharply in the June quarter, at one point reaching
a 12-month low of US$47 a tonne (FOB Australia) in mid-June, before
rebounding late in the month. While the decline in the iron ore price was
expected, it occurred earlier than forecast in the March 2017 Resources
and Energy Quarterly. As a result, the iron ore price forecast has been
revised down from US$65 a tonne (average) to US$62 a tonne in 2017.
The iron ore price is forecast to average US$55 a tonne in the second
half of 2017. The recent strength of China’s steel sector (please refer to
the Steel chapter) is expected to provide some short-term support.
Nevertheless, the iron ore price is forecast to ultimately decline. Iron ore
port stocks in China have steadily grown to record highs, reaching an
estimated 140 million tonnes in June 2017. The seaborne iron ore
market is forecast to remain well-supplied by low-cost producers in 2018
and 2019. Demand for iron ore is forecast to moderate over the same
period, as steel production declines in China.
High iron ore prices at the end of 2016 and start of 2017 resulted in a
rebound in iron ore production in China and other nations, such as Iran.
An extended period of low prices is likely to be required to displace the
additional supply. The price forecast has been revised down from US$51
per tonne to US$48 a tonne in 2018, and to US$47 a tonne in 2019.
0
50
100
150
200
250
2008 2010 2012 2014 2016 2018
2017 U
S$ a
tonne
CFR China FOB Australia
0
1,500
3,000
4,500
0
50
100
150
2014 2015 2016 2017
RM
B
US
$ a
tonne
Million tonnes
Port stocks Iron ore price Steel price index (rhs)
Resources and Energy Quarterly June 2017 30
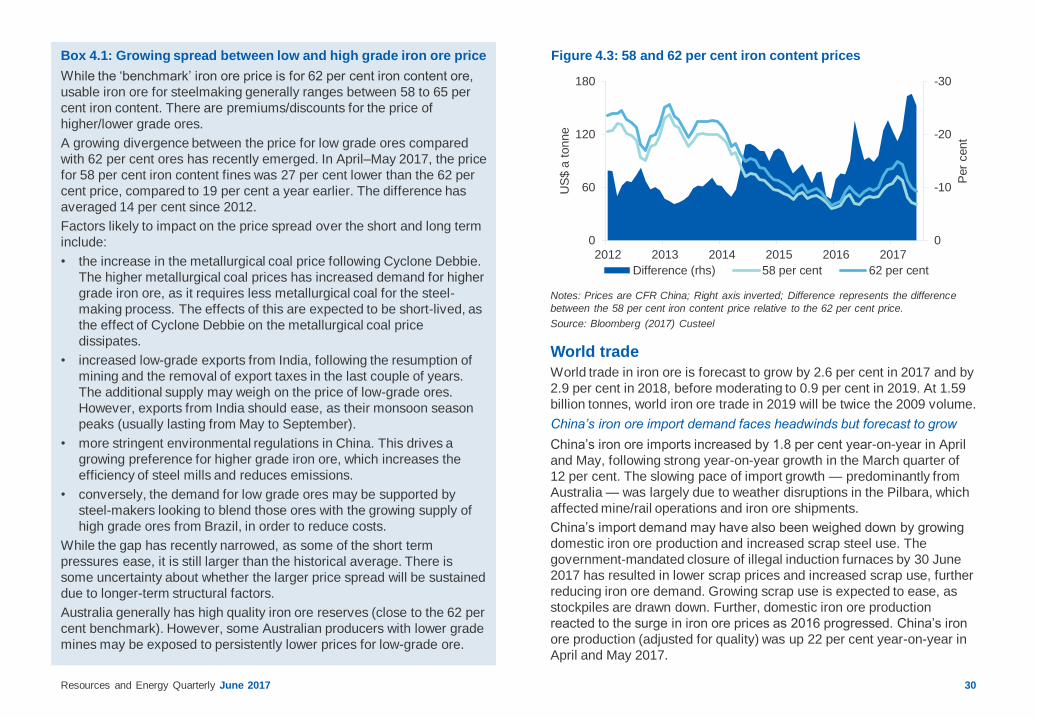
Figure 4.3: 58 and 62 per cent iron content prices
Notes: Prices are CFR China; Right axis inverted; Difference represents the difference
between the 58 per cent iron content price relative to the 62 per cent price.
Source: Bloomberg (2017) Custeel
Box 4.1: Growing spread between low and high grade iron ore price
While the ‘benchmark’ iron ore price is for 62 per cent iron content ore,
usable iron ore for steelmaking generally ranges between 58 to 65 per
cent iron content. There are premiums/discounts for the price of
higher/lower grade ores.
A growing divergence between the price for low grade ores compared
with 62 per cent ores has recently emerged. In April–May 2017, the price
for 58 per cent iron content fines was 27 per cent lower than the 62 per
cent price, compared to 19 per cent a year earlier. The difference has
averaged 14 per cent since 2012.
Factors likely to impact on the price spread over the short and long term
include:
• the increase in the metallurgical coal price following Cyclone Debbie.
The higher metallurgical coal prices has increased demand for higher
grade iron ore, as it requires less metallurgical coal for the steel-
making process. The effects of this are expected to be short-lived, as
the effect of Cyclone Debbie on the metallurgical coal price
dissipates.
• increased low-grade exports from India, following the resumption of
mining and the removal of export taxes in the last couple of years.
The additional supply may weigh on the price of low-grade ores.
However, exports from India should ease, as their monsoon season
peaks (usually lasting from May to September).
• more stringent environmental regulations in China. This drives a
growing preference for higher grade iron ore, which increases the
efficiency of steel mills and reduces emissions.
• conversely, the demand for low grade ores may be supported by
steel-makers looking to blend those ores with the growing supply of
high grade ores from Brazil, in order to reduce costs.
While the gap has recently narrowed, as some of the short term
pressures ease, it is still larger than the historical average. There is
some uncertainty about whether the larger price spread will be sustained
due to longer-term structural factors.
Australia generally has high quality iron ore reserves (close to the 62 per
cent benchmark). However, some Australian producers with lower grade
mines may be exposed to persistently lower prices for low-grade ore.
-30
-20
-10
00
60
120
180
2012 2013 2014 2015 2016 2017
Per
cent
US
$ a
tonne
Difference (rhs) 58 per cent 62 per cent
World trade
World trade in iron ore is forecast to grow by 2.6 per cent in 2017 and by
2.9 per cent in 2018, before moderating to 0.9 per cent in 2019. At 1.59
billion tonnes, world iron ore trade in 2019 will be twice the 2009 volume.
China’s iron ore import demand faces headwinds but forecast to grow
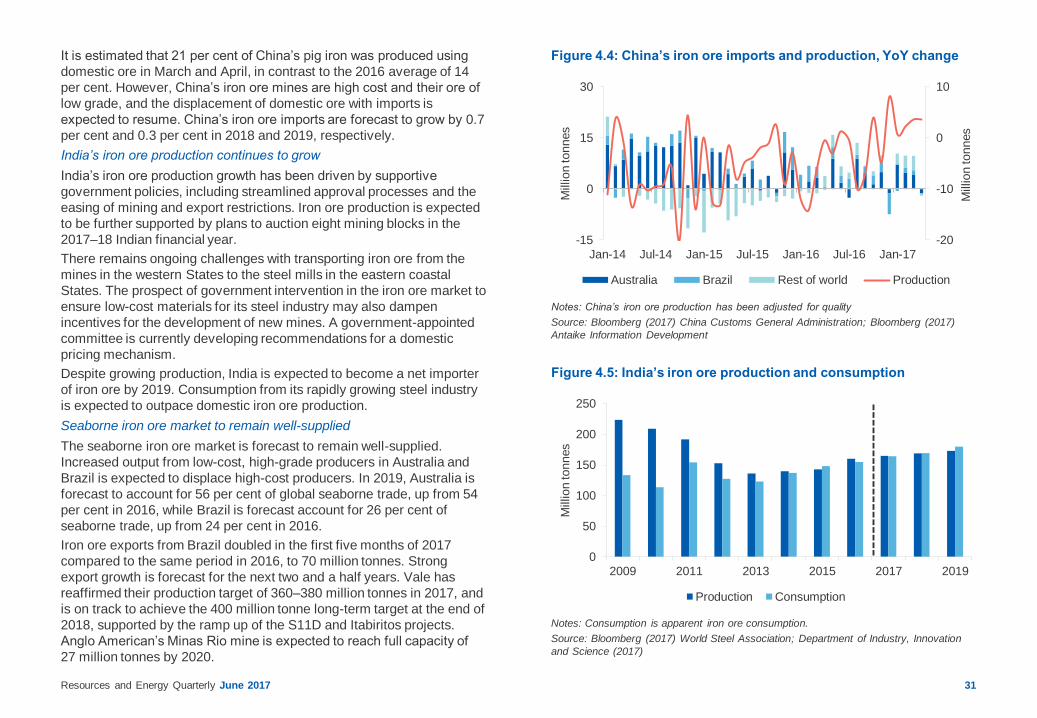
China’s iron ore imports increased by 1.8 per cent year-on-year in April
and May, following strong year-on-year growth in the March quarter of
12 per cent. The slowing pace of import growth — predominantly from
Australia — was largely due to weather disruptions in the Pilbara, which
affected mine/rail operations and iron ore shipments.
China’s import demand may have also been weighed down by growing
domestic iron ore production and increased scrap steel use. The
government-mandated closure of illegal induction furnaces by 30 June
2017 has resulted in lower scrap prices and increased scrap use, further
reducing iron ore demand. Growing scrap use is expected to ease, as
stockpiles are drawn down. Further, domestic iron ore production
reacted to the surge in iron ore prices as 2016 progressed. China’s iron
ore production (adjusted for quality) was up 22 per cent year-on-year in
April and May 2017.
Resources and Energy Quarterly June 2017 31
Figure 4.4: China’s iron ore imports and production, YoY change
Figure 4.5: India’s iron ore production and consumption
Notes: China’s iron ore production has been adjusted for quality
Source: Bloomberg (2017) China Customs General Administration; Bloomberg (2017)
Antaike Information Development
Notes: Consumption is apparent iron ore consumption.
Source: Bloomberg (2017) World Steel Association; Department of Industry, Innovation
and Science (2017)
It is estimated that 21 per cent of China’s pig iron was produced using
domestic ore in March and April, in contrast to the 2016 average of 14
per cent. However, China’s iron ore mines are high cost and their ore of
low grade, and the displacement of domestic ore with imports is
expected to resume. China’s iron ore imports are forecast to grow by 0.7
per cent and 0.3 per cent in 2018 and 2019, respectively.
India’s iron ore production continues to grow
India’s iron ore production growth has been driven by supportive
government policies, including streamlined approval processes and the
easing of mining and export restrictions. Iron ore production is expected
to be further supported by plans to auction eight mining blocks in the
2017–18 Indian financial year.
There remains ongoing challenges with transporting iron ore from the
mines in the western States to the steel mills in the eastern coastal
States. The prospect of government intervention in the iron ore market to
ensure low-cost materials for its steel industry may also dampen
incentives for the development of new mines. A government-appointed
committee is currently developing recommendations for a domestic
pricing mechanism.
Despite growing production, India is expected to become a net importer
of iron ore by 2019. Consumption from its rapidly growing steel industry
is expected to outpace domestic iron ore production.
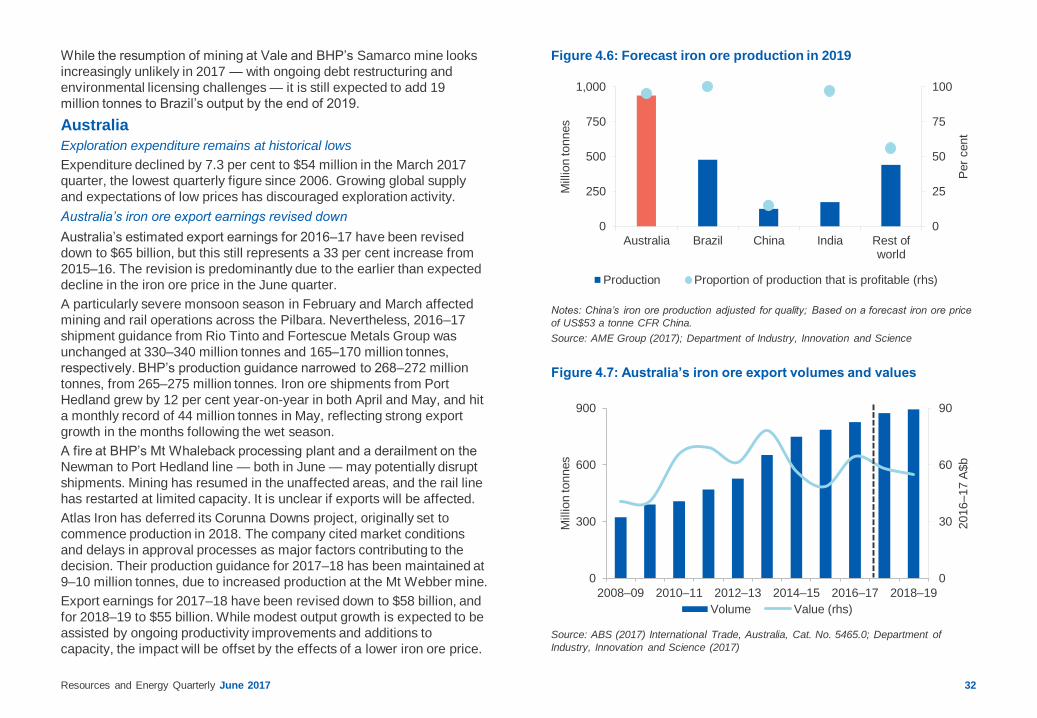
Seaborne iron ore market to remain well-supplied
The seaborne iron ore market is forecast to remain well-supplied.
Increased output from low-cost, high-grade producers in Australia and
Brazil is expected to displace high-cost producers. In 2019, Australia is
forecast to account for 56 per cent of global seaborne trade, up from 54
per cent in 2016, while Brazil is forecast account for 26 per cent of
seaborne trade, up from 24 per cent in 2016.
Iron ore exports from Brazil doubled in the first five months of 2017
compared to the same period in 2016, to 70 million tonnes. Strong
export growth is forecast for the next two and a half years. Vale has
reaffirmed their production target of 360–380 million tonnes in 2017, and
is on track to achieve the 400 million tonne long-term target at the end of
2018, supported by the ramp up of the S11D and Itabiritos projects.
Anglo American’s Minas Rio mine is expected to reach full capacity of
27 million tonnes by 2020.
-20
-10
0
10
-15
0
15
30
Jan-14 Jul-14 Jan-15 Jul-15 Jan-16 Jul-16 Jan-17
Million tonnes
Million tonnes
Australia Brazil Rest of world Production
0
50
100
150
200
250
2009 2011 2013 2015 2017 2019M
illion tonnes
Production Consumption
Resources and Energy Quarterly June 2017 32
Figure 4.6: Forecast iron ore production in 2019
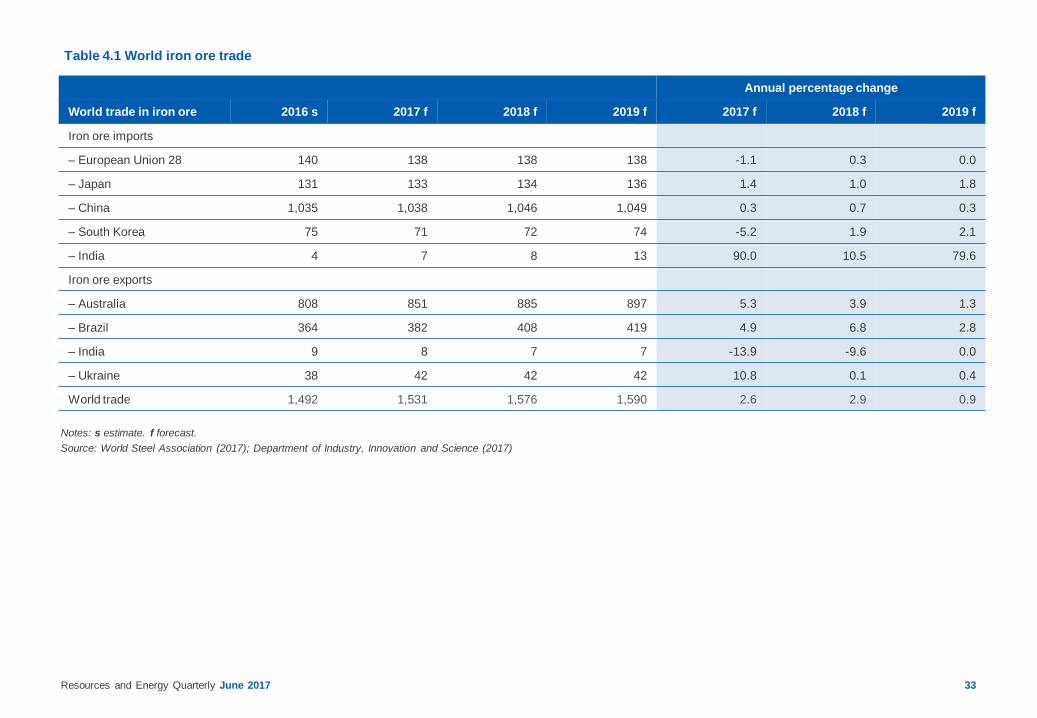
Figure 4.7: Australia’s iron ore export volumes and values
Notes: China’s iron ore production adjusted for quality; Based on a forecast iron ore price
of US$53 a tonne CFR China.
Source: AME Group (2017); Department of Industry, Innovation and Science
Source: ABS (2017) International Trade, Australia, Cat. No. 5465.0; Department of
Industry, Innovation and Science (2017)
While the resumption of mining at Vale and BHP’s Samarco mine looks
increasingly unlikely in 2017 — with ongoing debt restructuring and
environmental licensing challenges — it is still expected to add 19
million tonnes to Brazil’s output by the end of 2019.
Australia
Exploration expenditure remains at historical lows
Expenditure declined by 7.3 per cent to $54 million in the March 2017
quarter, the lowest quarterly figure since 2006. Growing global supply
and expectations of low prices has discouraged exploration activity.
Australia’s iron ore export earnings revised down
Australia’s estimated export earnings for 2016–17 have been revised
down to $65 billion, but this still represents a 33 per cent increase from
2015–16. The revision is predominantly due to the earlier than expected
decline in the iron ore price in the June quarter.
A particularly severe monsoon season in February and March affected
mining and rail operations across the Pilbara. Nevertheless, 2016–17
shipment guidance from Rio Tinto and Fortescue Metals Group was
unchanged at 330–340 million tonnes and 165–170 million tonnes,
respectively. BHP’s production guidance narrowed to 268–272 million
tonnes, from 265–275 million tonnes. Iron ore shipments from Port
Hedland grew by 12 per cent year-on-year in both April and May, and hit
a monthly record of 44 million tonnes in May, reflecting strong export
growth in the months following the wet season.
A fire at BHP’s Mt Whaleback processing plant and a derailment on the
Newman to Port Hedland line — both in June — may potentially disrupt
shipments. Mining has resumed in the unaffected areas, and the rail line
has restarted at limited capacity. It is unclear if exports will be affected.
Atlas Iron has deferred its Corunna Downs project, originally set to
commence production in 2018. The company cited market conditions
and delays in approval processes as major factors contributing to the
decision. Their production guidance for 2017–18 has been maintained at
9–10 million tonnes, due to increased production at the Mt Webber mine.
Export earnings for 2017–18 have been revised down to $58 billion, and
for 2018–19 to $55 billion. While modest output growth is expected to be
assisted by ongoing productivity improvements and additions to
capacity, the impact will be offset by the effects of a lower iron ore price.
0
30
60
90
0
300
600
900
2008–09 2010–11 2012–13 2014–15 2016–17 2018–19
2016–17 A
$b
Million tonnes
Volume Value (rhs)
0
25
50
75
100
0
250
500
750
1,000
Australia Brazil China India Rest ofworld
Per
cent
Million tonnes
Production Proportion of production that is profitable (rhs)
Resources and Energy Quarterly June 2017 33
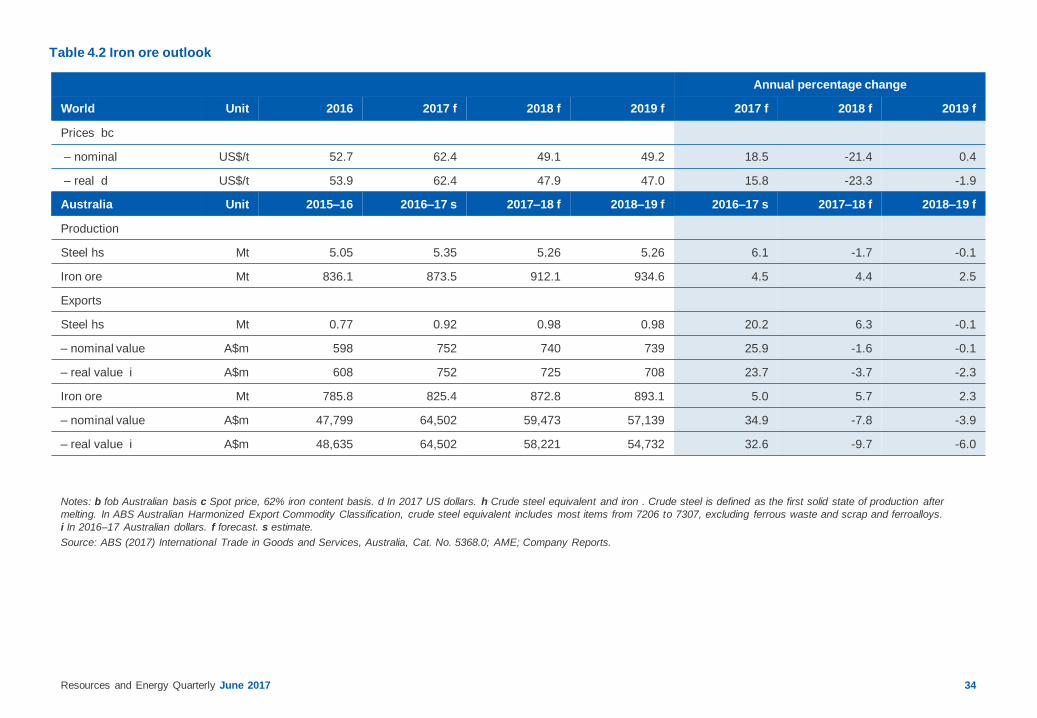
Annual percentage change
World trade in iron ore 2016 s 2017 f 2018 f 2019 f 2017 f 2018 f 2019 f
Iron ore imports
– European Union 28 140 138 138 138 -1.1 0.3 0.0
– Japan 131 133 134 136 1.4 1.0 1.8
– China 1,035 1,038 1,046 1,049 0.3 0.7 0.3
– South Korea 75 71 72 74 -5.2 1.9 2.1
– India 4 7 8 13 90.0 10.5 79.6
Iron ore exports
– Australia 808 851 885 897 5.3 3.9 1.3
– Brazil 364 382 408 419 4.9 6.8 2.8
– India 9 8 7 7 -13.9 -9.6 0.0
– Ukraine 38 42 42 42 10.8 0.1 0.4
World trade 1,492 1,531 1,576 1,590 2.6 2.9 0.9
Notes: s estimate. f forecast.
Source: World Steel Association (2017); Department of Industry, Innovation and Science (2017)
Table 4.1 World iron ore trade
Resources and Energy Quarterly June 2017 34
Annual percentage change
World Unit 2016 2017 f 2018 f 2019 f 2017 f 2018 f 2019 f
Prices bc
– nominal US$/t 52.7 62.4 49.1 49.2 18.5 -21.4 0.4
– real d US$/t 53.9 62.4 47.9 47.0 15.8 -23.3 -1.9
Notes: b fob Australian basis c Spot price, 62% iron content basis. d In 2017 US dollars. h Crude steel equivalent and iron . Crude steel is defined as the first solid state of production after
melting. In ABS Australian Harmonized Export Commodity Classification, crude steel equivalent includes most items from 7206 to 7307, excluding ferrous waste and scrap and ferroalloys.
i In 2016–17 Australian dollars. f forecast. s estimate.
Source: ABS (2017) International Trade in Goods and Services, Australia, Cat. No. 5368.0; AME; Company Reports.
Table 4.2 Iron ore outlook
Australia Unit 2015–16 2016–17 s 2017–18 f 2018–19 f 2016–17 s 2017–18 f 2018–19 f
Production
Steel hs Mt 5.05 5.35 5.26 5.26 6.1 -1.7 -0.1
Iron ore Mt 836.1 873.5 912.1 934.6 4.5 4.4 2.5
Exports
Steel hs Mt 0.77 0.92 0.98 0.98 20.2 6.3 -0.1
– nominal value A$m 598 752 740 739 25.9 -1.6 -0.1
– real value i A$m 608 752 725 708 23.7 -3.7 -2.3
Iron ore Mt 785.8 825.4 872.8 893.1 5.0 5.7 2.3
– nominal value A$m 47,799 64,502 59,473 57,139 34.9 -7.8 -3.9
– real value i A$m 48,635 64,502 58,221 54,732 32.6 -9.7 -6.0

Resources and Energy Quarterly June 2017 36
Figure 5.1: Spot prices
Figure 5.2: Benchmark contract prices for Australian metallurgical coal
Source: IHS (2017)
Source: Department of Industry; Innovation and Science (2017)
Market Summary
Global metallurgical coal spot prices spiked in April, in the wake of the
destruction left by Cyclone Debbie in Queensland, the world’s largest
metallurgical coal producing region. Important rail links to export ports
were cut, tightening the export market. Since April, a return to normal of
rail operations has seen prices decline. Prices are forecast to fall
modestly further over the rest of the outlook period. Overall export
earnings for 2016–17 are estimated to have been a record $36 billion.
However, due to price declines over the outlook period, export earnings
for 2017–18 and 2018–19 are forecast to be lower.
Prices
Spot price decline expected to continue
Spot prices rallied in April 2017, to average US$261 a tonne for the
month. The rally in price was largely driven by a sharp decline in exports
from Queensland, caused by the fallout from Cyclone Debbie. Since the
rally in April, spot prices have started to decline, with prices in the June
quarter estimated to have averaged US$187 a tonne.
The combination of easing Government-mandated coal mine closures —
and restricted days of coal mine operation in — China, and a recovery in
metallurgical coal operations in Australia, are expected to have a
normalising (no weather disruptions) impact on global production levels.
These factors are forecast to result in spot prices in 2017 averaging
around US$158 a tonne.
June quarter benchmark contract prices paid to Australian metallurgical
coal producers by Japanese steel producers were still not settled as of
late-June. The significant delay in landing on a June quarter price was
largely due to Cyclone Debbie. Reports suggest that, in lieu of a
quarterly contract price, producers and consumers adopted a spot or
index-linked approach as a pricing mechanism for the June quarter.
Australian benchmark prime hard metallurgical coal contract prices are
forecast to average US$191 a tonne in 2017 — a 67 per cent increase
from 2016, reflecting the high March quarter contract price of US$285 a
tonne. Contract prices for the remaining two quarters are forecast to be
substantially lower.
0
50
100
150
200
250
300
350
Jul-11 Apr-12 Jan-13 Oct-13 Jul-14 Apr-15 Jan-16 Oct-16
US
$ a
tonne
Australian hard coking coal Australian low volatility PCI
0
50
100
150
200
250
300
350
400
Dec-03 Dec-06 Dec-09 Dec-12 Dec-15 Dec-18
2017 U
S$ a
tonne
Resources and Energy Quarterly June 2017 37
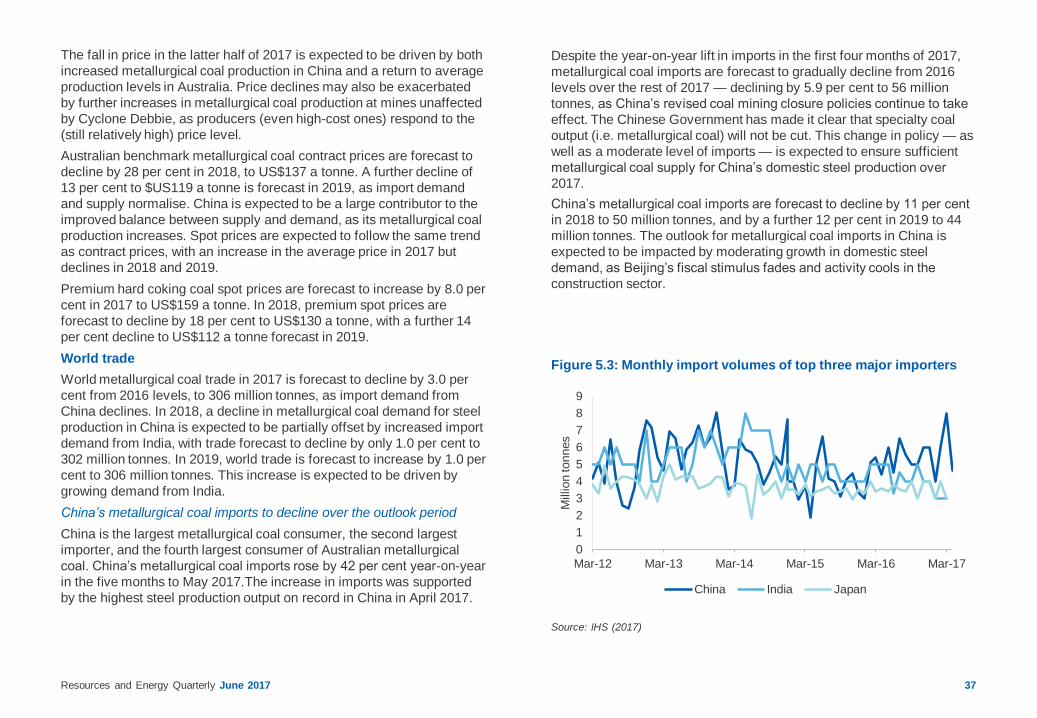
Figure 5.3: Monthly import volumes of top three major importers
Source: IHS (2017)
The fall in price in the latter half of 2017 is expected to be driven by both
increased metallurgical coal production in China and a return to average
production levels in Australia. Price declines may also be exacerbated
by further increases in metallurgical coal production at mines unaffected
by Cyclone Debbie, as producers (even high-cost ones) respond to the
(still relatively high) price level.
Australian benchmark metallurgical coal contract prices are forecast to
decline by 28 per cent in 2018, to US$137 a tonne. A further decline of
13 per cent to $US119 a tonne is forecast in 2019, as import demand
and supply normalise. China is expected to be a large contributor to the
improved balance between supply and demand, as its metallurgical coal
production increases. Spot prices are expected to follow the same trend
as contract prices, with an increase in the average price in 2017 but
declines in 2018 and 2019.
Premium hard coking coal spot prices are forecast to increase by 8.0 per
cent in 2017 to US$159 a tonne. In 2018, premium spot prices are
forecast to decline by 18 per cent to US$130 a tonne, with a further 14
per cent decline to US$112 a tonne forecast in 2019.
World trade
World metallurgical coal trade in 2017 is forecast to decline by 3.0 per
cent from 2016 levels, to 306 million tonnes, as import demand from
China declines. In 2018, a decline in metallurgical coal demand for steel
production in China is expected to be partially offset by increased import
demand from India, with trade forecast to decline by only 1.0 per cent to
302 million tonnes. In 2019, world trade is forecast to increase by 1.0 per
cent to 306 million tonnes. This increase is expected to be driven by
growing demand from India.
China’s metallurgical coal imports to decline over the outlook period
China is the largest metallurgical coal consumer, the second largest
importer, and the fourth largest consumer of Australian metallurgical
coal. China’s metallurgical coal imports rose by 42 per cent year-on-year
in the five months to May 2017.The increase in imports was supported
by the highest steel production output on record in China in April 2017.
Despite the year-on-year lift in imports in the first four months of 2017,
metallurgical coal imports are forecast to gradually decline from 2016
levels over the rest of 2017 — declining by 5.9 per cent to 56 million
tonnes, as China’s revised coal mining closure policies continue to take
effect. The Chinese Government has made it clear that specialty coal
output (i.e. metallurgical coal) will not be cut. This change in policy — as
well as a moderate level of imports — is expected to ensure sufficient
metallurgical coal supply for China’s domestic steel production over
2017.
China’s metallurgical coal imports are forecast to decline by 11 per cent
in 2018 to 50 million tonnes, and by a further 12 per cent in 2019 to 44
million tonnes. The outlook for metallurgical coal imports in China is
expected to be impacted by moderating growth in domestic steel
demand, as Beijing’s fiscal stimulus fades and activity cools in the
construction sector.
0
1
2
3
4
5
6
7
8
9
Mar-12 Mar-13 Mar-14 Mar-15 Mar-16 Mar-17M
illion tonnes
China India Japan
Resources and Energy Quarterly June 2017 38
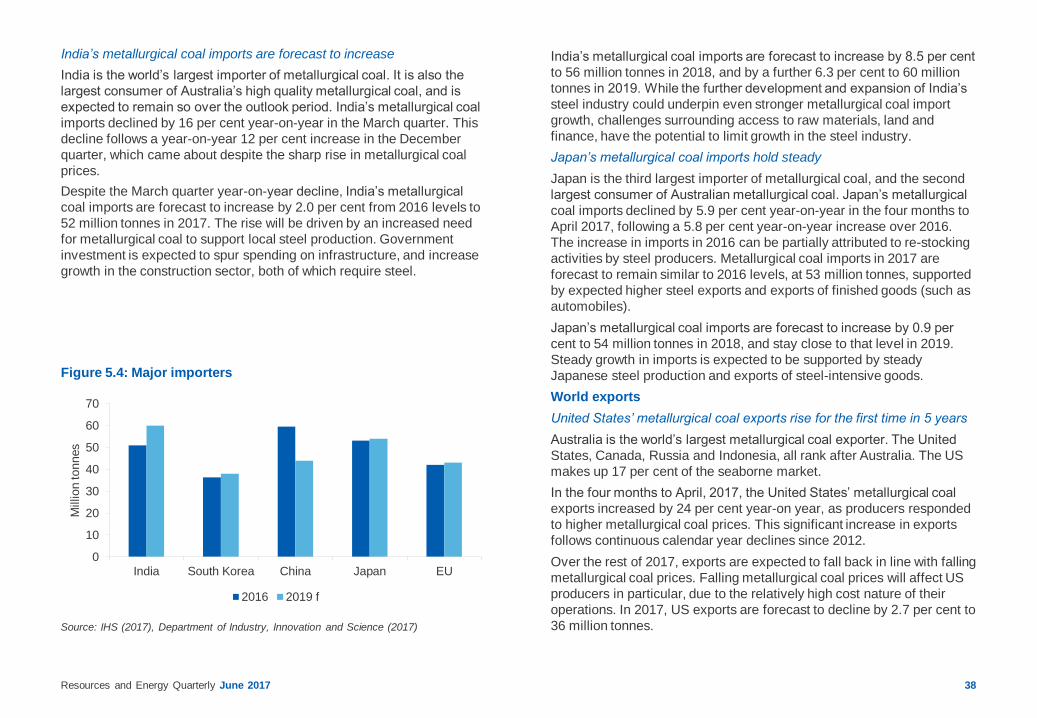
Figure 5.4: Major importers
Source: IHS (2017), Department of Industry, Innovation and Science (2017)
India’s metallurgical coal imports are forecast to increase by 8.5 per cent
to 56 million tonnes in 2018, and by a further 6.3 per cent to 60 million
tonnes in 2019. While the further development and expansion of India’s
steel industry could underpin even stronger metallurgical coal import
growth, challenges surrounding access to raw materials, land and
finance, have the potential to limit growth in the steel industry.
Japan’s metallurgical coal imports hold steady
Japan is the third largest importer of metallurgical coal, and the second
largest consumer of Australian metallurgical coal. Japan’s metallurgical
coal imports declined by 5.9 per cent year-on-year in the four months to
April 2017, following a 5.8 per cent year-on-year increase over 2016.
The increase in imports in 2016 can be partially attributed to re-stocking
activities by steel producers. Metallurgical coal imports in 2017 are
forecast to remain similar to 2016 levels, at 53 million tonnes, supported
by expected higher steel exports and exports of finished goods (such as
automobiles).
Japan’s metallurgical coal imports are forecast to increase by 0.9 per
cent to 54 million tonnes in 2018, and stay close to that level in 2019.
Steady growth in imports is expected to be supported by steady
Japanese steel production and exports of steel-intensive goods.
World exports
United States’ metallurgical coal exports rise for the first time in 5 years
Australia is the world’s largest metallurgical coal exporter. The United
States, Canada, Russia and Indonesia, all rank after Australia. The US
makes up 17 per cent of the seaborne market.
In the four months to April, 2017, the United States’ metallurgical coal
exports increased by 24 per cent year-on year, as producers responded
to higher metallurgical coal prices. This significant increase in exports
follows continuous calendar year declines since 2012.
Over the rest of 2017, exports are expected to fall back in line with falling
metallurgical coal prices. Falling metallurgical coal prices will affect US
producers in particular, due to the relatively high cost nature of their
operations. In 2017, US exports are forecast to decline by 2.7 per cent to
36 million tonnes.
India’s metallurgical coal imports are forecast to increase
India is the world’s largest importer of metallurgical coal. It is also the
largest consumer of Australia’s high quality metallurgical coal, and is
expected to remain so over the outlook period. India’s metallurgical coal
imports declined by 16 per cent year-on-year in the March quarter. This
decline follows a year-on-year 12 per cent increase in the December
quarter, which came about despite the sharp rise in metallurgical coal
prices.
Despite the March quarter year-on-year decline, India’s metallurgical
coal imports are forecast to increase by 2.0 per cent from 2016 levels to
52 million tonnes in 2017. The rise will be driven by an increased need
for metallurgical coal to support local steel production. Government
investment is expected to spur spending on infrastructure, and increase
growth in the construction sector, both of which require steel.
0
10
20
30
40
50
60
70
India South Korea China Japan EU
Million tonnes
2016 2019 f
Resources and Energy Quarterly June 2017 39
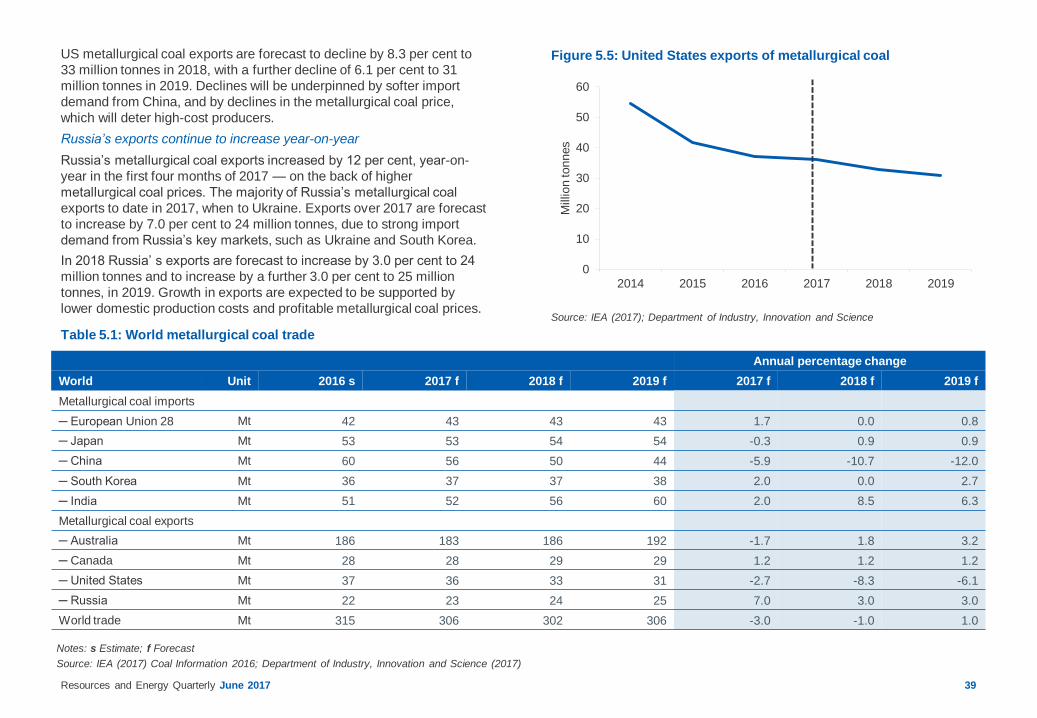
Figure 5.5: United States exports of metallurgical coal
Notes: s Estimate; f Forecast
Source: IEA (2017) Coal Information 2016; Department of Industry, Innovation and Science (2017)
Source: IEA (2017); Department of Industry, Innovation and Science
Table 5.1: World metallurgical coal trade
US metallurgical coal exports are forecast to decline by 8.3 per cent to
33 million tonnes in 2018, with a further decline of 6.1 per cent to 31
million tonnes in 2019. Declines will be underpinned by softer import
demand from China, and by declines in the metallurgical coal price,
which will deter high-cost producers.
Russia’s exports continue to increase year-on-year
Russia’s metallurgical coal exports increased by 12 per cent, year-on-
year in the first four months of 2017 — on the back of higher
metallurgical coal prices. The majority of Russia’s metallurgical coal
exports to date in 2017, when to Ukraine. Exports over 2017 are forecast
to increase by 7.0 per cent to 24 million tonnes, due to strong import
demand from Russia’s key markets, such as Ukraine and South Korea.
In 2018 Russia’ s exports are forecast to increase by 3.0 per cent to 24
million tonnes and to increase by a further 3.0 per cent to 25 million
tonnes, in 2019. Growth in exports are expected to be supported by
lower domestic production costs and profitable metallurgical coal prices.
Annual percentage change
World Unit 2016 s 2017 f 2018 f 2019 f 2017 f 2018 f 2019 f
Metallurgical coal imports
─ European Union 28 Mt 42 43 43 43 1.7 0.0 0.8
─ Japan Mt 53 53 54 54 -0.3 0.9 0.9
─ China Mt 60 56 50 44 -5.9 -10.7 -12.0
─ South Korea Mt 36 37 37 38 2.0 0.0 2.7
─ India Mt 51 52 56 60 2.0 8.5 6.3
Metallurgical coal exports
─ Australia Mt 186 183 186 192 -1.7 1.8 3.2
─ Canada Mt 28 28 29 29 1.2 1.2 1.2
─ United States Mt 37 36 33 31 -2.7 -8.3 -6.1
─ Russia Mt 22 23 24 25 7.0 3.0 3.0
World trade Mt 315 306 302 306 -3.0 -1.0 1.0
0
10
20
30
40
50
60
2014 2015 2016 2017 2018 2019
Million tonnes
Resources and Energy Quarterly June 2017 40
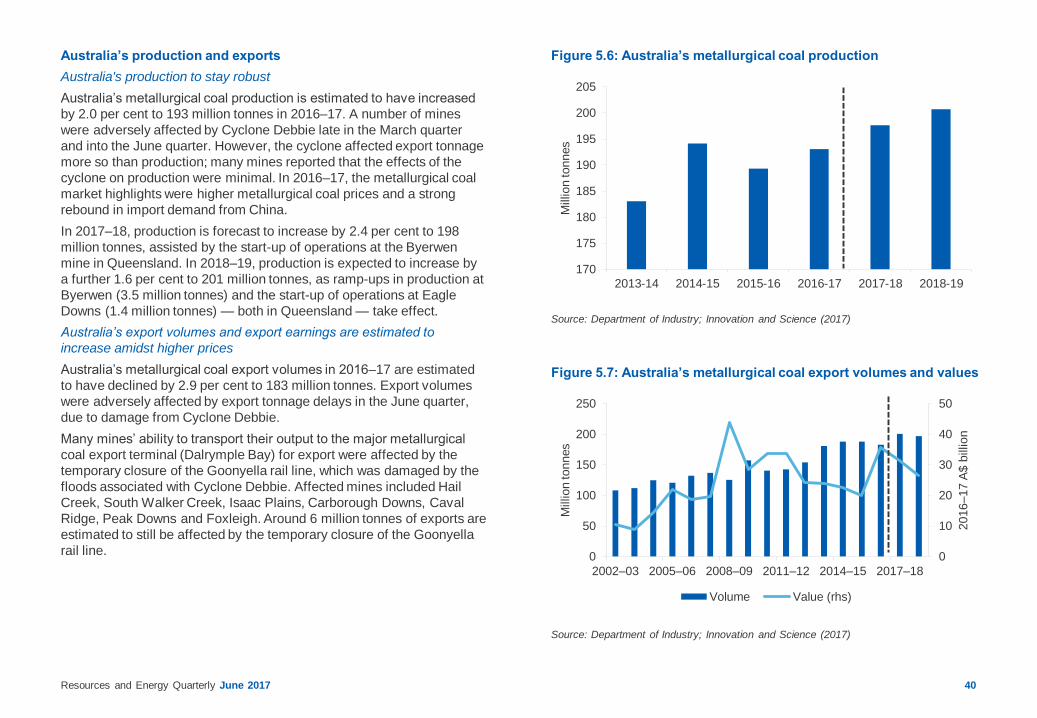
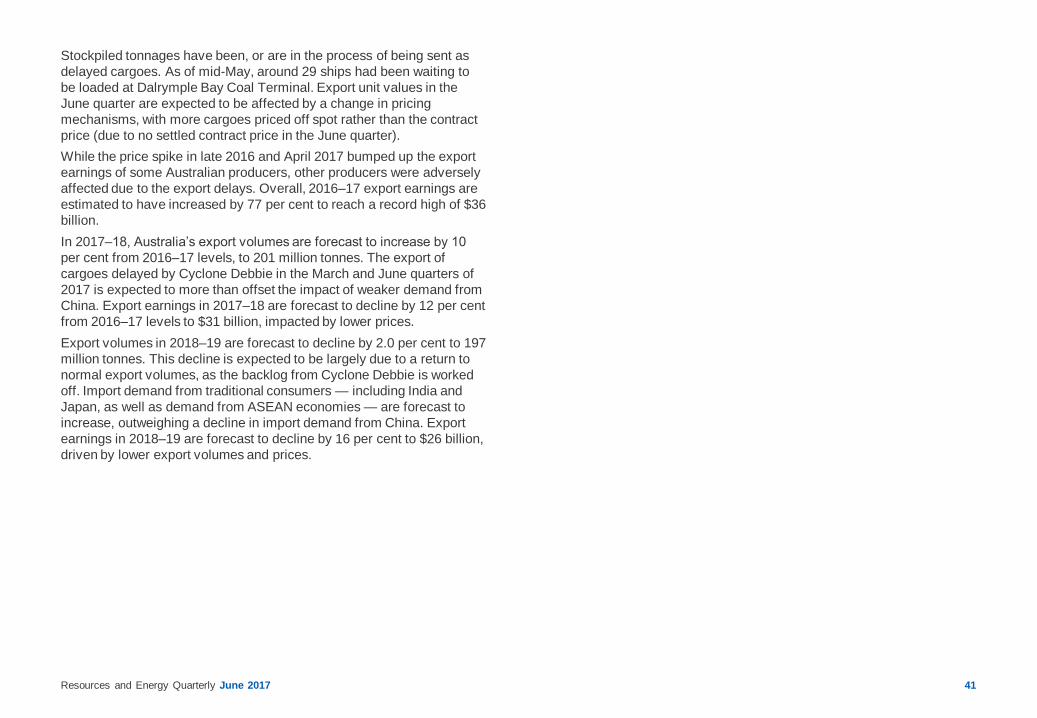
Figure 5.6: Australia’s metallurgical coal production
Figure 5.7: Australia’s metallurgical coal export volumes and values
Source: Department of Industry; Innovation and Science (2017)
Source: Department of Industry; Innovation and Science (2017)
Australia’s production and exports
Australia's production to stay robust
Australia’s metallurgical coal production is estimated to have increased
by 2.0 per cent to 193 million tonnes in 2016–17. A number of mines
were adversely affected by Cyclone Debbie late in the March quarter
and into the June quarter. However, the cyclone affected export tonnage
more so than production; many mines reported that the effects of the
cyclone on production were minimal. In 2016–17, the metallurgical coal
market highlights were higher metallurgical coal prices and a strong
rebound in import demand from China.
In 2017–18, production is forecast to increase by 2.4 per cent to 198
million tonnes, assisted by the start-up of operations at the Byerwen
mine in Queensland. In 2018–19, production is expected to increase by
a further 1.6 per cent to 201 million tonnes, as ramp-ups in production at
Byerwen (3.5 million tonnes) and the start-up of operations at Eagle
Downs (1.4 million tonnes) — both in Queensland — take effect.
Australia’s export volumes and export earnings are estimated to
increase amidst higher prices
Australia’s metallurgical coal export volumes in 2016–17 are estimated
to have declined by 2.9 per cent to 183 million tonnes. Export volumes
were adversely affected by export tonnage delays in the June quarter,
due to damage from Cyclone Debbie.
Many mines’ ability to transport their output to the major metallurgical
coal export terminal (Dalrymple Bay) for export were affected by the
temporary closure of the Goonyella rail line, which was damaged by the
floods associated with Cyclone Debbie. Affected mines included Hail
Creek, South Walker Creek, Isaac Plains, Carborough Downs, Caval
Ridge, Peak Downs and Foxleigh. Around 6 million tonnes of exports are
estimated to still be affected by the temporary closure of the Goonyella
rail line.
170
175
180
185
190
195
200
205
2013-14 2014-15 2015-16 2016-17 2017-18 2018-19
Million tonnes
0
10
20
30
40
50
0
50
100
150
200
250
2002–03 2005–06 2008–09 2011–12 2014–15 2017–18
2016–17 A
$ b
illion
Million tonnes
Volume Value (rhs)
Resources and Energy Quarterly June 2017 41
Stockpiled tonnages have been, or are in the process of being sent as
delayed cargoes. As of mid-May, around 29 ships had been waiting to
be loaded at Dalrymple Bay Coal Terminal. Export unit values in the
June quarter are expected to be affected by a change in pricing
mechanisms, with more cargoes priced off spot rather than the contract
price (due to no settled contract price in the June quarter).
While the price spike in late 2016 and April 2017 bumped up the export
earnings of some Australian producers, other producers were adversely
affected due to the export delays. Overall, 2016–17 export earnings are
estimated to have increased by 77 per cent to reach a record high of $36
billion.
In 2017–18, Australia’s export volumes are forecast to increase by 10
per cent from 2016–17 levels, to 201 million tonnes. The export of
cargoes delayed by Cyclone Debbie in the March and June quarters of
2017 is expected to more than offset the impact of weaker demand from
China. Export earnings in 2017–18 are forecast to decline by 12 per cent
from 2016–17 levels to $31 billion, impacted by lower prices.
Export volumes in 2018–19 are forecast to decline by 2.0 per cent to 197
million tonnes. This decline is expected to be largely due to a return to
normal export volumes, as the backlog from Cyclone Debbie is worked
off. Import demand from traditional consumers — including India and
Japan, as well as demand from ASEAN economies — are forecast to
increase, outweighing a decline in import demand from China. Export
earnings in 2018–19 are forecast to decline by 16 per cent to $26 billion,
driven by lower export volumes and prices.