Fifth Progress Report on State Green Procurement and ... · Fifth Progress Report on State Green...
61
The 693kW solar array at Robert Moses State Park in Suffolk County generates as much electricity as the park consumes, making it the first energy-neutral state park in the nation. GREENING NEW YORK STATE Fifth Progress Report on State Green Procurement and Agency Sustainability Fiscal Year 2015-16
Transcript of Fifth Progress Report on State Green Procurement and ... · Fifth Progress Report on State Green...

The 693kW solar array at Robert Moses State Park in Suffolk County generates as much electricity as the park consumes, making it the first energy-neutral state park in the nation.
GREENING NEW YORK STATE
Fifth Progress Report on
State Green Procurement and Agency Sustainability
Fiscal Year 2015-16

Message from the Commissioners
Through the leadership of Governor Andrew M. Cuomo, New York has experienced steady progress toward the
adoption of sustainable practices and operations by State government. New York’s Green Procurement and
Agency Sustainability program is an ambitious effort led by our two agencies, the Department of Environmental
Conservation (DEC) and the Office of General Services (OGS), working together to implement Executive Order
No. 4 (EO 4), which was continued by Governor Cuomo in January 2011. This Fifth Progress Report documents
the achievements that have been attained thanks to the work of dedicated staff in agencies and authorities across
the State.
New York State is a national leader in “green” or environmentally preferable purchasing. Buying green products
supports all of EO 4’s environmental priorities including reductions in waste, toxics, energy, and water use. As
agencies have become more comfortable with the goals and benefits of green procurement, the EO 4 Interagency
Committee, led by DEC and OGS, has increased its emphasis on making purchasing easier. Toward this end, we
are pleased to announce the creation of a new “Green Procurement” team within OGS Procurement Services that
will focus on the issuance of contracts with green offerings. The availability of recycled content copy paper on
centralized contracts has been the driving force behind increasing purchases of 100% post-consumer recycled
content copy paper, which reached 57% of dollars spent on copy paper in FY 15-16, the highest percentage spent
since tracking began, and a 35 percentage point increase from the 22% spent in FY 08-09.
Considerable strides have also been made to incorporate sustainability into State operations. New York is leading
the nation under Governor Cuomo’s comprehensive policy for a clean, more affordable and resilient energy
system, called Reforming the Energy Vision. In February 2017, Governor Cuomo announced that State-supported
solar power in New York increased nearly 800% from 2011 to 2016. As an example, the electricity generated by
the recently completed 693kW solar array at Robert Moses State Park will cover the entire annual energy usage
of the park and make it the first energy neutral state park in the nation. In support of these efforts, OGS will make
awards in 2017 for a centralized photovoltaic systems (solar) contract for use by State agencies, authorities, and
local governments.
This year’s waste generation and recycling data show the enormous progress made in recycling construction and
demolition (C&D) debris. State agencies and authorities reported the highest level of C&D materials recycled in
the past eight reporting years. The Department of Transportation (DOT) and the Metropolitan Transportation
Authority (MTA) helped to lead this effort. Also in 2016, MTA’s New York City Transit division was honored for
incorporating innovative features into the newly renovated Mother Clara Hale Bus Depot, including a green roof,
solar wall, and the capture and reuse of rainwater for washing buses. It earned a New York State Environmental
Excellence award in 2016 for these efforts, as well as bragging rights as the first LEED (Leadership in Energy &
Environmental Design) certified bus depot in the country.
These successes are made possible by the dedicated work of Sustainability Coordinators designated by agencies
and authorities across the State, who tirelessly advocate for the adoption of sustainable practices within their
organizations, and tailor projects to fit their agency’s unique mission. They also keep track of the information
necessary to produce this Progress Report. We are committed to supporting their efforts and building upon their
achievements in order to bring a greener, more sustainable, and more efficient government to the people of the
State of New York.
RoAnn M. Destito,
Commissioner,
Office of General Services
Basil Seggos,
Commissioner,
Department of Environmental
Conservation

Table of Contents
Message from the Commissioners
Executive Summary................................................................................................................................................... i
Progress Toward a Green New York ....................................................................................................................... i
Reducing and Recycling Waste ............................................................................................................................... i
Reducing the Environmental Impacts of Operations ............................................................................................. iv
Saving Money and Buying Green .......................................................................................................................... iv
Challenges and Success Stories ........................................................................................................................... vi
New and Noteworthy Initiatives in FY 15-16 ......................................................................................................... vii
Achieving the Promise of Sustainability ................................................................................................................ 1
The Benefits of Sustainability ................................................................................................................................. 2
Operating Green ....................................................................................................................................................... 5
Leading the Green Team: People, Planning and Money ....................................................................................... 6
Waste and Paper Use Reduction Goals ................................................................................................................. 9
Waste Reduction and Reuse ................................................................................................................................ 10
Recycling and Composting ................................................................................................................................... 14
Reducing Toxic Chemical Use.............................................................................................................................. 19
Green Cleaning ..................................................................................................................................................... 21
Energy Efficiency .................................................................................................................................................. 22
Renewable Energy ............................................................................................................................................... 24
Sustainable Transportation ................................................................................................................................... 26
Conserving Water and Other Natural Resources ................................................................................................. 28
Education and Engagement ................................................................................................................................. 32
Buying Green .......................................................................................................................................................... 35
Purchasing Recycled Paper ................................................................................................................................. 36
Green Specifications and Centralized Procurements ........................................................................................... 38
Buying Green ........................................................................................................................................................ 42
Restricting the Use of Bottled Water .................................................................................................................... 46
Background ........................................................................................................................................................... 46
Findings ................................................................................................................................................................ 46
Savings and Costs ................................................................................................................................................ 46
Challenges and Success Stories .......................................................................................................................... 47
Conclusion .............................................................................................................................................................. 49

Fifth Progress Report on State Green Procurement and Agency Sustainability | Fiscal Year 2015-16 i
Executive Summary
The vision of a vibrant, innovative, and sustainable economy underlies Executive Order No. 4 (EO 4), which
establishes a State Green Procurement and Sustainability Program, and Executive Order No. 18 (EO 18), which
restricts the purchase of bottled water by the State. In 2011, Governor Andrew M. Cuomo continued both orders.
EO 4 directs the approximately 73 State agencies, authorities, and other entities covered by the Order
(“agencies”) to incorporate sustainability into all aspects of their operations. To accomplish this, agencies are
required to implement a Sustainability and Environmental Stewardship Program and assign an employee to serve
as Sustainability and Green Procurement Coordinator (“Sustainability Coordinator”). EO 4 also created an
Interagency Committee on Sustainability and Green Procurement (“Interagency Committee”) co-chaired by the
Commissioners of the Office of General Services (OGS) and the Department of Environmental Conservation
(DEC), and charged it with several tasks, including preparation of this report.
EO 18 directs executive agencies to eliminate the purchase of bottled water. Agency reporting under EO 18 has
been combined with reporting under EO 4. Both are summarized in this report.
Progress Toward a Green New York
The past eight reporting years, from FY 2008-09 (“08-09”) to FY 2015-16 (“15-16”), have seen steady progress
toward a greener New York. Overall paper use and waste generation levels (with some adjustment for a surge in
demolition debris, described in more detail below) declined in FY 15-16, continuing the State’s encouraging
downward trend.
Sustainability is a process, and the most successful agencies enjoy the executive support, personnel infrastructure,
and financing needed to continually review their operations, measure progress, embrace innovation, and
overcome challenges. Of the 66 entities reporting in FY 15-16, 88% havea designated Sustainability Coordinator,
an increase from 82% the previous year. 26% of agencies have a sustainability team. To be effective, agencies
need a champion or team of champions who are willing to lead and coordinate the agency’s commitment to
sustainability. Agencies which embody that model include the Office of Parks, Recreation and Historic
Preservation (Parks), the Jacob K. Javits Center (“Javits Center”), the City University of New York (“CUNY”), the
Metropolitan Transportation Authority (“MTA”), and DEC.
Reducing and Recycling Waste
EO 4 and EO 18 have significantly impacted how State agencies generate
and handle waste. Agencies have significantly reduced paper use,
decreased waste generation, increased recycling rates, and purchased
100% post-consumer recycled content copy paper at high levels. The
executive agencies covered by EO 18 have virtually eliminated the
purchase of bottled water.
The majority of agencies adopted paper use reduction practices starting in
FY 08-09. A shift to double-sided printing and electronic transactions
resulted in a 49% decrease in paper use through FY 15-16, a highly
encouraging trend that saved $19.6 million in FYs 11-12 through 15-16, a total of $40.9 million since reporting
began in FY 08-09, and will continue to save approximately $7 million per year going forward. By far the greatest
amount ($4.2 million), and more than one-half (57%) of dollars spent on copy paper in FY 15-16 went to purchase
100% post-consumer recycled content, processed chlorine-free copy paper. This represents a 35 percentage
point increase from the 22% (or $3.3 million) spent in FY 08-09.
By reducing copy paper
use, New York saved
$36 million in FYs 11-12
through 15-16 and will
continue to save
approximately $7 million
per year.

Fifth Progress Report on State Green Procurement and Agency Sustainability | Fiscal Year 2015-16 ii
*The modest increase in paper purchased in FY 14-15 is primarily due to a 20 percentage point increase in agencies reporting compared to
previous years. In FY 15-16, paper use declined even though the number of reporting agencies increased by 5 percentage points.
While FY 15-16 saw a bump upwards in overall waste generated, the increase is entirely due to two large entities,
the Department of Transportation (“DOT”) and MTA generating significantly more construction and demolition
(“C&D”) debris than the previous year, for a total of 189,270 additional tons. When this number is subtracted from
the total, the overall amount of waste generated for FY 15-16 is 390,745 tons, a 52% decrease from FY 08-09,
and a modest decrease from the previous reporting year, even though the number of reporting agencies
increased. This maintains the State’s encouraging waste reduction trend.
*The large increase in waste generated in FY 10-11 is primarily due to MTA reporting 200,000 tons more waste generated (most likely C&D
debris) as compared to the previous or following years. **The large increase in waste generated in FY 15-16 is due to DOT and MTA reporting
189,270 tons more C&D debris generated as compared to the previous year. The blue dashed lines indicate the amount of waste generated
for FYs 10-11 and 15-16 when those increases are subtracted. In FY 10-11, the increased waste was disposed of, not recycled. In FY 15-16,
the increase in materials generated was entirely recycled, leading to a notable increase in the overall recycling rate.
$14.54M
$12.79M $11.37M
$8.33M
$6.83M $6.81M
$7.89M* $7.44M
22%
49%44%
49% 52%43%
55%57%
01
02
0
FY 08-09 FY 09-10 FY 10-11 FY 11-12 FY 12-13 FY 13-14 FY 14-15 FY 15-16
Do
lla
rs S
pe
nt
(in
Mil
lio
ns
)Copy Paper Use Reduction and Recycled Content
Amount ofOverall PaperPurchased
Amount of100%RecycledPaperPurchased(and %)
815,000
507,929
682,043*
531,059501,125
386,766 398,895
580,015**
50%
63% 45%67% 71%
71% 70%
78%
0
100,000
200,000
300,000
400,000
500,000
600,000
700,000
800,000
900,000
FY 08-09 FY 09-10 FY 10-11 FY 11-12 FY 12-13 FY 13-14 FY 14-15 FY 15-16
To
ns
Waste Reduction and Recycling
Solid Waste Generated Waste Recycled (and %)
49% decrease in paper purchasing
390,745
without extra
C&D debris.

Fifth Progress Report on State Green Procurement and Agency Sustainability | Fiscal Year 2015-16 iii
The remarkable story told by the data in the chart above is the enormous progress agencies have made in
recycling C&D debris. In FY 10-11, the State saw a similar increase, of 200,000 tons, of waste generated by MTA.
None of that increased material was recycled, causing a dip in the recycling rate to 45%, its lowest recorded level.
In FY 15-16, all of the increased material was recycled, causing a bump in the recycling rate to 78%, its highest
recorded level.
In FY 15-16, DOT reported 64.4 lane miles of cold in place asphalt recycling, a significant increase from zero
miles the year before, that resulted in an increase of 136,013 tons of C&D debris generated, and also recycled, by
DOT over the previous year. MTA adopted an ambitious C&D recycling goal in 2014, and reports that of the 105
construction projects that generated C&D in FY 15-16, 32 achieved a 100% diversion rate and 48 recycled more
than 90% of the material generated, resulting in an increase of 53,257 tons of C&D recycled by MTA over the
previous year. Together, these trends account for the significant jump in the overall amount of materials recycled.
In FYs 12-13 through 15-16, agencies reported recycling rates of 70% or above, which represents a 20 percentage
point increase from FY 08-09 and well surpasses the statewide recycling goal of 50% established pursuant to the
Solid Waste Management Act of 1988. Of the 580,015 tons of waste generated in FY 15-16, 452,962 tons were
recycled or composted, more than the total amount of waste generated in the previous fiscal year.
The total amount of organic material composted in FY 15-16 increased 34% over the amount composted in FY
14-15, to 19,647 tons. Food scrap composting, a subset of that number, rose 20% to 8,885 tons, primarily as a
result of increased composting on SUNY campuses across the state.
The executive agencies covered by EO 18 have virtually eliminated the purchase of bottled water. Fourteen
agencies continue to use bottled water under special circumstances, such as for soldiers on active duty. 88% of
authorities and other reporting entities not covered by EO 18 have elected to comply anyway, restricting bottled
water use to special circumstances.
Driven by increased rates of recycling construction and demolition debris, the State’s overall
rate of recycling soared to 78% in FY 15-16. Here, debris to be recycled is moved by
conveyor belt as part of MTA’s construction of the Second Avenue Subway in Manhattan.

Fifth Progress Report on State Green Procurement and Agency Sustainability | Fiscal Year 2015-16 iv
Reducing the Environmental Impacts of Operations
Overall, agency reports document the widespread adoption of green practices that are helping to reduce energy
use, employee travel, waste, water use, and the use of toxic chemicals. Other initiatives, such as the use of
renewable energy, the purchase of Zero Emission Vehicles (ZEVs) and the adoption of employee workplace
charging programs are still in their infancy but promise growth in future years. In FY 15-16:
95% of agencies use webinars or videoconferencing at least some of the time to reduce employee travel, with
20% using them all of the time.
89% use electronic means to provide documents to the public all or most of the time, and 82% use electronic
means to receive documents or information from the public all or most of the time.
87% of agencies responsible for performing or contracting for cleaning at their facilities use green cleaning
products all or a majority of the time. 81% use fragrance-free products, 78% use concentrated products, and
75% have reduced the number of different kinds of cleaning products used.
86% of agencies use carpooling and fleet management practices at least some of the time to reduce employee
vehicle miles traveled.
85% set weather-appropriate building temperature control ranges to conserve energy at all or a majority of
their facilities.
83% use two-sided printing either all or a majority of the time.
71% of agencies responsible for indoor pest management use
integrated pest management (IPM) at all or a majority of their facilities.
73% of agencies have installed ENERGY STAR® equipment and
appliances at all or a majority of their facilities.
68% use high efficiency plumbing fixtures in at least some of
their facilities.
64% of agencies have an office supply reuse program in place in at least some of their facilities.
61% of agencies responsible for landscaping at their facilities are using practices that preserve or maximize
the use of native vegetation to support pollinators and reduce water and energy use at least some of the time.
58% of agencies responsible for turf and ornamental pest management use non-chemical means of pest
control at all or a majority of their facilities.
52% of agencies responsible for turf and ornamental management reported avoiding nursery stock treated with
insecticides at all or a majority of their facilities.
Saving Money and Buying Green
Overall, New York’s experience has shown that sustainable practices do not cost more and can even save
money, especially energy and waste reduction.
On average for FY 09-10 through FY 14-15, 38% of agencies reported saving money through energy reduction,
34% saved money by eliminating the purchase of bottled water, and 33% saved money through waste reduction
and reuse. Most reported either a reduction or no change in costs due to the implementation of projects across
EO 4’s other areas of focus: 52% for water and natural resource conservation, 51% for non-chemical pest control
or integrated pest management (“IPM”), 45% for recycling and composting, 48% for green cleaning, and 42% for
green procurement. Significantly fewer agencies (3% to 12% depending on the activity) experienced increases in
costs. More than one-third did not have estimates for changes in costs due to their activities.
Organic material
composting rose 34% to
19,647 tons in FY 15-16.
Food scrap composting
rose 20% to comprise
8,885 tons of that total.

Fifth Progress Report on State Green Procurement and Agency Sustainability | Fiscal Year 2015-16 v
On average, almost two-thirds (61%) of dollars spent on janitorial
paper in FY 15-16 went to purchase 100% recycled content paper, a
significant increase from the 34% of dollars spent on such paper in FY
08-09. The encouraging trends for both copy and janitorial paper
purchasing indicate widespread culture change and illustrate the
power of State contracting, as they were facilitated by statewide
contracts for 100% recycled paper first issued by OGS in the summer
of 2008.
Systems for tracking green purchases are in development. Combining agency reports with the total spent on 30%
or more post-consumer recycled content copy paper, 100% recycled janitorial paper, re-refined oil, green
computers, environmentally preferable cleaning products, environmentally preferable lighting products, green floor
coverings, and solar electric systems, overall green purchasing by State entities amounted to $66.3 million in
FY 15-16.
EO 4 requires the Interagency Committee to annually select a minimum of three priority categories of
commodities, services, and technologies, and at least 12 priority commodities, services, and technologies within
each category for which to develop green specifications. To date, the Committee has finalized 43 green
specifications covering a broad and diverse array of 84 products and services, including computers, cleaning
products, lighting, pest management, and sustainable landscaping. Many of these specifications are among the
most protective in the country.
OGS issued an impressive number of green contracts to support the purchase of EO 4-compliant goods and
services. The contract for “Recycling and Trash Removal Services” offers 11 different recycling options, including
the composting of food waste and other organics, and includes provisions for training, educational outreach, and
waste composition analysis. Offerings on the multi-state contract for “Environmentally Preferable Cleaning
Products, Programs, Equipment and Supplies” are fully green and in compliance with New York State law and EO
4 requirements. Twelve categories of products are covered, including general purpose cleaners, floor
maintenance chemicals, and even disinfectants.
Close to all agencies reporting, 97%, consulted the green procurement specifications when making purchases at
least some of the time in FY 15-16, and 63% did so all or a majority of the time. As New York’s green
procurement program continues to mature, with more green contracts issued and better tracking systems put into
place, reporting on green purchasing should become more robust.
3437
21
15
5 6 5
15
35
19 24
35
46
30
42
27
3 4 4 49
4
12 12
0
5
10
15
20
25
30
35
40
45
50
No WaterBottles
ReduceEnergy
ReduceWaste
ReduceWater & NR
Use
Less ToxicPest Mgt.
Recycling &Composting
GreenCleaning
GreenPurchasing
Pe
rce
mt
of
Res
po
nd
ers
Cost of Sustainability Programs FY 09-10 to FY 15-16
Saving Money No Change Increase In Cost
Overall, sustainable
practices do not cost
more and can even save
money, especially energy
and waste reduction.
Fifth Progress Report on State Green Procurement and Agency Sustainability | Fiscal Year 2015-16 vi
Challenges and Success Stories
Reports from the field in FY 15-16 highlighted progress and several important success stories.
Former challenges being met include:
Tracking of solid waste. The past eight years of measuring waste has resulted in the creation of tools and
changes of processes that have made it easier for agencies to track their performance. The “Recycling Services and
Trash Removal” contract is helping to enhance this trend, since it includes both training and tracking services.
Increasing the purchase of 100% post-consumer recycled content copy paper. Purchases have continued to
increase, reaching the highest level yet recorded in FY 15-16, at 57% of overall paper purchases, despite initial
concerns about price and performance. Statewide contracts for 100% recycled copy and janitorial paper by OGS
Procurement Services continue to support this trend, and data for the last seven years shows that 100% recycled
copy paper, on average, costs the same or less than other papers.
Promoting adoption of green cleaning practices. Green cleaning continues to be widely practiced, despite
initial concerns about price and performance. The “Environmentally Preferable Cleaning Products” contract, as
well as robust green offerings by preferred sources, are making it easier for agencies to identify and purchase
high-performing, fully green cleaning products at a competitive price.
Overcoming barriers to green purchasing. Actions taken by OGS to issue new green contracts, identify green
products on existing contracts (such as “Floor Coverings and Lamps”), and give prominent exposure to green
purchasing at the annual Purchasing Forum, continue to help agencies identify and purchase green products at a
competitive price.
Issues that are the focus of current improvement efforts include:
Tracking green purchasing. Most financial accounting systems currently used by agencies do not track green
purchasing data. Barriers include a lack of standard definitions and a coding system for green products. The EO 4
Subcommittee on Green Procurement is exploring options that would allow for the tracking of green purchasing in
OGS’s new e-catalog and the Statewide Financial System.
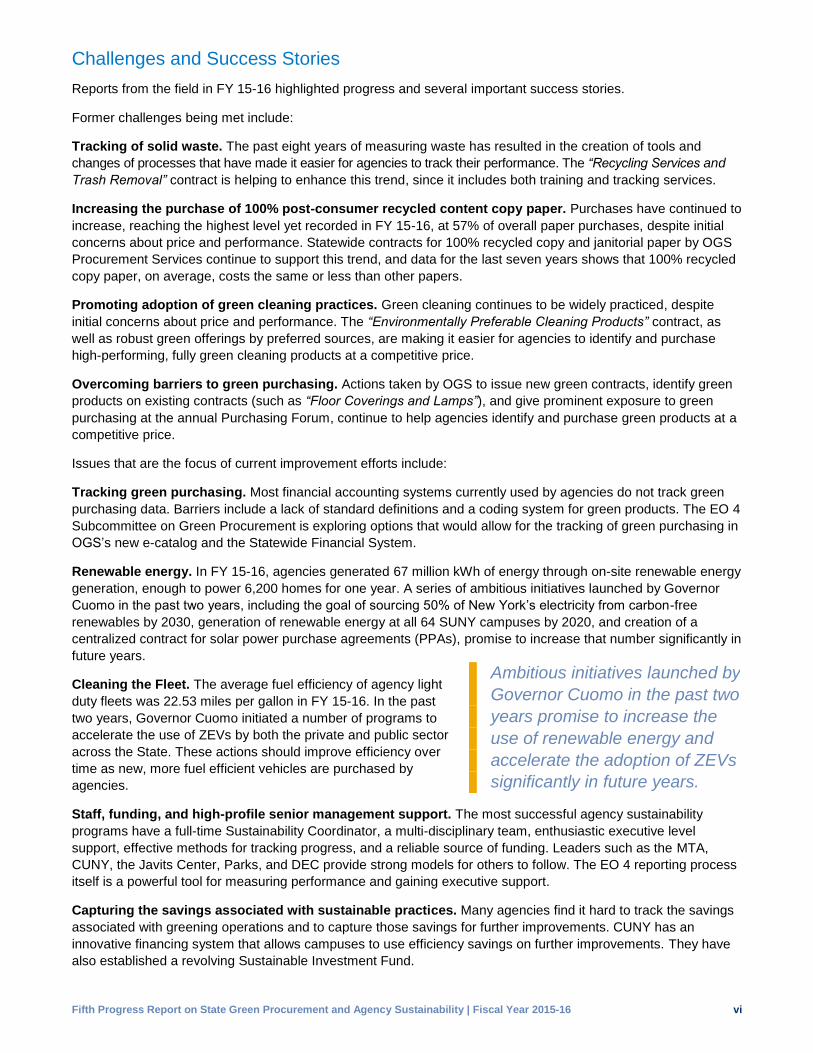
Renewable energy. In FY 15-16, agencies generated 67 million kWh of energy through on-site renewable energy
generation, enough to power 6,200 homes for one year. A series of ambitious initiatives launched by Governor
Cuomo in the past two years, including the goal of sourcing 50% of New York’s electricity from carbon-free
renewables by 2030, generation of renewable energy at all 64 SUNY campuses by 2020, and creation of a
centralized contract for solar power purchase agreements (PPAs), promise to increase that number significantly in
future years.
Cleaning the Fleet. The average fuel efficiency of agency light
duty fleets was 22.53 miles per gallon in FY 15-16. In the past
two years, Governor Cuomo initiated a number of programs to
accelerate the use of ZEVs by both the private and public sector
across the State. These actions should improve efficiency over
time as new, more fuel efficient vehicles are purchased by
agencies.
Staff, funding, and high-profile senior management support. The most successful agency sustainability
programs have a full-time Sustainability Coordinator, a multi-disciplinary team, enthusiastic executive level
support, effective methods for tracking progress, and a reliable source of funding. Leaders such as the MTA,
CUNY, the Javits Center, Parks, and DEC provide strong models for others to follow. The EO 4 reporting process
itself is a powerful tool for measuring performance and gaining executive support.
Capturing the savings associated with sustainable practices. Many agencies find it hard to track the savings
associated with greening operations and to capture those savings for further improvements. CUNY has an
innovative financing system that allows campuses to use efficiency savings on further improvements. They have
also established a revolving Sustainable Investment Fund.
Ambitious initiatives launched by
Governor Cuomo in the past two
years promise to increase the
use of renewable energy and
accelerate the adoption of ZEVs
significantly in future years.

Fifth Progress Report on State Green Procurement and Agency Sustainability | Fiscal Year 2015-16 vii
Leased spaces. Agencies located in leased spaces can find it difficult to ensure that EO 4 requirements are
being followed, especially at properties not managed by OGS. Sharing space with other tenants can also make
tracking waste difficult. The EO 4 Interagency Committee continues to explore how to provide more effective
training to agencies housed in leased space.
Donating surplus property for reuse outside government. Agencies continue to report the need for a more
streamlined process for donation of old furniture and equipment to local governments or not-for-profit
organizations. A number of SUNY campuses and NYPA are pioneers in reuse activities.
Staff training and culture change. Training and engagement are powerful tools for addressing obstacles to the
adoption of green practices. In 2016, the Interagency Committee created a new Operations and Engagement
Subcommittee and charged it with helping Sustainability Coordinators troubleshoot challenges and enhance
communication. It is working closely with the Training Subcommittee and OGS staff to launch a new EO 4 website
called “GreenNY,” and create fact sheets on green cleaning, green purchasing and surplus value. In December
2016, the new Subcommittee hosted the first annual GreenNY Forum, which brought Coordinators together to
discuss their efforts to green operations and learn about new initiatives and resources.
New and Noteworthy Initiatives in FY 15-16
People, Planning, and Money
In lieu of appointing a single Sustainability Coordinator, DEC launched a “silo-busting,” sustainability structure
that includes a Leadership Team and Sustainability Coordinators in each Region, supported by each Region’s
Operations Supervisor. Monthly and quarterly meetings are held with executive staff and the Commissioner.
Waste Reduction
SUNY Potsdam improved their campus-wide Move Out Program and donated 4 tons of reusable goods.
DASNY, CUNY Lehman College, SUNY Canton and SUNY Potsdam reduced printing and saved on paper,
toner, and maintenance costs by purchasing print management software.
Recycling
MTA achieved record levels of C&D debris recycling in FY 15-16 after
establishing an ambitious diversion goal in 2014. They also generated
$1 million in revenue from the sale of scrap metal.
SUNY campuses collected food scraps for composting in record
numbers – 2,305 tons in FY 15-16 – more than double the 882 tons they reported composting in FY 14-15.
SUNY Oneonta calculates that their recycling program saved $260,000 over the past 3 years.
Reducing Pesticide Use
SUNY Canton and SUNY Potsdam planted a bee and butterfly garden on campus where they've adopted
sustainable practices and educated the community on the link between non-chemical pest management and
pollinator protection.
Green Cleaning
The Development Authority of the North Country has reduced the quantity of chemicals in inventory for three
years running by carefully assessing need prior to purchasing and looking for less toxic alternatives.
SUNY Albany’s
sustainability initiatives
are saving $500,000 a
year in utility costs.

Fifth Progress Report on State Green Procurement and Agency Sustainability | Fiscal Year 2015-16 viii
Energy Efficiency
SUNY Albany replaced metal halide lights in their sports arena with LEDs, resulting in a 45% reduction in
lighting power use. Overall, the university is saving $500,000 per year due to sustainability initiatives.
The Javits Center has decreased energy consumption by 2.1 million kWh since FY 14-15 through demand
response management and everyday energy monitoring.
Renewable Energy
Parks completed a 693 kW solar array at Robert Moses State Park, making it the first energy neutral state park
in the nation.
The Olympic Regional Development Authority entered a PPA for 5.3 MWh of solar power at Gore Mountain.
CUNY Queens College installed solar panels on the roof of a campus dorm along with batteries. In the event of
a grid failure, the dorm would be able to use energy from the battery backup systems and remain occupied.
Sustainable Transportation
The Environmental Facilities Corporations (“EFC”) lowered their vehicle miles traveled (“VMT”) by nearly 20%,
bringing their two year decline in VMT to 36%.
The New York State Authority (“Thruway”) installed fast electric vehicle charging stations at four of their travel
plazas between New York City and Albany, capable of providing many vehicles with a full charge in less than
an hour.
Water Conservation and Reuse
SUNY Oswego upgraded their plumbing fixtures to high efficiency units in a 200 bed residence hall for a 30%
reduction in water use.
Green Infrastructure and Sustainable Storm Water Management
SUNY Empire State College constructed a large bioretention area which slows the flow of almost 100% of the
storm water coming from impervious surfaces on campus.
Sustainable Landscaping
Parks installed large-scale native plant and pollinator gardens.
The Capital District Transportation Authority switched to the
installation of low maintenance, native plants.
Education and Training
CUNY added recycling education modules in all new student and staff orientations.
Green Procurement
EFC modified its printing contracts to reduce the number of copies made and require contractors to use 100%
post-consumer content recycled paper.
Restricting the Use of Bottled Water
The Division of Military and Naval Affairs analyzed their practice of storing bottled water in disaster
preparedness kits and decided to buy only what is needed for a specific mission, eliminating potential waste.
In nine months of use, SUNY Farmingdale’s water bottle filling stations dispensed the equivalent of more than
300,000 16 oz. plastic water bottles.
Thruway installed fast
electric vehicle charging
stations at four of their travel
plazas that can provide a full
charge in less than an hour.

Fifth Progress Report on State Green Procurement and Agency Sustainability | Fiscal Year 2015-16 1
Achieving the Promise of Sustainability
A sustainable economy is healthy, vibrant, innovative, resilient, and diverse. Building a sustainable future requires
persistent innovation as New Yorkers work together to shift from the inefficient use of energy and materials
toward a new paradigm that emphasizes efficiency, closed-loop and cradle-to-cradle product purchasing, toxic-
free products and practices, and the protection of natural resources and ecosystems. Government efforts are
informed by efforts in the private sector (for example, by the winners of New York State’s Environmental
Excellence Awards), and these leadership practices provide a business model for others, giving businesses,
institutions, and individuals the inspiration and information they need to incorporate sustainability into their
business operations.
There are approximately 73 State agencies, authorities, offices, commissions, boards, and public benefit
corporations (“agencies” or “affected entities”) currently covered by EO 4. Under the Executive Order, each are
directed to incorporate sustainability into all aspects of their operations. EO 18 requires agencies to “eliminate the
expenditure of State funds for the purchase of bottled water.” To accomplish these goals, agencies are required to
develop and implement a Sustainability and Environmental Stewardship Program, implement effective waste
reduction and recycling strategies (including eliminating the use of bottled water), and assign an employee to serve
as Sustainability Coordinator. These coordinators serve the crucial function of incorporating sustainability into the
day-to-day operations of their agency.
The solar wall, one of many sustainable features, on the MTA’s new, award-winning LEED Gold
Mother Clara Hale Bus Depot in Manhattan, reduces energy use and related pollution and carbon emissions.

Fifth Progress Report on State Green Procurement and Agency Sustainability | Fiscal Year 2015-16 2
Both Orders require the Commissioners of
OGS and DEC to report regularly on progress,
in consultation with members of the
Interagency Committee on Sustainability
andGreen Procurement, onwhich they are co-
chairs. EO 18 authorizes combined reporting
for the two Executive Orders, and one form
has been used for agency reports since
FY 09-10.
Reporting has remained robust since the first
year of reporting in FY 08-09, when 69 EO 4
reports were filed by the roughly 100 entities
covered by the Order at that time. In 2011,
Governor Cuomo initiated a consolidation
effort among State agencies and authorities in
order to improve government efficiency and
performance. Taking into account joint
reporting, approximately 73 reporting entities
are now covered by the Order. A record
number of agencies, 66, or 90% of all covered
entities, filed reports in FY 15-16. This
summary compiles those individual reports
and uses more recent information when
necessary to provide a complete picture of
progress.
The Benefits of Sustainability
Shifting government operations and procurement toward a sustainable framework has the potential to significantly
reduce pollution and waste while saving taxpayer dollars. New York is comparable to a Fortune 500 company, with a
considerable environmental footprint and remarkable purchasing power. Currently, New York State government:
Operates more than 16,000 facilities totaling 225 million square feet, with an estimated annual utility bill of
$600 million.
Generates close to 400,000 tons of solid waste, more than a quarter of which is office waste.
Operates more than 24,000 vehicles.
Spends approximately $8 billion per year on the purchase of commodities, services, and technology.
Some of the key benefits of greening State government include:
Waste Prevention. Reducing or eliminating waste reduces agency costs, as well as the pollution, water use,
greenhouse gas emissions, energy and labor costs associated with raw material harvesting, resource extraction,
transportation and manufacturing, and the end-of-life management of wastes. Greenhouse gas emissions can be
reduced by more than 8 metric tons of CO2 equivalent (MTCO2e) by reducing office paper use by just 1 ton.
Reusing, upcycling, or sustainably remanufacturing a product conserves the energy, labor, and materials
embedded in the product, effectively closing the loop and contributing to waste prevention.
Recycling. Diverting materials for recycling and purchasing products with recycled content avoids the
environmental impacts associated with raw material harvesting and the disposal of waste, including habitat loss,
energy use, water use, and pollution. Each ton of paper recycled saves enough energy to power the average
American home for six months and reduces greenhouse gas emissions by 1 MTCO2e. Recycling also creates
jobs. According to the Institute for Local Self-Reliance, every 10,000 tons of waste kept out of the landfill can
EO 4 INTERAGENCY COMMITTEE
CHAIRS:
OGS and DEC
MEMBERS:
Division of Budget (DOB)
Dormitory Authority of the State of New York
(DASNY)
Empire State Development (ESD)
Environmental Facilities Corporation (EFC)
Department of Health (DOH)
NYS Energy Research and Development Authority
(NYSERDA)
Power Authority of the State of New York (NYPA)
Department of Transportation (DOT)

Fifth Progress Report on State Green Procurement and Agency Sustainability | Fiscal Year 2015-16 3
create 10 recycling jobs or 75 material reuse jobs. The depletion of natural resources can also weaken the
economy and hinder economic growth.
Reducing Toxic Chemical Use. Reducing or eliminating toxics use (for example by reducing the use of
pesticides or using green cleaning products) creates a healthier work environment for State employees, visitors,
and facility residents, resulting in better health, fewer sick days, and higher productivity. It also reduces toxic
bioaccumulation in the environment; toxic exposure to manufacturing employees; and the associated costs of
managing toxic materials during use, transportation, and disposal, including the significant cost of cleaning up
contaminated sites. Products made without toxic chemicals are also easier and safer to recycle and reuse.
Conserving energy. Using less energy reduces the pollution, water use, greenhouse gases, materials input, and
costs associated with energy generation. Redirecting our energy sources away from fossil fuels toward clean,
renewable energy, such as wind and solar, is creating jobs in New York State. Over time, renewable energy
technologies create a net-positive, regenerative effect on the environment, allowing air, water, and land to return
to a healthy state.
Conserving Water and Other Natural Resources.
Conserving water and practicing sustainable resource
management protects water quality, wildlife habitat and
ecosystems. It also avoids the energy use and costs
associated with the treatment and delivery of potable water.
Sustainably managed ecosystems provide many services to
New Yorkers, including the purification of water and air;
waste decomposition and detoxification; CO2 sequestration;
pollination; local timber; areas for hunting, fishing, recreation,
ecotourism, and wildlife viewing; and the use of natural
systems for scientific education.
Holistic Thinking and Multiple Benefits. When project teams consider a wide range of opportunities and
potential impacts, they are better able to achieve multiple benefits. For example, an energy efficiency project that
embraces the additional goal of improving indoor air quality avoids a potential pitfall and increases project benefits.
Lean efforts to streamline licensing projects can reduce paper use and help government respond more quickly.
Reducing Silos and Fostering Innovation. EO 4 has increased communication across agencies and
authorities, and allowed for the sharing of best practices and results. In turn, successful programs are serving as
role models for local governments and the private sector. Green procurement specifications provide a clear
market signal that drives sustainable innovation and helps build a more diverse, resilient, and stable economy.
Here are a few New York State initiatives directly supported by the work occurring under EO 4:
New York’s Beyond Waste sustainable materials management plan establishes a goal of reducing waste
disposed from 4.1 to 0.6 pounds per person per day by 2030.
New York’s Green Cleaning Program (Chapter 584 of the Laws of 2005) requires elementary and secondary
schools to use environmentally preferable cleaning products.
The Pollinator Task Force issued recommendations in 2016 to address pollinator population loss in
New York State.
Under the Regional Greenhouse Gas Initiative, multiple states are working together to cap and reduce CO2
emissions from the power sector.
Executive Order No. 88 drives improvements in energy efficiency in State buildings, with the goal of reducing
energy-use intensity (EUI) 20% by 2020.
The 2015 New York State Energy Plan, Reforming the Energy Vision, and The Clean Energy Standard
call for ambitious action to meet clean energy goals, such as deriving 50% of electricity from renewables by
2030.
Sustainability projects reduce
pollution and waste, save
taxpayer money, and foster
collaboration, innovation, and
the realization of multiple
benefits. They also support a
wide range of New York
State goals and initiatives.

Fifth Progress Report on State Green Procurement and Agency Sustainability | Fiscal Year 2015-16 4
The Clean Energy Fund is a 10-year, $5 billion
commitment to energy efficiency and renewable energy to
implement the State Energy Plan.
NY-Sun helps make solar energy affordable for all
New York residents, with the goal of adding more than
3 GW of installed solar capacity across the State by 2023.
K-Solar helps public schools lower their energy costs
through clean, local power.
The Multi-State ZEVs MOU and Action Plan is a
collective commitment by New York and seven other
states to have at least 3.3 million ZEVs operating on their roadways by 2025.
Clean Fleets NY requires that at least 50% of new, administrative-use vehicles purchased by select State
agencies be ZEVs, including battery electric, plug-in electric hybrid, or hydrogen fuel cell vehicles.
Through ChargeNY, the State is investing toward the goal of installing 3,000 electric vehicle charging stations
across the State to support the addition of 40,000 plug-in electric vehicles on the road in New York by 2018.
In 2015, New York joined the International ZEV Alliance to work with partners across the globe to expand the
electric vehicle market and phase out fossil fuel vehicle sales by 2050.
Green Jobs – Green NY provides access to training for energy efficiency, renewables, and other green-
collar careers.
The Governor’s Office of Storm Recovery, NY Rising, and the Community Risk and Resiliency Act help
impacted communities with reconstruction following storm events.
The Environmental Protection Fund supports land acquisition, waterfront revitalization, municipal recycling,
and pollution prevention. This year the Governor championed a continued historic investment ($300 million) in
this crucial fund, first created in 1993.
The NY State Excelsior Conservation Corps provides internships and volunteer opportunities that educate
and allow participants to gain hands-on stewardship experience in parks and other natural areas.
Taste NY and Buy NY expands the market for food and beverages produced in New York State.
New York FreshConnect Farmers’ Markets provide fresh foods in high need neighborhoods while supporting
locally sourced foods and local farmers.
Sustainability is the simultaneous
pursuit of environmental quality,
economic prosperity and social
well-being for present and future
generations. It includes
environmental justice and concern
for the health of natural ecosystems
and maintaining biodiversity.

Fifth Progress Report on State Green Procurement and Agency Sustainability | Fiscal Year 2015-16 5
Operating Green
New York enjoys the services of a wide range of government agencies. Facilities include office space, hospitals,
group homes, prisons, laboratories, parks, forests, campgrounds, golf courses, fish hatcheries, highways, railroads,
power plants, and universities. Each are required to adopt a sustainability program to reduce the adverse public
health and environmental impacts of their operations. Agencies are given wide latitude to design programs that work
best in the context of their unique mission. Areas of focus include: materials use reduction, reuse, recycling and
composting (including food waste); toxics use reduction; energy efficiency; renewable energy; transportation;
water and natural resource conservation; and the purchase of green products, services, and technology.
An overarching theme of sustainability work is “continuous improvement.” The strength and resiliency of a system
is increased when it is diverse, decentralized, and produces results that can be replicated. These attributes are
reflected in the efforts New York State employees are taking to green our State’s operations and purchasing.
The work is diverse, as the priorities of each agency are shaped by their unique mission, facilities, and capacity.
The work is decentralized, as each agency doing the work also experiences the benefits and challenges, and
is able to identify the next level of effort needed based on that experience.
The results can be replicated because success achieved by a particular agency can spurs like-minded efforts
by another agency.
As the chart below illustrates, the work is done in a continuous feedback loop of vision, effort, measurement,
troubleshooting, and building on success. A healthy system continuously innovates to identify solutions that
elegantly address challenges without creating new problems.
The EO 4 reporting structure makes agency efforts more effective and resilient by helping agencies assess their
progress and share lessons learned. Agencies are taking different approaches that vary in size and structure.
However, each is achieving successful trainings, programs, engagement, and results. Sharing obstacles allows
for collaborative problem solving, while sharing successes inspires further innovation.
Celebrate success
Communicate value
Renew commitment
Build support
Rinse and
Repeat
Identify Potential Solutions
Develop a vision
Identify priorities
Design potential solutions
Implement Solutions
Gather resources
Begin implementation
Navigate obstacles
Measure Progress
Create metrics
Compile and interpret data
Track progress
The Work of
Sustainability

Fifth Progress Report on State Green Procurement and Agency Sustainability | Fiscal Year 2015-16 6
Some perennial challenges may require new policies or culture change, and may take years to yield a solution.
Each employee who changes their printing habits, asks for a pitcher of water at meetings instead of bottled water,
or seeks carpoolers to the meeting is moving New York State in the right direction. Each and every action, no
matter how simple, moves us toward a more sustainable future. The key is to be vigilant, persistent, and process-
oriented in order to maintain traction and momentum. A drop in performance one year can be a springboard for
renewal and greater achievement the next.
The sections below present performance metrics and cost information for each focus area of sustainable activity.
They summarize the challenges experienced by agencies, share how some have navigated those challenges to
achieve even greater success, and highlight noteworthy new initiatives begun, underway or completed in the
reporting period. Each achievement rests on years of effort and brings us closer to the vision of operating green.
Leading the Green Team: People, Planning and Money
The backbone of EO 4 is collaborative work. Collaboration is enhanced when Sustainability Coordinators or
teams have a recognized, formal role in an agency’s structure that enables them to cut across silos, when they
engage and connect both operations staff (“boots”) and policy makers (“suits”), and when they have adequate
resources to carry out their work.
A stellar example of a successful team is CUNY’s sustainability program,
“CUNY Conserves,” described in detail in last year’s report. Each of
CUNY’s 19 campuses has their own Sustainability Council, supported by a
full-time central office Sustainability Coordinator and staff. The program’s
Sustainable Investment Fund is now in its fourth year. In 2016, it received
21 applications for funding. The fund was started with a philanthropist’s
$1 million donation. It has been set up as a revolving loan fund for energy
conservation projects that include a short-payback period, rapid
implementation, and operations and maintenance (O&M) studies. In FY
2017-18, CUNY will be rolling out “Boots and Suits,” a focused
communication program designed to allow building operators and senior campus administrators to “speak the
same language” and understand each other’s perspective on issues such as demand response, peak load
management and resource allocation.
Other agencies with strong sustainability programs include MTA, the Javits Center, Parks, the Port Authority of
New York and New Jersey (Port Authority), and the Development Authority of the North Country.
Findings
Of the 66 entities reporting in FY 15-16, 58, or 88%, had a designated sustainability coordinator, an increase from
51, or 82%, the previous year. At 10 agencies, or 15%, the coordinator serves in a full-time capacity as
Sustainability Coordinator only. A total of 17 agencies, or 26%, have a sustainability team. These are encouraging
trends. To be effective, agencies need a champion or recognized team of champions who are willing to lead and
coordinate the agency’s commitment to sustainability.
A total of 29 agencies (44%) are working on or have finalized formal sustainability plans, up from 23 (37%) the
previous year. These plans help agencies track their actions, learn from their success (or challenges), and inspire
additional improvement. Only 5 agencies (8%) have a dedicated budget or fund for sustainability initiatives.
Savings and Costs
This reporting year again has shown that sustainable practices do not typically cost more, and in many cases
save money through energy use reduction, paper use reduction, and waste reductions combined with higher
levels of recycling. Many energy projects do require up-front, capital investment, but most result in operational
savings. Projects with less potential to reduce costs can still be valuable. Many are able to be accomplished when
they tie into the mission of the agency, yield operational improvements, support health and comfort of staff, or are
aligned with a facility or service that is being upgraded and is able to accommodate better, more sustainable outcomes.
Teams are most
effective when they
are able to cut across
silos and engage
both operations staff
(boots) and policy
makers (suits).

Fifth Progress Report on State Green Procurement and Agency Sustainability | Fiscal Year 2015-16 7
A great example of a project with multiple benefits is DASNY’s upgrade of its copier fleet. The agency moved from
having 133 different devices with disparate toners, service contracts, ages, and capabilities to 32 state-of-the-art
machines with print management control software. The investment was significant and the Return on Investment
(ROI), based solely on avoided service and toner costs, is projected at 6.5 years. Paper savings are tracking at
over 30%. The biggest wins from the project are better resources for staff and higher security for printed and
scanned documents. This length of return is high for a State project, but when the additional non-cost benefits
related to support of staff, workflow, and security improvements are considered, the benefits of implementation
become obvious.
Tracking Savings and Addressing Up-Front Costs
MTA reports that a primary challenge with implementing sustainable
practices is making the case for investing in projects that may have
increased up-front costs. While MTA does not have a budget
exclusively dedicated to sustainability, each department works to
incorporate sustainable attributes into new capital projects. Sustainable
construction methods are cheaper in the long run, but generally they
are more expensive up-front than conventional methods, and the focus
remains on keeping down initial costs. Without a thorough life-cycle
analysis, it is often difficult to see the justification for increased up-front
costs. In response, MTA is building a new, enterprise-wide Asset Management System that will make it easier to
analyze costs and savings over the life of a project. In an effort to increase awareness, Sustainability Guidelines
have also been developed and distributed to all Capital Project Managers to encourage them to incorporate
sustainable practices into their projects.
A closely related challenge is that many agencies find it hard to measure the savings associated with
sustainability improvements. A number of agencies are addressing this challenge through innovative approaches.
CUNY is working to achieve real-time monitoring (RTM) of energy use on each of their campuses. Once
installed, RTM systems will allow each college to track energy use in 15 minute increments, allowing them to
make informed choices to reduce peak and overall energy use, as well as spot anomalies that indicate
malfunctions. Utilities are willing to pay their customers for responding when called upon to reduce energy use.
In FY 15-16, CUNY held a number of “demand response” (DR) trainings for each school that simulated DR
events. They also coordinated the development of DR plans, all focused on ways to lower demand in response
to utility requests. In the spring of 2016, in anticipation of a long hot summer and increased energy demand,
CUNY Conserves established a “war room” with engineers on call during DR days to help colleges respond as
quickly as possible.
The Javits Center successfully participated in DR programs offered by both ConEdison and the New York
Independent Systems Operator. This, along with close auditing of their energy bill performed by their third party
energy dashboard supplier, created a revenue stream for sustainability projects.
DASNY signed onto a peak demand reduction contract with their utility, which saved them money on electricity
and earned them a payout of approximately $5,000 per year.
The Westchester Medical Center’s Green Team is working on developing a dashboard to capture all savings
associated with sustainability initiatives.
Challenges and Success Stories
Many challenges can be addressed by taking into account benefits that go beyond the required fiscal investment
and potential savings. These can include improvements to business line, product or service quality, and employee
health and wellbeing. Many of the challenges discussed below are being addressed by clearly building such co-
benefits into project intent and implementation. The most successful projects engage people, seek to be creative,
and look beyond the confines of the stated problem.
The United Nations Development Corporation reports that: “As a result of an energy use reduction project, our
perimeter exterior lighting was improved which will enhance security in those areas.”
MTA is implementing an
asset management
system to make it easier
to assess the long-term
financial advantages of
sustainable projects.

Fifth Progress Report on State Green Procurement and Agency Sustainability | Fiscal Year 2015-16 8
Staffing
As with any long-term initiative, changes in staff can impact
reporting or the development of sustainability plans at an agency.
When an agency’s designated Sustainability Coordinator changes,
all agencies are encouraged to quickly designate a replacement.
The majority of Sustainability Coordinators are not dedicated full-
time to that role. To ensure a smooth transition for EO 4 reporting,
we have begun asking for additional contact information for
contributors to each agency’s report.
Several agencies have created excellent ways to maintain continuity and integrate sustainability throughout their
agency. Others have succeeded by focusing greening efforts on specific projects.
The Battery Park City Authority’s entire parks division staff (more than 70 people) is involved in implementing
the agency’s sustainability plan in one way or another. Everything they do, from composting and organic
garden maintenance to sidewalk cleaning and compactor collection, are done with organic supplies and
sustainability in mind. Green practices are at the core of the park division’s organization at every level.
At the Development Authority of the North Country, the number of toxic chemicals in inventory has been
reduced by 63% since 2011 when a team of experts was named to spearhead the effort at the division level.
Widening the Lens to Overcome Obstacles and Capture Benefits
A prominent challenge reported frequently is that many sustainability improvements are process changes that
require a shift in effort, meaning more labor and attention to process is often needed, especially at first, to achieve
greater sustainability. For example, it is easier to throw all waste in one bin than it is to figure out what should be
thrown where, and contract for different types of removal services, not to mention monitor and measure progress.
Sustainability also encourages
agencies to optimize in ways that
may be outside their experience.
Thruway experienced such a
challenge this reporting year with the
installation of wind turbines. The
project was financed as a capital
investment to support New York’s
goal of increasing renewable energy
use while lowering electricity costs
(over the life of the turbines). The
challenge has been maintenance:
the effort and skills needed to
maintain the turbines is outside their
staff’s current experience and has
proved difficult. New York might
realize greater traction in renewable
energy and other transformational
sustainability initiatives by supporting
agencies through training or even
the issuance of state contracts for
maintenance services.
The Development Authority of the North Country reports that while reuse often results in cost savings in regard
to materials, it can require additional investments of staff time and equipment.
Sustainability Coordinators from more than 34 agencies gathered
at the first annual GreenNY Forum in December 2016 to share
their experience and learn about new initiatives and resources.
By involving many staff in
design and implementation,
sustainability plans can
make an agency’s efforts
more resilient to change.

Fifth Progress Report on State Green Procurement and Agency Sustainability | Fiscal Year 2015-16 9
The best examples of conquering these disincentives come from the SUNY and CUNY systems. They have
realized the value of positive community engagement and connection, and have built programs to achieve that
good-will benefit. The effort is no less resource intensive, but understanding and marketing all the benefits has led
to success.
SUNY Canton improved their campus-wide Move Out Program and donated 6,000 lbs. of reusable goods to
more than 10 different local organizations, including the Boys and Girls Club and the Humane Society.
SUNY Morrisville is growing more food on campus and incorporating the work into many of its degree
programs, educating students and providing fresh produce for the dining halls and campus restaurant.
CUNY has included a resiliency goal in their move towards renewable energy production, making it much
easier to support each installation of solar arrays. Queens College and Sustainable CUNY are partnering with
the U.S. Department of Energy’s Sustainable and Holistic Integration Energy Storage and Solar (SHINES)
program to install both solar panels and batteries on the roof of a campus dorm. In the event of a grid failure,
the dorm can remain occupied, with energy drawn from the battery backup systems.
Outside Recognition and Marketing
Participation in outside certification and recognition programs can make it easier for an agency to communicate
success, market sustainability initiatives, and achieve a long-lasting commitment to sustainability.
The SUNY system is using the Association for the Advancement of Sustainability in Higher Education’s
Sustainability Tracking Assessment and Rating System (AASHE Stars) to help them create a stronger
reputation for triple bottom line performance. AASHE Stars supports in several areas, including community
engagement, buildings and operations, and education.
The Westchester Medical Center has initiated an application for Westchester Green Business Challenge
(WGBC) certification. The application requires 89 actions and offers an additional 119 volunteer actions
designed to help set policies, take action and measure performance in areas including: organizational
commitment, energy, materials management in waste and recycling, materials management in purchasing,
transportation, land use, and water.
New and Noteworthy Initiatives in FY 15-16
DEC launched a new collaborative, multi-disciplinary sustainability structure
in 2016 that includes a Leadership Team, a Central Office Team, and a
Regional Sustainability Team made up of a Sustainability Coordinator from
each region as well as each Region’s Operations Supervisor. Instead of a
single sustainability coordinator, the teams are co-led by two staff, one drawn
from the Operations Division and one from the Pollution Prevention Unit,
supported by staff from the regions and executive. This structure is proving
effective at “silo-busting,” connecting boots and suits, and completing
successful projects.
Parks appointed Sustainability Coordinators in each region.
Waste and Paper Use Reduction Goals
New York’s Beyond Waste sustainable materials management plan, adopted in 2010, establishes a 20-year goal
of reducing the average amount of waste New Yorkers dispose of from 4.1 to 0.6 pounds per person per day. The
plan marks a shift from focusing on “end‐of‐the‐pipe” waste management to looking “upstream” at how materials
that would otherwise become waste can be avoided or better utilized as part of an efficient, vibrant economy.
EO 4 is specifically discussed in the plan as a valuable step forward in integrating waste prevention and recycling
into State operations.
Creative problem-
solving can reveal
the indirect and
non-monetary
benefits of green
practices.

Fifth Progress Report on State Green Procurement and Agency Sustainability | Fiscal Year 2015-16 10
Waste Reduction Goal
Given the importance of prevention, the EO 4 Interagency Committee established a waste reduction goal of
reducing total office waste generated by 10% per full-time employee equivalent (FTE) per year, starting with the
baseline year of FY 09-10. Office waste includes paper, plastics, metal and glass generated by office facilities.
Total waste generated is the sum of materials that are recycled, as well as materials sent to disposal. The
purpose of estimating waste generation per FTE is to enable agencies to compare their performance from one
year to the next by avoiding the variation associated with changing staffing levels.
The goal was applied to office waste only because the Interagency Committee determined that a single metric for
measuring reductions in other types of waste would be not be comparable over time. Agencies whose primary
purpose is transportation or construction generate very large quantities of bulk metals and construction and
demolition debris regardless of the size of their staff. Agencies that manage waste generated by the public, such
as Parks, SUNY and CUNY, also experience variation unrelated to staff size. For these reasons, the goal should
be viewed as a meaningful way for agencies to measure their own performance, but not as way to compare
performance across agencies.
While the waste reduction goal of 10% per FTE per year applies to office facilities and office waste only, data on
all materials generated–recycled and disposed–is still collected, but waste generated by the public and wastes
unrelated to staffing levels, such as C&Ddebris, scrap metal, and laboratory wastes, is reported separately
wherever possible. The Interagency Committee encourages agencies to develop meaningful waste reduction
goals for wastes specific to their own operations and to report on progress made toward reaching those goals in
their agency’s EO 4 report.
Paper Use Reduction Goal
The goal established for paper use reduction is a 10% reduction in copy paper purchased per FTE per year by
weight, starting with the baseline year of FY 09-10. In addition, the Committee asks agencies to report the
quantities of all janitorial paper purchased, and to identify steps taken to reduce the use of janitorial paper, such
as paper towel use. As with waste reduction, the paper use goal provides a meaningful way for agencies to
assess their progress in reducing paper use over time. Comparison between agencies is discouraged, given the
large variation in paper use across agencies based on mission.
Waste Reduction and Reuse
Agencies report that the EO 4 reporting process encourages them to take a more detailed look at the waste they
generate and develop more effective waste management practices. Overall waste generation data continued to
indicate a favorable downward trend, recycling rates stayed strong, and executive agencies have virtually eliminated
the purchase of bottled water.
Findings
FY 15-16 saw a significant bump upwards in overall waste generated, to 580,015 tons, but the increase is entirely
due to two large entities, DOT and MTA, generating significantly more construction and demolition (C&D) debris
than the previous year, for a total of 189,270 additional tons. When this number is subtracted from the total, the
overall amount of waste generated for FY 15-16 is 390,745 tons, a 52% decrease from FY 08-09, and a modest
decrease from the previous reporting year, even though the number of reporting agencies increased by 5 percentage
points. This maintains the State’s encouraging waste reduction trend (see chart on page ii of this report).
The remarkable story told by the data and agency reports in this reporting year is the enormous progress made in
recycling C&D debris. In FY 10-11, the State saw a similar increase, of 200,000 tons, of C&D debris generated,
which happened to be by the MTA. Although MTA additionally generated and also recycled an impressive
quantity of C&D debris in that year, a total of 151,000 tons, none of the 200,000 ton bump in C&D debris
generated was recycled, which caused a dip in the overall State recycling rate to 45%, its lowest recorded level.

Fifth Progress Report on State Green Procurement and Agency Sustainability | Fiscal Year 2015-16 11
In FY 15-16, DOT reported 64.4 lane miles of cold in place asphalt recycling, a significant increase from zero
miles the year before, that resulted in an increase of 136,013 tons of C&D debris generated, and also recycled, by
DOT over the previous year. MTA adopted an ambitious C&D recycling goal in 2014, and reports that of the
105 construction projects that generated C&D in FY 15-16, 32 achieved a 100% diversion rate and 48 recycled
more than 90% of the material generated. As a result, when MTA generated an additional 53,257 tons of C&D
debris in FY 15-16, all of it was recycled. Together, these two agencies’ efforts account for the significant jump in
the overall amount of waste recycled, to 78%, the highest level ever recorded.
Office waste accounted for 8% of the total waste generated in FY 15-16, while non-office waste accounted for
92%. The amount of office waste generated fell in FY 15-16 by 11% compared to the previous year. Overall,
office waste has gradually decreased 31% from 68,855 tons generated in FY 09-10 to 47,410 tons in FY 15-16,
an encouraging trend.
With the adoption of waste conservation techniques, such as double-sided printing and the use of electronic
documents, agencies have significantly reduced the overall amount of paper purchased and consumed. This has
led to significant reductions in the amount of waste generated and purchasing costs. In FY 15-16, 61 agencies
reported purchasing 223,538 boxes of copy paper worth $7.44 million, a 10% drop in the quantity purchased from
the previous year, even though the number of agencies reporting rose by 5 percentage points. The amount spent
on copy paper has fallen by an impressive 49% since FY 08-09 when agencies reported spending $14.54 million
on copy paper. This reduction adds up to $19.6 million in savings in FYs 11-12 through 15-16, $40.9 million in
savings since reporting began, and approximately $7 million in savings per year going forward. (See chart on p. ii,
and more detailed discussions on pages 36-38 of this report).
In FY 15-16, agencies reported use of the following waste reduction strategies:
83% agencies use two-sided printing either all (27%) or most (56%) of the time.
89% of reporting agencies use electronic means to provide documents to the public either all (21%) or most
(68%) of the time.
82% use electronic means to receive documents or information from the public either all (14%) or most (68%) of
the time.
73% use SharePoint, intranet, or other electronic means to share documents among employees either all
(18%) or most (55%) of the time.
64% have an office supply reuse program in place at least some of their facilities; 32% have them in place at all
(14%) or a majority (18%) of their facilities.
68,855
59,202 56,157
47,03647,244* 53,245**
47,410
0
10,000
20,000
30,000
40,000
50,000
60,000
70,000
80,000
FY 09-10 FY 10-11 FY 11-12 FY 12-13 FY 13-14 FY 14-15 FY 15-16
To
ns
of
Wa
ste
Office Waste Generated (all reporting agencies)
74
Agencies 66
Agencies 56
Agencies 58
Agencies
54
Agencies
62
Agencies
66
Agencies

Fifth Progress Report on State Green Procurement and Agency Sustainability | Fiscal Year 2015-16 12
In addition, 34% of agencies reported using controls to track and manage printing, such as the mandatory use of
employee or student ID cards, to limit excessive paper use all (8%), most (9%), or some (15%) of the time.
*Fluctuations in the percentage of agencies reporting are due to changes in the ability of agencies to track savings and costs from year to
year. There is steady reporting of savings compared to increases in cost.
Savings and Costs
On average over the past seven years, a significant number of agencies (32%) reported saving money through
waste reduction. More than half have reported either a reduction or no change in costs. Only a very small number,
4%, have reported an increase in costs. More than 40% said they did not know.
Improvements in reuse have resulted in reductions in waste management costs and improved environmental
benefits. Many waste reduction strategies require staff education and participation. DEC and NYPA have both
successfully engaged their staff by having zero waste events which rely on staff bringing their own plates and
utensils as well as composting and recycling. Zero waste events are a true example of agencies and staff being
environmentally, socially, and economically responsible. Waste is virtually eliminated, organics are diverted, and
employees are engaged in sustainable action.
Success Stories, Challenges and Lessons Learned
Measuring Waste Generation and Recycling
In general, the continued focus on measuring waste and improving tracking tools and processes have made it
easier for agencies to manage their performance. The “Recycling Services and Trash Removal” contract supports
these efforts as it includes both training and waste tracking services.
Despite considerable progress over the past several years, opportunities for improvement still exist. At some
facilities, centralized dumpsters collect waste generated from office and non-office sources, or from State agency
employees and other building occupants, making it difficult to measure one source in isolation.
In addition, waste haulers may not have the equipment needed for measurement. For example, NYSERDA
contracts with a waste hauler that does not have scales on their trucks. The authority’s small size and the
relatively low value of the contract makes successful renegotiation with a different vendor unlikely. Therefore,
NYSERDA's reported numbers only reflect their recycling efforts where accurate measurement is possible.
Another challenge is changes in office space or waste collection. When an agency experiences a significant
relocation or a purge of paper documents, for example, their reporting may be skewed. It is important in these
cases to appropriately describe the reason for the disparity. Once the event is over, waste generation should
drop dramatically.
MTA’s Assistant Director of Environment and Sustainability developed a waste management calculator for
capital projects that allows for more accurate tracking of waste generated and recycled during construction.
40
50 *
2729
2529
25
1916
1923 23 24
29
3 3
85 5
2 00
10
20
30
40
50
60
FY 09-10 FY 10-11 FY 11-12 FY 12-13 FY 13-14 FY 14-15 FY 15-16
Pe
rce
nt
of
Re
sp
on
de
rs
Savings and Costs: Waste Reduction FYs 09-10 to 15-16
Saving Money
No Change
Increase in Cost
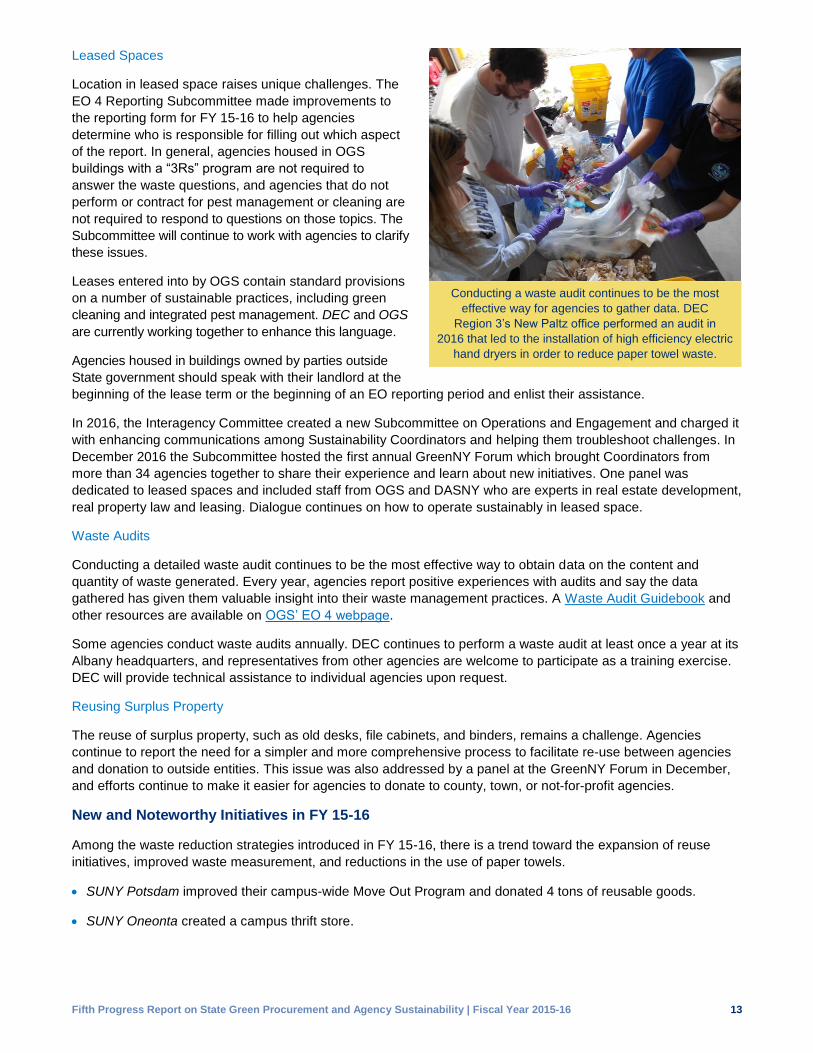
Fifth Progress Report on State Green Procurement and Agency Sustainability | Fiscal Year 2015-16 13
Leased Spaces
Location in leased space raises unique challenges. The
EO 4 Reporting Subcommittee made improvements to
the reporting form for FY 15-16 to help agencies
determine who is responsible for filling out which aspect
of the report. In general, agencies housed in OGS
buildings with a “3Rs” program are not required to
answer the waste questions, and agencies that do not
perform or contract for pest management or cleaning are
not required to respond to questions on those topics. The
Subcommittee will continue to work with agencies to clarify
these issues.
Leases entered into by OGS contain standard provisions
on a number of sustainable practices, including green
cleaning and integrated pest management. DEC and OGS
are currently working together to enhance this language.
Agencies housed in buildings owned by parties outside
State government should speak with their landlord at the
beginning of the lease term or the beginning of an EO reporting period and enlist their assistance.
In 2016, the Interagency Committee created a new Subcommittee on Operations and Engagement and charged it
with enhancing communications among Sustainability Coordinators and helping them troubleshoot challenges. In
December 2016 the Subcommittee hosted the first annual GreenNY Forum which brought Coordinators from
more than 34 agencies together to share their experience and learn about new initiatives. One panel was
dedicated to leased spaces and included staff from OGS and DASNY who are experts in real estate development,
real property law and leasing. Dialogue continues on how to operate sustainably in leased space.
Waste Audits
Conducting a detailed waste audit continues to be the most effective way to obtain data on the content and
quantity of waste generated. Every year, agencies report positive experiences with audits and say the data
gathered has given them valuable insight into their waste management practices. A Waste Audit Guidebook and
other resources are available on OGS’ EO 4 webpage.
Some agencies conduct waste audits annually. DEC continues to perform a waste audit at least once a year at its
Albany headquarters, and representatives from other agencies are welcome to participate as a training exercise.
DEC will provide technical assistance to individual agencies upon request.
Reusing Surplus Property
The reuse of surplus property, such as old desks, file cabinets, and binders, remains a challenge. Agencies
continue to report the need for a simpler and more comprehensive process to facilitate re-use between agencies
and donation to outside entities. This issue was also addressed by a panel at the GreenNY Forum in December,
and efforts continue to make it easier for agencies to donate to county, town, or not-for-profit agencies.
New and Noteworthy Initiatives in FY 15-16
Among the waste reduction strategies introduced in FY 15-16, there is a trend toward the expansion of reuse
initiatives, improved waste measurement, and reductions in the use of paper towels.
SUNY Potsdam improved their campus-wide Move Out Program and donated 4 tons of reusable goods.
SUNY Oneonta created a campus thrift store.
Conducting a waste audit continues to be the most
effective way for agencies to gather data. DEC
Region 3’s New Paltz office performed an audit in
2016 that led to the installation of high efficiency electric
hand dryers in order to reduce paper towel waste.
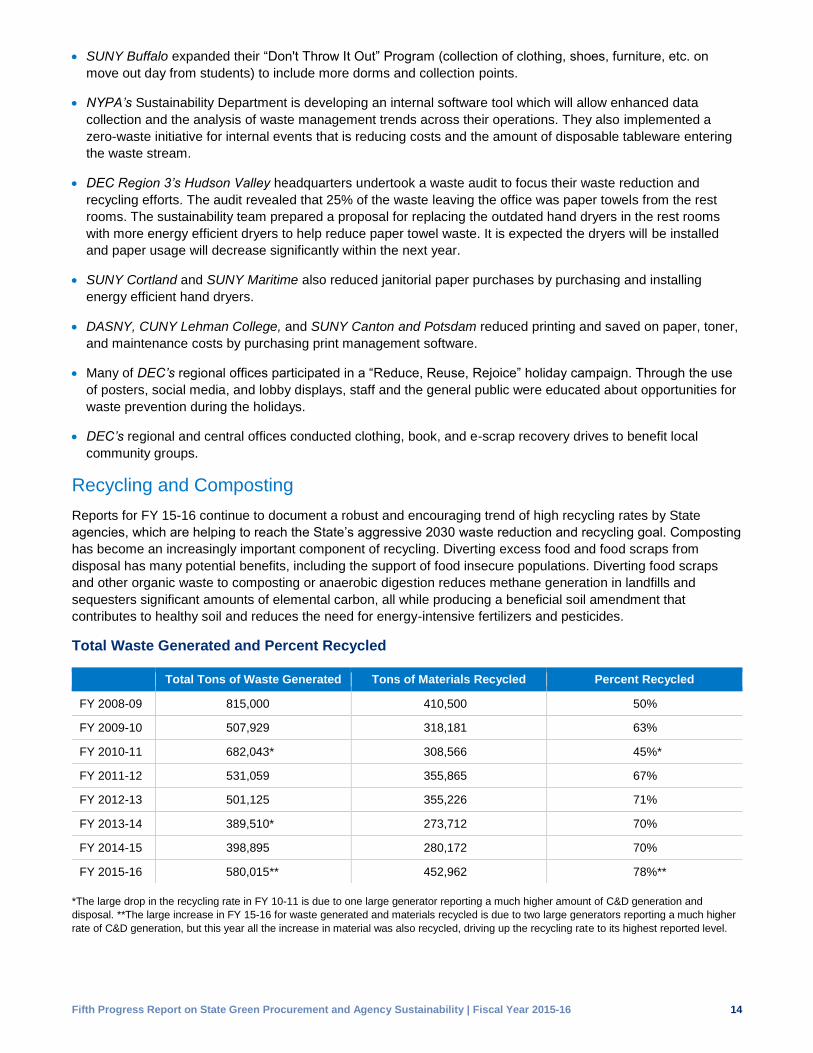
Fifth Progress Report on State Green Procurement and Agency Sustainability | Fiscal Year 2015-16 14
SUNY Buffalo expanded their “Don't Throw It Out” Program (collection of clothing, shoes, furniture, etc. on
move out day from students) to include more dorms and collection points.
NYPA’s Sustainability Department is developing an internal software tool which will allow enhanced data
collection and the analysis of waste management trends across their operations. They also implemented a
zero-waste initiative for internal events that is reducing costs and the amount of disposable tableware entering
the waste stream.
DEC Region 3’s Hudson Valley headquarters undertook a waste audit to focus their waste reduction and
recycling efforts. The audit revealed that 25% of the waste leaving the office was paper towels from the rest
rooms. The sustainability team prepared a proposal for replacing the outdated hand dryers in the rest rooms
with more energy efficient dryers to help reduce paper towel waste. It is expected the dryers will be installed
and paper usage will decrease significantly within the next year.
SUNY Cortland and SUNY Maritime also reduced janitorial paper purchases by purchasing and installing
energy efficient hand dryers.
DASNY, CUNY Lehman College, and SUNY Canton and Potsdam reduced printing and saved on paper, toner,
and maintenance costs by purchasing print management software.
Many of DEC’s regional offices participated in a “Reduce, Reuse, Rejoice” holiday campaign. Through the use
of posters, social media, and lobby displays, staff and the general public were educated about opportunities for
waste prevention during the holidays.
DEC’s regional and central offices conducted clothing, book, and e-scrap recovery drives to benefit local
community groups.
Recycling and Composting
Reports for FY 15-16 continue to document a robust and encouraging trend of high recycling rates by State
agencies, which are helping to reach the State’s aggressive 2030 waste reduction and recycling goal. Composting
has become an increasingly important component of recycling. Diverting excess food and food scraps from
disposal has many potential benefits, including the support of food insecure populations. Diverting food scraps
and other organic waste to composting or anaerobic digestion reduces methane generation in landfills and
sequesters significant amounts of elemental carbon, all while producing a beneficial soil amendment that
contributes to healthy soil and reduces the need for energy-intensive fertilizers and pesticides.
Total Waste Generated and Percent Recycled
Total Tons of Waste Generated Tons of Materials Recycled Percent Recycled
FY 2008-09 815,000 410,500 50%
FY 2009-10 507,929 318,181 63%
FY 2010-11 682,043* 308,566 45%*
FY 2011-12 531,059 355,865 67%
FY 2012-13 501,125 355,226 71%
FY 2013-14 389,510* 273,712 70%
FY 2014-15 398,895 280,172 70%
FY 2015-16 580,015** 452,962 78%**
*The large drop in the recycling rate in FY 10-11 is due to one large generator reporting a much higher amount of C&D generation and
disposal. **The large increase in FY 15-16 for waste generated and materials recycled is due to two large generators reporting a much higher
rate of C&D generation, but this year all the increase in material was also recycled, driving up the recycling rate to its highest reported level.

Fifth Progress Report on State Green Procurement and Agency Sustainability | Fiscal Year 2015-16 15
Findings
In the last four reporting years, 70% or more of the solid waste generated by State agencies was recycled or
composted, compared to a 50% rate of recycling in FY 08-09. In FY 15-16, that percentage rose to the highest
level ever recorded, 78%, due to impressive increases in the recycling rate of construction and demolition (C&D)
debris by DOT and MTA (see the chart on page ii, and more detailed discussions on pages 10-11 and 17 of this
report).
The total amount of organic material composted in FY 15-16 rose by 5,022 tons to 19,647 tons, a 34% increase
from the 14,625 tons composted in FY 15-16.
Food scrap composting rose by 1,470 tons to 8,885 tons, a 20% increase from the 7,415 tons composted in
FY 14-15, primarily as a result of increased composting on SUNY campuses across the state.
In FY 15-16, the number of agencies that reported composting rose slightly to 16 from 15 in the previous reporting
year. SUNY and the Department of Corrections and Community Supervision (DOCCS) accounted for 87% of all
material composted in FY 15-16, with SUNY increasing their composting by 4,429 tons and DOCCS increasing
their composting by 333 tons over the previous reporting year.
SUNY campuses also collected food scraps for composting in record numbers – (2,305 tons in FY 15-16) – well
over the 882 tons they reported composting in FY 14-15. Many colleges have found a way to either compost on
site or send their compostables to a local facility.
The pie chart below provides a breakdown of the total quantity of materials recycled by agencies, on average, in
FY 15-16. Because waste types are split out by weight, “office recyclables” (paper, bottles and cans) amount to
significantly less than non-office recyclables, which weigh more. C&D material includes concrete, asphalt, brick
and clean wood that come from building construction, renovation and demolition, as well as highway construction
and maintenance.
Savings and Costs
On average over the past seven years, a significant plurality of agencies (50%) reported a reduction (15%) or no
change (35%) in costs as a result of recycling efforts. A much smaller number (7%) reported an increase in costs.
More than 40% reported that they did not know. The agencies reporting savings had more comprehensive waste
reduction, reuse, recycling and composting programs.
291,77745%
33,98018%
41,93514%
7,5383%
19,6474%
58,08414%
Tons of Material by Type Recycled by EO4 Reporting Entities FY 15-16
Clean Construction & Demolition Debris
Bulk Metals
Office Recyclables (paper, glass, etc. fromall facilities, not just office buildings)
Maintenance and Equipment Recycling
Compostables
Other
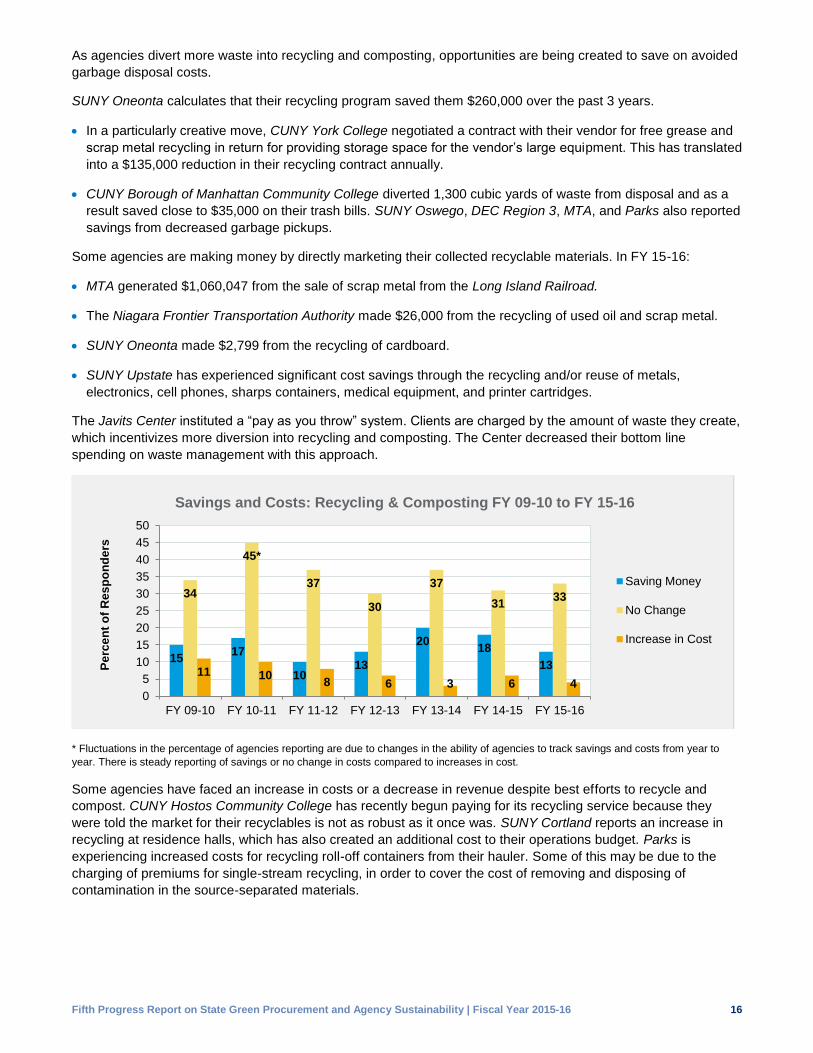
Fifth Progress Report on State Green Procurement and Agency Sustainability | Fiscal Year 2015-16 16
As agencies divert more waste into recycling and composting, opportunities are being created to save on avoided
garbage disposal costs.
SUNY Oneonta calculates that their recycling program saved them $260,000 over the past 3 years.
In a particularly creative move, CUNY York College negotiated a contract with their vendor for free grease and
scrap metal recycling in return for providing storage space for the vendor’s large equipment. This has translated
into a $135,000 reduction in their recycling contract annually.
CUNY Borough of Manhattan Community College diverted 1,300 cubic yards of waste from disposal and as a
result saved close to $35,000 on their trash bills. SUNY Oswego, DEC Region 3, MTA, and Parks also reported
savings from decreased garbage pickups.
Some agencies are making money by directly marketing their collected recyclable materials. In FY 15-16:
MTA generated $1,060,047 from the sale of scrap metal from the Long Island Railroad.
The Niagara Frontier Transportation Authority made $26,000 from the recycling of used oil and scrap metal.
SUNY Oneonta made $2,799 from the recycling of cardboard.
SUNY Upstate has experienced significant cost savings through the recycling and/or reuse of metals,
electronics, cell phones, sharps containers, medical equipment, and printer cartridges.
The Javits Center instituted a “pay as you throw” system. Clients are charged by the amount of waste they create,
which incentivizes more diversion into recycling and composting. The Center decreased their bottom line
spending on waste management with this approach.
* Fluctuations in the percentage of agencies reporting are due to changes in the ability of agencies to track savings and costs from year to
year. There is steady reporting of savings or no change in costs compared to increases in cost.
Some agencies have faced an increase in costs or a decrease in revenue despite best efforts to recycle and
compost. CUNY Hostos Community College has recently begun paying for its recycling service because they
were told the market for their recyclables is not as robust as it once was. SUNY Cortland reports an increase in
recycling at residence halls, which has also created an additional cost to their operations budget. Parks is
experiencing increased costs for recycling roll-off containers from their hauler. Some of this may be due to the
charging of premiums for single-stream recycling, in order to cover the cost of removing and disposing of
contamination in the source-separated materials.
1517
1013
2018
13
34
45*
37
30
37
3133
11 108 6 3 6 4
0
5
10
15
20
25
30
35
40
45
50
FY 09-10 FY 10-11 FY 11-12 FY 12-13 FY 13-14 FY 14-15 FY 15-16
Pe
rce
nt
of
Res
po
nd
ers
Savings and Costs: Recycling & Composting FY 09-10 to FY 15-16
Saving Money
No Change
Increase in Cost

Fifth Progress Report on State Green Procurement and Agency Sustainability | Fiscal Year 2015-16 17
Success Stories, Challenges, and Lessons Learned
Source Separation and Education
CUNY reports that college communities do not always separate materials properly which results in the
contamination of recyclables with garbage and the loss of recyclables mistakenly placed in the garbage. Most
colleges agree that better signage and more recycling containers are needed to make recycling more effective.
Many other reporting agencies also indicate that good education and clear signage is key achieving high levels of
accurate source separation.
That said, CUNY’s campuses have consistently made improvements each year to streamline their recycling
programs and improve the capture rates of materials. Part of their success can be credited to including recycling
education modules in all new student and staff orientations. Every year, CUNY campuses participate in the
national “Recyclemania” competition.
SUNY Stony Brook reports that better signage has improved the quality of their recyclables in dorm areas.
SUNY Oswego relabeled all their recycling and trash receptacles in FY 15-16, conducted recycling training for
staff and residents, and replaced non-recyclable take out containers with containers compatible with the
campus recycling program.
DEC’s Region 2 and central offices have redesigned their recycling signage to capture even more material
for recovery, and would be happy to share their model language with other agencies.
SUNY New Paltz has placed a recycling bin next to all trash bins at main building entrances on campus and
standardized aesthetics.
Campgrounds and Wilderness Areas
DEC notes that convenience packaging is increasing garbage generated at campgrounds and forest preserve
properties. The Olympic Regional Development Authority’s challenge for composting is that most venues are in
wilderness areas with a lot of public traffic. Composting can draw black bears in so it’s challenging to compost
without causing human/bear conflicts.
New and Noteworthy Initiatives in FY 15-16
Among the recycling strategies introduced in FY 15-
16, impressive actions were taken to recycle C&D
debris and compost organic material and food
scraps. Investment in public outreach and employee
engagement was also notable, as was a trend toward
the adoption of single stream recycling.
Recycling C&D Debris
MTA New York City Transit updated its capital
program management specifications in 2014 to
include a 75% C&D debris diversion goal. Since
then, more and more projects have it included in
their construction documents. At a minimum, 10%
of projects are audited to assess recycling efforts
in the field. Of the 105 construction projects that
generated C&D in FY 15-16, 32 achieved a 100%
diversion rate and 48 diverted more than 90%.
DOT performed 64.4 lane miles of cold in-place
asphalt recycling in FY 15-16, compared to zero miles of such recycling in the previous reporting year. Each
lane mile of such recycling results in approximately 2,112 tons of material recycled. The amount of cold in-place
recycling varies from year-to-year based on a variety of factors, including competing operational needs and
resource and personnel availability.
DOT performed more than 64 lane miles of cold in-place
asphalt recycling in FY 15-16, which diverted 136,013 tons
of C&D material from disposal.

Fifth Progress Report on State Green Procurement and Agency Sustainability | Fiscal Year 2015-16 18
DEC Region 3 deconstructed an 8,000 sq. ft. wooden structure and recovered 22 tons of shingles and 140 tons
of wood waste.
Composting
SUNY composting initiatives continued to expand across their campuses. SUNY Canton converted 5,000
pounds of food scraps into a nutrient rich soil amendment for use on campus landscaping.
SUNY Oswego started a food waste composting program in one dining hall diverting approximately 50 pounds
of food per day.
SUNY Oneonta partnered with the City of Oneonta to apply for, and were awarded, a $420,000 grant from
DEC’s Climate Smart Communities Grant Program to create a regional compost facility. Once the facility is
operational, all the food waste from campus will be sent there instead of to the landfill.
SUNY Morrisville produces biodiesel from waste cooking oil, recycles farm waste through an anaerobic digester
and composts.
SUNY Albany expanded food scrap composting into offices and all dining halls and earned the ranking of 10th
in the nation for per capita food scrap composting in a nationwide campaign.
Six of DEC’s nine regional offices and their central office are now composting and two regions have expanded
their composting capacity. Region 4 Schenectady began composting food scraps and created a lobby display
to educate visitors and staff.
The Roosevelt Island Operating Corp partnered with the Roosevelt Island Garden Club (a community-based
organization) to create a composting program for Island residents, which produced approximately 10 tons of
compost material.
CUNY Macaulay Honors holds a composting day every Thursday at Lincoln Square Park, where it invites the
public to join in their composting efforts.
CUNY Lehman College developed a new “NYC Compost Project” food-scrap
drop-off and composting site on campus to make it convenient for students
and city residents to bring their food scraps for composting.
Parks updated the educational composting display at Letchworth State Park.
Patrons can view examples of backyard composting systems and are given
pamphlets regarding the benefits of composting.
Miscellaneous
DEC’s Region 4 Stamford office has upgraded the buildings’ recycling bins and has created a public outreach
display in the lobby for visitors and staff about the benefits of recycling.
Ag and Markets collected returnable containers and then donated them to the Regional Food Bank as a
revenue source.
NYPA’s sustainability team conducted an in-depth evaluation of the root cause of disposable beverage
container waste as part of a Lean Six Sigma efficiency initiative. One easy to implement solution was to provide
reusable, washable coffee mugs to the café vendor in the lobby of their building.
All employees in OGS owned and managed buildings now use a two-basket recycling system at their desks.
Comingled recycling and rechargeable battery collection bins are centrally located in each building.
SUNY Albany
earned the rank of
10th in the nation
for per capita food
scrap composting.

Fifth Progress Report on State Green Procurement and Agency Sustainability | Fiscal Year 2015-16 19
Reducing Toxic Chemical Use
Agencies continued their efforts to reduce toxic chemical use in FY 15-16. Safer pest management and green
cleaning continued to be practiced by most agencies, with new efforts made to test non-toxic approaches and
phase out the use of commonly used toxins, such as bleach.
Pest Management
Most agencies continue to use Integrated Pest Management (IPM) to prevent indoor pests. IPM is a set of
practices that minimize pesticide use and focus on prevention through monitoring, good sanitation and structural
and biological controls, with least-toxic pesticide use as a last resort. OGS has been a leader on the use of IPM in
public buildings for the past 26 years.
A clear majority of agencies are now using solely mechanical, sanitary, cultural or biological means to control
pests on their lawns and grounds, as required under the EO 4 specification for “Turf and Ornamental
Management.” Currently, a number of specific types of facilities and uses are exempt from that specification,
including golf courses, land in agricultural production, and utility rights of way. The Governor’s Pollinator Task
Force Report, issued 2016, recommends that the specification be amended to require the avoidance of nursery
stock treated with insecticides (including a special class of insecticides known as neonicotinoids) and require
exempt uses to practice IPM or Integrated Vegetation Management (IVM).
Least toxic and non-toxic pest and vegetation management practices
protect public health, promote healthy ecosystems, and help to ensure
greater natural species diversity along rights-of-way. Both also help to
promote the diversity of local pollinators such as honeybees and the
endangered Karner Blue butterfly.
Findings
In FY 15-16:
71% of agencies responsible (either directly or through contractors) for indoor pest management reported using
IPM at all (57%) or a majority (14%) of their facilities. This represents an increase from the 64% of agencies
reporting that rate of use in FY 14-15, and a notable increase in facilities using IPM at all of their facilities (up 14
percentage points from 43% in FY 14-15). Only 3% do not practice IPM at any of their facilities.
58% of agencies responsible for turf and ornamental pest management reported using non-chemical means of
pest control at all (33%) or a majority (25%) of their facilities. This represents an increase from the 50% of
agencies reporting that rate of use in FY 14-15, an encouraging trend. Only 8% do not follow such practices at
any of their facilities.
This year, questions were added to the survey regarding the use of IPM and IVM on golf courses, rights-of-way
and other facilities exempted from the “Turf and Ornamental Management” specification.
48% of agencies responsible for pest management at exempted facilities reported using IPM or IVM at all
(26%) or a majority (22%) of such facilities. Only 13% did not practice IPM or IVM practices at any such facilities.
52% of agencies responsible for turf and ornamental management reported avoiding nursery stock treated with
insecticides at all (30%) or a majority (22%) of their facilities.
58% of agencies report
using non-chemical means
of pest control for turf and
ornamentals at all or a
majority of their facilities.

Fifth Progress Report on State Green Procurement and Agency Sustainability | Fiscal Year 2015-16 20
Savings and Costs
On average over the past seven years, a significant plurality of agencies (51%) reported a reduction or no change
in costs as a result of practicing IPM, IVM or non-chemical means of pest control. In contrast, a much smaller
percentage (9%) reported an increase in costs. Over one-third said they did not know.
* Fluctuations in the percentage of agencies reporting are due to changes in the ability of agencies to track savings and costs from year to
year. There is steady reporting of no change in costs compared to increases in cost.
Success Stories, Challenges and Lessons Learned
Agency reports documented widespread and enthusiastic adoption of IPM, IVM, and non-chemical means of pest
management over the past six years, with some agencies reporting the exclusive and successful use of such
approaches, including OGS, Parks, and the Battery Park Parks Conservancy. An increasingly small number of
agencies (two in FY 15-16, the lowest yet) received reports from one or more of their facilities that less toxic or
non-toxic means of pest control can be more expensive or less effective.
SUNY Stonybrook reports that efforts to reduce herbicide use have resulted in the increased use of man power
to eradicate weeds on campus, which is more expensive.
DOT has implemented a good housekeeping IVM program in which they purchase only the quantities of
herbicides required to treat the amount of vegetation to be managed, thus reducing costs and hazardous
waste. The greatest challenge has been controlling noxious and invasive plants in highway rights-of-way.
Noxious weeds often can't be controlled mechanically without presenting a significant hazard to maintenance
personnel. Many invasive species can be spread inadvertently by mowing and other mechanical control
methods. An effort to avoid mowing invasive species, and to clean mowers after use, has been put in place.
CUNY Borough of Manhattan Community College is using EPA-designated green products for landscaping
which has resulted in reduced costs for hazardous waste pickup.
Parks continues lead on the use of organic alternatives and IPM. All the golf courses in Parks’ system have
adopted a progressive model for the use of IPM on turf grass, first developed in collaboration with the New York
State IPM Program and Cornell University at the world famous Bethpage State Park golf facility in 2009. The
program has reduced the overall number of pesticide and fertilizer applications as well as the size of treated
areas, and led to the use of less toxic products with higher efficacy and lower costs. The program has resulted
in cost savings, water conservation, and improved water quality in surrounding areas.
Parks has also increased their use of goats to eliminate poison ivy and reduce mowing.
CUNY Lehman College uses cryogenic pest control equipment to manage bedbugs, which saves money and is
non-toxic.
4 2 7 8 5 6 5
47
57*
43 4346
42 43
49 11
8
17
5 11
0
10
20
30
40
50
60
FY 09-10 FY 10-11 FY 11-12 FY 12-13 FY 13-14 FY 14-15 FY 15-16
Pe
rce
nt
of
Re
sp
on
de
rs
Savings and Costs: Pest Management FY 09-10 to FY 15-16
Saving Money
No Change
Increase in Cost

Fifth Progress Report on State Green Procurement and Agency Sustainability | Fiscal Year 2015-16 21
New and Noteworthy Initiatives in FY 15-16
SUNY Canton and SUNY Potsdam planted a bee and butterfly garden on campus where they've adopted
sustainable practices and educated the community on the link between non-chemical use and pollinator protection.
The United Nations Development Corporation reports that IPM enables a proactive approach which helps
eliminate the need for toxic treatments and greatly minimizes problem areas.
The Roosevelt Island Operating Corporation uses pet friendly pesticides at its outdoor facilities and restricts the
use of certain toxic chemicals.
Green Cleaning
Healthy working and learning environments help New Yorkers thrive. The State’s Green Cleaning Program, which
is managed by OGS, was established in statute for schools and for agencies under EO 4. By adopting green
cleaning practices and purchasing state approved green cleaning products, schools and agencies across the
state have eliminated or reduced the use of toxic cleaning products.
Findings
In FY 15-16, agencies responsible for performing or contracting for cleaning services at their facilities reported that:
87% use green cleaning products that meet EO 4 specifications and can be found on OGS’s List of Approved
Products all (38%) or a majority (49%) of the time. This year, for the first time, no agencies reported that they
never use products from the list, an improvement over the three agencies reporting that way the year before.
81% use fragrance-free products and 78% use concentrated products all or a majority of the time.
76% reported the use of walk-off mats and microfiber mops and cloths to reduce the overall amount of
chemicals used.
78% reported that they reduced the number of different kinds of cleaning products used.
These responses align with those from previous years, and show continued commitment to reducing the use of
toxic products for cleaning. Several agencies reported the introduction or continuation of systems of inventory
control that allow them to purchase fewer cleaning products. Concentrated products were also used, which can
reduce the costs and carbon footprint of packaging and transportation.
3 47 8 5 6
3
34
4743 43
4642 42
1714
118
17
511
05
101520253035404550
FY 09-10 FY 10-11 FY 11-12 FY 12-13 FY 13-14 FY 14-15 FY 15-16*
Pe
rce
nt
of
Res
po
nd
ers
Savings and Costs: Green Cleaning FY 09-10 to FY 15-16
Saving Money
No Change
Increase in Cost

Fifth Progress Report on State Green Procurement and Agency Sustainability | Fiscal Year 2015-16 22
Savings and Costs
Over the past seven years, the percentage of agencies reporting a reduction or no change in costs as a result of
adopting green cleaning practices has held close to the period average of 48%. The number of agencies reporting
an increase averaged 11%. More than a third said they did not know the effect of green cleaning on their spending.
Success Stories, Challenges and
Lessons Learned
A substantial number of agencies reported on
successes in FY 15-16. Some challenges were
also reported.
The Development Authority of the North Country
reviews chemical inventories prior to chemical
purchases to determine if another substance already
in stock can be used instead, or if there are less
toxic alternatives, resulting in a steady reduction in
chemical inventories over multiple years.
Niagara Frontier Transportation Authority has
implemented a web-based material safety
management system, in which incoming materials
are pre-screened for toxic characteristics prior
to approval.
Olympic Regional Development Authority has installed concentrated green cleaning product stations in most of
their venues. These stations automatically dilute the product to ensure that there is no over-use.
SUNY Albany also employs dilution control for green cleaning products, which has reduced waste.
DASNY reported that more information on scents and toxins in cleaning products is needed, since many people
still bring in their own toxic wipes, scented oils, and sprays to work. Training would help to educate staff about
approved products and their proper use.New York State Department of Public Service noted that there has
been some difficulty in finding an effective green replacement for brass cleaner.
New and Noteworthy Initiatives in FY 15-16
DOT began an effort to encourage maintenance staff to control brush with a combination of mechanical means
and small amounts of herbicides. The objective is to pre-empt more costly tree removal work later; it is easier,
safer and less costly to remove brush than to remove trees that can be hazardous to the traveling public. They
have also been applying a “natural” herbicide to determine its effectiveness compared to conventional
herbicides. While initial results were less than satisfactory, follow up testing is scheduled for FY 16-17 to see if
equipment modifications would improve effectiveness.
Energy Efficiency
If energy-efficiency improvements have never been made in a building, or have not been made in the last couple
of years, rapidly changing technologies can offer significant opportunities to upgrade existing systems to save
energy and money. It is often possible to reduce energy use by 5-10% just by implementing simple changes,
especially when coupled with employee education that includes purchasing, maintenance and fleet staff. Simple
changes include low and no cost actions, such as adjusting temperature set points and putting procedures in
place to ensure lights are off during vacant hours. These practices must be embraced and visibly endorsed as a
priority by the highest levels of management to foster a workplace culture of sustainability. After simple changes
have been made, an energy study can help building managers identify opportunities for deeper cost-savings.
Steve Marshall, Water Quality Operator for the Development
Authority of the North Country, is one of a team of expert
employees whose inventory reviews have reduced the
number of toxic chemicals in stock by 63% since 2011.

Fifth Progress Report on State Green Procurement and Agency Sustainability | Fiscal Year 2015-16 23
Findings
In FY 15-16, agencies reported that:
A significant majority, 73%, have installed ENERGY STAR® equipment and/or appliances at all (38%) or a
majority (35%) of their facilities. Only 11% have not purchased such equipment at all.
60% used motion detectors to reduce unnecessary lighting at all (25%) or a majority (35%) of their facilities.
Only 6% did not use such sensors at all.
85% set weather-appropriate building temperature control ranges to conserve energy at all (47%) or a majority
(38%) of their facilities.
Compared to FY 14-15, the percentage of agencies reporting that they implemented these simple changes
declined 4 percentage points for the purchase of ENERGY STAR® equipment while increasing 5 percentage
points for the use of motion detectors and 10 percentage points for the setting of temperature control ranges.
Savings and Costs
On average over the past seven years, a significant number of agencies, 38%, reported a reduction in costs as a
result of their energy use reduction efforts. 19% reported no change in costs, and only 5% reported an increase in
costs. More than one third said that they did not know. This uncertainty may be due to the challenge of tracking
energy use and correlating changes in use to a specific project.
Agency experience shows that energy efficiency can have a positive impact on agency budgets, and it is
important to emphasize that the savings are realized in the agency’s operating budget – where it can be most
easily redirected to other agency priorities. However, the potential for saving money is still too often overlooked.
Challenges and Success Stories
While the data is positive, achieving efficient energy practices can be challenging. Success requires not only initial
project implementation, but re-evaluation, the consideration of new initiatives, and periodic employee education to
ensure that best practices (e.g. turning off computers at the end of the day) are imbedded in an organization’s
culture. Without all these components, backsliding may occur, and sustainability projects may not be pursued, be
halted, or be ineffective.
Agencies that have been able to bring these pieces together successfully are reaping the benefits of sustainability:
SUNY Albany reports that “We have saved significant money in our utility budget due to sustainability
initiatives – over $500,000 a year.” These savings were realized by establishing a temperature set point policy,
modifying the scheduling of air handling units to match building occupancy patterns, reducing both heating and
lighting over school breaks, and holding annual educational campaigns, initiatives that promise to reap
continued savings year-to-year.
42
34
46*
39
3135
29
17
25
1614
17
24
18
2 7 4 6 8 2 20
5
10
15
20
25
30
35
40
45
50
FY 09-10 FY 10-11 FY 11-12 FY 12-13 FY 13-14 FY 14-15 FY 15-16
Pe
rce
nt
of
Res
po
nd
ers
Savings and Costs: Energy Reduction FY 09-10 to FY 15-16
Saving Money
No Change
Increase inCost
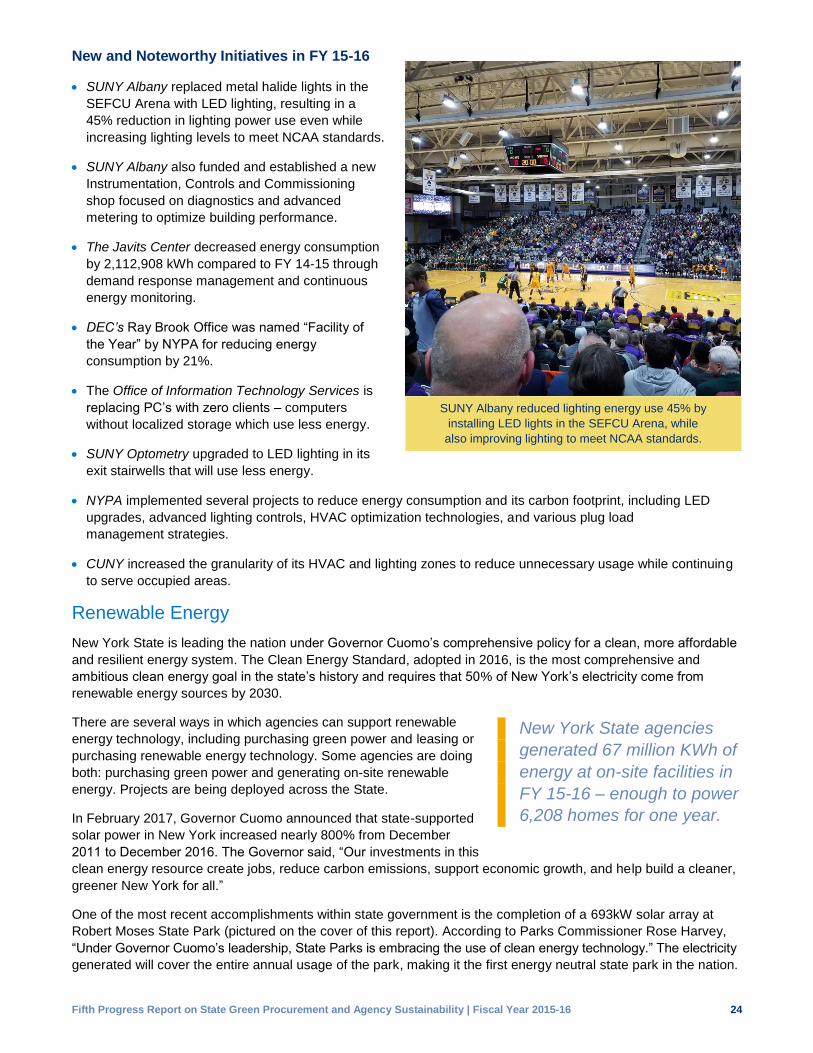
Fifth Progress Report on State Green Procurement and Agency Sustainability | Fiscal Year 2015-16 24
New and Noteworthy Initiatives in FY 15-16
SUNY Albany replaced metal halide lights in the
SEFCU Arena with LED lighting, resulting in a
45% reduction in lighting power use even while
increasing lighting levels to meet NCAA standards.
SUNY Albany also funded and established a new
Instrumentation, Controls and Commissioning
shop focused on diagnostics and advanced
metering to optimize building performance.
The Javits Center decreased energy consumption
by 2,112,908 kWh compared to FY 14-15 through
demand response management and continuous
energy monitoring.
DEC’s Ray Brook Office was named “Facility of
the Year” by NYPA for reducing energy
consumption by 21%.
The Office of Information Technology Services is
replacing PC’s with zero clients – computers
without localized storage which use less energy.
SUNY Optometry upgraded to LED lighting in its
exit stairwells that will use less energy.
NYPA implemented several projects to reduce energy consumption and its carbon footprint, including LED
upgrades, advanced lighting controls, HVAC optimization technologies, and various plug load
management strategies.
CUNY increased the granularity of its HVAC and lighting zones to reduce unnecessary usage while continuing
to serve occupied areas.
Renewable Energy
New York State is leading the nation under Governor Cuomo’s comprehensive policy for a clean, more affordable
and resilient energy system. The Clean Energy Standard, adopted in 2016, is the most comprehensive and
ambitious clean energy goal in the state’s history and requires that 50% of New York’s electricity come from
renewable energy sources by 2030.
There are several ways in which agencies can support renewable
energy technology, including purchasing green power and leasing or
purchasing renewable energy technology. Some agencies are doing
both: purchasing green power and generating on-site renewable
energy. Projects are being deployed across the State.
In February 2017, Governor Cuomo announced that state-supported
solar power in New York increased nearly 800% from December
2011 to December 2016. The Governor said, “Our investments in this
clean energy resource create jobs, reduce carbon emissions, support economic growth, and help build a cleaner,
greener New York for all.”
One of the most recent accomplishments within state government is the completion of a 693kW solar array at
Robert Moses State Park (pictured on the cover of this report). According to Parks Commissioner Rose Harvey,
“Under Governor Cuomo’s leadership, State Parks is embracing the use of clean energy technology.” The electricity
generated will cover the entire annual usage of the park, making it the first energy neutral state park in the nation.
SUNY Albany reduced lighting energy use 45% by
installing LED lights in the SEFCU Arena, while
also improving lighting to meet NCAA standards.
New York State agencies
generated 67 million KWh of
energy at on-site facilities in
FY 15-16 – enough to power
6,208 homes for one year.

Fifth Progress Report on State Green Procurement and Agency Sustainability | Fiscal Year 2015-16 25
The system, built by Parks employees, will also relieve some energy costs at Jones Beach State Park and save
$150,000 annually.
Findings
Several agencies took advantage of renewable energy opportunities in FY 15-16:
29% either purchased Renewable Energy Credits (RECs) (12%), generated on-site renewable energy (11%),
or did both (6%).
According to the U.S. Energy Information Administration, the average home uses 10,812 kWh of energy per year.
Affected entities reported generating 67,119,713 kWh of energy through on-site renewable energy generation
alone in FY 15-16 – enough to power 6,200 homes for one year.
Savings and Costs
On average over the past two reporting years, 39%
of agencies reported a reduction (19%) or no change
(21%) in costs due to their renewable energy
generation or purchasing efforts. More than a third
said that they did not know. The number of agencies
reporting an increase in costs declined 13
percentage points, from 25% to 12%.
Success Stories, Challenges and
Lessons Learned
As with energy efficiency, the upfront cost of
renewable energy projects can be a barrier to
implementation. However, with tools like power purchase agreements (PPAs), where a developer arranges for the
design, permitting, financing, and installation of a solar energy system on a customer or host site property for little
to no cost, these projects are becoming more achievable for state agencies.
OGS is currently working on a centralized contract for the installation of solar panels and equipment, including
technical assistance from the New York Power Authority, and the purchase of solar generated electricity through
a PPA between a solar developer and an agency. The contract will provide a clear path forward for agencies to
use PPAs and includes a “model” PPA that agencies can modify to meet their own project needs.
New and Noteworthy Initiatives in FY 15-16
As mentioned previously, CUNY Queens College is installing solar panels and batteries on the roof of a
campus dorm. In the event of a grid failure, the dorms will draw energy from the battery backup system.
SUNY New Paltz is constructing a 217 kW solar system at the Elting Gym and Sojourner Truth Library. The
Gym will also have a 200 kWh battery storage array providing backup power to the building, which serves as
the region’s Red Cross Shelter.
CUNY Borough of Manhattan Community College is installing 916 solar arrays which will be capable of
generating 325 kW.
The Olympic Regional Development Authority entered into a PPA for 5.3 MW of solar power at Gore Mountain
ski resort.
MTA Metro North installed five dual solar/wind parking lot lights at the Tarrytown Station that operate
independently of the electrical grid. There were no pre-existing transmission lines at the location.
The Niagara Frontier Transportation Authority added a solar installation to its Frontier Bus Garage.
25
12
20 21
25
12
0
5
10
15
20
25
30
FY 14-15 FY 15-16
Pe
rce
nt
of
Res
po
nd
ers
Savings and Costs: Renewable Energy
Saving Money
No Change
Increase in Cost

Fifth Progress Report on State Green Procurement and Agency Sustainability | Fiscal Year 2015-16 26
Sustainable Transportation
DEC organized a “Green Your Commute Day” event in which more than 800 employees walked, biked, took public
transit, carpooled, or drove an electric vehicle to work and reduced carbon emissions by 8.5 tons in just one day.
Findings
In FY 15-16, agencies reported that:
95% used webinars or videoconferencing at least some of the time to reduce employee travel, with 20% using
them all of the time.
86% use carpooling and fleet management practices at least some of the time to reduce employee vehicle
miles traveled (VMT).
Of the 43 agencies reporting VMT data in the last two fiscal years, 18, or 42%, reduced VMT between FY 14-15
and 15-16. Total VMT reported by 54 agencies in FY 15-16 was 72.96 million miles.
The average fuel efficiency of agency light duty fleets (including SUVs, trucks, vans, and sedans) was 22.53
miles per gallon (MPG), a slight increase of 0.3 since the last reporting period. In comparison, the average fuel
efficiency of light duty vehicles across the U.S. in 2016 was 25.09 MPG.
4% of the current light duty fleet is made up of Zero Emission Vehicles (ZEVs) (415 out of 9,942 vehicles), and
6% of light duty vehicles acquired in FY 15-16 were ZEVs (38 out of 603 vehicles).
A plurality of agencies promote and support policies to reduce employee commuter miles all or a majority of the
time, including carpooling (40%) and public transportation (48%).
Three agencies, NYSERDA, NYPA, and the Long Island Power Authority (5% of those reporting) have a
workplace charging program in place.
Some agencies promote and support the use of compressed pay periods (14% all or a majority of the time,
48% at least some of the time, and 52% never) and telecommuting (6% all or a majority of the time, 45% at
least some of the time, and 55% never).

Fifth Progress Report on State Green Procurement and Agency Sustainability | Fiscal Year 2015-16 27
In addition to agency level initiatives to reduce commuter miles, the State encourages the use of public
transportation by its employees through the NYS-Ride program, which lowers the cost of commuting by transit by
allowing employees to purchase public transportation fare using pre-tax dollars.
Savings and Costs
On average over the past two reporting
years, 38% of agencies reported a
reduction (16%) or no change (22%) in
costs due to their efforts to green
transportation practices. Only 7%
experienced an increase in costs. More
than half said they did not know.
Challenges and Success Stories
Multiple agencies stated that a major
obstacle to utilizing more fuel efficient
vehicles was the higher cost premium. A
few agencies stated that the lack of public
transportation options in rural areas made
it difficult for them to promote the use of it by employees. In addition, some work schedules do not align with
public transit options, or with the vagaries in timing in public transit options.
In order to address the cost premium of fuel efficient vehicles, DEC and OGS have begun leading aggregate
purchases of plug-in hybrid electric vehicles for State agencies, authorities, and local governments through the
New York State Vehicle Marketplace. Aggregate purchasing has the potential to significantly lower costs and
increase the number of zero emission vehicles (ZEVs) in the State’s fleet.
New and Noteworthy Initiatives in FY 2015-16
EFC lowered their VMT by nearly 20%, bringing their two year decline in VMT to 36%.
MTA installed electric vehicle charging stations at 4 of their metro-north train stations for public use. This
included the Cortlandt, Beacon, and Southeast stations, as well as at the North White Plains Parking Garage.
Thruway installed direct current fast electric vehicle charging stations at four of their travel plazas between New
York City and Albany. These stations charge EVs at 50 kW, fast enough to provide many vehicles with a full
charge in less than an hour, making them practical for long-distance EV transportation.
SUNY Oneonta installed a dual port electric vehicle charger on campus for staff, students, and visitors.
Buffalo Fiscal Stability Authority reimburses employees who take public transportation up to a prescribed
amount. Not only does this incentivize employees to take transit, it also saves the authority money.
The Niagara Frontier Transportation Authority installed a cell-phone waiting area where drivers can wait in their
cars to pick up passengers. This lowers emissions by eliminating the need for drivers to continually drive
around the terminal while waiting to pick someone up.
DEC organized a “Green Your Commute Day” event in which
more than 800 employees from across the State walked, biked,
took public transit, carpooled or drove an electric vehicle to work
and reduced carbon emissions by 8.5 tons. Planning is
underway for an even larger interagency led event in 2017.
SUNY Cortland instituted Zip Car on their campus, which netted the campus an annual revenue of $3,000 while
reducing the number of vehicles on campus by an average of 15 vehicles per Zip Car.
23
16
27
22
57
0
5
10
15
20
25
30
FY 14-15 FY 15-16
Pe
rce
nt
of
Re
sp
on
de
rs
Savings and Costs: Sustainable Transportation
FY 14-15 to FY 15-16
Saving Money
No Change
Increase inCost
EFC lowered employee vehicle
miles traveled by 36% over the
past two reporting years.

Fifth Progress Report on State Green Procurement and Agency Sustainability | Fiscal Year 2015-16 28
Conserving Water and Other Natural Resources
According to the U.S. Drought Monitor, 2015 began with almost 30% of the continental United States
experiencing moderate to exceptional drought. Although it is natural for normal fluctuations in weather patterns to
cause periods of drought, some scientists believe that a warming climate may result in more severe drought
events in the future. Fortunately, New York State is rich in freshwater – in fact, it is home to the largest unfiltered
water supply in the country. These resources can be preserved and protected for future generations through
conservation, efficient use, and reuse, measures that will increase in importance as drought conditions accelerate.
A range of measures, including high efficiency plumbing fixtures, the reclamation and reuse of grey water, and the
collection of rainwater for landscaping and washing vehicles, can help to ensure that residents have perpetual
access to freshwater, our most precious natural resource.
Indoor Water Conservation and Reuse
Findings
Many agencies are already implementing indoor water conservation measures. In FY 15-16, agencies reported that:
68% use high efficiency plumbing fixtures in at least some or all of their facilities.
22% use greywater collection in at least some of their facilities.
Savings and Costs
On average over the past seven years, a significant plurality of agencies (52%) reported a reduction (16%) or no
change (36%) in costs as a result of implementing indoor water conservation measures. In contrast, a much
smaller number (4%) reported an increase in costs. Over a third said they did not know.
NYPA switched to low flow water fixtures and aerators at their White Plains office which led to reduced consumption
of municipal water and reduced energy consumption from heating the water, yielding sizeable cost savings.
Success Stories, Challenges and Lessons Learned
Becoming more sustainable is always going to mean changes for an agency, and change can be a challenge.
Although water conservation can result in long term savings, reduced consumption, and more efficient operations,
the upfront cost of upgrading infrastructure can be a barrier.
A number of other agencies have overcome this obstacle by taking advantage of the opportunity afforded by new
construction or planned renovations. For example, MTA built an impressive greywater bus washing system into
the newly constructed Mother Clara Hale Bus Depot, which won a New York State Environmental Excellence
Award in 2016 as the first LEED certified bus depot in the country. Parks is replacing low efficiency plumbing
fixtures with high efficiency fixtures as renovations occur or fixtures require replacement. The United Nations
611
23
31
20
1012
45 44
32
22
3234
42
4 6 4 2 7 0 40
5
10
15
20
25
30
35
40
45
50
FY 09-10 FY 10-11 FY 11-12 FY 12-13 FY 13-14 FY 14-15 FY 15-16
Pe
rce
nt
of
Res
po
nd
ers
Savings and Costs: Indoor Water ConservationFY 09-10 to FY 15-16
Saving Money
No Change
Increase in Cost

Fifth Progress Report on State Green Procurement and Agency Sustainability | Fiscal Year 2015-16 29
Development Corporation reused high efficiency plumbing fixtures being replaced as part of a restroom
renovation in one building to replace broken, less efficient fixtures at a different building.
Agencies that do not own the buildings they occupy report that implementing water conservation can be a
challenge due to the nature of lease agreements and landlord restrictions. For example, the Long Island Power
Authority is located in a large commercial building and has found it challenging to incorporate water conservation
into the services provided by the landlord.
Measuring success can also be a challenge. At the Javits Center, the nature of hosted events changes annually
and some events require more water use than others. Changing variables like this can make it difficult for
agencies to accurately compare water use data from year to year.
Sharing challenges and successes among agencies can inspire new ideas, promote partnerships, and embolden
agency advocates to address inefficiencies. Although every agency is different, sharing success stories can
spur innovation.
New and Noteworthy Initiatives in FY 15-16
CUNY as a whole continues to be a role model with their commitments to reducing water consumption. Most
schools are installing or have installed touchless faucets. Lehman College campus buildings now use meters to
measure water use. Borough of Manhattan Community College uses grey water from the HVAC system in the
cooling tower at Fiterman Hall. The College of Staten Island is storing greywater in underground tanks for use
in the campus sprinkler system and Brooklyn College is building a new blue roof on the science building.
The Capital District Transportation Authority
refitted their bus washing facility to reclaim grey
water for reuse.
The Development Authority of the North Country’s
Water Quality division has begun to utilize
rainwater collection to wash vehicles (their
materials management facility has practiced this
for several years).
SUNY Oswego upgraded their plumbing fixtures to
high efficiency units in a 200 bed residence hall for
a 30% reduction in water use. SUNY Albany has
installed water submeters, which allows for the
tracking of water use at individual facilities.
The Department of Taxation and Finance is
encouraging their landlords to implement cost saving water consumption fixtures through their leases.
The United Nations Development Corporation has installed a passive grading system that collects runoff for
landscaping and an irrigation system that uses sensors to prevent wasted water.
Westchester Medical Center is initiating rainwater reuse to regenerate pond-less landscape water features
(waterfalls, fountains, etc.).
Green Infrastructure and Sustainable Storm Water Management
Green infrastructure applications, whether scaled small or large, reduce the negative impacts of storm water
runoff, water pollution, sewer overflows and flooding. Green infrastructure practices can be more economically
viable as compared to building or expanding traditional storm water and sewage treatment systems. They can
also yield numerous additional benefits including aesthetic improvements, recreational enhancements, wildlife
habitat resources, cleaner air, energy savings, urban cooling, and climate change mitigation.
Green infrastructure solutions can be applied on different scales. New York State’s Forest Preserve, parks, and
other State-owned lands include large, natural tracts of forests, floodplains, and wetlands. These naturally
The Capital District Transportation Authority
reuses grey water to wash buses.

Fifth Progress Report on State Green Procurement and Agency Sustainability | Fiscal Year 2015-16 30
occurring ecosystems are critical to providing the benefits of green infrastructure. Other structures, such as street
trees and rainwater collection systems have been installed in smaller or more urban settings.
Sustainable storm water management, an important subset of green infrastructure, uses both the natural
environment and engineered systems to help manage storm water in a way that conserves, protects, and
sometimes enhances ecosystem values and functions. Practices include rain gardens, green roofs, vegetated
swales, bio retention areas, rain barrels, and permeable pavement. Many examples of large or small green
infrastructure and sustainable storm water management projects can be found on a variety of state properties.
Findings
In FY 15-16, agencies responsible for landscaping at their facilities reported that:
38% are using large-scale green infrastructure practices (such as forests, riparian buffers, floodplains, and
wetlands) on at least some of their facilities.
59% are implementing smaller-scale green infrastructure practices (such as rain gardens, urban trees, green
roofs, and green walls) on at least some of their facilities.
55% are using practices that minimize the use of potable
water and help manage stormwater by harvesting and
reusing rainwater (e.g. rain barrels, cisterns, vehicle
washing, fountains etc.) on at least some of their facilities.
Success Stories, Challenges and Lessons Learned
Agencies reported encountering some challenges, primarily
related to monitoring and maintenance. Agencies in leased
spaces often encounter landlord challenges when the lease
language for the property does not cover these practices.
MTA found that monitoring storm water retention systems
has been challenging; however, experience is being
gained with monitoring and building management systems.
SUNY Cortland has implemented storm water
management runoff programs with success. However,
additional time and material charges have been incurred in
order to keep the systems running smoothly.
SUNY Stony Brook continues to be a “Groundwater
Guardian Green Site” designated by the Groundwater
Foundation, for their outstanding groundwater stewardship.
New and Noteworthy Initiatives in FY 15-16
CUNY Lehman College is metering water use at certain campus buildings. One academic building has more
than 11,000 sq. ft. of green roof spaces that filter rainwater and increase energy efficiency.
CUNY Borough of Manhattan Community College has installed trees to serve as a wind break from the Hudson
River. The tree pits are filled with Cornell structural soil to absorb excess storm water.
SUNY Empire State College constructed a new building which contains a large bioretention area which slows
the flow of almost 100% of the storm water coming from impervious surfaces on campus.
SUNY Cortland installed a storm water retention area under a newly built, 50 space parking lot.
CUNY Borough of Manhattan Community
College installed street trees that serve as a
windbreak and absorb excess storm water.

Fifth Progress Report on State Green Procurement and Agency Sustainability | Fiscal Year 2015-16 31
Sustainable Landscaping
Sustainable landscaping practices are regenerative and responsive to local ecological conditions. They actively
contribute to the development of healthy communities by restoring diverse habitats, promoting diversity and the
growth of native species, contributing to clean water and air, using less energy inputs, sequestering carbon, and
decreasing the need for irrigation and added soil nutrients. They create value through significant economic, social,
and environmental benefits which are cost-efficient over the long term.
Varying soil conditions, precipitation, plant habitats, and micro-climates should be taken into account when
planning a sustainable landscape. Plant, soil amendment, pest management, and water use choices should be
made with the goals of conservation, reducing chemical use and preventing erosion in mind. Planting invasive
species should be avoided and native plants should be given priority. The field of sustainable landscaping
continues to evolve in response to changing climate conditions.
Findings
In FY 15-16, agencies responsible for landscaping at their facilities reported that:
55% use practices that preserve or enhance soil (e.g. planning windbreaks or using compost created on site)
on at least some of their facilities, and 14% are using such practices at all of their facilities.
61% use practices that preserve or maximize the use of native vegetation to support pollinators and reduce
water, energy and toxic chemical use on at least some of their facilities. Such practices include low- or no-mow
policies, or the planting of xeric, native, or pollinator-friendly plants.
Success Stories, Challenges and Lessons Learned
DEC Region 5 Warrensburg and Ray Brook tried
sustainable landscaping in the past but encountered
concerns with aesthetics which ultimately resulted
in the practices being discontinued.
The Niagara Frontier Transportation Authority has
challenges with sustainable landscaping at airport
locations due to safety concerns. Landscaping
near runways must be properly groomed to
discourage wildlife habitat nesting areas.
SUNY Albany implemented a recent project for a
new turf field which was designed improperly,
despite incorporating sustainable landscape
practices into the request for proposals from bidders.
New and Noteworthy Initiatives in FY 15-16
Parks installed large scale native plantings and
pollinator gardens. They have mitigated stream bank erosion by performing stream bank stabilization and
marsh restoration.
SUNY Canton is using compost as a soil amendment to reduce chemical fertilizer applied to gardens. Native
plants and pollinator plants have been established, and no-mow zones have been increased.
SUNY Stony Brook discourages the use of fertilizers and prefers to use organic solutions when planting on
campus and in the greenhouse.
SUNY Oneonta received a $910,000 EFC grant to develop green infrastructure on campus.
The Capital District Transportation Authority now installs low maintenance, native plants on its properties.
The use of native plants, well-suited to site
conditions, is a beautiful way to sustainably manage
storm water runoff and support pollinators.
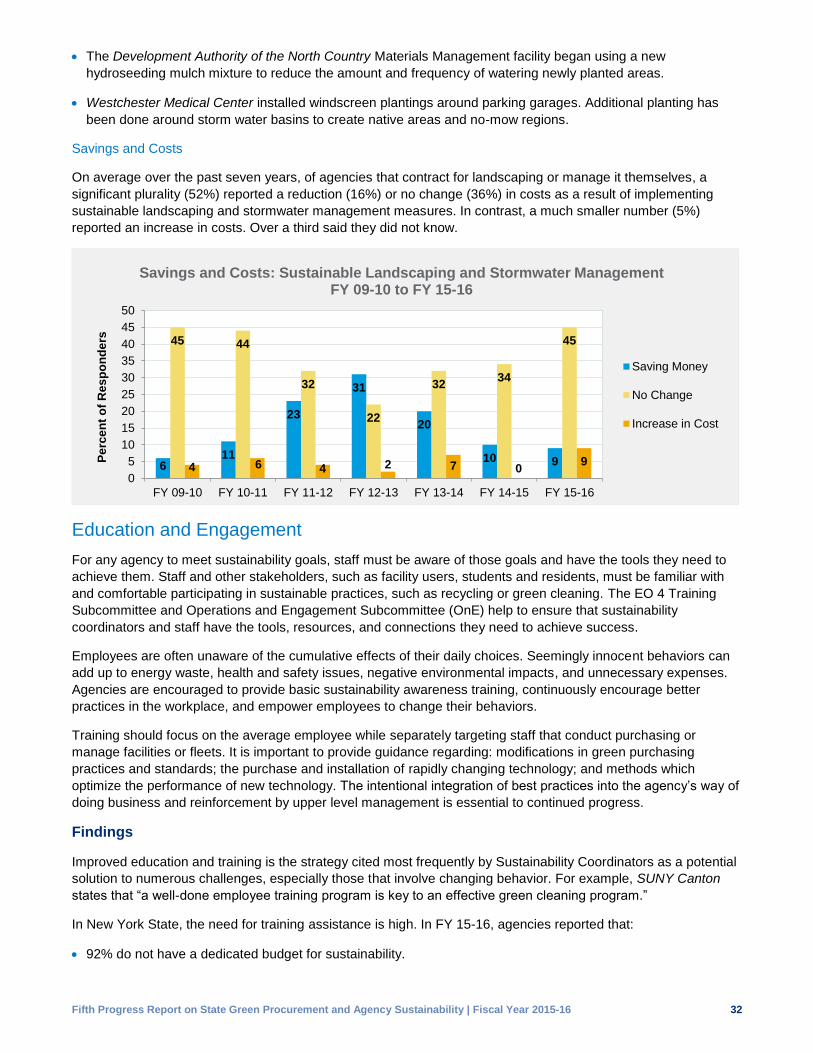
Fifth Progress Report on State Green Procurement and Agency Sustainability | Fiscal Year 2015-16 32
The Development Authority of the North Country Materials Management facility began using a new
hydroseeding mulch mixture to reduce the amount and frequency of watering newly planted areas.
Westchester Medical Center installed windscreen plantings around parking garages. Additional planting has
been done around storm water basins to create native areas and no-mow regions.
Savings and Costs
On average over the past seven years, of agencies that contract for landscaping or manage it themselves, a
significant plurality (52%) reported a reduction (16%) or no change (36%) in costs as a result of implementing
sustainable landscaping and stormwater management measures. In contrast, a much smaller number (5%)
reported an increase in costs. Over a third said they did not know.
Education and Engagement
For any agency to meet sustainability goals, staff must be aware of those goals and have the tools they need to
achieve them. Staff and other stakeholders, such as facility users, students and residents, must be familiar with
and comfortable participating in sustainable practices, such as recycling or green cleaning. The EO 4 Training
Subcommittee and Operations and Engagement Subcommittee (OnE) help to ensure that sustainability
coordinators and staff have the tools, resources, and connections they need to achieve success.
Employees are often unaware of the cumulative effects of their daily choices. Seemingly innocent behaviors can
add up to energy waste, health and safety issues, negative environmental impacts, and unnecessary expenses.
Agencies are encouraged to provide basic sustainability awareness training, continuously encourage better
practices in the workplace, and empower employees to change their behaviors.
Training should focus on the average employee while separately targeting staff that conduct purchasing or
manage facilities or fleets. It is important to provide guidance regarding: modifications in green purchasing
practices and standards; the purchase and installation of rapidly changing technology; and methods which
optimize the performance of new technology. The intentional integration of best practices into the agency’s way of
doing business and reinforcement by upper level management is essential to continued progress.
Findings
Improved education and training is the strategy cited most frequently by Sustainability Coordinators as a potential
solution to numerous challenges, especially those that involve changing behavior. For example, SUNY Canton
states that “a well-done employee training program is key to an effective green cleaning program.”
In New York State, the need for training assistance is high. In FY 15-16, agencies reported that:
92% do not have a dedicated budget for sustainability.
611
23
31
20
10 9
45 44
32
22
3234
45
4 6 4 2 7 09
0
5
10
15
20
25
30
35
40
45
50
FY 09-10 FY 10-11 FY 11-12 FY 12-13 FY 13-14 FY 14-15 FY 15-16
Pe
rce
nt
of
Res
po
nd
ers
Savings and Costs: Sustainable Landscaping and Stormwater Management FY 09-10 to FY 15-16
Saving Money
No Change
Increase in Cost

Fifth Progress Report on State Green Procurement and Agency Sustainability | Fiscal Year 2015-16 33
74% do not have a sustainability team charged with helping to implement sustainability policies or projects.
47% are taking advantage of the training offered by the EO 4 Training Subcommittee.
44% are providing their own training to staff about sustainability.
Most agencies share sustainability information with staff through simple, low- or no-cost ways that rely on existing
resources, such as posting information on internal websites, convening workgroups or green teams, emailing a
Green Bulletin to all staff, and holding events on Earth Day, America Recycles Day, or Green Your Commute
Day. For agencies in leased facilities, tenant newsletters may be passed along to staff with notices about
recycling updates and green cleaning. The goal of these activities is not just to educate; they also shine a light on
best practices and achievements that help us learn about and build on each other’s work.
For example, last year, two agencies, the Javits Center and Parks, were awarded a New York State
Environmental Excellence award by Governor Cuomo. This year, the Committee sent information out to all
Sustainability Coordinators, encouraging them to assess their projects for submission for the award. Participation
in the program not only benefits the honorees, it helps promote sustainability to wider audience.
Success Stories, Challenges and
Lessons Learned
Generally speaking, if a sustainable action is
embedded in an automatic system (for example, the
powering down of all computers at 6 p.m.),
implementation is easy. Where an activity requires
staff or patron participation, there will be a continous
need for messaging, training, and the restating of
goals over time.
Training topics suggested by agencies in FY 15-16
include green cleaning, surplus value, and green
procurement. This year, several fact sheets were
created and posted on the OGS website and
distributed to sustainability coordinators. These fact
sheets include an Introduction to Green Purchasing,
Green Products Available on Contract, Plug-in
Electric Vehicles, and a case study on DASNYs Green Building effort. OGS and the Training Subcommittee jointly
hosted a widely attended webinar on how to use OGS’s Centralized Contracts. It further explained how to
purchase environmentally friendly products and described potential benefits of the purchases.
Parks’ success with implementing sustainable practices at their golf facilities is primarily due to a robust
educational program. The introduction of Integrated Pest Management (IPM) at the Bethpage State Park golf
facility, carried out in conjunction with the New York State IPM Program and Cornell University, was approached
in stages to learn best practices and to educate the players about changes to the courses’ appearance. Player
education was critical to the success of the project, especially because there was often a period of time when the
course would not look as aesthetically pleasing as it had looked in the past. Without public awareness of the
course’s efforts to employ environmentally friendly practices, players may have thought the staff had become
inattentive to maintenance.
In addition, maintenance staff had to be intentional in not resorting to harmful chemicals during the transition
period. Although there was an initial investment to move to IPM, in both training and costs, Parks was able to
develop a golf turf management program that is less reliant on chemical pesticides and reduces chemical
exposures. Annual satisfaction surveys have shown that golfers do not perceive a difference in quality of the IPM
managed putting greens.
By continuously promoting the changes with both workers and players, and using IPM as a regular protocol,
Parks has achieved long-lasting success. IPM is now used at all golf courses in the State park system, including
the world renowned Black Course at Bethpage State Park, which has twice been host to the U.S. Open.
Staff from the GreenNY program met with purchasing agents
and vendors at the New York State Purchasing Forum in
2016. The display features success stories in many of the
diverse areas of sustainable activity pursued by agencies.

Fifth Progress Report on State Green Procurement and Agency Sustainability | Fiscal Year 2015-16 34
New and Noteworthy Initiatives in FY 15-16
The Niagara Frontier Transportation Authority offers environmental training to its employees on an annual basis
which focuses on reducing potential environmental impacts from the various activities the authority carries out
day to day, including waste reduction.
DOT has an extensive program to train new and existing Certified
Commercial Pesticide Applicators and Technicians. The training
program is key to reducing the use of toxic chemicals because it
teaches new staff, and updates existing staff, on how to use
pesticides in a manner that obtains the highest level of control with
the least amount of pesticides possible – for their benefit and the
benefit of others.
Parks offers Solar Installation, Energy Auditor, Green Professional
(GPRO), and various energy efficiency and sustainability trainings to its staff.
MTA is increasing awareness about the benefits of sustainability by developing and distributing Sustainability
Guidelines to all Capital Project Managers to encourage them to incorporate sustainable practices into
their projects.
New York State Bridge Authority has developed guidance memos about sustainability which have been
circulated to staff on such topics as single stream recycling, source paper reduction, re-use of office products,
green procurement and recycled content.
Training programs help to
change culture and attitudes
toward green practices, and
to increase awareness of
green tools and methods.

Fifth Progress Report on State Green Procurement and Agency Sustainability | Fiscal Year 2015-16 35
Buying Green
New York State is a national leader in green purchasing. Also known as environmentally preferable purchasing
(EPP), it involves the selection of goods and services that positively impact or have less harmful impacts on public
health and the environment compared to traditional products. Buying green products supports all of EO 4’s
environmental priorities regarding waste, toxics, energy, water, and natural resources.
Through the volume of its procurement, government can harness the energy of the market to produce products
that perform better and cost less. As supply increases, prices should decrease, and high-performance green
products and services will become more affordable for all consumers.
In general, the Interagency Committee anticipates that green products
for which specifications are approved under EO 4 will be competitively
priced compared to their conventional counterparts. Many green
products, such as traffic safety equipment made from recycled plastic,
glass beads in reflective paint made from recycled glass, and
remanufactured toner cartridges, are consistently less expensive than
conventional products. Many others, including 100% recycled content
janitorial paper, green computers, green cleaning products, and soy-
based ink, are consistently comparable in price to conventional products.
Fuel-efficient vehicles and appliances may be more expensive up front
but result in lower life cycle costs over time due to energy savings.
Green products also generally perform well compared to conventional products. After seven years of experience
under EO 4, only a handful of agencies (three in FY 15-16) reported that green cleaning products were not as
effective as conventional cleaners, while 87% of agencies reported using green cleaners all or a majority of the
time. This result corresponds to the State Education Department’s 2010 survey of schools, which found that green
cleaning products “cost the same or less,” work as effectively, and last longer (because they are concentrated and
have more accurate dispensing systems) than their traditional counterparts.
The price of some green products, such as various types of recycled content copy paper or re-refined oil, while
generally competitive, may still be higher than conventional products in response to fluctuations in market
demand or regional supply. Under current OGS statewide contracts for “truckload” and “less than truckload” lots
of recycled copy paper, the price of 100% post-consumer recycled content paper is very competitive, with bulk
purchases having the lowest pricing. For copy paper sold in quantities of “less than truckload” lots, pricing for
100% post-consumer recycled content paper is only slightly higher than the price for 30% post-consumer recycled
content paper. The OGS “miscellaneous office supplies” statewide contract gives agencies a very wide range of
choices of brands, amount of recycled content and paper type, and vendor catalogs make it easy to compare prices
and product specifications. Agencies willing to shop around should have no difficulty finding cost-effective recycled
content paper.
In the case of re-refined oil, a clear majority (81%) of State contracts for such oil are awarded on low bid, while 19%
(due to regional differences in price) are awarded within the State’s 10% price preference for recycled content
products. New York was the first state to buy re-refined motor oil in 1990, and helped build the market. The oil
consistently meets all performance standards, with few reported problems over 25 years. In 1990, Safety Kleen
re-refined approximately 30 million gallons of oil in Canada. It now returns more than 200 million gallons to the
marketplace each year.
Green products generally
perform well and are
competitively priced
compared to their
conventional counterparts.
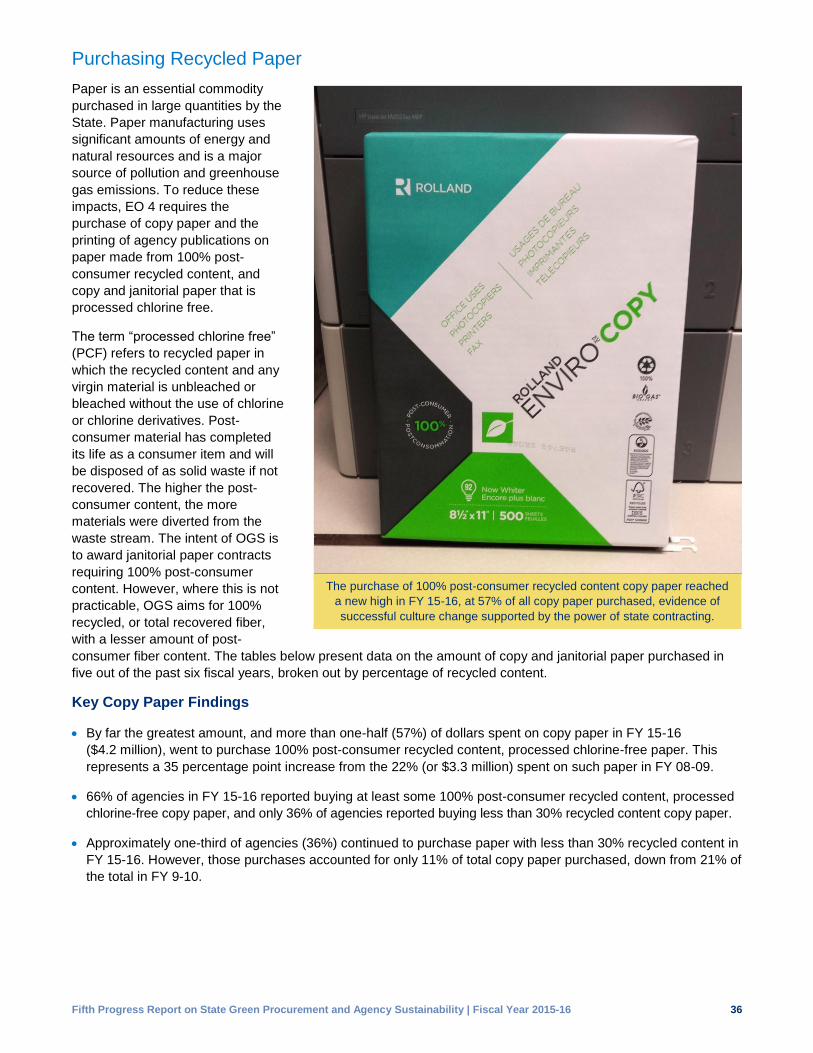
Fifth Progress Report on State Green Procurement and Agency Sustainability | Fiscal Year 2015-16 36
Purchasing Recycled Paper
Paper is an essential commodity
purchased in large quantities by the
State. Paper manufacturing uses
significant amounts of energy and
natural resources and is a major
source of pollution and greenhouse
gas emissions. To reduce these
impacts, EO 4 requires the
purchase of copy paper and the
printing of agency publications on
paper made from 100% post-
consumer recycled content, and
copy and janitorial paper that is
processed chlorine free.
The term “processed chlorine free”
(PCF) refers to recycled paper in
which the recycled content and any
virgin material is unbleached or
bleached without the use of chlorine
or chlorine derivatives. Post-
consumer material has completed
its life as a consumer item and will
be disposed of as solid waste if not
recovered. The higher the post-
consumer content, the more
materials were diverted from the
waste stream. The intent of OGS is
to award janitorial paper contracts
requiring 100% post-consumer
content. However, where this is not
practicable, OGS aims for 100%
recycled, or total recovered fiber,
with a lesser amount of post-
consumer fiber content. The tables below present data on the amount of copy and janitorial paper purchased in
five out of the past six fiscal years, broken out by percentage of recycled content.
Key Copy Paper Findings
By far the greatest amount, and more than one-half (57%) of dollars spent on copy paper in FY 15-16
($4.2 million), went to purchase 100% post-consumer recycled content, processed chlorine-free paper. This
represents a 35 percentage point increase from the 22% (or $3.3 million) spent on such paper in FY 08-09.
66% of agencies in FY 15-16 reported buying at least some 100% post-consumer recycled content, processed
chlorine-free copy paper, and only 36% of agencies reported buying less than 30% recycled content copy paper.
Approximately one-third of agencies (36%) continued to purchase paper with less than 30% recycled content in
FY 15-16. However, those purchases accounted for only 11% of total copy paper purchased, down from 21% of
the total in FY 9-10.
The purchase of 100% post-consumer recycled content copy paper reached
a new high in FY 15-16, at 57% of all copy paper purchased, evidence of
successful culture change supported by the power of state contracting.

Fifth Progress Report on State Green Procurement and Agency Sustainability | Fiscal Year 2015-16 37
Copy Paper Purchases by Amount of Recycled Content
Agencies Reporting Purchases FY
% of Agencies Reporting Purchases
Total Boxes Purchased
Total Dollars Spent
Average Price per
box % of
Expenditures
100% Recycled Chlorine-free
54 09-10 77% 159,857 $6,320,148 $39.5 49%
36 12-13 75% 111,289 $3,558,738 $32 52%
30 13-14 65% 99,945 $2,948,224 $29 43%
36 14-15 64% 140,792 $4,354,301 $31 55%
40 15-16 66% 123,821 $4,202,536 $34 57%
30%-99% Recycled
43 09-10 61% 110,028 $3,803,229 $34.5 30%
26 12-13 54% 84,783 $2,579,189 $30 38%
30 13-14 65% 77,577 $2,382,439 $31 40%
32 14-15 57% 83,527 $2,739,832 $33 35%
39 15-16 64% 78,438 $2,402,276 $31 32%
<30% Recycled
21 09-10 30% 81,407 $2,665,794 $33 21%
18 12-13 37% 18,091 $690,368 $38 10%
15 13-14 33% 40,290 $1,482,989 $37 22%
16 14-15 29% 24,233 $795,008 $33 10%
22 15-16 36% 21,277 $833,689 $39 11%
Total Agencies Reporting Purchases
70 09-10
N/A
351,292 $12,789,171
N/A
100%
48 12-13 214,163 $6,828,295 100%
46 13-14 217,812 $6,813,652 100%
56 14-15 248,552 $7,889,141 100%
61 15-16 223,536 $7,438,501 100%
In an important development, an analysis of paper purchasing data revealed that 100% post-consumer recycled
content copy paper is not more expensive than copy paper with little to no post-consumer recycled content. On
the contrary, on average over the past four fiscal years, 100% post-consumer recycled content copy cost, at
$31.50 per box, virtually the same as 30-99% post-consumer recycled content copy paper, at $31.25 per box, and
was significantly less expensive than copy paper with less than 30% post-consumer recycled content, at $36.75
per box.
Key Janitorial Paper Findings
61% of dollars spent on janitorial paper in FY 15-16 (or $4.3 million) went to purchase 100% recycled content,
processed chlorine-free paper. This amount represents a 27 percentage point increase from the 34% (or
$1.2 million) spent on such paper in FY 2008-09.
Only nine agencies continued to purchase unrecycled janitorial paper in FY 15-16. Such purchases accounted
for only 12% of all janitorial paper purchases.
Due to the difficulties associated with measuring janitorial paper purchases, the number of agencies reporting
such purchases, of any kind, is consistently lower than that reporting for copy paper.

Fifth Progress Report on State Green Procurement and Agency Sustainability | Fiscal Year 2015-16 38
Agencies Reporting Purchases FY
Percent of Agencies Reporting Purchases
Total Cases of Janitorial Paper
Purchased
Total Dollars Spent on
Janitorial Paper
Percent of Expenditures by
Recycled Content
100% Recycled Chlorine-free
28 09-10 88% 236,139 $7,138,622 75%
18 12-13 45% 188,046 $3,728,247 57%
15 13-14 50% 178,652 $3,433,252 64%
20 14-15 51% 183,775 $3,622,217 63%
23 15-16 72% 138,048 $4,253,639 61%
1%-99% Recycled
22 09-10 69% 71,029 $1,699,169 18%
13 12-13 33% 66,556 $1,893,061 29%
10 13-14 33% 33,088 $1,167,095 22%
16 14-15 41% 45,275 $1,394,914 24%
24 15-16 75% 85,395 $1,909,007 27%
Unrecycled Janitorial Paper
9 09-10 28% 90,982 $727,420 8%
4 12-13 10% 28,553 $905,181 14%
6 13-14 20% 31,541 $752,227 14%
5 14-15 13% 28,719 $781,307 13%
9 15-16 28% 33,188 $814,128 12%
Total Agencies Reporting Purchases
32 09-10
N/A
398,150 $9,565,211 100%
40 12-13 283,155 $6,526,489 100%
30 13-14 243,281 $5,352,574 100%
39 14-15 257,769 $5,798,438 100%
32 15-16 256,631 $6,976,774 100%
Other Paper Purchases
The EO 4 report form contained an open-ended item requesting information on other types of papers purchased,
including quantities and dollar amounts. 36 entities reported purchasing other types of paper in FY 15-16.
Agencies reported purchasing colored paper, card stock, plotter paper, graph paper, bond paper, map paper,
steno pads, and rolls of engineering paper. Several agencies reported dollar amounts for these purchases, while
some did not have detailed information available.
Green Specifications and Centralized Procurements
Green Specifications
In April 2016, four green specifications were approved by the Interagency Committee for a total of 43
specifications currently approved for use in state procurement. The approved specifications include: Model
Packaging; Printing (amended); Sustainable Landscaping; and Wheel Weights. As a result of the approval of
Model Packaging language, there are now five broad categories for the specifications—Electronics/Appliances,
Transportation, Office and Building Operations, Food Service, and Model Packaging Language that cover a total
of 84 different commodity, service, or technology products. For example, the Desktop and Laptop Computer
specification covers three types of devices: desktop, notebook (including laptops) and tablets. A summary of the
new specifications is provided below on page 42, and a complete list of approved specifications is available on the
New York State OGS website.

Fifth Progress Report on State Green Procurement and Agency Sustainability | Fiscal Year 2015-16 39
In addition, nine green specifications were tentatively approved by the
Interagency Committee which, after a public comment period, were approved
on April 28, 2017.
Disinfectants and Sanitizers
Floor Finishes and Finish Removers
Furniture
General Purpose Cleaners
Hand Cleaners, Hand Soaps, Hand
Sanitizers and Personal Care Products
Lighting
Monochrome Printer Cartridges
State Funded Food
State Funded Travel
Centralized Green Procurements
The New York State OGS Procurement Services is the state’s centralized procurement office, establishing and
managing nearly 1,500 contracts for commodities, services, and technology, including many contracts containing
environmentally friendly products and services. Procurement Services is dedicated to helping customers meet
their green procurement goals by providing environmentally preferable purchasing contracts which are driven by
four major directives:
The New York State Green Cleaning Law (Chapter 584 of the Laws of 2005; State Education Law § 409-i)
Executive Order No. 4 (Green Procurement and Agency Sustainability)
Executive Order No. 18 (Eliminate State Purchases of Bottled Water)
Executive Order No. 142 (Directing State Agencies and Authorities to Diversity Transportation Fuel and Heating
Oil Supplied Through the use of Bio-Fuels in State Vehicles and Buildings)
Examples of environmentally preferable procurements either issued or developed by Procurement Services in
FY15-16 include the following:
Microcomputer and Related Systems
Users of the OGS centralized contracts for microcomputers continue to realize both savings and environmental
benefits by purchasing computers that meet EPEAT requirements through the Aggregate Buy Program conducted by
Procurement Services. During the 2015-2016 fiscal year, Procurement Services completed the 2014-2015 aggregate
buy (which ended in December of 2015), and in 2016 issued a new aggregate buy. Since 2008, the year that
OGS began including EPEAT requirements in the buy program, an impressive number of EPEAT registered
electronic devices have been purchased as shown in the following table. For the period between April of 2015 and
December of 2015, approximately $49.2 million was spent on the purchase of EPEAT registered computers
through the 2014-15 aggregate buy program. The overall buy for 2014-15 was $109.3 million, as shown below.
Number of EPEAT Registered Computers Purchased through the NYS Aggregate Buy Program
Aggregate Buy Program EPEAT Silver EPEAT Gold Spend*
(millions of $) Savings**
(millions of $)
April 2008 through March 2009 418,915 $154.9 $130.9
April 2009 through June 2010 47,369 405,964 $188.3 $143.8
June 2010 through January 2012 7,606 194,530 $127.8 $130.9
February 2012 through January 2014 569,106 $199.8 $188.4
April 2014 through December 2015 235,156 $109.3 ***
Totals 473,890 1,404,756 $580.3 $594.1
Notes: *Spend represents the total amount spent by users of the aggregate buy program. **Savings represents the difference between the price of
the computers purchased through the aggregate buy compared to the prices on the state contract. ***Data unavailable at the time of publication.
Users of the green
computer aggregate
buy program saved
$594.1 million
between April 2008
and December 2015,
while spending a
total of $580.1 million
in the same period.

Fifth Progress Report on State Green Procurement and Agency Sustainability | Fiscal Year 2015-16 40
Recycling and Trash Removal Services
In December of 2016, OGS Procurement Services awarded a procurement for Recycling and Trash Removal
Services, which offers contract users a centralized contracting vehicle for meeting the recycling and composting
requirements contained in the EO 4 specification for Solid Waste Recycling and Management Services. The
procurement includes eleven lots for the recycling of materials including single stream materials, comingled
materials, metal food containers, glass, plastics, cardboard, mixed paper, white office paper, shredded paper,
scrap metal, and construction & demolition materials, and also two lots for composting—one for green waste and
one for organics. The contract contains requirements for reporting so that contract users can track the amount of
materials being recycled and disposed of and includes recycling revenue for some of the recycling lots.
Recycled Copy Paper, Envelopes and Opaque Rolls
OGS continues to offer copy paper, envelopes and opaque rolls containing recycled content through the following
centralized contracts which were issued in 2012 and 2013:
Recycled Copy Paper (Group 50211, Award 22478) (100% and 30% post-consumer recycled content)
Recycled Copy Paper, Truckload Lots (Group 50213, Award 22446) (100% post-consumer recycled content)
Recycled Opaque Rolls (Group 50208, Award 22551) (30% post-consumer recycled content)
Envelopes, Wove, Kraft (Group 50030, Award 22508) (30% post-consumer recycled content)
These contracts provide users with the opportunity
to purchase paper with recycled content that meets
language contained in the Order itself and the EO 4
specification for Printing. All paper available on
these contracts that is 100% post-consumer
recycled content is also processed chlorine free.
Reported sales for these contracts was
approximately $6.4 million in 2015.
Green Cleaning
OGS continues to offer green cleaning products
through its Environmentally Preferable Cleaning
Products, Programs, Equipment and Supplies
contract that was awarded in March of 2015. This
contract includes 12 lots covering general purpose
cleaning, floor maintenance, disinfectants and
sanitizers, vacuum cleaners, hand soaps, de-icing,
compostable bags, entryway mats, and a full range
of microfiber products. This contract includes
products that meet New York’s green cleaning law
for schools and the EO 4 specifications for Industrial
and Institutional Cleaning Products, Hand Cleaners,
Electric Hand Dryers and Vacuum Cleaners.
Provisions for training, tracking purchases and
record keeping are also included, many at no extra
charge. Sales of green products through this award
were estimated to be approximately $2.25 million in
FY 15-16, up from approximately $1 million in
FY 14-15, an encouraging trend.
The Training Subcommittee has made a series of
guides to help agencies buy green and operate more
sustainably. This one features green cleaning.

Fifth Progress Report on State Green Procurement and Agency Sustainability | Fiscal Year 2015-16 41
Floor Coverings and Related Services
In FY 15-16, OGS continued to offer carpet meeting the EO 4 specification for Carpet and Carpet Tile through its
piggyback contract with the National Joint Powers Alliance. By using this contract, authorized users can recycle
their existing carpet, purchase new carpet that meets the EO 4 specification for Carpet and Carpet Tile, and
establish a pattern of purchasing that is both environmentally sustainable and prevents used carpeting materials
from being disposed of in landfills. Sales of carpet and carpet tile that meet the EO 4 specification were
approximately $640,000 in FY 15-16 and $1.40 million throughout the life of the contract. In 2017, Procurement
Services began the process of replacing this award, and expects to issue new contracts by the end of the year.
Oil Lubricating, High Detergent (Re-refined Motor Oil)
OGS continues to offer re-refined motor oil under the Oil,
Lubricating, High Detergent contract (Group 05700, Award 22300)
which was issued in 2011. This contract provides users with the
opportunity to purchase re-refined motor oil that meets the
requirements of the EO 4 specification for Lubricating Oil, High
Detergent, which requires State entities to purchase lubricating oil
that meets or exceeds a minimum percentage of post-consumer
material content by weight of 55%. In FY 15-16 approximately
$700,000 dollars of sales took place through this contract for a total of
$6.7 million since inception of the contract. In FY 15-16,
Procurement Services began the process of replacing this award,
and expects to award a replacement contract in 2017.
Hydraulic Oil, High Detergent, Returnable Drums (Re-refined Hydraulic Oil)
During FY 15-16, OGS also continued to offer re-refined hydraulic oil under the Hydraulic Oil, High Detergent,
Returnable Drums contract (Group 05701, Award 22260) which was issued in 2011. This contract provides users
with the opportunity to purchase re-refined hydraulic oil that meets the requirements of the EO 4 specification for
Hydraulic Oil, High Detergent which requires State entities to purchase lubricating oil that meets or exceeds a
minimum percentage of post-consumer material content by weight of 55%. Approximately $300,000 dollars of
sales take place each year through this contract for a total of $1.0 million since inception of the contract.
Electric Lamps
OGS continues to offer energy efficient lighting through its piggyback contract with the National Association of
Procurement Officials’ (NASPO) Value Point Facilities MRO contract (#1862) for Lamps, Ballasts and Lighting
Equipment. Included in this contract is “Hot List” pricing for frequently purchased items which receive increased
discounts off of the Value Point pricing, and this list includes items which meet the EO 4 specification for Compact
Fluorescent Lighting as well as additional environmentally preferable lighting products. Similar to the Floor
Coverings and Related Services contract, the Lamps, Ballasts, and Lighting Equipment contract also includes a
guide to assist users in identifying products that meet the EO 4 specification. This contract was awarded in May of
2015 and expires in February of 2017, at which time the “Hot List” was transitioned to the OGS Industrial Supply
Contract. Approximately $1.4 million of environmentally preferable lighting products are purchased through this
contract each year including products such as reduced wattage bulbs and DLC certified bulbs and fixtures.
Photovoltaic Systems
Since 2009, solar powered photovoltaic systems have been offered through the OGS contract for Photovoltaic
Systems (Group 05302, Award 21806), which is a statewide piggyback contract off of GSA’s contract GS-07F-
0108J. In 2016 sales of solar products were approximately $1.1 million through this contract.
New York was the first
state to buy re-refined
motor oil in 1990, and
helped build the market.
This experience
illustrates the power of
government spending to
spur and nurture the
development of green
products.

Fifth Progress Report on State Green Procurement and Agency Sustainability | Fiscal Year 2015-16 42
Green Specifications Finalized in 2016
Amended Printing
This specification was revised to update the recommended portion of the specification requirements to reference Ecologo Certification Criteria Document UL2803 and to recommend the avoidance of silver halide coatings, maximize the use of process-free printing plates, and maximize the recycling of aluminum plates.
Model Packaging Language
This specification was created to formalize the packaging language included in each EO4 specification and to establish the packaging requirements in its own specification.
The specification requires that packaging comply with Environmental Conservation Law (ECL) 37-025 and not contain inks, dyes, pigments, adhesives, stabilizers, or any other additives to which any lead, cadmium, mercury or hexavalent chromium is intentionally added or contain incidental concentrations of lead, cadmium, mercury or hexavalent chromium which together are greater than 100 parts per million by weight (0.01%). It also encourages effected entities to use bulk packaging, reusable packaging, innovative packaging that reduces the weight of packaging, reduces packaging waste, or utilizes packaging that is a component of the product; require that packaging remain the property of the supplier; and require that packaging maximizes recycled content and/or meets or exceeds the minimum post-consumer content level for packaging in the U.S. Environmental Protection Agency Comprehensive Procurement Guidelines; and require packaging to be either recyclable or compostable.
Sustainable Landscaping
This specification adopted the “Guidance for Federal Agencies on Sustainable Practices for Designed Landscapes” with addendum “Supporting the Health of Honey Bees and Other Pollinators,” which include guidance on site selection and planning, protection of soils, minimizing the use of water, preserving and protecting native vegetation, materials selection, preserving existing historic facilities and cultural landscapes, and construction, operations and maintenance.
Wheel Weights
This specification sets environmental standards for the purchase of wheel weights and automatic/continuous wheel balancers.
The specification prohibits effected entities from purchasing wheel weights or automatic/continuous wheel balancers that contain intentionally added lead and encourages effected entities to avoid the purchase of wheel weights or automatic/continuous wheel balancers that contain intentionally added mercury and to purchase wheel weights that have recycled content. Buying Green, Savings and Costs
Buying Green
Nearly all agencies reporting in FY 15-16 (97%)
said that they review and use the EO 4 procurement
specifications, as required by EO 4 when making
purchasing decisions, a ten percentage point
increase from the 87% that reported doing so in
FY 14-15. An impressive majority, 63%, reported
reviewing and using the specifications all (27%) or
a majority of the time (36%).
The greatest commitment to EO 4’s green
purchasing directives was demonstrated by
DASNY, NYSERDA, CUNY and Parks, which
reported spending $62,378, $61,315, $30,551, and
$22,220 on green products, respectively. Reported
expenditures for green purchases among the
remaining entities ranged from $1,995 to $9,689
with a total of $198,442 reported for all agencies.
Combined with the amounts spent on the purchase of EPEAT registered computers through the aggregate buy
program ($49.2 million on a pro-rated basis), copy paper with 30% or more post-consumer recycled content ($6.6
million), janitorial paper with 100% recycled content ($4.3 million), re-refined motor oil ($700,000), environmentally
preferable cleaning products ($2.25 million), photovoltaic systems ($1.08 million), environmentally preferable
lighting products ($1.4 million), and the purchase of EO 4 carpet ($640,000), the overall green purchasing by
State entities amounted to approximately $66.3 million in FY 15-16.
DASNY replaced 133 copiers with 32 state-of-the-art
machines that feature print management control software.
Paper costs have declined by 30%, and non-monetary
benefits include better service, workflow and security.

Fifth Progress Report on State Green Procurement and Agency Sustainability | Fiscal Year 2015-16 43
Savings and Costs
In FY 15-16, 41% of reporting agencies reported either a reduction (6%) or no change (35%) in costs as a result
of buying green, while over half (53%) reported that they did not know. The lowest percentage of agencies since
reporting began reported an increase in costs (6%). Overall, data regarding the cost of green procurement is
encouraging. On average over the past seven years, a plurality of agencies (41%) reported a reduction (15%) or
no change (27%) in costs as a result of implementing green procurement practices. A smaller number (12%)
reported an increase, while 46% did not know.
MTA saved money on electrical costs by purchasing LED lighting (as compared to compact fluorescent bulbs)
and purchasing energy saving air conditioners.
* Fluctuations in the percentage of agencies reporting are due to changes in the ability of agencies to track savings and costs from year to
year. There is steady reporting of savings or no change in costs compared to increases in cost.
Success Stories, Challenges, and Lessons Learned
As agencies have become more comfortable with the goals and benefits of green procurement, the focus of the
Interagency Committee has shifted from developing green specifications—“defining green”—to making it easier
for agencies to purchase green products and services. The issuance of wholly green procurements and contracts
based on green specifications developed under EO 4, such as Microcomputer and Related Systems, Recycled
Copy Paper, Environmentally Preferable Cleaning Products, Photovoltaic Systems and Re-refined Motor and
Hydraulic Oil, are a crucial step forward. Also promising and important are the creation of tools for agencies to
identify green products available on conventional contracts, such as the EO 4 Product Guides developed for Floor
Coverings and Lamps.
Additional developments include the integration of green purchasing into the State Procurement Guidelines, and
the invitation to vendors of recycled and remanufactured commodities to promote their offerings at the annual
State Procurement Forum. Challenges that remain include the development of tools for agencies to identify green
offerings available through the new State e-catalog system, and the adoption of more effective methods for
agencies to track their green purchases.
Agency success stories are heartening. CUNY reports that green procurement choices are now commonplace
across their campuses for a range of different items and services, including paper, cleaning supplies, paint, carpeting,
and energy efficient servers, networks and computers. All CUNY colleges now use recycled-content copy paper.
As the market for green products has grown, CUNY reports that prices have also become more competitive.
14 13
21
16 1715
6
27
31
2522
26
21
35*
23
13
810
13 13
60
5
10
15
20
25
30
35
40
FY 09-10 FY 10-11 FY 11-12 FY 12-13 FY 13-14 FY 14-15 FY 15-16
Pe
rce
nt
of
Re
sp
on
de
rs
Cost of Green Procurement FY 09-10 to FY 15-16
Saving Money
No Change
Increase in Cost

Fifth Progress Report on State Green Procurement and Agency Sustainability | Fiscal Year 2015-16 44
Finding Green Products that Work Well at an Affordable Price
The majority of statewide contracts are not exclusively green, and it can be time consuming for purchasers to
navigate offerings and identify green products. As consumer demand has grown, the market has responded, and
more green products with high levels of performance are available than ever before. Unfortunately, however,
some companies have resorted to “greenwashing,” which is the making of green claims that are intentionally
misleading, or provide too little information to allow meaningful comparison.
Two agencies have responded to this challenge by adding boilerplate requirements to their competitive bidding
process to include the seeking out of green vendors wherever possible. One is CUNY Queensborough College.
Another is NYPA, which has implemented a new procurement system that requires all their suppliers to complete
a sustainability survey when submitting bids. This information is used to benchmark sustainability performance
across their supply chain, with the goal of mitigating supply chain risk and increasing the sustainability efforts of
vendors. The Javits Center is also planning to include sustainability criteria in their bid review process.
In other instances, the market has not yet responded with green alternatives. For example, the Division of Housing
and Community Renewal has found it difficult to procure hybrid electric vehicles in the small SUV and mini-van
categories because few options exist at a reasonable price. DEC has had the same challenge with SUVs and
pickup trucks.
Tracking Green Procurement
Few agencies have a system for tracking green
purchases, and the Statewide Financial System
(SFS) does not currently track them. OGS and DEC
are working together to develop standard definitions
and a coding system for green products. Over time,
building the capability of the SFS and the new e-
catalog to track green purchasing will support more
consistent methods of reporting across the State.
The Development Authority of the North Country
continues to enhance its electronic purchasing
tracking system to allow green purchases to be
tracked across Divisions. This may be a good
model for other agencies. In FY 15-16, the
authority revisited its green tracking list and
created an updated spreadsheet reporting
system that allows for the sorting and
summarizing of products purchased, as well as
keeping track of cost savings.
Purchases by Contractors
Agencies that contract out for janitorial and other
services must work cooperatively with those
contractors to achieve green procurement. The
Javits Center notes that when the use of green
cleaning products is not included in an existing
contract for cleaning services, off-contract requests
for the use of green cleaners is more expensive.
DASNY reports that a similar challenge exists in
construction-related procurement.
This guide offers a list of all State
contracts containing green products.

Fifth Progress Report on State Green Procurement and Agency Sustainability | Fiscal Year 2015-16 45
Recycled Paper
The increased rate of 100% post-consumer recycled content paper purchasing by agencies in FY 15-16 provides
solid evidence of successful culture change, supported by the power of State contracting. The issuance of
statewide contracts for 100% post-consumer recycled content copy paper and 100% janitorial paper in the
summer of 2008 has kept prices low for the past seven reporting years, as documented by data showing that on
average, over the past four fiscal years, agencies paid virtually the same amount for 100% post-consumer
recycled content copy paper (at $31.50 per box) as for 30-99% recycled paper (at $31.25 per box), and
significantly less than for copy paper with less than 30% post-consumer recycled content (at $36.75 per box).
Only a handful of agencies (three in FY 15-16), report that 100% recycled content copy paper is more expensive.
In order to take advantage of the best pricing opportunities, agencies are encouraged to shop around and provide
as much lead time as possible, especially for large purchases. The number of reports raising issues about the
performance of 100% post-consumer recycled copy paper was also low (four in FY 15-16), and included Civil
Service, whose exam materials must adhere to a particularly high level of purity, since even a small mark could
be perceived as an apostrophe and alter the interpretation of a test question.
New and Noteworthy Initiatives in FY 15-16
EFC modified its printing contracts to reduce the number of copies made and require contractors to use 100%
post-consumer content recycled paper.
The Westchester Medical Center is engaged in an initiative to evaluate options for the purchase of new
stretcher mattresses that include a mattress identified as green by Practice Greenhealth, in that it has reduced
levels of chemicals in the fabric and foam, and is made from non-hazardous fire retardant materials.
The Javits Center is pursuing green cleaning and green procurement training for their staff, which should help
them better identify green products.
Fifth Progress Report on State Green Procurement and Agency Sustainability | Fiscal Year 2015-16 46
Restricting the Use of Bottled Water
Background
EO 18 directed all executive agencies to “develop and implement a plan to
eliminate the expenditure of State funds for the purchase of bottled water
for use at executive agency facilities” within 180 days of May 5, 2009, with
each agency’s goal being “to eliminate such expenditure by May 1, 2010.”
EO 18 defines “executive agencies” as “any department, agency, division,
commission, bureau, or other entity of the State over which the Governor
has executive power.” Following an outreach effort by OGS in 2009, which
included the broader universe of public authorities and public benefit
corporations covered by EO 4, 66 State entities designated an EO 18
coordinator. Of these, 59 submitted EO 18 plans, under which 29 stated
that they had already eliminated the purchase of bottled water and 22
requested exemptions to continue purchasing under certain
circumstances. The primary reasons cited were the need for additional time to install filtration systems,
maintaining emergency supplies, and locations and circumstances where tap water was not potable or
unavailable. EO 18 allows such exemptions.
Findings
Agency reports for FY 15-16 continue to indicate excellent compliance with the directives of EO 18. All executive
agencies required to comply with EO 18 report that they are in compliance. In addition, of the 28 authorities and
other entities reporting not covered by EO 18, 21 (75%) nonetheless adopted the goal of eliminating bottled water
use and reported compliance.
Eight executive agencies covered by EO 18 and 14 entities not covered by EO 18 (but nonetheless in
compliance) said they still require exemptions allowing the purchase of bottled water in one or more locations.
Entities with large centralized offices served by reliable municipal water supplies generally reported no need for
exemptions. The main need for exemptions arose for entities with staff working in remote locations, where a
source of potable tap water is unavailable.
In brief, the report for FY 15-16 continues to document that the executive agencies covered by EO 18 have
virtually eliminated the purchase of bottled water. No covered agencies are purchasing bottled water without an
exemption, and only 8 continue to use bottled water under special circumstances. In addition, 79% of authorities,
public benefit corporations, and university systems not required to eliminate bottled water use have restricted it to
special circumstances.
Savings and Costs
In FY 15-16, 23% of agencies and authorities reporting said they reduced costs by eliminating bottled water use,
42% experienced no change in costs, and only 5 (9%), reported an increase in costs. The remaining 22% did
not know.
Of the five agencies reporting an increase in costs, two of them are the university systems, SUNY and CUNY. A
number of CUNY campuses noted that water bottle refilling stations have upfront costs: the station itself costs
around $1,000, and filters are about $143 each. Both university systems report that the installation and
maintenance of water bottle refilling stations is costing more than they used to spend on bottled water. This
makes sense, because both university systems are doing much more than reducing their own purchases of
bottled water—they are going above and beyond by significantly reducing the expense and environmental impact
of the purchase of bottled water from outside vendors by their students.
CUNY, however, has also found that transitioning from the purchase of large cooler bottles to water filtration
systems has reduced costs. They were also able to reduce the cost of filtration systems by 50% by purchasing
from a preferred source.
Executive agencies have
virtually eliminated the
spending of state funds
on water bottles, and
86% of authorities not
covered by EO 18 have
also restricted purchases
to special circumstances.

Fifth Progress Report on State Green Procurement and Agency Sustainability | Fiscal Year 2015-16 47
Most agencies report that their spending on bottled water isn’t declining further because they are either spending
no money on bottled water or they only spend on exempt purposes, which aren’t changing significantly on an
annual basis. Most report that the majority of savings occurred in the first year of implementation of the Order.
Total exempted spending on bottled water for one agency decreased due to improvements in protocols for
stocking emergency supplies, and for another due to providing municipal water to previously unserved facilities.
Although EO 18 reporting does not require quantified cost savings, entities are asked to report the amount they
have spent on bottled water purchases over the past year. An estimated $150,000 of State funds were reportedly
spent on bottled water in FY 15-16. The most significant expenditures were:
The Division of Military and Naval Affairs spent approximately $49,000 to supply bottled water to “State active
duty soldiers serving on missions which require them to perform duties in areas where it would be impossible to
bring water in.”
NYPA spent $24,200 to supply crews working on remote power lines and facilities without currently available
potable water. They are in the process of replacing water coolers with water service stations in facilities that are
capable of new water service connections.
Parks spent $18,300 on bottled water for facilities that have old pipes, lead pipes, or other water supply issues.
CUNY spent $29,300 on bottled water. Since they are not required to comply with EO 18, some of their schools
continue to purchase bottled water, although they are encouraged not to. Some of their bottled water goes toward
events. Other spending includes supplying Medgar Evers College, which doesn’t have sufficient water fountains.
Challenges and Success Stories
Eight entities (down from 11 in FY 09-10) said that potable water was unavailable at certain facilities. The
majority of these are sites operated by DOT and Thruway, while some are remote facilities operated by NYPA,
DEC, and Parks. In a number of these instances, upgrades continue to be implemented.
Seven entities continue to purchase bottled water for emergency use.
Six entities indicated they needed to continue purchasing water to meet the special needs of employees, clients
or the public. Examples include water for detained youths during transport over long distances, soldiers on
active duty, transit employees working in remote locations, and patients.
Only seven entities not covered by EO 18 continue to purchase bottled water for uses not exempt under the
Order. For example, the Central New York Regional Transportation Authority purchases five gallon bottles of
water for water coolers at two locations, but it has installed tap water filters at a third location and is looking into
doing the same at the other locations.
3734
4137
23
35
30 30
37
42
0 2 3 29
0
10
20
30
40
50
FY 11-12 FY 12-13 FY 13-14 FY 14-15 FY 15-16
Pe
rce
nt
of
Res
po
nd
ers
Cost of Eliminating Bottled Water Use FY 11-12 to FY 15-16
Saving Money
No Change
Increase in Cost

Fifth Progress Report on State Green Procurement and Agency Sustainability | Fiscal Year 2015-16 48
There are still some instances of convenience usage, especially for
meetings or conferences. SUNY Empire State College reported that while
they are very supportive of the no bottled water policy, they have run into
some instances where bottled water may be a good option. One is where
the University is providing a boxed lunch to people who are traveling, for
example on a field trip or tour. If water is not offered, people have to choose
soda or a sugared beverage instead. Another is when speakers are using a
podium, where a cup of water is more likely to spill.
These challenges are real, because while the use of reusable water bottles
would be the ideal solution in both scenarios, culture change is slow, and
not everyone has adopted the habit of traveling with their own reusable
bottle. At the same time, the meeting culture of providing water to
participants has been one of the harder traditions to break. As CUNY
Hunter College notes, “convenience and paradigm shifting” are important as
we work to eliminate bottled water purchasing. The most innovative initiatives are working to change this culture
and reduce the amount of bottled water purchased by caterers or sold by State vendors to students and other
clients. Successes include:
The Office of General Services has installed bottle filling stations in many of the buildings it operates across
the State.
Most SUNY campuses have installed water bottle filling stations and continue to add more.
Most CUNY campuses have installed water bottle filling stations and are using signage and educational videos
to encourage their use instead of the purchase of bottled water. Stations are constantly being added.
New and Noteworthy Initiatives in FY 2015-16
The Division of Military and Naval Affairs
analyzed their previous practices of storing
bottled water with disaster preparedness kits and
made the decision to only buy what is needed for
a specific mission, thereby eliminating stockpiling
and potential waste.
In nine months of use, SUNY Farmingdale’s
water bottle filling stations dispensed the
equivalent of more than 300,000 16 oz. plastic
water bottles.
SUNY New Paltz installed 50 “gooseneck”
retrofits to older water fountains, allowing them to
more easily fill water bottles. Elkay bottle filling stations are now their “campus standard for water fountains.”
SUNY Oneonta gave every freshman a sturdy reusable water bottle.
SUNY Oswego’s outreach and education programs to reduce disposable water bottle use have been very
successful with minimal investment. Staff paid for by the student Sustainability Fee were used to launch a
“TapIn” campaign, which diverted 20,000 plastic water bottles from the waste stream in just 8 weeks. Metrics
were obtained through an app people use to scan their refillable bottle each time it was used. The system was
simple to use and made tracking and data collection automatic.
The Division of Military and Naval Affairs
reduced stockpiling and waste by limiting
bottled water purchases to specific missions.
The installation of bottle
filling stations by SUNY
and CUNY have
resulted in reduced
spending by students
on bottled water. SUNY
Farmingdale alone
reduced bottled water
purchases by more than
300,000 bottles.

Fifth Progress Report on State Green Procurement and Agency Sustainability | Fiscal Year 2015-16 49
Conclusion
The agency reports compiled and summarized for FY 15-16 demonstrate continued and encouraging progress
toward the adoption of sustainable practices and purchasing by New York State government. Through the
leadership of Governor Cuomo, agencies continue to reduce paper use and waste, recycling has reached new
highs, non-chemical control of pests for turf and ornamentals has jumped, green cleaning remains strong, and
OGS has issued important green contracts. Model agencies have led efforts to install on-site renewable energy,
capture rainwater, and reduce toxic chemical use. Through continued focus on achieving the goals of
sustainability and green procurement, the progress made by State agencies to date has established a solid
promise of continuing innovation and success.