Fifth Five-Yea Revier w Report City of Dubuque Dubuque ... · City of Dubuque Dubuque County Iow, a...
132
Fifth Five-Year Review Report John Deere Dubuque Works Superfund Site City of Dubuque Dubuque County, Iowa July 2013 Prepared By: Region 7 United States Environmental Protection Agency Lenexa, Kansas Approved by: Cecilia Tarjis Director, Superfund Division Date: 30284937 Hill HI Superfund
Transcript of Fifth Five-Yea Revier w Report City of Dubuque Dubuque ... · City of Dubuque Dubuque County Iow, a...
Fifth Five-Year Review Report
John Deere Dubuque Works Superfund Site
City of Dubuque
Dubuque County, Iowa
July 2013
Prepared By:
Region 7
United States Environmental Protection Agency
Lenexa, Kansas
Approved by:
Cecilia Tarjis Director, Superfund Division
Date:
30284937
Hill HI Superfund
TABLE OF CONTENTS
List of Abbreviations i Executive Summary....... ii Five-Year Review Summary Form iv
I. 0 INTRODUCTION 1
2.0 SITE CHRONOLOGY 2
3.0 BACKGROUND 2 3.1 Physical Characteristics 2 3.2 Land and Resource Use 2 3.3 History of Contamination.... 4 3.4 Regulatory History 4
4.0 REMEDIAL ACTIONS .6 4.1 Remedy Selection 6 4.2 Remedial Action Objectives 6 4.3 Consent Decree and Performance Standards 6 4.4 Remedy Implementation 9
5.0 PROGRESS SINCE THE LAST REVIEW 18
6.0 FIFTH FIVE-YEAR REVIEW PROCESS 19 6.1 Community Notification and Involvement 19 6.2 Document Review 19 6.3 Data Review 20 6.4 Systems Operations/Operation and Maintenance 23 6.5 Environmental Covenant Review 23 6.6 Site Inspection 23 6.7 Interviews 24
7.0 TECHNICAL ASSESSMENT : 24 7.1 Question A 24 7.2 Question B 25 7.3 Question C : 27 7.4 Technical Assessment Summary 28
8.0 ISSUES 28
9.0 RECOMMENDATIONS AND FOLLOW-UP ACTIONS... 28
10.0 PROTECTIVENESS STATEMENT 29
II. 0 NEXT REVIEW 29

TABLE OF CONTENTS (Continued)
Figures
Tables
Appendices
LIST OF ABBREVIATIONS
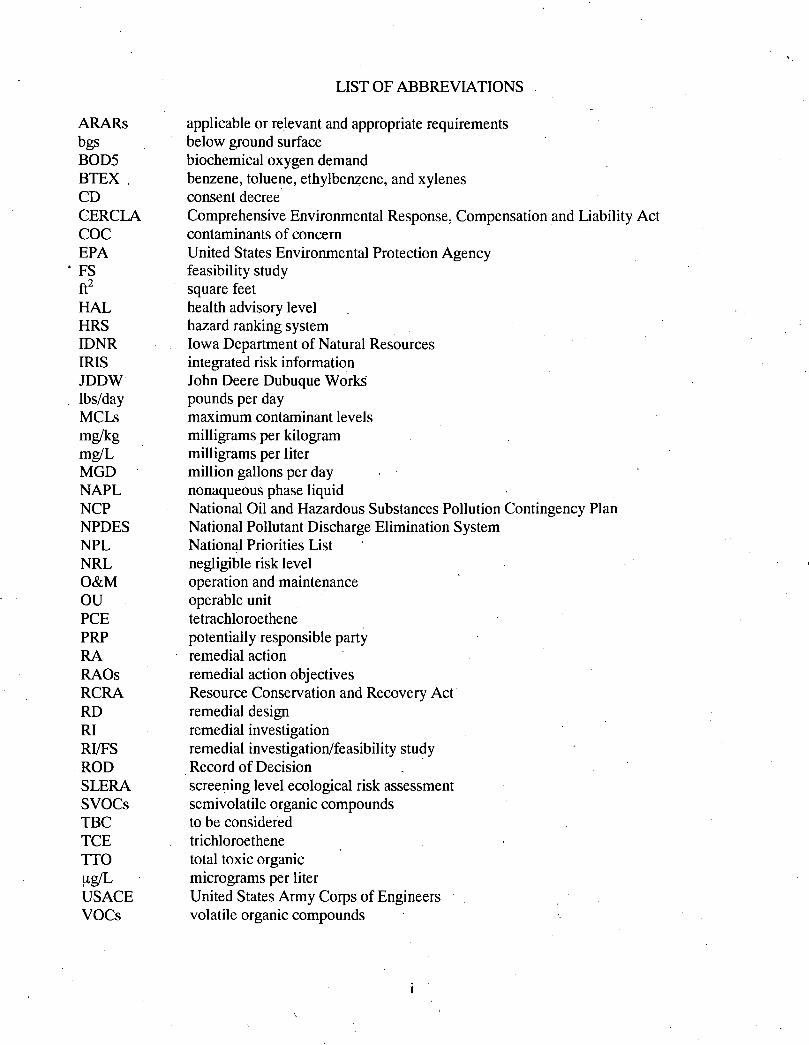
ARARs applicable or relevant and appropriate requirements bgs below ground surface BOD5 biochemical oxygen demand BTEX . benzene, toluene, ethylbenzene, and xylenes CD consent decree CERCLA Comprehensive Environmental Response, Compensation and Liability Act COC contaminants of concern EPA United States Environmental Protection Agency FS feasibility study ft2 square feet HAL health advisory level HRS hazard ranking system IDNR Iowa Department of Natural Resources IRIS integrated risk information JDDW John Deere Dubuque Works lbs/day pounds per day MCLs maximum contaminant levels mg/kg milligrams per kilogram mg/L milligrams per liter MGD million gallons per day NAPL nonaqueous phase liquid NCP National Oil and Hazardous Substances Pollution Contingency Plan NPDES National Pollutant Discharge Elimination System NPL National Priorities List NRL negligible risk level O&M operation and maintenance OU operable unit PCE tetrachloroethene PRP potentially responsible party RA remedial action RAOs remedial action objectives RCRA Resource Conservation and Recovery Act RD remedial design RI remedial investigation RI/FS remedial investigation/feasibility study ROD Record of Decision SLERA screening level ecological risk assessment SVOCs semivolatile organic compounds TBC to be considered TCE trichloroethene TTO total toxic organic fig/L micrograms per liter USACE United States Army Corps of Engineers VOCs volatile organic compounds
J
EXECUTIVE SUMMARY
The remedy for the John Deere Dubuque Works (JDDW) site in Dubuque, Iowa, includes pumping groundwater from the alluvial aquifer using the existing production wells to maintain an inward hydraulic gradient. The remedy also includes using deed restrictions and environmental covenants to prevent inappropriate use of the plant property in the future. In addition, wells tapping the alluvial aquifer beneath the JDDW property for the purpose of extracting water for human drinking purposes or for irrigation of food or feed crops are not allowed.
According to the data reviewed, the site inspection and interviews, the remedy is functioning as intended by the Record of Decision. However, a protectiveness determination of the remedy at Operable Unit 1 cannot be made at this time until further information is obtained. Further information will be obtained by conducting a screening level ecological risk assessment at the site to evaluate if any ecological exposure pathways exist. The site is located near the confluence of the Little Maquoketa and Mississippi Rivers. The portion of the Mississippi River adjacent to the site is part of the Upper Mississippi River National Wildlife and Fish Refuge. It is expected these actions will take approximately one year to complete, at which time a protectiveness determination will be made.
There are additional recommendations that do not affect protectiveness of the remedy that could be completed to optimize monitoring activities for the site in the future. Monitoring wells MW-2, MW-11D, MW-16, MW-20D and SBW-3N were removed from the groundwater monitoring program in September 1998 and should be abandoned pursuant to Iowa Administrative Code 567-39.8. Wells MW-8S, MW-9S, MW-12, PW-3A, PW-4A, PW-5 and PW-7A have been below cleanup criteria for the past 10 years and should be removed from the groundwater monitoring program. '
Nonaqueous phase liquid (NAPL) monitoring has been conducted at the site quarterly since the NAPL monitoring plan was implemented in June 2004. NAPL monitoring in wells MW-4, MW-6, MW-7S, MW-8S, MW-12, MW-13S, RW-3, RW-4(a), RW-5 and G-2S can be conducted annually and the monthly groundwater elevation levels can be collected at the six paired wells only to optimize monitoring activities at the site. All groundwater elevations should be measured annually to develop the groundwater contour map.
Since September 1998, groundwater sampling has been conducted on a biennial schedule. Based on the historic groundwater results, this sampling frequency can be reduced to once every five years in conjunction with the five-year reviews.
Quarterly performance reports with site information including a summary of activities performed on-site, weekly flow data and rolling 12-month average of head differentials at the paired monitoring wells has been submitted to the U. S. Environmental Protection Agency to demonstrate compliance with the Consent Decree performance standards. The reporting can be reduced from quarterly to annually due January 30 for the previous years' site activities.
In October 2004, well SBW-4 was added to the monitoring program and NAPL measurements have been collected monthly. Since the NAPL thickness has not fluctuated significantly over the past five years, the measurements from SBW-4 should be discontinued.
ii
As recommended by the five-year review guidance, all reviews should include an evaluation of the potential for vapor intrusion issues. Following review of all data and information for the JDDW site, there is no potential for vapor intrusion. The concentration of the chlorinated contaminants of concern (COCs) in shallow groundwater is extremely low. Considering the attenuation factors associated with groundwater to indoor air, no issues are evident. Additionally, the concentration of the chlorinated COCs has been decreasing over the years. Based on this information, there appears to be limited opportunities for vapor intrusion at this site.
iii
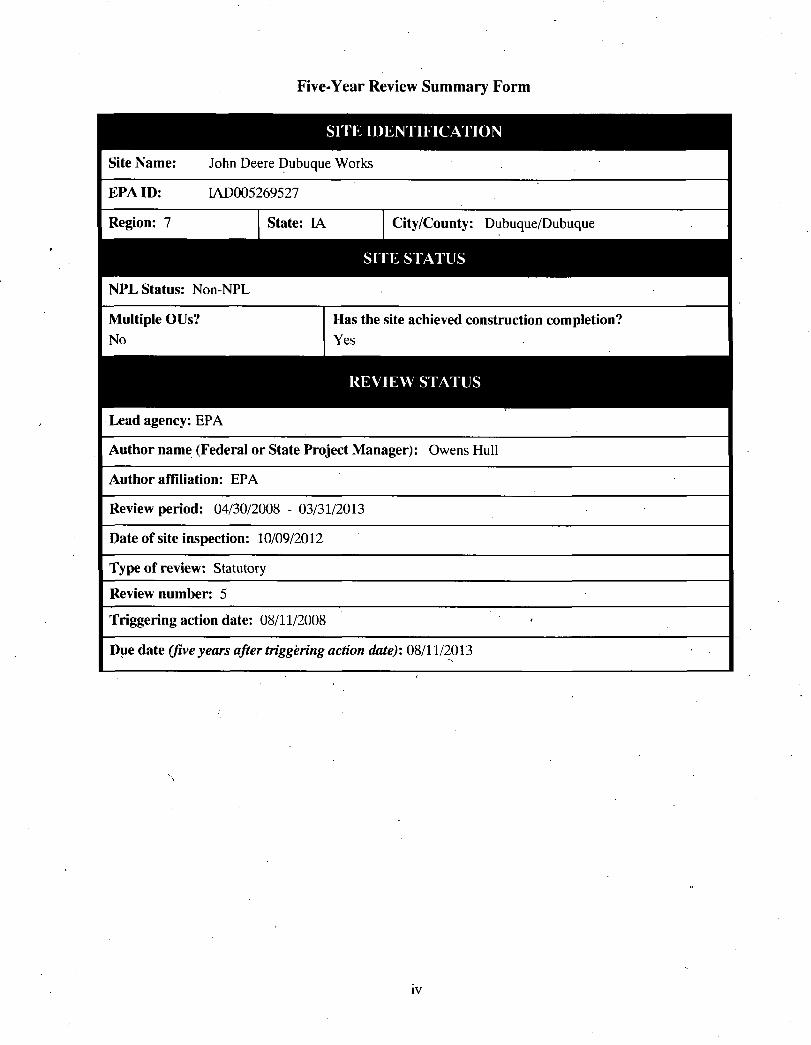
Five-Year Review Summary Form
SITE IDENTIFICATION
Site Name: John Deere Dubuque Works
EPA ID: IAD005269527
Region: 7
NPL Status: Non-NPL
State: IA City/County: Dubuque/Dubuque
SITE STATUS
Multiple OUs? No
Has the site achieved construction completion? Yes
Lead agency: EPA
Author name (Federal or State Project Manager): Owens Hull
Author affiliation: EPA
Review period: 04/30/2008 - 03/31/2013
Date of site inspection: 10/09/2012
Type of review: Statutory
Review number: 5
Triggering action date: 08/11/2008
Due date (five years after triggering action date): 08/11/2013
iv
Five-Year Review Summary Form (continued)
Issues/ Reco m m e n d a t i o n s
: &t|(s) without lssu /Recommei ^Sbns Identified mllfe Five-Yea^^yiew: --4^
N/A
Issues and Recommendations Identified in the.Five-Year Review: : v ; . v 'tew-
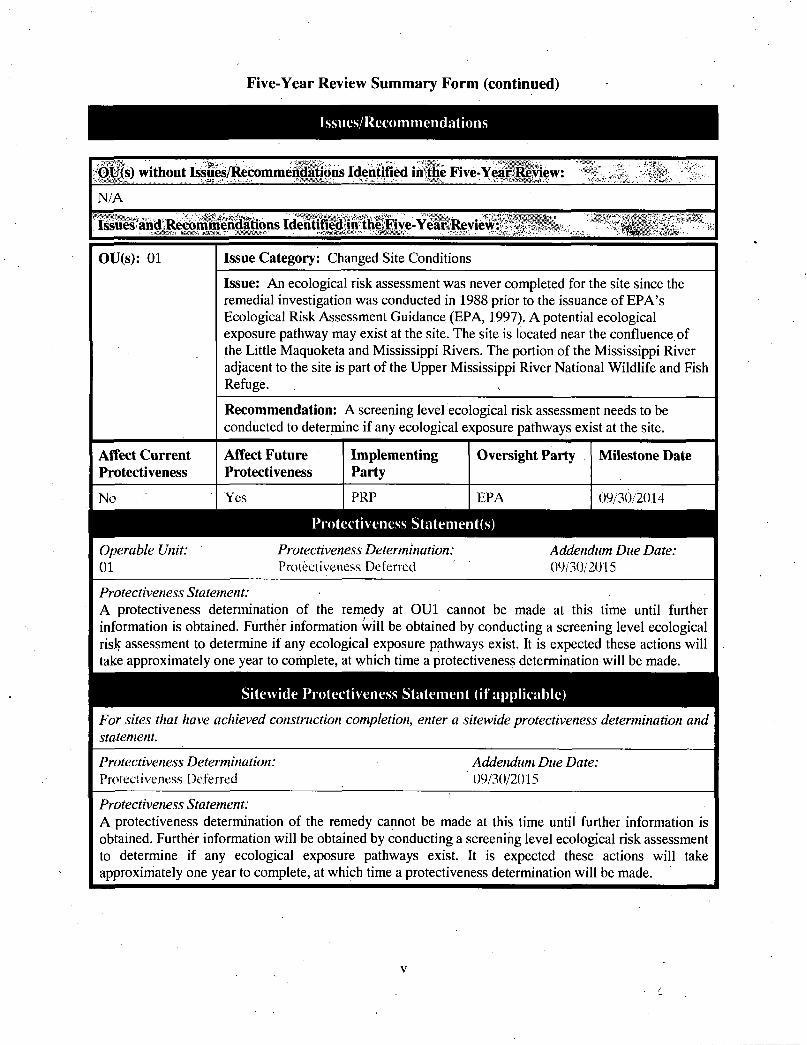
OU(s): 01 Issue Category: Changed Site Conditions
Issue: An ecological risk assessment was never completed for the site since the remedial investigation was conducted in 1988 prior to the issuance of EPA's Ecological Risk Assessment Guidance (EPA, 1997). A potential ecological exposure pathway may exist at the site. The site is located near the confluence of the Little Maquoketa and Mississippi Rivers. The portion of the Mississippi River adjacent to the site is part of the Upper Mississippi River National Wildlife and Fish Refuge. ,
Recommendation: A screening level ecological risk assessment needs to be conducted to determine if any ecological exposure pathways exist at the site.
Affect Current Protectiveness
Affect Future Protectiveness
Implementing Party
Oversight Party Milestone Date
No Yes PRP EPA 09/30/2014
Protectiveness Statement(s)
Operable Unit: 01
Protectiveness Determination: Protectiveness Deferred
Addendum Due Date: 09/30/2015
Protectiveness Statement: A protectiveness determination of the remedy at OU1 cannot be made at this time until further information is obtained. Further information will be obtained by conducting a screening level ecological risk assessment to determine if any ecological exposure pathways exist. It is expected these actions will take approximately one year to complete, at which time a protectiveness determination will be made.
Sitewide Protectiveness Statement (if applicable)
For sites that have achieved construction completion, enter a sitewide protectiveness determination and statement.
Protectiveness Determination: Protectiveness Deferred
Addendum Due Date: 09/30/2015
Protectiveness Statement: A protectiveness determination of the remedy cannot be made at this time until further information is obtained. Further information will be obtained by conducting a screening level ecological risk assessment to determine if any ecological exposure pathways exist. It is expected these actions will take approximately one year to complete, at which time a protectiveness determination will be made.
FIFTH FIVE-YEAR REVIEW REPORT
John Deere Dubuque Works
1.0 INTRODUCTION
The U.S. Environmental Protection Agency Region 7 has conducted a five-year review of the remedial action (RA) implemented at the John Deere Dubuque Works (JDDW) site in Dubuque, Iowa. This review was conducted for the period April 2008 through March 2013. This report documents the results of the review. ARCADIS was contracted by JDDW to provide information to support the preparation of the five-year review.
The purpose of five-year reviews is to determine whether the remedy at a site is protective of human health and the environment. The methods, findings and conclusions of reviews are documented in five-year review reports. In addition, five-year review reports identify issues found during the review, if any, and recommendations to address them.
The agency is preparing this five-year review pursuant to the Comprehensive Environmental Response, Compensation and Liability Act (CERCLA) §121 and the National Oil and Hazardous Substances Pollution Contingency Plan (NCP). CERCLA § 121 (c) states:
If the President selects a remedial action that results in any hazardous substances, pollutants or contaminants remaining at the site, the President shall review such remedial action no less often than each five years after the initiation of such remedial action to assure that human health and the environment are being protected by the remedial action being implemented. In addition, if upon such review it is the judgment of the President that action is appropriate at such site in accordance with section [104] or [106], the President shall take or require such action. The President shall report to the Congress a list of facilities for which such review is required, and the results of all such reviews, and any actions taken as a result of such reviews.
The agency interpreted this requirement further in NCP; 40 CFR § 300.430(f)(4)(ii) states:
If a remedial action is selected that results in hazardous substances, pollutants, or contaminants remaining at the site above levels that allow for unlimited use and unrestricted exposure, the lead agency shall review such action no less often.than every five years after the initiation of the selected remedial action.
This is the fifth five-year review for the JDDW site. The first five-year review was completed in September 1995, the second five-year review was completed in September 1998, the third five-year review was completed in September 2003 and the fourth five-year review was completed in August 2008. Subsequent five-year reviews should be completed no later than five years following the signature of the previous five-year review report. The triggering action for this statutory review is the date of completion of the fourth five-year review (August 2008) as shown in USEPA's WasteLAN database. This five-year review is required because the JDDW RA resulted in hazardous substances, pollutants or contaminants remaining on-site.
1
2.0 SITE CHRONOLOGY
A chronology of site events for the JDDW site is presented in Table 1.
3.0 BACKGROUND i
3.1 Physical Characteristics
The JDDW plant is located approximately 2.5 miles north of the city of Dubuque in northeastern Iowa and covers 1,447 acres near the confluence of the Mississippi and the Little Maquoketa Rivers. Land surface elevations vary from 600 feet above mean sea level along the Mississippi River close to the JDDW plant to greater than 850 feet above mean sea level on the uplands away from the river. The Mississippi River is located east of the site, and the Little Maquoketa River bisects the JDDW property and enters the Mississippi River east of the northeast facility boundary. A site map is included as Figure 1. The plant buildings are located on a relatively flat delta at the confluence of the Little Maquoketa River and the Mississippi River.
Site geology consists of alluvial sediment overlying bedrock. The alluvial sediments at the JDDW site vary in thickness from 100 to 158 feet and consist principally of fine-to-coarse-grained sand deposited mainly by glacial meltwaters. A thin silty layer has also been deposited by the Little Maquoketa and Mississippi Rivers. The plant site is located above the thickest portion of the alluvium in the Peru Bottoms area. Toward the bluffs, the elevation of the bedrock increases and the alluvial deposits become thinner. Groundwater flow in the alluvial aquifer is toward the production wells.
Three distinct bedrock aquifers are present in the Dubuque, Iowa, area: the Galena-Platteville aquifer, Cambrian-Ordovician aquifer and Dresbach Group aquifer. The Galena-Platteville aquifer is comprised of the Galena, Decorah and Platteville Formations of Ordovician age, which are the younger bedrock units in the vicinity of JDDW. These bedrock units, which consist of limestone and dolomite with shaley layers, are not present in the JDDW plant area, but are found in the uplands adjacent to the river valley and at the bottom of shallow filled valleys. The Galena-Platteville aquifer yields small quantities of water adequate for domestic supply. The Galena-Platteville aquifer is underlain by the deeper-lying Cambrian-Ordovician aquifer, which is comprised of the Ordovician-age St. Peter Sandstone and Prairie du Chien (Dolomite) Group and the Cambrian-age Jordan Sandstone. This aquifer is a major source of water across the state of Iowa. In the JDDW plant area, the Galena-Platteville aquifer and the St. Peter Sandstone (the upper portion of the Cambrian-Ordovician aquifer) are absent, and the alluvium is in direct contact with the Prairie du Chien Group of the Cambrian-Ordovician aquifer. The Cambrian-Ordovician aquifer is underlain by the St. Lawrence Formation and the Franconia Sandstone, which are relatively impermeable and provide an effective confining layer between the Cambrian-Ordovician aquifer and the deeper-lying Dresbach Group aquifer. The Dresbach Group aquifer consists of the Galesville Sandstone, the Eau Claire Formation and the Mt. Simon Sandstone. This aquifer is not as productive or as widely used as the Cambrian-Ordovician aquifer.
3.2 Land and Resource Use
General land use in Dubuque County and northeastern Iowa is primarily agricultural except near major population centers. JDDW is zoned M-2 Heavy Industrial District by Dubuque County. Areas adjacent to
2
JDDW are zoned R-l Rural Residential to the north, which includes mostly farms; C- l Conservancy to the east; A - l Agricultural to the west; and C- l Conservancy, R-2 Single Family Residential, and R-3 Multifamily Residential to the south.
The JDDW site, although once farmland, remains largely undeveloped except for the immediate vicinity of the plant operations, which is located on the eastern half of the site. In 1946, JDDW began manufacturing operations in a 600,000-square-foot (ft2) facility. A site map is included in Figure 2. Prior to 1976, several major additions to the plant were completed predominantly to the south of the original building. As a result of these additions, the facility covered more than 5,000,000 ft2, which included the original plant building, storage areas, waste disposal areas and parking lots.
In 1997, JDDW closed down and demolished buildings E, E l , E2 and E3 (Figure 2). In 1998, buildings J, K and I were demolished (Figure 2), and in 2003, buildings U, V and VI were demolished (Figure 2). These demolitions reduced the size of the facility by 932,776 ft2.
In the past, JDDW has employed over 8,000 workers in the manufacture of heavy-construction equipment including backhoes, bulldozers and forestry equipment. As of January 31, 2013, approximately 2,220 workers are employed at the plant.
The portion of the Mississippi River adjacent to the site is part of the Upper Mississippi River National Wildlife and Fish Refuge established in 1924. A Chicago, Milwaukee, St. Paul & Pacific Railroad track lies between the plant and the Mississippi River (Figure 2). Approximately 20 cottages are located between the JDDW facility and the Mississippi River on the floodplain (Geraghty & Miller, 1990). Nineteen of the 20 cottages are leased from the U.S. Army Corps of Engineers (USACE) to private residents. The remaining cottage is not owned by the USACE and is privately owned. It is anticipated that the current land uses of the JDDW plant and adjacent areas will continue into the future. JDDW has an environmental covenant that limits the use of the current plant property to industrial activity only.
The JDDW plant's water supply is obtained from two bedrock wells installed in the lower Cambrian-Ordovician limestone aquifer (PW-1 and PW-2) and six wells installed in the alluvial aquifer (PW-3A, PW-4A, PW-5, PW-6, PW-7A and PW-8). The JDDW potable water supply is obtained from the two bedrock wells PW-1 and PW-2. Process and cooling water for the plant are provided by alluvial wells PW-3A, PW-4A and PW-7A. Alluvial well PW-5 is retained as a backup well, and alluvial wells PW-6 and PW-8 are reserved for fire protection. A map illustrating the locations of production wells PW-3A, PW-4A, PW-5, PW-6, PW-7A and PW-8 is included as Figure 3.
Three production wells were replaced in the 1990s. After obtaining the agency's approval, PW-3 was abandoned in April 1997 due to changes in plant production and replaced with PW-3 A. PW-4 was replaced with PW-4A in May 1995 and PW-7 was replaced with PW-7A in September 1995, because water being pumped from these wells contained large volumes of sand. The locations of PW-3, PW-4 and PW-7 are also shown on Figure 3.
3
3.3 ' History of Contamination
Potential sources of environmental contamination were identified in the remedial investigation (RI) conducted at the JDDW site in 1988. Identified sources of contamination included a former landfill, a foundry, a chrome basin at the industrial wastewater treatment plant, a coal storage yard and a diesel fuel line leak located under the plant which occurred in 1980.
Throughout its history, the JDDW facility has used two separate landfills for waste disposal. The older landfill, identified as a potential source of contamination in the RI report, was placed in a natural depression in the Little Maquoketa River floodplain near the northern end of the facility. The older landfill was used from 1946 until 1974 and was approximately 20 acres in area. Prior to 1974, JDDW placed wastes up to the banks of the river. In 1974, the Iowa Department of Natural Resources (IDNR) required the wastes be moved to at least 140 feet from the riverbanks. The wastes were bulldozed back and fences were placed along the perimeter of the landfill. The newer landfill is not included in the RA.
Prior to 1968, wastes were placed in the low areas of the older landfill and combustible material was burned. Wastes disposed in the older landfill included caustics (sodium or potassium hydroxide), acids (hydrochloric or sulfuric), petroleum distillates (solvents, grinding oils, etc.), heavy metals (chromium, lead and zinc used in electroplating), cyanide, paint sludge and foundry sand containing one percent oil-based resin. The quantities of materials disposed of in the older landfill are not known (Geraghty & Miller, 1998).
In October 1980, a fuel layer was present on the shallow water table under building G-2 as a result of an underground diesel fuel line leak. An estimated 200,000 gallons of diesel fuel leaked from the line. Recovery well G-2S was installed in October 1980 and JDDW initiated fuel recovery operation on November 10,1980. Groundwater was separated from the fuel using an oil/water separator. The recovered fuel was retained for on-site reclamation, and the water from the oil/water separator was discharged via a National Pollution Discharge Elimination System (NPDES)-permitted discharge to the Mississippi River. In May 1981, recovery well G-2D was installed and used to draw down the water table providing better recovery in G-2S. Eighteen monitoring wells were installed between February and June 1981 to monitor groundwater quality related to the fuel spill. Groundwater monitoring results indicated that the spill was limited to an area around G-2S and G-2D extending to and including PW-3. Recovery wells RW-3, RW-4 and RW-5 were installed in 1981 near corresponding production wells PW-3, PW-4 and PW-5. In April 1982, pumping of both G-2S and G-2D were discontinued after approximately 20,610 gallons of diesel were recovered and diesel recovery at RW-3 was initiated. Diesel recovery from RW-4 was initiated in June 1982 and discontinued in November 1983 after recovering 20 gallons of diesel fuel. RW-5 did not yield measurable quantities of diesel and recovery was not initiated. By October 1985, approximately 86,000 gallons of diesel fuel had been recovered. Locations of the monitoring wells and the recovery wells are shown on Figure 3.
3.4 Regulatory History
The JDDW facility was identified as a potential hazardous waste site on June 5,1981. A preliminary assessment report issued in July 1983 cited an initial Hazard Ranking System (HRS) score of 34.95 (low to moderate hazard). In 1984, a site investigation was performed, and, in 1985, JDDW contracted Geraghty & Miller (now ARCADIS) to perform site studies related to the former landfill.
4
In September 1985, the agency proposed the site for inclusion on the National Priorities List (NPL). An HRS score of 28.5 is sufficient to place a,site on the NPL; however, the site was never placed on the final NPL. The agency and Deere & Company, Inc., entered into an Administrative Consent Order on September 30,1986, requiring the development of a remedial investigation/ feasibility study (RI/FS) for the site. The RI/FS process was near completion when on June 24,1988, the agency announced its new national policy in the Federal Register (53 FR 23978), whereby Resource Conservation and Recovery Act (RCRA) treatment, storage or disposal facilities would not be placed on the NPL. As a result of this policy, the agency announced its intention to remove several sites, including JDDW, from the sites proposed for the NPL. One of the main purposes of this policy was to avoid spending Superfund money at RCRA sites that are subject to the corrective action authorities of RCRA. The policy does not prohibit site cleanup from proceeding under a CERCLA Consent Decree (CD) under which the potentially responsible party (PRP) funds the work. Region 7 decided to continue to treat the facility as a Superfund site. Deere & Company, Inc., has been the sole owner and operator of the site, is the only PRP for on-site contamination and has funded the remedial work at the site to date.
The RI report was submitted to the agency in August 1988. The purpose of the RI was to collect necessary data to characterize the site and to assess the potential release of hazardous materials from waste management units, waste disposal or product leakage and/or spillage. The RI focused on potential constituent sources identified through a review of plant operations. Potential sources identified in the RI included the former landfill, the foundry (old foundry ponds), the chrome basin at the industrial wastewater treatment plant, several isolated waste oil/coolant spills, the coal storage yard and the 200,000-gallon diesel fuel line leak, which occurred in 1980. RI activities included collection of data to characterize air, surface water, sediments, surface soils, subsurface soils and groundwater quality. The floating hydrocarbon was also analyzed and it was found to be predominantly diesel fuel, with lesser concentrations of volatile organic compounds (VOCs) not typically associated with diesel fuel. It was suspected that leaks occurring prior to 1980 may have contributed to the other "non-diesel" VOCs found within the floating layer. The floating layer was renamed non-aqueous phase liquid (NAPL).
Low concentrations of VOCs were detected in the alluvial aquifer groundwater underlying the JDDW site; however, specific sources of the VOCs were not identified. Low concentrations of benzene, ethylbenzene, toluene and xylenes (BTEX) were associated with the diesel fuel spill. Low levels of chlorinated VOCs, which are not common components of diesel, were also detected in groundwater samples. The source of the chlorinated compounds was assumed to be from previous solvent handling practices at the site. The site contaminants of concern (COCs) identified during the RI are listed in Table 2.
RI analytical results were used in a risk assessment to evaluate potential threats to human health and the environment. Results of the risk assessment analysis concluded that waste disposal activities at the site did not represent an unacceptable risk to the public health and environment (Geraghty & Miller, 1990). However, there was potential future exposure of residents located east of the JDDW facility to ; groundwater containing organic contaminants related to discontinuation of pumping for long periods of time. Ecological risks were considered low during the 1990 risk assessment. The potential for adverse health effects to the terrestrial or aquatic ecosystems adjacent to the facility were considered low based on environmental and biomarker data collected.
5
4.0 REMEDIAL ACTIONS
4.1 Remedy Selection
The Record of Decision (ROD) was signed by the EPA Regional Administrator, Region 7, on September 29,1988.
The final RA specified in the ROD includes the following:
1. Developing an alternative potable water supply for the plant;
2. Extracting water from the alluvial aquifer using the existing production wells. This action maintains drawdown around the plant and landfill areas, thus protecting nearby wells and controlling contaminant releases;
3. Continuing to extract and treat NAPL from the alluvial production well PW-3;
4. Using deed restrictions to prevent inappropriate use of the plant property in the future. Future use of the current plant property will be limited to industrial activity only. In addition, water wells tapping the alluvial aquifer beneath the JDDW property would not be allowed; and
5. Developing a contingency plan which would ensure that contaminants do not migrate off-site in the event of a plant shutdown.
4.2 Remedial Action Objectives
Based on the results of the RI, three remedial action objectives (RAOs) were developed which included:
• Ensure long-term quality of the plant potable water supply; • Continue to prevent off-site migration of the potentially contaminated groundwater; • Restore groundwater quality in the alluvial aquifer.
4.3 Consent Decree and Performance Standards
In September 1989, the agency and JDDW entered into a CD requiring the development of a remedial design (RD) and implementation of RA. The performance standards, an attachment to the CD, established the guidelines for RA. The CD performance standards and the agency- approved modifications to the performance standards that have occurred since signing the CD are summarized below:
1. Develop an alternate water supply for the site.
2. Continue to extract water from the alluvial aquifer under the Site, at rates which will maintain an inward gradient condition adequate to contain contaminants and prevent migration to private wells offsite.
6
Performance standards for No. 2 are as follows:
A. Pumping rate: Simulations performed during the RI/FS estimated that a minimum pumping rate of 1.2 million gallons per day (MGD) would maintain an inward-gradient condition adequate to contain the contaminant plume in the alluvial groundwater beneath the site. The CD required that, as part of the RD phase of the work, JDDW would review the existing data and further analyze the hydrology beneath the site to more accurately estimate the minimum pumping rate required to capture the contaminated groundwater flow, and prepare a well management plan. The well management plan supersedes the 1.2 MGD guideline in the CD.
B. Maintenance and verification of hydraulic gradient: As part of the verification that contaminants are not migrating off-site, a minimum of three piezometer pairs would be used near the perimeter of the site. The monitoring well pairs and required water-level differences are listed below:
• South perimeter monitoring well pair MW-1 and MW-20S - water-level difference at least 0.10 feet;
• East perimeter monitoring well pair MW-5 (MW-5 was replaced with.MW-5N in 1994) and MW-6 - water-level difference at least 0.15 feet; and
• North perimeter monitoring well pair MW-10 and MW-1 IS - water-level difference at least 0.15 feet.
The groundwater elevation measured at the outer well of the monitoring well pair should be higher than the groundwater elevation at the inner well of the pair. The CD specified that the water levels would be measured at least once every four hours. The difference in groundwater levels at each monitoring well pair is calculated on a rolling annual average basis. In July 1997, the agency approved reducing the frequency of recording groundwater level measurements from every four hours to morithly.
The Mississippi River stage adjacent to the site would be measured on a normally scheduled working-day basis to within 0.1 feet. Although it was not specified in the performance standards, the Little Maquoketa River stage was also measured on a working-day basis. In October 2001, the agency approved reducing the stage monitoring of the Little Maquoketa River from daily to monthly at the same time as the water levels. In June 2004, the agency approved reducing the river stage monitoring of the Mississippi River to monthly at the same time as the monitoring well water levels.
The water levels should be measured on a monthly basis for the 14 shallow monitoring wells listed in Table 3 and prepare contour maps of water levels in these wells and in the Mississippi and Little Maquoketa Rivers. Water levels are also measured in Production Wells PW-3 (now PW-3A), PW-4 (now PW-4A), PW-5 and PW-7 (now PW-7A). After one year, if the water levels in the three perimeter monitoring well pairs indicated a consistent inward gradient, contour maps would be prepared on a quarterly basis for the next two years. Although quarterly contour maps are no longer required, JDDW has continued to prepare water-level maps on a quarterly basis.
7
C. Monitoring performance of the withdrawal well system: The CD required alluvial production wells PW-3 (now PW-3A), PW-4 (now PW-4A), PW-5 and PW-7 (now P-7A) and the 14 monitoring wells listed in Table 3 to be sampled quarterly for the first year and annually thereafter for the COCs listed in Table 2. In September 1998, the agency approved reducing the groundwater monitoring frequency to biennial, eliminating hexavalent chromium, lead and copper sampling from all wells and reducing the number of wells included in the monitoring program (Table 3). In June 2004, the agency approved removing MW-13D from the monitoring program.
D. Discharge of surface water from the site: The CD required JDDW to obtain a revised NPDES permit with the groundwater monitoring constituents included for sampling at Outfalls 002, 005 and 011. Outfalls 002 and 005 discharge noncontact cooling water, drinking fountain water and storm water through the north and south sedimentation-ponds, respectively. These ponds are equipped with oil skimmers. Outfall 011 discharges wastewater from a physical, chemical and biological treatment plant, which treats all process wastewater from the facility (IDNR, 1999).
E. Completion of the work. Alluvial groundwater is required to be extracted and sampled until the COCs are reduced to below the federal maximum contaminant levels (MCLs) or applicable state groundwater remediation regulations, whichever are more stringent. The state of Iowa has defined the groundwater cleanup level to be the lifetime health advisory level (HAL) if one exists. If there is no HAL, the action level is the negligible risk level (NRL). If there is no HAL or NRL, the cleanup level is equal to the MCL. For COCs for which there is no MCL or state requirement, the following regulatory sources shall be used in descending order to identify •cleanup levels:
• Proposed MCL
• The EPA Office of Drinking Water's lifetime health advisory levels
• Integrated risk information (IRIS) verified reference dose or 10"6 cancer potency factor and ingestion of 2 liters of water per day by a 70 kilogram adult \
• The agency's Office of Research and Development's health effect assessment criteria
The groundwater extraction will continue until four consecutive quarters of monitoring indicate that the alluvial water quality beneath the site has been at or below cleanup levels in effect at that time. In December 1996, the agency and IDNR approved the use of federal MCLs for those contaminants with MCLs as cleanup goals instead of the more stringent HALs and NRLs. The current groundwater performance standards identified as of February 2013 for the COCs are listed in Table 4.
3. Develop contingency plans to ensure that contaminants in the alluvial aquifer do not migrate off-site in the event of plant shutdown or modifications, which decrease pumpage rates.
4. Continue to extract nonaqueous phase liquid CNAPL") from the-alluvium and to separate the NAPL. with the groundwater effluent to be discharged through NPDES outflows and the remaining materials to be transported for off-site management at a permitted RCRA hazardous
8
waste disposal facility, unless Deere demonstrates alternative disposition measures that meet all applicable or relevant and appropriate requirements, and the EPA approves such alternative measures.
Performance standards for No. 4 are as follows:
A. NAPL management: See above.
B. Record keeping: Record volume of NAPL and volume of contaminated water withdrawn on a normal-scheduled-workweek-basis for each recovery well. NAPL thickness is measured quarterly at recovery wells RW-3 (now RW-3A), RW-4 (now RW-4A), RW-5 and G-2S and the monitoring wells listed in Table 3. SBW-4 was added to the monitoring program in the fourth quarter of 2004.
C. Monitoring performance of the NAPL withdrawal system: Alluvial production wells PW-3 (now PW-3 A), PW-4 (now PW-4A), PW-5 and PW-7 (now PW-7 A) and six monitoring wells listed in Table 3 are to be sampled quarterly for the first year and annually thereafter for BTEX and trichloroethene (TCE). These wells are monitored concurrently with performance standard 2C. In September 1998, the agency approved reducing the groundwater monitoring frequency to biennial and reducing the number of monitoring wells included in the monitoring program (Table 3).
D. Completion of work: Monitoring and recovery operations shall continue until no more than lA inch of NAPL is detected and verified in RW-3 (now RW-3A), and no more than l/8inch is detected and verified in monitoring wells MW-4, MW-6, MW-7S, MW-8S, MW-12 and MW-13S and recovery wells RW-4, RW-5 and G-2S. When ]A inch or less is detected at RW-3 (now RW-3A) and/or 1/8 inch or less is detected at any other of the above-listed wells, the well in
' question shall be purged of three well volumes and allowed to stabilize for 24 hours before a verification thickness measurement is taken.
Before certifying completion of the NAPL phase of work, the wells listed in the paragraph above will be analyzed for BTEX, TCE and total petroleum hydrocarbons. If the BTEX and TCE concentrations are below performance standards for four consecutive quarters, the NAPL extraction and treatment requirements are considered complete.
4.4 Remedy Implementation
4.4.1 Remedial Design i
The RD was started on February 7,1989, and the RD report was approved by the agency in September 1990. Pursuant to Section IV of CD paragraphs 18 and 23, Deere & Company, Inc., filed the required deed restriction and a copy of the CD with the Dubuque County recorder's office on January 19,1990. The RD report addressed implementation of the requirements set forth in the ROD and CD. The RD report included documentation on the modifications made to the JDDW potable well system and a groundwater management plan.
9
4.4.1.1 Potable Well System Modifications
Installation of an alternative potable water supply for the JDDW facility was completed in 1988. Prior to 1988, the potable water and plant process water source for the plant included groundwater from the alluvial aquifer. In 1988, JDDW separated the potable water piping from other plant process water piping and connected it solely to bedrock wells PW-1 and PW-2 installed in the lower Cambrian-Ordovician limestone aquifer. The bedrock aquifer provides higher quality water without the potential for contamination from surficial sources.
4.4.1.2 Groundwater Management Plan
The groundwater management plan included three components: a well management plan, a groundwater monitoring plan and a NAPL management plan. JDDW initiated groundwater monitoring activities required by the CD in January 1990.
The well management plan addressed the containment and recovery of impacted alluvial aquifer groundwater. The plan was developed from the RD modeling results and included alluvial production well system operating guidelines to maintain a minimum total pumping rate necessary to create an inward hydraulic gradient to prevent off-site migration of VOCs. The well management plan indicated that under extreme hydrologic conditions, the optimum minimum total pumping rates from production wells PW-4 and PW-7 required to maintain the hydraulic head differences in the three perimeter wells are 0.52 MGD and 0.37 MGD, respectively. The total minimum rate of 0.89 MGD is lower than the earlier estimated total pumping rate of 1.2 MGD derived during the RI/FS.
The well management plan also provided operating guidelines for contingency activities implemented if the alluvial production system is shutdown or modified. The plan supersedes the 1.2 MGD guideline in the CD.
During the third five-year review, JDDW evaluated and updated the well management plan. Since 1997, JDDW has been in the process of reducing the size of the facility by closing down and demolishing buildings. As a result of the process reduction, the amount of water required to operate the facility has decreased. During previous years, JDDW has needed to pump significantly more process water than the plan required to ensure that groundwater containment was achieved. With the process change, JDDW planned to reduce the water withdrawal from the alluvial aquifer to amounts that may approach the minimum requirements of the plan. The reduction in groundwater withdrawal has optimized the use of the production wells and reduced JDDW's operating costs. In March and April 2003, the groundwater model was updated7to incorporate the replacement and relocation of production wells PW-3A, PW-4A and PW-7A. The updated groundwater model was then used to update the plan to ensure that the minimum water withdrawal requirements were accurate for the current production well configuration. A memorandum that summarizes the modifications made to the existing model, as well as the revisions to the plan, was included in the Third Five-Year Review Report (ARCADIS, 2003). Using the updated plan, JDDW determined that they could use three production wells to provide water for the plant and meet the environmental requirements. JDDW decided to use PW-3A, PW-4A and PW-7A. The pump from PW-4A was placed in PW-3 A, and the PW-5 pump was placed in PW-4A. PW-5 was retained as a backup well.
The groundwater monitoring plan identified groundwater quality sampling and hydraulic monitoring to be completed for the duration of the RA and reporting requirements. The plan ensured that the RA would be effective and would prevent off-site migration of potentially contaminated groundwater and restore
10
groundwater quality in the alluvial aquifer. A contingency monitoring program was also included in the plan. The NAPL management plan presented existing and future NAPL recovery operations and reporting requirements. Table 3 summarizes the monitoring required by the groundwater and NAPL management plans.
4.4.2 Remedial Performance from Implementation in September 1990 to March 2008
The five-year reviews completed in September 1995, September 1998, September 2003 and August 2008 concluded that the response actions implemented by JDDW, together with the long-term monitoring, continue to protect the public health, welfare and the environment at the site.
During the 1994 to 2008 period, the following modifications were made to the alluvial groundwater recovery system, NAPL recovery system and groundwater monitoring network after obtaining the agency's approval:
• JDDW received approval from the agency in September 1994 to relocate MW-5 due to construction activities. This well was relocated in the fourth quarter of 1994 and was renamed MW-5N.
• PW-4 and PW-7 were replaced because water being pumped from these wells contained large volumes of sand. PW-4 was replaced with PW-4A in May 1995 and PW-7 was replaced with PW-7A in September 1995.
• RW-4 was also replaced in May 1995 with RW-4A.
• In August 1995, JDDW replaced SBW-3 with SBW-3N due to inadvertent covering of SBW-3 with concrete.
• In April 1997, JDDW received approval from the agency to relocate PW-3 and RW-3 due to changes in plant production. The old wells were abandoned on April 21,1997. The replacement wells were called PW-3A and RW-3A. The locations are shown on Figure 3.
• As recommended in the September 2003 Five-Year Review Report, a NAPL monitoring program was developed for SBW-4 which included adding this well to quarterly NAPL monitoring in 2004.
The following modifications were made to the CD performance requirements:
• In December 1996, the agency and IDNR approved the use of federal MCLs for those contaminants with MCLs as cleanup goals instead of the more stringent FLALs and NRLs.
• In July 1997, JDDW received approval from the agency to reduce the frequency of recording groundwater-level measurements at the perimeter piezometer pairs from every four hours to monthly.
• In the September 1998 Five-Year Review Report, JDDW received approval from the agency to reduce the frequency of groundwater monitoring to every two years beginning in 1998. This approval was granted because the groundwater data collected in 1998 was comparable to the 1997
11
data. Additionally, lead, copper and hexavalent chromium were eliminated from all monitoring wells sampled and the wells included in the biennial groundwater sampling events were reduced from the 18 wells specified in the CD to MW-6, MW-8S, MW-9D, MW-9S, MW-12, MW-13D, MW-13S and PW-3A, PW-4 A, PW-5 and PW-7A (Table 3).
• In June 2002, JDDW received approval from the agency to abandon MW-9D because the physical state of the well inhibited its usefulness as a monitoring well. The well could not be sampled during the 2000 and 2002 biennial events because an obstruction located approximately 25 ft below ground surface (bgs) prohibited the introduction of any variety of submersible pumps to the depth of the water table. The agency also approved the recommendation not to replace MW-9D by stating that it is apparent that there are enough other monitoring well locations from which to gather data, and, at this point in time, the cessation of sampling at MW-9D does not represent a critical loss of meaningful data especially since this location has not demonstrated contamination above MCLs. MW-9D was abandoned on August 22, 2002, in accordance with IDNR
, requirements by a licensed well contractor.
• In June 2004, JDDW received approval from the agency to remove MW-13D from the biennial groundwater sampling event and abandon the well (Table 3). It was abandoned on October 29, 2008, in accordance with IDNR requirements by a licensed well contractor. In addition, the agency approved reducing the river stage monitoring of the Mississippi River to monthly, at the same time as the monitoring well water levels. JDDW started measuring the Mississippi River stage monthly in the third quarter of 2011. v
4.4.2.1 Maintain Inward Gradient
During the September 1990 to March 2008 period, the groundwater extraction system continued to be fully operational and functional. Operation of the system created a hydraulic capture zone to contain contaminants. The system met the performance criteria for hydraulic capture of the groundwater except during the weeks of December 25,1995; December 28,1999; November 6,13 and 20, 2000; and December 3, 2000, when the weekly minimum pumping rates were 0.82, 0.91, 0.85,0.81, 0.78 and 0,72 MGD, respectively. These rates are below the 0.89 MGD minimum pumping rate specified in the water management plan and the 1.2 MGD guideline specified in the CD. During the weeks of January 15, 22 and 29, 2006; February 19 and 26, 2006; and March 5 and 19, 2006, the weekly minimum pumping rates were 1.03,0.96,1.00,1.14,1.12,1.1 and 1.05 MGD, respectively. These rates are above the 0.89 MGD minimum pumping rate specified in the plan, but below the 1.2 MGD guideline specified in the CD.
Despite the reduced pumping rate, monitoring water levels showed that an inward hydraulic gradient had been maintained. Water levels in the three piezometer pairs at the perimeter of the site consistently exhibited rolling annual average head differences greater than the minimum requirements established in the performance standards.
4.4.2.2 Performance of Withdrawal System
Between September 1990 and March 2008, groundwater quality monitoring was performed in accordance with the CD. Groundwater samples were collected in the required on-site wells (listed in Table 3) quarterly in 1990, annually between 1991 and 1998 and biennially thereafter. The tetrachloroethene (PCE) concentrations detected in MW-6, MW-9S, MW-13S and SBW-3; the TCE concentrations detected in MW-6, MW-9S, MW-13S, MW-16, PW-4 and SBW-3; and the benzene concentrations detected in
12
MW-13S, PW-3 and PW-5 have been above performance standards as shown in the summary of analytical data presented in Appendix B. As discussed above, JDDW replaced SBW-3 with SBW-3N in August 1995. Concentrations of PCE and TCE were not detected in SBW-3N and the agency approved removing this well from the monitoring program in 1998. Chromium concentrations exceeded the standard in MW-1 IS during one sampling event in February 2010.
Figures 4, 5 and 6 illustrate trends in concentrations of PCE, TCE and benzene, respectively, from September 1990 to February 2008. The following bullets summarize trend plots for MW-6, MW-9S, MW-13S, PW-3/PW-3A and PW-4/PW-4A.
• MW-6: Concentrations of PCE were not detected until 1997 when the concentration temporarily increased to above the MCL. Concentrations of PCE decreased in 1998 and have remained below the MCL. Concentrations of TCE fluctuated between 1990 and 2008. Concentrations of TCE increased to above the MCL in 1991,1993 and 2000 and subsequently decreased to below the
. MCL during the next sampling event. Concentrations increased to above the MCL in 2006 and decreased to a concentration equal to the MCL in 2008.
• MW-9S: Concentrations of PCE and TCE increased between 1990 and 1993 and then decreased to below the MCL in 1994. In 1997, PCE and TCE concentrations increased to above the MCL and decreasing trends occurred between 1997 and 2002. Concentrations of TCE and PCE decreased to belOw the MCL in 1998 and 2002, respectively, and have remained below the MCL.
• MW-13S: Concentrations of PCE decreased between 1990 and 1992 to below the MCL and concentrations remained below the MCL between 1992 and 2008. Concentrations of TCE were not detected until 1995 when the concentration temporarily increased to above the MCL. Concentrations of TCE decreased in 1996 and have remained below the MCL. Concentrations of benzene were not detected until 1992 when the concentration increased to above the MCL. Concentrations of benzene decreased to below the MCL in 1994 and a second increasing trend occurred between 1997 and 2002. Between 2002 and 2008, concentrations decreased to slightly above the MCL.
• PW-3/PW-3A: Concentrations of benzene fluctuated between 1990 and 1997. Concentrations of benzene increased to above the MCL in 1990,1991,1993 and 1996 and subsequently decreased to below the MCL. Concentrations of benzene remained below the MCL between 1996 and 2008.
• PW-4/PW-4A: Concentrations of TCE fluctuated between 1990 and 1993. Concentrations of TCE increased to above or equal to the MCL in 1990 and 1993 and subsequently decreased to below the MCL in 1991 and 1994, respectively. Concentrations-of benzene remained below the MCL between 1994 and 2008.
Between 1990 and 2008, TCE, benzene arid PCE concentrations have fluctuated, with concentrations generally declining, with the .exception of benzene in MW-13S in 2002. In 1997, increases in concentrations of PCE and TCE were detected in MW-9S and benzene in MW-13S. These concentration increases correspond to the relocation of PW-3A in 1997. It appears that the relocation of PW-3A in 1997 modified the groundwater flow path in the vicinity of MW-13S, resulting in residual benzene associated with the NAPL being drawn into the monitoring well. During subsequent sampling events, the
13
concentrations of PCE and TCE detected in MW-9S decreased to below the MCL. Concentrations of benzene detected in MW-13S increased in 2002 and exhibited a decreasing trend between 2002 and 2008.
4.4.2.3 NAPL Recovery
NAPL recovery occurred in G-2S, RW-4 and RW-3 from November 1980 to July 1991. During this time, 138,163 gallons were recovered. No measurable amounts were recovered from January 1991 through July 1991, although 3.67 million gallons of groundwater were pumped from RW-3 during this time.
Recovery operations were discontinued in July 1991; however, the recovery wells and monitoring wells listed in Table 3 have continuously been monitored for NAPL thickness as required by the CD.
Until January 1998, less than V* inch of NAPL had been measured at RW-3 since recovery operations ceased. As a result of relocating PW-3 and RW-3, approximately 4.6 inches were detected in new recovery well RW-3A in January 1998. Lab analysis shows the material is consistent with No. 6 fuel oil. The NAPL was removed in three days. Twenty-hours after removal, it was measured at a thickness less than 1/8 inch. Measurements in April 1998 showed a thickness of 0.01 feet (less than 1/8 inch), and during the five-year review site visit in May 1998, NAPL was measured at a thickness of 0.02 feet (1/4 inch). It was recorded in RW-3A during the third (0.48 feet) and fourth (0.21 feet) quarters of 1998. It was absent from RW-3A between January 1999 and October 2006. Measurements in January and April 2007 showed a thickness of 0.01 feet (less than 1/8 inch).
NAPL was detected at a thickness from a trace to 0.02 feet in MW-9S in July 2002. The well's dedicated pump motor would not operate when the biennial groundwater sampling event was conducted. The pump was removed and inspected and it was determined that the source was the dedicated pump's motor. The motor's casing had deteriorated to a point where the motor leaked some of its own oil into the well. The NAPL was removed using absorbent material, and it was not detected in the well during subsequent monitoring events.
NAPL was detected at a thickness ranging from 0.01 to 0.03 feet in MW-6 between October 1998 and July 2000. It has not been detected in since July 2000. Between 1998 and 2008, it has been sporadically measured up to 0.01 feet (approximately 1/8 inch) in MW-8S (October 1999), MW-12 (July 2004 and 2006, April 2007), MW-13S (April 2000), G-2S (October 2006, July 2007 and January 2008), RW-4A (January and July 2000) and RW-5 (April 2007). Several wells not listed in CD Performance Standard No. 4B Record Keeping have been included in the NAPL discussion presented in the quarterly reports. It has been measured up to 0.01 feet (approximately 1/8 inch) in MW-1 (April 2007) and SBW-3N (July 2007 and January 2008) and 0.02 feet in MW-20S (April 2000).
4.4.2.4 SBW-4 NAPL Monitoring
The agency had approved abandoning this well during the second five-year review; however, abandonment was delayed because 0.11 feet of NAPL was detected on May 24, 1999.aThe well was installed to a depth of approximately 25 feet bgs in the former landfill during the RI to collect samples for chemical analysis to characterize the landfill source area and assess the physical dimensions of the landfill. The well is screened across the landfill materials.
14
On May 25,1999, an absorbent sock was installed. The sock was removed and checked on May 26; approximately 4 ounces of NAPL was removed. After the sock was removed, no NAPL was detected. The well was checked in June and July 1999; no NAPL was detected. Monitoring was discontinued in July. As part of the third five-year review, the well was checked to for the presence of NAPL. On September 23, 2003, a sock was placed in the well. NAPL was present when the sock was removed from the well. In the Third Five-Year Review Report, JDDW recommended a plan detailing the NAPL monitoring program be developed and implemented.
A monitoring program was developed and a monitoring plan was submitted to the agency in the May 21, 2004, correspondence (Third Five-Year Review Report, March 1998 to September 2003, Recommendations [ARCADIS, 2004]). JDDW proposed measuring the NAPL's thickness and collecting a sample for analysis of total petroleum hydrocarbons by EPA method 8015 and semivolatile organic compounds (SVOCs) by EPA method 8270 during the June 2004 biennial groundwater sampling event. JDDW proposed installing an absorbent sock to remove the remaining NAPL after the sample was collected. After removal, JDDW proposed to monitor the well daily for one week, weekly for three weeks and monthly for a quarter to assess the infiltration rate, then quarterly during the NAPL monitoring program.
The plan was implemented during the June 2004 biennial monitoring. Due to its highly viscous nature, NAPL thickness could not be measured with an oil/water interface probe. As the probe was lowered into the well, it became coated with NAPL and the probe's sensors could not take readings. A bailer was used to collect NAPL samples for laboratory analysis. Based on the amount present in the bailer, it was estimated that 0.6 feet of NAPL was present on June 8. After the laboratory sample was collected, an absorbent sock was used to remove the NAPL. JDDW had proposed monitoring the well daily for one week, weekly for three weeks and monthly for a quarter to assess the infiltration rate. However, this monitoring was not performed due to the inability of the probe to measure the thickness of the NAPL. Beginning in the fourth quarter of 2004, JDDW proposed to monitor the thickness quarterly by replacing the sock in during the quarterly monitoring program.
The sample was analyzed for SVOCs and was also submitted for a fingerprint evaluation using gas chromatography with a flame ionization detector by Core Laboratories of Houston, Texas. The fingerprint evaluation indicated,. "The sample appears to be hydrocarbon based with the predominant constituents eluting in a range of molecular weights, typically associated with normal decane (nCIO) to beyond pentatriacontanes (nC35+)." The majority of the fingerprint elutes between the C15 and C35 ranges as a typical hydrocarbon "hump." Pristane and phytane peaks are present in the chromatogram, and both compounds are normally associated with hydrocarbons. Phytane is considered to be the product of the "diagenesis of phytol at low pressures and temperatures from naturally occurring organic deposits." Both compounds are commonly found in unrefined crude oils and may be used as biomarkers for geochemical interpretations.
The analysis identified concentrations of bis(2-ethylhexyl) phthalate (100 milligrams per kilogram [mg/Kg]), pentachlorophenol (170 mg/Kg), 2-methylnaphthalene (1.5 mg/Kg) and naphthalene (0.37 mg/Kg). No other SVOCs were detected above the reporting limits that were attainable due to the elevated concentrations of some of the target compounds.
The well was added to the quarterly monitoring program beginning in the fourth quarter of 2004. It was monitored monthly during this quarter. The absorbent sock that was placed in the well in June 2004 was removed in October 2004 and approximately 1.19 feet of NAPL was present, it was not present in
15
1
November 2004, and 0.01 feet was present in December 2004. During each of these monitoring events, the sock was removed and then reinstalled in the well. After the NAPL was removed, the sock was replaced.
The well was also monitored monthly during the first and second quarters of 2005. Beginning in the third quarter of 2005, the well was monitored quarterly. The results of the monitoring are presented in Table 10. During the November 2004 to January 2008 period, NAPL thickness in the well, for the most part, was 0.01 feet or not detected.
4.4.2.5 Discharge of Surface Water from Site
The site has multiple permitted outfalls with various monitoring requirements and discharge limits, which are listed in the 1999 NPDES permit presented in Appendix C. Surface water discharge through the NPDES-permitted outfalls to the Mississippi River and the Little Maquoketa River are monitored and reported in monthly wastewater monitoring reports in accordance with the permit for the JDDW facility. Only Outfalls 002, 005 and 011 were identified by the CD for monitoring discharges for the COCs. The discharge from Outfalls 005 and 006 are combined and referred to as Outfall 801 in the permit.
The March 5,1991, NPDES permit amendment required that Outfalls 002 and 005 be monitored monthly for copper and quarterly for total toxic organic (TTO) pollutants. The TTO pollutant list is comprised of the site COCs (Table 2). The permit established copper limits for Outfall 002 (0.071 milligrams per liter [mg/L], 0.39 pounds per day [lbs/day]) and Outfall 005 (0.04 mg/L, 3.004 lbs/day). Additionally, the effluent limitations for metal finishing, which include copper, lead, hexavalent chromium and TTO pollutants were added for Outfall 011 (Table 5). Outfalls 002 and 005 were analyzed for copper and TTO pollutants in July 1992.
Copper levels identified in Outfalls 002 (0.01 mg/L, 0.07 lbs/day) and 005 (0.01 mg/L, 0.35 lbs/day) in July 1992 did not exceed established effluent limitations (USEPA, 1995). The TTO constituents identified in Outfalls 002 (0.042 mg/L, 0.277 lbs/day) and 005 (0.041 mg/L, 1.269 lbs/day) were all BTEX compounds (USEPA, 1995).
A revised permit was issued by IDNR for the facility on September 3,1992. The final effluent from Outfall 011 was required to be analyzed once every six months for TTO pollutants. The TTO effluent limit for Outfall 011 is listed on Table 5. The inorganic COCs including lead, copper and hexavalent chromium were required to be analyzed two times a week. IDNR did not consider it necessary to continue to monitor Outfalls 002 or 005 for copper and TTO pollutants. Amendments to the September 3 permit were issued on January-21,1994, and August 14,1995. The effluent limitations set for lead, copper and hexavalent chromium at Outfall 011 in the September 3 permit and in the August 14 revision to the permit are listed in Table 5. The revised permit expired on September 1,1997, and at IDNR's direction, JDDW continued operating under this permit until a new permit was issued on July 15,1999.
Outfalls 002 and 005 are regularly monitored for flow rate, oil and grease, pH and temperature. The combined flow from Outfalls 005 and 006, referred to as Outfall 801 in the NPDES permit, and Outfall 002 are also monitored for Acute Toxicity of Ceriodaphnia and Acute Toxicity of Pimephales. Effluent limitations and monitoring requirements for these parameters are set in the NPDES permits. Between September 1990 and July 1999, none of the parameters monitored in Outfall 005 exceeded the effluent limitations. Beginning in February 1994, Outfall 002 was also monitored for total residual chlorine in
16
accordance with a January 21,1994, amendment to the permit, which took effect August 1,1994. At Outfall 002, the daily maximum total residual chlorine effluent limitation was slightly exceeded during one week in May 1999.
During the September 1990 to July 1999 period, all concentrations of lead, copper and hexavalent chromium detected at Outfall Oi l were below the permitted discharge limits except for four days in April 1995 when hexavalent chromium exceeded the effluent limitation and one day in July 1994 when lead exceeded the effluent limitation. None of the TTO COCs were detected at Outfall Oi l during this period. Outfall 011 is also regularly monitored for flow rate, biochemical oxygen demand (BOD5), total suspended solids, pH, temperature, cadmium, total chromium, cyanide, nickel, lead, oil and grease, silver and zinc. Total chromium exceeded effluent limitations three days in April 1995 and BOD5 exceeded effluent limitations one day in November 1992 and one day in October 1993. All other constituents monitored at Outfall O i l did not exceed the effluent limitations set in the permit.
A new permit was issued on July 15,1999, and expired on July 14, 2004. At IDNR's direction, JDDW continued to operate under this permit until a new permit was issued. The July 1999 permit is included as Appendix C. The following modifications were made in the permit:
• The hexavalent chromium monitoring requirement was removed for Outfall 011 in the July 1999 NPDES permit. (Note: The source of hexavalent chromium at JDDW was eliminated when the chrome electroplating operation was discontinued in October 1994. The electroplating equipment was physically removed from the site in January 1996.)
• The monitoring frequency for cadmium, total chromium, copper, lead, nickel and zinc at Outfall 011 was reduced from twice a week to quarterly.
• The temperature effluent limits were eliminated for Outfalls 002, 005 and 011.
The NPDES effluent Outfall 011 limitations for the COCs and sampling frequency are listed in Table 5.
Between July 1999 and March 2008, none of the parameters monitored at Outfall 005 exceeded the effluent limitations set forth in the July 1999 permit. At Outfall 002, the monthly average flow rate exceeded the effluent limitations in May, June and July 2002. In Outfall 011, concentrations of lead, copper and TTO COCs were identified at levels below the permitted discharge limits. Outfall 011 is also regularly monitored for flow rate, BOD5, total suspended solids, pH, temperature, cadmium, total chromium, cyanide, nickel, oil and grease, silver and zinc. None of these constituents exceeded effluent limitations except for the daily maximum flow rate in March 2001.
4.4.2.6 Institutional Control Implementation
On January 19, 1990, Deere & Company, Inc., filed the required deed restriction and a copy of the CD with the Dubuque County recorder's office. Pursuant to the CD, the deed restriction stated in the event of conveyance of all or any portion of the site, the restrictions shall run with the land and be binding upon all successors in title. These restrictions include (1) prohibit use of the site and adjacent areas A and B for residential or agricultural purposes; (2) prohibit use of adjacent area B for residential purposes; and (3) prohibit the construction, installation, maintenance or use of any alluvial wells on-site and on adjacent areas A and B for the purpose of extracting water for human drinking purposes or for irrigation of food and feed crops.
17
4.4.3 Systems Operations/Operation and Maintenance
Since the alluvial aquifer groundwater recovery system at the site is the plant production well system, the operation and maintenance (O&M) of the system includes general activities associated with plant operations. Consequently, consistent O&M of the extraction system is ensured. The costs associated with maintaining the system are included in the plant's operating budget. O&M costs for the RA include costs for hydraulic and groundwater quality monitoring, administrative services and reporting and the alternate water supply. Since these costs were not compiled in the previous five-year review report and cannot be used to indicate potential remedy problems, these costs were riot included in this five-year review report.
Since 1997, JDDW has been in the process of reducing the size of the facility demolishing buildings. As a result of the process reduction, the amount of water required to operate the facility has decreased. During previous years, JDDW has needed to pump significantly more process water than the well management plan required to ensure that groundwater containment was achieved. The reduction in groundwater withdrawal has optimized the use of the production wells and reduced JDDW's operating costs. During the third five-year review, JDDW evaluated and updated the plan. Using the updated plan, JDDW determined that they could use three production wells to provide water for the plant and meet'the environmental requirements. JDDW decided to use PW-3A, PW-4A and PW-7A. The pump from PW-4A was placed in PW-3A and the PW-5 pump was placed in PW-4A. PW-5 was retained as a backup well.
5.0 PROGRESS SINCE THE LAST REVIEW
The August 2008 Five-Year Review Report stated:
...the selected remedy remains protective of human health and the environment and complies with Federal and State requirements that are applicable or relevant and appropriate to this remedial action. Therefore, this remedy continues to be protective of human health and the environment.
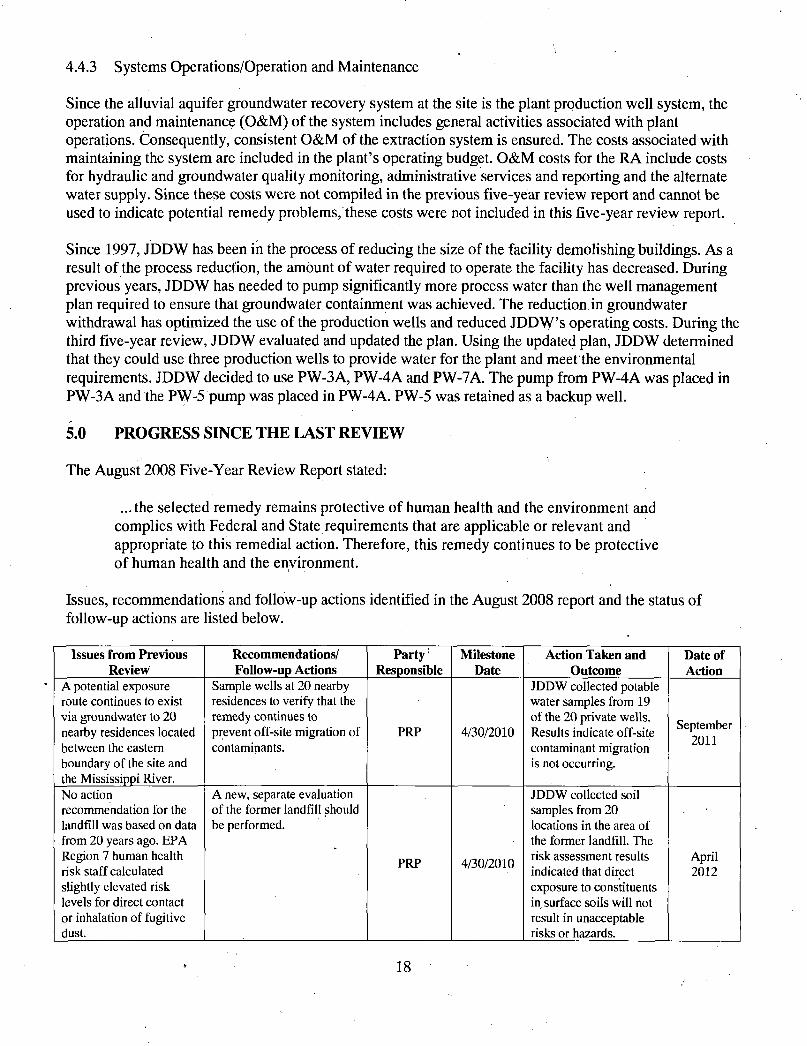
Issues, recommendations and follow-up actions identified in the August 2008 report and the status of follow-up actions are listed below.
Issues from Previous Review
Recommendations/ Follow-up Actions
Party Responsible
Milestone Date
Action Taken and Outcome
Date of Action
A potential exposure route continues to exist via groundwater to 20 nearby residences located between the eastern boundary of the site and the Mississippi River.
Sample wells at 20 nearby residences to verify that the remedy continues to prevent off-site migration of contaminants.
PRP 4/30/2010
JDDW collected potable water samples from 19 of the 20 private wells. Results indicate off-site contaminant migration is not occurring.
September 2011
No action recommendation for the landfill was based on data from 20 years ago. EPA Region 7 human health risk staff calculated slightly elevated risk levels for direct contact or inhalation of fugitive dust.
A new, separate evaluation of the former landfill should be performed.
PRP 4/30/2010
JDDW collected soil samples from 20 locations in the area of the former landfill. The risk assessment results indicated that direct exposure to constituents in surface soils will not result in unacceptable risks or hazards.
April 2012
18
I
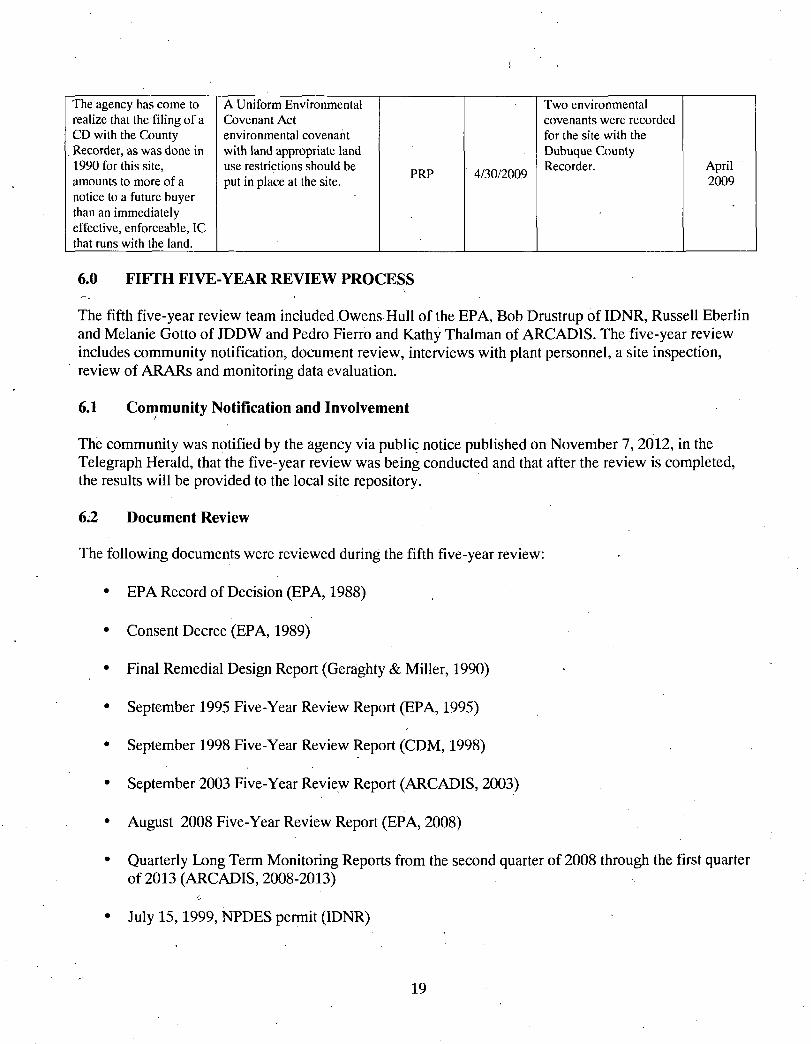
The agency has come to A Uniform Environmental Two environmental realize that the filing of a Covenant Act covenants were recorded CD with the County environmental covenant for the site with the
. Recorder, as was done in with land appropriate land Dubuque County 1990 for this site, amounts to more of a
use restrictions should be put in place at the site.
PRP 4/30/2009 Recorder. April
2009 notice to a future buyer than an immediately effective, enforceable, IC that runs with the land.
6.0 FIFTH FIVE-YEAR REVIEW PROCESS
The fifth five-year review team included Owens Hull of the EPA, Bob Drustrup of IDNR, Russell Eberlin and Melanie Gotto of JDDW and Pedro Fierro and Kathy Thalman of ARCADIS. The five-year review includes community notification, document review, interviews with plant personnel, a site inspection, review of ARARs and monitoring data evaluation.
6.1 Community Notification and Involvement
The community was notified by the agency via public notice published on November 7, 2012, in the Telegraph Herald, that the five-year review was being conducted and that after the review is completed, the results will be provided to the local site repository.
6.2 Document Review
The following documents were reviewed during the fifth five-year review:
• EPA Record of Decision (EPA, 1988)
• Consent Decree (EPA, 1989)
• Final Remedial Design Report (Geraghty & Miller, 1990)
• September 1995 Five-Year Review Report (EPA, 1995)
• September 1998 Five-Year Review Report (CDM, 1998)
• September 2003 Five-Year Review Report (ARCADIS, 2003)
• August 2008 Five-Year Review Report (EPA, 2008)
• Quarterly Long Term Monitoring Reports from the second quarter of 2008 through the first quarter of 2013 (ARCADIS, 2008-2013)
• July 15,1999, NPDES permit (IDNR)
19
• JDDW NPDES Database for monthly NPDES Reports was used to determine exceedances of effluent limitations for the period April 2008 to March 2013
• John Deere Dubuque Works Five-Year Review Investigation Work Plan (ARCADIS, August 2011)
• Former Landfill Human Health Risk Assessment (ARCADIS, 2012 [Revised November 2012])
• JDDW documents sent by the agency in electronic format on March 21, 2013, to the Carnegie-Stout Public Library.
The following ARARs documents were reviewed:
• Federal Clean Water Act/Safe Drinking Water Act (federal MCLs)
• The agency's Office of Drinking Water lifetime health advisory levels
• IRIS verified reference dose or 10"6 cancer potency factor and ingestion of 2 liters of water per day by a 70 kilogram adult
• The agency's Office of Research and Development health effects assessment criteria
• Iowa groundwater remediation regulations (Iowa Environmental Protection Commission, Chapter 133, Rules for Determining Cleanup Actions and Responsible Parties).
i
A detailed document list is presented in Appendix A.
6.3 Data Review
Data reviewed during the five-year review included groundwater withdrawal amounts, water-level data, groundwater quality data and NAPL recovery and surface water discharge data collected between April 2008 and March 2013. This data was compared to the site performance standards specified in the CD.
6.3.1 Groundwater Withdrawal
From April 2008 to March 2013, the groundwater extraction system continued to be fully operational and functional. Operation of the system created a hydraulic capture zone to contain contaminants. The volume of groundwater pumped out of production wells has exceeded the 0.89 MGD minimum pumping rate specified in the water management plan and the 1.2 MGD guideline specified in the CD, except during the weeks of November 22, 2009, and February 7 and 14, 2010, when the minimum weekly pumping rates were 1.15,1.01 and 1.03 MGD, respectively. These rates are below the 1.2 MGD guideline specified in the CD. As discussed above, the well management plan supersedes the 1.2 MGD guideline in the CD. Table 6 presents a summary of the well-pumping rates.
Despite the reduced pumping rate, monitoring water levels showed that an inward hydraulic gradient had been maintained. Water levels in the three piezometer pairs at the perimeter of the site have consistently
I 20
exhibited rolling annual average head differences greater than the minimum requirements established in the CD performance standards. A summary of the rolling head differences at each of the three piezometer pairs is provided in Table 7.
6.3.2 Surface Water
The site has multiple permitted outfalls with various monitoring requirements and discharge limits, which are listed on the July 1999 NPDES permit (Appendix C). Surface water discharge through the permitted outfalls to the Mississippi River and the Little Maquoketa River has been monitored and reported in monthly wastewater monitoring reports in accordance with the permit for the JDDW facility. The site COCs are monitored in Outfall O i l as specified by the CD. -
As discussed previously, a revised permit was issued by IDNR for the facility on July 15,1999. The revised permit expired on July 14, 2004, and at IDNR's direction, JDDW is continuing to operate under this permit until a new permit is issued. The July 1999 permit is included as Appendix C. The NPDES effluent Outfall Oi l limitations for the COCs and sampling frequency are listed in Table 5.
Outfalls 002, 005 and 006 are regularly monitored for flow rate, oil and grease and pH. The combined flow from Outfall 005 and 006, referred to as Outfall 801 in the NPDES permit and Outfall 002 are also monitored for Acute Toxicity of Ceriodaphnia and Acute Toxicity ofPimephales. Outfall 002 is also monitored for total residual chlorine. None of the parameters monitored at Outfall 002, 005 and 006 have exceeded the effluent limitations set forth in the July 1999 permits during the past five years.
In accordance with the permit, the final effluent from Outfall 011 was analyzed once every six months for TTOs. The inorganic COCs including lead and copper were analyzed quarterly. In Outfall 011, concentrations of lead and copper were identified at levels below the permitted discharge limits (Table 5). Outfall 011 was analyzed for TTO COCs in April and October 2008, 2009, 2010, 2011 and 2012. The wastewater monitoring data reviewed from April 2008 to March 2013 indicate the TTO concentrations were below effluent limitations.
Outfall 011 is also regularly monitored for flow rate, BOD5, total suspended solids, pH, temperature, cadmium, total chromium, cyanide, nickel, oil and grease, silver and zinc. None of these constituents, except for BOD5, exceeded effluent limitations during the five-year review period. BOD5 concentrations exceeded the permit limits twice in March 2011 due to wastewater originating off-site.
6.3.3 NAPL
NAPL operations were discontinued on July 21,1991; however, NAPL thickness has been continuously monitored quarterly at the well locations listed in Table 3. As recommended in the September 2003 Five-Year Review Report, a monitoring program was developed for well SBW-4, which included adding this well to the quarterly monitoring in 2004. This section discusses the quarterly monitoring and SBW-4 NAPL monitoring performed between April 2008 and March 2013.
NAPL has only been sporadically measured up to 0.01 feet (approximately 1/8 inch) in monitoring wells MW-7S (January and April 2009, April 2010), MW-8S (April 2009 and 2010), MW-12 (October 2010), MW-13S (April 2008), G-2S (January 2009, July 2010 and 2011), RW-3A (July 2009) and RW-5 (April and July 2008) (Table 9). Several wells not listed in CD performance standard No. 4(b) Record Keeping
21
have been included in the NAPL discussion presented in the quarterly reports. NAPL was measured up to 0.01 feet (approximately 1/8 inch) in three of these wells: MW-11S (October 2010), MW-20S (April 2008, and SBW-3N (April 2008, 2009, 2010, and 2011).
The SBW-4 monitoring plan was implemented during the June 2004 biennial monitoring. The results of the monitoring performed between 2008 and 2013 are presented in Table 10. NAPL measurements have predominately been at or below 0.01 feet in well SBW-4 since 2007. During the March 2012 monthly inspection/monitoring event, a field decision was made by JDDW to temporarily remove the absorbent sock to assess the fluctuation and infiltration rate of NAPL over time. During the month of March 2012, JDDW monitored the NAPL in this well weekly for two weeks and then biweekly. No significant changes were noted in thickness during this time period. During the second, third and fourth quarterly reporting periods of 2012, JDDW monitored thicknesses in this well monthly without the presence of the sock and no significant changes were observed.
6.3.4 Groundwater Quality
In June 2010, February and June 2011 and October/November 2012, groundwater samples were collected from monitoring wells MW-6, MW-8S, MW-9S, MW-12, MW-13S and alluvial production wells PW-3A, PW-4A, PW-5 and PW-7A (Table 3). JDDW performed confirmatory groundwater sampling events in February and June 2011 to determine if COC concentrations detected remained below MCLs.
A summary of the analytical data is presented in Appendix B. Wells that have COC detections above federal MCLs are listed in Table 8. Contaminants that have been above MCLs during the last five years of monitoring include TCE and benzene. All other COCs have been below MCLs for the last five years.
Figures 4, 5 and 6 illustrate the trends in concentrations of PCE, TCE and benzene in the alluvial aquifer from 1990 to 2012. Between 1990 and 2012, TCE, benzene and PCE concentrations fluctuated with concentrations generally declining with the exception of TCE in MW-6. In 1997, increases in concentrations of PCE and TCE were detected in MW-9S and benzene in MW-13S. During subsequent sampling events, the concentrations of PCE and TCE detected in MW-9S decreased to below the MCL. These concentration increases correspond to the relocation of well PW-3 A in 1997.
Between 1990 and 1997, the benzene concentrations detected in MW-13S exceeded the MCL only during one sampling event (September 1992). The concentrations of benzene detected in MW-13S began to increase after ell PW-3 was replaced with PW-3 A, which occurred in 1996 (Figure 6, Appendix B). It appears that the relocation of PW-3A modified the groundwater flow path in the vicinity of MW-13S, resulting in residual benzene associated with the NAPL being drawn into the monitoring well. The concentrations of benzene detected in MW-13S increased from 19 micrograms per liter (fig/L) in August 2000 to 130 u,g/L in June 2002. Concentrations of benzene detected in MW-13S exhibited a decreasing trend between 2002 and 2010 with concentrations decreasing to below the detection limit. In November 2012, concentrations increased to 12 u,g/L. Concentrations of TCE detected in MW-6 fluctuated between 1990 and 2012. Concentrations of TCE increased to above the MCL in 1991,1993, 2000, 2006 and June 2011 and subsequently decreased to equal to or below the MCL during the next sampling event. The increase in TCE concentrations may be due to fluctuations in the water table caused by variations in the groundwater withdrawal from the alluvial aquifer and flooding of the Mississippi River.
JDDW collected potable water samples from 19 private wells located east of the site from September 26 through 29, 2011. The analytical results were consistent with the performance standards for the site.
22
Estimated concentrations of site COCs were detected in two wells. However, detections were well below cleanup standards. Groundwater elevations collected at the site have consistently indicated an inward hydraulic gradient is maintained by the production wells verifying that COCs could not have migrated off-site potentially impacting the private wells.
6.4 Systems Operations/Operation and Maintenance
Since the alluvial aquifer groundwater recovery system at the site is the plant production well system, the O&M of the system includes general activities associated with plant operations. Consequently, consistent O&M of the extraction system is ensured. The costs associated with maintaining the system are included in the plant's operating budget. O&M costs for the RA include costs for hydraulic and groundwater quality monitoring, administrative services and reporting and the alternate water supply. Since these costs were not compiled in the previous five-year review report and cannot be used to indicate potential remedy problems, these costs were not included in this five-year review report.
In 2010, a multiphase project was initiated to improve performance and optimize pumping at wells PW-3A, PW-4A and PW-7A. The project allowed for nonpotable well system automation and reliability improvements. The critical aspects of this project are outlined below:
• Common pumps were purchased for PW-3A, PW-4A and PW-7A to replace the obsolete pumps that were in use at the time of the project initiation.
• Variable frequency drives were installed on all wells to improve energy efficiency and enable automated control of the pumping.
• A dual electric feed was installed to PW-4A to allow operation during power outages.
• A control system was installed allowing for remote access and programming operation. Automatic t modulating valves were installed and tied into the well control system, enabling the system to
increase water withdrawal during low demand periods and maintain the inward hydraulic gradient.
The establishment of the new production well control system has provided increased reliability that minimum pumping requirements are met and that the corresponding hydraulic gradient is maintained.
6.5 Environmental Covenant Review
In 2009, as recommended in the 2008 Five-Year Review Report, environmental covenants were placed on the site pursuant to the Iowa Uniform Environmental Covenants Act, Iowa Code Chapter 4551. These covenants have been recorded with the Dubuque County recorder's office and were established to enhance the future enforceability and permanence of the existing deed restrictions. These environmental covenants are perpetual and will run with the property as provided in Iowa Code Chapter 4551 until modified or terminated.
6.6 Site Inspection
On November 2, 2012, Owens Hull of the EPA and Russell Eberlin and Melanie Gotto of JDDW conducted the site inspection to evaluate components of the remediation with respect to the CD and
23
decision documents. The Site Inspection Check List is presented in Appendix D. The purpose of the inspection was to assess the protectiveness of the remedy, including the presence of fencing to restrict site access and the condition of the site monitoring wells.
The selected remedy includes developing an alternate water supply for the plant, maintain an inward hydraulic gradient using production wells to prevent off-site contaminant migration, extract and treat NAPL and implement deed restrictions to prevent inappropriate land use in the future. The remedy is functioning as intended and protective of human health.
No significant issues were identified during the site inspection. The production and monitoring wells at the site are in good condition and well maintained. The site perimeter fence as well as an environmental covenant placed on-site ensures ICs are maintained. Periodic monitoring is also conducted to ensure current and long-term protectiveness of the remedy is maintained.
On November 2, 2012, the agency went to the local site repository to evaluate record keeping. The agency found that the JDDW documents were no longer present at the Carnegie-Stout Public Library in Dubuque. The documents included in the site repository in February 4, 2008, are listed in Appendix A. On March 29, 2013, the agency sent an electronic version of the entire administrative record to the public repository for the site.
6.7 Interviews
Mr. Hull conducted interviews about the O&M of the site remedy with Russell Eberlin and Melanie Gotto of JDDW on November 2,2012. Mr. Eberlin stated he did not have any major concerns regarding the site. He did have some suggestions to consider during the review process including abandonment of monitoring wells that have historically met cleanup criteria as well as opportunities to reduce the NAPL monitoring frequency. He stated the facility is in compliance with all required permits and the remedy is operating as intended. Ms. Gotto stated she did not have any major concerns regarding the site. She agreed there are ways to optimize the sampling events and stated the remedy remains effective and is operating as intended.
Mr. Hull conducted a telephone interview with Kathy Thalman of ARCADIS on January 29, 2013. Ms. Thalman stated the remedy is effective at maintaining an inward gradient and there are no indicators of off-site migration based on recent sampling. She did not have any major concerns regarding the effectiveness of the remedy.
Mr. Hull conducted an interview with Bob Drustrup of IDNR on October 11, 2012. Mr. Drustrup did not indicate he had any concerns regarding the site. He stated the remedy remains protective. The interview documentation form and interview records are presented in Appendix D.
7.0 TECHNICAL ASSESSMENT
The following section states three questions and answers as they pertain to the protectiveness statement.
7.1 Question A
Is the remedy functioning as intended by the decision document? Yes.
24
The review of the documents, ARARs, risk assumptions, environmental monitoring data, remedy performance data and the results of the site inspection indicate that the remedy is functioning as intended by the ROD. The JDDW groundwater extraction system is fully operational and functional. Operation of the system creates a hydraulic capture zone that contains and withdraws the contaminated groundwater. All progress reports submitted to date indicate that an inward hydraulic gradient has been maintained. During the 2013 groundwater sampling event, concentrations of COCs were below agency MCLs in all wells included in the groundwater monitoring program except MW-13S and MW-6. The TTO, lead and copper concentrations detected in Outfall Oi l did not exceed NDPES effluent limits. Environmental covenants have been imposed on the site to enhance the groundwater and land use restrictions. These have been recorded at the Dubuque County recorder's office.
7.2 Question B
Are the exposure assumptions, toxicity data, cleanup levels and RAOs used at the time of the remedy selection still valid? No.
Changes in Standards and TBCs
• Have there been changes to risk-based cleanup levels or standards identified as ARARs in the ROD that call into question the protectiveness of the remedy? The CD requires that extraction of the NAPL plume and groundwater monitoring continue until concentrations of the COCs fall below federal MCLs or applicable Iowa groundwater remediation regulations. The COCs identified in the CD include 14 VOCs (benzene; carbon tetrachloride; chloroform; 1,1-dichloroethane; 1,1-dichloroethene; 1,2-DCE; ethylbenzene; 1,1,2,2-tetrachloroethane; tetrachloroethene; toluene; 1,1,1-trichloroethane; 1,1,2-TCA; trichloroethene and xylene), and three metals (hexavalent chromium, copper and lead). There have been updates to water quality standards since the 1988 ROD was issued.
• Are there newly promulgated standards that call into question the protectiveness of the remedy? The agency is not aware of any new groundwater standards that would call into question the protectiveness of the remedy.
• Have To Be Considereds (TBCs) used in selecting cleanup levels at the site changed in a way that could affect the protectiveness of the remedy? TBCs were not used in selecting cleanup levels for the site.
Changes in Exposure Pathways
• Has land use or expected land use on or near the site changed (for example, industrial to residential, commercial to residential)? Land use has not changed at the site since the last five-year review, and the agency is not aware of any potential future land use changes. However, a potential exposure pathway continues to exist via groundwater to the 20 nearby residences located between the eastern boundary of the site and the Mississippi River. As a result of a ' recommendation of the Fourth Five-Year Review Report, 19 of the 20 private alluvial wells were sampled in 2011. Results of this sampling event indicated that the remedy is continuing to prevent site contaminants from migrating off-site and affecting the nearby residences.
25
It was also noted in the Fourth Five-Year Review Report that capping-of the former landfill was apparently not a component of the RA. The RI report stated:
Fugitive dust generation at the former landfill and foundry sands area is controlled to some extent by dust suppression programs and the planting of grasses/at the foundry sands area. However, at present there are large areas of open soils that can result in dust generation under high wind conditions.
Because of this, during the previous five-year review, a simple screening level risk evaluation of the former landfill surface soil was conducted, and slightly elevated risk levels for direct contact or inhalation of fugitive dust for a number of contaminants was determined.
To more adequately evaluate this potential risk, additional surface soil data were collected in 2011, and a human health risk assessment was performed to evaluate the potential current and future risks and hazards to human health associated with contaminants detected in soil at the site's former landfill. The results of the risk assessment, completed in 2012, concluded that there were no unacceptable risks or hazards from direct exposure to contaminants in the surface soils.
• Have any human health or ecological routes of exposure or receptors changed or been newly identified (for example, dermal contact where none previously existed, new populations or species identified on-site or near the site) that could affect the protectiveness of the remedy? The agency is not aware of any new routes of exposure or new receptors. However, a screening level ecological risk assessment (SLERA) needs to be conducted to determine if any ecological exposure pathways exist.
• Are there newly identified contaminants or contaminant sources? The available data do not indicate any new contaminants or contaminant sources.
• Are there unanticipated toxic by-products of the remedy not previously addressed by the decision documents (for example, by-products not evaluated at the time of remedy selection)? The agency is not aware of any unanticipated toxic byproducts.
• Have physical site conditions (changes in anticipated direction or rate of groundwater flow) or the understanding of these conditions (changes in anticipated direction or rate of groundwater flow) changed in a way that could affect the protectiveness of the remedy? The RA alternative selected in the ROD requires that the facility's production wells be pumped at a rate sufficient to create an inward hydraulic gradient that would minimize the potential for off-site migration of groundwater contamination. Based on the private alluvial well sampling conducted in 2011, there is no indication that groundwater contamination beneath the facility has migrated off-site.
Changes in Toxicity and Other Contaminant Characteristics
• Have toxicity factors for COCs at the site changed in a way that could affect the protectiveness of the remedy? Toxicity values have changed for many of the site contaminants since the baseline risk assessment and ROD were completed.
26
Hexavalent chromium has been detected iri groundwater samples at the site (Appendix B), and it is recommended that these concentrations be compared to hexavalent chromium screening levels which have decreased significantly due to a new oral cancer slope factor (EPA, 2010). The carcinogenic tapwater screening level for hexavalent chromium is 0.031 ug/L and is based on an excess lifetime cancer risk of 1E-06 (EPA, 2012b).
Hexavalent chromium reporting limits (less thanlO pg/L) and concentrations detected in groundwater samples were found to exceed the hexavalent chromium tapwater screening level and were outside the 1E-04 target carcinogenic risk range. However, because the. local aquifer is no longer being used as a drinking water source (and water wells tapping the alluvial aquifer beneath the site are not allowed), the elevated chromium does not adversely affect the protectiveness of the remedy.
• Have other contaminant characteristics changed in a way that could affect protectiveness of the remedy? The agency is not aware, of any other changes to contaminant characteristics that could impact the protectiveness of the remedy.
Changes in Risk Assessment Methods
• Human Health Risk Assessment: Have standardized risk assessment methodologies changed in a way that could affect the protectiveness of the remedy? The agency has significantly revised its dermal risk assessment guidance since the completion of the original risk assessment (EPA, 2004). Region 7 also uses a different approach when estimating the health risks from inhalation of VOCs during household use of contaminated groundwater (bathing, showering, cooking, etc.) (EPA, 2009a). In addition, several exposure assessment input parameters in.the original risk assessment are slightly different from values currently used. The agency also now uses the IEUB Model and the Adult Lead Methodology to evaluate potential health risks from lead, and to help establish cleanup levels in soil. The agency has also developed and implemented risk assessment guidance which evaluates the vapor intrusion pathway. (Note: the human health risk assessment completed in 2012 that evaluated the potential current and future risks and hazards to human health associated with contaminants detected in soil at the site's former landfill did follow the most recent agency risk assessment methods). Finally, the agency has changed its cancer risk assessment methodology for contaminants suspected of being carcinogenic via a mutagenic mode of action. Despite these changes in risk assessment methodology, the protectiveness of the remedy is not expected to be adversely affected.
• Ecological Risk Assessment: Have standardized risk assessment methodologies changed in a way that could affect the protectiveness of the remedy? Yes. The agency now uses the Ecological Risk Assessment Guidance for Superfund: Process for Designing and Conducting Ecological Risk Assessments (EPA, 1997). To determine protectiveness, a SLERA needs to be conducted to evaluate if any ecological exposure pathways exist.
Question C
Has any other information come to light that would call into question the protectiveness of the remedy? Yes.
27
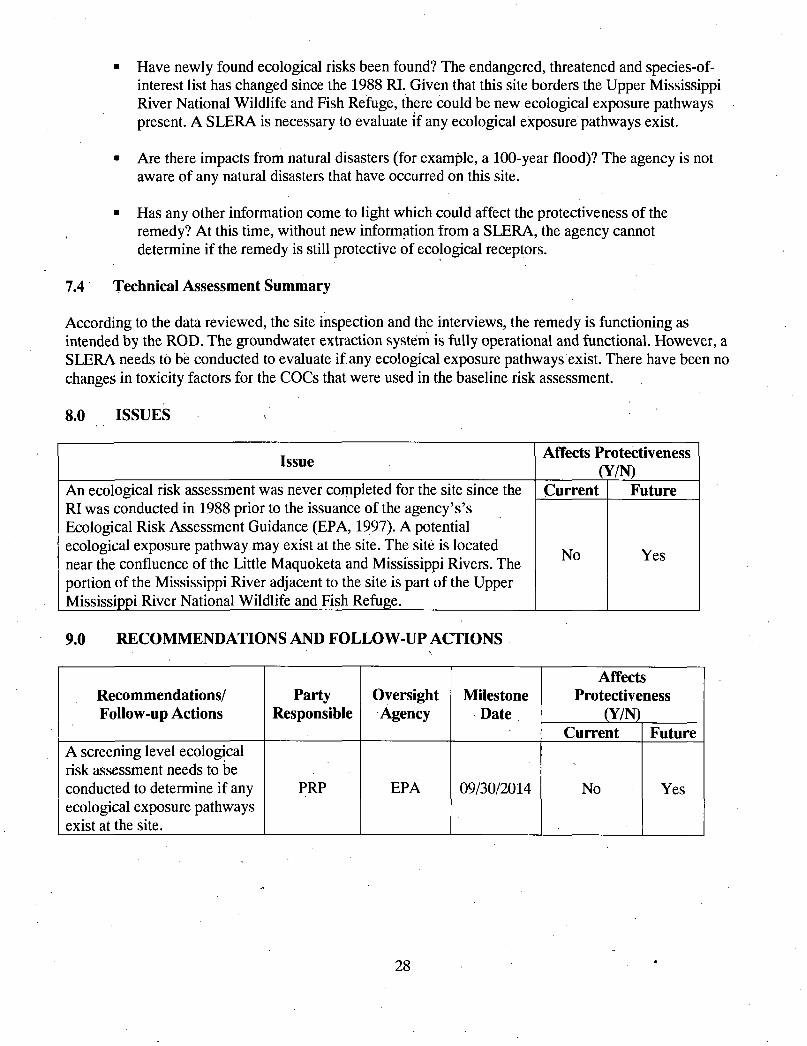
• Have newly found ecological risks been found? The endangered, threatened and species-of-interest list has changed since the 1988 RI. Given that this site borders the Upper Mississippi River National Wildlife and Fish Refuge, there could be new ecological exposure pathways present. A SLERA is necessary to evaluate if any ecological exposure pathways exist.
• Are there impacts from natural disasters (for example, a 100-year flood)? The agency is not aware of any natural disasters that have occurred on this site.
• Has any other information come to light which could affect the protectiveness of the remedy? At this time, without new information from a SLERA, the agency cannot determine if the remedy is still protective of ecological receptors.
7.4 Technical Assessment Summary
According to the data reviewed, the site inspection and the interviews, the remedy is functioning as intended by the ROD. The groundwater extraction system is fully operational and functional. However, a SLERA needs to be conducted to evaluate if any ecological exposure pathways exist. There have been no changes in toxicity factors for the COCs that were used in the baseline risk assessment.
8.0 ISSUES
Issue Affects Pi 0 "otectiveness k7N)
An ecological risk assessment was never completed for the site since the RI was conducted in 1988 prior to the issuance of the agency's's Ecological Risk Assessment Guidance (EPA, 1997). A potential ecological exposure pathway may exist at the site. The site is located near the confluence of the Little Maquoketa and Mississippi Rivers. The portion of the Mississippi River adjacent to the site is part of the Upper Mississippi River National Wildlife and Fish Refuge.
Current Future An ecological risk assessment was never completed for the site since the RI was conducted in 1988 prior to the issuance of the agency's's Ecological Risk Assessment Guidance (EPA, 1997). A potential ecological exposure pathway may exist at the site. The site is located near the confluence of the Little Maquoketa and Mississippi Rivers. The portion of the Mississippi River adjacent to the site is part of the Upper Mississippi River National Wildlife and Fish Refuge.
No Yes
9.0 RECOMMENDATIONS AND FOLLOW-UP ACTIONS
Recommendations/ Follow-up Actions
Party Responsible
Oversight Agency
Milestone Date
Affects Protectiveness
(Y/N) Recommendations/ Follow-up Actions
Party Responsible
Oversight Agency
Milestone Date
Current Future A screening level ecological risk assessment needs to be conducted to determine if any ecological exposure pathways exist at the site.
PRP EPA 09/30/2014 No Yes
28
10.0 PROTECTIVENESS STATEMENT
A protectiveness determination of the remedy at OU1 cannot be made at this time until further information is obtained. Further information will be obtained by conducting a screening level ecological risk assessment to determine if any ecological exposure pathways exist. It is expected these actions will take approximately one year to complete, at which time a protectiveness determination will be made.
11.0 NEXT REVIEW
It will be necessary to continue the five-year review processes, the sixth five-year review should be conducted by July 2018.
29
FIGURES
Site Location
Site Map
Well Locations Map
Tetrachloroethene Concentrations Detected in the Alluvial Aquifer
Trichloroethene Concentrations Detected in the Alluvial Aquifer
Benzene Concentrations Detected in the Alluvial Aquifer
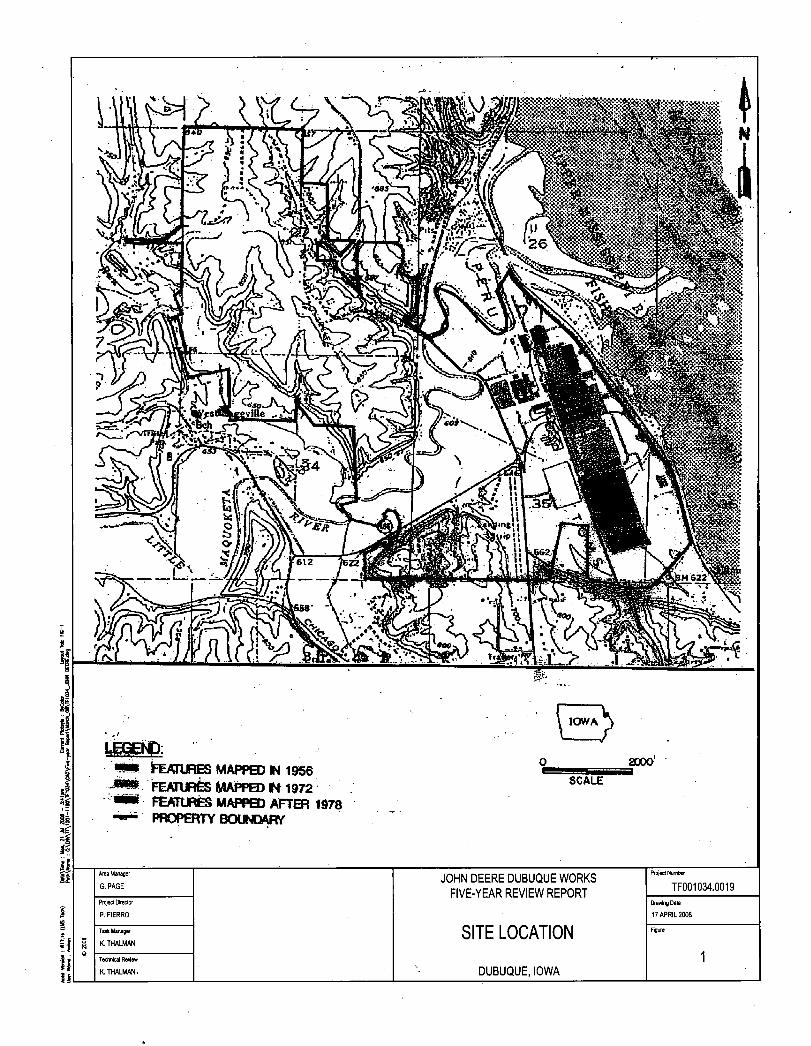
U33END: • * * IFEATURES MAPPED IN 1956
FEATURES MAPPED N 1972 FEATURES MAPPED AFTER 1978 PROPERTY BOUNDARY
2000 SCALE
Area Manager
G. PAGE
Project Director
P. FIERRO
Task Manager
K. THALMAN
Technical Reteew
K. THALMAN.
JOHN DEERE DUBUQUE WORKS FIVE-YEAR REVIEW REPORT
SITE LOCATION
DUBUQUE, IOWA
Project Number
TF001034.0019 Drawing Dale
17 APRIL 2008
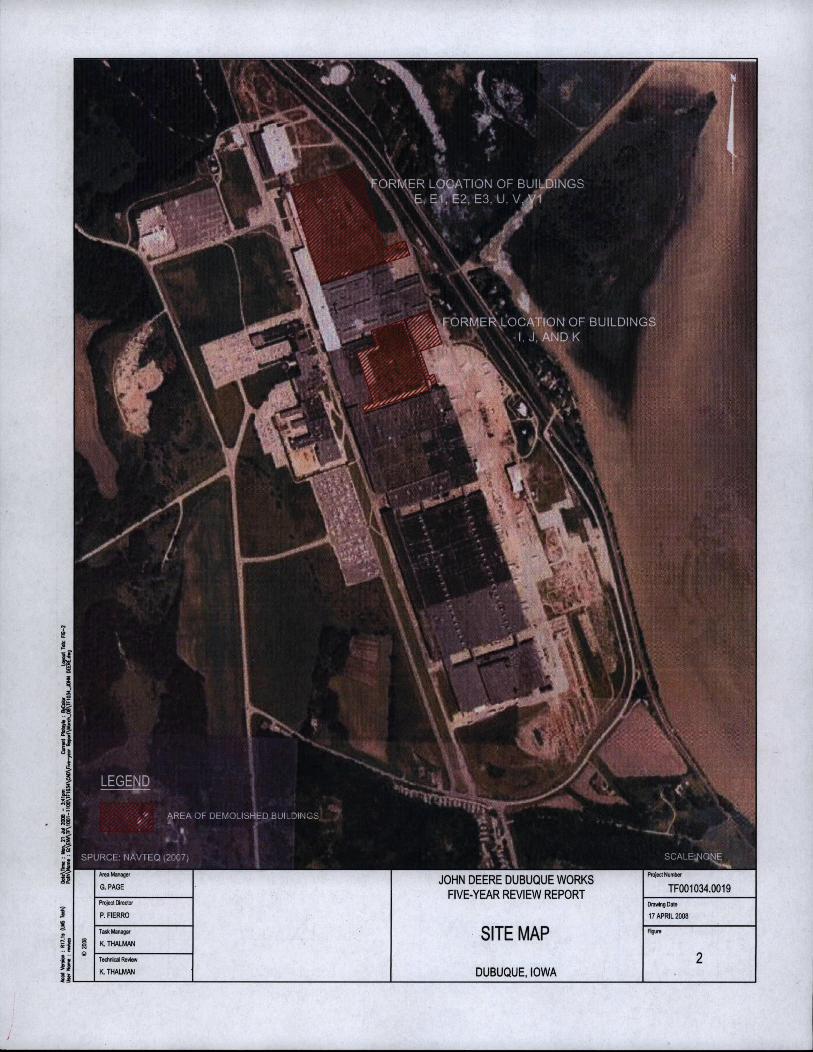
5
hi if
*f ii i
El II
I |
ii ! i
LEGEND
AREA OF DEMOLISHED BUILDINGS
SPURCE: NAVTEQ (2007) SCALEJMONE
Area Manager
G. PAGE JOHN DEERE DUBUQUE WORKS
FIVE-YEAR REVIEW REPORT
Project Number
TF001034.0019 Project Director
JOHN DEERE DUBUQUE WORKS FIVE-YEAR REVIEW REPORT
D'-iwin g Date
P. FIERRO 17 APRIL 2008
Task Manager
K. THALMAN SITE MAP Figure
Technical Review 2 K. THALMAN DUBUQUE, IOWA
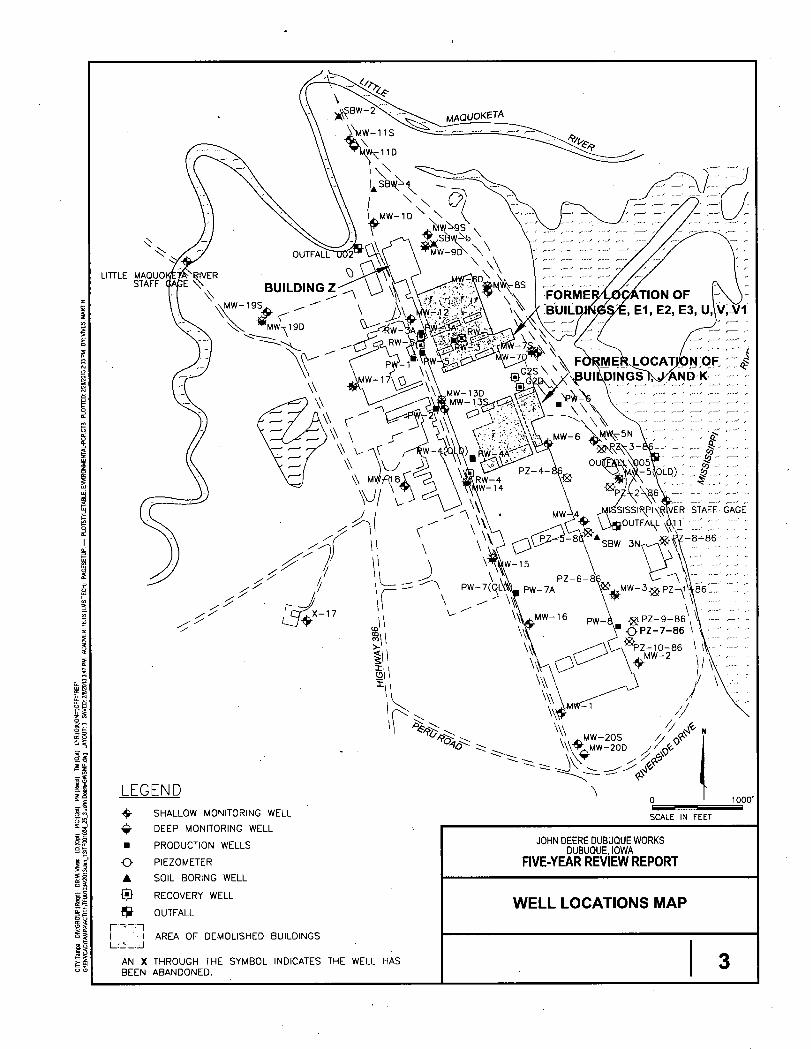
I 3
i l
II'
as
c_> C3
LITTLE MAQUO STAFF
LEGEND SHALLOW MONITORING WELL
DEEP MONITORING WELL • PRODUCTION WELLS
o PIEZOMETER
• SOIL BORING WELL
RECOVERY WELL
OUTFALL
i—---\
SCALE IN FEET
i • i AREA OF DEMOLISHED BUILDINGS L ^ . _ . J
AN X THROUGH THE SYMBOL INDICATES THE WELL HAS BEEN ABANDONED.
JOHN DEERE DUBUQUE WORKS DUBUQUE, IOWA
FIVE-YEAR REVIEW REPORT
WELL LOCATIONS MAP
3
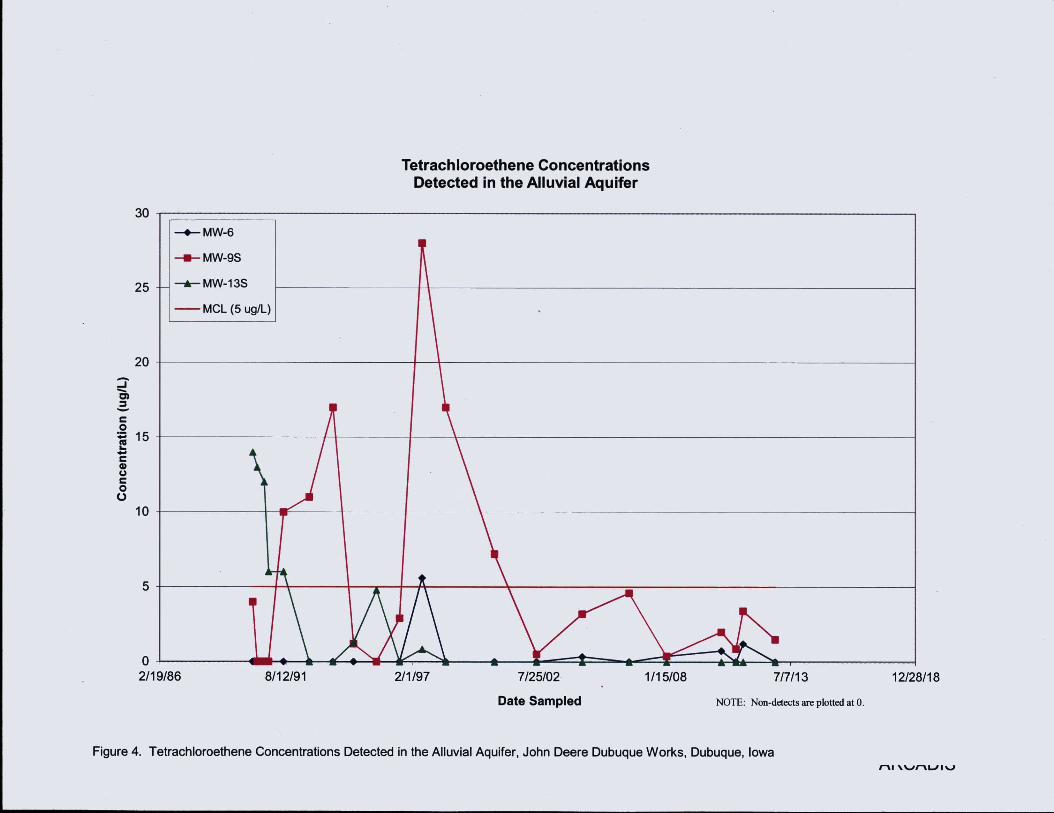
Figure 4. Tetrachloroethene Concentrations Detected in the Alluvial Aquifer, John Deere Dubuque Works, Dubuque, Iowa
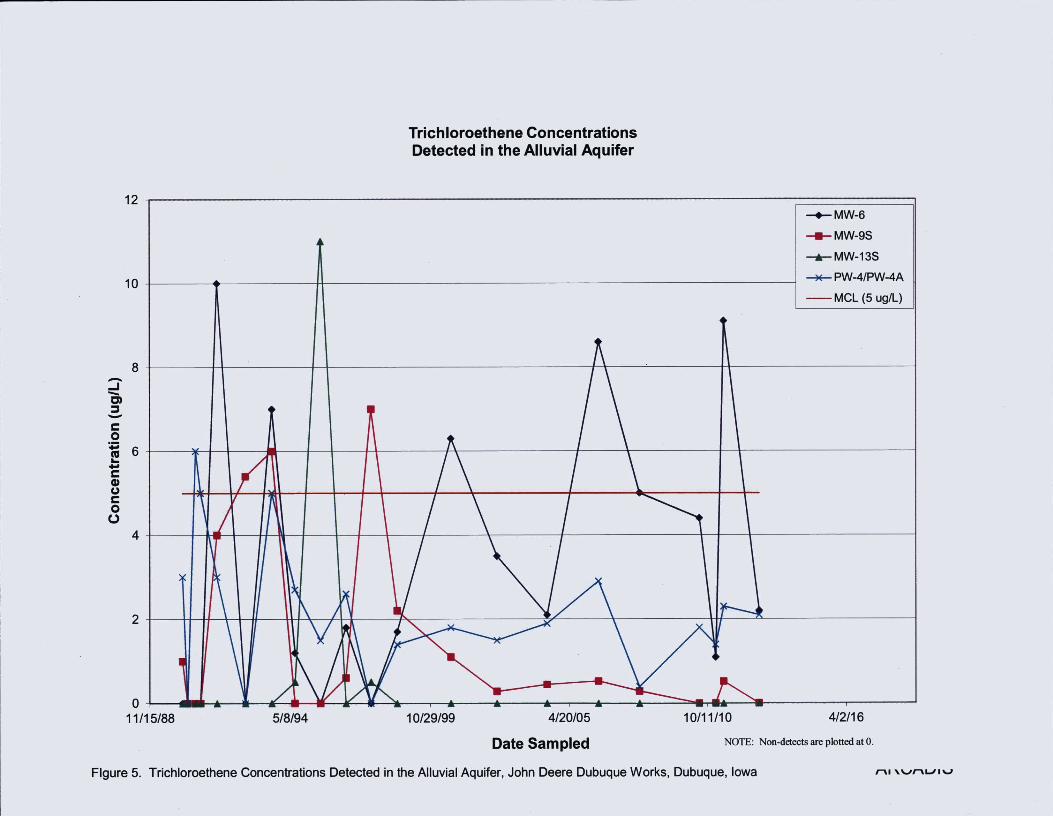
Trichloroethene Concentrations Detected in the Alluvial Aquifer
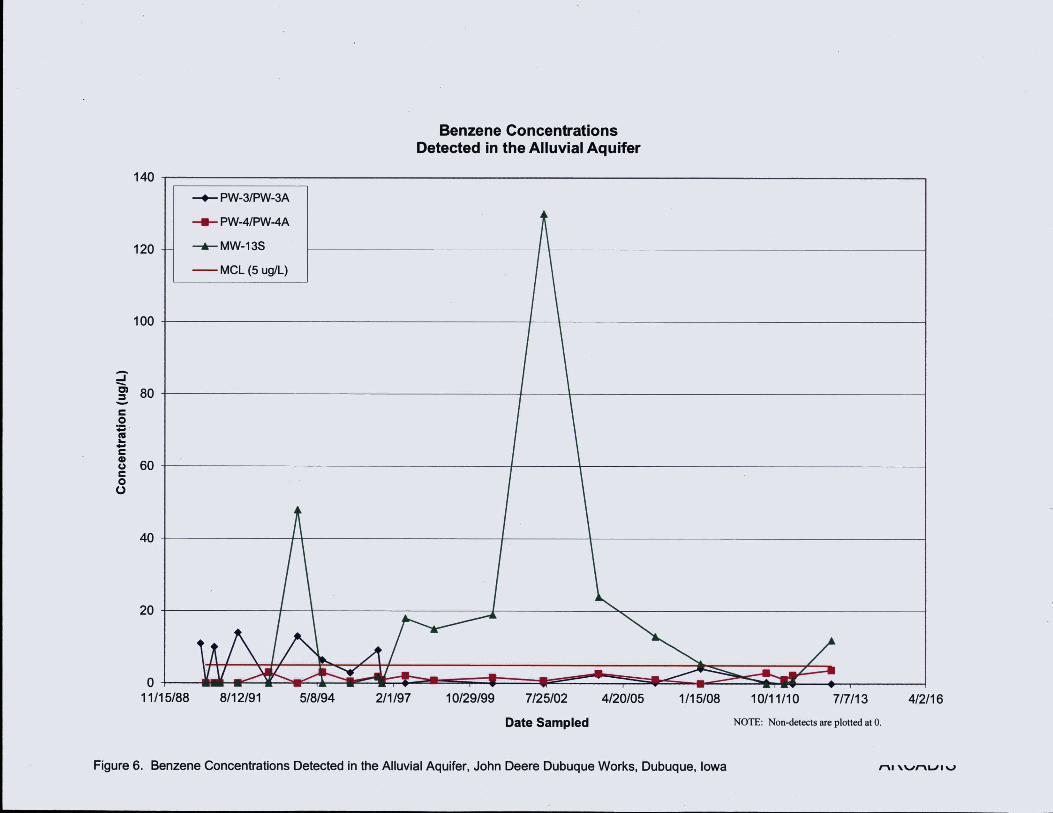
Benzene Concentrations Detected in the Alluvial Aquifer
Figure 6. Benzene Concentrations Detected in the Alluvial Aquifer, John Deere Dubuque Works, Dubuque, Iowa /-vi \ v / n u i u
TABLES
1 Chronolgy of Site Events
2 Contaminants of Concern
3 Summary of Groundwater Withdrawal System and NAPL Monitoring
4 Current Performance Standards for Contaminants in Groundwater
5 NPDES Effluent Limitations for the Constituents of Concern in Outfall Oil
6 Alluvial Production Well Pumping Summary
7 Paired Well Head Difference Summary
8 Chemical Groundwater Analyses Summary
9 Nonaqueous Phase Liquid Quarterly Monitoring Results
10 SBW-4 Nonaqueous Phase Liquid Monitoring Results
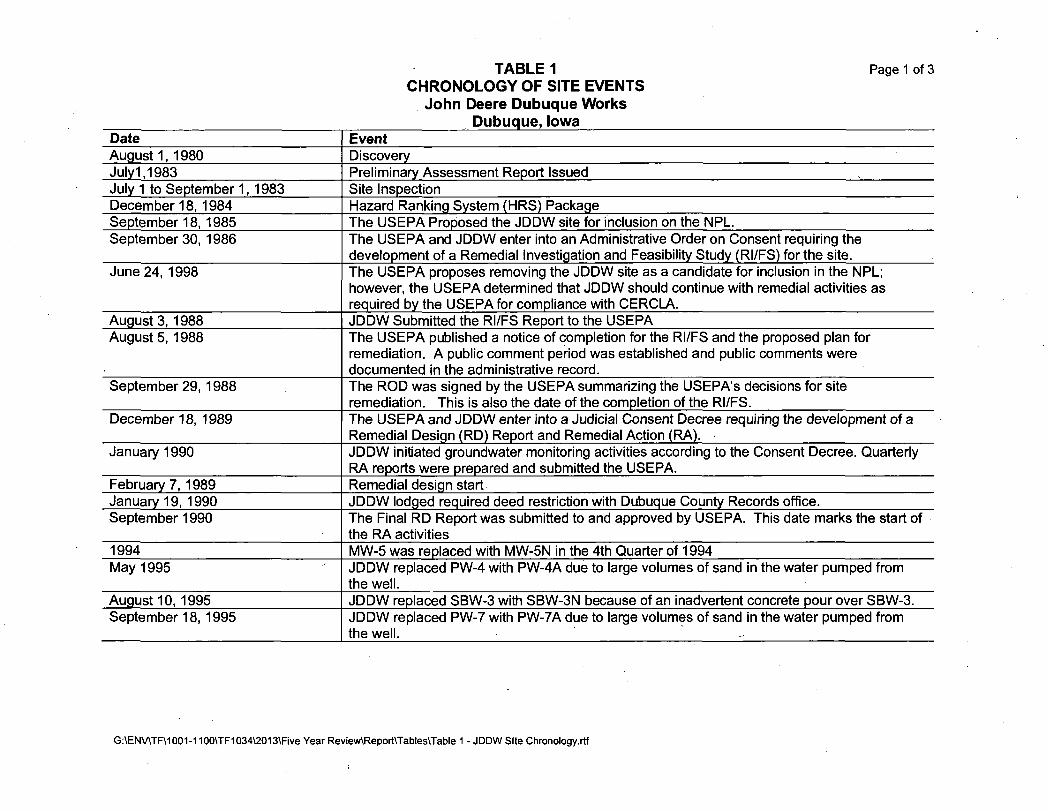
TABLE 1 Page 1 of 3 CHRONOLOGY OF SITE EVENTS
John Deere Dubuque Works Dubuque, Iowa
Date Event August 1, 1980 Discovery July1,1983 Preliminary Assessment Report Issued July 1 to September 1,1983 Site Inspection December 18,1984 Hazard Ranking System (HRS) Package September 18, 1985 The USEPA Proposed the JDDW site for inclusion on the NPL. September 30, 1986 The USEPA and JDDW enter into an Administrative Order on Consent requiring the
development of a Remedial Investigation and Feasibility Study (RI/FS) for the site. June 24, 1998 The USEPA proposes removing the JDDW site as a candidate for inclusion in the NPL;
however, the USEPA determined that JDDW should continue with remedial activities as required by the USEPA for compliance with CERCLA.
August 3, 1988 JDDW Submitted the RI/FS Report to the USEPA August 5, 1988 The U S E P A published a notice of completion for the RI/FS and the proposed plan for
remediation. A public comment period was established and public comments were documented in the administrative record.
September 29, 1988 The ROD was signed by the USEPA summarizing the USEPA's decisions for site remediation. This is also the date of the completion of the RI/FS.
December 18, 1989 The USEPA and JDDW enter into a Judicial Consent Decree requiring the development of a Remedial Design (RD) Report and Remedial Action (RA). -
January 1990 JDDW initiated groundwater monitoring activities according to the Consent Decree. Quarterly RA reports were prepared and submitted the USEPA.
February 7, 1989 Remedial design start January 19, 1990 JDDW lodged required deed restriction with Dubuque County Records office. September 1990 The Final RD Report was submitted to and approved by USEPA. This date marks the start of
the RA activities 1994 MW-5 was replaced with MW-5N in the 4th Quarter of 1994 May 1995 JDDW replaced PW-4 with PW-4A due to large volumes of sand in the water pumped from
the well. August 10,1995 JDDW replaced SBW-3 with SBW-3N because of an inadvertent concrete pour over SBW-3. September 18, 1995 JDDW replaced PW-7 with PW-7A due to large volumes of sand in the water pumped from
the well.
G:\EN\ATF\1001-1100\TF1034\2013\Five Year Review\Report\Tables\Table 1 - JDDW Site Chronology.rtf
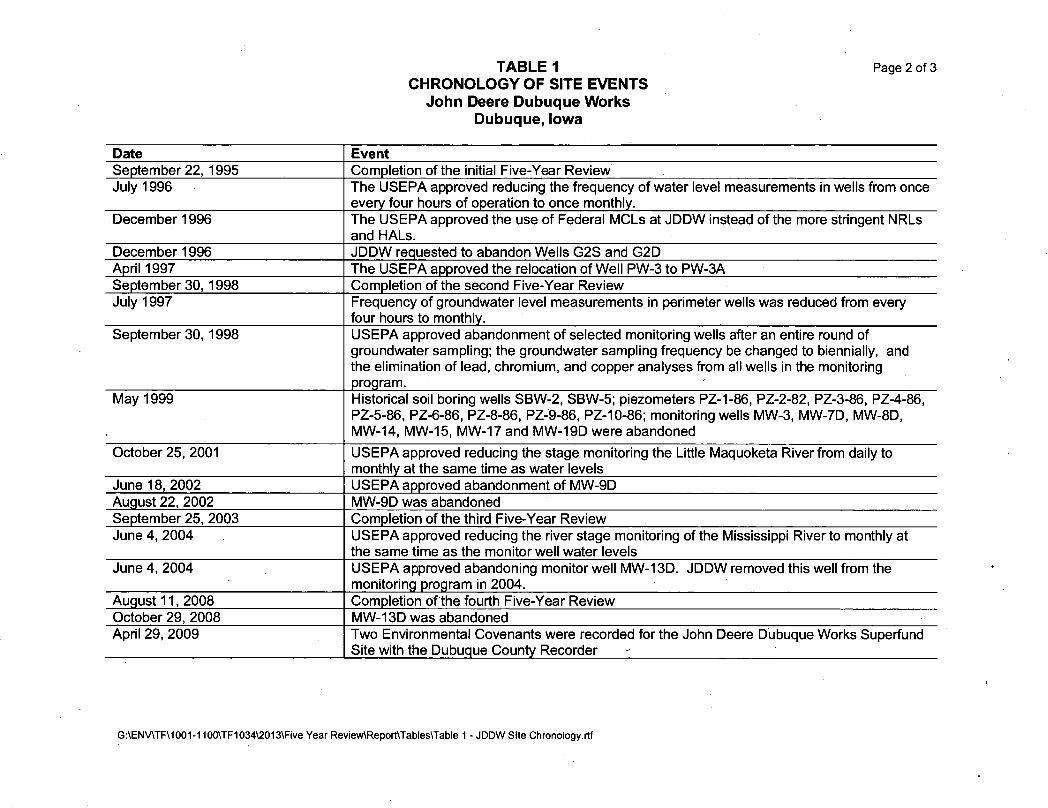
TABLE 1 Page 2 of 3 CHRONOLOGY OF SITE EVENTS
John Deere Dubuque Works Dubuque, Iowa
Date Event September 22, 1995 Completion of the initial Five-Year Review July 1996 The USEPA approved reducing the frequency of water level measurements in wells from once
every four hours of operation to once monthly. December 1996 The U S E P A approved the use of Federal MCLs at JDDW instead of the more stringent NRLs
and HALs. December 1996 JDDW requested to abandon Wells G2S and G2D April 1997 The USEPA approved the relocation of Well PW-3 to PW-3A September 30, 1998 Completion of the second Five-Year Review July 1997 Frequency of groundwater level measurements in perimeter wells was reduced from every
four hours to monthly. September 30, 1998 USEPA approved abandonment of selected monitoring wells after an entire round of
groundwater sampling; the groundwater sampling frequency be changed to biennially, and the elimination of lead, chromium, and copper analyses from all wells in the monitoring program.
May 1999 Historical soil boring wells SBW-2, SBW-5; piezometers PZ-1-86, PZ-2-82, PZ-3-86, PZ-4-86, PZ-5-86, PZ-6-86, PZ-8-86, PZ-9-86, PZ-10-86; monitoring wells MW-3, MW-7D, MW-8D, MW-14, MW-15, MW-17 and MW-19D were abandoned
October 25, 2001 U S E P A approved reducing the stage monitoring the Little Maquoketa River from daily to monthly at the same time as water levels
June 18, 2002 U S E P A approved abandonment of MW-9D August 22, 2002 MW-9D was abandoned September 25, 2003 Completion of the third Five-Year Review June 4, 2004 U S E P A approved reducing the river stage monitoring of the Mississippi River to monthly at
the same time as the monitor well water levels June 4, 2004 U S E P A approved abandoning monitor well MW-13D. JDDW removed this well from the
monitoring program in 2004. August 11, 2008 Completion of the fourth Five-Year Review October 29, 2008 MW-13D was abandoned April 29, 2009 Two Environmental Covenants were recorded for the John Deere Dubuque Works Superfund
Site with the Dubuque County Recorder
G:\ENV\TF\1001-1100\TF1034\2013\Five Year Review\Report\Tables\Table 1 - JDDW Site Chronology.rtf
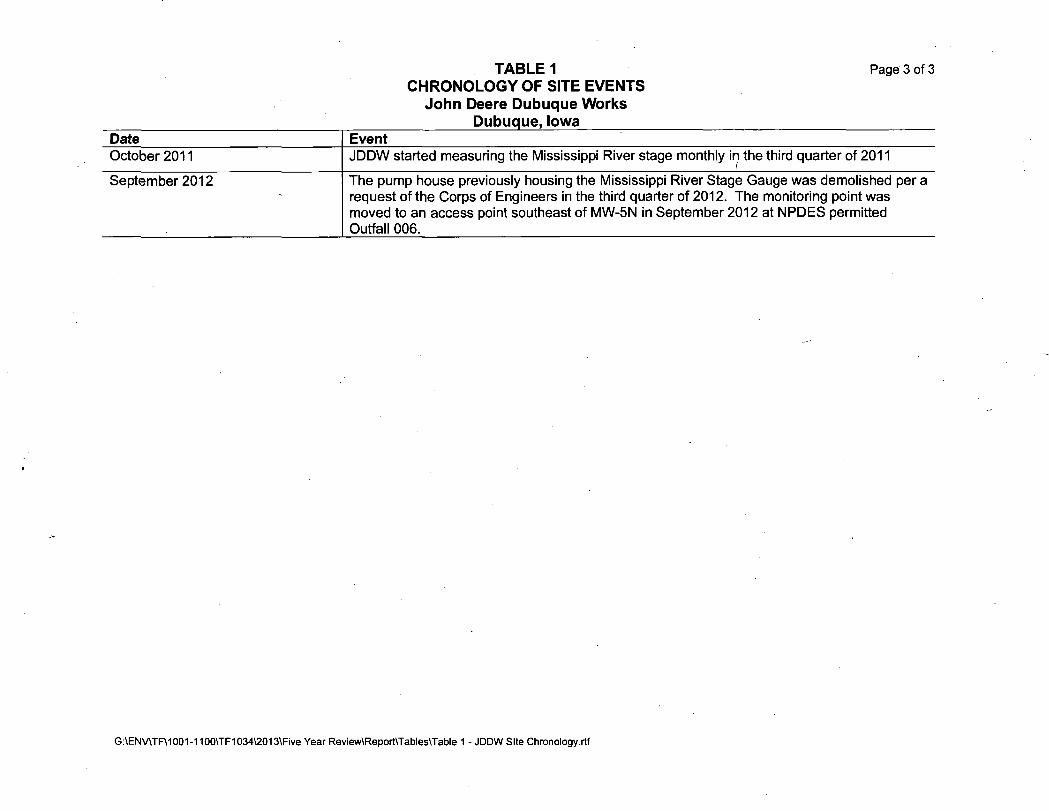
TABLE 1 Page 3 of 3 CHRONOLOGY OF SITE EVENTS
John Deere Dubuque Works Dubuque, Iowa
Date Event October 2011 JDDW started measuring the Mississippi River stage monthly in the third quarter of 2011
September 2012 The pump house previously housing the Mississippi River Stage Gauge was demolished per a request of the Corps of Engineers in the third quarter of 2012. The monitoring point was moved to an access point southeast of MW-5N in September 2012 at NPDES permitted Outfall 006.
G:\ENv\TF\1001-1100\TF1034\2013\Five Year Review\Report\Tables\Table 1 - JDDW Site Chronology.rtf
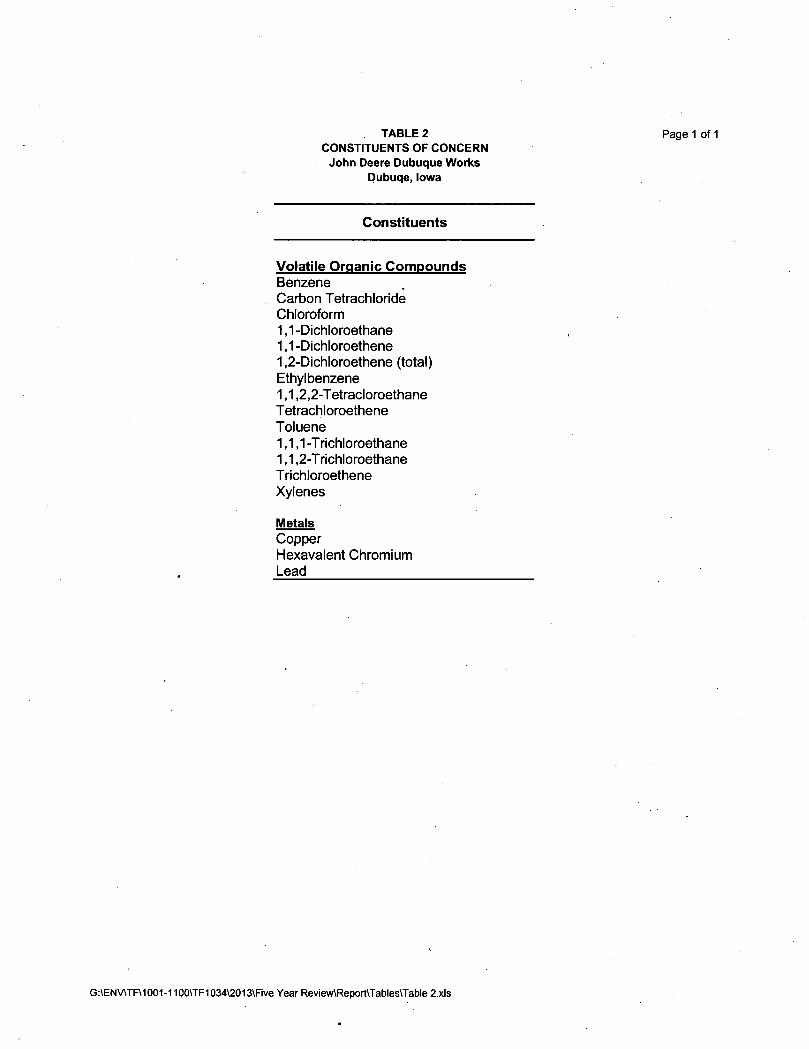
T A B L E 2 CONSTITUENTS OF C O N C E R N
John Deere Dubuque Works Dubuqe, Iowa
Constituents
Volatile Organic Compounds Benzene Carbon Tetrachloride Chloroform 1,1-Dichloroethane 1.1- Dichloroethene 1.2- Dichloroethene (total) Ethylbenzene 1,1,2,2-Tetracloroethane Tetrachloroethene Toluene 1,1,1 -Trichloroethane 1,1,2-Trichloroethane Trichloroethene Xylenes
Metals Copper Hexavalent Chromium Lead
G:\ENV\TR1001-1100\TF1034\2013\Five Year Review\Report\Tables\Table 2.xls
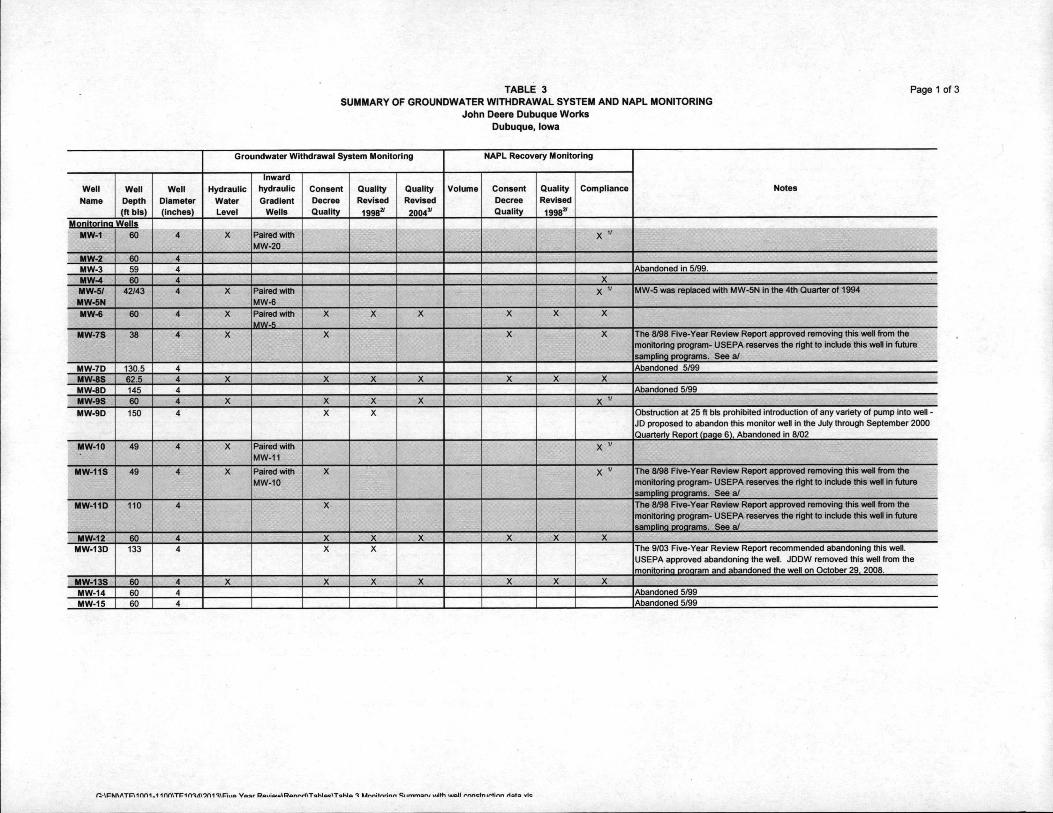
TABLE 3 Page 1 of 3 SUMMARY OF GROUNDWATER WITHDRAWAL SYSTEM AND NAPL MONITORING
John Deere Dubuque Works Dubuque, Iowa
Groundwater Withdrawal System Monitoring NAPL Recovery Monitoring
Notes Well
Name Well
Depth (ft bis)
Well Diameter (inches)
Hydraulic Water Level
Inward hydraulic Gradient
Wells
Consent Decree Quality
Quality
Revised
1998a
Quality
Revised
2004"
Volume Consent Decree Quality
Quality
Revised
1998*
Compliance Notes
Monitoring Wells MW-1 60 4 X Paired with
MW-20 X "
MW-2 60 4 MW-3 59 4 Abandoned in 5/99.
MW-4 60 4 X
MW-5/ MW-5N
42/43 4 X Paired with MW-6
X 8 MW-5 was replaced with MW-5N in the 4th Quarter of 1994
MW-6 60 4 X Paired with MW-5
X X X X X X
MW-7S 38 4 X X X X The 8/98 Five-Year Review Report approved removing this well from the monitoring program- U S E P A reserves the right to include this well in future sampling programs. See a/
MW-7D 130.5 4 Abandoned 5/99
MW-8S 62.5 4 X X X X X X X MW-8D 145 4 Abandoned 5/99
MW-9S 60 4 X X X X X " MW-9D 150 4 X X Obstruction at 25 ft bis prohibited introduction of any variety of pump into well -
JD proposed to abandon this monitor well in the July through September 2000 Quarterly Report (page 6), Abandoned in 8/02
MW-10 49 4 X Paired with MW-11
X "
MW-11S 49 4 X Paired with MW-10
X X " The 8/98 Five-Year Review Report approved removing this well from the monitoring program- U S E P A reserves the right to include this well in future sampling programs. See a/
MW-11D 110 4 X The 8/98 Five-Year Review Report approved removing this well from the monitoring program- U S E P A reserves the right to include this well in future samplinq proqrams. See a/
MW-12 60 4 X X X X X X
MW-13D 133 4 X X The 9/03 Five-Year Review Report recommended abandoning this well. USEPA approved abandoning the well. JDDW removed this well from the monitorina program and abandoned the well on October 29. 2008.
MW-13S 60 4 X X X X X X X
MW-14 60 4 Abandoned 5/99
MW-15 60 4 Abandoned 5/99
n \ P M \ A T P \ i n n i _ 1 i n n \ T P i n ^ \ 9 n n \ F i » Q V o a r R o w i o u A R o r w t t T a h l o ^ T a h l o 1 M n n i t n r i n n Q u m m a r w uuith UJDI I r n n e t n , n t \ n n d a t a v ie
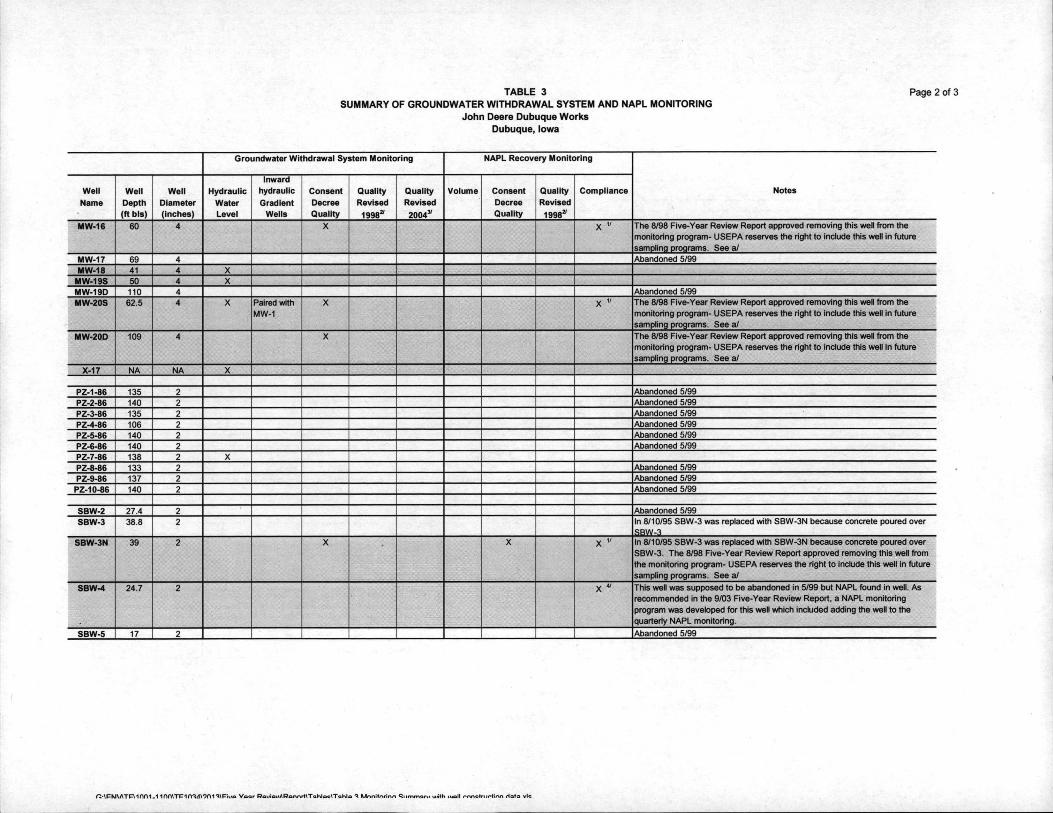
TABLE 3 SUMMARY OF GROUNDWATER WITHDRAWAL SYSTEM AND NAPL MONITORING
John Deere Dubuque Works Dubuque, Iowa
Page 2 of 3
Groundwater Withdrawal System Monitoring NAPL Recovery Monitoring
Notes Well
Name Well
Depth (ft bis)
Well Diameter (inches)
Hydraulic Water Level
Inward hydraulic Gradient
Wells
Consent Decree Quality
Quality
Revised
1998"
Quality
Revised
2004*
Volume Consent Decree Quality
Quality
Revised
1998*
Compl iance Notes
MW-16 60 4 X X " The 8/98 Five-Year Review Report approved removing this well from the monitoring program- U S E P A reserves the right to include this well in future samplinq proqrams. See a/
MW-17 69 4 Abandoned 5/99
MW-18 41 4 X MW-19S 50 4 X MW-19D 110 4 Abandoned 5/99
MW-20S 62.5 4 X Paired with MW-1
X X " The 8/98 Five-Year Review Report approved removing this well from the monitoring program- U S E P A reserves the right to include this well in future sampling programs. See a/
MW-20O 109 4 X The 8/98 Five-Year Review Report approved removing this well from the monitoring program- U S E P A reserves the right to include this well in future sampling programs. See a/
X-17 NA NA X
PZ-1-86 135 2 Abandoned 5/99 PZ-2-86 140 2 Abandoned 5/99
PZ-3-86 135 2 Abandoned 5/99
PZ-4-86 106 2 Abandoned 5/99 PZ-S-86 140 2 Abandoned 5/99 PZ-6-86 140 2 Abandoned 5/99 PZ-7-86 138 2 X PZ-8-86 133 2 Abandoned 5/99
PZ-9-86 137 2 Abandoned 5/99
PZ-10-86 140 2 Abandoned 5/99
SBW-2 27.4 2 Abandoned 5/99 SBW-3 38.8 2 In 8/10/95 SBW-3 was replaced with SBW-3N because concrete poured over
SBW-3 SBW-3N 39 2 X X X M In 8/10/95 SBW-3 was replaced with SBW-3N because concrete poured over
SBW-3. The 8/98 Five-Year Review Report approved removing this well from the monitoring program- USEPA reserves the right to include this well in future sampling programs. See a/
SBW-4 24.7 2 X * This well was supposed to be abandoned in 5/99 but NAPL found in well. As recommended in the 9/03 Five-Year Review Report, a NAPL monitoring program was developed for this well which included adding the well to the quarteriy NAPL monitoring.
SBW-5 17 2 Abandoned 5/99
f l \ F W \ A T P \ i n n i . 1 i n n \ T P i m d \ ' 3 n n \ F i » o V o a r R o w i £ K « A R a n n r i \ T a h l o e \ T a h l o M n n i t n r i n n Q i i n v r a r u i . iol l r n n e t m r H r v i H a t a v ie
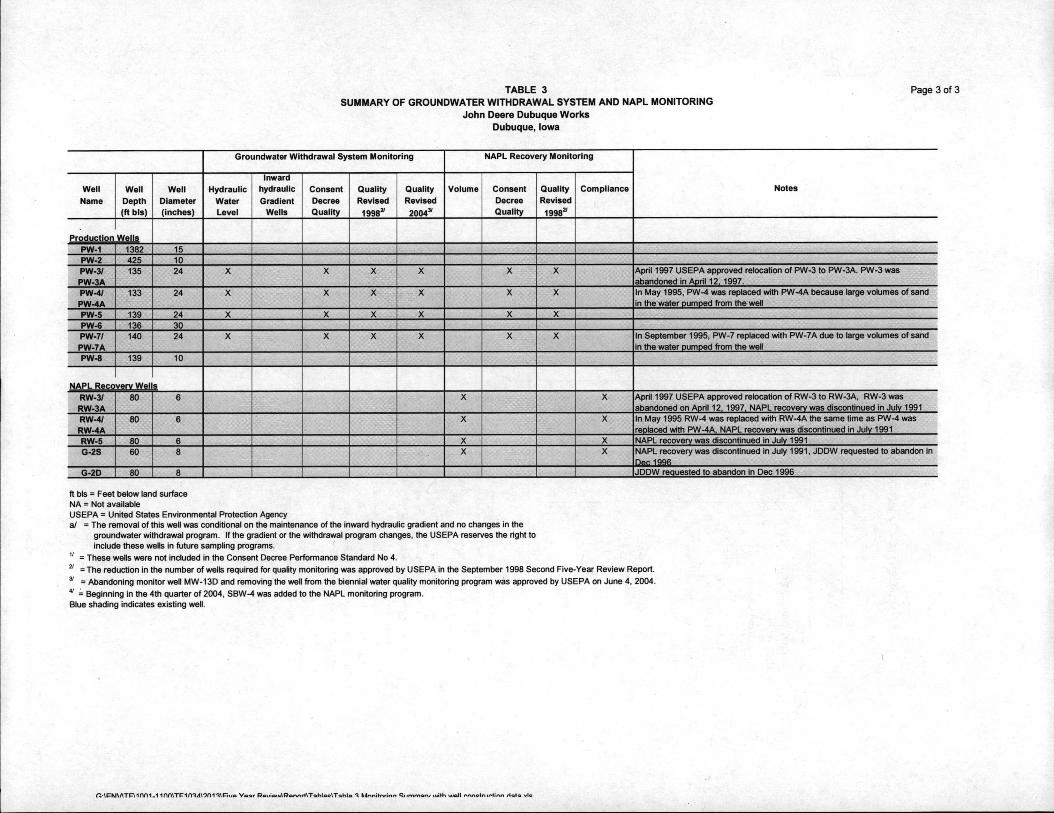
TABLE 3 Page 3 of 3 SUMMARY OF GROUNDWATER WITHDRAWAL SYSTEM AND NAPL MONITORING
John Deere Dubuque Works Dubuque, Iowa
Groundwater Withdrawal System Monitoring NAPL Recovery Monitoring
Notes Well
Name
Well Depth (ft bis)
Well Diameter (inches)
Hydraulic Water Level
Inward hydraulic Gradient
Wells
Consent Decree Quality
Quality
Revised
1998"
Quality
Revised
2004*
Volume Consent Decree Quality
Quality
Revised
1998*
Compliance Notes
Production Wells PW-1 1382 15 PW-2 425 10 PW-3/ PW-3A
135 24 X X X X X X April 1997 U S E P A approved relocation of PW-3 to PW-3A. PW-3 was abandoned in April 12, 1997.
PW-4/ PW-4A
133 24 X X X X X X In May 1995, PW-4 was replaced with PW-4A because large volumes of sand in the water pumped from the well
PW-5 139 24 X X X X X X PW-6 136 30 PW-7/ PW-7A
140 24 X X X X X X In September 1995, PW-7 replaced with PW-7A due to large volumes of sand in the water pumped from the well
PW-8 139 10
NAPL Reco verv Wei s
RW-3/ RW-3A
80 6 X X April 1997 U S E P A approved relocation of RW-3 to RW-3A, RW-3 was abandoned on April 12, 1997, NAPL recovery was discontinued in July 1991
RW-4/ RW-4A
80 6 X X In May 1995 RW-4 was replaced with RW-4A the same time as PW-4 was replaced with PW-4A, NAPL recovery was discontinued in July 1991
RW-5 80 6 X X NAPL recovery was discontinued in July 1991
G-2S 60 8 X X NAPL recovery was discontinued in July 1991, JDDW requested to abandon in Dec 1996
G-2D 80 8 JDDW requested to abandon in Dec 1996
ft bis = Feet below land surface NA • Not available USEPA = United States Environmental Protection Agency al = The removal of this well was conditional on the maintenance of the inward hydraulic gradient and no changes in the
groundwater withdrawal program. If the gradient or the withdrawal program changes, the USEPA reserves the right to include these wells in future sampling programs.
" = These wells were not included in the Consent Decree Performance Standard No 4. " = The reduction in the number of wells required for quality monitoring was approved by USEPA in the September 1998 Second Five-Year Review Report * • Abandoning monitor well MW-13D and removing the well from the biennial water quality monitoring program was approved by USEPA on June 4, 2004 4 ' = Beginning in the 4th quarter of 2004, SBW-4 was added to the NAPL monitoring program. Blue shading indicates existing well.
f 5 - \ P M \ A T F \ - i n n i . 1 i n n \ T P i m ^ \ 9 n n \ P i w o V o a r R o w i o u A R o n n r r t T a h l o c V T a h l o 1 M n n i t r t r i n n Q u m m a r u u-ith IAOII ™ n e t r , i r t i n n H a t a v ie
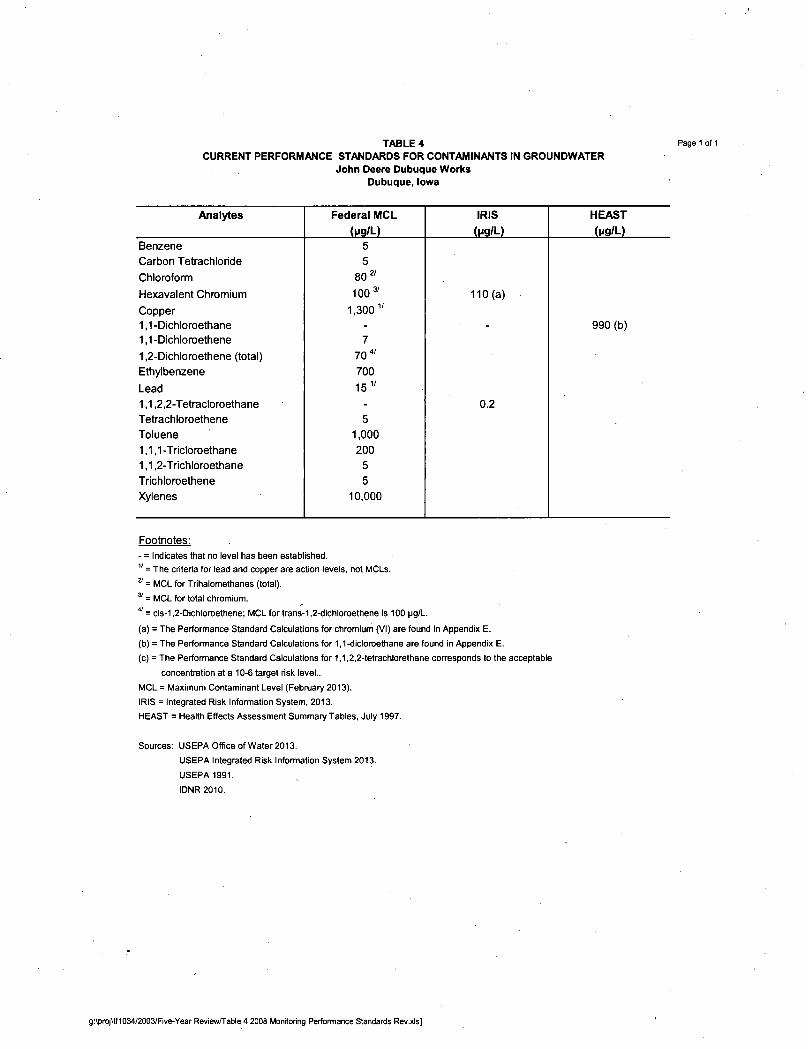
T A B L E 4 Page 1 of 1 CURRENT PERFORMANCE STANDARDS FOR CONTAMINANTS IN GROUNDWATER
John Deere Dubuque Works Dubuque, Iowa
Analytes Federal MCL IRIS HEAST
(M9/L) (ng/L) (ug/L)
Benzene 5
Carbon Tetrachloride 5
Chloroform 80 21
Hexavalent Chromium 100 3 ' 110(a)
Copper 1,300 1 /
1,1-Dichloroethane - - 990 (b)
1,1-Dichloroethene 7
1,2-Dichloroethene (total) 70 4 /
Ethylbenzene 700
Lead 15 v
1,1,2,2-Tetracloroethane - 0.2
Tetrachloroethene 5
Toluene 1,000
1,1,1-Tricloroethane 200
1,1,2-Trichloroethane 5
Trichloroethene 5
Xylenes 10,000
Footnotes:
- = Indicates that no level has been established. 1 ' = The criteria for lead and copper are action levels, not MCLs. 2 1 - MCL for Trihalomethanes (total). 3 1 = MCL for total chromium. v = cis-1,2-Dichloroethene; MCL for trans-1,2-dichloroethene is 100 ug/L.
(a) = The Performance Standard Calculations for chromium (VI) are found in Appendix E.
(b) = The Performance Standard Calculations for 1,1-dicloroethane are found in Appendix E.
(c) = The Performance Standard Calculations for 1,1,2,2-tetrachlorethane corresponds to the acceptable
concentration at a 10-6 target risk level..
MCL = Maximum Contaminant Level (February 2013).
IRIS = Integrated Risk Information System, 2013.
HEAST = Health Effects Assessment Summary Tables, July 1997.
Sources: USEPA Office of Water 2013.
USEPA Integrated Risk Information System 2013.
USEPA 1991.
IDNR 2010.
g:\proj\tf1034/2003/Five-Year Review/Table 4 2008 Monitoring Performance Standards Rev.xls]
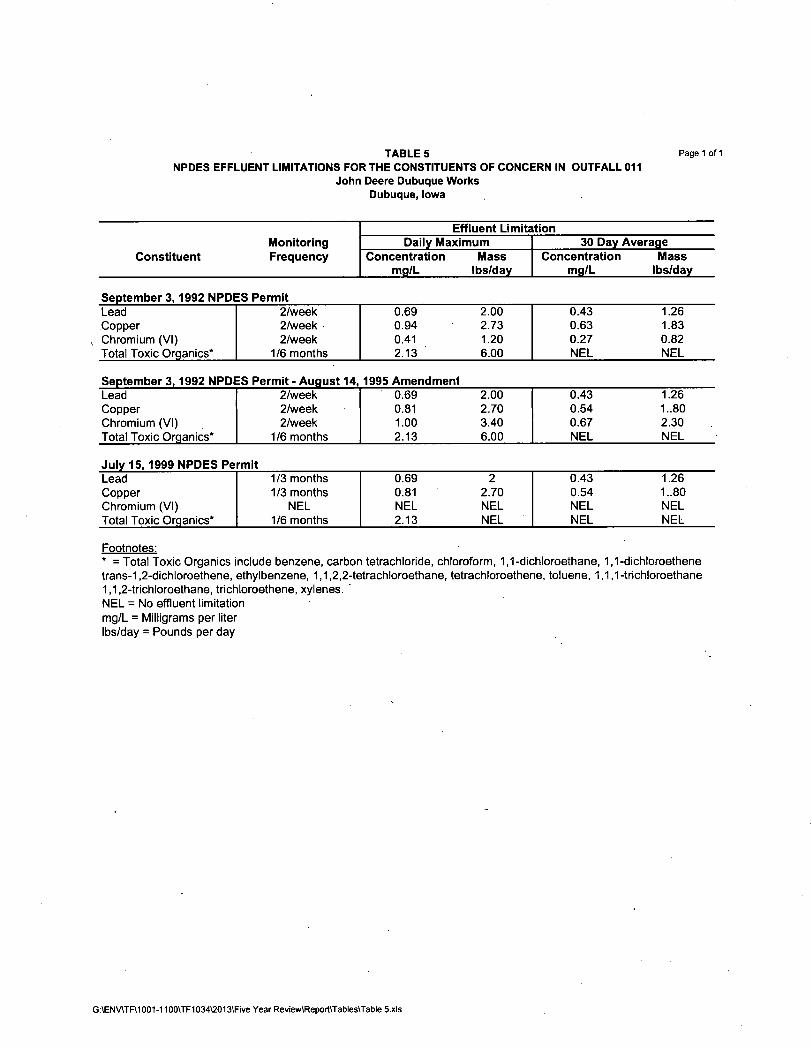
TABLE 5 Page 1 of 1 NPDES EFFLUENT LIMITATIONS FOR THE CONSTITUENTS OF CONCERN IN OUTFALL 011
John Deere Dubuque Works Dubuque, Iowa
Monitoring Constituent Frequency
Effluent Limitation Monitoring
Constituent Frequency Daily Maximum 30 Day Average Monitoring
Constituent Frequency Concentration Mass mg/L lbs/day
Concentration Mass mg/L lbs/day
September 3,1992 NPDES Permit Lead Copper Chromium (VI) Total Toxic Organics*
2/week 2/week 2/week
1/6 months
0.69 2.00 0.94 2.73 0.41 1.20 2.13 6.00
0.43 1.26 0.63 1.83 0.27 0.82 NEL NEL
September 3,1992 NPDES Permit - August 14,1995 Amendment Lead Copper Chromium (VI) Total Toxic Organics*
2/week 2/week 2/week
1/6 months
0.69 2.00 0.81 2.70 1.00 3.40 2.13 6.00
0.43 1.26 0.54 1..80 0.67 2.30 NEL NEL
July 15,1999 NPDES Permit Lead Copper Chromium (VI) Total Toxic Organics*
1/3 months 1/3 months
NEL 1/6 months
0.69 2 0.81 2.70 NEL NEL 2.13 NEL
0.43 1.26 0.54 1..80 NEL NEL NEL NEL
Footnotes: * = Total Toxic Organics include benzene, carbon tetrachloride, chloroform, 1,1-dichloroethane, 1,1-dichloroethene trans-1,2-dichloroethene, ethylbenzene, 1,1,2,2-tetrachloroethane, tetrachloroethene, toluene, 1,1,1-trichloroethane 1,1,2-trichloroethane, trichloroethene, xylenes. ' NEL = No effluent limitation mg/L = Milligrams per liter lbs/day = Pounds per day
G:\ENV\TR1001-1100\TF1034\2013\FiveYear Review\Report\Tables\Table 5.xls
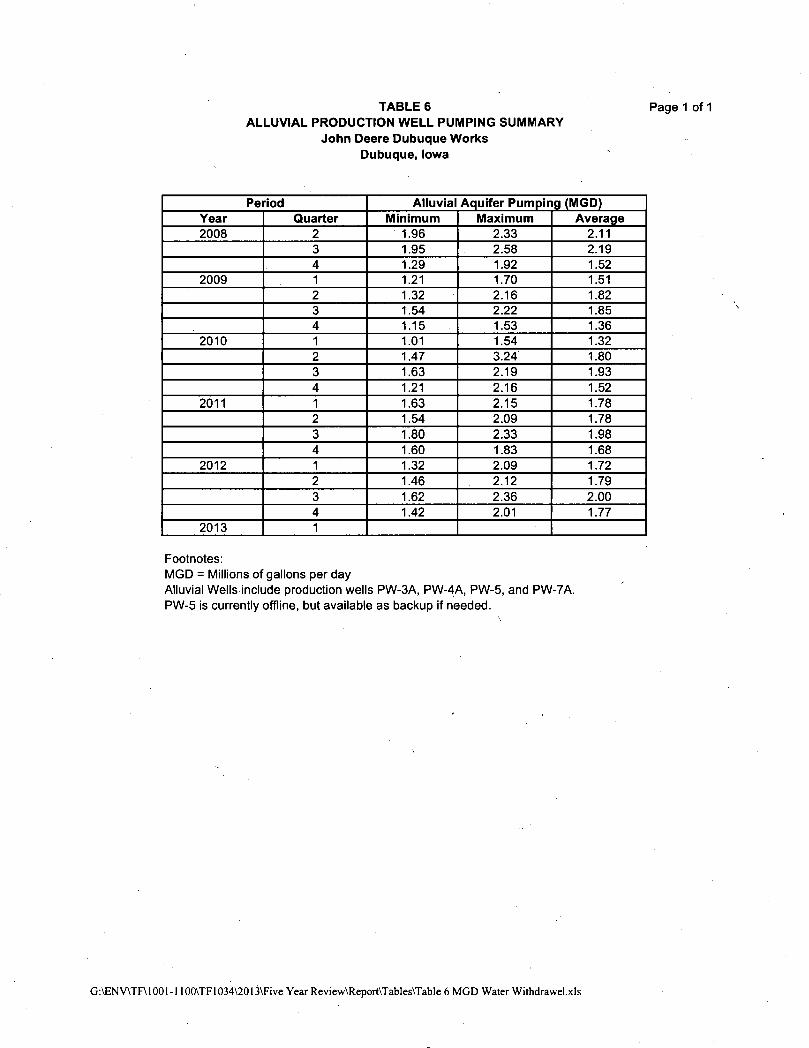
TABLE 6 Page 1 of 1 ALLUVIAL PRODUCTION WELL PUMPING SUMMARY
John Deere Dubuque Works Dubuque, Iowa
Period Alluvial Aquifer Pumping (MGD) Year Quarter Minimum Maximum Average 2008 2 1.96 2.33 2.11
3 1.95 2.58 2.19 4 1.29 1.92 1.52
2009 1 1.21 1.70 1.51 2 1.32 2.16 1.82 3 1.54 2.22 1.85 4 1.15 1.53 1.36
2010 1 1.01 1.54 1.32 2 1.47 3.24 1.80 3 1.63 2.19 1.93 4 1.21 2.16 1.52
2011 1 1.63 2.15 1.78 2 1.54 2.09 1.78 3 1.80 2.33 1.98 4 1.60 1.83 1.68
2012 1 1.32 2.09 1.72 2 1.46 2.12 1.79 3 1.62 2.36 2.00 4 1.42 2.01 1.77
2013 1
Footnotes: MGD = Millions of gallons per day Alluvial Wells include production wells PW-3A, PW-4A, PW-5, and PW-7A. PW-5 is currently offline, but available as backup if needed.
G:\ENV\TF\1001-1100\TF1034\20l3\Five Year Review\Report\Tables\Table 6 MGD Water Withdrawel.xls
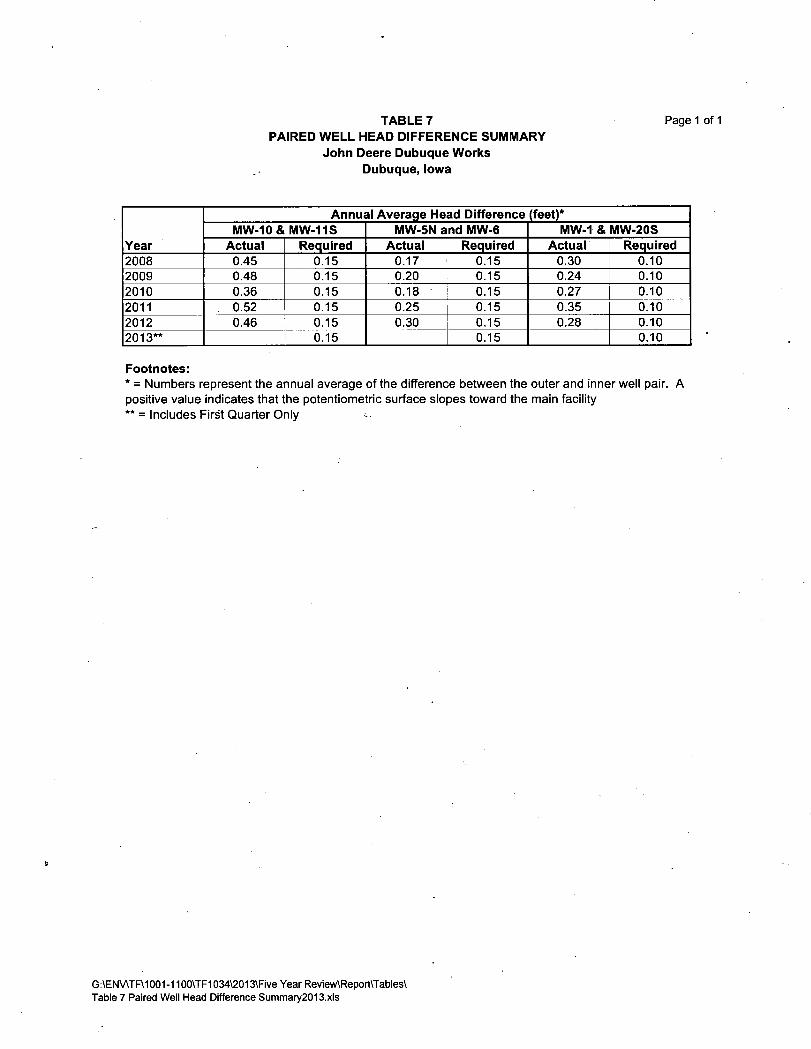
TABLE 7 Page 1 PAIRED WELL HEAD DIFFERENCE SUMMARY
John Deere Dubuque Works Dubuque, Iowa
Year
Annual Average Head Difference (feet)*
Year MW-10 & MW-11S MW-5N and MW-6 MW-1 & MW-20S
Year Actual Required Actual Required Actual Required 2008 0.45 0.15 0.17 0.15 0.30 0.10 2009 0.48 0.15 0.20 0.15 0.24 0.10 2010 0.36 0.15 0.18 0.15 0.27 0.10 2011 0.52 0.15 0.25 0.15 0.35 0.10 2012 0.46 0.15 0.30 0.15 0.28 0.10 2013** 0.15 0.15 0.10
Footnotes: * = Numbers represent the annual average of the difference between the outer and inner well pair. A positive value indicates that the potentiometric surface slopes toward the main facility ** = Includes First Quarter Only
G:\EN\ATF\1001-1100\TF1034\2013\Five Year Review\Report\Tables\ Table 7 Paired Well Head Difference Summary2013.xls
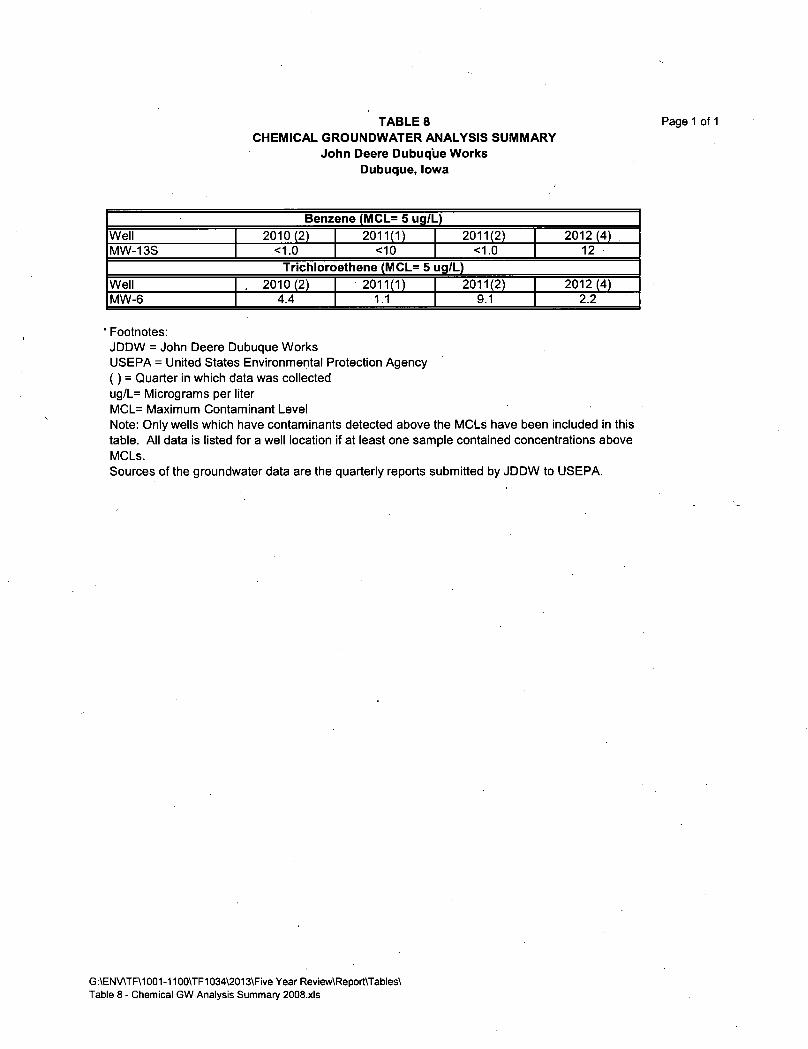
TABLE 8 Page 1 of 1 CHEMICAL GROUNDWATER ANALYSIS SUMMARY
John Deere Dubuque Works Dubuque, Iowa
Benzene (MCL= 5 ug/L) Well 2010(2) 2011(1) 2011(2) 2012(4) MW-13S <1.0 <10 <1.0 12
Trichloroethene (MCL= 5 ug/L) Well , 2010(2) 2011(1) 2011(2) 2012 (4) MW-6 4.4 1.1 9.1 2.2
Footnotes: JDDW = John Deere Dubuque Works USEPA = United States Environmental Protection Agency () = Quarter in which data was collected ug/L= Micrograms per liter MCL= Maximum Contaminant Level Note: Only wells which have contaminants detected above the MCLs have been included in this table. All data is listed for a well location if at least one sample contained concentrations above MCLs. Sources of the groundwater data are the quarterly reports submitted by JDDW to USEPA.
G:\ENV\TF\1001-1100\TF1034\2013\Five Year Review\Report\Tables\ Table 8 - Chemical GW Analysis Summary 2008.xls
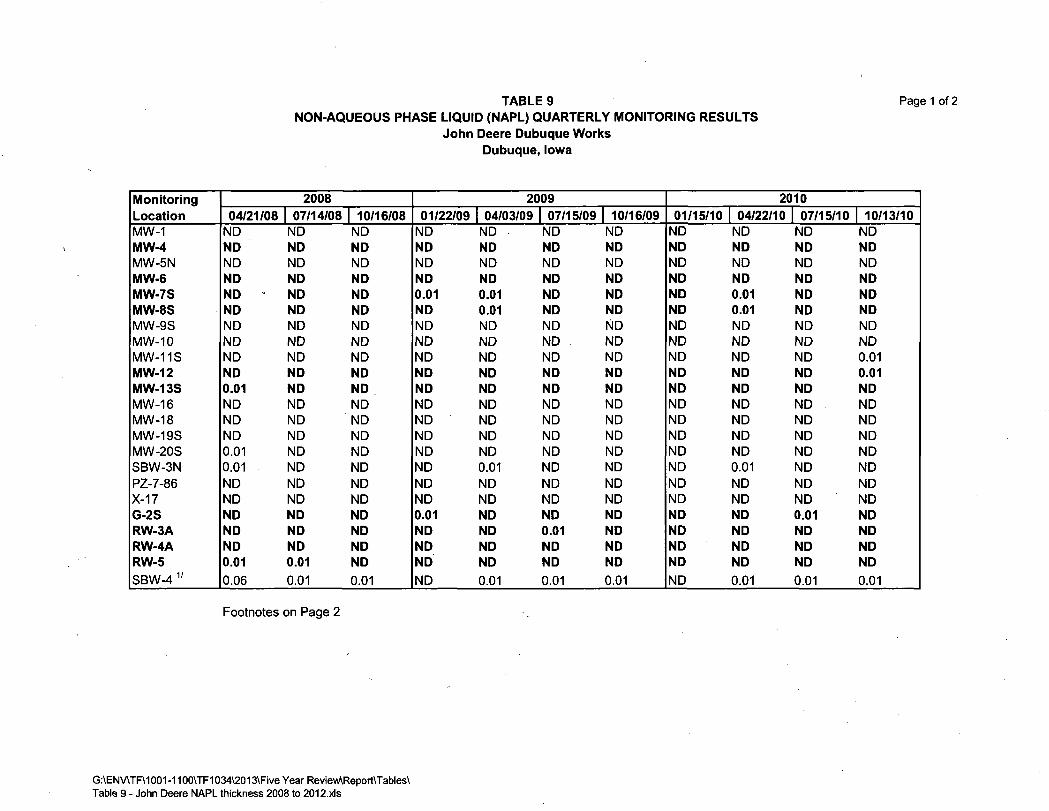
TABLE 9 Page 1 of 2 NON-AQUEOUS PHASE LIQUID (NAPL) QUARTERLY MONITORING RESULTS
John Deere Dubuque Works Dubuque, Iowa
Monitoring Location
2008 2009 2010 Monitoring Location 04/21/08 07/14/08 10/16/08 01/22/09 04/03/09 07/15/09 10/16/09 01/15/10 04/22/10 07/15/10 10/13/10 MW-1 ND ND ND ND ND ND ND ND ND ND ND MW-4 ND ND ND ND ND ND ND ND ND ND ND MW-5N ND ND ND ND ND ND ND ND ND ND ND MW-6 ND ND ND ND ND ND ND ND ND ND ND MW-7S ND ND ND 0.01 0.01 ND ND ND 0.01 ND ND MW-8S ND ND ND ND 0.01 ND ND ND 0.01 ND ND MW-9S ND ND ND ND ND ND ND ND ND ND ND MW-10 ND ND ND ND ND ND ND ND ND ND ND MW-11S ND ND ND ND ND ND ND ND ND ND 0.01 MW-12 ND ND ND ND ND ND ND ND ND ND 0.01 MW-13S 0.01 ND ND ND ND ND ND ND ND ND ND MW-16 ND ND ND ND ND ND ND ND ND ND ND MW-18 ND ND ND ND ND ND ND ND ND ND ND MW-19S ND ND ND ND ND ND ND ND ND ND ND MW-20S 0.01 ND ND ND ND ND ND ND ND ND ND SBW-3N 0.01 ND ND ND 0.01 ND ND ND 0.01 ND ND PZ-7-86 ND ND ND ND ND ND ND ND ND ND ND X-17 ND ND ND ND ND ND ND ND ND ND ND G-2S ND ND ND 0.01 ND ND ND ND ND 0.01 ND RW-3A ND ND ND ND ND 0.01 ND ND ND ND ND RW-4A ND ND ND ND ND ND ND ND ND ND ND RW-5 0.01 0.01 ND ND ND ND ND ND ND ND ND SBW-4 1 / 0.06 0.01 0.01 ND 0.01 0.01 0.01 ND 0.01 0.01 0.01
Footnotes on Page 2
G:\ENV\TF\1001-1100\TF1034\2013\FiveYearReview\Report\Tables\ Table 9 - John Deere NAPL thickness 2008 to 2012.xls
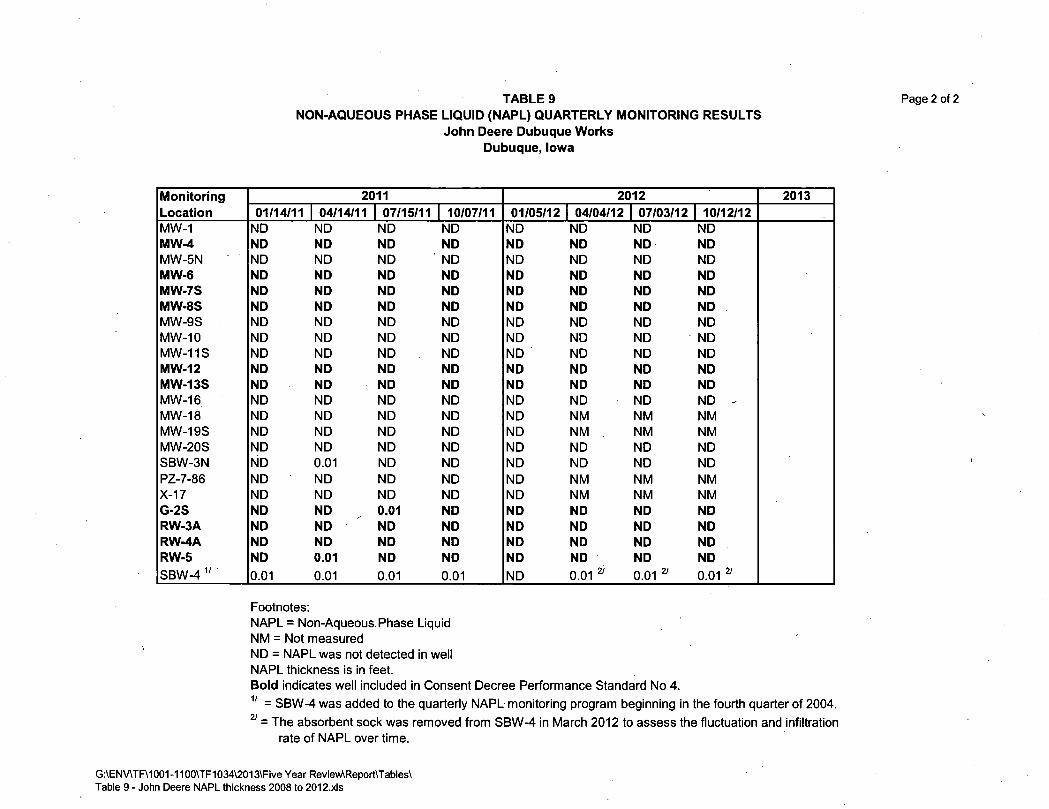
TABLE 9 NON-AQUEOUS PHASE LIQUID (NAPL) QUARTERLY MONITORING RESULTS
John Deere Dubuque Works Dubuque, Iowa
Monitoring Location
2011 2012 2013 Monitoring Location 01/14/11 04/14/11 07/15/11 10/07/11 01/05/12 04/04/12 07/03/12 10/12/12 MW-1 ND ND ND ND ND ND ND ND MW-4 ND ND ND ND ND ND ND ND MW-5N ND ND ND ND ND ND ND ND MW-6 ND ND ND ND ND ND ND ND MW-7S ND ND ND ND ND ND ND ND MW-8S ND ND ND ND ND ND ND ND MW-9S ND ND ND ND ND ND ND ND MW-10 ND ND ND ND ND ND ND ND MW-11S ND ND ND ND ND ND ND ND MW-12 ND ND ND ND ND ND ND ND MW-13S ND ND ND ND ND ND ND ND MW-16 ND ND ND ND ND ND ND ND -MW-18 ND ND ND ND ND NM NM NM MW-19S ND ND ND ND ND NM NM NM MW-20S ND ND ND ND ND ND ND ND SBW-3N ND 0.01 ND ND ND ND ND ND PZ-7-86 ND ND ND ND ND NM NM NM X-17 ND ND ND ND ND NM NM NM G-2S ND ND 0.01 ND ND ND ND ND RW-3A ND ND ND ND ND ND ND ND RW-4A ND ND ND ND ND ND ND ND RW-5 ND 0.01 ND ND ND ND ND ND SBW-4 1 / 0.01 0.01 0.01 0.01 ND 0.01 21 0.01 21 0.01 21
Footnotes: NAPL = Non-Aqueous. Phase Liquid NM = Not measured ND = NAPL was not detected in well NAPL thickness is in feet. Bold indicates well included in Consent Decree Performance Standard No 4. 1 / = SBW-4 was added to the quarterly NAPL monitoring program beginning in the fourth quarter of 2004. 2 1 = The absorbent sock was removed from SBW-4 in March 2012 to assess the fluctuation and infiltration
rate of NAPL over time.
G:\ENV\TF\1001-1100\TF1034\2013\Five Year Review\Report\Tables\ Table 9 - John Deere NAPL thickness 2008 to 2012.xls
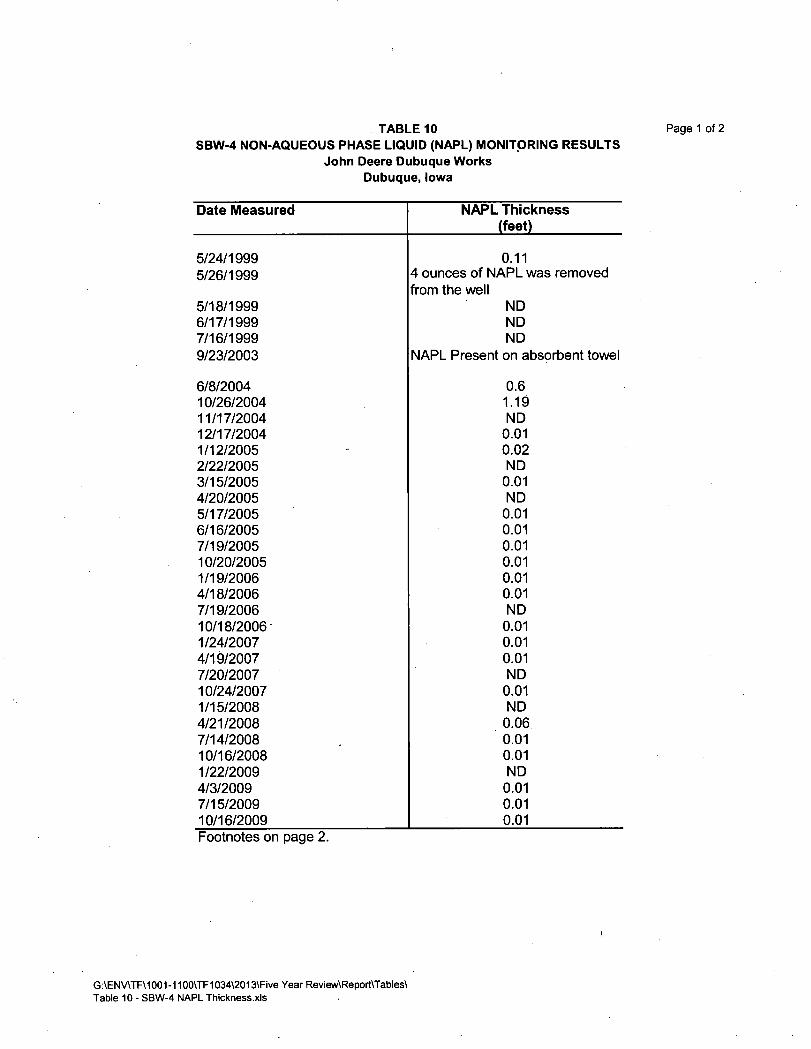
TABLE 10 Pagel of 2 SBW-4 NON-AQUEOUS PHASE LIQUID (NAPL) MONITORING RESULTS
John Deere Dubuque Works Dubuque, Iowa
Date Measured NAPL Thickness (feet)
5/24/1999 0.11 5/26/1999 4 ounces of NAPL was removed
from the well 5/18/1999 ND 6/17/1999 ND 7/16/1999 ND 9/23/2003 NAPL Present on absorbent towel
6/8/2004 0.6 10/26/2004 1.19 11/17/2004 ND 12/17/2004 0.01 1/12/2005 0.02 2/22/2005 ND 3/15/2005 0.01 4/20/2005 ND 5/17/2005 0.01 6/16/2005 0.01 7/19/2005 0.01 10/20/2005 0.01 1/19/2006 0.01 4/18/2006 0.01 7/19/2006 ND 10/18/2006 0.01 1/24/2007 0.01 4/19/2007 0.01 7/20/2007 ND 10/24/2007 0.01 1/15/2008 ND 4/21/2008 0.06 7/14/2008 0.01 10/16/2008 0.01 1/22/2009 ND 4/3/2009 0.01 7/15/2009 0.01 10/16/2009 0.01 Footnotes on page 2.
G:\ENV\TF\1001-1100\TF1034\2013\Five Year Review\Report\Tables\ Table 10 - SBW-4 NAPL Thickness.xls
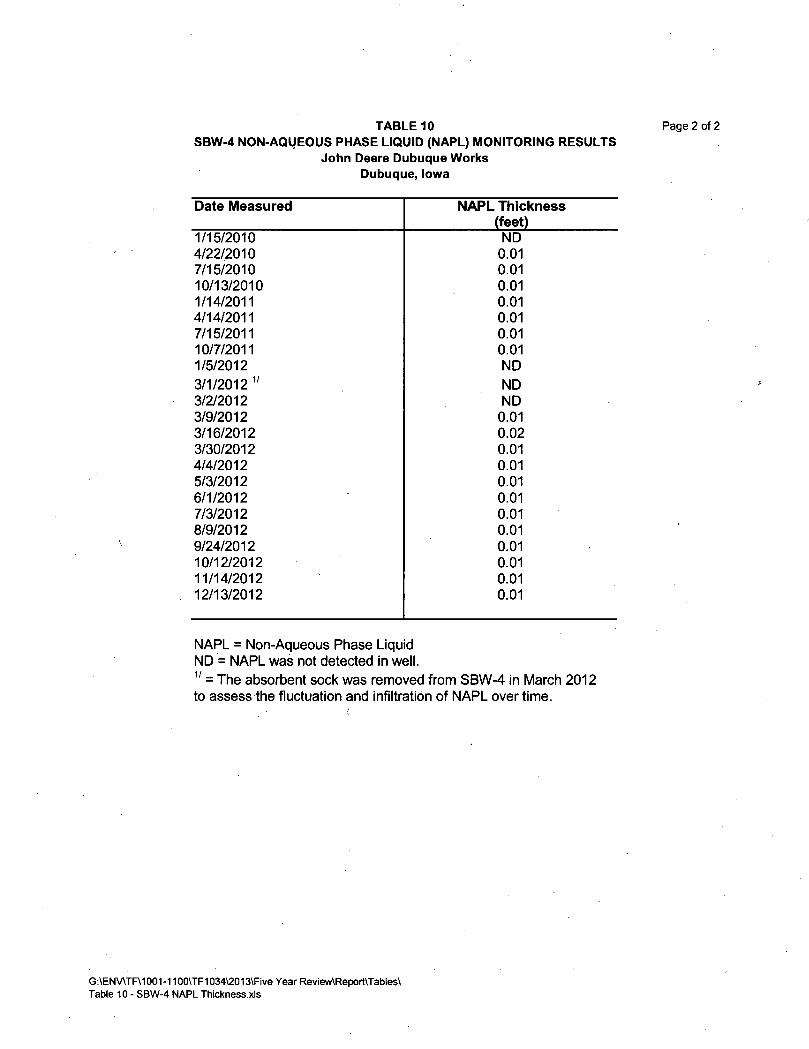
TABLE 10 Page 2 of 2 SBW-4 NON-AQUEOUS PHASE LIQUID (NAPL) MONITORING RESULTS
John Deere Dubuque Works Dubuque, Iowa
Date Measured NAPL Thickness (feet)
1/15/2010 ND 4/22/2010 0.01 7/15/2010 0.01 10/13/2010 0.01 1/14/2011 0.01 4/14/2011 0.01 7/15/2011 0.01 10/7/2011 0.01 1/5/2012 ND 3/1/2012 1 / ND 3/2/2012 ND 3/9/2012 0.01 3/16/2012 0.02 3/30/2012 0.01 4/4/2012 0.01 5/3/2012 0.01 6/1/2012 0.01 7/3/2012 0.01 8/9/2012 0.01 9/24/2012 0.01 10/12/2012 0.01 11/14/2012 0.01 12/13/2012 0.01
NAPL = Non-Aqueous Phase Liquid ND = NAPL was not detected in well. 1 / = The absorbent sock was removed from SBW-4 in March 2012 to assess the fluctuation and infiltration of NAPL overtime.
G:\ENV\TF\1001-1100\TF1034\2013\Five Year Review\Report\Tables\ Table 10 - SBW-4 NAPL Thickness.xls
APPENDICES
A Documents Reviewed
B Summary of Groundwater Analytical Data
C NPDES Permit
D November 2, 2012 Five-Year Review Site Inspection Check List and Interview Summary Forms
E Performance Standard Calculations
APPENDIX A
APPENDIX A
DOCUMENTS REVIEWED
Reports
ARCADIS U.S., Inc. Final Report 2013 First Quarter Long-Term Monitoring Report, John Deere Dubuque Works, April 2013
ARCADIS U.S., Inc. Final Report 2012 Fourth Quarter Long-Term Monitoring Report, John Deere Dubuque Works, January 2013
ARCADIS, 2012 Former Landfill Human Health Risk Assessment, John Deere Dubuque Works Dubuque, Iowa, April 2012 [Revised November 2012]
ARCADIS U.S., Inc. Final Report 2012 Third Quarter Long-Term Monitoring Report, John Deere Dubuque Works, October 2012
ARCADIS U.S., Inc. Final Report 2012 Second Quarter Long-Term Monitoring Report, John Deere Dubuque Works, July 2012
ARCADIS U.S., Inc. Final Report 2012 First Quarter Long-Term Monitoring Report, John Deere Dubuque Works, April 2012
ARCADIS U.S., Inc. Final Report 2011 Fourth Quarter Long-Term Monitoring Report, John Deere Dubuque Works, January 2012
United States Environmental Protection Agency, 20.11, Recommended Evaluation of Institutional Controls: Supplement to the "Comprehensive Five-Year Review Guidance" OSWER Directive 9355.7-18, December 2011
United States Environmental Protection Agency, 2011, Five-Year Review Summary Form Template, December 2011
ARCADIS U.S., Inc. Final Report 2011 Third Quarter Long-Term Monitoring Report, John Deere Dubuque Works, October 2011
ARCADIS U.S., Inc. John Deere Dubuque Works Five-Year Review Investigation Work Plan. August 2011.
ARCADIS U.S., Inc. Final Report 2011 Second Quarter Long-Term Monitoring Report, John Deere Dubuque Works, June 2011
ARCADIS U.S., Inc. Final Report 2011 Dubuque Works, April 2011
First Quarter Long-Term Monitoring Report, John Deere
ARCADIS U.S., Inc. Final Report 2010 Fourth Quarter Long-Term Monitoring Report, John Deere Dubuque Works, January 2011
ARCADIS U.S., Inc. Final Report 2010 Third Quarter Long-Term Monitoring Report, John Deere Dubuque Works, October 2010
ARCADIS U.S., Inc. Final Report 2010 Second Quarter Long-Term Monitoring Report, John Deere Dubuque Works, July 2010
ARCADIS U.S., Inc. Final Report 2010 First Quarter Long-Term Monitoring Report, John Deere Dubuque Works, April 2010
ARCADIS U.S., Inc. Final Report 2009 Fourth Quarter Long-Term Monitoring Report, John Deere Dubuque Works, January 2010
ARCADIS U.S., Inc. Final Report 2009 Third Quarter Long-Term Monitoring Report, John Deere Dubuque Works, October 2009
ARCADIS U.S., Inc. Final Report 2009 Second Quarter Long-Term Monitoring Report, John Deere Dubuque Works, July 2009
ARCADIS U.S., Inc. Final Report 2009 First Quarter Long-Term Monitoring Report, John Deere Dubuque Works, April 2009
ARCADIS US, Inc. Final Report 2008 Fourth Quarter Long-Term Monitoring Report, John Deere Dubuque Works, January 2009
ARCADIS G&M, Inc., Final Report 2008 Third Quarter Long-Term Monitoring Report, John Deere Dubuque Works, October 2008
United States Environmental Protection Agency, 2008, Fourth Five-Year Review April 2003 to March 2008, for John Deere Dubuque Works, Dubuque, Iowa, USEPA ID No. IAD005269527, August 11,2008
ARCADIS G&M, Inc., Final Report 2008 Second Quarter Long-Term Monitoring Report, John Deere Dubuque Works, July 2008
ARCADIS G&M, Inc., Third Five-Year Review Report March 1998 to September 2003 Recommendations, ARCADIS 2004.
ARCADIS G&M, Inc., Third Five-Year Review March 1998 to September 2003 for John Deere Dubuque Works, Dubuque, Iowa, US EPA ID No. IAD005269527, September 25, 2003
COM Federal Programs Corporation, 1998. Second Five-Year Review Report for John Deere Dubuque Works, Dubuque, Iowa, August 1998.
Geraghty & Miller, Inc., 1990, Final Remedial Design Report, September 1990
United States Environmental Protection Agency, 2001, Comprehensive Five-Year Review Guidance, Office of Emergency and Remedial Response, EPA 540-R-01-007, June 2001
United States Environmental Protection Agency, 1995, Five-Year Review Report, John Deere Dubuque Works, Dubuque, Iowa, September 1995
Geraghty & Miller, Inc., Remedial Investigation Report, August 1988
ARARs
40 CFR 141.80; Subpart I, Control of Lead and Copper
40 CFR 141.64; Subpart G, Maximum Contaminant Levels for Disinfection By-Products
USEPA Office of Water 2013 (http://www.epa.gov/safewater/contaminants/index.cfm).
USEPA Maximum Contaminant Level Standards as of February 2013 (http://www.epa.gov/safewater/contaminantsl/index.html)
USEPA Integrated Risk Information System (IRIS) 2013 (http://www.epa.gov/iris).
IDNR 2010 Iowa Environmental Protection Commission, Chapter 133, "Rules for Determining Cleanup Actions and Responsible Parties" (https://www.legis.iowa.gov/DOCS/ACO/IAC/LINC/Chapter.567.133.pdf) dated 13 January 2010.
U.S. Environmental Protection Agency (USEPA), 1991. Risk Assessment Guidance for Superfund, Human Health Evaluation Manual. Part 8: Development of Risk-based Preliminary Remediation Goals. Office of Solid Waste and Emergency Response, Washington, DC. OSWER Directive 9285.7-018. December 13.
U.S. Environmental Protection Agency (USEPA), 1997. Health Effects Assessment Summary Tables, FY-1997 Update. Office of Research and Development and Office of Emergency and Remedial Response, Washington, DC. EPA/540/R-97/036. OERR 9200.6-303(97-1). NTIS No. PB97-921199. July.
NPDES Records
Iowa Department of Natural Resources, National Pollutant Discharge Elimination System (NPDES) Permit for John Deere Dubuque Works, Iowa NPDES Permit Number 31-26-1-07, Date of Issuance: July 15, 1999, Date of Expiration: July 14, 2004.
April 2008 through March 2013 John Deere Dubuque Works, Wastewater Monitoring Reports, Facility #31-26-1-07, April 2003-March 2013. The JDDW NPDES Database for monthly NPDES Reports was used to determine exceedances of effluent limitations for the period April 2008 to March 2013.
Site Renositorv Documents on February 4. 2008 - Carnegie-Stout Public Library. Diihnoue. Iowa. November 2. 2012 Site Inspection found documents had been removed from library.
ARCADIS G&M, Inc., Third Five-Year Review March 1998 to September 2003 for John Deere Dubuque Works, Dubuque, Iowa, USEPA, ID No. IAD005269527, September 25, 2003.
Geraghty & Miller, Inc., 1988, Remedial Investigation, John Deere Dubuque Works, Dubuque, Iowa, Final Draft, August 1, 1988. Volumes 1 through 14.
G&M Consulting Engineers, Inc. 1988, Feasibility Study, Final Draft Report prepared for John Deere Dubuque Works, Dubuque, Iowa, August 1988.
United States Army Corps of Engineers, Rock Island District, 1986, Environmental Assessment for Real Estate Action, Proposed Long-term Strategy for Maintenance Dredging at John Deere Dubuque Works, Dubuque County, Iowa, April 1986.
United States Environmental Protection Agency, 1995, John Deere Dubuque Works, Dubuque, Iowa, Superfund Site, Administrative Record Addendum, October 1995, Region VII, Superfund Division, USEPA-Five Year Review Report, John Deere Dubuque Works, Dubuque, Iowa, September 1995 conducted by USEPA Region VII, Kansas City, Kansas.
United States Environmental Protection Agency, 1988, Record of Decision, John Deere Dubuque Works Company Superfund Site, Dubuque, Iowa, USEPA Region VII, Kansas City, Kansas, September 29, 1988.
United States Environmental Protection Agency, John Deere Dubuque Works Superfund Site, Dubuque, Iowa, 1988, Administrative Record Index, August 1988.
John Deere Dubuque Works, Dubuque, Iowa, Superfund Site, Administrative Record, File 1/4 Containing Documents Dated From January 1, 1912 to April 27,1984.
John Deere Dubuque Works, Dubuque, Iowa, Superfund Site, Administrative Record, File 2/4 Containing Documents Dated From May 11, 1984 to April 1, 1986.
John Deere Dubuque Works, Dubuque, Iowa, Superfund Site, Administrative Record, File 3/4 Containing Documents Dated From April 9, 1986 to May 14, 1987.
John Deere Dubuque Works, Dubuque, Iowa, Superfund Site, Administrative Record, File 4/4 Containing Documents Dated From April 15,1987 to June 30, 1988.
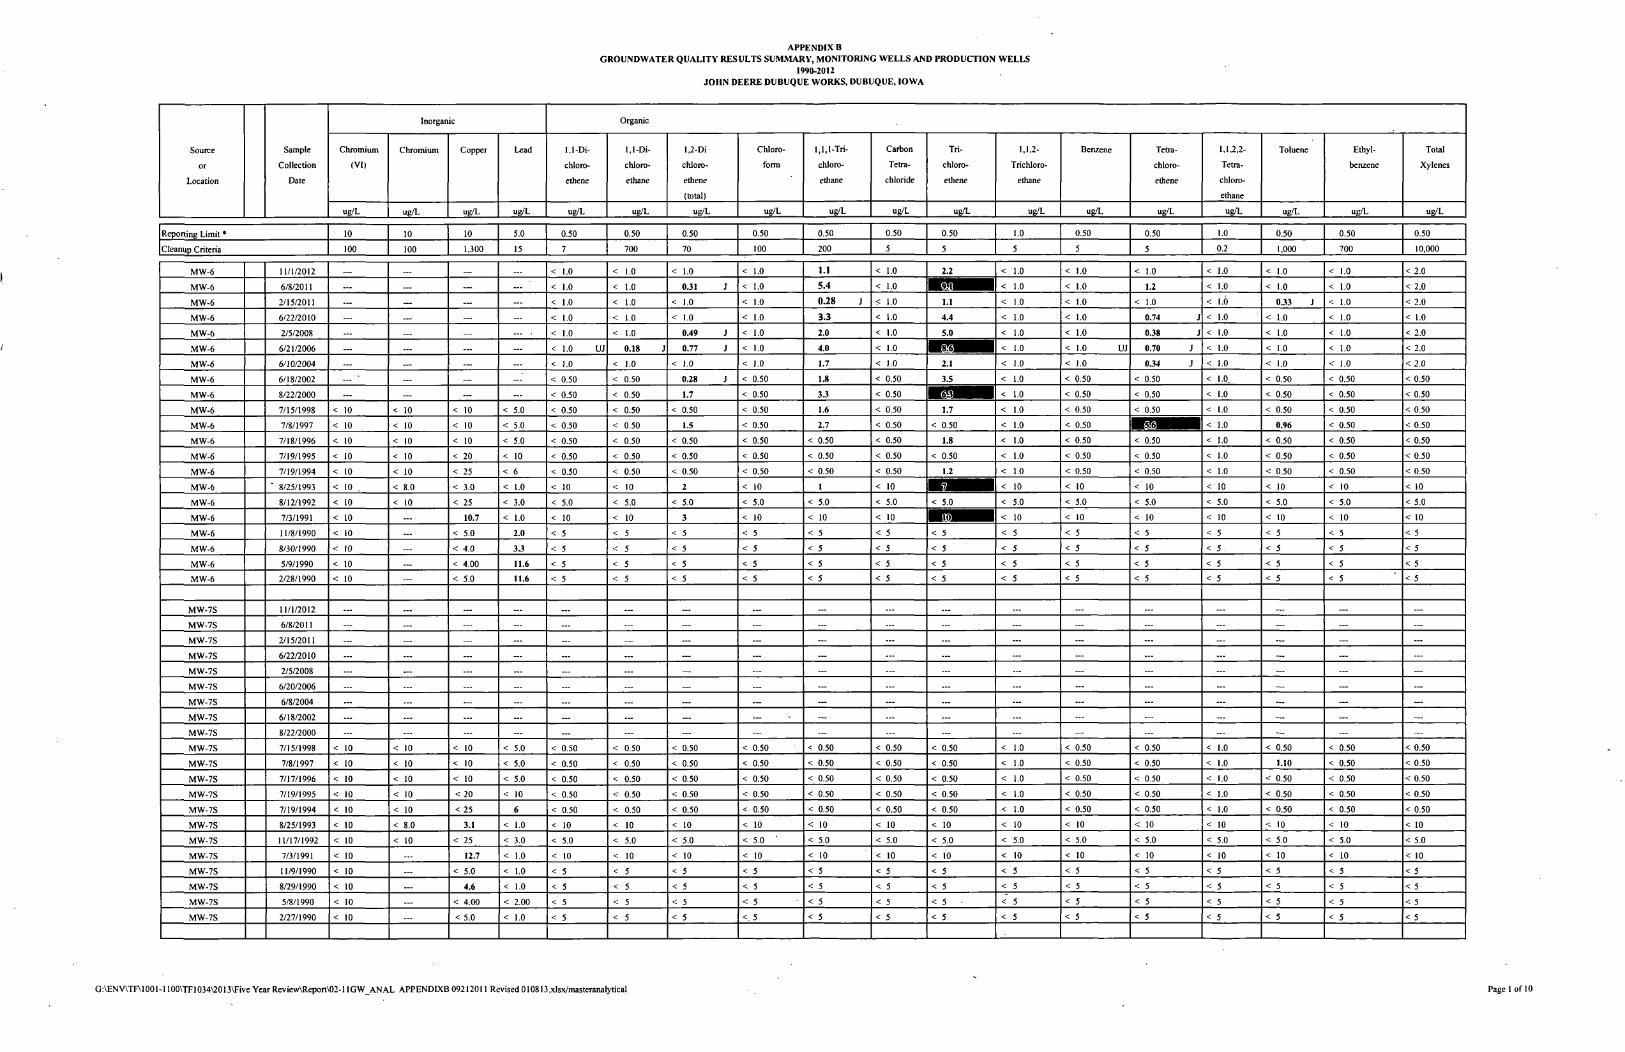
APPENDIX B GROUNDWATER QUALITY RESULTS SUMMARY, MONITORING WELLS AND PRODUCTION WELLS
1990-2012 JOHN DEERE DUBUQUE WORKS, DUBUQUE, IOWA
Inorganic Organic
Source Sample Chromium Chromium Copper Lead 1,1-Di- 1,1-Di- 1,2-Di Chloro 1,1,1-Tri- Carbon Tri- 1,1,2- Benzene Tetia- 1,1,2,2- Toluene Ethyl- Total
or Collection (VI) chloro- chloro- chloro- form chloro- Tetra chloro- Trichloro- chloro- Tetra- benzene Xylenes
Location Date ethene ethane ethene ethane chloride ethene ethane ethene chloro-
(total) ethane
ug/L ug/L ug/L ug/L ug/L ug/L ug/L ug/L ug/L ug/L ug/L ug/L ug/L ug/L ug/L ug/L ug/L ug/L
Reporting Limit * 10 10 10 5.0 0.50 0.50 0.50 0.50 0.50 0.50 0.50 1.0 0.50 0.50 1.0 0.50 0.50 0.50
Cleanup Criteria 100 100 1,300 15 7 700 70 100 200 5 5 5 5 5 0.2 1,000 700 10,000
MW-6 11/1/2012 < 1.0 < 1.0 < 1.0 < 1.0 1.1 < 1.0 2.2 < 1.0 < 1.0 < 1.0 < 1.0 < 1.0 < 1.0 < 2.0
MW-6 6/8/2011 — < 1.0 < 1.0 0.31 J < 1.0 5.4 < 1.0 < 1.0 < 1.0 1.2 < 1.0 < 1.0 < 1.0 < 2.0
MW-6 2/15/2011 < 1.0 < 1.0 < 1.0 < 1.0 0.28 J * 1.0 i . i < 1.0 < 1.0 < 1.0 < 1.6 0.33 J < 1.0 < 2.0
MW-6 6/22/2010 < 1.0 < 1.0 < 1.0 < 1.0 3.3 < 1.0 4.4 < 1.0 < 1.0 0.74 J < 1.0 < 1.0 < 1.0 < 1.0
MW-6 2/5/2008 — ... — . < 1.0 < 1.0 0.49 J < 1.0 2.0 < 1.0 5.0 < 1.0 < 1.0 0.38 J < 1.0 < 1.0 < 1.0 < 2.0
MW-6 6/21/2006 ... ... < 1.0 UJ 0.18 J 0.77 J < 1.0 4.0 < 1.0 < 1.0 < 1.0 UJ 0.70 J < 1.0 < 1.0 < 1.0 < 2.0
MW-6 6/10/2004 < 1.0 < 1.0 < 1.0 < 1.0 1.7 < 1.0 2.1 < 1.0 < 1.0 0.34 J < 1.0 < 1.0 < 1.0 < 2.0
MW-6 6/18/2002 ' < 0.50 < 0.50 0.28 J < 0.50 1.8 < 0.50 3.5 < 1.0 < 0.50 < 0.50 < 10 < 0.50 < 0.50 < 0.50
MW-6 8/22/2000 < 0.50 < 0.50 1.7 < 0.50 3.3 < 0.50 as < 1.0 < 0.50 < 0.50 < 1.0 < 0.50 < 0.50 < 0.50
MW-6 7/15/1998 < 10 < 10 < 10 < 5.0 < 0.50 < 0.50 < 0.50 < 0.50 1.6 < 0.50 1.7 < 1.0 < 0.50 < 0.50 < 1.0 < 0.50 < 0.50 < 0.50
MW-6 7/8/1997 < 10 < 10 < 10 < 5.0 < 0.50 < 0.50 1.5 < 0.50 2.7 < 0.50 < 0.50 < 1.0 < 0.50 as < 1.0 0.96 < 0.50 < 0.50
MW-6 7/18/1996 < 10 < 10 < 10 < 5.0 < 0.50 < 0.50 < 0.50 < 0.50 < 0.50 < 0.50 1.8 < 1.0 < 0.50 < 0.50 < 1.0 < 0.50 < 0.50 < 0.50
MW-6 7/19/1995 < 10 < 10 < 20 < 10 < 0.50 < 0.50 < 0.50 < 0.50 < 0.50 < 0.50 < 0.50 < 1.0 < 0.50 < 0.50 < 1.0 < 0.50 < 0.50 < 0.50
MW-6 7/19/1994 < 10 < 10 < 25 < 6 < 0.50 < 0.50 < 0.50 < 0.50 < 0.50 < 0.50 1.2 < 1.0 < 0.50 < 0.50 < 1.0 < 0.50 < 0.50 < 0.50
MW-6 " 8/25/1993 < 10 < 8.0 < 3.0 < 1.0 < 10 < 10 2 < 10 1 < 10 » < 10 < 10 < 10 < 10 < 10 < 10 < 10
MW-6 8/12/1992 < 10 < 10 < 25 < 3.0 < 5.0 < 5.0 < 5.0 < 5.0 < 5.0 < 5.0 < 5.0 < 5.0 < 5.0 < 5.0 < 5.0 < 5.0 < 5.0 < 5.0
MW-6 7/3/1991 < 10 10.7 < 1.0 < 10 < 10 3 < 10 < 10 < 10 < 10 < 10 < 10 < 10 < 10 < 10 < 10
MW-6 11/8/1990 < 10 < 5.0 2.0 < 5 < 5 < 5 < 5 < 5 < 5 < 5 < 5 < 5 < 5 < 5 < 5 < 5 < 5
MW-6 8/30/1990 < 10 < 4.0 3.3 < 5 < 5 < 5 < 5 < 5 < 5 < 5 < 5 < 5 < 5 < 5 < 5 < 5 < 5
MW-6 5/9/1990 < 10 < 4.00 11.6 < 5 < 5 < 5 < 5 < 5 < 5 < 5 < 5 < 5 < 5 < 5 < 5 < 5 < 5
MW-6 2/28/1990 < 10 < 5.0 11.6 < 5 < 5 < 5 < 5 < 5 < 5 < 5 < 5 < 5 < 5 < 5 < 5 < 5 < 5
MW-7S 11/1/2012 ... ... ... ... ... ... — ... ... MW-7S 6/8/2011 _ ... ... ... ... — ... ... ... ... ... ... ... ... ... ... MW-7S 2/15/2011 — ... ... — ... — .._ ... ... ... ... ... — ... .__ ... MW-7S 6/22/2010 ... — ... ... ... ... ... ... ... ... ... ... ... ... MW-7S 2/5/2008 ... ... ... — ._. ... ... ... ... ... ... ... ... ... — MW-7S 6/20/2006 ... ... ... ... ... ... ... ... ... ... ... _. ... — MW-7S 6/8/2004 ... ... ... ... ... ... ... ... ... ... ... ... ... MW-7S 6/18/2002 ... ... ... ... ... ... ... ... ... ... ... ... MW-7S 8/22/2000 ... ... .._ ... ... ... — ... ... ... ... _. MW-7S 7/15/1998 < 10 < 10 < 10 < 5.0 < 0.50 < 0.50 < 0.50 < 0.50 < 0.50 < 0.50 < 0.50 < 1.0 < 0.50 < 0.50 < 1.0 < 0.50 < 0.50 < 0.50
MW-7S 7/8/1997 < 10 < 10 < 10 < 5.0 < 0.50 < 0.50 < 0.50 < 0.50 < 0.50 < 0.50 < 0.50 < 1.0 < 0.50 < 0.50 < 1.0 1.10 < 0.50 < 0.50
MW-7S 7/17/1996 < 10 < 10 < 10 < 5.0 < 0.50 < 0.50 < 0.50 < 0.50 < 0.50 < 0.50 < 0.50 < 1.0 < 0.50 < 0.50 < 1.0 < 0.50 < 0.50 < 0.50
MW-7S 7/19/1995 < 10 < 10 < 20 < 10 < 0.50 < 0.50 < 0.50 < 0.50 < 0.50 < 0.50 < 0.50 < 1.0 < 0.50 < 0.50 < 1.0 < 0.50 < 0.50 < 0.50
MW-7S 7/19/1994 < 10 < 10 < 25 6 < 0.50 < 0.50 < 0.50 < 0.50 < 0.50 < 0.50 < 0.50 < 1.0 < 0.50 < 0.50 < 1.0 < 0.50 < 0.50 < 0.50
MW-7S 8/25/1993 < 10 < 8.0 3.1 < 1.0 < 10 < 10 < 10 < 10 < 10 < 10 < 10 < 10 < 10 < 10 < 10 < 10 < 10 < 10
MW-7S 11/17/1992 < 10 < 10 < 25 < 3.0 < 5.0 < 5.0 < 5.0 < 5.0 ' < 5.0 < 5.0 < 5.0 < 5.0 < 5.0 < 5.0 < 5.0 < 5.0 < 5.0 < 5.0
MW-7S 7/3/1991 < 10 — 12.7 < 1.0 < 10 < 10 < 10 < 10 < 10 < 10 < 10 < 10 < 10 < 10 < 10 < 10 < 10 < 10
MW-7S 11/9/1990 < 10 < 5.0 < 1.0 < 5 < 5 < 5 < 5 < 5 < 5 < 5 < 5 < 5 < 5 < 5 < 5 < 5 < 5
MW-7S 8/29/1990 < 10 4.6 < 1.0 < 5 < 5 < 5 < 5 < 5 < 5 < 5 < 5 < 5 < 5 < 5 < 5 < 5 < 5
MW-7S 5/8/1990 < 10 ... < 4.00 < 2.00 < 5 < 5 < 5 < 5 < 5 < 5 < 5 • < 5 < 5 < 5 < 5 < 5 < 5 < 5
MW-7S 2/27/1990 < 10 < 5.0 < 1.0 < 5 < 5 < 5 < 5 < 5 < 5 < 5 < 5 < 5 < 5 < 5 < 5 < 5 < 5
G:\ENV\TFM001-1100\TF1034\2013\Five Year Review\Report\02-l 1GWANAL APPENDLXB 09212011 Revised 010813.xlsx/masteranalytical Page 1 of 10
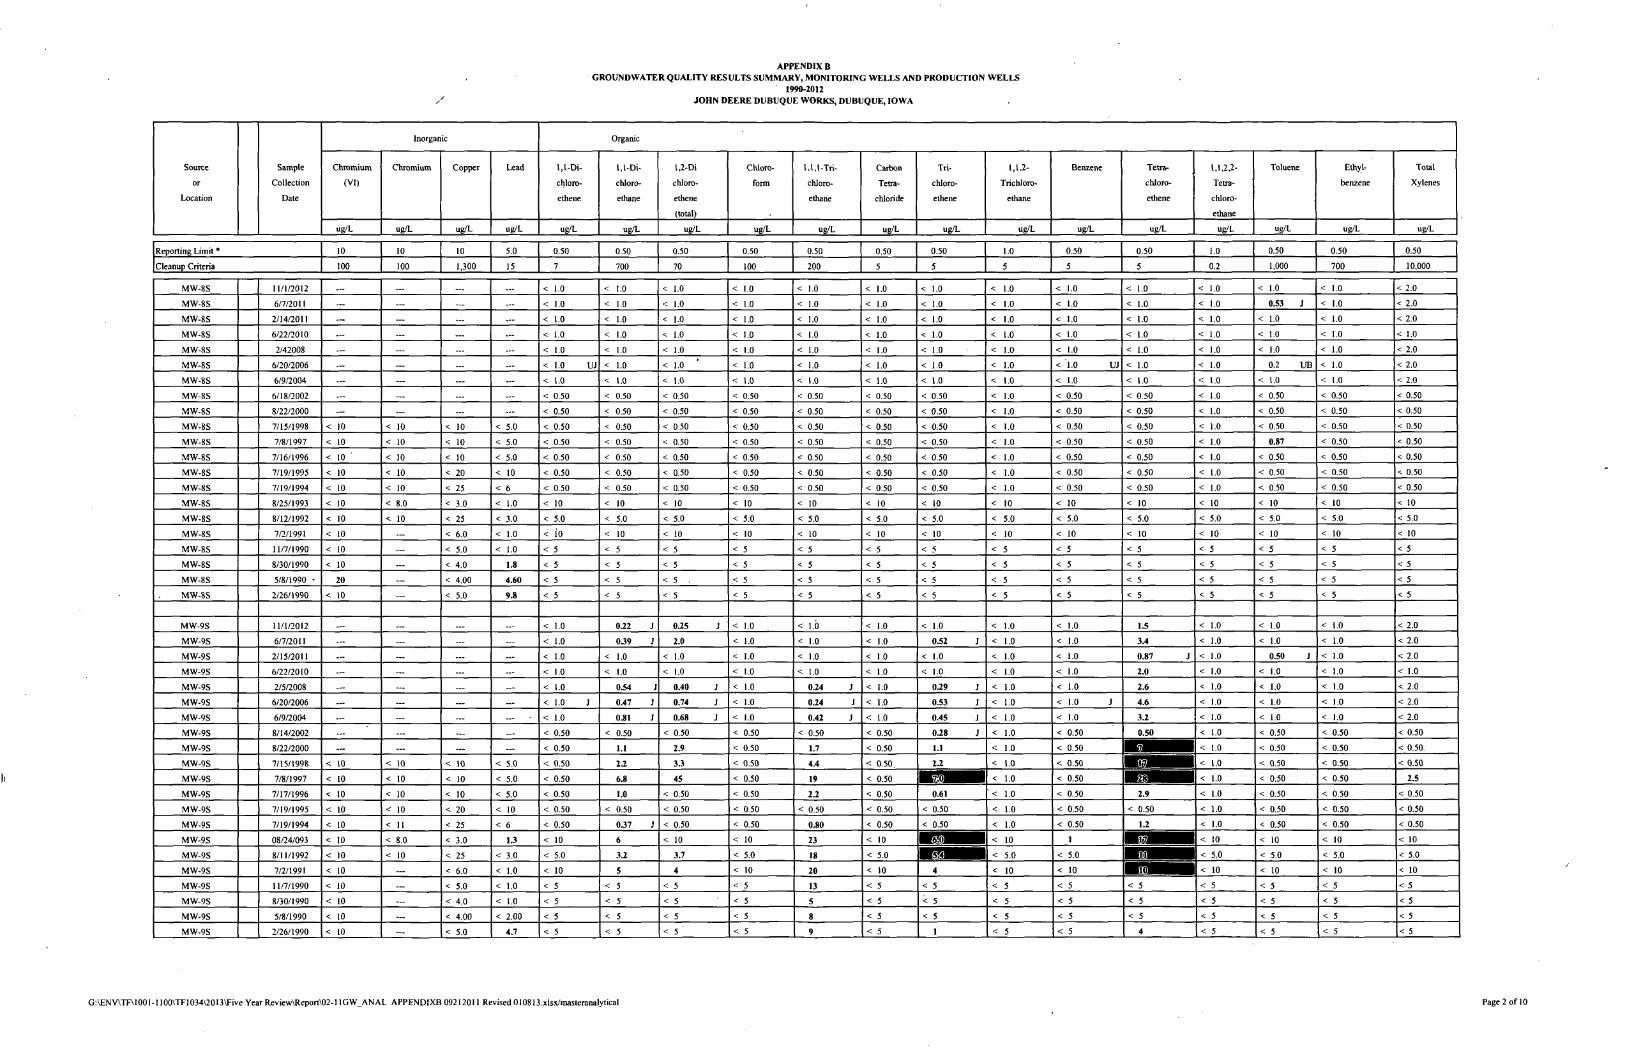
APPENDIX B GROUNDWATER QUALITY RESULTS SUMMARY, MONITORING WELLS AND PRODUCTION WELLS
1990-2012 JOHN DEERE DUBUQUE WORKS, DUBUQUE, IOWA
Inorganic Organic
Source Sample Chromium Chromium Copper Lead 1,1-Di- 1,1-Di- 1,2-Di Chloro 1,1,1-Tri- Caibon Tri- 1,1,2- Benzene Tetra- 1,1,2,2- Toluene Ethyl- Total
or Collection (VI) chloro- chloro- chloro- form chloro- Tetra chloro- Trichloro- chloro- Tetra- benzene Xylenes
Location Date ethene ethane ethene ethane chloride ethene ethane ethene chloro-
(total) ethane
ug/L ug/L ug/L ug/L ug/L ug/L ug/L ug/L ug/L ug/L ug/L ug/L Ug/L ug/L ug/L ug/L ug/L ug/L
Reporting Limit * 10 10 10 5.0 0.50 0.50 0.50 0.50 0.50 0.50 0.50 1.0 0.50 0.50 1.0 0.50 0.50 0.50
Cleanup Criteria 100 100 1,300 15 7 700 70 100 200 5 5 5 5 5 0.2 1,000 700 10,000
MW-8S 11/1/2012 — ... < 1.0 < 1.0 < 1.0 < 1.0 < 1.0 < 1.0 < 1.0 < 1.0 < 1.0 < 1.0 < 1.0 < 1.0 < 1.0 < 2.0
MW-8S 6/7/2011 — — < 1.0 < 1.0 < 1.0 < 1.0 < 1.0 < 1.0 < 1.0 < 1.0 < 1.0 < 1.0 < 1.0 0.53 J < 1.0 < 2.0
MW-8S 2/14/2011 — _— < 1.0 < 1.0 < 1.0 < 1.0 < 1.0 < 1.0 < 1.0 < 1.0 < 1.0 < 1.0 < 1.0 < 1.0 < 1.0 < 2.0
MW-8S 6/22/2010 < 1.0 < 1.0 < 1.0 < 1.0 < 1.0 < 1.0 < 1.0 < 1.0 < 1.0 < 1.0 < 1.0 < 1.0 < 1.0 < 1.0
MW-8S 2/42008 ... < 1.0 < 1.0 < 1.0 < 1.0 < 1.0 < 1.0 < 1.0 < 1.0 < 1.0 < 1.0 < 1.0 < 1.0 < 1.0 < 2.0
MW-8S 6/20/2006 — ... < 1.0 UJ < 1.0 < 1.0 < 1.0 < 1.0 < 1.0 < 1.0 < 1.0 < 1.0 UJ < 1.0 < 1.0 0.2 UB < 1.0 < 2.0
MW-8S 6/9/2004 — ... < 1.0 < 1.0 < 1.0 < 1.0 < 1.0 < 1.0 < 1.0 < 1.0 < 1.0 < 1.0 < 1.0 < 1.0 < 1.0 < 2.0
MW-8S 6/18/2002 — ... < 0.50 < 0.50 < 0.50 < 0.50 < 0.50 < 0.50 < 0.50 < 1.0 < 0.50 < 0.50 < 1.0 < 0.50 < 0.50 < 0.50
MW-8S 8/22/2000 ... < 0.50 < 0.50 < 0.50 < 0.50 < 0.50 < 0.50 < 0.50 < 1.0 < 0.50 < 0.50 < 1.0 < 0.50 < 0.50 < 0.50
MW-8S 7/15/1998 < 10 < 10 < 10 < 5.0 < 0.50 < 0.50 < 0.50 < 0.50 < 0.50 < 0.50 < 0.50 < 1.0 < 0.50 < 0.50 < 1.0 < 0.50 < 0.50 < 0.50
MW-8S 7/8/1997 < 10 < 10 < 10 < 5.0 < 0.50 < 0.50 < 0.50 < 0.50 < 0.50 < 0.50 < 0.50 < 1.0 < 0.50 < 0.50 < 1.0 0.87 < 0.50 < 0.50
MW-8S 7/16/1996 < 10 ' < 10 < 10 < 5.0 < 0.50 < 0.50 < 0.50 < 0.50 < 0.50 < 0.50 < 0.50 < 1.0 < 0.50 < 0.50 < 1.0 < 0.50 < 0.50 < 0.50
MW-8S 7/19/1995 < 10 < 10 < 20 < 10 < 0.50 < 0.50 < 0.50 < 0.50 < 0.50 < 0.50 < 0.50 < 1.0 < 0.50 < 0.50 < 1.0 < 0.50 < 0.50 < 0.50
MW-8S 7/19/1994 < 10 < 10 < 25 < 6 < 0.50 < 0.50 < 0.50 < 0.50 < 0.50 < 0.50 < 0.50 < 1.0 < 0.50 < 0.50 < 1.0 < 0.50 < 0.50 < 0.50
MW-8S 8/25/1993 < 10 < 8.0 < 3.0 < 1.0 < 10 < 10 < 10 < 10 < 10 < 10 < 10 < 10 < 10 < 10 < 10 < 10 < 10 < 10
MW-8S 8/12/1992 < 10 < 10 < 25 < 3.0 < 5.0 < 5.0 < 5.0 < 5.0 < 5.0 < 5.0 < 5.0 < 5.0 < 5.0 < 5.0 < 5.0 < 5.0 < 5.0 < 5.0
MW-8S 7/2/1991 < 10 ... < 6.0 < 1.0 < 10 < 10 < 10 < 10 < 10 < 10 < 10 < 10 < 10 < 10 < 10 < 10 < 10 < 10
MW-8S 11/7/1990 < 10 ... < 5.0 < 1.0 < 5 < 5 < 5 < 5 < 5 < 5 < 5 < 5 < 5 < 5 < 5 < 5 < 5 < 5
MW-8S 8/30/1990 < 10 ... < 4.0 1.8 < 5 < 5 < 5 < 5 < 5 < 5 < 5 < 5 < 5 < 5 < 5 < 5 < 5 < 5
MW-8S 5/8/1990 • 20 < 4.00 4.60 < 5 < 5 < 5 . < 5 < 5 < 5 < 5 < 5 < 5 < 5 < 5 < 5 < 5 < 5
MW-8S 2/26/1990 < 10 ... < 5.0 9.8 < 5 < 5 < 5 < 5 < 5 < 5 < 5 < 5 < 5 < 5 < 5 < 5 < 5 < 5
MW-9S 11/1/2012 — < 1.0 0.22 J 0.25 J < 1.0 < l.b < 1.0 < 1.0 < 1.0 < 1.0 1.5 < 1.0 < 1.0 < 1.0 < 2.0
MW-9S 6/7/2011 ... ... < 1.0 0.39 J 2.0 < 1.0 < 1.0 < 1.0 0.52 J < 1.0 < 1.0 3.4 < 1.0 < 1.0 < 1.0 < 2.0
MW-9S 2/15/2011 ... — ... < 1.0 < 1.0 < 1.0 < 1.0 < 1.0 < 1.0 < 1.0 < 1.0 < 1.0 0.87 J < 1.0 0.50 J < 1.0 < 2.0
MW-9S 6/22/2010 — ... < 1.0 < 1.0 < 1.0 < 1.0 < 1.0 < 1.0 < 1.0 < 1.0 < 1.0 2.0 < 1.0 < 1.0 < 1.0 < 1.0
MW-9S 2/5/2008 ... — ... ... < 1.0 0.54 J 0.40 J < 1.0 0.24 J < 1.0 0.29 J < 1.0 < 1.0 2.6 < 1.0 < 1.0 < 1.0 < 2.0
MW-9S 6/20/2006 < 1.0 J 0.47 J 0.74 J < 1.0 0.24 J < 1.0 0.53 J < 1.0 < 1.0 J 4.6 < 1.0 < 1.0 < 1.0 < 2.0
MW-9S 6/9/2004 — < 1.0 0.81 J 0.68 J < 1.0 0.42 J < 1.0 0.45 J < 1.0 < 1.0 3.2 < 1.0 < 1.0 < 1.0 < 2.0
MW-9S 8/14/2002 ... < 0.50 < 0.50 < 0.50 < 0.50 < 0.50 < 0.50 0.28 J < 1.0 < 0.50 0.50 < 1.0 < 0.50 < 0.50 < 0.50
MW-9S 8/22/2000 ... < 0.50 1.1 2.9 < 0.50 1.7 < 0.50 1.1 < 1.0 < 0.50 < 1.0 < 0.50 < 0.50 < 0.50
MW-9S 7/15/1998 < 10 < 10 < 10 < 5.0 < 0.50 2.2 3.3 < 0.50 4.4 < 0.50 2.2 < 1.0 < 0.50 1 w < 1.0 < 0.50 < 0.50 < 0.50
MW-9S 7/8/1997 < 10 < 10 < 10 < 5.0 < 0.50 6.8 45 < 0.50 19 < 0.50 < 1.0 < 0.50 < 1.0 < 0.50 < 0.50 2.5
MW-9S 7/17/1996 < 10 < 10 < 10 < 5.0 < 0.50 1.0 < 0.50 < 0.50 2.2 < 0.50 0.61 < 1.0 < 0.50 2.9 < 1.0 < 0.50 < 0.50 < 0.50
MW-9S 7/19/1995 < 10 < 10 < 20 < 10 < 0.50 < 0.50 < 0.50 < 0.50 < 0.50 < 0.50 < 0.50 < 1.0 < 0.50 < 0.50 < 1.0 < 0.50 < 0.50 < 0.50
MW-9S 7/19/1994 < 10 < 11 < 25 < 6 < 0.50 0.37 J < 0.50 < 0.50 0.80 < 0.50 < 0.50 < 1.0 < 0.50 1.2 < 1.0 < 0.50 < 0.50 < 0.50
MW-9S 08/24/093 < 10 < 8.0 < 3.0 1.3 < 10 6 < 10 < 10 23 < 10 <3ffl < 10 1 [ as < 10 < 10 < 10 < 10
MW-9S 8/11/1992 < 10 < 10 < 25 < 3.0 < 5.0 3.2 3.7 < 5.0 18 < 5.0 1 m < 5.0 < 5.0 1 00 < 5.0 < 5.0 < 5.0 < 5.0
MW-9S 7/2/1991 < 10 < 6.0 < 1.0 < 10 5 4 < 10 20 < 10 4 < 10 < 10 1 OD < 10 < 10 < 10 < 10
MW-9S 11/7/1990 < 10 ... < 5.0 < 1.0 < 5 < 5 < 5 < 5 13 < 5 < 5 < 5 < 5 < 5 < 5 < 5 < 5 < 5
MW-9S 8/30/1990 < 10 — < 4.0 < 1.0 < 5 < 5 < 5 < 5 5 < 5 < 5 < 5 < 5 < 5 < 5 < 5 < 5 < 5
MW-9S 5/8/1990 < 10 — < 4.00 < 2.00 < 5 < 5 < 5 < 5 8 < 5 < 5 < 5 < 5 < 5 < 5 < 5 < 5 < 5
MW-9S 2/26/1990 < 10 — < 5.0 4.7 < 5 < 5 < 5 < 5 9 < 5 1 < 5 < 5 4 < 5 < 5 < 5 < 5
G:\ENV\TF\1001-1100\TF1034\2013\Five Year Review\Report\02-l 1GW ANAL APPENDIXB 09212011 Revised 010813.xlsx/masleranalytical Page 2 of 10
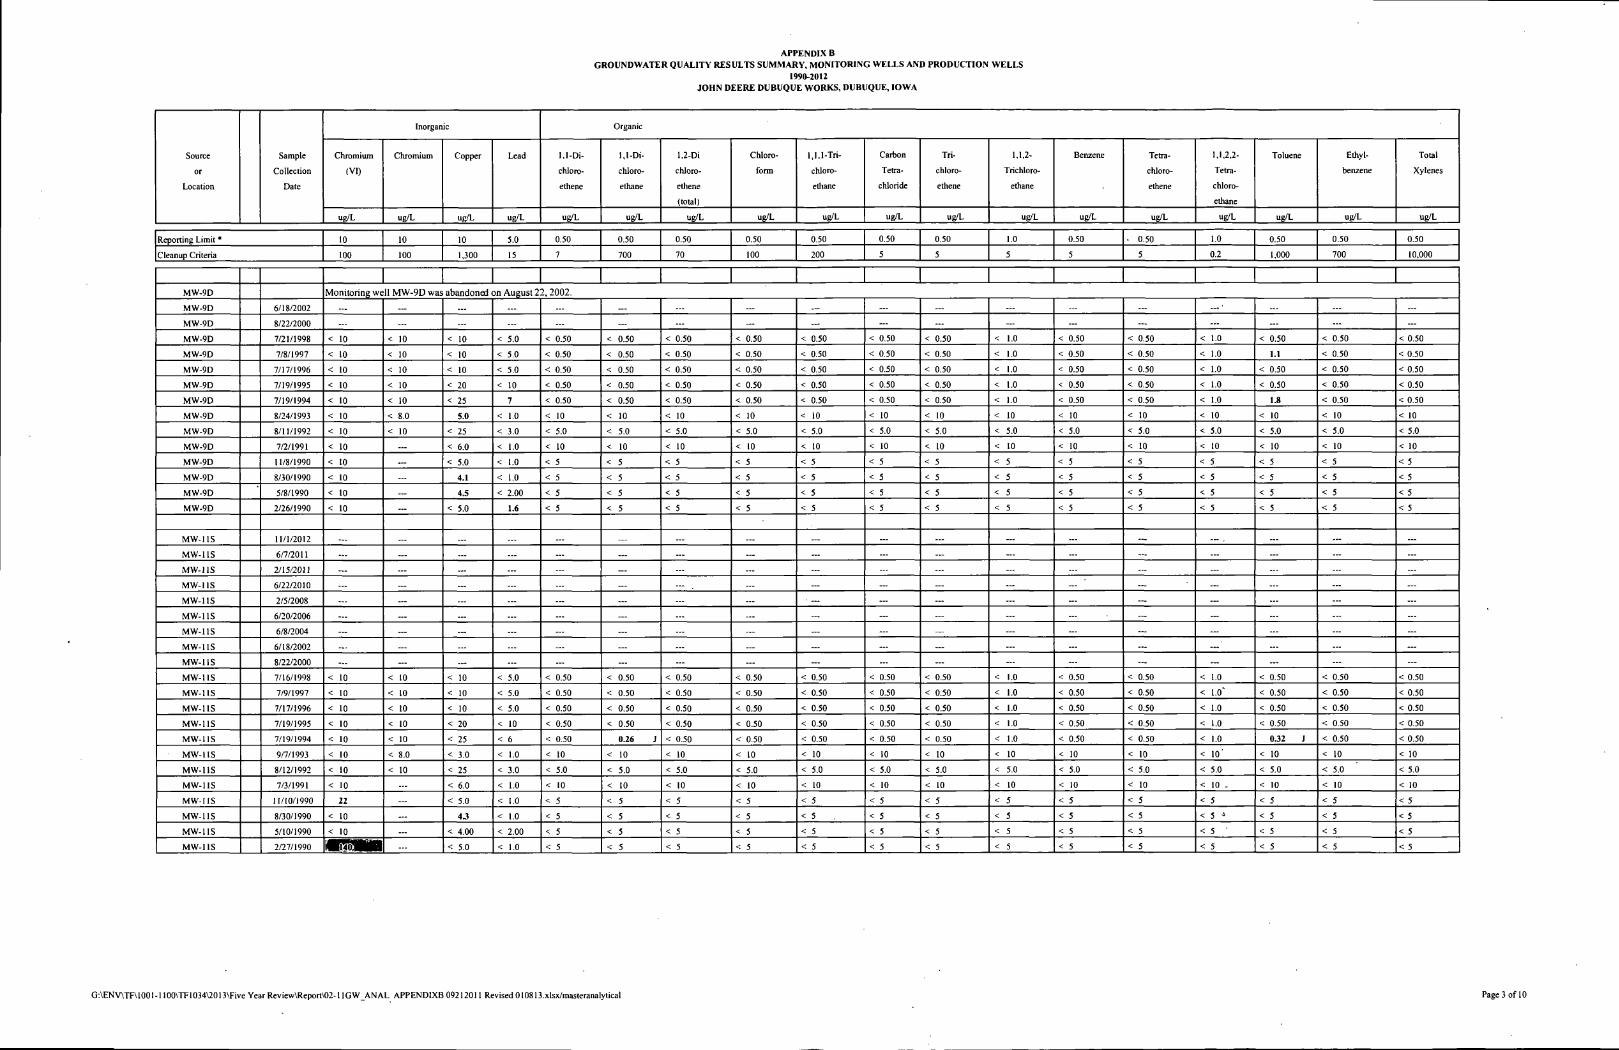
APPENDIX B GROUNDWATER QUALITY RESULTS SUMMARY, MONITORING WELLS AND PRODUCTION WELLS
1990-2012 JOHN DEERE DUBUQUE WORKS, DUBUQUE, IOWA
Inorganic Organic
Source Sample Chromium Chromium Copper Lead 1,1-Di- 1,1-Di- 1,2-Di Chloro 1,1,1-Tri- Carbon Tri- 1.1,2- Benzene Tetra- 1,1,2,2- Toluene Ethyl- Total
or Collection (VI) chloro- chloro- chloro- form chloro- Tetra chloro- Trichloro- chloro- Tetra- benzene Xylenes
Location Date ethene ethane ethene ethane chloride ethene ethane ethene chloro-
(total) ethane
ug/L ug/L ug/L ug/L ug/L ug/L ug/L ug/L ug/L ug/L ug/L ug/L ug/L ug/L ug/L ug/L ug/L ug/L
Reporting Limit * 10 10 10 5.0 0.50 0.50 0.50 0.50 0.50 0.50 0.50 1.0 0.50 • 0.50 1.0 0.50 0.50 0.50
Cleanup Criteria 100 100 1,300 15 7 700 70 100 200 5 5 5 5 5 0.2 1,000 700 10,000
MW-9D Monitoring well MW-9D was abandoned on August 22,2002.
MW-9D 6/18/2002 ... ... ... ... ... — — ... MW-9D 8/22/2000 ... ... ... _.. ... ... ... ... ... ... ... ... ... ... MW-9D 7/21/1998 < 10 < 10 < 10 < 5.0 < 0.50 < 0.50 < 0.50 < 0.50 < 0.50 < 0.50 < 0.50 < 1.0 < 0.50 < 0.50 < 1.0 < 0.50 < 0.50 < 0.50
MW-9D 7/8/1997 < 10 < 10 < 10 < 5.0 < 0.50 < 0.50 < 0.50 < 0.50 < 0.50 < 0.50 < 0.50 < 1.0 < 0.50 < 0.50 < 1.0 1.1 < 0.50 < 0.50
MW-9D 7/17/1996 < 10 < 10 < 10 < 5.0 < 0.50 < 0.50 < 0.50 < 0.50 < 0.50 < 0.50 < 0.50 < 1.0 < 0.50 < 0.50 < 1.0 < 0.50 < 0.50 < 0.50
MW-9D 7/19/1995 < 10 < 10 < 20 < 10 < 0.50 < 0.50 < 0.50 < 0.50 < 0.50 < 0.50 < 0.50 < 1.0 < 0.50 < 0.50 < 1.0 < 0.50 < 0.50 < 0.50
MW-9D 7/19/1994 < 10 < 10 < 25 7 < 0.50 < 0.50 < 0.50 < 0.50 < 0.50 < 0.50 < 0.50 < 1.0 < 0.50 < 0.50 < 1.0 1.8 < 0.50 < 0.50
MW-9D 8/24/1993 < 10 < 8.0 5.0 < 1.0 < 10 < 10 < 10 < 10 < 10 < 10 < 10 < 10 < 10 < 10 < 10 < 10 < 10 < 10
MW-9D 8/11/1992 < 10 < 10 < 25 < 3.0 < 5.0 < 5.0 < 5.0 < 5.0 < 5.0 < 5.0 < 5.0 < 5.0 < 5.0 < 5.0 < 5.0 < 5.0 < 5.0 < 5.0
MW-9D 7/2/1991 < 10 < 6.0 < 1.0 < 10 < 10 < 10 < 10 < 10 < 10 < 10 < 10 < 10 < 10 < 10 < 10 < 10 < 10
MW-9D 11/8/1990 < 10 < 5.0 < 1.0 < 5 < 5 < 5 < 5 < 5 < 5 < 5 < 5 < 5 < 5 < 5 < 5 < 5 < 5
MW-9D 8/30/1990 < 10 4.1 < 1.0 < 5 < 5 < 5 < 5 < 5 < 5 < 5 < 5 < 5 < 5 < 5 < 5 < 5 < 5
MW-9D 5/8/1990 < 10 4.5 < 2.00 < 5 < 5 < 5 < 5 < 5 < 5 < 5 < 5 < 5 < 5 < 5 < 5 < 5 < 5
MW-9D 2/26/1990 < 10 ... < 5.0 1.6 < 5 < 5 < 5 < 5 < 5 < 5 < 5 < 5 < 5 < 5 < 5 < 5 < 5 < 5
MW-1 IS 11/1/2012 — — ... ... ... ... ... ... — ... MW-1 IS 6/7/2011 — ... ... ... — ... ... ... ... ... ... ... MW-1 IS 2/15/2011 — — — ... ... ... ... ... ... ... — ... ... MW-1 IS 6/22/2010 — ... ... ... ... _- ... ... ... ... — MW-1 IS 2/5/2008 — ... — ... ... ... — ... ... ... ... ... MW-1 IS 6/20/2006 — ... ... ._. ... ... ... ... ... ... ... MW-11S 6/8/2004 — — ... — ... — ... ... ... ... ... MW-11S 6/18/2002 — _.. ... ... ... ... ... ... ... -_' ... ... ... MW-1 IS 8/22/2000 — ... ... ... ... ... ... ... ... ... ... ... ... MW-1 IS 7/16/1998 < 10 < 10 < 10 < 5.0 < 0.50 < 0.50 < 0.50 < 0.50 < 0.50 < 0.50 < 0.50 < 1.0 < 0.50 < 0.50 < 1.0 < 0.50 < 0.50 < 0.50
MW-1 IS 7/9/1997 < 10 < 10 < 10 < 5.0 < 0.50 < 0.50 < 0.50 < 0.50 < 0.50 < 0.50 < 0.50 < 1.0 < 0.50 < 0.50 < 1.0" < 0.50 < 0.50 < 0.50
MW-1 IS 7/17/1996 < 10 < 10 < 10 < 5.0 < 0.50 < 0.50 < 0.50 < 0.50 < 0.50 < 0.50 < 0.50 < 1.0 < 0.50 < 0.50 < 1.0 < 0.50 < 0.50 < 0.50
MW-1 IS 7/19/1995 < 10 < 10 < 20 < 10 < 0.50 < 0.50 < 0.50 < 0.50 < 0.50 < 0.50 < 0.50 < 1.0 < 0.50 < 0.50 < 1.0 < 0.50 < 0.50 < 0.50
MW-1 IS 7/19/1994 < 10 < 10 < 25 < 6 < 0.50 0.26 J < 0.50 < 0.50 < 0.50 < 0.50 < 0.50 < 1.0 < 0.50 < 0.50 < 1.0 0.32 J < 0.50 < 0.50
MW-1 IS 9/7/1993 < 10 < 8.0 < 3.0 < 1.0 < 10 < 10 < 10 < 10 < 10 < 10 < 10 < 10 < 10 < 10 < 10' < 10 < 10 < 10
MW-11S 8/12/1992 < 10 < 10 < 25 < 3.0 < 5.0 < 5.0 < 5.0 < 5.0 < 5.0 < 5.0 < 5.0 < 5.0 < 5.0 < 5.0 < 5.0 < 5.0 < 5.0 < 5.0
MW-1 IS 7/3/1991 < 10 ... < 6.0 < 1.0 < 10 < 10 < 10 < 10 < 10 < 10 < 10 < 10 < 10 < 10 < 10 - < 10 < 10 < 10
MW-I1S 11/10/1990 22 < 5.0 < 1.0 < 5 < 5 < 5 < 5 < 5 < 5 < 5 < 5 < 5 < 5 < 5 < 5 < 5 < 5
MW-1 IS 8/30/1990 < 10 4J < 1.0 < 5 < 5 < 5 < 5 < 5 < 5 < 5 < 5 < 5 < 5 < 5 J < 5 < 5 < 5
MW-1 IS 5/10/1990 < 10 < 4.00 < 2.00 < 5 < 5 < 5 < 5 < 5 < 5 < 5 < 5 < 5 < 5 < 5 ' < 5 < 5 < 5
MW-1 IS 2/27/1990 ... < 5.0 < 1.0 < 5 < 5 < 5 < 5 < 5 < 5 < 5 < 5 < 5 < 5 < 5 < 5 < 5 < 5
G:\ENV\TF\100l-ll00\TF1034\2013\FiveYearRcview\Report\02-llGW_ANAL APPENDLXB 09212011 Revised 010813.xlsx/masteranalytical Page 3 of 10
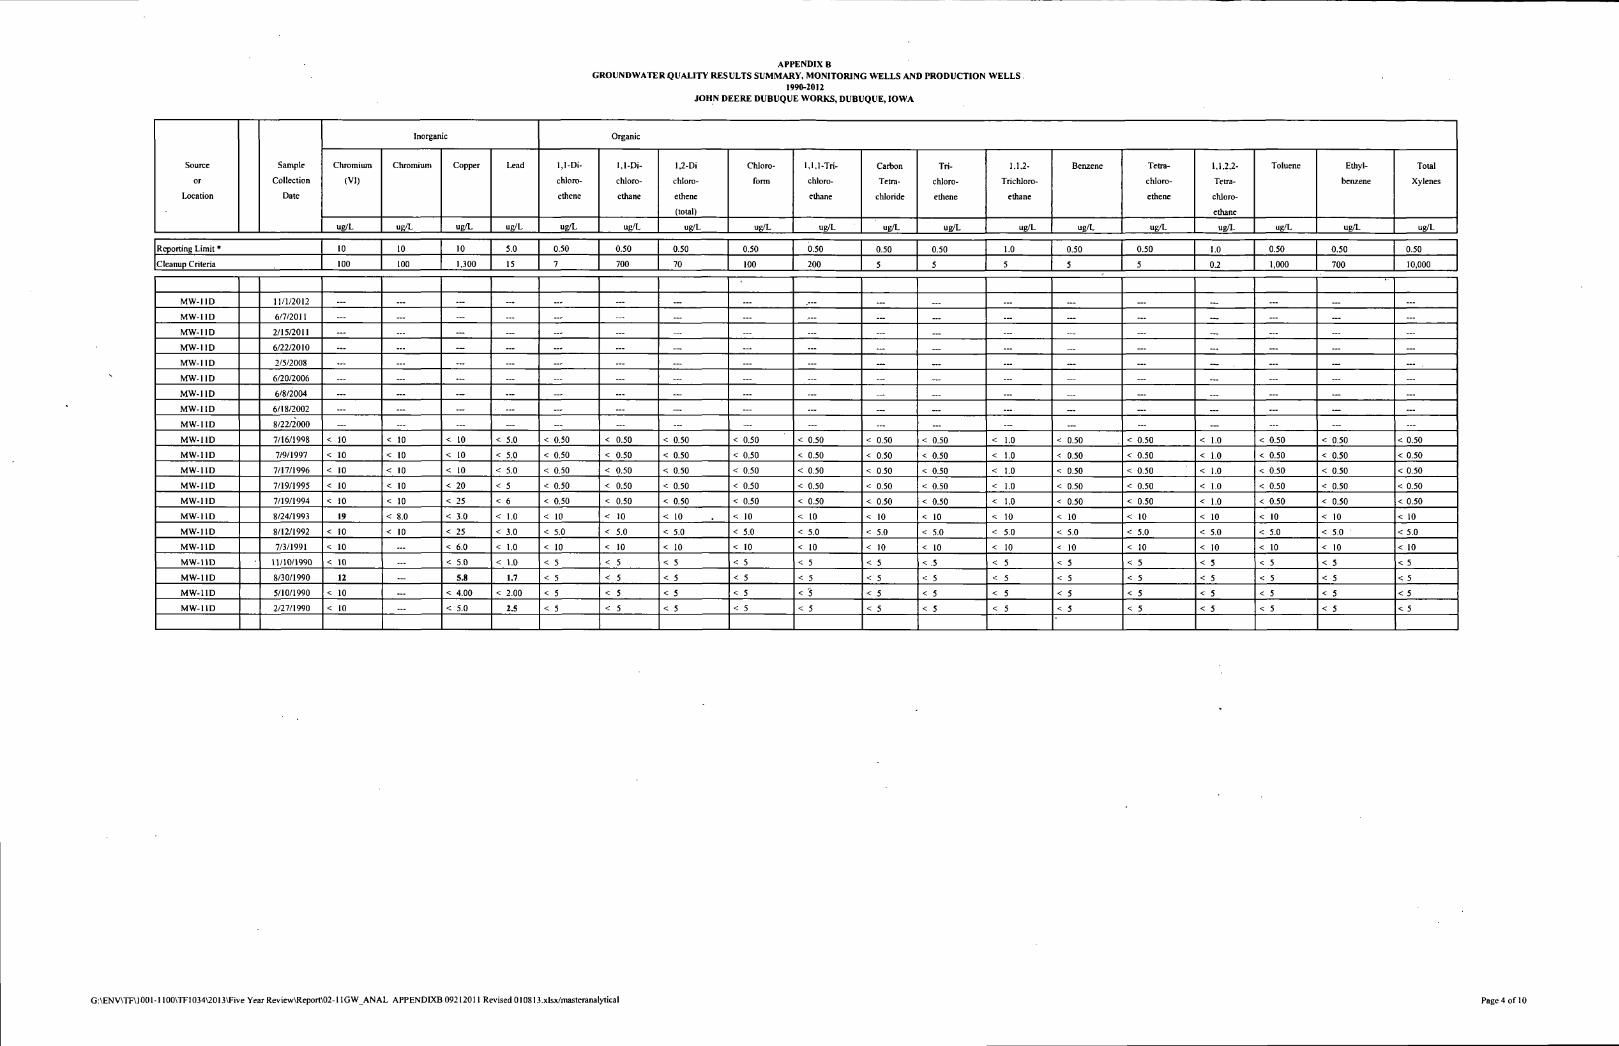
APPENDIX B GROUNDWATER QUALITY RESULTS SUMMARY, MONITORING WELLS AND PRODUCTION WELLS .
1990-2012 JOHN DEERE DUBUQUE WORKS, DUBUQUE, IOWA
Inorganic Organic
Source Sample Chromium Chromium Copper Lead 1,1-Di- 1,1-Di- 1,2-Di Chloro 1,1,1-Tri- Carbon Tri- 1.1.2- Benzene Tctra- 1,1,2,2- Toluene Ethyl- Total
or Collection (VI) chloro- chloro- chlorc- form chloro- Tetra chloro- Trichloro- chloro- Tetra- benzene Xylenes
Location Date ethene ethane ethene ethane chloride ethene ethane cthene chloro-
(total) ethane
ug/L ug/L ug/L ug/L ug/L ug/L ug/L ug/L ug/L ug/L ug/L ug/L ug/L ug/L ug/L ug/L ug/L ug/L
Reporting Limit * 10 10 10 5.0 0.50 0.50 0.50 0.50 0.50 0.50 0.50 1.0 0.50 0.50 1.0 0.50 0.50 0.50
Cleanup Criteria 100 100 1,300 15 7 700 70 100 200 5 5 5 5 5 0.2 1,000 700 10,000
MW-1 ID 11/1/2012 ... ... ... — ... ... ... ... .— — ... ... ... MW-1 ID 6/7/2011 ... ... ... ... ... ._. ... ... .-- — — ... ... MW-1 ID 2/15/2011 ... ... — — ... ... ... ... ... — — — ... MW-1 ID 6/22/2010 ... ... — ... ... ... — ... ... — — ... MW-1 ID 2/5/2008 ... ... ... ... ... ... ... ... ... — ... MW-1 ID 6/20/2006 ... — ... ... _. ... ... ... — ... — — ... MW-1 ID 6/8/2004 ... — — — — ... ._ ... — — — MW-1 ID 6/18/2002 ... ... ... . ... ... — ... — — MW-11D 8/22/2000 ... ... ... ... ... ... ... ... ... ... ... ... ... ... ... ... ... MW-11D 7/16/1998 < 10 < 10 < 10 < 5.0 < 0.50 < 0.50 < 0.50 < 0.50 < 0.50 < 0.50 < 0.50 < 1.0 < 0.50 < 0.50 < 1.0 < 0.50 < 0.50 < 0.50
MW-11D 7/9/1997 < 10 < 10 < 10 < 5.0 < 0.50 < 0.50 < 0.50 < 0.50 < 0.50 < 0.50 < 0.50 < 1.0 < 0.50 < 0.50 < 1.0 < 0.50 < 0.50 < 0.50
MW-11D 7/17/1996 < 10 < 10 < 10 < 5.0 < 0.50 < 0.50 < 0.50 < 0.50 < 0.50 < 0.50 < 0.50 < 1.0 < 0.50 < 0.50 < 1.0 < 0.50 < 0.50 < 0.50
MW-11D 7/19/1995 < 10 < 10 < 20 < 5 < 0.50 < 0.50 < 0.50 < 0.50 < 0.50 < 0.50 < 0.50 < 1.0 < 0.50 < 0.50 < 1.0 < 0.50 < 0.50 < 0.50
MW-11D 7/19/1994 < 10 < 10 < 25 < 6 < 0.50 < 0.50 < 0.50 < 0.50 < 0.50 < 0.50 < 0.50 < 1.0 < 0.50 < 0.50 < 1.0 < 0.50 < 0.50 < 0.50
MW-11D 8/24/1993 19 < 8.0 < 3.0 < 1.0 < 10 < 10 < 10 < 10 < 10 < 10 < 10 < 10 < 10 < 10 < 10 < 10 < 10 < 10
MW-1 ID 8/12/1992 < 10 < 10 < 25 < 3.0 < 5.0 < 5.0 < 5.0 < 5.0 < 5.0 < 5.0 < 5.0 < 5.0 < 5.0 < 5.0 < 5.0 < 5.0 < 5.0 < 5.0
MW-11D 7/3/1991 < 10 ... < 6.0 < 1.0 < 10 < 10 < 10 < 10 < 10 < 10 < 10 < 10 < 10 < 10 < 10 < 10 < 10 < 10
MW-11D U/10/1990 < 10 ... < 5.0 < 1.0 < 5 < 5 < 5 < 5 < 5 < 5 < 5 < 5 < 5 < 5 < 5 < 5 < 5 < 5
MW-1 ID 8/30/1990 12 ... 5.8 1.7 < 5 < 5 < 5 < 5 < 5 < 5 < 5 < 5 < 5 < 5 < 5 < 5 < 5 < 5
MW-11D 5/10/1990 < 10 ... < 4.00 < 2.00 < 5 < 5 < 5 < 5 < 5 < 5 < 5 < 5 < 5 < 5 < 5 < 5 < 5 < 5
MW-11D 2/27/1990 < 10 ... < 5.0 2.5 < 5 < 5 < 5 < 5 < 5 < 5 < 5 < 5 < 5 < 5 < 5 < 5 < 5 < 5
G:\ENV\TF\1001-1100\TF1034\2013\Five Year Review\Report\02-11GW ANAL APPENDIXB 09212011 Revised 010813.xlsx/masteranalytical Page 4 of 10
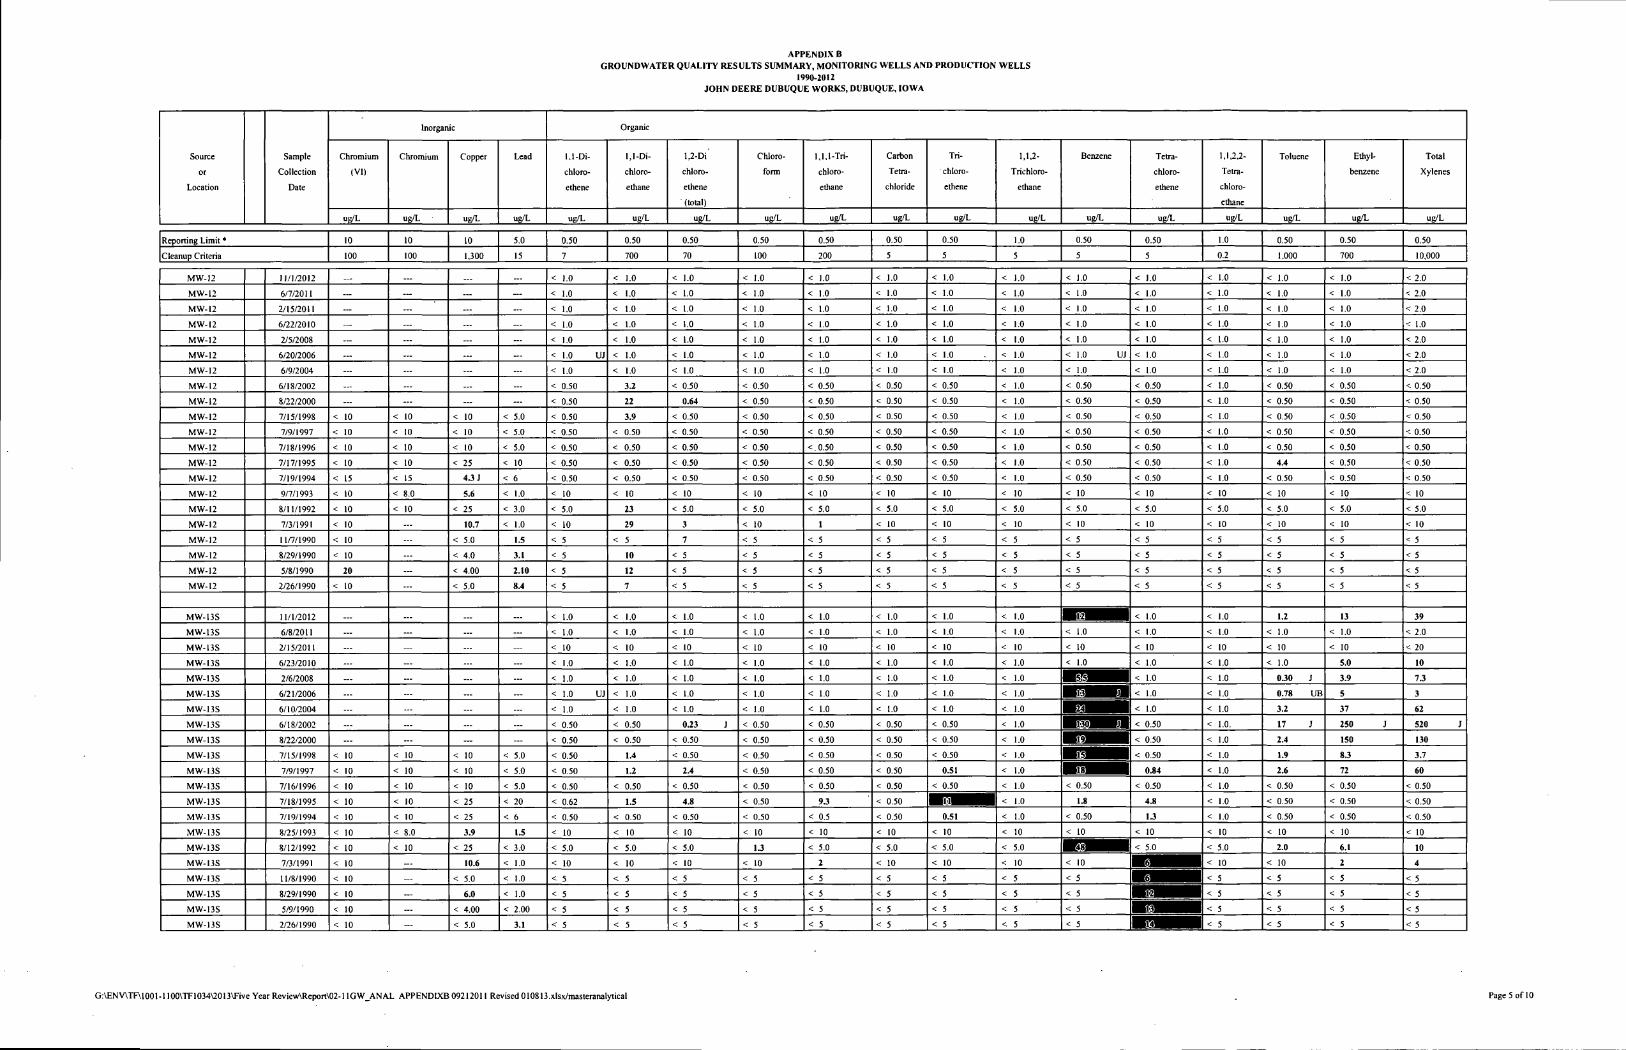
APPENDIX B GROUNDWATER QUALITY RESULTS SUMMARY, MONITORING WELLS AND PRODUCTION WELLS
1990-2012 JOHN DEERE DUBUQUE WORKS, DUBUQUE, IOWA
Inorganic Organic
Source Sample Chromium Chromium Copper Lead 1,1-Di- 1,1-Di- 1,2-Di Chloro 1,1,1-Tri- Carbon Tri- 1,1,2- Benzene Tetra- 1,1,2,2- Toluene Ethyl- Total
or Collection (VI) chloro- chloro- chloro- form chloro- Tetra chloro- Trichloro- chloro- Tetra- benzene Xylenes
Location Date ethene ethane ethene ethane chloride ethene ethane ethene chloro-
(total) ethane
ug/L ug/L ug/L ug/L ug/L ug/L ug/L ug/L ug/L ug/L ug/L ug/L ug/L ug/L ug/L ug/L ug/L ug/L
Reporting Limit * 10 10 10 5.0 0.50 0.50 0.50 0.50 0.50 0.50 0.50 1.0 0.50 0.50 1.0 0.50 0.50 0.50
Cleanup Criteria 100 100 1,300 15 7 700 70 100 200 5 5 5 5 5 0.2 1.000 700 10,000
MW-12 11/1/2012 ... < 1.0 < 1.0 < 1.0 < 1.0 < 1.0 < 1.0 < 1.0 < 1.0 < 1.0 < 1.0 < 1.0 < 1.0 < 1.0 < 2.0
MW-12 6/7/2011 < 1.0 < 1.0 < 1.0 < 1.0 < 1.0 < 1.0 < 1.0 < 1.0 < 1.0 < 1.0 < 1.0 < 1.0 < 1.0 < 2.0
MW-12 2/15/2011 ... — < 1.0 < 1.0 < 1.0 < 1.0 < 1.0 < 1.0 < 1.0 < 1.0 < 1.0 < 1.0 < 1.0 < 1.0 < 1.0 < 2.0
MW-12 6/22/2010 < 1.0 < 1.0 < 1.0 < 1.0 < 1.0 < 1.0 < 1.0 < 1.0 < 1.0 < 1.0 < 1.0 < 1.0 < 1.0 < 1.0
MW-12 2/5/2008 ... < 1.0 < 1.0 < 1.0 < 1.0 < 1.0 < 1.0 < 1.0 < 1.0 < 1.0 < 1.0 < 1.0 < 1.0 < 1.0 < 2.0
MW-12 6/20/2006 < 1.0 UJ < 1.0 < 1.0 < 1.0 < 1.0 < 1.0 < 1.0 < 1.0 < 1.0 UJ < 1.0 < 1.0 < 1.0 < 1.0 < 2.0
MW-12 6/9/2004 < 1.0 < 1.0 < 1.0 < 1.0 < 1.0 < 1.0 < 1.0 < 1.0 < 1.0 < 1.0 < 1.0 < 1.0 < 1.0 < 2.0
MW-12 6/18/2002 < 0.50 3.2 < 0.50 < 0.50 < 0.50 < 0.50 < 0.50 < 1.0 < 0.50 < 0.50 < 1.0 < 0.50 < 0.50 < 0.50
MW-12 8/22/2000 < 0.50 22 0.64 < 0.50 < 0.50 < 0.50 < 0.50 < 1.0 < 0.50 < 0.50 < 1.0 < 0.50 < 0.50 < 0.50
MW-12 7/15/1998 < 10 < 10 < 10 < 5.0 < 0.50 3.9 < 0.50 < 0.50 < 0.50 < 0.50 < 0.50 < 1.0 < 0.50 < 0.50 < 1.0 < 0.50 < 0.50 < 0.50
MW-12 7/9/1997 < 10 < 10 < 10 < 5.0 < 0.50 < 0.50 < 0.50 < 0.50 < 0.50 < 0.50 < 0.50 < 1.0 < 0.50 < 0.50 < 1.0 < 0.50 < 0.50 < 0.50
MW-12 7/18/1996 < 10 < 10 < 10 < 5.0 < 0.50 < 0.50 < 0.50 < 0.50 <.0.50 < 0.50 < 0.50 < 1.0 < 0.50 < 0.50 < 1.0 < 0.50 < 0.50 < 0.50
MW-12 7/17/1995 < 10 < 10 < 25 < 10 < 0.50 < 0.50 < 0.50 < 0.50 < 0.50 < 0.50 < 0.50 < 1.0 < 0.50 < 0.50 < 1.0 4.4 < 0.50 < 0.50
MW-12 7/19/1994 < 15 < 15 4.3 J < 6 < 0.50 < 0.50 < 0.50 < 0.50 < 0.50 < 0.50 < 0.50 < 1.0 < 0.50 < 0.50 < 1.0 < 0.50 < 0.50 < 0.50
MW-12 9/7/1993 < 10 < 8.0 5.6 < 1.0 < 10 < 10 < 10 < 10 < 10 < 10 < 10 < 10 < 10 < 10 < 10 < 10 < 10 < 10
MW-12 8/11/1992 < 10 < 10 < 25 < 3.0 < 5.0 23 < 5.0 < 5.0 < 5.0 < 5.0 < 5.0 < 5.0 < 5.0 < 5.0 < 5.0 < 5.0 < 5.0 < 5.0
MW-12 7/3/1991 < 10 10.7 < 1.0 < 10 29 3 < 10 1 < 10 < 10 < 10 < 10 < 10 < 10 < 10 < 10 < 10
MW-12 11/7/1990 < 10 < 5.0 1.5 < 5 < 5 7 < 5 < 5 < 5 < 5 < 5 < 5 < 5 < 5 < 5 < 5 < 5
MW-12 8/29/1990 < 10 ... < 4.0 3.1 < 5 10 < 5 < 5 < 5 < 5 < 5 < 5 < 5 < 5 < 5 < 5 < 5 < 5
MW-12 5/8/1990 20 — < 4.00 2.10 < 5 12 < 5 < 5 < 5 < 5 < 5 < 5 < 5 < 5 < 5 < 5 < 5 < 5
MW-12 2/26/1990 < 10 < 5.0 8.4 < 5 7 < 5 < 5 < 5 < 5 < 5 < 5 < 5 < 5 < 5 < 5 < 5 < 5
MW-13S 11/1/2012 < 1.0 < 1.0 < 1.0 < 1.0 < 1.0 < 1.0 < 1.0 < 1.0 < 1.0 < 1.0 1.2 13 39
MW-13S 6/8/2011 < 1.0 < 1.0 < 1.0 < 1.0 < 1.0 < 1.0 < 1.0 < 1.0 < 1.0 < 1.0 < 1.0 < 1.0 < 1.0 < 2.0
MW-13S 2/15/2011 — ... — < 10 < 10 < 10 < 10 < 10 < 10 < 10 < 10 < 10 < 10 < 10 < 10 < 10 < 20
MW-13S 6/23/2010 ... < 1.0 < 1.0 < 1.0 < 1.0 < 1.0 < 1.0 < 1.0 < 1.0 < 1.0 < 1.0 < 1.0 < 1.0 5.0 10
MW-13S 2/6/2008 ... < 1.0 < 1.0 < 1.0 < 1.0 < 1.0 < 1.0 < 1.0 < 1.0 as < 1.0 < 1.0 0J0 J 3.9 7.3
MW-13S 6/21/2006 ... < 1.0 UJ < 1.0 < 1.0 < 1.0 < 1.0 < 1.0 < 1.0 < 1.0 as s < 1.0 < 1.0 0.78 UB 5 3
MW-13S 6/10/2004 ... ... < 1.0 < 1.0 < 1.0 < 1.0 < 1.0 < 1.0 < 1.0 < 1.0 m < 1.0 < 1.0 3.2 37 62
MW-13S 6/18/2002 < 0.50 < 0.50 0.23 J < 0.50 < 0.50 < 0.50 < 0.50 < 1.0 DSD 8 < 0.50 < 1.0. 17 J 250 J 520 J
MW-13S 8/22/2000 — < 0.50 < 0.50 < 0.50 < 0.50 < 0.50 < 0.50 < 0.50 < 1.0 m> < 0.50 < 1.0 2.4 150 130
MW-13S 7/15/1998 < 10 < 10 < 10 < 5.0 < 0.50 1.4 < 0.50 < 0.50 < 0.50 < 0.50 < 0.50 < 1.0 AS < 0.50 < 1.0 1.9 8.3 3.7
MW-13S 7/9/1997 < 10 < 10 < 10 < 5.0 < 0.50 1.2 2.4 < 0.50 < 0.50 < 0.50 0.51 < 1.0 33 0.84 < 1.0 2.6 72 60
MW-13S 7/16/1996 < 10 < 10 < 10 < 5.0 < 0.50 < 0.50 < 0.50 < 0.50 < 0.50 < 0.50 < 0.50 < 1.0 < 0.50 < 0.50 < 1.0 < 0.50 < 0.50 < 0.50
MW-13S 7/18/1995 < 10 < 10 < 25 < 20 < 0.62 1.5 4.8 < 0.50 9.3 < 0.50 < 1.0 1.8 4.8 < 1.0 < 0.50 < 0.50 < 0.50
MW-13S 7/19/1994 < 10 < 10 < 25 < 6 < 0.50 < 0.50 < 0.50 < 0.50 < 0.5 < 0.50 0.51 < 1.0 < 0.50 1.3 < 1.0 < 0.50 < 0.50 < 0.50
MW-13S 8/25/1993 < 10 < 8.0 3.9 1.5 < 10 < 10 < 10 < 10 < 10 < 10 < 10 < 10 < 10 < 10 < 10 < 10 < 10 < 10
MW-13S 8/12/1992 < 10 < 10 < 25 < 3.0 < 5.0 < 5.0 < 5.0 u < 5.0 < 5.0 < 5.0 < 5.0 m < 5.0 < 5.0 2.0 6.1 10
MW-13S 7/3/1991 < 10 10.6 < 1.0 < 10 < 10 < 10 < 10 2 < 10 < 10 < 10 < 10 t 6 < 10 < 10 2 4
MW-13S 11/8/1990 < 10 — < 5.0 < 1.0 < 5 < 5 < 5 < 5 < 5 < 5 < 5 < 5 < 5 r s < 5 < 5 < 5 < 5
MW-13S 8/29/1990 < 10 — 6.0 < 1.0 < 5 < 5 < 5 < 5 < 5 < 5 < 5 < 5 < 5 Fas < 5 < 5 < 5 < 5
MW-13S 5/9/1990 < 10 < 4.00 < 2.00 < 5 < 5 < 5 < 5 < 5 < 5 < 5 < 5 < 5 1 IB < 5 < 5 < 5 < 5
MW-13S 2/26/1990 < 10 ... < 5.0 3.1 < 5 < 5 < 5 < 5 < 5 < 5 < 5 < 5 < 5 1 oa < 5 < 5 < 5 < 5
G:\ENV\TF\1001-1100\TF1034\2013\Five Year Review\Report\02-11GW ANAL APPEND1XB 09212011 Revised 010813.xlsx/masteranalytical Page 5 of 10
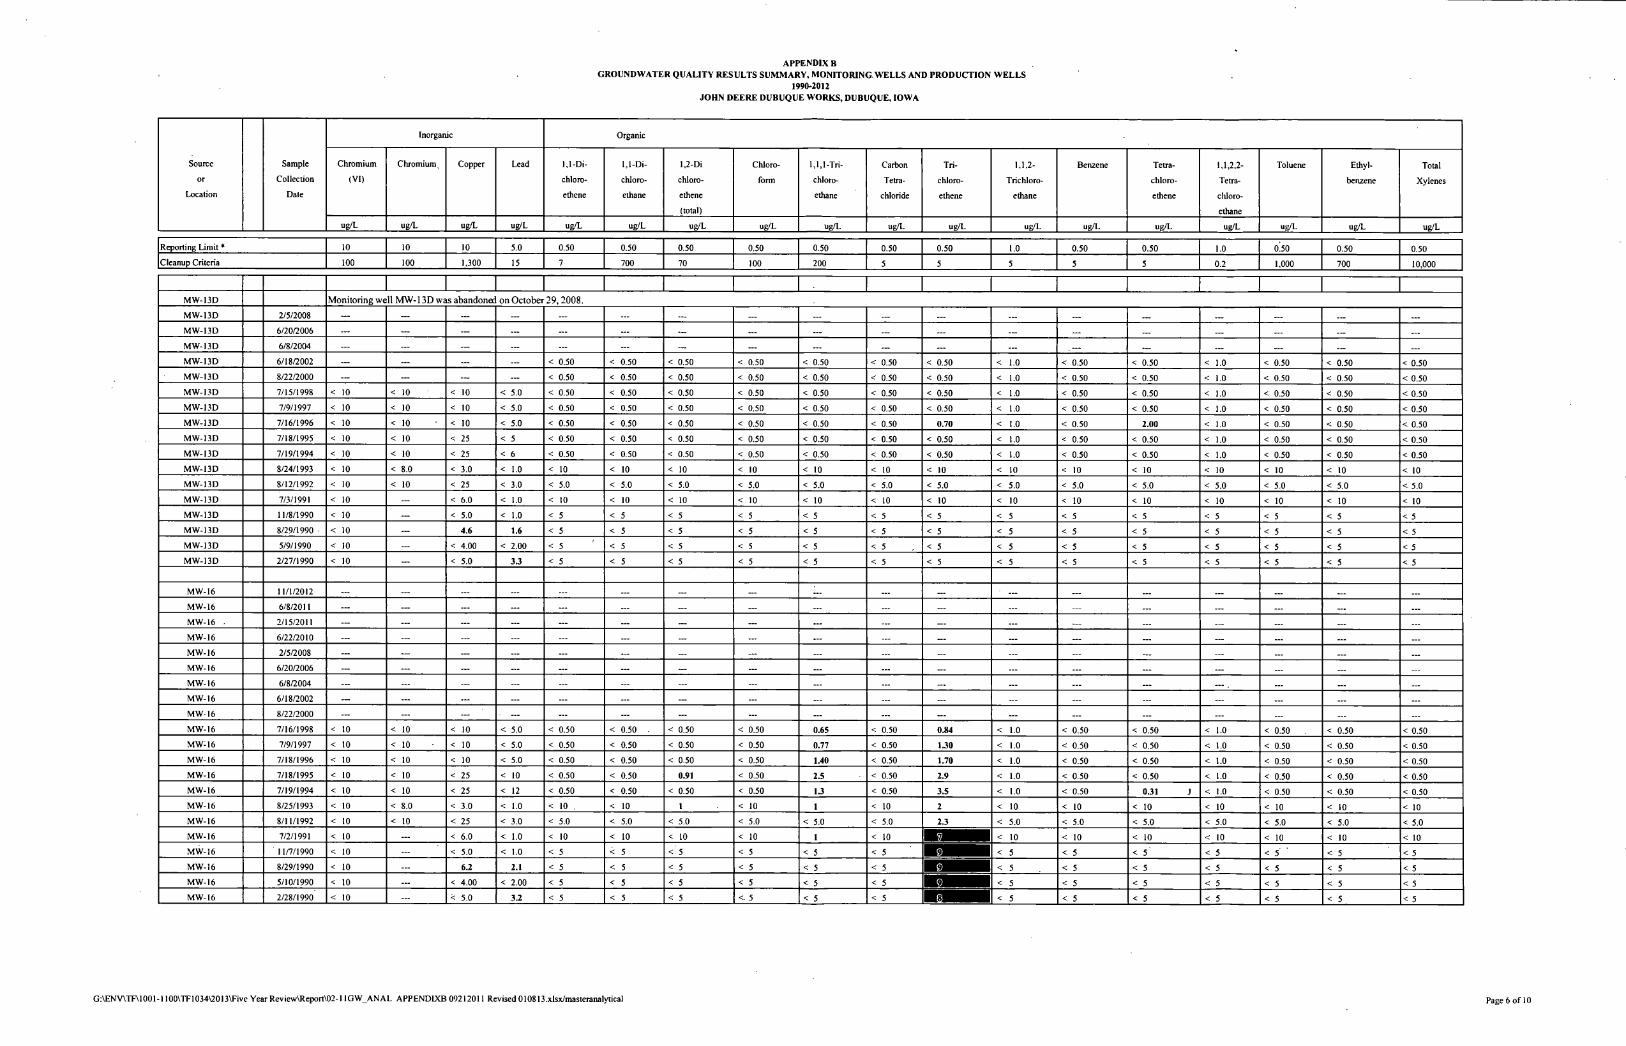
APPENDIX B GROUNDWATER QUALITY RESULTS SUMMARY, MONITORING WELLS AND PRODUCTION WELLS
1990-2012 JOHN DEERE DUBUQUE WORKS, DUBUQUE, IOWA
Inorganic Organic
Source Sample Chromium Chromium x Copper Lead 1,1-Di- 1,1-Di- 1,2-Di Chloro 1,1,1-Tri- Carbon Tri- 1.1,2- Benzene Tetra- 1,1,2,2- Toluene Ethyl- Total
or Collection (VI) chloro- chloro- chloro- form chloro- Tetra chloro- Trichloro- chloro- Tetra- benzene Xylenes
Location Date ethene ethane ethene ethane chloride ethene ethane ethene chloro-
(total) ethane
ug/L ug/L ug/L ug/L ug/L ug/L ug/L ug/L ug/L ug/L ug/L ug/L ug/L ug/L ug/L ug/L ug/L ug/L
Reporting Limit * 10 10 10 5.0 0.50 0.50 0.50 0.50 0.50 0.50 0.50 1.0 0.50 0.50 1.0 0 50 0.50 0.50
Cleanup Criteria 100 100 1,300 15 7 700 70 100 200 5 5 5 5 5 0.2 1,000 700 10,000
MW-13D Monitoring well MW-13D was abandoned on October 29,2008.
MW-13D 2/5/2008 ... ... ... ... ... ... ... ... ... ... ... MW-13D 6/20/2006 ... ... ... ... ... ... ... ... MW-13D 6/8/2004 ... ... — ... ... ... ... ... ... ... MW-13D 6/18/2002 ... ... ... ... < 0.50 < 0.50 < 0.50 < 0.50 < 0.50 < 0.50 < 0.50 < 1.0 < 0.50 < 0.50 < 1.0 < 0.50 < 0.50 < 0.50
MW-I3D 8/22/2000 ... ... ... ... < 0.50 < 0.50 < 0.50 < 0.50 < 0.50 < 0.50 < 0.50 < 1.0 < 0.50 < 0.50 < 1.0 < 0.50 < 0.50 < 0.50
MW-13D 7/15/1998 < 10 < 10 < 10 < 5.0 < 0.50 < 0.50 < 0.50 < 0.50 < 0.50 < 0.50 < 0.50 < 1.0 < 0.50 < 0.50 < 1.0 < 0.50 < 0.50 < 0.50
MW-13D 7/9/1997 < 10 < 10 < 10 < 5.0 < 0.50 < 0.50 < 0.50 < 0.50 < 0.50 < 0.50 < 0.50 < 1.0 < 0.50 < 0.50 < 1.0 < 0.50 < 0.50 < 0.50
MW-13D 7/16/1996 < 10 < 10 < 10 < 5.0 < 0.50 < 0.50 < 0.50 < 0.50 < 0.50 < 0.50 0.70 < 1.0 < 0.50 2.00 < 1.0 < 0.50 < 0.50 < 0.50
MW-13D 7/18/1995 < 10 < 10 < 25 < 5 < 0.50 < 0.50 < 0.50 < 0.50 < 0.50 < 0.50 < 0.50 < 1.0 < 0.50 < 0.50 < 1.0 < 0.50 < 0.50 < 0.50
MW-13D 7/19/1994 < 10 < 10 < 25 < 6 < 0.50 < 0.50 < 0.50 < 0.50 < 0.50 < 0.50 < 0.50 < 1.0 < 0.50 < 0.50 < 1.0 < 0.50 < 0.50 < 0.50
MW-13D 8/24/1993 < 10 < 8.0 < 3.0 < 1.0 < 10 < 10 < 10 < 10 < 10 < 10 < 10 < 10 < 10 < 10 < 10 < 10 < 10 < 10
MW-13D 8/12/1992 < 10 < 10 < 25 < 3.0 < 5.0 < 5.0 < 5.0 < 5.0 < 5.0 < 5.0 < 5.0 < 5.0 < 5.0 < 5.0 < 5.0 < 5.0 < 5.0 < 5.0
MW-13D 7/3/1991 < 10 ... < 6.0 < 1.0 < 10 < 10 < 10 < 10 < 10 < 10 < 10 < 10 < 10 < 10 < 10 < 10 < 10 < 10
MW-13D 11/8/1990 < 10 ... < 5.0 < 1.0 < 5 < 5 < 5 < 5 < 5 < 5 < 5 < 5 < 5 < 5 < 5 < 5 < 5 < 5
MW-13D 8/29/1990 • < 10 ... 4.6 1.6 < 5 < 5 < 5 < 5 < 5 < 5 < 5 < 5 < 5 < 5 < 5 < 5 < 5 < 5
MW-13D 5/9/1990 < 10 ... < 4.00 < 2.00 < 5 < 5 < 5 < 5 < 5 < 5 < 5 < 5 < 5 < 5 < 5 < 5 < 5 < 5
MW-13D 2/27/1990 < 10 — < 5.0 3.3 < 5 < 5 < 5 < 5 < 5 < 5 < 5 < 5 < 5 < 5 < 5 < 5 < 5 < 5
MW-16 11/1/2012 ... ... ... ... ... — ... ... ...
• —
MW-16 6/8/2011 ... ... ... ... ... ... ... ... ... — ... MW-16 . 2/15/2011 ... ... ... ... ... ... ... ... ... ... ... ... MW-16 6/22/2010 ... ... ... ... ... ... ... ... — — — MW-16 2/5/2008 ... .__ ... ... ... ._. ... ... ... ... — MW-16 6/20/2006 ... ... ... ... ... ... ... ... ... ... ... ... MW-16 6/8/2004 ... ... ... ... ... ... ... ... ... ... — ... ... MW-16 6/18/2002 ... ... ... ... ... ... ... ... ... — ... MW-16 8/22/2000 ... ... ... . ... ... ... ... ... ... ... MW-16 7/16/1998 < 10 < 10 < 10 < 5.0 < 0.50 < 0.50 . < 0.50 < 0.50 0.65 < 0.50 0.84 < 1.0 < 0.50 < 0.50 < 1.0 < 0.50 < 0.50 < 0.50
MW-16 7/9/1997 < 10 < 10 < 10 < 5.0 < 0.50 < 0.50 < 0.50 < 0.50 0.77 < 0.50 1.30 < 1.0 < 0.50 < 0.50 < 1.0 < 0.50 < 0.50 < 0.50
MW-16 7/18/1996 < 10 < 10 < 10 < 5.0 < 0.50 < 0.50 < 0.50 < 0.50 1.40 < 0.50 1.70 < 1.0 < 0.50 < 0.50 < 1.0 < 0.50 < 0.50 < 0.50
MW-16 7/18/1995 < 10 < 10 < 25 < 10 < 0.50 < 0.50 0.91 < 0.50 2.5 < 0.50 2.9 < 1.0 < 0.50 < 0.50 < 1.0 < 0.50 < 0.50 < 0.50
MW-16 7/19/1994 < 10 < 10 < 25 < 12 < 0.50 < 0.50 < 0.50 < 0.50 1.3 < 0.50 3.5 < 1.0 < 0.50 0J1 J < 1.0 < 0.50 < 0.50 < 0.50
MW-16 8/25/1993 < 10 < 8.0 < 3.0 < 1.0 < 10 . < 10 1 < 10 1 < 10 2 < 10 < 10 < 10 < 10 < 10 < 10 < 10
MW-16 8/11/1992 < 10 < 10 < 25 < 3.0 < 5.0 < 5.0 < 5.0 < 5.0 < 5.0 < 5.0 2.3 < 5.0 < 5.0 < 5.0 < 5.0 < 5.0 < 5.0 < 5.0
MW-16 7/2/1991 < 10 ... < 6.0 < 1.0 < 10 < 10 < 10 < 10 1 < 10 < 10 < 10 < 10 < 10 < 10 < 10 < 10
MW-16 11/7/1990 < 10 ... < 5.0 < 1.0 < 5 < 5 < 5 < 5 < 5 < 5 < 5 < 5 < 5 < 5 < 5 < 5 < 5
MW-16 8/29/1990 < 10 ... 6.2 2.1 < 5 < 5 < 5 < 5 < 5 < 5 < 5 < 5 < 5 < 5 < 5 < 5 < 5
MW-16 5/10/1990 < 10 ... < 4.00 < 2.00 < 5 < 5 < 5 < 5 < 5 < 5 < 5 < 5 < 5 < 5 < 5 < 5 < 5
MW-16 2/28/1990 < 10 ... < 5.0 3.2 < 5 < 5 < 5 < 5 < 5 < 5 < 5 < 5 < 5 < 5 < 5 < 5 < 5
G:\ENV\TF\1001-1100\TF1034\20l3\Five Year Review\Rcport\02-l 1GW_ANAL APPENDIXB 09212011 Revised 010813.xlsx/masteranalytical Page 6 of 10
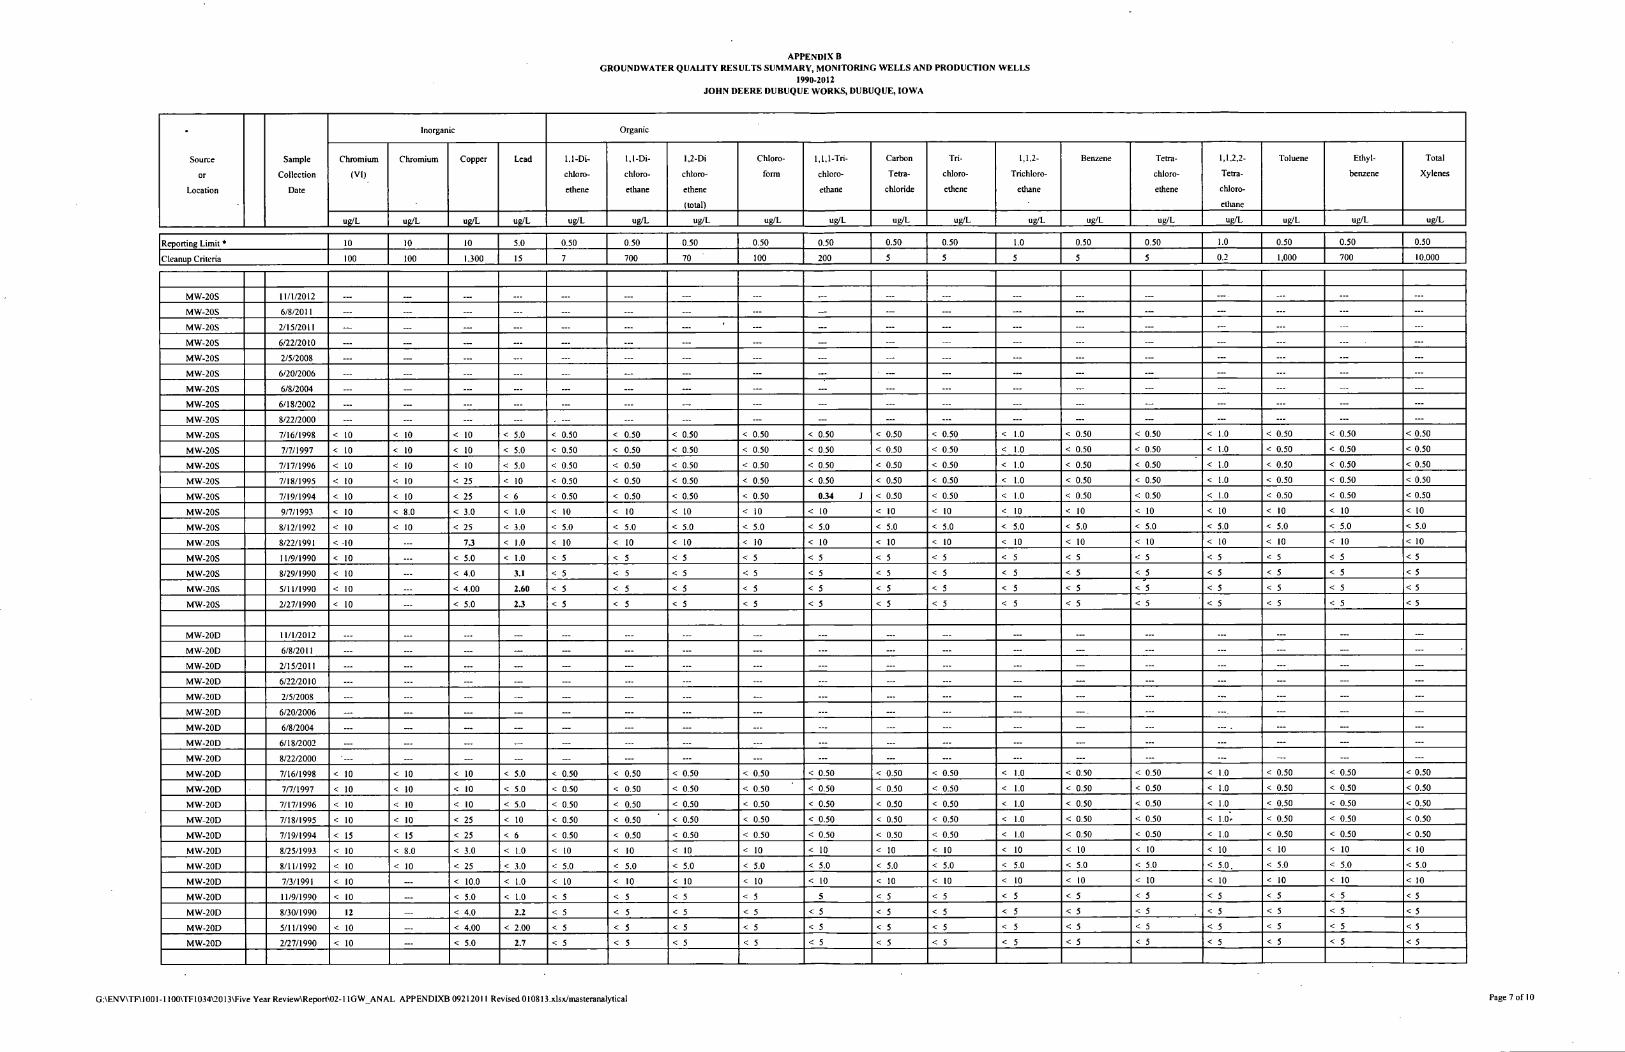
APPENDIX B GROUNDWATER QUALITY RESULTS SUMMARY, MONITORING WELLS AND PRODUCTION WELLS
1990-2012 JOHN DEERE DUBUQUE WORKS, DUBUQUE, IOWA
• Inorganic Organic
Source Sample Chromium Chromium Copper Lead 1,1-Di- 1,1-Di- 1,2-Di Chloro- 1,1,1-Tri- Carbon Tri- 1,1,2- Benzene Tetra- 1,1,2,2- Toluene Ethyl- Total
or Collection (VI) chloro- chloro- chloro- form chloro- Tetra chloro- Trichloro- chloro- Tetra- benzene Xylenes
Location Date ethene ethane ethene ethane chloride ethene ethane ethene chloro-
(total) ethane
ug/L ug/L ug/L ug/L ug/L ug/L ug/L ug/L ug/L ug/L ug/L ug/L ug/L ug/L ug/L ug/L ug/L ug/L
Reporting Limit * 10 10 10 5.0 0.50 0.50 0.50 0.50 0.50 0.50 0.50 1.0 0.50 0.50 1.0 0.50 0.50 0.50
Cleanup Criteria 100 100 1,300 15 7 700 70 100 200 5 5 5 5 5 0.2 1,000 700 10.000
MW-20S 11/1/2012 ___ — ... ... ... ... ... .... ... ... ... MW-20S 6/8/2011 ___ ... ... ... ... ... ... ... ... ... MW-20S 2/15/2011 ... ... ... ... ... ... — ... ... ... ... ... MW-20S 6/22/2010 ___ ___ ... ... ... ... ... ... ... — ... MW-20S 2/5/2008 .__ ... — .- ... ... ... ... ... ... — ... MW-20S 6/20/2006 .__ ... ...
• ... ... ... ... ... ... ... ... ...
MW-20S 6/8/2004 _._ ... ... ... ... ... ... ... ... ... ... MW-20S 6/18/2002 _._ ... ... ... ... ... ... ... ... ... ... ... MW-20S 8/22/2000 . .__ ... ... ... ... ... ... ... ... ... ... MW-20S 7/16/1998 < 10 < 10 < 10 < 5.0 < 0.50 < 0.50 < 0.50 < 0.50 < 0.50 < 0.50 < 0.50 < 1.0 < 0.50 < 0.50 < 1.0 < 0.50 < 0.50 < 0.50
MW-20S 7/7/1997 < 10 < 10 < 10 < 5.0 < 0.50 < 0.50 < 0.50 < 0.50 < 0.50 < 0.50 < 0.50 < 1.0 < 0.50 < 0.50 < 1.0 < 0.50 < 0.50 < 0.50
MW-20S 7/17/1996 < 10 < 10 < 10 < 5.0 < 0.50 < 0.50 < 0.50 < 0.50 < 0.50 < 0.50 < 0.50 < 1.0 < 0.50 < 0.50 < 1.0 < 0.50 < 0.50 < 0.50
MW-20S 7/18/1995 < 10 < 10 < 25 < 10 < 0.50 < 0.50 < 0.50 < 0.50 < 0.50 < 0.50 < 0.50 < 1.0 < 0.50 < 0.50 < 1.0 < 0.50 < 0.50 < 0.50
MW-20S 7/19/1994 < 10 < 10 < 25 < 6 < 0.50 < 0.50 < 0.50 < 0.50 0.34 J < 0.50 < 0.50 < 1.0 < 0.50 < 0.50 < 1.0 < 0.50 < 0.50 < 0.50
MW-20S 9/7/1993 < 10 < 8.0 < 3.0 < 1.0 < 10 < 10 < 10 < 10 < 10 < 10 < 10 < 10 < 10 < 10 < 10 < 10 < 10 < 10
MW-20S 8/12/1992 < 10 < 10 < 25 < 3.0 < 5.0 < 5.0 < 5.0 < 5.0 < 5.0 < 5.0 < 5.0 < 5.0 < 5.0 < 5.0 < 5.0 < 5.0 < 5.0 < 5.0
MW-20S 8/22/1991 < 10 73 < 1.0 < 10 < 10 < 10 < 10 < 10 < 10 < 10 < 10 < 10 < 10 < 10 < 10 < 10 < 10
MW-20S 11/9/1990 < 10 ___ < 5.0 < 1.0 < 5 < 5 < 5 < 5 < 5 < 5 < 5 < 5 < 5 < 5 < 5 < 5 < 5 < 5
MW-20S 8/29/1990 < 10 < 4.0 3.1 < 5 < 5 < 5 < 5 < 5 < 5 < 5 < 5 < 5 < 5 < 5 < 5 < 5 < 5
MW-20S 5/11/1990 < 10 < 4.00 2.60 < 5 < 5 < 5 < 5 < 5 < 5 < 5 < 5 < 5 < 5 < 5 < 5 < 5 < 5
MW-20S 2/27/1990 < 10 < 5.0 2.3 < 5 < 5 < 5 < 5 < 5 < 5 < 5 < 5 < 5 < 5 < 5 < 5 < 5 < 5
MW-20D 11/1/2012 .__ ... ___ — — — ... ... ... ... ... ... ... MW-20D 6/8/2011 ... ... ... ... ... ... ... ... ... ... MW-20D 2/15/2011 _._ — ... ... ... ... ... ... ... ... ... ... MW-20D 6/22/2010 .__ ... ... ... ... ... ... ... ___ ... MW-20D 2/5/2008 ... ... ... ... ... ... ... ... ... MW-20D 6/20/2006 _._ .__ ... ... ... ... ... ... ... ... MW-20D 6/8/2004 — ... ... ... ... ... ... ... ... MW-20D 6/18/2002 __. — ... ... ... ... ... ... ... ... ... MW-20D 8/22/2000 ___ — ... ... ... ... ... — ... ... MW-20D 7/16/1998 < 10 < 10 < 10 < 5.0 < 0.50 < 0.50 < 0.50 < 0.50 < 0.50 < 0.50 < 0.50 < 1.0 < 0.50 < 0.50 < 1.0 < 0.50 < 0.50 < 0.50
MW-20D 7/7/1997 < 10 < 10 < 10 < 5.0 < 0.50 < 0.50 < 0.50 < 0.50 < 0.50 < 0.50 < 0.50 < 1.0 < 0.50 < 0.50 < 1.0 < 0.50 < 0.50 < 0.50
MW-20D 7/17/1996 < 10 < 10 < 10 < 5.0 < 0.50 < 0.50 < 0.50 < 0.50 < 0.50 < 0.50 < 0.50 < 1.0 < 0.50 < 0.50 < 1.0 < 0.50 < 0.50 < 0.50
MW-20D 7/18/1995 < 10 < 10 < 25 < 10 < 0.50 < 0.50 < 0.50 < 0.50 < 0.50 < 0.50 < 0.50 < 1.0 < 0.50 < 0.50 < l.Or < 0.50 < 0.50 < 0.50
MW-20D 7/19/1994 < 15 < 15 < 25 < 6 < 0.50 < 0.50 < 0.50 < 0.50 < 0.50 < 0.50 < 0.50 < 1.0 < 0.50 < 0.50 < 1.0 < 0.50 < 0.50 < 0.50
MW-20D 8/25/1993 < 10 < 8.0 < 3.0 < 1.0 < 10 < 10 < 10 < 10 < 10 < 10 < 10 < 10 < 10 < 10 < 10 < 10 < 10 < 10
MW-20D 8/11/1992 < 10 < 10 < 25 < 3.0 < 5.0 < 5.0 < 5.0 < 5.0 < 5.0 < 5.0 < 5.0 < 5.0 < 5.0 < 5.0 < 5.0. < 5.0 < 5.0 < 5.0
MW-20D 7/3/1991 < 10 < 10.0 < 1.0 < 10 < 10 < 10 < 10 < 10 < 10 < 10 < 10 < 10 < 10 < 10 < 10 < 10 < 10
MW-20D 11/9/1990 < 10 < 5.0 < 1.0 < 5 < 5 < 5 < 5 5 < 5 < 5 < 5 < 5 < 5 < 5 < 5 < 5 < 5
MW-20D 8/30/1990 12 < 4.0 2.2 < 5 < 5 < 5 < 5 < 5 < 5 < 5 < 5 < 5 < 5 < 5 < 5 < 5 < 5
MW-20D 5/11/1990 < 10 < 4.00 < 2.00 < 5 < 5 < 5 < 5 < 5 < 5 < 5 < 5 < 5 < 5 < 5 < 5 < 5 < 5
MW-20D 2/27/1990 < 10 < 5.0 2.7 < 5 < 5 < 5 < 5 < 5 < 5 < 5 < 5 < 5 < 5 < 5 < 5 < 5 < 5
G:\ENV\TF\I001 -1100\TF1034\2013\Five Year Review\Report\02-11GW ANAL APPENDIXB 09212011 Revised 010813.xlsx/masteranalytical Page 7 of 10
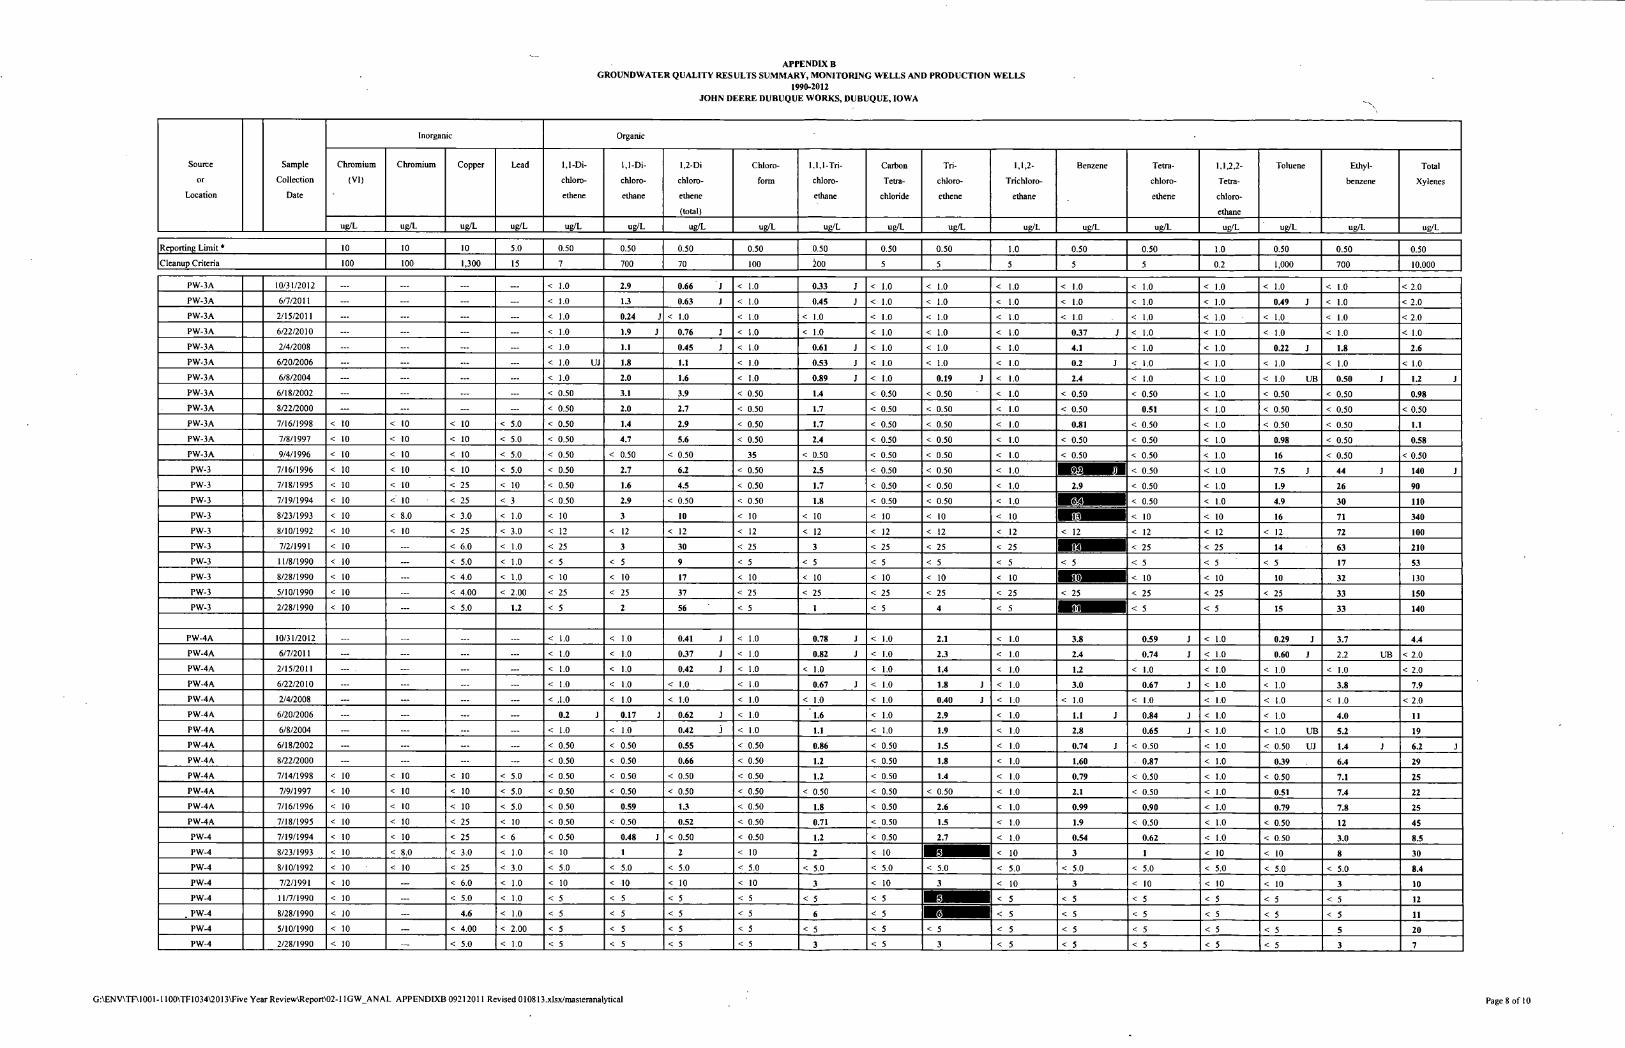
APPENDIX B GROUNDWATER QUALITY RESULTS SUMMARY, MONITORING WELLS AND PRODUCTION WELLS
1990-2012 JOHN DEERE DUBUQUE WORKS, DUBUQUE, IOWA
Inorganic Organic
Source Sample Chromium Chromium Copper Lead 1,1-Di- 1,1-Di- 1,2-Di Chloro 1,1,1-Tri- Carbon Tri- 1,1,2- Benzene Tetra- 1,1,2,2- Toluene Etbyl- Total
or Collection (VI) chloro- chloro- chloro- form chloro- Tetra chloro- Trichloro- chloro- Tctra- benzene Xylenes
Location Date ethene ethane ethene ethanc chloride ethenc ethane ethene chloro-
(total) ethane
ug/L ug/L ug/L ug/L ug/L ug/L ug/L ug/L ug/L ug/L ug/L ug/L ug/L ug/L ug/L ug/L ug/L ug/L
Reporting Limit * 10 10 10 5.0 0.50 0.50 0.50 0.50 0.50 0.50 0.50 1.0 0.50 0.50 1.0 0.50 0.50 0.50
Cleanup Criteria 100 100 1,300 15 7 700 70 100 200 5 5 5 5 5 0.2 1,000 700 10,000
PW-3A 10/31/2012 ... ... ... ... < 1.0 2.9 0.66 J < 1.0 0.33 J < 1.0 < 1.0 < 1.0 < 1.0 < 1.0 < 1.0 < 1.0 < 1.0 < 2.0
PW-3A 6/7/2011 ... ... ... ... < 1.0 1.3 0.63 J < 1.0 0.45 J < 1.0 < 1.0 < 1.0 < 1.0 < 1.0 < 1.0 0.49 J < 1.0 < 2.0
PW-3A 2/15/2011 ... ... ... ... < 1.0 0.24 J < 1.0 < 1.0 < 1.0 < 1.0 < 1.0 < 1.0 < 1.0 < 1.0 < 1.0 < 1.0 < 1.0 < 2.0
PW-3A 6/22/2010 ... ... ... ... < 1.0 1.9 J 0.76 J < 1.0 < 1.0 < 1.0 < 1.0 < 1.0 0.37 J < 1.0 < 1.0 < 1.0 < 1.0 < 1.0
PW-3A 2/4/2008 ... ... — ... < 1.0 1.1 0.45 J < 1.0 0.61 J < 1.0 < 1.0 < 1.0 4.1 < 1.0 < 1.0 0.22 J 1.8 2.6
PW-3 A 6/20/2006 ... ... ... ... < 1.0 UJ 1.8 1.1 < 1.0 0.53 J < 1.0 < 1.0 < 1.0 0.2 J < 1.0 < 1.0 < 1.0 < 1.0 < 1.0
PW-3A 6/8/2004 — ... ... ... < 1.0 2.0 1.6 < 1.0 0.89 J < 1.0 0.19 J < 1.0 2.4 < 1.0 < 1.0 < 1.0 UB 0.50 J 1.2 J
PW-3A 6/18/2002 — ... ... ... < 0.50 3.1 3.9 < 0.50 1.4 < 0.50 < 0.50 < 1.0 < 0.50 < 0.50 < 1.0 < 0.50 < 0.50 0.98
PW-3A 8/22/2000 — ... — ... < 0.50 2.0 2.7 < 0.50 1.7 < 0.50 < 0.50 < 1.0 < 0.50 0.51 < 1.0 < 0.50 < 0.50 < 0.50
PW-3A 7/16/1998 < 10 < 10 < 10 < 5.0 < 0.50 1.4 2.9 < 0.50 1.7 < 0.50 < 0.50 < 1.0 0.81 < 0.50 < 1.0 < 0.50 < 0.50 1.1
PW-3A 7/8/1997 < 10 < 10 < 10 < 5.0 < 0.50 4.7 5.6 < 0.50 2.4 < 0.50 < 0.50 < 1.0 < 0.50 < 0.50 < 1.0 0.98 < 0.50 0.58
PW-3A 9/4/1996 < 10 < 10 < 10 < 5.0 < 0.50 < 0.50 < 0.50 35 < 0.50 < 0.50 < 0.50 < 1.0 < 0.50 < 0.50 < 1.0 16 < 0.50 < 0.50
PW-3 7/16/1996 < 10 < 10 < 10 < 5.0 < 0.50 2.7 6.2 < 0.50 2.5 < 0.50 < 0.50 < 1.0 92 8 < 0.50 < 1.0 7.5 J 44 J 140 J
PW-3 7/18/1995 < 10 < 10 < 25 < 10 < 0.50 1.6 4.5 < 0.50 1.7 < 0.50 < 0.50 < 1.0 2.9 < 0.50 < 1.0 1.9 26 90
PW-3 7/19/1994 < 10 < 10 < 25 < 3 < 0.50 2.9 < 0.50 < 0.50 1.8 < 0.50 < 0.50 < 1.0 m < 0.50 < 1.0 4.9 30 110
PW-3 8/23/1993 < 10 < 8.0 < 3.0 < 1.0 < 10 3 10 < 10 < 10 < 10 < 10 < 10 < 10 < 10 16 71 340
PW-3 8/10/1992 < 10 < 10 < 25 < 3.0 < 12 < 12 < 12 < 12 < 12 < 12 < 12 < 12 < 12 < 12 < 12 < 12 72 100
PW-3 7/2/1991 < 10 ... < 6.0 < 1.0 < 25 3 30 < 25 3 < 25 < 25 < 25 03 < 25 < 25 14 63 210
PW-3 11/8/1990 < 10 ... < 5.0 < 1.0 < 5 < 5 9 < 5 < 5 < 5 < 5 < 5 < 5 < 5 < 5 < 5 17 53
PW-3 8/28/1990 < 10 ... < 4.0 < 1.0 < 10 < 10 17 < 10 < 10 < 10 < 10 < 10 HD < 10 < 10 10 32 130
PW-3 5/10/1990 < 10 ... < 4.00 < 2.00 < 25 < 25 37 < 25 < 25 < 25 < 25 < 25 < 25 < 25 < 25 < 25 33 150
PW-3 2/28/1990 < 10 ... < 5.0 1.2 < 5 2 56 < 5 1 < 5 4 < 5 < 5 < 5 15 33 140
PW-4A 10/31/2012 ... ... ... ... < 1.0 < 1.0 0.41 J < 1.0 0.78 J < 1.0 2.1 < 1.0 3.8 0.59 J < 1.0 0.29 J 3.7 4.4
PW-4A 6/7/2011 ._- _._ ... ... < 1.0 < 1.0 0.37 J < 1.0 0.82 J < 1.0 2.3 < 1.0 2.4 0.74 J < 1.0 0.60 J 2.2 UB < 2.0
PW-4A 2/15/2011 — . ... ... ... < 1.0 < 1.0 0.42 J < 1.0 < 1.0 < 1.0 1.4 < 1.0 1.2 < 1.0 < 1.0 < 1.0 < 1.0 < 2.0
PW-4A 6/22/2010 ... ... ... ... < 1.0 < 1.0 < 1.0 < 1.0 0.67 J < 1.0 1.8 J < 1.0 3.0 0.67 J < 1.0 < 1.0 3.8 7.9
PW-4A 2/4/2008 ... ... ... ... < .1.0 < 1.0 < 1.0 < 1.0 < 1.0 < 1.0 0.40 J < 1.0 < 1.0 < 1.0 < 1.0 < 1.0 < 1.0 < 2.0
PW-4A 6/20/2006 ... ... ... ... 0.2 J 0.17 J 0.62 J < 1.0 1.6 < 1.0 2.9 < 1.0 1.1 J 0.84 J < 1.0 < 1.0 4.0 11
PW-4A 6/8/2004 — ... ... — < 1.0 < 1.0 0.42 J < 1.0 1.1 < 1.0 1.9 < 1.0 2.8 0.65 J < 1.0 < 1.0 UB 5.2 19
PW-4A 6/18/2002 — ... ... ... < 0.50 < 0.50 0.55 < 0.50 0.86 < 0.50 1.5 < 1.0 0.74 J < 0.50 < 1.0 < 0.50 UJ 1.4 J 6.2 J
PW-4A 8/22/2000 — ... ... ... < 0.50 < 0.50 0.66 < 0.50 1.2 < 0.50 1.8 < 1.0 1.60 0.87 < 1.0 0.39 6.4 29
PW-4A 7/14/1998 < 10 < 10 < 10 < 5.0 < 0.50 < 0.50 < 0.50 < 0.50 1.2 < 0.50 1.4 < 1.0 0.79 < 0.50 < 1.0 < 0.50 7.1 25
PW-4A 7/9/1997 < 10 < 10 < 10 < 5.0 < 0.50 < 0.50 < 0.50 < 0.50 < 0.50 < 0.50 < 0.50 < 1.0 2.1 < 0.50 < 1.0 0.51 7.4 22
PW-4A 7/16/1996 < 10 < 10 < 10 < 5.0 < 0.50 0.S9 1.3 < 0.50 1.8 < 0.50 2.6 < 1.0 0.99 0.90 < 1.0 0.79 7.8 25
PW-4A 7/18/1995 < 10 < 10 < 25 < 10 < 0.50 < 0.50 0.52 < 0.50 0.71 < 0.50 1.5 < 1.0 1.9 < 0.50 < 1.0 < 0.50 12 45
PW-4 7/19/1994 < 10 < 10 < 25 < 6 < 0.50 0.48 J < 0.50 < 0.50 1.2 < 0.50 2.7 < 1.0 0.54 0.62 < 1.0 < 0.50 3.0 8.5
PW-4 8/23/1993 < 10 < 8.0 < 3.0 < 1.0 < 10 1 2 < 10 2 < 10 s < 10 3 1 < 10 < 10 8 30
PW-4 8/10/1992 < 10 < 10 < 25 < 3.0 < 5.0 < 5.0 < 5.0 < 5.0 < 5.0 < 5.0 < 5.0 < 5.0 < 5.0 < 5.0 < 5.0 < 5.0 < 5.0 8.4
PW-4 7/2/1991 < 10 ... < 6.0 < 1.0 < 10 < 10 < 10 < 10 3 < 10 3 < 10 3 < 10 < 10 < 10 3 10
PW-4 11/7/1990 < 10 ... < 5.0 < 1.0 < 5 < 5 < 5 < 5 < 5 < 5 8 < 5 < 5 < 5 < 5 < 5 < 5 12
. PW-4 8/28/1990 < 10 ... 4.6 < 1.0 < 5 < 5 < 5 < 5 6 < 5 1 0 < 5 < 5 < 5 < 5 < 5 < 5 11
PW-4 5/10/1990 < 10 ... < 4.00 < 2.00 < 5 < 5 < 5 < 5 < 5 < 5 < 5 < 5 < 5 < 5 < 5 < 5 5 20
PW-4 2/28/1990 < 10 --. < 5.0 < 1.0 < 5 < 5 < 5 < 5 3 < 5 3 < 5 < 5 < 5 < 5 < 5 3 7
G:\ENV\TF\1001-1100\TF1034\2013\FiveYearReview\Report\02-llGW_ANAL APPENDIXB09212011 Revised010813.xlsx/masteranalvtical Page 8 of 10
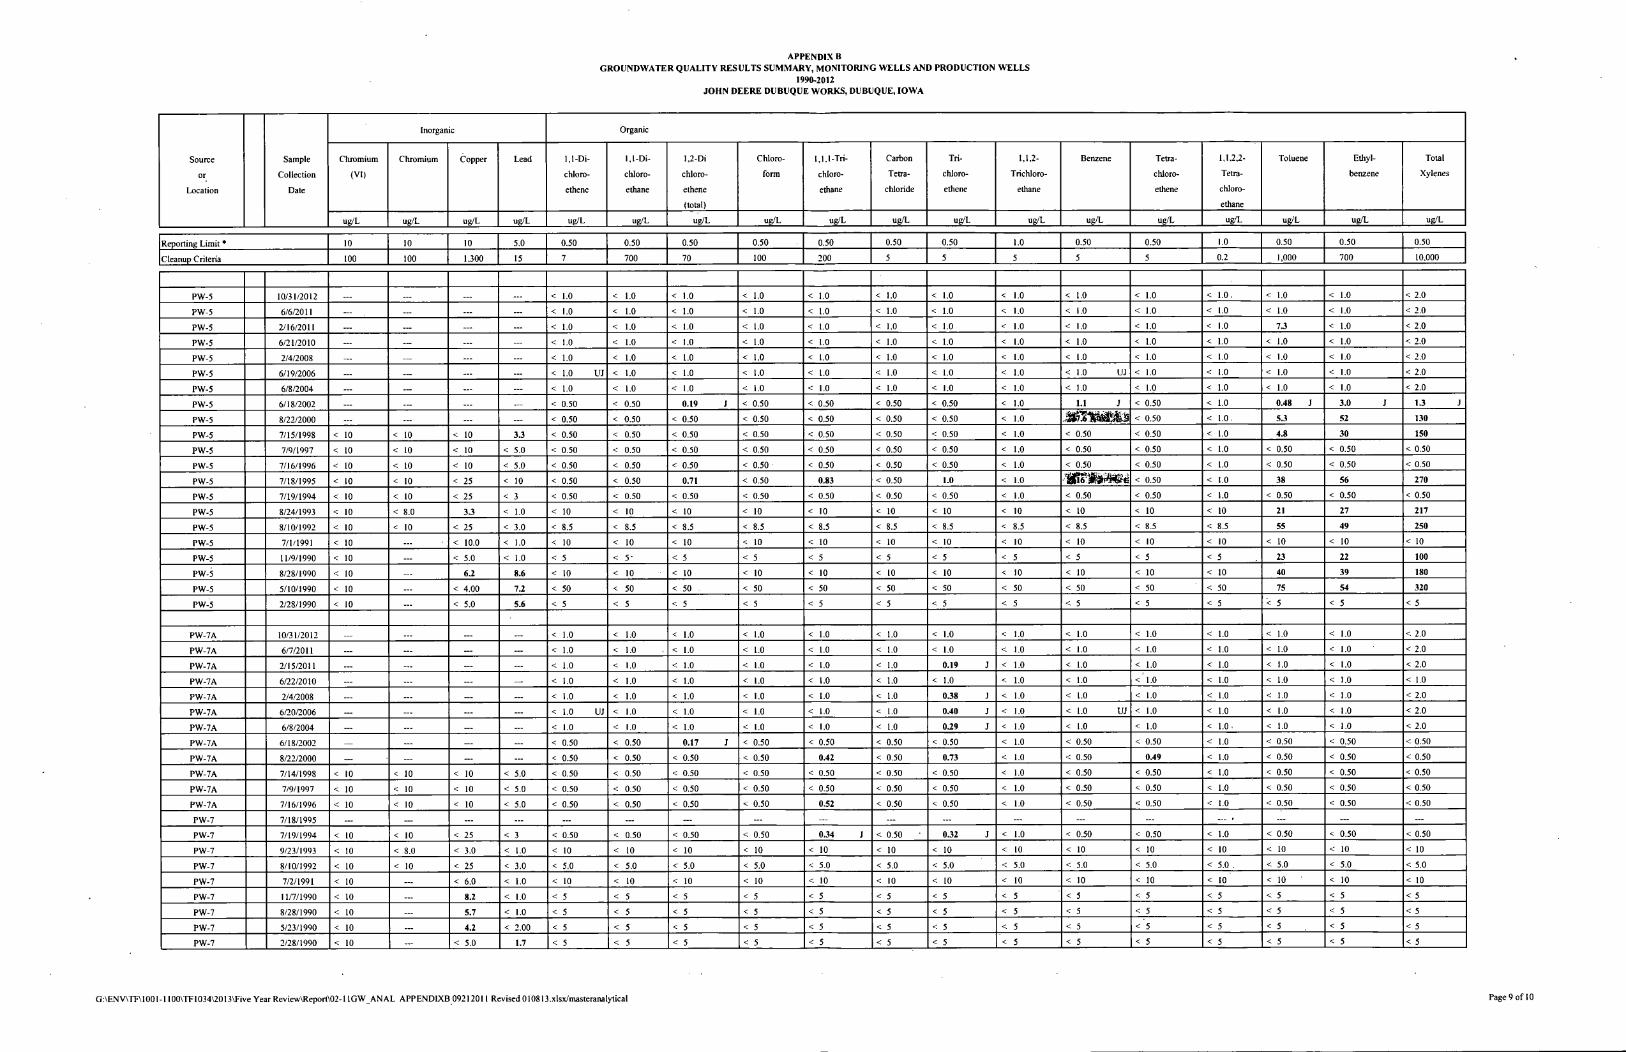
APPENDIX B GROUNDWATER QUALITY RESULTS SUMMARY, MONITORING WELLS AND PRODUCTION WELLS
1990-2012 JOHN DEERE DUBUQUE WORKS, DUBUQUE, IOWA
Inorganic Organic
Source Sample Chromium Chromium Copper Lead 1,1-Di- 1,1-Di- 1,2-Di Chloro 1,1,1-Tri- Carbon Tri- 1,1,2- Benzene Tetra- 1,1,2,2- Toluene Ethyl- Total
or Collection (VI) chloro- chloro- chloro- form chloro- Tetra chloro- Trichloro- chloro- Tetra- benzene Xylenes
Location Date ethene ethane ethene ethane chloride ethene ethane ethene chloro-
(total) ethane
ug/L ug/L ug/L ug/L ug/L ug/L ug/L ug/L ug/L ug/L ug/L Ug/L ug/L ug/L ug/L ug/L ug/L ug/L
Reporting Limit * 10 10 10 5.0 0.50 0.50 0.50 0.50 0.50 0.50 0.50 1.0 0.50 0.50 1.0 0.50 0.50 0.50
Cleanup Criteria 100 100 1.300 15 7 700 70 100 200 5 5 5 5 5 0.2 1,000 700 10,000
PW-5 10/31/2012 ___ < 1.0 < 1.0 < 1.0 < 1.0 < 1.0 < 1.0 < 1.0 < 1.0 < 1.0 < 1.0 < 1.0. < 1.0 < 1.0 < 2.0
PW-5 6/6/2011 .__ < 1.0 < 1.0 < 1.0 < 1.0 < 1.0 < 1.0 < 1.0 < 1.0 < 1.0 < 1.0 < 1.0 < 1.0 < 1.0 < 2.0
PW-5 2/16/2011 < 1.0 < 1.0 < 1.0 < 1.0 < 1.0 < 1.0 < 1.0 < 1.0 < 1.0 < 1.0 < 1.0 7.3 < 1.0 < 2.0
PW-5 6/21/2010 ___ — < 1.0 < 1.0 < 1.0 < 1.0 < 1.0 < 1.0 < 1.0 < 1.0 < 1.0 < 1.0 < 1.0 < 1.0 < 1.0 < 2.0
PW-5 2/4/2008 ___ ... < 1.0 < 1.0 < 1.0 < 1.0 < 1.0 < 1.0 < 1.0 < 1.0 < 1.0 < 1.0 < 1.0 < 1.0 < 1.0 < 2.0
PW-5 6/19/2006 ___ < 1.0 UJ < 1.0 < 1.0 < 1.0 < 1.0 < 1.0 < 1.0 < 1.0 < 1.0 UJ < 1.0 < 1.0 < 1.0 < 1.0 < 2.0
PW-5 6/8/2004 < 1.0 < 1.0 < 1.0 < 1.0 < 1.0 < 1.0 < 1.0 < 1.0 < 1.0 < 1.0 < 1.0 < 1.0 < 1.0 < 2.0
PW-5 6/18/2002 — < 0.50 < 0.50 0.19 J < 0.50 < 0.50 < 0.50 < 0.50 < 1.0 1.1 J < 0.50 < 1.0 0.48 J 3.0 J 1.3 J
PW-5 8/22/2000 __. < 0.50 < 0.50 < 0.50 < 0.50 < 0.50 < 0.50 < 0.50 < 1.0 < 0.50 < 1.0. 5.3 52 130
PW-5 7/15/1998 < 10 < 10 < 10 3.3 < 0.50 < 0.50 < 0.50 < 0.50 < 0.50 < 0.50 < 0.50 < 1.0 < 0.50 < 0.50 < 1.0 4.8 30 150
PW-5 7/9/1997 < 10 < 10 < 10 < 5.0 < 0.50 < 0.50 < 0.50 < 0.50 < 0.50 < 0.50 < 0.50 < 1.0 < 0.50 < 0.50 < 1.0 < 0.50 < 0.50 < 0.50
PW-5 7/16/1996 < 10 < 10 < 10 < 5.0 < 0.50 < 0.50 < 0.50 < 0.50 < 0.50 < 0.50 < 0.50 < 1.0 < 0.50 < 0.50 < 1.0 < 0.50 < 0.50 < 0.50
PW-5 7/18/1995 < 10 < 10 < 25 < 10 < 0.50 < 0.50 0.71 < 0.50 0.83 < 0.50 1.0 < 1.0 < 0.50 < 1.0 38 56 270
PW-5 7/19/1994 < 10 < 10 < 25 < 3 < 0.50 < 0.50 < 0.50 < 0.50 < 0.50 < 0.50 < 0.50 < 1.0 < 0.50 < 0.50 < 1.0 < 0.50 < 0.50 < 0.50
PW-5 8/24/1993 < 10 < 8.0 3.3 < 1.0 < 10 < 10 < 10 < 10 < 10 < 10 < 10 < 10 < 10 < 10 < 10 21 27 217
PW-5 8/10/1992 < 10 < 10 < 25 < 3.0 < 8.5 < 8.5 < 8.5 < 8.5 < 8.5 < 8.5 < 8.5 < 8.5 < 8.5 < 8.5 < 8.5 55 49 250
PW-5 7/1/1991 < 10 __. < 10.0 < 1.0 < 10 < 10 < 10 < 10 < 10 < 10 < 10 < 10 < 10 < 10 < 10 < 10 < 10 < 10
PW-5 11/9/1990 < 10 < 5.0 < 1.0 < 5 < 5" < 5 < 5 < 5 < 5 < 5 < 5 < 5 < 5 < 5 23 22 100
PW-5 8/28/1990 < 10 6.2 8.6 < 10 < 10 < 10 < 10 < 10 < 10 < 10 < 10 < 10 < 10 < 10 40 39 180
PW-5 5/10/1990 < 10 < 4.00 7.2 < 50 < 50 < 50 < 50 < 50 < 50 < 50 < 50 < 50 < 50 < 50 75 54 320
PW-5 2/28/1990 < 10 < 5.0 5.6 < 5 < 5 < 5 < 5 < 5 < 5 < 5 < 5 < 5 < 5 < 5 < 5 < 5 < 5
PW-7A 10/31/2012 — < 1.0 < 1.0 < 1.0 < 1.0 < 1.0 < 1.0 < 1.0 < 1.0 < 1.0 < 1.0 < 1.0 < 1.0 < 1.0 < 2.0
PW-7A 6/7/2011 < 1.0 < 1.0 < 1.0 < 1.0 < 1.0 < 1.0 < 1.0 < 1.0 < 1.0 < 1.0 < 1.0 < 1.0 < 1.0 < 2.0
PW-7A 2/15/2011 ___ ___ < 1.0 < 1.0 < 1.0 < 1.0 < 1.0 < 1.0 0.19 J < 1.0 < 1.0 < 1.0 < 1.0 < 1.0 < 1.0 < 2.0
PW-7A 6/22/2010 < 1.0 < 1.0 < 1.0 < 1.0 < 1.0 < 1.0 < 1.0 < 1.0 < 1.0 <' 1.0 < 1.0 < 1.0 < 1.0 < 1.0
PW-7A 2/4/2008 __. < 1.0 < 1.0 < 1.0 < 1.0 < 1.0 < 1.0 0.38 J < 1.0 < 1.0 < 1.0 < 1.0 < 1.0 < 1.0 < 2.0
PW-7A 6/20/2006 < 1.0 UJ < 1.0 < 1.0 < 1.0 < 1.0 < 1.0 0.40 J < 1.0 < 1.0 UJ < 1.0 < 1.0 < 1.0 < 1.0 < 2.0
PW-7A 6/8/2004 _._ < 1.0 < 1.0 < 1.0 < 1.0 < 1.0 < 1.0 0.29 J < 1.0 < 1.0 < 1.0 < 1.0. < 1.0 < 1.0 < 2.0
PW-7A 6/18/2002 ___ < 0.50 < 0.50 0.17 J < 0.50 < 0.50 < 0.50 < 0.50 < 1.0 < 0.50 < 0.50 < 1.0 < 0.50 < 0.50 < 0.50
PW-7A 8/22/2000 < 0.50 < 0.50 < 0.50 < 0.50 0.42 < 0.50 0.73 < 1.0 < 0.50 0.49 < 1.0 < 0.50 < 0.50 < 0.50
PW-7A 7/14/1998 < 10 < 10 < 10 < 5.0 < 0.50 < 0.50 < 0.50 < 0.50 < 0.50 < 0.50 < 0.50 < 1.0 < 0.50 < 0.50 < 1.0 < 0.50 < 0.50 < 0.50
PW-7 A 7/9/1997 < 10 < 10 < 10 < 5.0 < 0.50 < 0.50 < 0.50 < 0.50 < 0.50 < 0.50 < 0.50 < 1.0 < 0.50 < 0.50 < 1.0 < 0.50 < 0.50 < 0.50
PW-7A 7/16/1996 < 10 < 10 < 10 < 5.0 < 0.50 < 0.50 < 0.50 < 0.50 0.52 < 0.50 < 0.50 < 1.0 < 0.50 < 0.50 < 1.0 < 0.50 < 0.50 < 0.50
PW-7 7/18/1995 ___ ___ ... _._ ... ... ... ... ... ... ... ... PW-7 7/19/1994 < 10 < 10 < 25 < 3 < 0.50 < 0.50 < 0.50 < 0.50 0.34 J < 0.50 0.32 J < 1.0 < 0.50 < 0.50 < 1.0 < 0.50 < 0.50 < 0.50
PW-7 9/23/1993 < 10 < 8.0 < 3.0 < 1.0 < 10 < 10 < 10 < 10 < 10 < 10 < 10 < 10 < 10 < 10 < 10 < 10 < 10 < 10
PW-7 8/10/1992 < 10 < 10 < 25 < 3.0 < 5.0 < 5.0 < 5.0 < 5.0 < 5.0 < 5.0 < 5.0 < 5.0 < 5.0 < 5.0 < 5.0 . < 5.0 < 5.0 < 5.0
PW-7 7/2/1991 < 10 < 6.0 < 1.0 < 10 < 10 < 10 < 10 < 10 < 10 < 10 < 10 < 10 < 10 < 10 < 10 < 10 < 10
PW-7 11/7/1990 < 10 8.2 < 1.0 < 5 < 5 < 5 < 5 < 5 < 5 < 5 < 5 < 5 < 5 < 5 < 5 < 5 < 5
PW-7 8/28/1990 < 10 5.7 < 1.0 < 5 < 5 < 5 < 5 < 5 < 5 < 5 < 5 < 5 < 5 < 5 < 5 < 5 < 5
PW-7 5/23/1990 < 10 4.2 < 2.00 < 5 < 5 < 5 < 5 < 5 < 5 < 5 < 5 < 5 < 5 < 5 < 5 < 5 < 5
PW-7 2/28/1990 < 10 ._ < 5.0 1.7 < 5 < 5 < 5 < 5 < 5 < 5 < 5 < 5 < 5 < 5 < 5 < 5 < 5 < 5
G:\ENV\TF\1001-U00\TF1034\2013\Five Year Review\Reporl\02-11GW ANAL APPEND1XB 09212011 Revised 010813.xlsx/masteranalytical Page 9 of 10
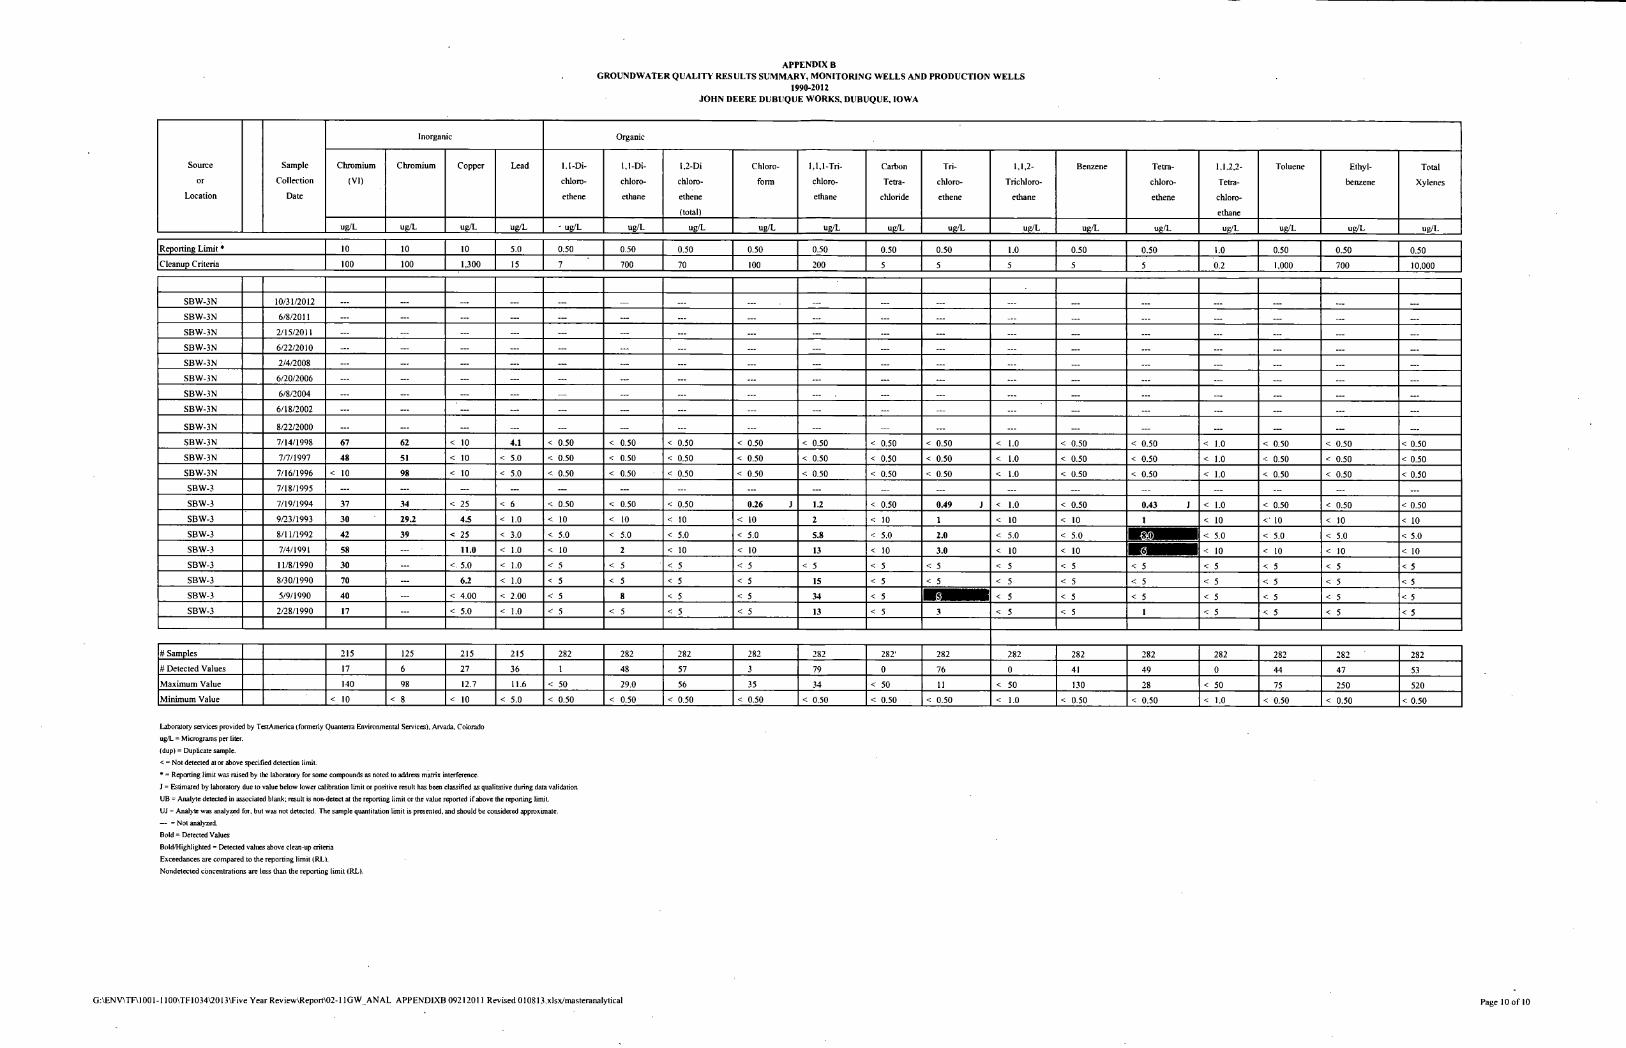
APPENDIX B GROUNDWATER QUALITY RESULTS SUMMARY, MONITORING WELLS AND PRODUCTION WELLS
1990-2012 JOHN DEERE DUBUQUE WORKS, DUBUQUE, IOWA
Inorganic Organic
Source Sample Chromium Chromium Copper Lead l.I-Di- 1,1-Di- 1,2-Di Chloro 1,1,1-Tri- Carbon Tri- 1,1,2- Benzene Tetra- 1.1.2,2- Toluene Ethyl- Total
or Collection (VI) chloro- chloro- chloro- form chloro- Tetra chloro- Trichloro- chloro- Tetra- benzene Xylenes
Location Date ethenc ethane ethene ethane chloride ethene ethane ethene chloro-
(total) ethane
ug/L ug/L ug/L ug/L - ug/L ug/L ug/L ug/L ug/L ug/L ug/L ug/L ug/L ug/L ug/L ug/L ug/L ug/L
Reporting Limit * 10 10 10 5.0 0.50 0.50 0.50 0.50 0.50 0.50 0.50 1.0 0.50 0.50 1.0 0.50 0.50 0.50
Cleanup Criteria 100 100 1,300 15 7 700 70 100 200 5 5 5 5 5 0.2 1,000 700 10.000
SBW-3N 10/31/2012 ... ... — ... ... __. ... ... — ... SBW-3N 6/8/2011 ... ... ... ... ... ... ... ... — ... SBW-3N 2/15/2011 ... ... ... ... ... ... ... ... ... — ... SBW-3N 6/22/2010 ... _._ ... ... ... ... ... ... ... SBW-3N 2/4/2008 ... ... ... ... — ... ... ... SBW-3N 6/20/2006 ... ... ... ... ... ... ... — ... SBW-3N 6/8/2004 ... ... ... ... _._ ... ... — ... SBW-3N 6/18/2002 ... ... ... ... ... ... ... — — ... ... SBW-3N 8/22/2000 — ... ... ... SBW-3N 7/14/1998 67 62 < 10 4.1 < 0.50 < 0.50 < 0.50 < 0.50 < 0.50 < 0.50 < 0.50 < 1.0 < 0.50 < 0.50 < 1.0 < 0.50 < 0.50 < 0.50
SBW-3N 7/7/1997 48 51 < 10 < 5.0 < 0.50 < 0.50 < 0.50 < 0.50 < 0.50 < 0.50 < 0.50 < 1.0 < 0.50 < 0.50 < 1.0 < 0.50 < 0.50 < 0.50
SBW-3N 7/16/1996 < 10 98 < 10 < 5.0 < 0.50 < 0.50 < 0.50 < 0.50 < 0.50 < 0.50 < 0.50 < 1.0 < 0.50 < 0.50 < 1.0 < 0.50 < 0.50 < 0.50
SBW-3 7/18/1995 ... ... _._ ... ... ... ... ... ... . „ — ... SBW-3 7/19/1994 37 34 < 25 < 6 < 0.50 < 0.50 < 0.50 0.26 J 1.2 < 0.50 0.49 J < 1.0 < 0.50 0.43 J < 1.0 < 0.50 < 0.50 < 0.50
SBW-3 9/23/1993 30 29.2 4.5 < 1.0 < 10 < 10 < 10 < 10 2 < 10 1 < 10 < 10 1 < 10 <' 10 < 10 < 10
SBW-3 8/11/1992 42 39 < 25 < 3.0 < 5.0 < 5.0 < 5.0 < 5.0 5.8 < 5.0 2.0 < 5.0 < 5.0 < 5.0 < 5.0 < 5.0 < 5.0
SBW-3 7/4/1991 58 ... 11.0 < 1.0 < 10 2 < 10 < 10 13 < 10 3.0 < 10 < 10 < 10 < 10 < 10 < 10
SBW-3 11/8/1990 30 ... < 5.0 < 1.0 < 5 < 5 < 5 < 5 < 5 < 5 < 5 < 5 < 5 < 5 < 5 < 5 < 5 < 5
SBW-3 8/30/1990 70 ... 6.2 < 1.0 < 5 < 5 < 5 < 5 15 < 5 < 5 < 5 < 5 < 5 < 5 < 5 < 5 < 5
SBW-3 5/9/1990 40 ... < 4.00 < 2.00 < 5 8 < 5 < 5 34 < 5 < 5 < 5 < 5 < 5 < 5 < 5 < 5
SBW-3 2/28/1990 17 ... < 5.0 < 1.0 < 5 < 5 < 5 < 5 13 < 5 3 < 5 < 5 1 < 5 < 5 < 5 < 5
# Samples 215 125 215 215 282 282 282 282 282 282' 282 282 282 282 282 282 282 282
# Detected Values 17 6 27 36 1 48 57 3 79 0 76 0 41 49 0 44 47 53
Maximum Value 140 98 12.7 11.6 < 50 29.0 56 35 34 < 50 11 < 50 130 28 < 50 75 250 520
Minimum Value < 10 < 8 < 10 < 5.0 < 0.50 < 0.50 < 0.50 < 0.50 < 0.50 < 0.50 < 0.50 < 1.0 < 0.50 < 0.50 < 1.0 < 0.50 < 0.50 < 0.50
Laboratory services provided by TcstAmerica (formerly Quanterra Environmental Services), Arvada, Colorado
ug/L = Micrograms per liter,
(dup) = Duplicate sample.
< = Not detected at or above specified detection limit.
* = Reporting limit was raised by the laboratory for some compounds as noted to address matrix interference.
J = Estimated by laboratory due lo value below lower calibration limit or positive result has been classified as qualitative during data validation
UB = Analyte detected in associated blank; result is non-detect at the reporting limit or the value reported if above the reporting limit
UJ ~~ Analyte was analyzed for, but was not detected. The sample quantitation limit is presented, and should be considered approximate.
— = Not analyzed.
Bold = Detected Values
Bold/Highlighted = Detected values above clean-up criteria
Exceedances are compared to the reporting limit (RL).
Nondetected concentrations are less than the reporting limit (RL).
G:\ENV\TFM001-1100\TF1034\2O13\Five Year Review\Report\02-l 1GW ANAL APPEND1XB 09212011 Revised O10813.x]sx/mastcranalylical Page 10 of 10
APPENDIX C
i
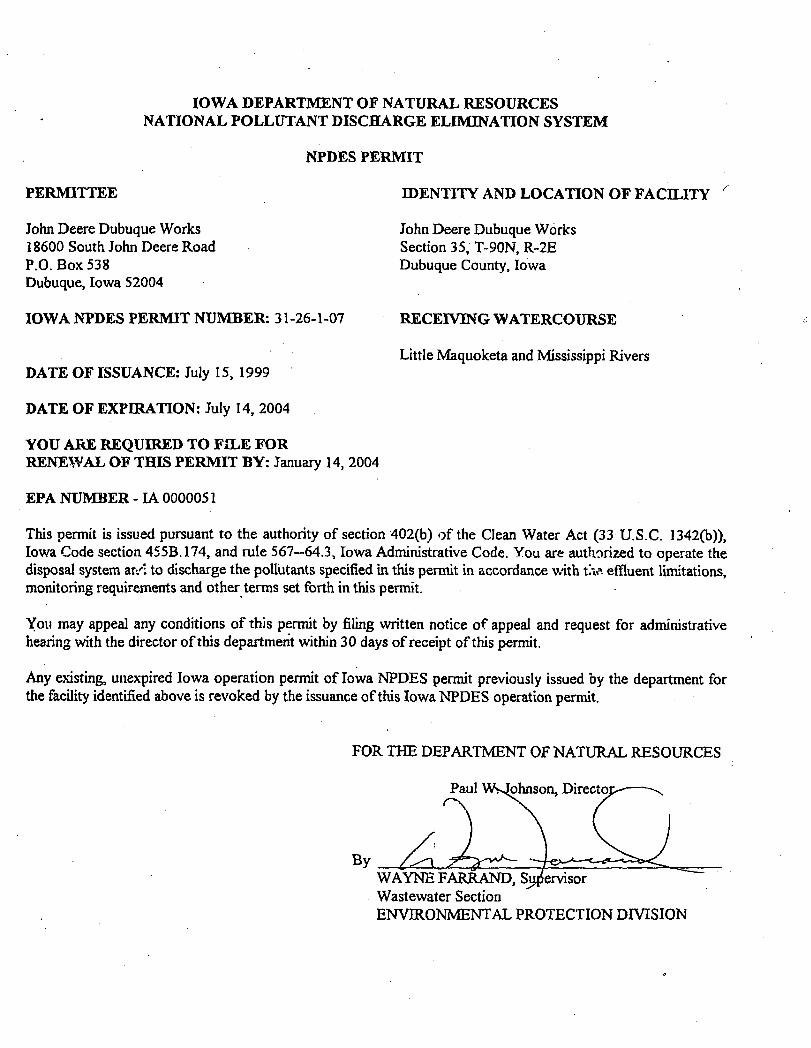
IOWA DEPARTMENT OF NATURAL RESOURCES NATIONAL POLLUTANT DISCHARGE ELIMINATION SYSTEM
NPDES PERMIT
PERMITTEE
John Deere Dubuque Works 18600 South John Deere Road P.O. Box 538 Dubuque, Iowa 52004
IOWA NPDES PERMIT NUMBER: 31-26-1-07
IDENTITY AND LOCATION OF FACILITY
John Deere Dubuque Works Section 35, T-90N, R-2E Dubuque County, Iowa
RECEIVING WATERCOURSE
Little Maquoketa and Mississippi Rivers DATE OF ISSUANCE: July 15, 1999
DATE OF EXPERATION: July 14, 2004
YOU ARE REQUIRED TO FILE FOR RENEWAL OF THIS PERMIT B Y : January 14, 2004
EPA NUMBER - IA 0000051
This permit is issued pursuant to the authority of section 402(b) of the Clean Water Act (33 U.S.C. 1342(b)), Iowa Code section 455B.174, and rule 567—64.3, Iowa Administrative Code. You are authorized to operate the disposal system ar/1 to discharge the pollutants specified in this permit in accordance with t.v. effluent limitations, monitoring requirements and other terms set forth in this permit.
You may appeal any conditions of this permit by filing written notice of appeal and request for administrative healing with the director of this department within 30 days of receipt of this permit.
Any existing, unexpired Iowa operation permit of Iowa NPDES permit previously issued by the department for the facility identified above is revoked by the issuance of this Iowa NPDES operation permit.
FOR THE DEPARTMENT OF NATURAL RESOURCES
bhnson, Director
WAYNE FARRAND, Si Wastewater Section ENVIRONMENTAL PROTECTION DIVISION
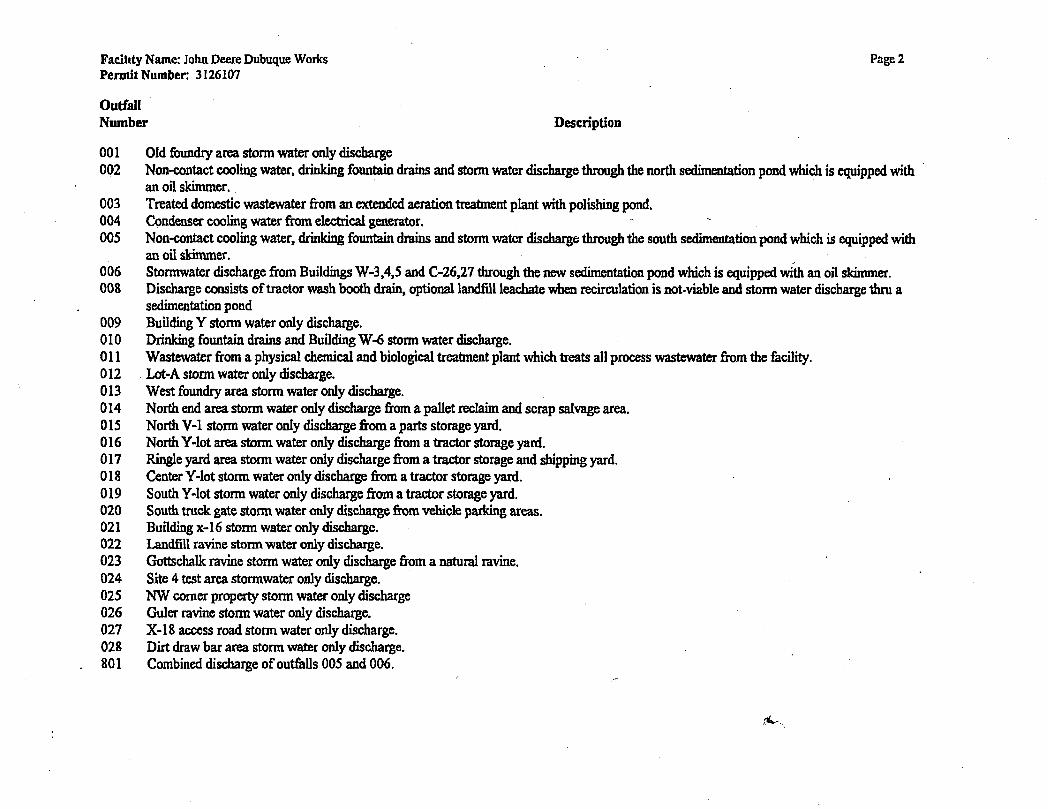
Facility Name: John Deere Dubuque Works Permit Number: 3126107
Page 2
Outfall Number Description
001 Old foundry area storm water only discbarge 002 Non-contact cooling water, drinking fountain drains and storm water discharge through the north sedimentation pond which is equipped with
an oil skimmer. 003 Treated domestic wastewater from an extended aeration treatment plant with polishing pond. 004 Condenser cooling water from electrical generator. ~ - . 005 Non-contact cooling water, drinking fountain drains and storm water discharge through the south sedimentation pond which is equipped with
an oil skimmer. 006 Stomtwater discharge from Buildings W-3,4,5 and C-26,27 through the new sedimentation pond which is equipped with an oil skimmer. 008 Discharge consists of tractor wash booth drain, optional landfill leachate when recirculation is not-viable and storm water discharge thru a
sedimentation pond 009 Building Y storm water only discharge. 010 Drinking fountain drains and Building W-6 storm water discharge. Oil Wastewater from a physical chemical and biological treatment plant which treats all process wastewater from the facility. 012 Lot-A storm water only discharge. 013 West foundry area storm water only discharge. 014 North end area storm water only discharge from a pallet reclaim and scrap salvage area. 015 North V-l storm water only discharge from a parts storage yard. 016 North Y-lot area storm water only discharge from a tractor storage yard. 017 Ringle yard area storm water only discharge from a tractor storage and shipping yard. 018 Center Y-lot storm water only discharge from a tractor storage yard. 019 South Y-lot storm water only discharge from a tractor storage yard. 020 South truck gate storm water only discharge from vehicle parking areas. 021 Building x-16 storm water only discharge. 022 Landfill ravine storm water only discharge. 023 Gottschalk ravine storm water only discharge from a natural ravine. 024 Site 4 test area stormwater only discharge. 025 NW comer property storm water only discharge 026 Guler ravine storm water only discharge. 027 X-18 access road storm water only discharge. 028 Dirt draw bar area storm water only discharge. 801 Combined discharge of outfalls 005 and 006.
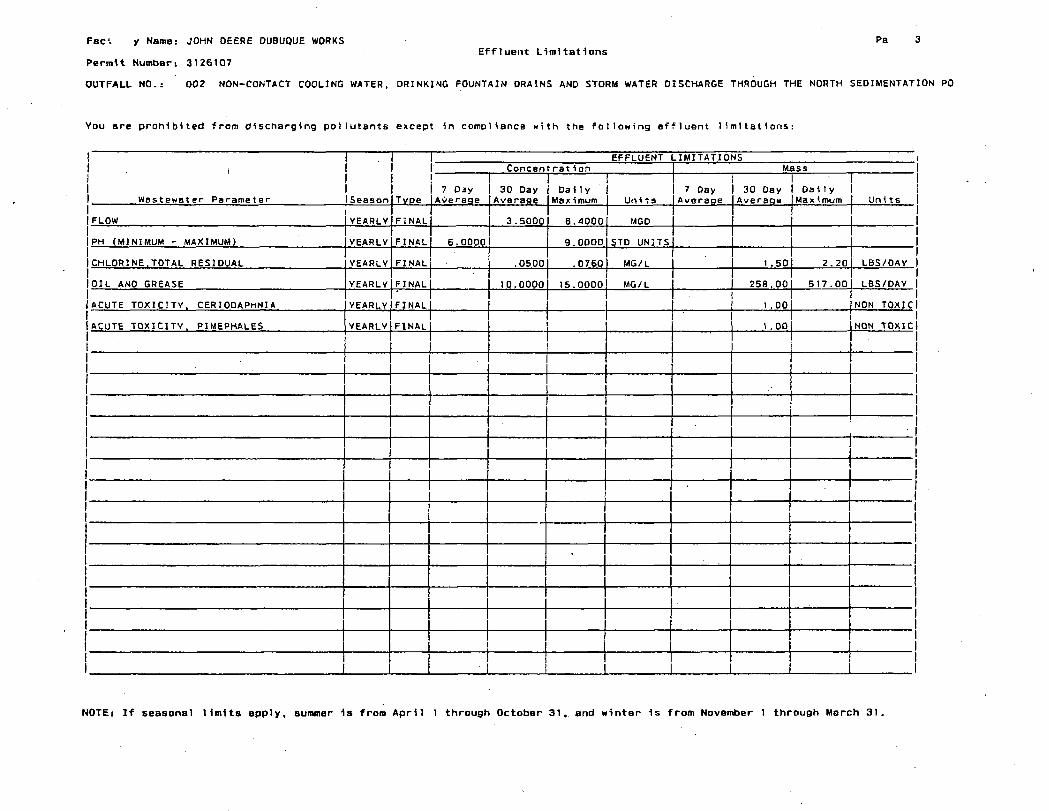
FaC. y Name: JOHN DEERE DUBUQUE WORKS Pa 3 Effluent Limitations
Permit Number: 3126107
OUTFALL NO.: 002 NON-CONTACT COOLING WATER, DRINKING FOUNTAIN DRAINS AND STORM WATER DISCHARGE THROUGH THE NORTH SEDIMENTATION
You are prohibited from discharging pollutants except In compliance with the following effluent limitations:
EFFLUENT LIMITATIONS 1 I I I 1 Concentration Mass
1 Wastewater Parameter
1 1 Season
1 I Type
7 Djy Average
30 Day Average
Da 11y ! Maximum 1 Un i t s
7 Day Average
1 1 30 Day Average
1 1 Da 1 1 y MaxImum
1 I
Uni t s
1 FLOW VEARLV FINAL 3.5000 6.40001 MGD
PH (MINIMUM - MAXIMUM) YEARLY FINAL 6.0000 9.0000 STD UNITS
ICHLORINE.TOTAL RESIDUAL YEARLY FINAL .0500 .07601 MG/L 1 .50 2.20 LBS/OAY
1 lOIL ANO GREASE
YEARLY FINAL 10.0000 15.0000 MG/L 258.00 517.00 LBS/DAY
1 |ACUTE TOXICITV. CERIODAPHNIA
YEARLY FINAL l .00 NON TOXIC 1 lACUTE TOXICITV. PIMEPHALES YEARLY FINAL 1 .00 NON TOXIC
1 1
1
•
I
NOTE: If seasonal limits apply, summer 1s from April 1 through October 31, and winter 1s from November 1 through March 31.
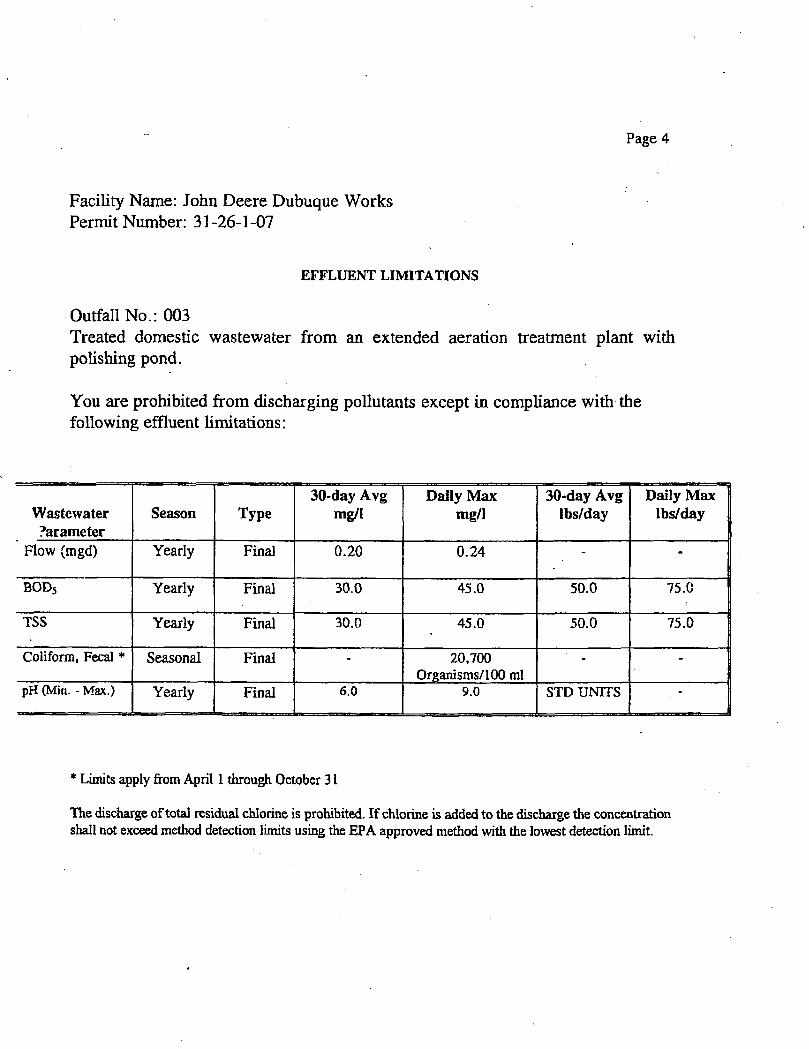
Page 4
Facility Name: John Deere Dubuque Works Permit Number: 31-26-1-07
EFFLUENT LIMITATIONS
Outfall No.: 003 Treated domestic wastewater from an extended aeration treatment plant with polishing pond.
You are prohibited from discharging pollutants except in compliance with the following effluent limitations:
Wastewater ?arameter
Season Type 30-day Avg
mg/1 Daily Max
mg/1 30-day Avg
lbs/day Daily Max
lbs/day
Flow (mgd) Yearly Final 0.20 0.24 - -
BOD5 Yearly Final 30.0 45.0 50.0 75.0
TSS Yearly Final 30.0 45.0 50.0 75.0
CoHform, Fecal * Seasonal Final - 20,700 Organisms/100 ml
- -
pH (Min. - Max.) Yearly Final 6.0 9.0 STD UNITS -
* Limits apply from April I through October 31
The discharge of total residual chlorine is prohibited. If chlorine is added to the discharge the concentration shall not exceed method detection limits using the EPA approved method with the lowest detection limit.
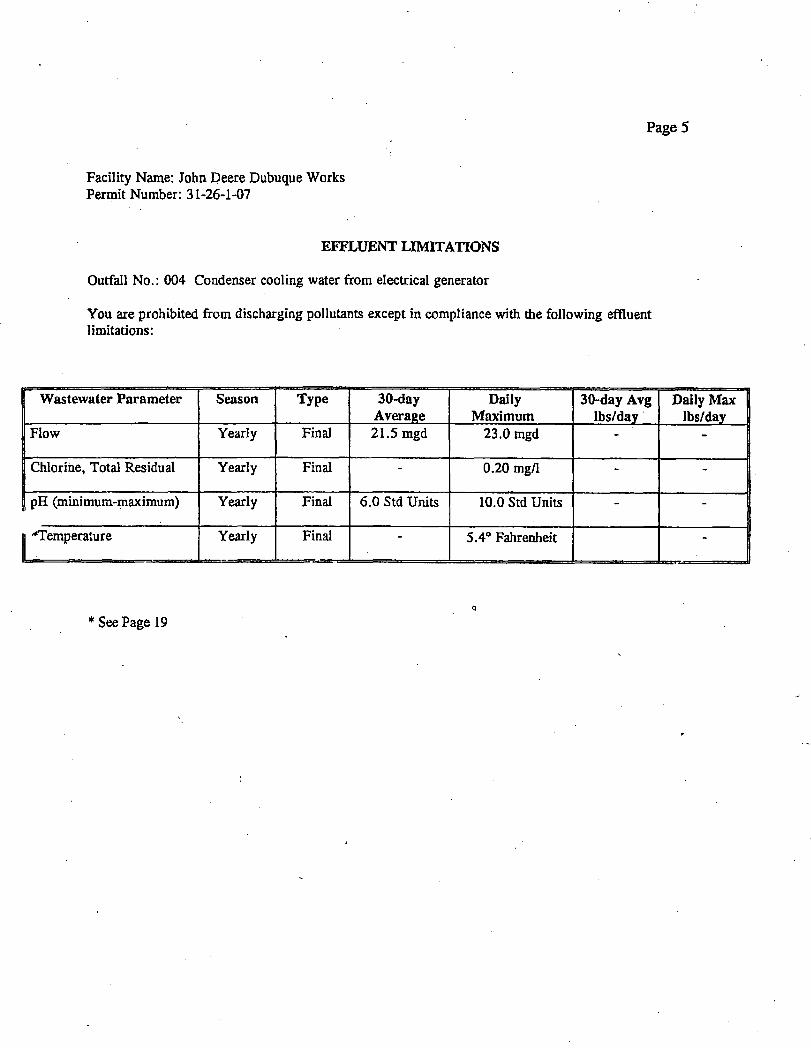
Page 5
Facility Name: John Deere Dubuque Works Permit Number: 31-26-1-07
EFFLUENT LIMITATIONS
Outfall No.: 004 Condenser cooling water from electrical generator
You are prohibited from discharging pollutants except in compliance with the following effluent limitations:
Wastewater Parameter Season Type 30-day Average
Daily Maximum
30-day Avg lbs/day
Daily Max 1 lbs/day 1
Flow Yearly Final 21.5 mgd 23.0 mgd -
Chlorine, Total Residual Yearly Final - 0.20 mg/l - -
( pH (minimum-maximum) Yearly Final 6.0 Std Units 10.0 Std Units -
"Temperature Yearly Final - 5.4° Fahrenheit
* See Page 19
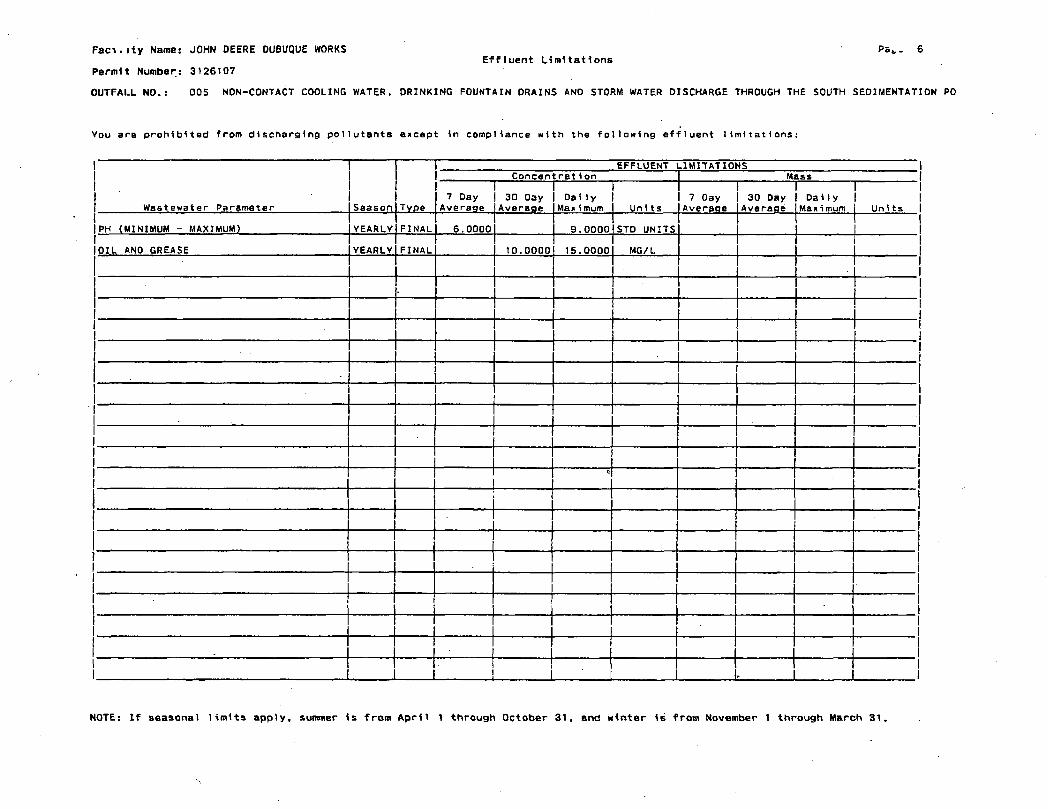
F a c i . i t y Name: JOHN DEERE DUBUQUE WORKS Pa... 6 Effluent Limitations
Permit Number: 3126107 OUTFALL NO.: 005 NON-CONTACT COOLING WATER. DRINKING FOUNTAIN DRAINS AND STORM WATER DISCHARGE THROUGH THE SOUTH SEDIMENTATION
Vou are prohibited from discharging pollutants except in compliance with the following effluent limitations:
Wastewater Parameter Season
1 EFFLUENT LIMITATIONS 1 Co n c e n t r a t i o n I Mass
Wastewater Parameter Season Type
1 7 Day
Ave rage
30 Oay Average
Dai l y Max i mum Uni ts
7 Oay Average
1 30 Day
Average
1 D a l l y
Max 1 mum Uni ts
PH (MINIMUM - MAXIMUM) YEARLY FINAL 6.0000 9.0000 STD UNITS
OIL ANO GREASE YEARLY FINAL 10.0000 15.0000 MG/L
C
j
• !
| 1
1 1 1'
1 1
NOTE: If seasonal l i m i t s apply, summer i s from A p r i l 1 through October 31, and winter i s from November 1 through March 31.
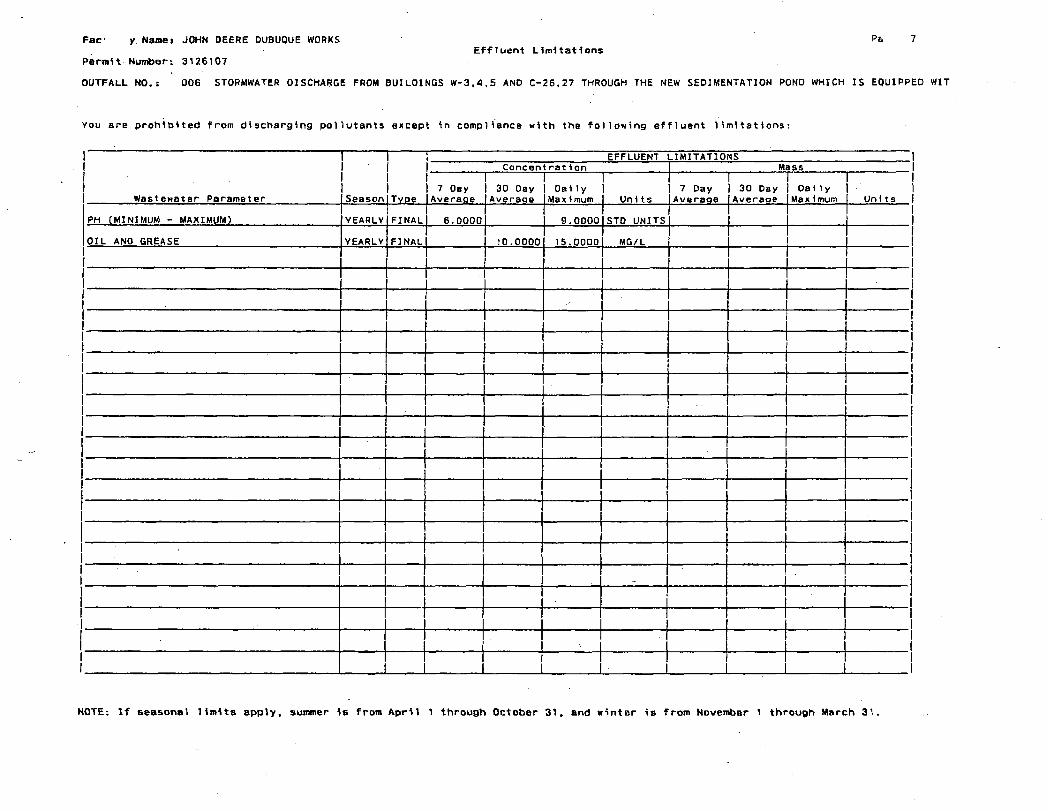
Fac- y Namei JOHN DEERE DUBUQUE WORKS P& 7 Effluent Limitations
Permit Number: 3126107
OUTFALL NO.: 006 STORMWATER DISCHARGE FROM BUILOINGS W-3.4,5 AND C-26.27 THROUGH THE NEW SEDIMENTATION POND WHICH IS EQUIPPED WIT
You are prohibited from discharging pollutants except in compliance with the following effluent l i m i t a t i o n s :
I I | 1 EFFLUENT LIMITATIONS I I I j Concentration I Mass
i Wastewater Parameter
1 ! Season
1 1 Tvoe
1 1 7 Oay I 30 Oay
Averaqe lAveraqe
1 1 Oa11y | I 7 Day 1 30 Day
Average 1 1 Daily Max 1 mum
I Uni ts
PH (MINIMUM - MAXIMUM) YEARLY FINAL 1 Maximum j Units |Ave rage
9.00001STD UNITSl OIL ANO GREASE YEARLY FINAL
6.0000J 1 10.0000 15.00OOI MG/L 1 1
1 1 1
-
• NOTE: If seasonal l i m i t s apply, summer i s from A p r i l 1 through October 31. and winter i s from November 1 through March 31.
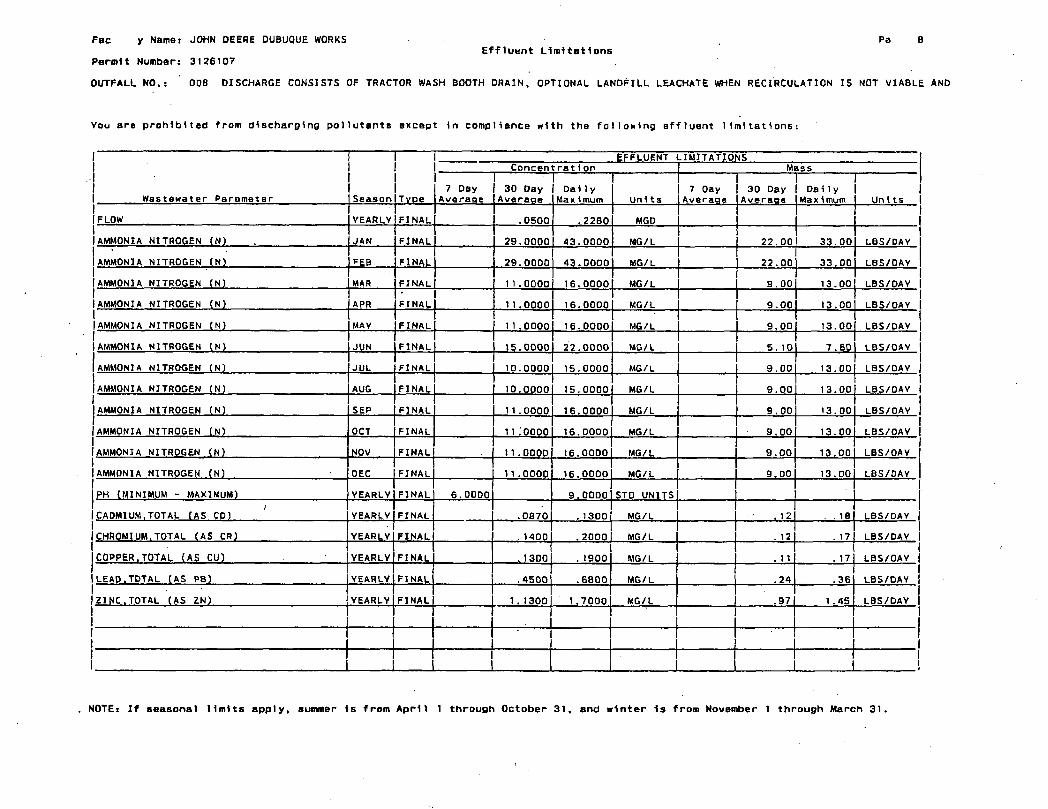
Fac y Name: JOHN DEERE DUBUQUE WORKS Pa 8 Effluent Limitations
Permit Number: 3126107
OUTFALL NO.: 008 DISCHARGE CONSISTS OF TRACTOR WASH BOOTH DRAIN, OPTIONAL LANDFILL LEACHATE WHEN RECIRCULATION IS NOT VIABLE AND
You are prohibited from discharging pollutants except in compliance with the following Bffluent l i m i t a t i o n s :
I I I I EFFLUENT LIMITATIONS I I Concentration I Mass
Wastewater Parameter
1 Season
1 Type
1 7 Day
Average
• 30 Day
Averaac
1 D a l l y
Ma x1 mum Uni t s 7 Oay
Average 30 Day
Average Da i 1 y
Ma x 1 mum Unit s
FLOW YEARLY FINAL .0500 .2280 MGD
AMMONIA NITROGEN (N) JAN FINAL 29.0000 43.0000 MG/L 22. 00 33. 00 LBS/DAY
AMMONIA NITROGEN (N) FEB FINAL 29.0000 43.0000 MG/L 22.00 33.00 LBS/DAY
AMMONIA NITROGEN (N) MAR FINAL 11.0000 16.0000 MG/L 9.00 13.00 LBS/DAY
AMMONIA NITROGEN (N) APR FINAL 11.0000 16.0000 MG/L 9.00 13.00 LBS/OAY
AMMONIA NITROGEN (N) MAY FINAL 11.0000 16.0000 MG/L 9.00 13.00 LBS/DAY
AMMONIA NITROGEN (N) JUN FINAL 15.0000 22.0000 MG/L 5. 10 7.60 LBS/OAY
AMMONIA NITROGEN (N) JUL FINAL 10.0000 15.0000 MG/L 9.00 13.00 LBS/DAY
AMMONIA NITROGEN ( N) AUG FINAL 10.0000 15.0000 MG/L 9.00 13.00 LBS/OAY
AMMONIA NITROGEN (N) SEP FINAL 1 1.0000 16.0000 MG/L 9.00 13.00 LBS/OAY
AMMONIA NITROGEN (N) OCT FINAL 11.0000 16.0000 MG/L 9.00 13.00 LBS/OAY
AMMONIA NITROGEN (N) NOV FINAL 11.OOOD 16.00D0 MG/L 9.00 13.00 LBS/OAY
AMMONIA NITROGEN (N) OEC FINAL 11.0000 16.0000 MG/L 9.00 13 .00 LBS/DAY
PH {MINIMUM - MAXIMUM) YEARLY FINAL 6.0000 9.0000 STD UNITS
CADMIUM.TOTAL (AS CD) YEARLY FINAL .0870 . 1300 MG/L .12 . 18 L8S/DAY
CHROMIUM.TOTAL (AS CR) YEARLY FINAL . 1400 . 2000 MG/L . 12 . 17 LBS/DAY
COPPER.TOTAL (AS CU) YEARLY FINAL . 1300 . 1900 MG/L . 1 1 . 17 LBS/OAY
LEAD.TOTAL (AS PB) YEARLY FINAL .4500 .6800 MG/L .24 .36 LBS/DAY
ZINC.TOTAL (AS ZN) YEARLY FINAL 1.1300 1.7000 MG/L .97 1.45 LBS/DAY
I
1 I i
NOTE: If seasonal limits apply, summer 1s from April 1 through October 31, and winter 1s from November 1 through March 31.
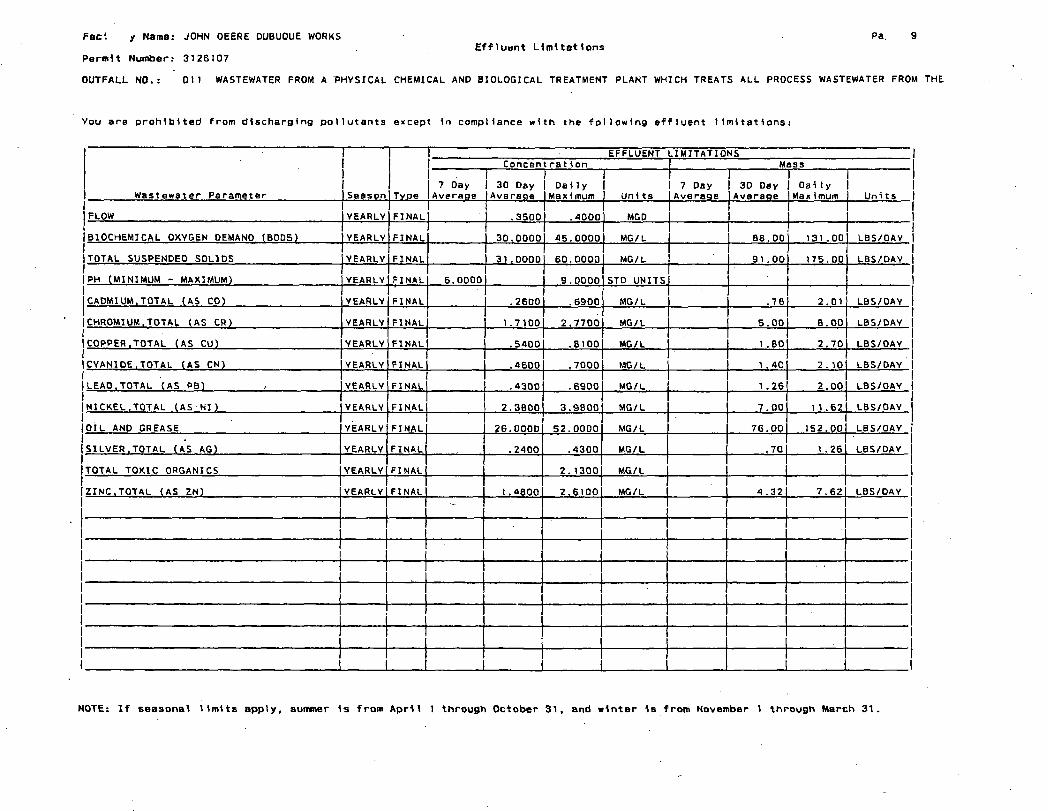
Fee'. y Name: JOHN OEERE DUBUQUE WORKS Pa. 9 Effluant Limitations
Permit Number: 3126107
OUTFALL NO.: Oil WASTEWATER FROM A PHYSICAL CHEMICAL AND BIOLOGICAL TREATMENT PLANT WHICH TREATS ALL PROCESS WASTEWATER FROM THE
You are prohibited from discharging pollutants except 1n compliance with the following effluent l i m i t a t i o n s :
1 1 1 1
Wastewater Parameter I Season Type
EFFLUENT LIMITATIONS 1 1 1 1
Wastewater Parameter I Season Type
Concentration ! Mass 1 1 1 1
Wastewater Parameter I Season Type
1 7 Oay 1 30 Day
1 D a l l y I
Maximum t U n i t s
1 1 1 1 1 7 Day | 30 Day | O a i l y I Average (Average I Maximum j Un i t s
1 FLOW 1 YEARLY
FINAL Average |Averaqe
.4000 MGD 1 1 I I
1 BIOCHEMICAL OXYGEN DEMANO (B0D5) I YEARLY
FINAL J .3500
1 30.0000 1 45.0000 MG/L 1 1
1 88.001 131.00 LBS/OAY
1 TOTAL SUSPENDEO SOLIDS i YEARLY
FINAL 1 31.0000! 60.0000 MG/L 91 .00 175.DO LBS/DAY
PH (MINIMUM - MAXIMUM) 1 YEARLY
FINAL 6.0000 9.0000 STD UNITS
CADMIUM.TOTAL (AS CO) YEARLY FINAL .2600 .6900 MG/L .76 2.01 LBS/OAY
CHROMIUM.TOTAL (AS CR) YEARLY FINAL 1.7100 2.7700 MG/L 5.00 8.00 LBS/DAY
COPPER.TOTAL (AS CU) YEARLY FINAL .5400 .8100 MG/L 1 .80 2.70 LBS/OAY
CYANIDE.TOTAL (AS CN) YEARLY FINAL .4600 .7000 MG/L 1 . 40 2 . 10 LBS/DAY
LEAD.TOTAL (AS PB) YEARLY FINAL .4300 .6900 MG/L 1 .26 2.00 LBS/OAY
NICKEL.TOTAL (AS NI ) YEARLY FINAL 2.3B00 3.9B00 MG/L 7.00 1 1 .62 LBS/DAY
OIL AND GREASE YEARLY FINAL 26.OOOD 52.0000 MG/L 76.00 152.00 LBS/OAY
SILVER.TOTAL (AS AG) YEARLY FINAL .2400 .4300 MG/L .70 1 .26 LBS/DAY
TOTAL TOXIC ORGANICS YEARLY FINAL 2. 1300 MG/L
ZINC,TOTAL (AS ZN) YEARLY FINAL I.4800 2.6100 MG/L 4 . 32 7 .62 LBS/DAY -
1
1
NOTE: If seasonal l i m i t s apply, summer 1s from A p r i l 1 through October 31, and winter 1s from November 1 through March 31.
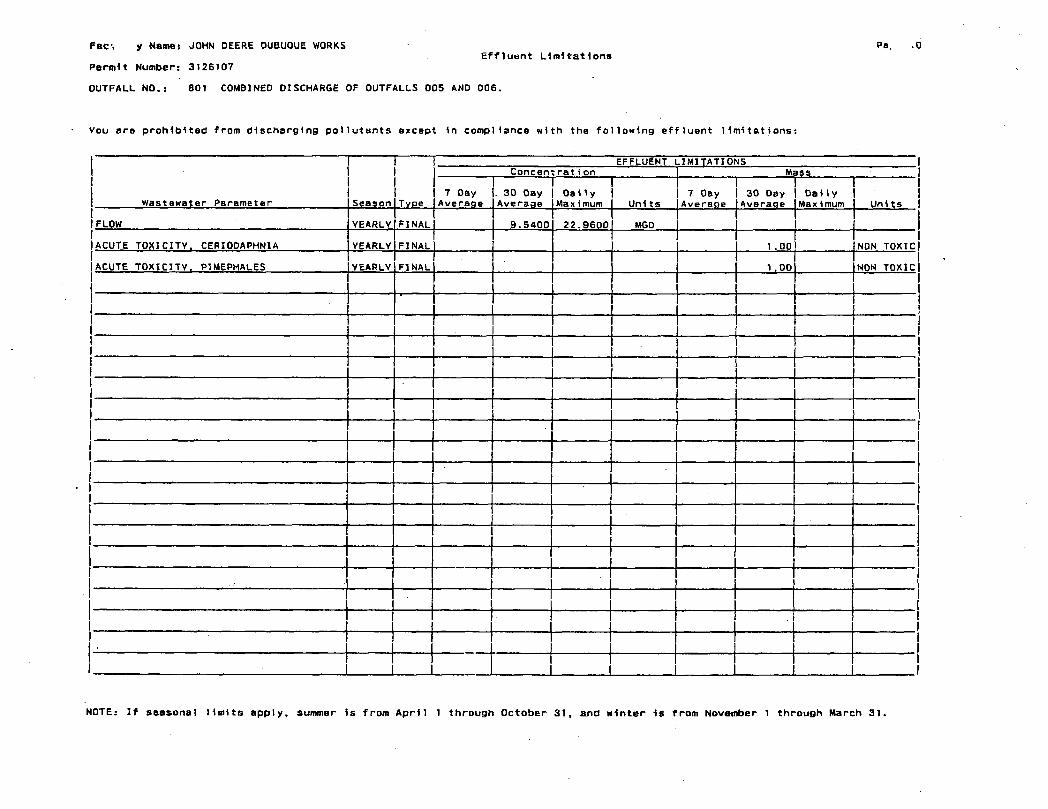
Fac. y Name: JOHN DEERE DUBUQUE WORKS Pa. .0 Effluent Limitations
Permit Number: 3126107
OUTFALL NO.: 801 COMBINED DISCHARGE OF OUTFALLS 005 AND 006.
Vou are prohibited from discharging pollutants except 1n compliance with the following effluent l i m i t a t i o n s :
1 1 1 1
EFFLUENT LIMITATIONS 1 1 1 1 C o n c e n t r a t i o n 1 M ass
Wastewater Parameter Season Type 7 Oay
Average . 30 Oay Average
O a l l y Max i mum Uni ts
7 Oay Average
30 Day Average
Da11y Max imum Uni t s
FLOW YEARLY FINAL 9.5400 22.9600 MGD
lACUTE TOXICITY. CERI0DAPHN1A YEARLY FINAL 1 .00 NON TOXICl
IACUTE TOXICITY. PIMEPHALES YEARLY FINAL 1 .00 1
NON TOXIC 1
!
1
1 1 1
1 !
• •
1
NOTE: If seasonal l i m i t s apply, summer Is from Ap r i l 1 through October 31, and winter 1s from November 1 through March 31.
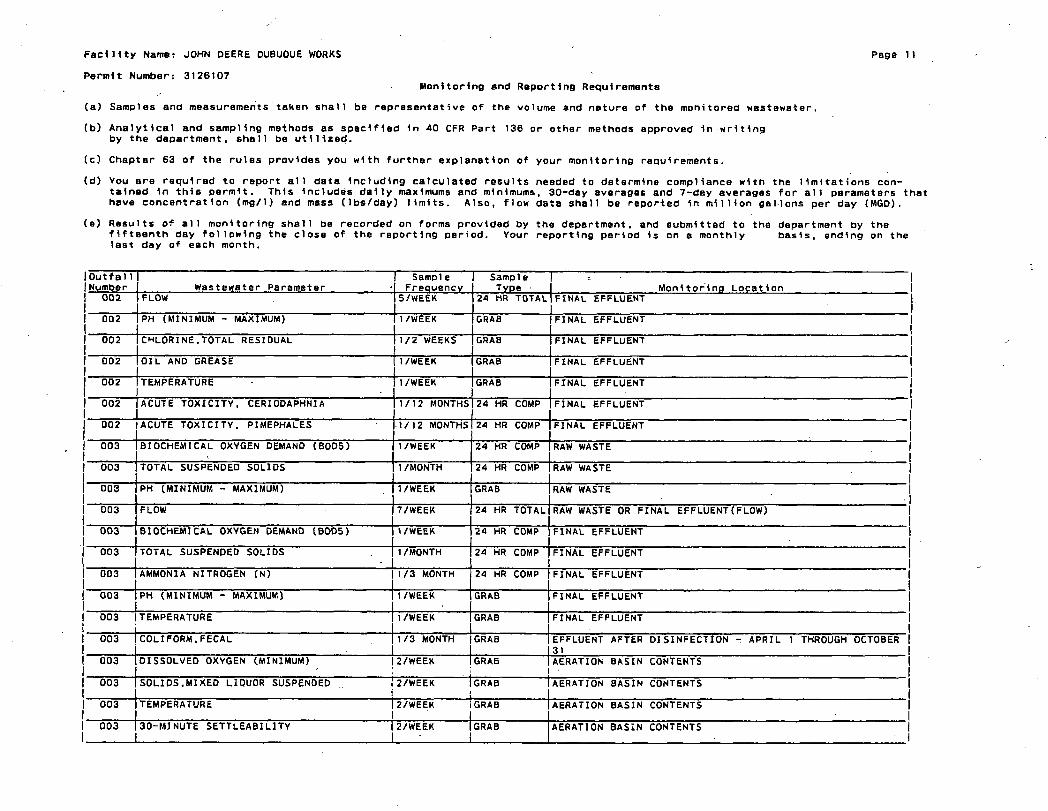
F a c i l i t y Name: JOHN DEERE DUBUQUE WORKS Page 11
Permit Number: 3126107 Monitoring and Reporting Requirements
(a) Samples and measurements taken shall be representative of the volume and nature of the monitored wastewater,
(b) Analytical and sampling methods as specified in 40 CFR Part 136 or other methods approved 1n writing by the department, shall be u t i l i z e d .
(c) Chapter 63 of the rules provides you with further explanation of your monitoring requirements.
(d) Vou are required to report a l l data Including calculated results needed to determine compliance with the limitations contained in t h i s permit. This includes daily maximums and mini mums, 30-day averages and 7-day averages for a l l parameters that have concentration (mg/1) and mass (lbs/day) l i m i t s . Also, flow data shall be reported 1n m i l l i o n gallons per day (MGD).
(e) Results of a l l monitoring shall be recorded on forms provided by the department, and submitted to the department by the f i f t e e n t h day following the close of the reporting period. Your reporting period is on a monthly basis, ending on the last day of each month.
l O u t f a l 1 Number
1 1 Wastewater Parameter
I Sample • Freouencv
1 Samp 1e I Type
C
M o n i t o r i n g L o c a t i o n 002 IFLOW
|PH (MINIMUM - MAXIMUM)
15/WEEK
1 I 24 HR TOTAL FINAL EFFLUENT
002 I
11/WEEK ! GRAB FINAL EFFLUENT
002 ICHLORINE,TOTAL RESIDUAL I 1/2 WEEKS
f GRAB FINAL EFFLUENT
002 OIL AND GREASE I 1/WEEK GRAB FINAL EFFLUENT
002 TEMPERATURE
1 ACUTE TOXICITY. CERIODAPHNIA
11/WEEK GRAB FINAL EFFLUENT
002 1
|1/12 MONTHS I
24 HR COMP FINAL EFFLUENT
002 ACUTE TOXICITV, PIMEPHALES I 1/12 MONTHS 1
24 HR COMP FINAL EFFLUENT
003 BIOCHEMICAL OXYGEN DEMAND (B0D5) 11/WEEK 1
24 HR COMP RAW WASTE
003 TOTAL SUSPENDED SOLIDS |1/MONTH 24 HR COMP RAW WASTE
003 PH (MINIMUM - MAXIMUM) I1/WEEK I
GRAB RAW WASTE
003 FLOW I7/WEEK 24 HR TOTAL RAW WASTE OR FINAL EFFLUENT(FLOW)
003 BIOCHEMICAL OXYGEN DEMAND (B0D5) I1/WEEK 24 HR COMP FINAL EFFLUENT
003 TOTAL SUSPENDED SOLIDS |1/MONTH • I
24 HR COMP FINAL EFFLUENT
003 AMMONIA NITROGEN (N) I 1/3 MONTH
I1/WEEK
24 HR COMP FINAL EFFLUENT
003 PH (MINIMUM - MAXIMUM) GRAB FINAL EFFLUENT
003 1 TEMPERATURE I1/WEEK j
GRAB FINAL EFFLUENT
003 COLIFORM.FECAL
• I 1/3 MONTH 1
GRAB EFFLUENT AFTER 31
DISINFECTION - APRIL 1 THROUGH OCTOBER
003 DISSOLVED OXYGEN (MINIMUM) 12/WEEK GRAB AERATION BASIN CONTENTS
003 SOLIDS.MIXED LIQUOR SUSPENDED 12/WEEK 1 GRAB AERATION BASIN CONTENTS
003 TEMPERATURE I2/WEEK i GRAB 1 1
AERATION BASIN CONTENTS
003 30-MINUTE SETTLEABILlTY 12/WEEK 1
1 1 GRAB AERATION BASIN CONTENTS 1
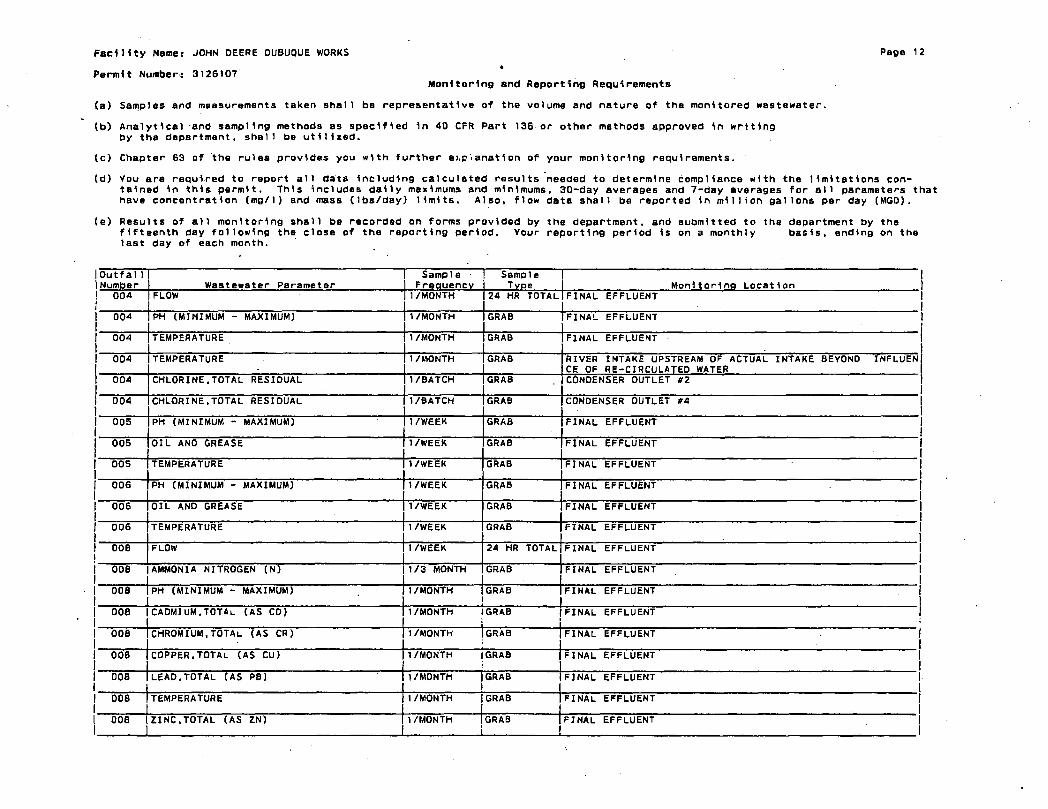
F a c i l i t y Name: JOHN DEERE DUBUQUE WORKS Page 12
Permit Number: 3126107 Monitoring and Reporting Requirements
(a) Samples and measurements taken shall be representative of the volume and nature of the monitored wastewater.
(b) Analytical and sampling methods as specified 1n 40 CFR Part 136 or other methods approved in writing by the department, shall be u t i l i z e d .
(c) Chapter 63 of the rules provides you with further ei.p'i anat 1 on of your monitoring requirements.
(d) Vou are required to report a l l data including calculated results needed to determine compliance with the limitations contained 1n this permit. This includes daily maximums and mini mums, 30-day averages and 7-day averages for a l l parameters that have concentration (mg/1) and mass (lbs/day) l i m i t s . Also, flow data shall be reported 1n m i l l i o n gallons per day (MGD).
(e) Results of a l l monitoring shall be recorded on forms provided by the department, and submitted to the department by the f i f t e e n t h day following the close of the reporting period. Vour reporting period 1s on a monthly basis, ending on the last day of each month.
Outfal1 Number Wastewater Parameter
Sample Frequency
Samole Type Mon i t o r i n g L o c a t i o n
004 FLOW 1/MONTH 24 HR TOTAL FINAL EFFLUENT
004 PH (MINIMUM - MAXIMUM) 1/MONTH GRAB FINAL EFFLUENT
004 TEMPERATURE 1/MONTH GRAB FINAL EFFLUENT
004 TEMPERATURE 1/MONTH GRAB RIVER INTAKE UPSTREAM OF ACTUAL INTAKE BEYOND INFLUEN CE OF RE-CIRCULATED WATER
004 CHLORINE.TOTAL RESIDUAL 1/BATCH GRAB CONDENSER OUTLET *2
004 CHLORINE.TOTAL RESIDUAL 1/BATCH GRAB CONDENSER OUTLET »4
005 PH (MINIMUM - MAXIMUM) 1/WEEK GRAB FINAL EFFLUENT
005 OIL ANO GREASE 1/WEEK GRAB FINAL EFFLUENT
005 TEMPERATURE 1/WEEK GRAB FINAL EFFLUENT
006 PH (MINIMUM - MAXIMUM) 1/WEEK GRAB FINAL EFFLUENT
006 OIL AND GREASE 1/WEEK GRAB FINAL EFFLUENT
006 TEMPERATURE 1/WEEK GRAB FINAL EFFLUENT
OOB FLOW 1/WEEK 24 HR TOTAL FINAL EFFLUENT
008 |AMMONIA NITROGEN (N) 1/3 MONTH GRAB FINAL EFFLUENT
008 IPH (MINIMUM - MAXIMUM) 1
1/MONTH GRAB FINAL EFFLUENT
006 |CADMIUM,TOTAL (AS CD) 1/MONTH 1 GRAB FINAL EFFLUENT
008 |CHROMIUM,TOTAL (AS CR)
1 1/MONTH |GRAB FINAL EFFLUENT
OOB |COPPER.TOTAL (AS Cu) 1/MONTH |GRAB |FINAL EFFLUENT
008 LEAD,TOTAL (AS PB)
i
1/MONTH |GRAB I F I N A L EFFLUENT 1
008 |TEMPERATURE 1/MONTH |GRAB 1 FINAL EFFLUENT
008 I ZINC,TOTAL (AS ZN) 1
1/MONTH IGRAB IFINAL EFFLUENT i !
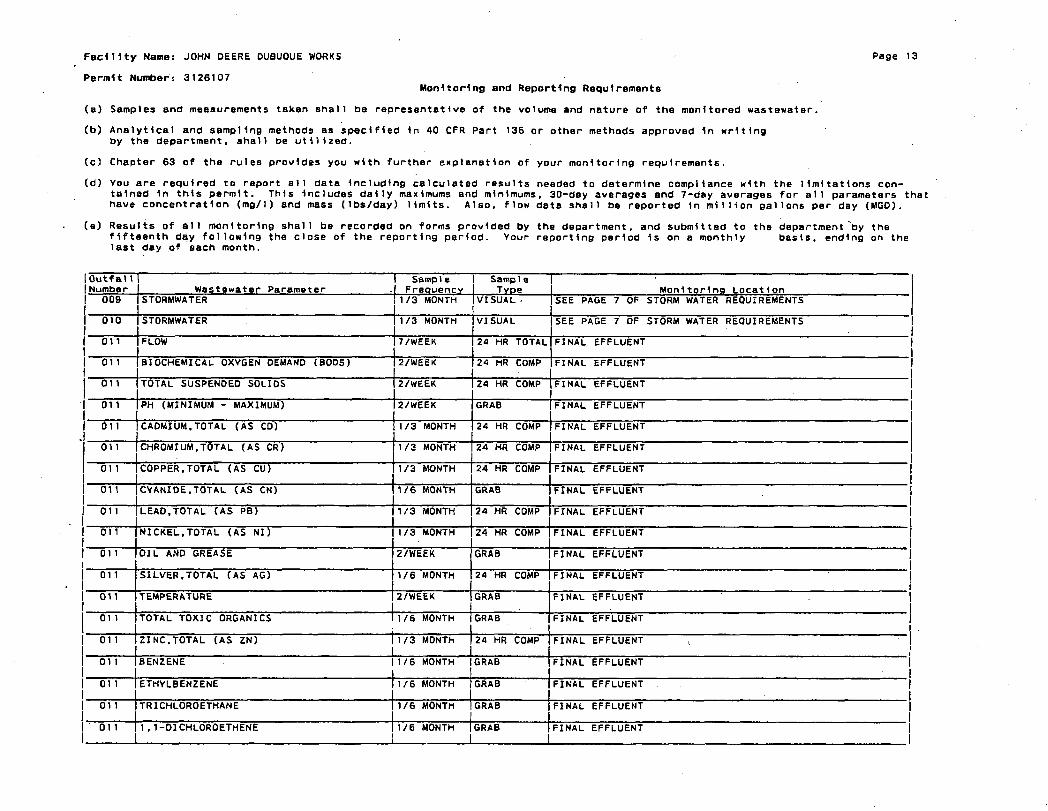
F a c i l i t y Name: JOHN DEERE DUBUQUE WORKS Page 13
Permit Number: 3126107 Monitoring and Reporting Requirements
(a) Samples and measurements taken shall be representative of the volume and nature of the monitored wastewater.
(b) Analytical and sampling methods as specified In 40 CFR Part 136 or other methods approved 1n writing by the department, shall be u t i l i z e d .
Cc) Chapter 63 of the rules provides you with further explanation of your monitoring requirements.
(d) You are required tD report a l l data Including calculated results needed to determine compliance with the limitations contained 1n th i s permit. This Includes dally maximums and mlnimums, 30-day averages and 7-day averages for a 11 parameters that have concentration (mg/1) and mass (lbs/day) l i m i t s . Also, flow date shall be reported In m i l l i o n gallons per day (MGD).
(e) Results of a l l monitoring shall be recorded on forms provided by the department, and submitted to the department~by the fi f t e e n t h day following the close of the reporting period. Your reporting period 1s on a monthly basis, ending on the last day of each month.
Outfal1 Number Wastewater Parameter
! Samp 1e ! Frequency
Samp 1e Type M o n i t o r i n g L o c a t i o n
009 STORMWATER 1/3 MONTH VISUAL - SEE PAGE 7 OF STORM WATER REQUIREMENTS
010 ST0RMWATER 1/3 MONTH VISUAL SEE PAGE 7 OF STORM WATER REQUIREMENTS
on FLOW 7/WEEK 24 HR TOTAL FINAL EFFLUENT
01 1 BIOCHEMICAL OXYGEN DEMAND (BOD5) 2/WEEK 24 HR COMP FINAL EFFLUENT
01 1 TOTAL SUSPENDED S0LI0S 2/WEEK 24 HR COMP FINAL EFFLUENT
01 1 PH (MINIMUM - MAXIMUM) 2/WEEK GRAB FINAL EFFLUENT
01 1 CADMIUM.TOTAL (AS CD) 1/3 MONTH 24 HR COMP FINAL EFFLUENT
01 1 CHROMIUM,TOTAL (AS CR) 1/3 MONTH 24 HR COMP FINAL EFFLUENT
01 1 COPPER,TOTAL (AS CU) 1/3 MONTH 24 HR COMP FINAL EFFLUENT
01 1 CYANIDE.TOTAL (AS CN) 1/6 MONTH GRAB FINAL EFFLUENT
01 1 LEAD,TOTAL (AS PB) 1/3 MONTH 24 HR COMP FINAL EFFLUENT
01 1 NICKEL,TOTAL (AS NI) 1/3 MONTH 24 HR COMP FINAL EFFLUENT
01 1 OIL AND GREASE 2/WEEK GRAB FINAL EFFLUENT
011 SILVER.TOTAL (AS AG) 1/6 MONTH 24 HR COMP FINAL EFFLUENT
O i l TEMPERATURE 2/WEEK GRAB FINAL EFFLUENT
01 1 TOTAL TOXIC ORGANICS 1/6 MONTH GRAB FINAL EFFLUENT
01 1 ZINC.TOTAL (AS ZN) 1/3 MONTH 24 HR COMP FINAL EFFLUENT
01 1 BENZENE 11/6 MONTH GRAB FINAL EFFLUENT
01 1. ETHYLBENZENE 1/6 MONTH GRAB
1 FINAL EFFLUENT . |
01 1 TRICHLOROETHANE 1/6 MONTH GRAB | 1 FINAL EFFLUENT
011 1,1-DlCHLOROETHENE I i
• 1/6 MONTH |
1 GRAB |
1 FINAL EFFLUENT |
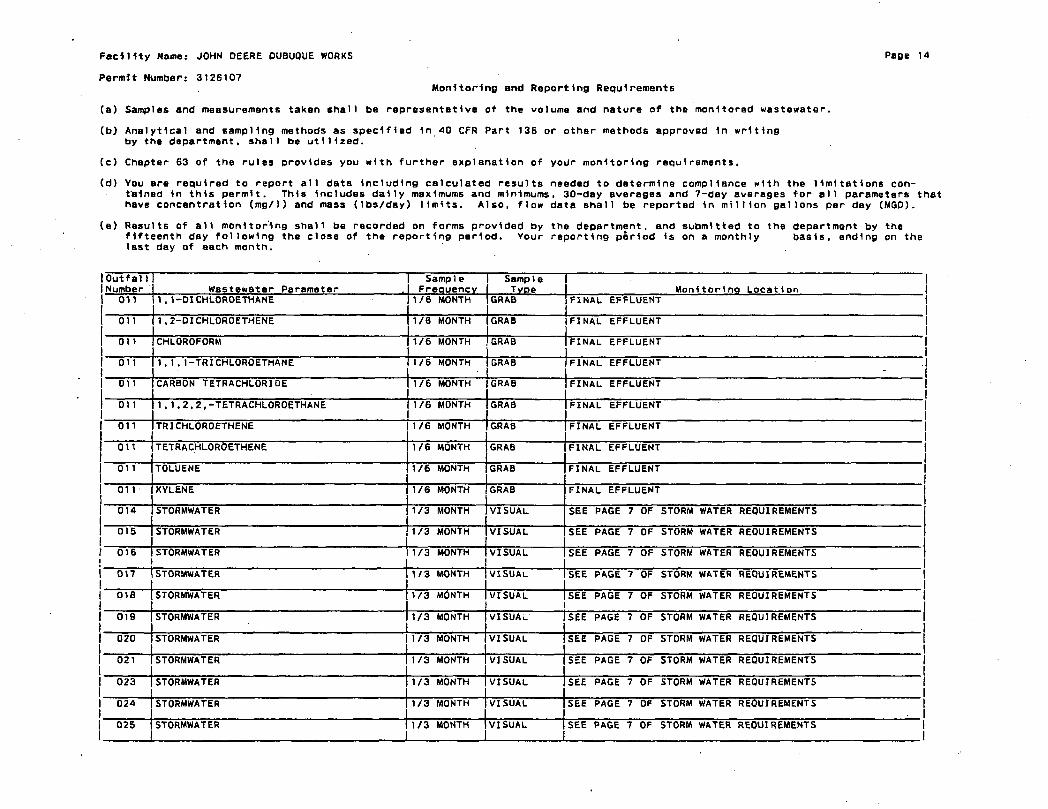
F a c i l i t y Name: JOHN DEERE DUBUQUE WORKS Page 14
Permit Number: 3126107 Monitoring and Reporting Requirements
(a) Samples and measurements taken shall be representative of the volume and nature of the monitored wastewater.
(b) Analytical and sampling methods as specified in 40 CFR Part 136 or other methods approved 1n writing by the department, shall be u t i l i z e d .
(c) Chapter 63 of the rules provides you with further explanation of your monitoring requirements.
(d) Vou are required to report a l l data Including calculated results needed to determine compliance with the limitations contained 1n this permit. This Includes daily maximums and minimums, 30-day averages and 7-day averages for a l l parameters that have concentration (mg/1) and mass (lbs/day) l i m i t s . Also, flow data shall be reported in mi l l i o n gallons par day (MGD).
(e) Results of a l l monitoring shall be recorded on forms provided by the department, and submitted to the department by the fifteenth day following the dose of the reporting period. Your reporting period is on a monthly basis, ending on the last day of each month,
Outfal1 Number Wastewater Parameter
Samp 1e Frequency
Samp 1e Type Monitoring L o c a t i o n
011 I,1-DICHL0R0ETHANE 1/6 MONTH GRAB FINAL EFFLUENT
011 1,2-DICHLOROETHENE 1/6 MONTH GRAB FINAL EFFLUENT
OH CHLOROFORM 1/6 MONTH GRAB FINAL EFFLUENT
O i l 1,1.1-TRICHLOROETHANE 1/6 MONTH GRAB FINAL EFFLUENT
O i l CARBON TETRACHLORIDE 1/6 MONTH GRAB FINAL EFFLUENT
01 1 1.1.2,2,-TETRACHLOROETHANE 1/6 MONTH GRAB FINAL EFFLUENT
on TR1CHLOROETHENE 1/6 MONTH GRAB FINAL EFFLUENT
on TETRACHLOROETHENE 1/6 MONTH GRAB FINAL EFFLUENT
011 TOLUENE 1/6 MONTH GRAB FINAL EFFLUENT
01 1 XYLENE 1/6 MONTH GRAB FINAL EFFLUENT
014 STORMWATER 1/3 MONTH VISUAL SEE PAGE 7 OF STORM WATER REQUIREMENTS
015 STORMWATER 1/3 MONTH VISUAL SEE PAGE 7 OF STORM WATER REQUIREMENTS
016 STORMWATER 1/3 MONTH VISUAL SEE PAGE 7 OF STORM WATER REQUIREMENTS
017 1STORMWATER 1/3 MONTH VISUAL SEE PAGE 7 OF STORM WATER REQUIREMENTS
018 |STORMWATER 1/3 MONTH VISUAL SEE PAGE 7 OF STORM WATER REQUIREMENTS
019 | STORMWATER 1/3 MONTH V I S U A L |SEE PAGE 7 OF STORM WATER REQUIREMENTS
020 |STORMWATER 11/3 MONTH
| I VISUAL |SEE PAGE 7 OF STORM WATER REQUIREMENTS
021 ISTORMWATER 1 1/3 MONTH
I I VISUAL |SEE PAGE 7 OF STORM WATER REQUIREMENTS
1 1 023 |STORMWATER I 1/3 MONTH i
VISUAL ISEE PAGE 7 OF STORM WATER REQUIREMENTS 1
024 |STORMWATER 1 1/3 MONTH
I 1 VISUAL |SEE PAGE 7 OF STORM WATER REQUIREMENTS
J 025 |STORMWATER 11/3 MONTH VISUAL i SEE PAGE 7 OF STORM WATER REQUIREMENTS I
1
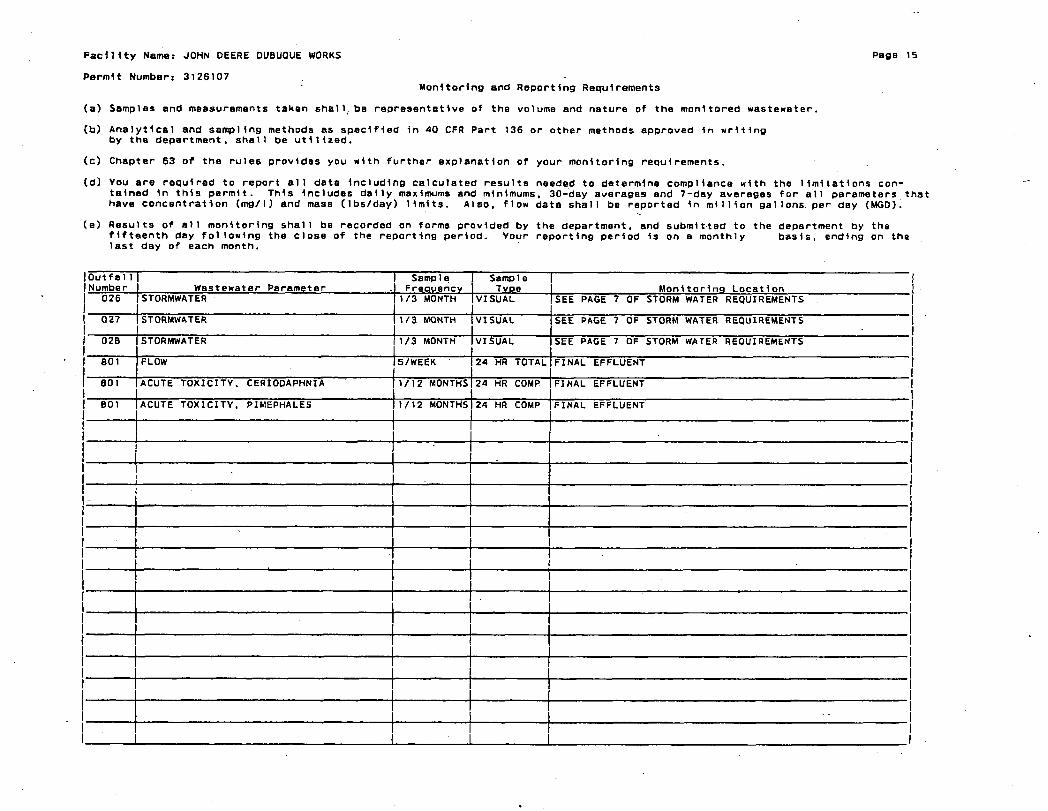
F a c i l i t y Name.- JOHN DEERE DUBUQUE WORKS Page 15
Permit Number: 3126107 Monitoring and Reporting Requirements
(a) Samples and measurements taken shall, be representative of the volume and nature of the monitored wastewater.
(b) Analytical and sampling methods as specified in 40 CFR Part 136 or other methods approved in writing by the department, shall be u t i l i z e d .
(c) Chapter 63 of the ru1e6 provides you with further explanation of your monitoring requirements.
(d) Vou are required to report a l l data Including calculated results needed to determine compliance with the limitations contained 1n this permit. This Includes daily maximums and minlmums, 30-day averages and 7-day averages for a l l parameters that have concentration (mg/1) and mass (lbs/day) l i m i t s . Also, flow data shall be reported 1n m i l l i o n gallons, per day (MGD).
(e) Results of a l l monitoring shall be recorded on forms provided by the department, and submitted to the department by the f i f t e e n t h day following the close of the reporting period. Vour reporting period is on a monthly basis, ending on the last day of each month.
O u t f a l l | | Sample Number j Wastewater Parameter .j Frequency
Sample | Type 1 M o n i t o r i n g L o c a t i o n
026 ISTORMWATER 11/3 MONTH VISUAL SEE PAGE 7 OF STORM WATER REQUIREMENTS
027 STORMWATER 1/3 MONTH VISUAL SEE PAGE 7 OF STORM WATER REQUIREMENTS
02B STORMWATER 1/3 MONTH VISUAL SEE PAGE 7 OF STORM WATER REQUIREMENTS
801 FLOW 5/WEEK 24 HR TOTAL FINAL EFFLUENT
801 ACUTE TOXICITV. CERIODAPHNIA 1/12 MONTHS 24 HR COMP FINAL EFFLUENT
B01 ACUTE TOXICITY. PIMEPHALES 1/12 MONTHS 24 HR COMP FINAL EFFLUENT
_
I I I I
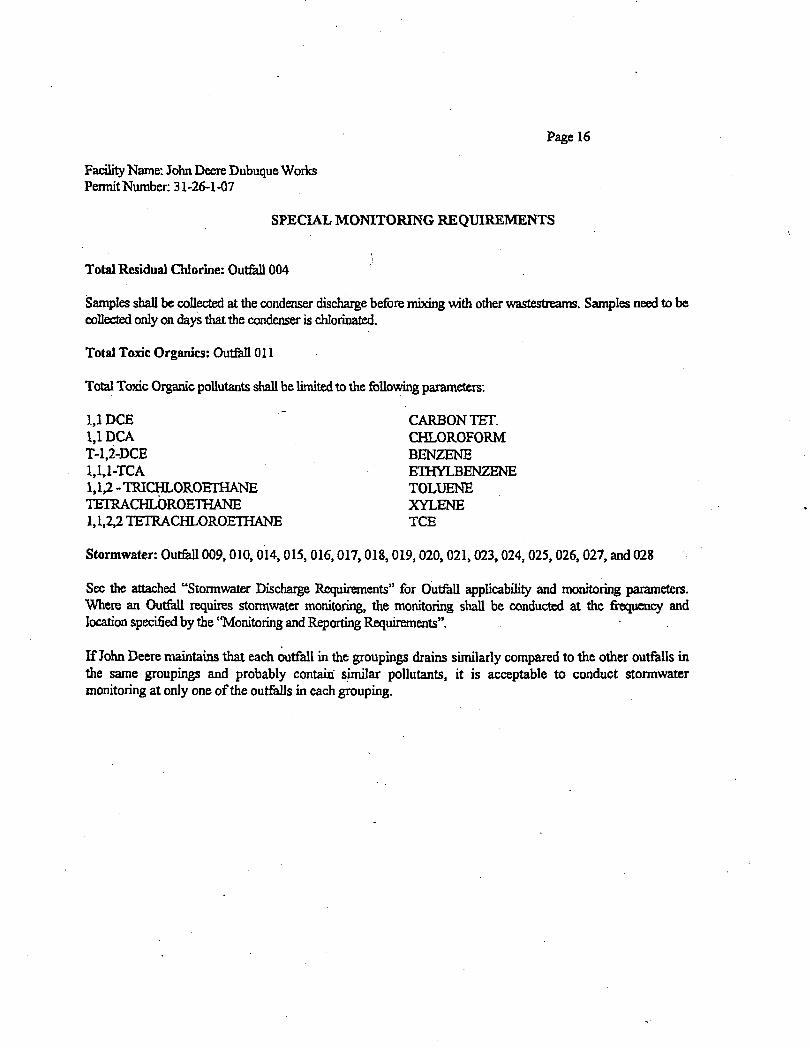
Page 16
Facility Name: John Deere Dubuque Works Permit Number: 31-26-1-07
SPECIAL MONITORING REQUIREMENTS
Total Residual Chlorine: Outfall 004
Samples shall be collected at the condenser discharge before mixing with other wastestreams. Samples need to be collected only on days that the condenser is chlorinated.
Total Toxic Organics: Outfall Oil
Total Toxic Organic pollutants shall be limited to the following parameters:
1,1 DCE " CARBON TET. 1,1 DCA CHLOROFORM T-1.2-DCE BENZENE 1,1,1-TCA ETHYLBENZENE 1,1,2 - TRICHLOROETHANE TOLUENE TETRACHLOROETHANE XYLENE 1,1,2,2 TETRACHLOROETHANE TCE
Stormwater: Outfall 009,010,014,015, 016,017,018,019,020,021,023,024,025,026,027, and 028
See the attached "Stormwater Discharge Requirements" for Outfall applicability and monitoring parameters. Where an Outfall requires stormwater monitoring, the monitoring shall be conducted at the frequency and location specified by the "Monitoring and Reporting Requirements".
If John Deere maintains that each outfall in the groupings drains similarly compared to the other outfalls in the same groupings and probably contain similar pollutants, it is acceptable to conduct stormwater monitoring at only one of the outfalls in each grouping.
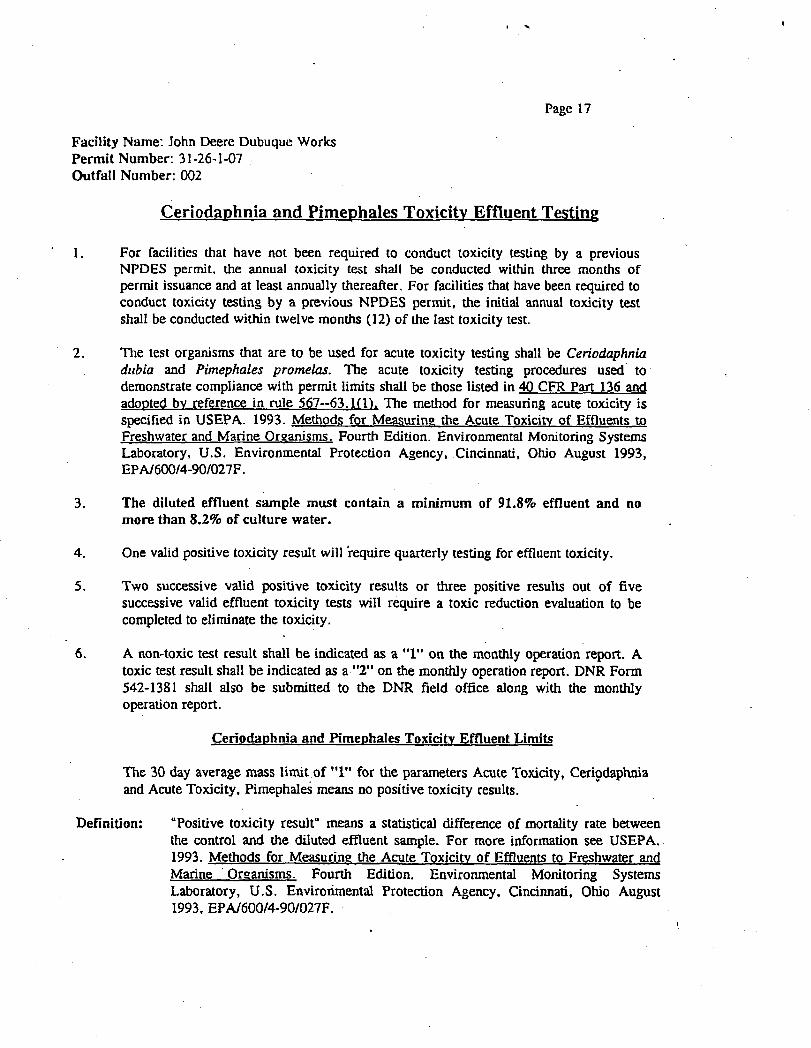
Page 17
Facility Name: John Deere Dubuque Works Permit Number: 31-26-1-07 Outfall Number: 002
Ceriodaphnia and Pimephales Toxicity Effluent Testing
1. For facilities that have not been required to conduct toxicity testing by a previous NPDES permit, the annual toxicity test shall be conducted within three months of permit issuance and at least annually thereafter. For facilities that have been required to conduct toxicity testing by a previous NPDES permit, the initial annual toxicity test shall be conducted within twelve months (12) of the last toxicity test.
2. The test organisms that are to be used for acute toxicity testing shall be Ceriodaphnia dubia and Pimephales promelas. The acute toxicity testing procedures used to demonstrate compliance with permit limits shall be those listed in 40 CFR Part 136 and adopted bv reference in rule 567—63.1(1). The method for measuring acute toxicity is specified in USEPA. 1993. Methods for Measuring the Acute Toxicity of Effluents to Freshwater and Marine Organisms. Fourth Edition. Environmental Monitoring Systems Laboratory, U.S. Environmental Protection Agency, Cincinnati, Ohio August 1993, EPA/600/4-90/027F.
3. The diluted effluent sample must contain a minimum of 91.8% effluent and no more than 8.2% of culture water.
4. One valid positive toxicity result will require quarterly testing for effluent toxicity.
5. Two successive valid positive toxicity results or three positive results out of five successive valid effluent toxicity tests will require a toxic reduction evaluation to be completed to eliminate the toxicity.
6. A non-toxic test result shall be indicated as a "1" on the monthly operation report. A toxic test result shall be indicated as a "2" on the monthly operation report. DNR Form 542-1381 shall also be submitted to the DNR field office along with the monthly operation report.
Ceriodaphnia and Pimephales Toxicity Effluent Limits
The 30 day average mass limit of "1" for the parameters Acute Toxicity, Ceriodaphnia and Acute Toxicity, Pimephales means no positive toxicity results.
Definition: "Positive toxicity result" means a statistical difference of mortality rate between the control and the diluted effluent sample. For more information see USEPA. 1993. Methods for Measuring the Acute Toxicity of Effluents to Freshwater and Marine Organisms. Fourth Edition. Environmental Monitoring Systems Laboratory, U.S. Environmental Protection Agency, Cincinnati, Ohio August 1993, EPA/600/4-90/027F.
'\
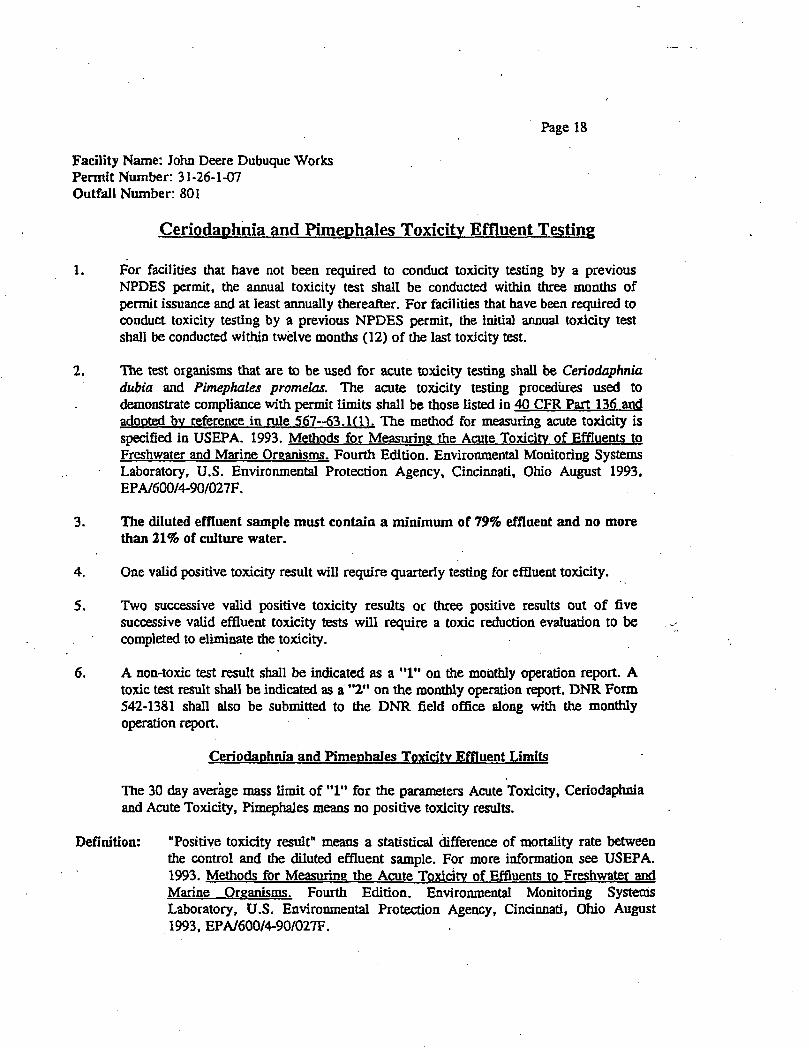
Page 18
Facility Name: John Deere Dubuque Works Permit Number: 31-26-1-07 Outfall Number: 801
Ceriodaphnia and Pimephales Toxicity Effluent Testing
1. For facilities that have not been required to conduct toxicity testing by a previous NPDES permit, the annual toxicity test shall be conducted within three months of permit issuance and at least annually thereafter. For facilities that have been required to conduct toxicity testing by a previous NPDES permit, the initial annual toxicity test shall be conducted within twelve months (12) of the last toxicity test.
2. The test organisms that are to be used for acute toxicity testing shall be Ceriodaphnia dubia and Pimephales promelas. The acute toxicity testing procedures used to demonstrate compliance with permit limits shall be those listed in 40 CFR Part 136 and adopted by reference in rule 567-63.1(11. The method for measuring acute toxicity is specified in USEPA. 1993. Methods for Measuring the Acute Toxicity of Effluents to Freshwater and Marine Organisms. Fourth Edition. Environmental Monitoring Systems Laboratory, U.S. Environmental Protection Agency, Cincinnati, Ohio August 1993, EPA/600/4-90/027F.
3. The diluted effluent sample must contain a minimum of 79% effluent and no more than 21% of culture water.
4. One valid positive toxicity result will require quarterly testing for effluent toxicity.
5. Two successive valid positive toxicity results or three positive results out of five successive valid effluent toxicity tests will require a toxic reduction evaluation to be completed to eliminate the toxicity.
6. A non-toxic test result shall be indicated as a " l " on the monthly operation report. A toxic test result shall be indicated as a "2" on the monthly operation report. DNR Form 542-1381 shall also be submitted to the DNR field office along with the monthly operation report.
Ceriodaphnia and Pimephales Toxicity Effluent Limits
The 30 day average mass limit of'T* for the parameters Acute Toxicity, Ceriodaphnia and Acute Toxicity, Pimephales means no positive toxicity results.
Definition: "Positive toxicity result" means a statistical difference of mortality rate between the control and the diluted effluent sample. For more information see USEPA. 1993. Methods for Measuring the Acute Toxicity of Effluents to Freshwater and Marine Organisms Fourth Edition. Environmental Monitoring Systems Laboratory, U.S. Environmental Protection Agency, Cincinnati, Ohio August 1993, EPA/600/4-90/027F.
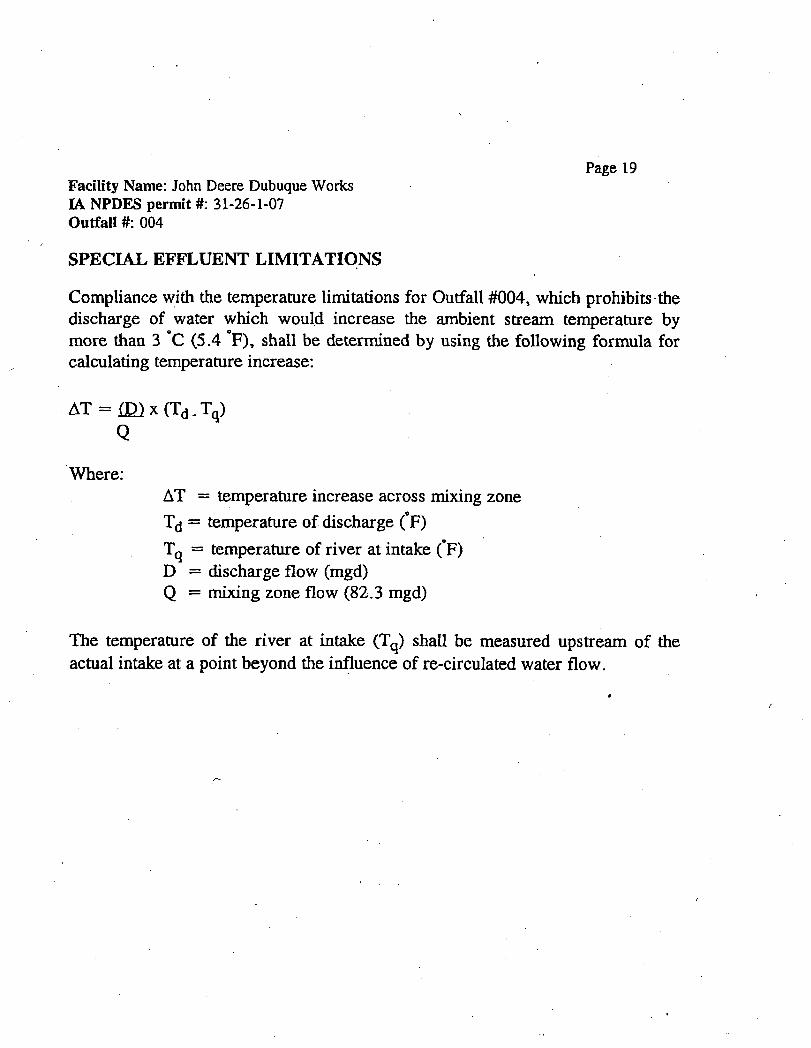
Page 19 Facility Name: John Deere Dubuque Works IA NPDES permit #: 31-26-1-07 Outfall #: 004
SPECIAL EFFLUENT LIMITATIONS
Compliance with the temperature Urnitations for Outfall #004, which prohibits the discharge of water which would increase the ambient stream temperature by more than 3 °C (5.4 °F), shall be determined by using the following formula for calculating temperature increase:
AT = (D) x (T(j. Tq) Q
Where: AT = temperature increase across mixing zone Td = temperature of discharge (°F)
Tq = temperature of river at intake (°F) D = discharge flow (mgd) Q = mixing zone flow (82.3 mgd)
The temperature of the river at intake (Tq) shall be measured upstream of the actual intake at a point beyond the influence of re-circulated water flow.
0
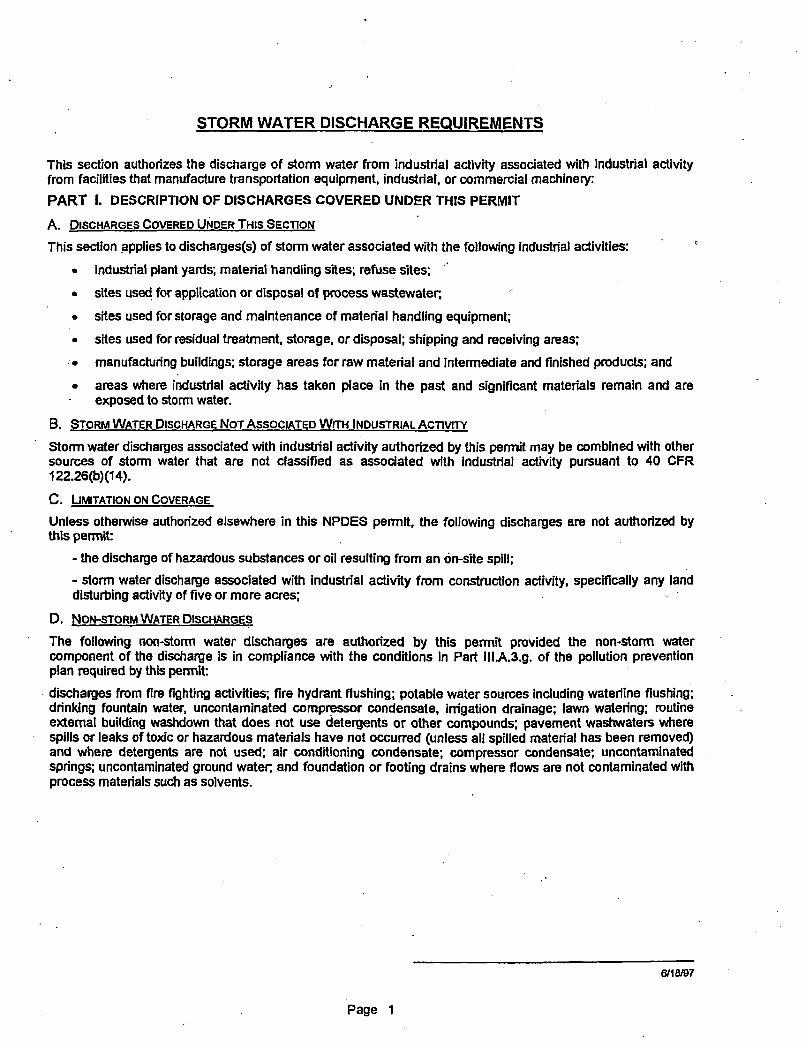
STORM WATER DISCHARGE REQUIREMENTS
This section authorizes the discharge of storm water from industrial activity associated with industrial activity from facilities that manufacture transportation equipment, industrial, or commercial machinery:
P A R T I. DESCRIPTION OF DISCHARGES COVERED UNDER THIS PERMIT
A. DISCHARGES COVERED UNDER THIS SECTION
This section applies to discharges(s) of storm water associated with the following industrial activities:
• industrial plant yards; material handling sites; refuse sites;
• sites used for application or disposal of process wastewater,
• sites used for storage and maintenance of material handling equipment;
• sites used for residual treatment, storage, or disposal; shipping and receiving areas;
• manufacturing buildings; storage areas for raw material and Intermediate and finished products; and
• areas where industrial activity has taken place in the past and significant materials remain and are exposed to storm water.
B. STORM WATER DISCHARGE NOT ASSOCIATED WITH INDUSTRIAL ACTIVITY
Storm water discharges associated with industrial activity authorized by this permit may be combined with other sources of storm water that are not classified as associated with industrial activity pursuant to 40 CFR 122.26(b)(14).
C. LIMITATION ON COVERAGE
Unless otherwise authorized elsewhere in this NPDES permit, the following discharges are not authorized by this permit:
- the discharge of hazardous substances or oil resulting from an on-site spill;
- storm water discharge associated with industrial activity from construction activity, specifically any land disturbing activity of five or more acres;
D. NON-STORM WATER DISCHARGES
The following non-storm water discharges are authorized by this permit provided the non-storm water component of the discharge is in compliance with the conditions in Part lll-A.3.g. of the pollution prevention plan required by this permit:
discharges from fire fighting activities; fire hydrant flushing; potable water sources including waterfine flushing; drinking fountain water, uncontaminated compressor condensate, irrigation drainage; lawn watering; routine external building washdown that does not use detergents or other compounds; pavement washwaters where spills or leaks of toxic or hazardous materials have not occurred (unless alt spilled material has been removed) and where detergents are not used; air conditioning condensate; compressor condensate; uncontaminated springs; uncontaminated ground water; and foundation or footing drains where flows are not contaminated with process materials such as solvents.
Page 1
6716797
APPENDIX D
OSWER No. 9355.7-03B-P
Five-Year Review Interviews
Information gathered from interviews during the site inspection may be key to understanding site status. Interviews should be conducted with various individuals or groups, including the operation and maintenance (O&M) site manager, O&M staff, local regulatory authorities and response agencies, community action groups or associations, site neighbors, and other stakeholders.
When conducting an interview, the interviewer should note the date of the interview, and the name, title, and affiliation of the person interviewed. The interviewer should also indicate whether the interview was conducted at the site, the office, or by phone. Written documentation of the interview should briefly summarize the discussion, address any problems or successes with the implementation of the remedy, and provide suggestions for future reference. Forms to use during interviews are provided at the end of this appendix.
The following tables provide lists of potential individuals to interview and the type of information which may be obtained during the interviews. The potential individuals to be interviewed are categorized by their ability to provide the following types of information:
Background information; • State and local considerations;
Construction considerations; and Performance, Operation and maintenance problems.
Al l of these individuals may be contacted during the five-year review. In most cases interviewing only a few key individuals will provide sufficient information for the review.
Background Information
The individuals listed below may provide information concerning previous and current concerns about the site, influences that affected the remedy decision, and further clarification on decisions made during remedy selection.
Interview Information Sought
Previous EPA Staff/Management - staff members may offer insight and clarification on decisions made during remedy selection and implementation
Nearest Neighbors - neighbors may provide insight into the enforcement of institutional controls, changes in land use, trespassing, and unusual or unexpected activity at the site
C-3
OSWERNo. 9355.7-03B-P
Interview Information Sought
Community Representatives* - members of the community may provide a broader view of site activities and issues than can be obtained during the site inspection
* Several types of individuals may be interviewed: residents/businesses adjacent to or on the site; residents/businesses within the path of migration; local civic leaders, local officials, Community Advisory Group (CAG), Technical Assistance Grant (TAG) group, and local environmental groups; and other audiences listed in the community profile in the Community Involvement Plan.
Some example interview questions are given below.
1. What is your overall impression of the project? (general sentiment)
2. What effects have site operations had on the surrounding community?
3. Are you aware of any community concerns regarding the site or its operation and administration? If so, please give details.
4. Are you aware of any events, incidents, or activities at the site such as vandalism, trespassing, or emergency responses from local authorities? If so, please give details.
5. Do you feel well informed about the site's activities and progress?
6. Do you have any comments, suggestions, or recommendations regarding the site's management or operation?
State and Local Considerations
State and local authorities may provide you with information about changes in State laws and regulations and present and prospective land uses and restrictions.
Interview Information Sought
State Contacts (including those responsible - changes in State laws and regulations that may impact for State water quality, hazardous waste, protectiveness and environmental health issues) - whether the site has been in compliance with permitting or
reporting requirements - information on site activities, status, and issues
Local Authorities (such as police, - status of institutional controls, site access controls, new emergency response or fire departments, ordinances in place, changes in actual or projected land use, and local environmental or planning offices) complaints being filed, and unusual activities at the site
C-4
Some example interview questions are given below. OSWERNo. 9355.7-03B-P
1. What is your overall impression of the project? (general sentiment)
2. Have there been routine communications or activities (site visits, inspections, reporting activities, etc.) conducted by your office regarding the site? If so, please give purpose and results.
3. Have there been any complaints, violations, or other incidents related to the site requiring a response by your office? If so, please give details of the events and results of the responses.
4. Do you feel well informed about the site's activities and progress?
5. Do you have any comments, suggestions, or recommendations regarding the site's management or operation?
Construction Considerations
It is important for you to determine the status of construction at the site and to ensure that health and safety concerns are addressed.
Interview Information Sought
Construction Contractor progress of project and changes in design due to field conditions - / revisions to the O&M Manual, implementation of the Health and
- Safety Plan/Contingency Plan insight into potential O&M problems
Construction Manager overview of all contractor construction activities at the site, health and safety issues, site protectiveness during construction, and the quality of the construction
Local Emergency Response Officials adequacy of contractor's Health and Safety Plan and the contractor's implementation of the Plan adequacy of contractor's emergency response duties as outlined in the Contingency Plan or Emergency Response Plan of the Health and Safety Plan
Some example interview questions for remedial actions still under construction are given below.
1. What is your overall impression of the project? (general sentiment)
2. What is the current status of construction (e.g., budget and schedule)?
3. Have any problems been encountered which required, or will require, changes to this remedial design or this ROD?
C-5
OSWER No. 9355.7-03B-P
4. Have any problems or difficulties been encountered which have impacted construction progress or implementability?
5. Do you have any comments, suggestions, or recommendations regarding the project (i.e., design, construction documents, constructability, management, regulatory agencies, etc.)?
Performance, Operation And Maintenance Problems
The following individuals may provide information to you regarding the performance of the remedy and status of O&M at the site so that the team can assess the progress of the implementation and effectiveness of the remedy, and any O&M problems.
Interview Information Sought
O&M Manager/Operating Contractor O&M status of the remedy, compliance with permit and reporting requirements, and complaints filed effectiveness of the O&M Plan information about any potential causes for concern about the remedy progress and performance of the remedy
O&M Staff effectiveness of the O&M Manual information about any potential causes for concern about the remedy Recommendations for adjusting the mode of operation or optimizing the operations protocol
Remedial Design/Remedial Action Consultant
original concepts behind the O&M of the remedy - questions about remedial design parameters, expected
performance and cost, and changes that have occurred during implementation
Some example interview questions are given below.
1. What is your overall impression of the project? (general, sentiment)
2. Is the remedy functioning as expected? How well is the remedy performing?
3. What does the monitoring data show? Are there any trends that show contaminant levels are decreasing?
4. Is there a continuous on-site O&M presence? If so, please describe staff and activities. If there is not a continuous on-site presence, describe staff and frequency of site inspections and activities.
5. Have there been any significant changes in the O & M requirements, maintenance schedules, or sampling routines since start-up or in the last five years? If so, do they affect the protectiveness or effectiveness of the remedy? Please describe changes and impacts.
C-6
OSWER No.. 9355.7-03B-P
6. Have there been unexpected O&M difficulties or costs at the site since start-up or in the last five years? If so, please give details.
7. Have there been opportunities to optimize O&M, or sampling efforts? Please describe changes and resultant or desired cost savings or improved efficiency.
8. Do you have any comments, suggestions, or recommendations regarding the project?
C-7
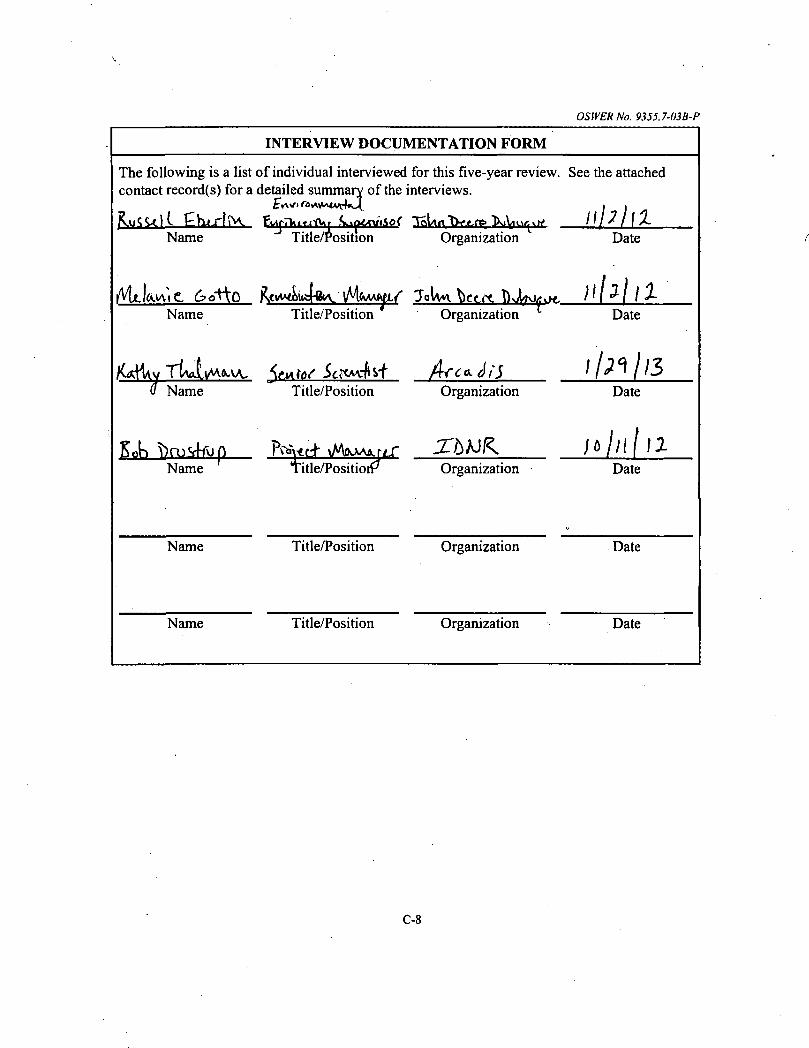
OSWER No. 9355.7-03B-P
INTERVIEW DOCUMENTATION FORM
The following is a list of individual interviewed for this five-year review. See the attached contact record(s) for a detailed summary of the interviews.
ft.uCK)l £hi.r?iVl ft^nm^ftf fhiqwioC T B L W U ^ ^ W \ 7 1 \ X Name Title/Position Organization Date
M i l a g e . 6ot to rVwwkAfri iMftMfyt/ Jotwi W r t W^UO^M.
Name Title/Position Organization Date
d Name Title/Position Organization
Name
Name
Name
"T Title/PositiorF ~ ' '
Title/Position
Title/Position
Organization
Organization
Organization
11^113 Date
Date
Date
Date
C-8
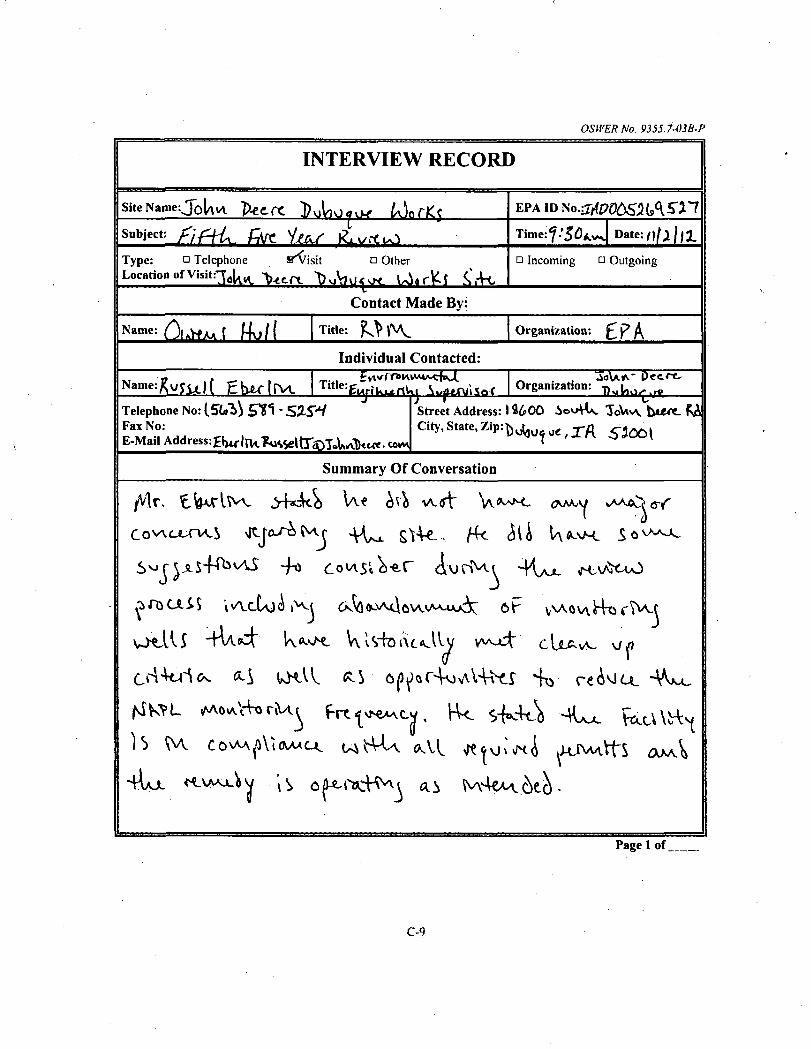
OSWER No. 93S5.7-03B-P
INTERVIEW RECORD
Site Name: J Q U W I ] f c f c f t ft^p^ EPA ID N O . ^ P C W S G A S ' I * 7
Subject: fi&L j f o y > ^ fctyft^ Time:f.'5<D Date:
Type: • Telephone H^Visit • Other L o c a r i o o o f V i s i t : ^ > t r c ^ ^ ^ ^ ^
• Incoming • Outgoing
Contact Made By:
Organization: £^ p ^
Individual Contacted: ~ \ \ 3O\A.A~ D e f t . Organ.zahon: ^ N a m e : ^ r u ) ( £ ^ l [ V l Title:
Telephone No: (5(*"J) 5 T i Fax No: E-Mail Address:£hulUi^»gltrC>T.>UAl)«c<<. cc™
Street Address: 14600 iovHW TOVWA. hur t , City, State, Z i p : ^ ^ ^ ^
Summary Of Conversation
Page 1 of_
C-9
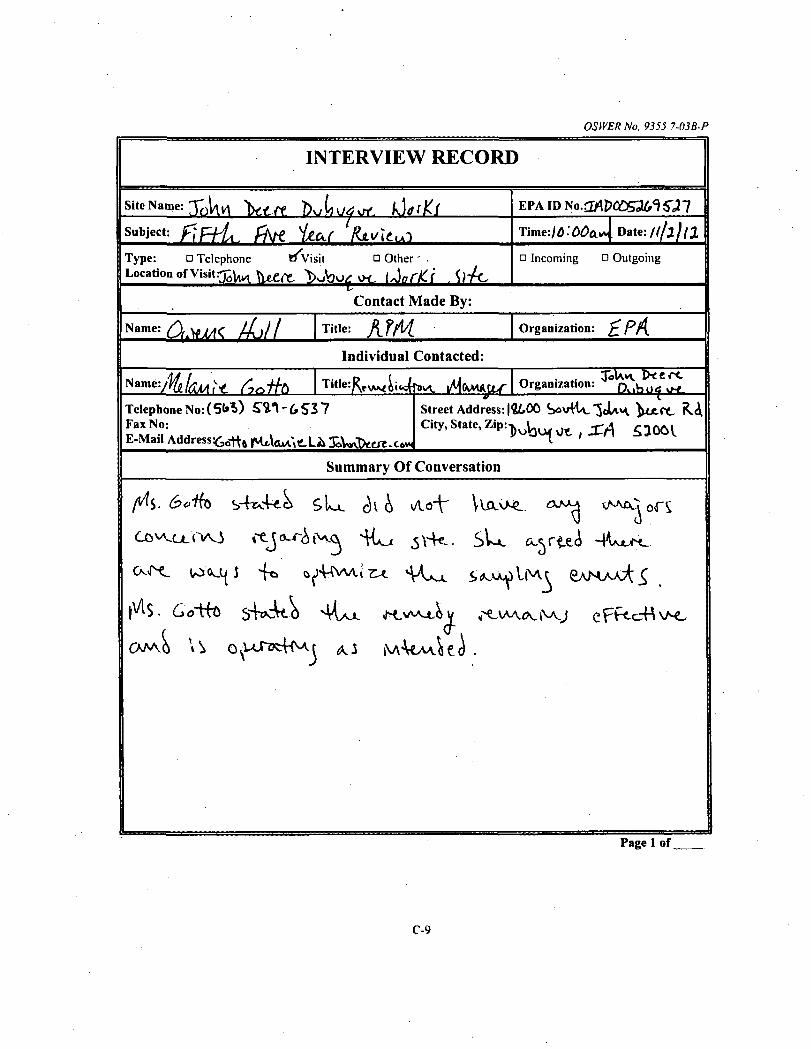
OSWER No. 9355.7-03B-P
INTERVIEW RECORD
Site Name: fr^g^ f j t f f f r EPA ID Ko.aAVOC&lSlS}!
[Subject: f j f ^ A ffsst jlc^f j W t V i Time.16'00a.™ Date:/ / / j /^
Type: o Telephone KfVisit • Other' . Location of V i s i t ^ ^ ^ e ^ ^ ( J „ r £ f , frA,
• Incoming • Outgoing
Contact Made By:
*«°*&MiA< till I l™c: ATM Organization: ^PrA.
Individual Contacted: Orgamzation: ^ ^
Telephone No: (5t»*) ^ " 6 S 3 7 Fax No: E-Mail Address£0-tt f t r*«Wig.LA 3 WT>eefe.C6w
Street Address: |4t,00 W H O C U H V*<X. f A. City, State, Z i p : - ^ ^ ^ f X ^ 5 a o 6 l
Summary Of Conversation
| S. 6 otto sW*-o VUx M W U , ^ ^ V A ^ V ^ J CFKCHVA^
Page 1 of
C-9
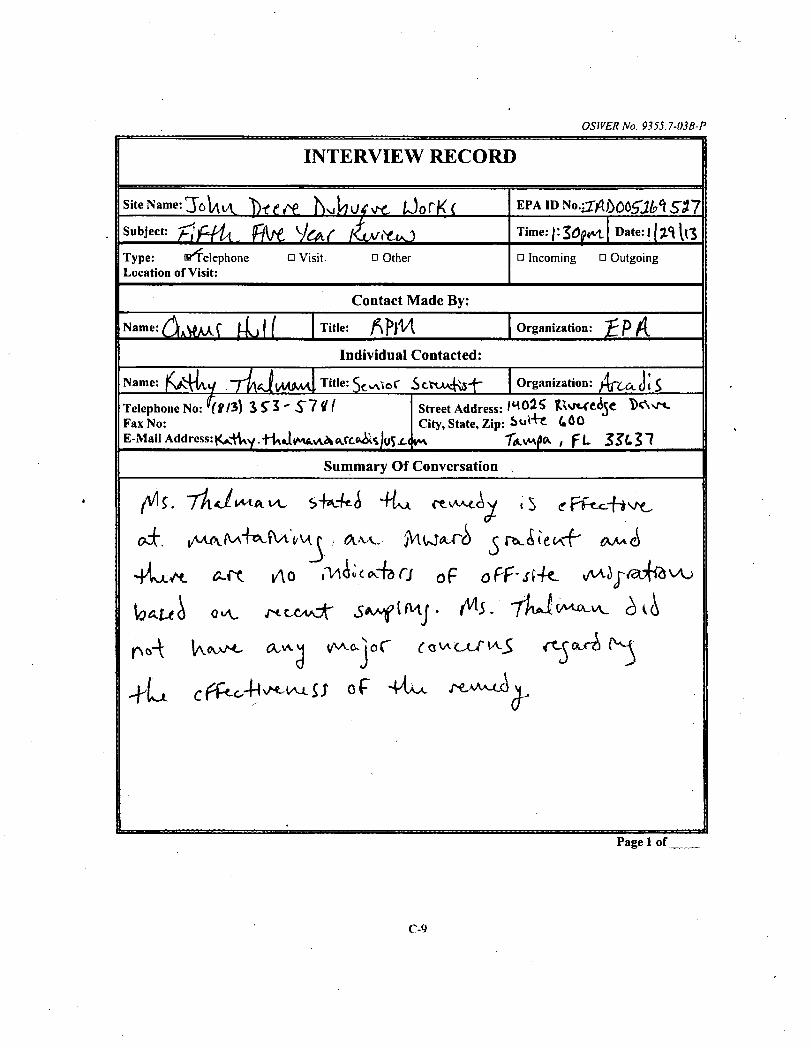
OSWER No. 935SJ-03B-P
I N T E R V I E W R E C O R D I
Site Name: 3oUt\ fyttt. IVJWV^ OoCKi EPA ID No.rr/lftOoS'Jfcl 5"27
Subject: rfWU f f a ^ r Z^vtoO Time:|:30p*i Date: 1 (tf \(3
Type: ©'Telephone • Visit o Other Location of Visit:
• Incoming • Outgoing
Contact Made By:
Title: ^fyM OrganizaHon: f \
Individual Contacted:
Name: J'v^ivV T / V J I M M * .Title: 5c ^»e.f .S c t u ^ - f - Organization: / ( f t&JiS
Telephone No: ^(gti) I S i ' S i 11 Fax No: E-Mail Address:|<^H\y .TiAj4M*.v\^<V.rc^)u5X(
Street Address: I^OlS t W e ^ e ^Ssr*. City, State, Zip: Sott* f OO
^ 7kw\f>* , PL ZJLZ1 Summary Of Conversation , |
/vie. -fkJ
Page 1 of
C-9
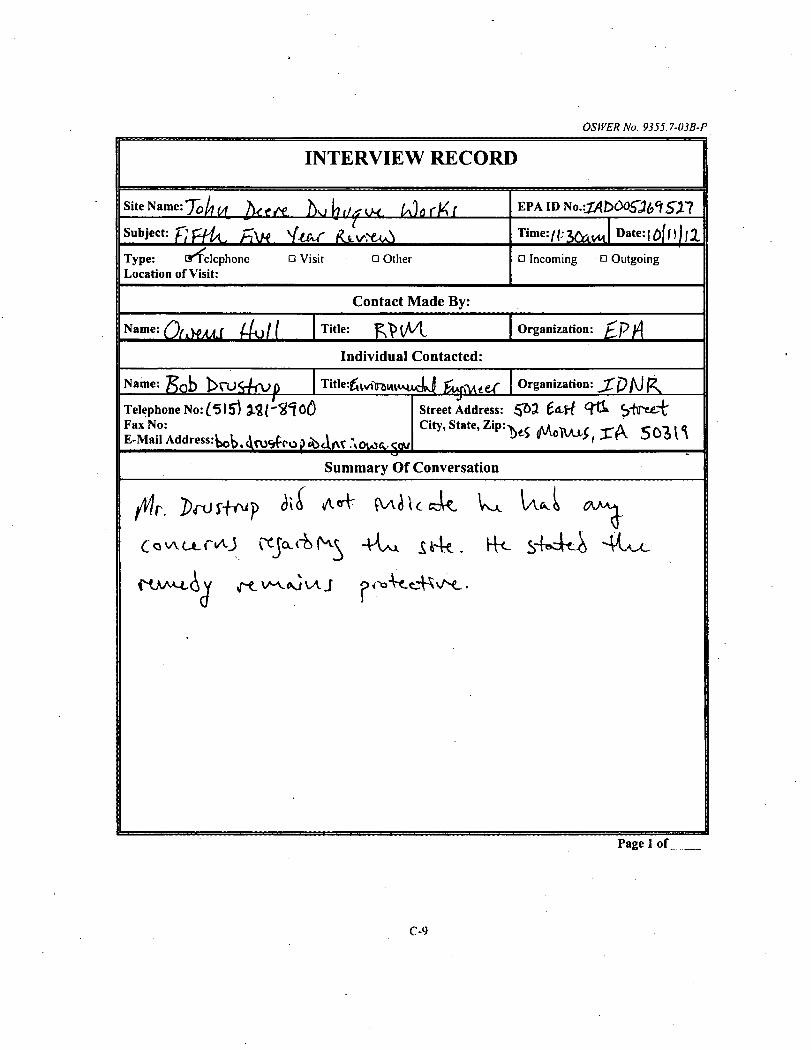
OSWER No. 9355.7-03B-P
INTERVIEW RECORD
Site Name: J p ^ /V, ( y , , ^ UlnfK
Subject: fiffa, fa W r U v A ^
EPA ID No.:jAb60&t>
ei SX1
Type: [ Telephone Location of Visit:
a Visit • Other Q Incoming Q Outgoing
Contact Made By:
" " " f W f 4 u / f I Title: K f r v H Organization: ^
Individual Contacted: N a m c : ^ p b k c U f r f V v n Tltle:glvflnwiit>uctJ gcffVuef | Organization: j T p / \ J f c
Telephone No: {515) 33 ( ' 2 1 0 0 Fax No: E-Mail Address:^, \ ^ c o j> A><W \OU,*..
Street Address: £ 0 3 t&tf. S f r e ^ City, State, Zip: v $ M f l l v u ; ^
Summary Of Conversation
Page 1 of
C-9
OSWER No. 9355.7-U3B-P
Five-Year Review Site Inspection Checklist
Purpose of the Checklist
The site inspection checklist provides a useful method for collecting important information during the site inspection portion of the five-year review. The checklist serves as a reminder of what information should to be gathered and provides the means of checking off information obtained and reviewed, or information not available or applicable. The checklist is divided into sections as follows:
I. Site Information II. Interviews III. On-site Documents & Records Verified IV. ' O & M Costs V. Access and Institutional Controls VI. General Site Conditions VII. Landfill Covers VIII. Vertical Barrier Walls IX. Groundwater/Surface Water Remedies X. Other Remedies XI. Overall Observations
Some data and information identified in the checklist may or may not be available at the site depending on how the site is managed. Sampling results, costs, and maintenance reports may be kept on site or may be kept in the offices of the contractor or at State offices. In cases where the information is not kept at the site, the item should not be checked as "not applicable," but rather it should be obtained from the office or agency where it is maintained. If this is known in advance, it may be possible to obtain the information before the site inspection.
This checklist was developed by EPA and the U.S. Army Corps of Engineers (USACE). It focuses on the two most common types of remedies that are subject to five-year reviews: landfill covers, and groundwater pump and treat remedies. Sections of the checklist are also provided for some other remedies. The sections on general site conditions would be applicable to a wider variety of remedies. The checklist should be modified to suit your needs when inspecting other types of remedies, as appropriate.
The checklist may be completed and attached to the Five-Year Review report to document site status. Please note that the checklist is not meant to be completely definitive or restrictive; additional information may be supplemented if the reviewer deems necessary. Also note that actual site conditions should be documented with photographs whenever possible.
D-3
OSWER No. 9355.7-03B-P
Using the Checklist for Types of Remedies
The checklist has sections designed to capture information concerning the main types of remedies which are found at sites requiring five-year reviews. These remedies are landfill covers (Section VII of the checklist) and groundwater and surface water remedies (Section IX of the checklist). The primary elements and appurtenances for these remedies are listed in sections which can be checked off as the facility is inspected. The opportunity is also provided to note site conditions, write comments on the facilities, and attach any additional pertinent information. If a site includes remedies beyond these, such as soil vapor extraction or soil landfarming, the information should be gathered in a similar manner and attached to the checklist.
Considering Operation and Maintenance Costs
Unexpectedly widely varying or unexpectedly high O&M costs may be early indicators of remedy problems. For this reason, it is important to obtain a record of the original O&M cost estimate and of annual O&M costs during the years for which costs incurred are available. Section IV of the checklist provides a place for documenting annual costs and for commenting on unanticipated or unusually high O&M costs. A more detailed categorization of costs may be attached to the checklist if available. Examples of categories of O&M costs are listed below.
Operating Labor - This includes all wages, salaries, training, overhead, and fringe benefits associated with the labor needed for operation of the facilities and equipment associated with the remedial actions.
Maintenance Equipment and Materials - This includes the costs for equipment, parts, and other materials required to perform routine maintenance of facilities and equipment associated with a remedial action.
Maintenance Labor - This includes the costs for labor required to perform routine maintenance of facilities and for equipment associated with a remedial action.
Auxiliary Materials and Energy - This includes items such as chemicals and utilities which can include electricity, telephone, natural gas, water, and fuel. Auxiliary materials include other expendable materials such as chemicals used during plant operations.
Purchased Services - This includes items such as sampling costs, laboratory fees, and other professional services for which the need can be predicted.
Administrative Costs - This includes all costs associated with administration of O&M not included under other categories, such as labor overhead.
D-4
OSWER No. 9355.7-03B-P
Insurance. Taxes and Licenses - This includes items such as liability and sudden and accidental insurance, real estate taxes on purchased land or right-of-way, licensing fees for certain technologies, and permit renewal and reporting costs.
Other Costs - This includes all other items which do not fit into any of the above categories.
OSWER No. 9355.7-03B-P
• I
[This page intentionally left blank.]
D-6
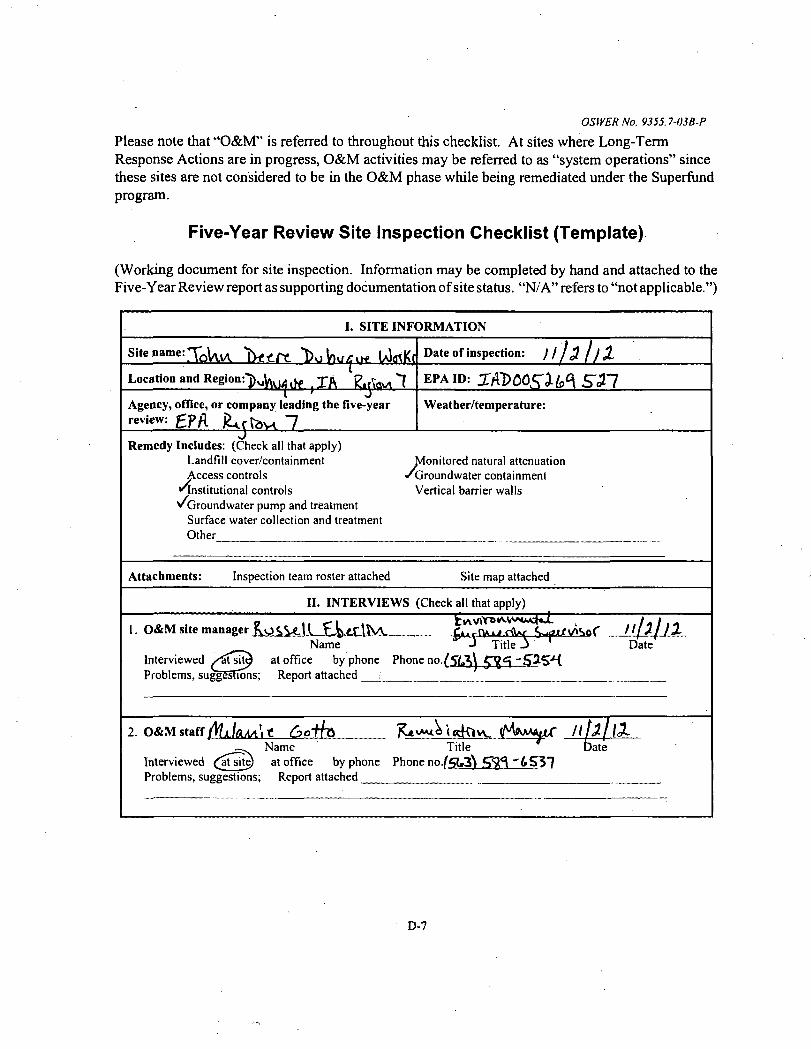
OSWER No. 9355.7-03B-P
Please note that ' 'O&M" is referred to throughout this checklist. At sites where Long-Term Response Actions are in progress, O&M activities may be referred to as "system operations" since these sites are not considered to be in the O&M phase while being remediated under the Superfund program.
Five-Year Review Site Inspection Checklist (Template)
(Working document for site inspection. Information may be completed by hand and attached to the Five-Year Review report as supporting documentation of site status. "N/A" refers to "not applicable.")
I. SITE INFORMATION
Sitenam*ToVUA W r t 'frutw^H. tO<rtKf| Date of inspection: } f / j / / Z
Location and Region:*] )^ t H , ^ j A ^ ' EPA ID: XrXDOC^Xb^ S31 Agency, office, or company leading the five-year review: g p f l j ^ j f e v i 7
Weather/temperature:
Remedy Includes: (Check all that apply) Landfill cover/containment Access controls
''Institutional controls ^Groundwater pump and treatment
Surface water collection and treatment Other
onitored natural attenuation Groundwater containment M i
•Gr Vertical barrier walls
Attachments: Inspection team roster attached Site map attached
II. INTERVIEWS (Check all that apply)
1. O&M site manager ^ O i ^ J L i ^ i T l M . fr" ry^ r tW Name J Title 3 1
Interviewed ^atsjtff at office by phone Phone no.^Sf^ 5^*1 "S^tS'K Problems, suggestions; Report attached •
Date
O&M staff jflMi t £ o f f o KtvA^VtcdKiw (MfrMyT /([jt/lX Name Title Date
Interviewed f^atsite) at office by phone Phone no.f5t,3) f f f f i "(»S%~\ Problems, suggestions; Report attached
D-7
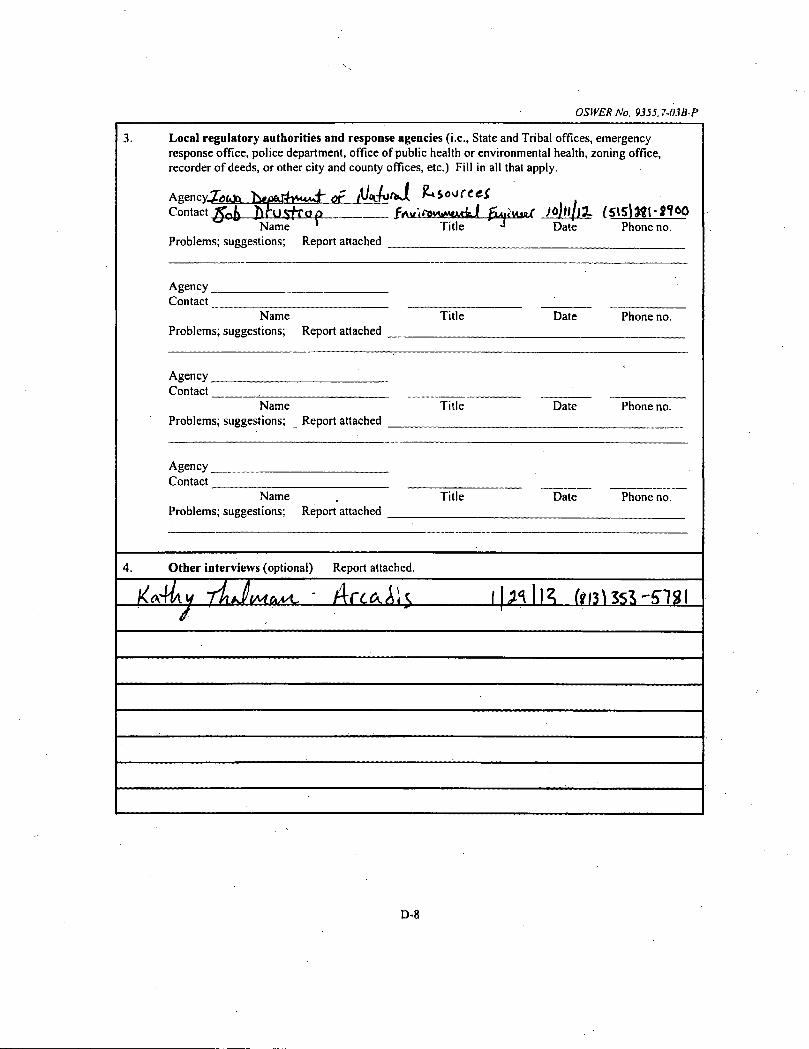
OSWER No. 9355J-03B-P
Local regulatory authorities and response agencies (i.e., State and Tribal offices, emergency response office, police department, office of public health or environmental health, zoning office, recorder of deeds, or other city and county offices, etc.) Fill in all that apply.
AgencyJ'.ixjtt h * ( » S h * * J r o f / O o c r Q ^ k i o o r c e * Contact ffru fthjtfrop frwirtvwtMkJ f W t u a / JOWjlX f S l S l t t l - m O
Momo » Title J Flare Phone no. Name Problems; suggestions; Report attached
Agency Contact
Name Problems; suggestions; Report attached
Title Date Phone no.
Agency Contact .
Name Problems; suggestions; Report attached
Title Date Phone no.
Agency Contact .
Name , Title Date Phone no. Problems; suggestions; Report attached
4. Other interviews (optional) Report attached
frl3l3S*-filgl
D-8
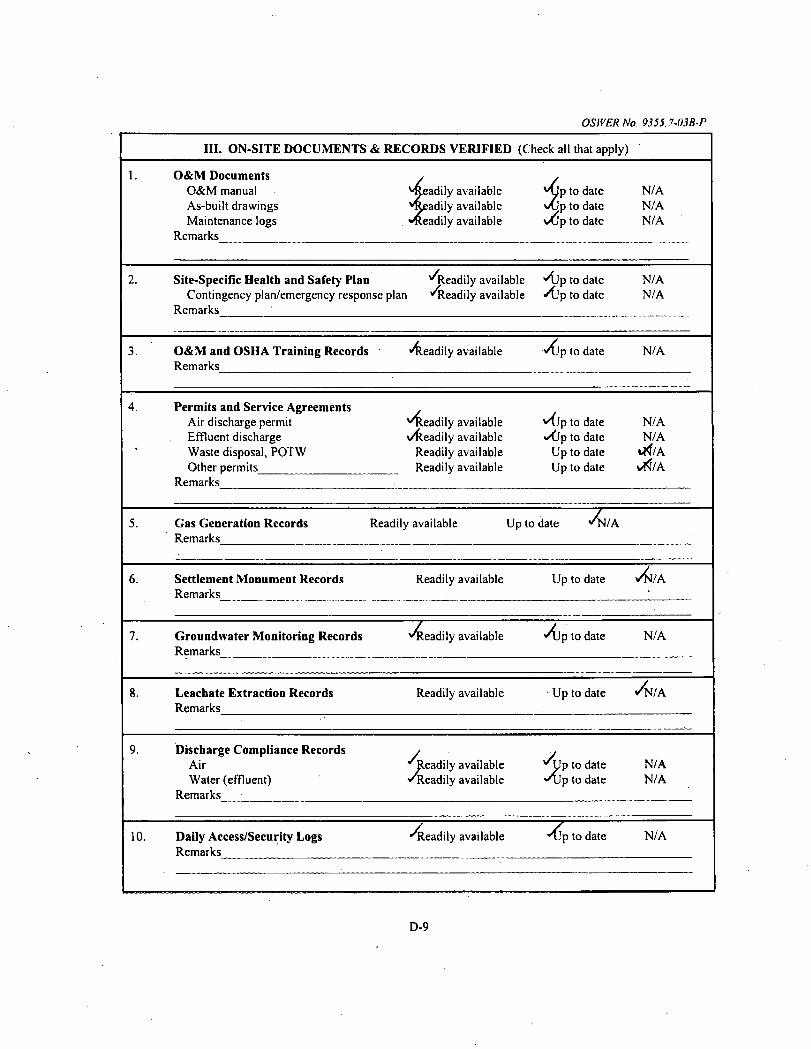
OSWER No 935S.7-03B-P
III. ON-SITE DOCUMENTS & RECORDS VERIFIED (Check all that apply)
1. O&M Documents O&M manual As-built drawings Maintenance logs
Remarks
^Readily available 'Readily available Readily available
^ p to date vtJp to date vL'p to date
N/A N/A N/A
2. Site-Specific Health and Safety Plan Contingency plan/emergency response pi
Remarks
^Readily available an Readily available
^lip to date to date
N/A N/A
3. O&M and OSHA Training Records Remarks
Readily available •Aip to date N/A
4. Permits and Service Agreements Air discharge permit Effluent discharge Waste disposal, POTW Other permits
Remarks
Readily available \/Readily available
Readily available Readily available
"'Up to date » Up to date
Up to date Up to date
N/A N/A
vrf/A v4<J/A
5. Gas Generation Records Readily available Up to date * >J/A Remarks
6. Settlement Monument Records Remarks
Readily available Up to date ^I/A
7. Groundwater Monitoring Records Remarks
^Keadily available X j p to date N/A
8. Leachate Extraction Records Remarks
Readily available • Up to date
9. Discharge Compliance Records Air Water (effluent)
Remarks
"'Readily available ^Readily available
^Up to date '•'Up to date
N/A N/A
10. Daily Access/Security Logs Remarks
Steadily available ^Vp to date N/A
D-9
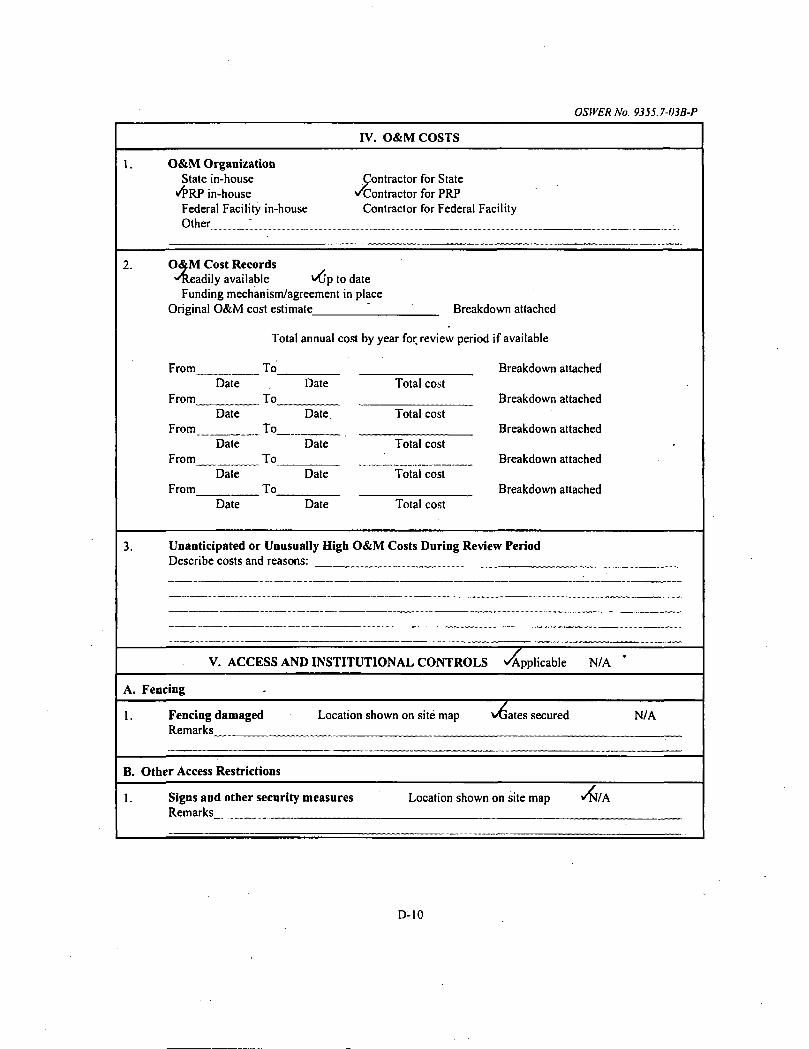
OSWER No. 9355.7-03B-P
O&M Organization State in-house
v4»RP in-house Federal Facility in-house Other
IV. O&M COSTS
Contractor for State vTJontractor for PRP
Contractor for Federal Facility
2. O&M Cost Records Readily available to date
Funding mechanism/agreement in place Original O&M cost estimate ' Breakdown attached
Total annual cost by year for review period if available
From To Breakdown attached
From Date
To Date Total cost
Breakdown attached
From Date
To Date Total cost
Breakdown attached
From Date
To Date Total cost
Breakdown attached
From Date
To Date Total cost
Breakdown attached Date Date Total cost
3. Unanticipated or Unusually High O&M Costs During Review Period Describe costs and reasons:
V. ACCESS AND INSTITUTIONAL CONTROLS Applicable N/A V/A'DDHC
A. Fencing
1. Fencing damaged Location shown on site map vGates secured N/A Remarks
B. Other Access Restrictions
1. Signs and other security measures Location shown on site map Remarks
D-10
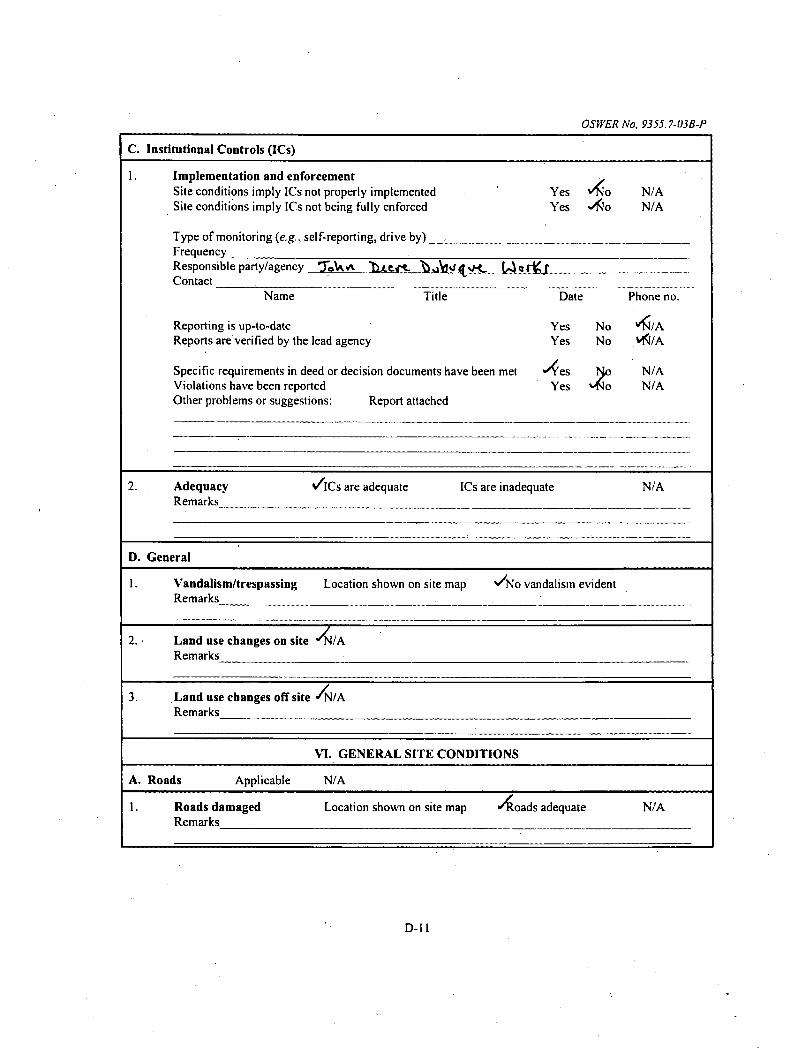
OSWER No. 9355.7-03B-P
C. Institutional Controls (ICs)
1. Implementation and enforcement . Site conditions imply ICs not properly implemented Yes ^TJo N/A Site conditions imply ICs not being fully enforced Yes «*No N/A
Type of monitoring (e.g., self-reporting, drive by) __. Frequency Responsible party/agency *3!>\*v\. TUev<- uVjv<< vM UlorKj Contact
Name Title Date Phone no.
"6/A VN/A
N/A N/A
Reporting is up-to-date Yes No Reports are verified by the lead agency Yes No
Specific requirements in deed or decision documents have been met X'es No Violations have been reported Yes Other problems or suggestions: Report attached
2. Adequacy v ICs are adequate ICs are inadequate N/A Remarks
D. General
1. Vandalism/trespassing Remarks
Location shown on site map v^No vandalism evident
2. • Land use changes on site Remarks
3. Land use changes off site ' N / A Remarks
VI. GENERAL SITE CONDITIONS
A. Roads Applicable N/A
1. Roads damaged Remarks
Location shown on site map ^oads adequate N/A
D- l l
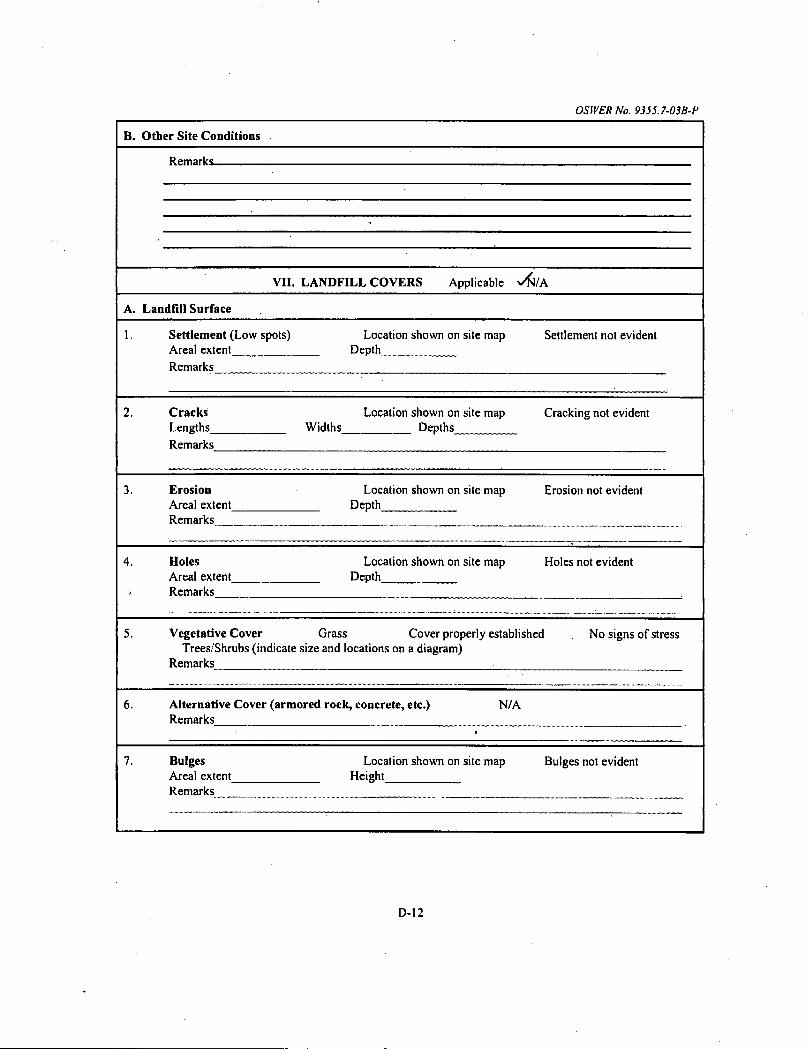
OSWER No. 9355.7-03B-P
B. Other Site Conditions
Remarks-
VII. LANDFILL COVERS Applicable N/N/A
A. Landfill Surface
1. Settlement (Low spots) Areal extent Remarks
Location shown on site map Depth
Settlement not evident
2. Cracks Lengths_ Remarks
Location shown on site map Cracking not evident Widths Depths
3. Erosion Areal extent_ Remarks
Location shown on site map Depth
Erosion not evident
4. Holes Areal extent_ Remarks
Location shown on site map Depth
Holes not evident
5. Vegetative Cover Grass Cover properly established Trees/Shrubs (indicate size and locations on a diagram)
Remarks
No signs of stress
6. Alternative Cover (armored rock, concrete, etc.) N/A Remarks
F
Bulges Areal extent_ Remarks
Location shown on site map Height
Bulges not evident
D-12
OSWER No. 9355.7-03B-P
8. Wet Areas/Water Damage Wet areas/water damage not evident Wet areas Location shown on site map Areal extent Ponding Location shown on site map Areal extent Seeps Location shown on site map Areal extent Soft subgrade Location shown on site map Areal extent
Remarks
9. Slope Instability Slides Location shown on site map No evidence of slope instability Areal extent Remarks
,-
B. Benches Applicable v ^ / A (Horizontally constructed mounds of earth placed across a steep landfill side slope to interrupt the slope in order to slow down the velocity of surface runoff and intercept and convey the runoff to a lined channel.)
1. Flows Bypass Bench Location shown on site map N/A or okay Remarks
2. Bench Breached Location shown on site map N/A or okay Remarks
Location shown on site map N/A or okay
3. Bench Overtopped Location shown on site map N/A or okay Remarks
C. Letdown Channels Applicable *^N/A (Channel lined with erosion control mats, riprap, grout bags, or gabions that descend down the steep side slope of the cover and will allow the runoff water collected by the benches to move off of the landfill cover without creating erosion gullies.)
1. Settlement Location shown on site map No evidence of settlement Areal extent Depth Remarks
2. Material Degradation Location shown on site map No evidence of degradation Material type Areal extent Remarks
3. Erosion Location shown on site map No evidence of erosion Areal extent Depth Remarks
D-13
J
OSWER No. 9355.7-03B-P
4. Undercutting Location shown on site map No evidence of undercutting ^ Areal extent Depth_. Remarks
5. Obstructions Type No obstructions Location shown on site map Areal extent
Size Remarks
6. Excessive Vegetative Growth Type No evidence of excessive growth Vegetation in channels does not obstruct flow Location shown on site map Areal extent
Remarks
D. Cover Penetrations Applicable Ik
1. Gas Vents Active Properly secured/locked Functioning Evidence of leakage at penetration N/A
Remarks
Passive Routinely sampled Good condition
Needs Maintenance
2. Gas Monitoring Probes Properly secured/locked Functioning • Routinely sampled Good condition Evidence of leakage at penetration Needs Maintenance. N/A
Remarks
3. Monitoring Wells (within surface area of landfill) Properly secured/locked Functioning Routinely sampled Good condition Evidence of leakage at penetration ' Needs Maintenance N/A
Remarks
Leachate Extraction Wells Properly secured/locked Functioning Routinely sampled Good condition Evidence of leakage at penetration Needs Maintenance N/A
Remarks
5. Settlement Monuments Located Routinely surveyed N/A Remarks
D-14
OSWER No. 9355.7-03B-P
E. Gas Collection and Treatment Applicable » N/A
1. Gas Treatment Facilities Flaring Thermal destruction Collection for reuse Good condition Needs Maintenance
Remarks
2. Gas Collection Wells, Manifolds and Piping Good condition Needs Maintenance
Remarks
3. Gas Monitoring Facilities (e.g., gas monitoring of adjacent homes or buildings) Good condition Needs Maintenance N/A
Remarks _
F. Cover Drainage Layer' Applicable VN/A
1. Outlet Pipes Inspected Remarks
Functioning N/A
2. Outlet Rock Inspected Remarks
Functioning N/A
G. Detention/Sedimentation Ponds Applicable ^ / A
1. Siltation Areal extent Depth N/A Siltation not evident
Remarks .
2. Erosion Areal extent Depth Erosion not evident
Remarks _ _
3. Outlet Works Functioning N/A Remarks
4. Dam Functioning N/A Remarks
D-15
OSWER No. 9355.7-03B-P
H. Retaining Walls Applicable l/A
1. Deformations Horizontal displacement Rotational displacement Remarks
Location shown on site map Deformation not evident Vertical displacement
2. Degradation Remarks
Location shown on site map Degradation not evident
I. Perimeter Ditches/Off-Site Discharge Applicable
1. Siltation Areal extent_ Remarks
Location shown on site map Siltation not evident Depth
Vegetative Growth Location shown on site map Vegetation does not impede flow
Areal extent Type Remarks
N/A
Erosion Areal extent_ Remarks
Location shown on site map Depth
Erosion not evident
Discharge Structure Remarks
Functioning N/A
VIII. VERTICAL BARRIER WALLS Applicable Ai/A
Settlement Areal extent_ Remarks
Location shown on site map Depth
Settlement not evident
Performance MonitoringType of monitoring Performance not monitored
Frequency Head differential , Remarks __/
Evidence of breaching
D-16
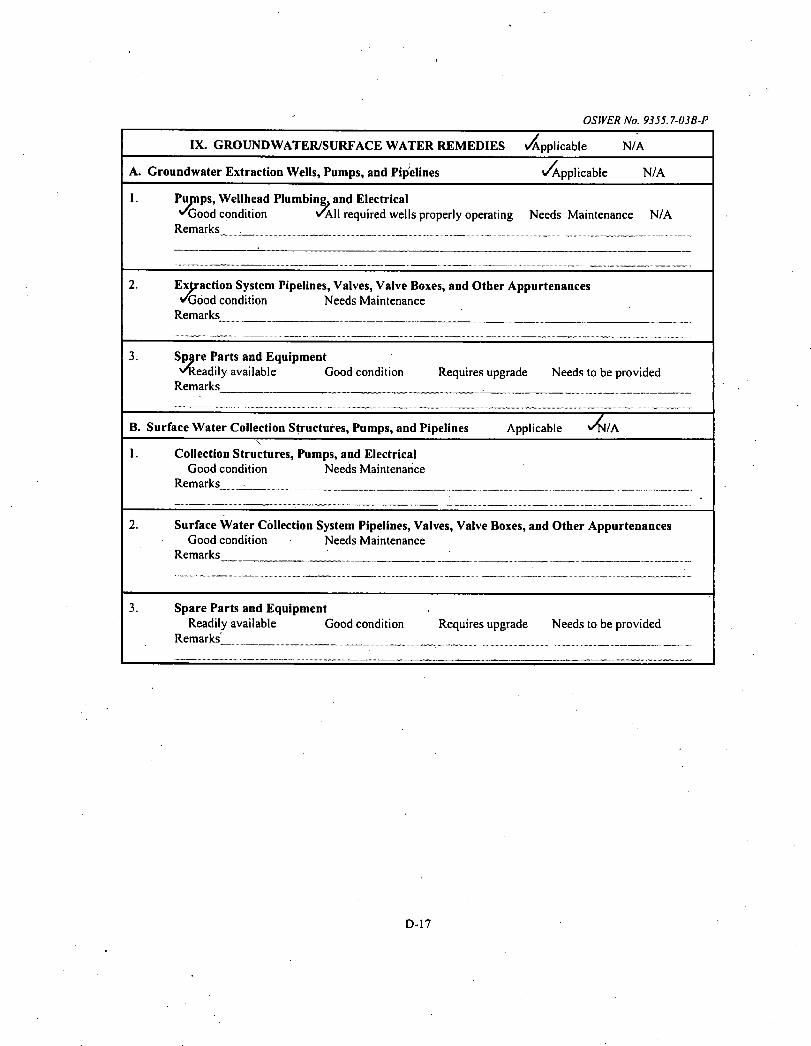
OSWER No. 9355.7-03B-P
IX. GROUND WATER/SURFACE WATER REMEDIES Applicable N/A
A. Groundwater Extraction Wells, Pumps, and Pipelines Applicable N/A
I. Pumps, Wellhead Plumbing, and Electrical ^jood condition VA11 required wells properly operating Needs Maintenance N/A
Remarks
2. Extraction System Pipelines, Valves, Valve Boxes, and Other Appurtenances *0}ood condition Needs Maintenance
Remarks
3. Spare Parts and Equipment ^lleadily available Good condition Requires upgrade Needs to be provided
Remarks
B. Surface Water Collection Structures, Pumps, and Pipelines Applicable ^N/A
1. Collection Structures, Pumps, and Electrical Good condition Needs Maintenance
Remarks
2. Surface Water Collection System Pipelines, Valves, Valve Boxes, and Other Appurtenances Good condition Needs Maintenance
Remarks
3. Spare Parts and Equipment Readily available Good condition Requires upgrade Needs to be provided
Remarks
D-17
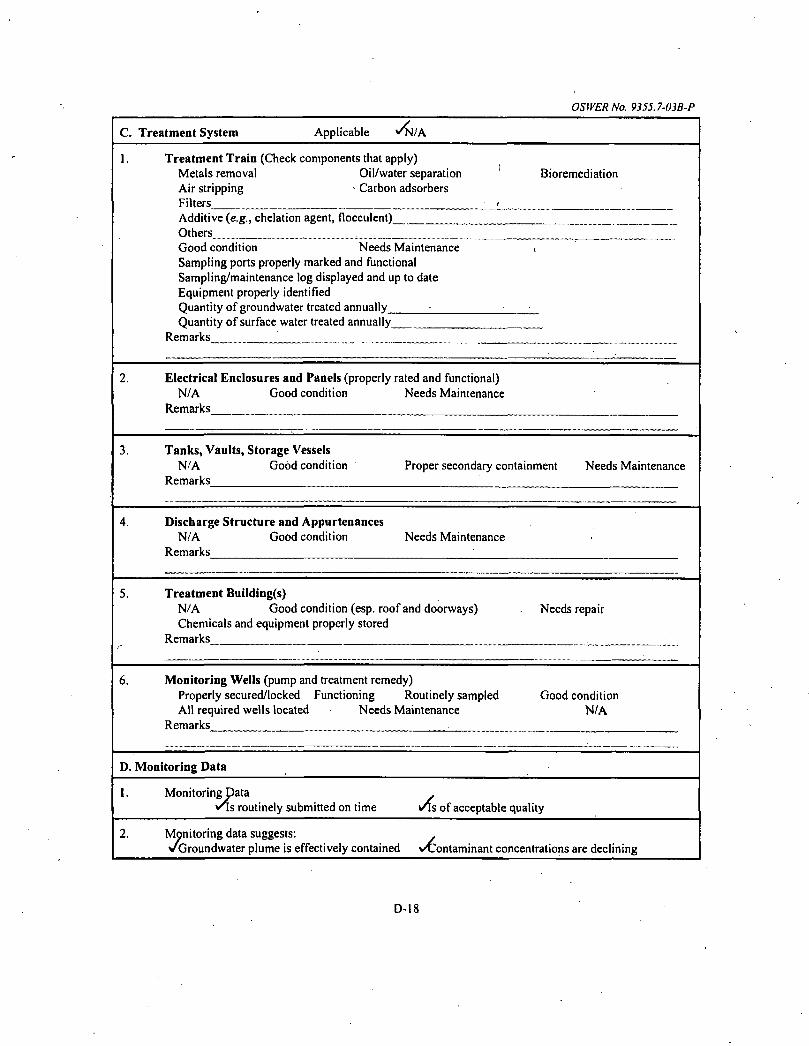
OSWER No. 9355.7-03B-P
c. Treatment System Applicable V ^ J / A
1. Treatment Train (Check components that apply) Metals removal Oil/water separation 1 Bioremediation Air stripping Carbon adsorbers Filters < Additive (e.g., chelation agent, flocculent) Others Good condition Needs Maintenance v Sampling ports properly marked and functional Sampling/maintenance log displayed and up to date Equipment properly identified Quantity of groundwater treated annually Quantity of surface water treated annually
Remarks
2. Electrical Enclosures and Panels (properly rated and functional) N/A Good condition Needs Maintenance
Remarks
3. Tanks, Vaults, Storage Vessels N/A Good condition Proper secondary containment Needs Maintenance
Remarks
4. Discharge Structure and Appurtenances N/A Good condition Needs Maintenance
Remarks
5. Treatment Building(s) N/A Good condition (esp. roof and doorways) Needs repair Chemicals and equipment properly stored
Remarks
6. Monitoring Wells (pump and treatment remedy) Properly secured/locked Functioning Routinely sampled Good condition All required wells located Needs Maintenance N/A
Remarks
D. Monitoring Data
I. Monitoring Data . v^s routinely submitted on time \As of acceptable quality
2. Monitoring data suggests: v Groundwater plume is effectively contained vContaminant concentrations are declining
D-18
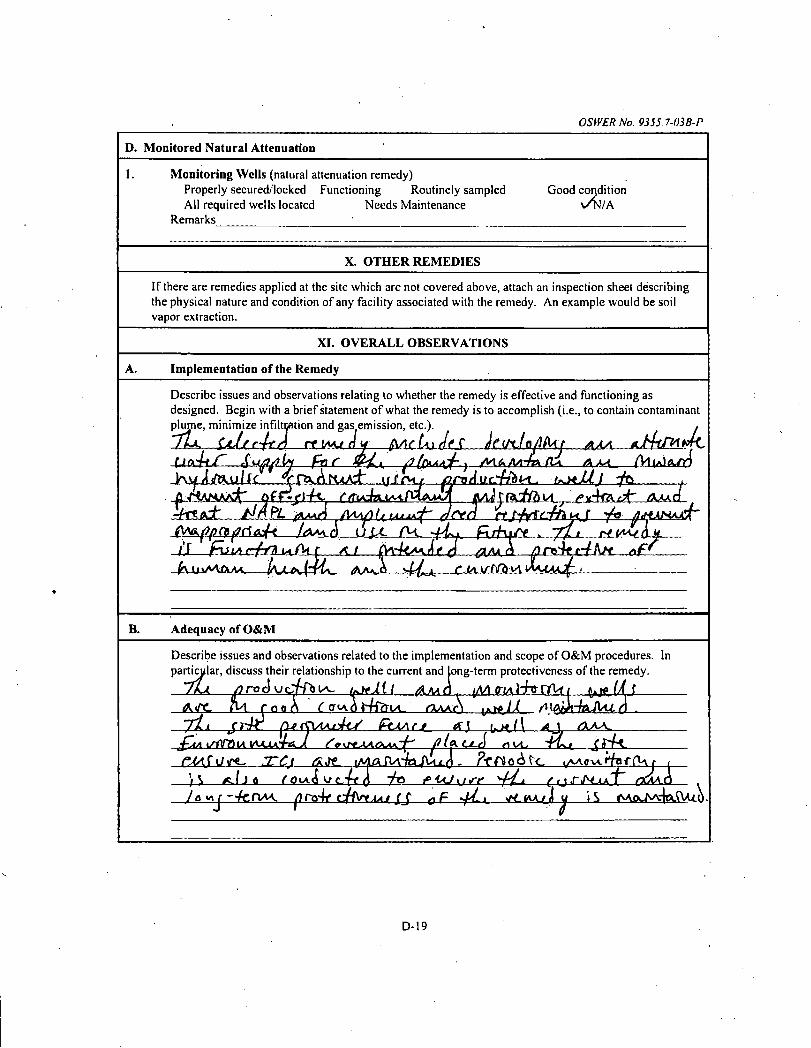
OSWER No. 9355.7-03B-P
D. Monitored Natural Attenuation
1. Monitoring Wells (natural attenuation remedy) Properly secured'locked Functioning Routinely sampled Good condition All required wells located Needs Maintenance \ZN/A
Remarks
X. OTHER REMEDIES
If there are remedies applied at the site which are not covered above, attach an inspection sheet describing the physical nature and condition of any facility associated with the remedy. An example would be soil vapor extraction.
XI. OVERALL OBSERVATIONS
Implementation of the Remedy
Describe issues and observations relating to whether the remedy is effective and functioning as designed. Begin with a brief statement of what the remedy is to accomplish (i.e., to contain contaminant plume, minimize infiltration and gas(emission, etc.). /
(J0i4i<r s. . . . 4^
^tisdt^JJAflr ,(V^UiM^t deed rfjjYfcMpJ j*
l'S f^iAsrf-f^(\LL Al (tek*£
B. Adequacy of O&M
Describe issues and observations related to the implementation and scope of O&M procedures. In particular, discuss their relationship to the current and long-term protectiveness of the remedy.
]t-i &1±4 ( Q^& v c-ft d f UJurtr ^Lt. (prHjuCt gd\Q
D-19
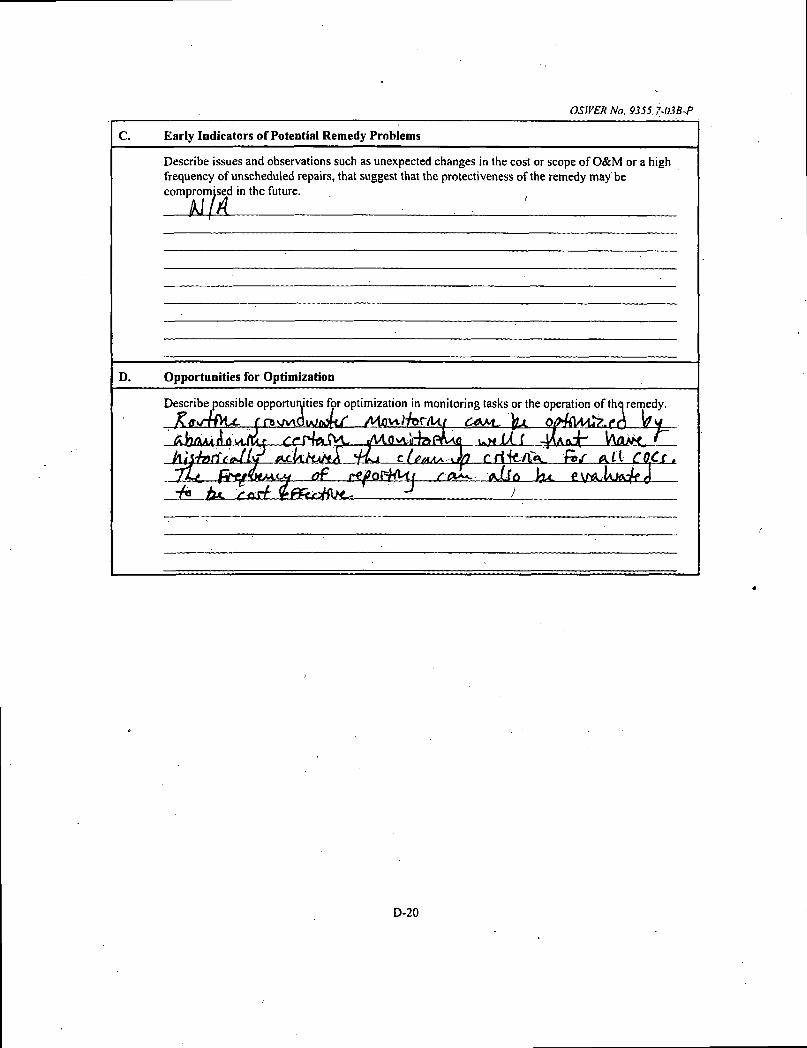
OSWER No. 9355.7-03B-P
C. Early Indicators of Potential Remedy Problems
Describe issues and observations such as unexpected changes in the cost or scope of O&M or a high frequency of unscheduled repairs, that suggest that the protectiveness of the remedy may be compromised in the future.
HIA : : : :
D. Opportunities for Optimization
Describe possible opportunities for optimization in monitoring tasks or the operation of tha remedy.
D-20
APPENDIX E
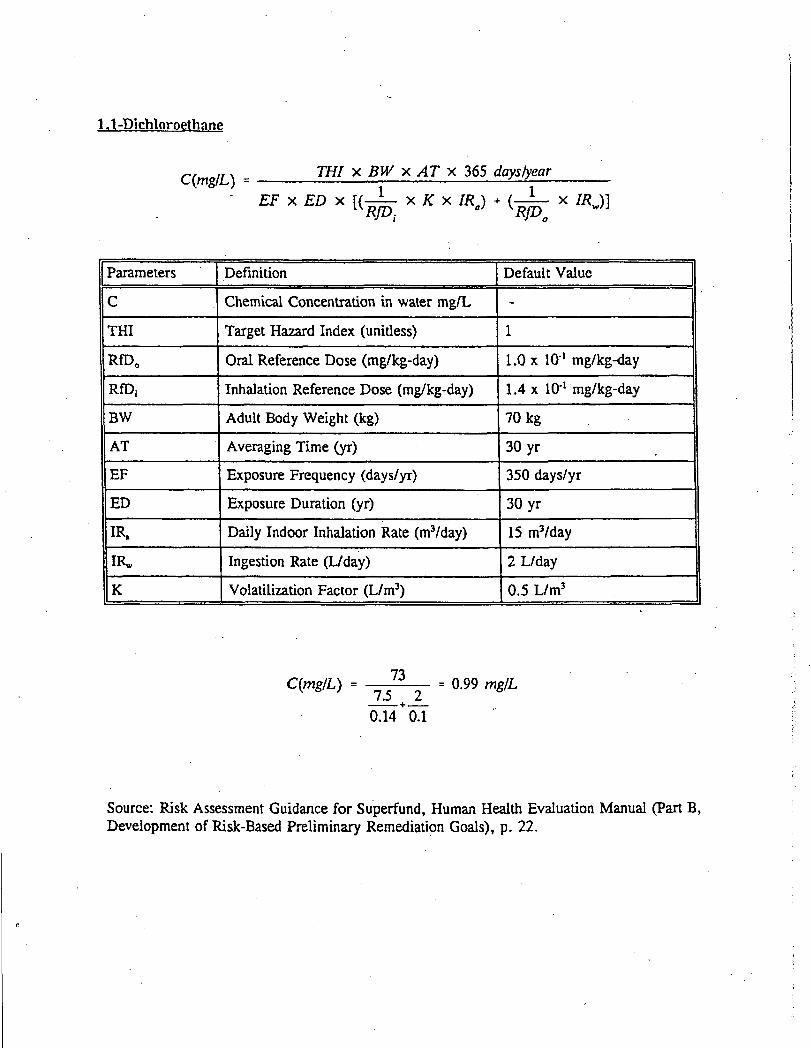
1.1-D'ichloroethane
C(mglL) = THI x BW x AT x 365 days/year
EF x ED x [(-^L x # x IRa) + ( 1 x /*J]
Parameters Definition Default Value
C Chemical Concentration in water mg/L -
THI Target Hazard Index (unitless) 1
RfD0 Oral Reference Dose (mg/kg-day) 1.0 x 10"1 mg/kg-day
RfD, Inhalation Reference Dose (mg/kg-day) 1.4 x 10'1 mg/kg-day
BW Adult Body Weight (kg) 70 kg
AT Averaging Time (yr) 30 yr
EF Exposure Frequency (days/yr) 350 days/yr
ED Exposure Duration (yr) 30 yr
Daily Indoor Inhalation Rate (nvVday) 15 nvVday
IRw Ingestion Rate (L/day) 2 L/day
K Volatilization Factor (L/m3) 0.5 L/m3
C(mg/L) 73 15 2
+— 0.14 0.1
0.99 mg/L
Source: Risk Assessment Guidance for Superfund, Human Health Evaluation Manual (Part B, Development of Risk-Based Preliminary Remediation Goals), p. 22.
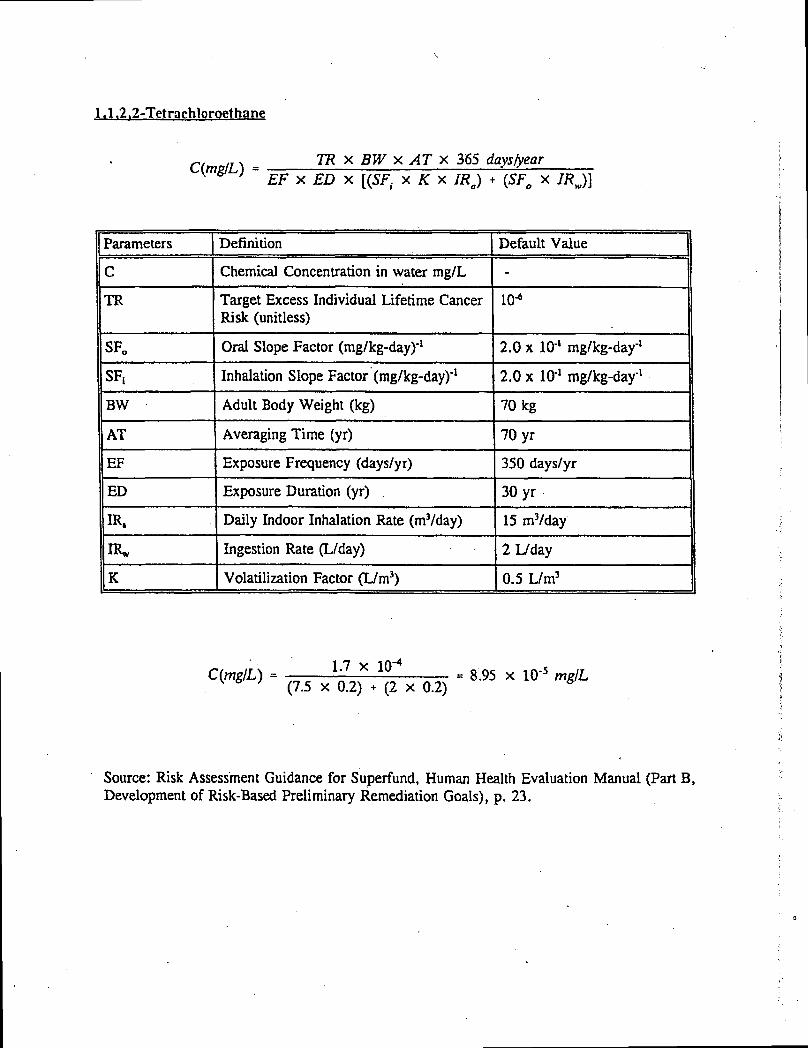
1.1,2,2-Tetrachloroethane
C(mglL) TR x BW x AT x 365 days/year EF x ED x [(SF. x K x + x IRJ]
Parameters Definition Default Value
C Chemical Concentration in water mg/L -
TR Target Excess Individual Lifetime Cancer Risk (unitless)
10*
SF0 Oral Slope Factor (mg/kg-day)"1 2.0 x 10-' mg/kg-day1
SF; Inhalation Slope Factor (mg/kg-day)"1 2.0 x 10"1 mg/kg-day1
BW Adult Body Weight (kg) 70 kg
AT Averaging Time (yr) 70 yr
EF Exposure Frequency (days/yr) 350 days/yr
ED Exposure Duration (yr) 30 yr
IR, Daily Indoor Inhalation Rate (mVday) 15 m3/day
IRw Ingestion Rate (L/day) 2 L/day
K Volatilization Factor (L/m3) 0.5 L/m3
C(mglL) = 1.7 x 10"4
8.95 x 10's mg/L (7.5 x 0.2) + (2 x 0.2)
Source: Risk Assessment Guidance for Superfund, Human Health Evaluation Manual (Part B, Development of Risk-Based Preliminary Remediation Goals), p. 23.
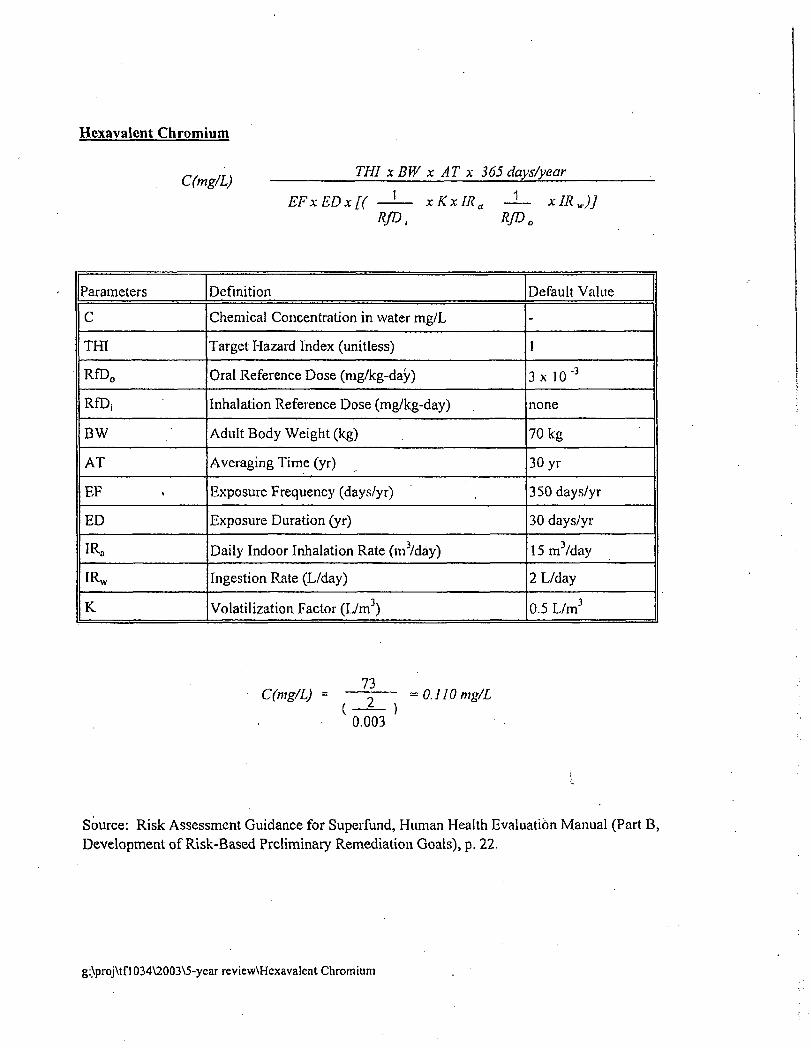
Hexavalent Chromium
CCmg/L) THI xBW x AT x 365 days/year
EFxEDx[( RfD,
xKxIR, 1
RfD, xIRJJ
Parameters Definition Default Value
C Chemical Concentration in water mg/L -
THI Target Hazard Index (unitless) 1
RfD 0 Oral Reference Dose (mg/kg-day) 3 x 10 "3
RfD, Inhalation Reference Dose (mg/kg-day) none
BW Adult Body Weight (kg) 70 kg
AT Averaging Time (yr) 30 yr
EF Exposure Frequency (days/yr) 350 days/yr
ED Exposure Duration (yr) 30 days/yr
IRa Daily Indoor Inhalation Rate (m3/day) 15m3/day
IRW Ingestion Rate (L/day) 2 L/day
K Volatilization Factor (L/m3) 0.5 L/m3
C(mg/L) = 73
0.003
0.110 mg/L
Source: Risk Assessment Guidance for Superfund, Human Health Evaluation Manual (Part B, Development of Risk-Based Preliminary Remediation Goals), p. 22.
g:\proj\tfl034\2003\5-year review\Hexavalent Chromium