Fieldwork Assessing the Vulnerability of Pacifi c Atolls to ... · Assessing the Vulnerability of...
24
Assessing the Vulnerability of Pacific Atolls to Climate Change Collaboration by USGS, National Oceanic and Atmospheric Administration, and University of Hawai‘i serendipitously captures a significant overwash event By Peter Swarzenski Pacific atolls and the people who live on them are well known to be among the most vulnerable to the impacts of future climate change and sea-level rise. The U.S. Geological Survey (USGS) is leading a multiagency project to assess the impacts of sea-level rise and storm-wave inundation on small Pacific atoll islets and their freshwater resources under various sea-level rise and climatic scenarios. In March 2014, instruments deployed by the project unexpectedly recorded an event that demonstrates the work’s importance: a combination of unusually high tides and large swells that flooded many areas within the Republic of the Marshall Islands. Funded by the Department of Defense (DoD) Strategic Environmental Research and Development Program (SERDP, <http://www.serdp.org/>), the project “The Impact of Sea-Level Rise and Climate Change on Department of Defense Installations on Atolls in the Pacific Ocean” was initiated to help DoD develop climate-change adaptation plans for U.S. installations in the Pacific. Its findings will have broad application to atolls worldwide and will be useful to Pacific island nations already threatened by sea-level rise and changing climate. The island of Roi-Namur on Kwajalein Atoll in the Republic of the Marshall Is- lands was chosen as the model atoll islet for this project. USGS scientists and their collaborators in the National Oceanic and Atmospheric Administration (NOAA) and the University of Hawai‘i are using a com- bination of data gathering and computer modeling to assess future vulnerabilities and to help make this and other Pacific atoll islets more resilient. Components of the project include oceanographic obser- vations and modeling, coastal hydrologic observations and modeling, global climate modeling, and benthic substrate character- ization. A suite of time-series instruments (which take measurements at regular During the March 2, 2014, overwash in the Republic of the Marshall Islands, seawater regularly topped the manmade perimeter berm on the island of Roi-Namur and covered large areas of the adjacent land surface. Inset shows location of photograph, taken by Peter Swarzenski, USGS. USGS technician Cordell Johnson in- stalling a temporary groundwater well on the beach at site C (see labeled square on aerial view, page 3) on Roi-Namur in November 2103. Instru- ments within the well continuously measure groundwater levels, salinity, temperature, and barometric pres- sure. USGS photograph by Peter Swarzenski. U.S. Department of the Interior U.S. Geological Survey Fieldwork http://soundwaves.usgs.gov/ (Pacific Atolls continued on page 2) Sound Waves Volume FY 2014, Issue No. 151 151 March/April 2014
Transcript of Fieldwork Assessing the Vulnerability of Pacifi c Atolls to ... · Assessing the Vulnerability of...
Assessing the Vulnerability of Pacifi c Atolls to Climate Change Collaboration by USGS, National Oceanic and Atmospheric Administration, and University of Hawai‘i serendipitously captures a signifi cant overwash event
By Peter Swarzenski
Pacifi c atolls and the people who live on them are well known to be among the most vulnerable to the impacts of future climate change and sea-level rise. The U.S. Geological Survey (USGS) is leading a multiagency project to assess the impacts of sea-level rise and storm-wave inundation on small Pacifi c atoll islets and their freshwater resources under various sea-level rise and climatic scenarios. In March 2014, instruments deployed by the project unexpectedly recorded an event that demonstrates the work’s importance: a combination of unusually high tides and large swells that fl ooded many areas within the Republic of the Marshall Islands.
Funded by the Department of Defense (DoD) Strategic Environmental Research and Development Program (SERDP, <http://www.serdp.org/>), the project “The Impact of Sea-Level Rise and Climate Change on Department of Defense Installations on Atolls in the Pacifi c Ocean” was initiated to help DoD develop climate-change adaptation plans for U.S. installations in the Pacifi c. Its
fi ndings will have broad application to atolls worldwide and will be useful to Pacifi c island nations already threatened by sea-level rise and changing climate.
The island of Roi-Namur on Kwajalein Atoll in the Republic of the Marshall Is-lands was chosen as the model atoll islet for this project. USGS scientists and their collaborators in the National Oceanic and Atmospheric Administration (NOAA) and the University of Hawai‘i are using a com-bination of data gathering and computer modeling to assess future vulnerabilities and to help make this and other Pacifi c atoll islets more resilient. Components of the project include oceanographic obser-vations and modeling, coastal hydrologic observations and modeling, global climate modeling, and benthic substrate character-ization.
A suite of time-series instruments (which take measurements at regular
During the March 2, 2014, overwash in the Republic of the Marshall Islands, seawater regularly topped the manmade perimeter berm on the island of Roi-Namur and covered large areas of the adjacent land surface. Inset shows location of photograph, taken by Peter Swarzenski, USGS.
USGS technician Cordell Johnson in-stalling a temporary groundwater well on the beach at site C (see labeled square on aerial view, page 3) on Roi-Namur in November 2103. Instru-ments within the well continuously measure groundwater levels, salinity, temperature, and barometric pres-sure. USGS photograph by Peter Swarzenski.
U.S. Department of the InteriorU.S. Geological Survey
Fieldwork
http://soundwaves.usgs.gov/
(Pacifi c Atolls continued on page 2)
Sound Waves Volume FY 2014, Issue No. 151151March/April 2014
2March/April 2014 Sound Waves
intervals over an extended period of time) were deployed on Roi-Namur during an October–November 2013 fi eld campaign by USGS personnel Steven Gingerich (USGS-Pacifi c Islands Water Science Center [PIWSC]), Cordell Johnson (USGS-Pacifi c Coastal and Marine Science Center [PCMSC]), Josh Logan (PCMSC), Sarah Rosa (PIWSC), Kurt Rosenberger (PCMSC), Curt Stolazzi (PCMSC), and Peter Swarzenski (PCMSC). The instruments were installed on the beach face, the reef fl at (shallow area between shoreline and reef crest), and the fore reef (which slopes down from the reef crest toward the open ocean), as well as in groundwater wells across the island. Still in place, they are continuously measuring parameters such as waves, tides, currents, run-up levels (distance inland reached by tides and waves), salinity, and temperature. In combination, these various time-series instruments probably make Kwajalein the most well instrumented atoll in the world!
During February–March 2014, Swarzenski returned to Roi-Namur to download data and reprogram the groundwater instruments. On March 2, 2014, the last day of his fi eld operations, a large swell with 5-meter (16 foot)-high waves arriving approximately every 15 seconds from the north-northeast struck the Republic of the Marshall Islands. Calm weather and sea conditions implied that the swell must have originated from afar. On the same day, a perigean spring high tide occurred in the mid-afternoon. (A perigean spring tide happens when the moon is either new or full and closest
to Earth [see http://oceanservice.noaa.gov/facts/perigean-spring-tide.html]; a popular term for an extreme tide is “king tide.”) The combination of the unusually high tide and swell produced a dramatic overwash event throughout the Republic of the Marshall Islands. During this overwash, which lasted approximately 3 hours, seawater regularly topped the protective perimeter berm on Roi-Namur and covered large areas of the adjacent land surface (see photograph on page 1). On nearby Majuro, the capital of the Marshall Islands, as many as 70 homes
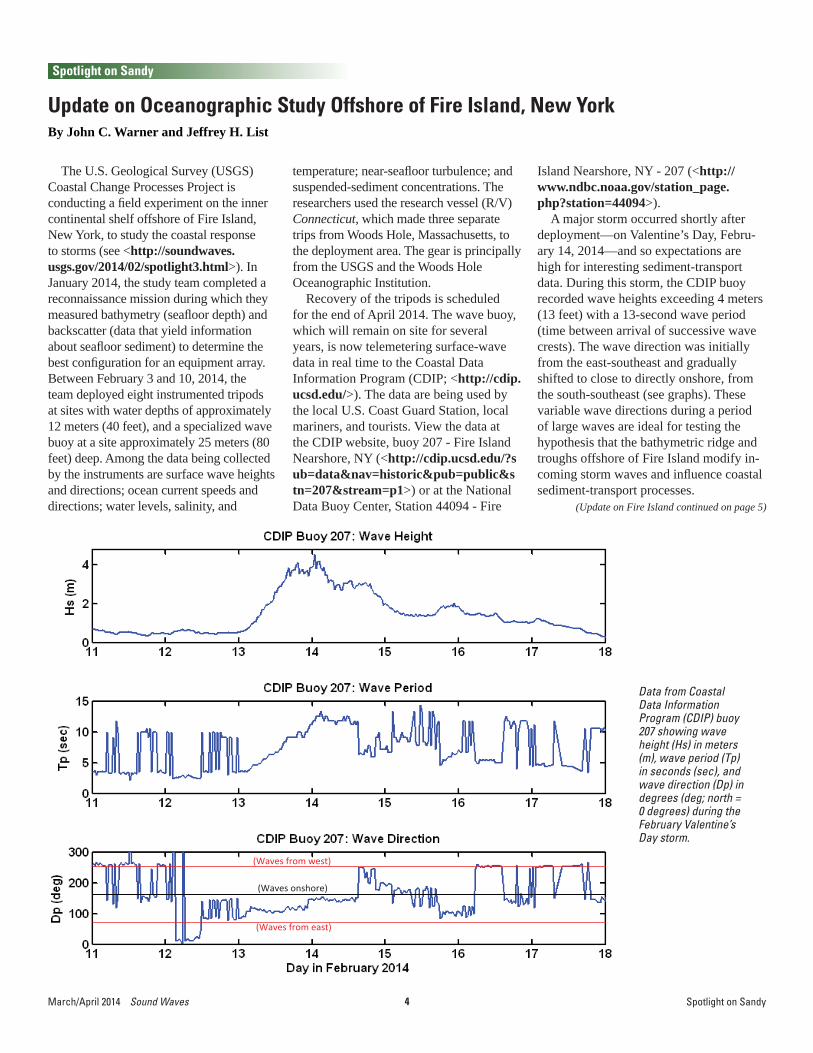
Large swells from the north-northeast with heights up to 5 meters (16 feet) combined with unusually high tides to inundate much of the Republic of the Marshall Islands on March 2, 2014. USGS photograph by Peter Swarzenski.
were directly affected by this overwash event, and a state of emergency was declared by President Christopher Loeak on March 5, 2014.
A press release about the March 2014 event from the Republic of the Marshall Islands government (<http://www.rmi-op.net/>, scroll to press release dated March 7, 2014) stated that “This week’s king tides were the worst that the Marshall
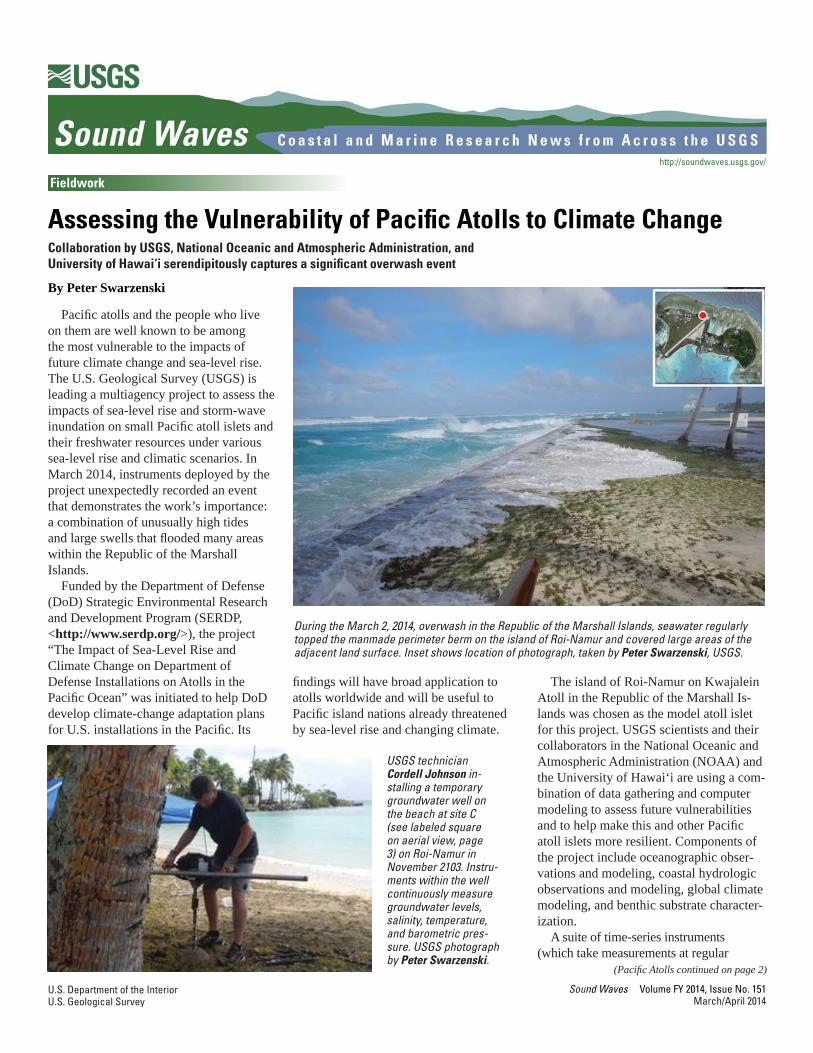
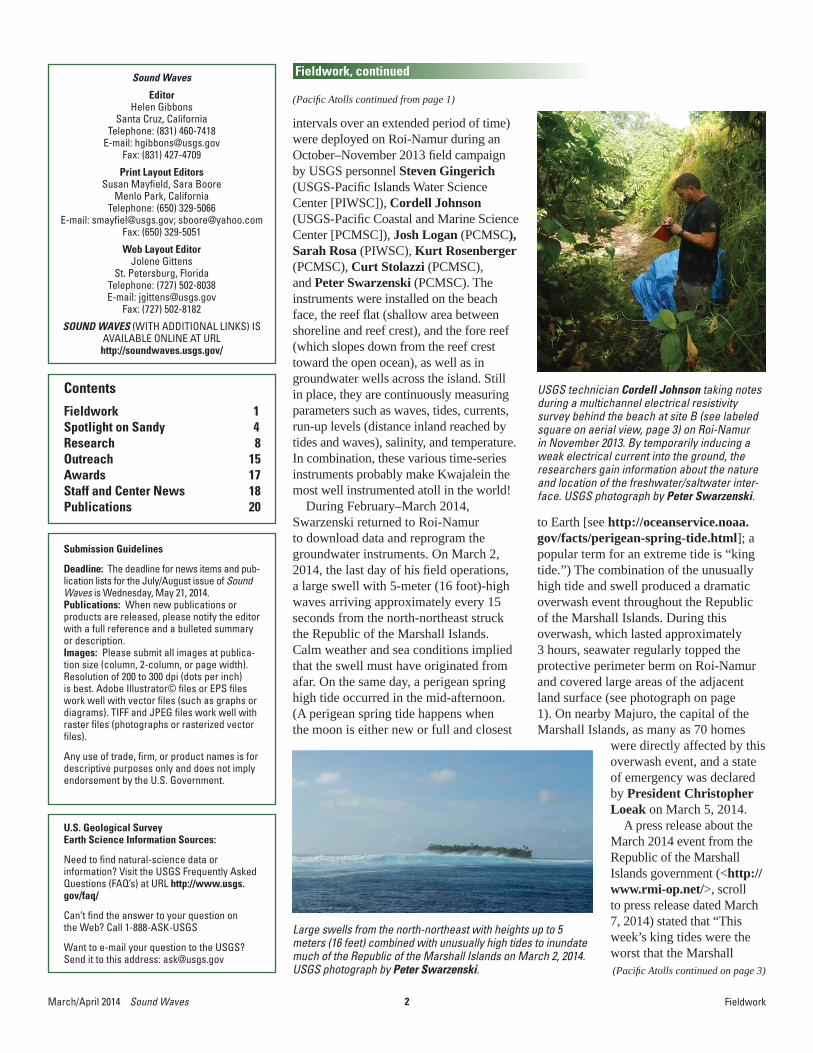
USGS technician Cordell Johnson taking notes during a multichannel electrical resistivity survey behind the beach at site B (see labeled square on aerial view, page 3) on Roi-Namur in November 2013. By temporarily inducing a weak electrical current into the ground, the researchers gain information about the nature and location of the freshwater/saltwater inter-face. USGS photograph by Peter Swarzenski.
Sound Waves
EditorHelen Gibbons
Santa Cruz, CaliforniaTelephone: (831) 460-7418
E-mail: [email protected]: (831) 427-4709
Print Layout EditorsSusan Mayfi eld, Sara Boore
Menlo Park, CaliforniaTelephone: (650) 329-5066
E-mail: smayfi [email protected]; [email protected]: (650) 329-5051
Web Layout EditorJolene Gittens
St. Petersburg, FloridaTelephone: (727) 502-8038E-mail: [email protected]
Fax: (727) 502-8182
SOUND WAVES (WITH ADDITIONAL LINKS) IS AVAILABLE ONLINE AT URLhttp://soundwaves.usgs.gov/
Fieldwork
Fieldwork, continued
Submission Guidelines
Deadline: The dead line for news items and pub- li ca tion lists for the July/August issue of Sound Waves is Wednesday, May 21, 2014. Publications: When new publications or prod ucts are re leased, please no ti fy the ed i tor with a full reference and a bulleted sum ma ry or description.Images: Please sub mit all images at pub li ca- tion size (col umn, 2-column, or page width). Resolution of 200 to 300 dpi (dots per inch) is best. Ado be Illustrator© fi les or EPS fi les work well with vector fi les (such as graphs or di a grams). TIFF and JPEG fi les work well with ras ter fi les (pho to graphs or rasterized vec tor fi les).
Any use of trade, fi rm, or product names is for descriptive purposes only and does not imply endorsement by the U.S. Gov ern ment.
U.S. Geological Survey Earth Science Information Sources:
Need to fi nd natural-science data orinformation? Visit the USGS Frequently Asked Ques tions (FAQ’s) at URL http://www.usgs.gov/faq/
Can’t fi nd the answer to your question on the Web? Call 1-888-ASK-USGS
Want to e-mail your question to the USGS?Send it to this address: [email protected]
Contents
Fieldwork 1Spotlight on Sandy 4Research 8Outreach 15Awards 17Staff and Center News 18Publications 20
(Pacifi c Atolls continued from page 1)
(Pacifi c Atolls continued on page 3)
3 Sound Waves March/April 2014
0 600 Milees
0 600 6 Kilometeeeers
Mercce catortoror Pro ProProroojectjectjecjectionionio
0 1000 feet
0 500 meters
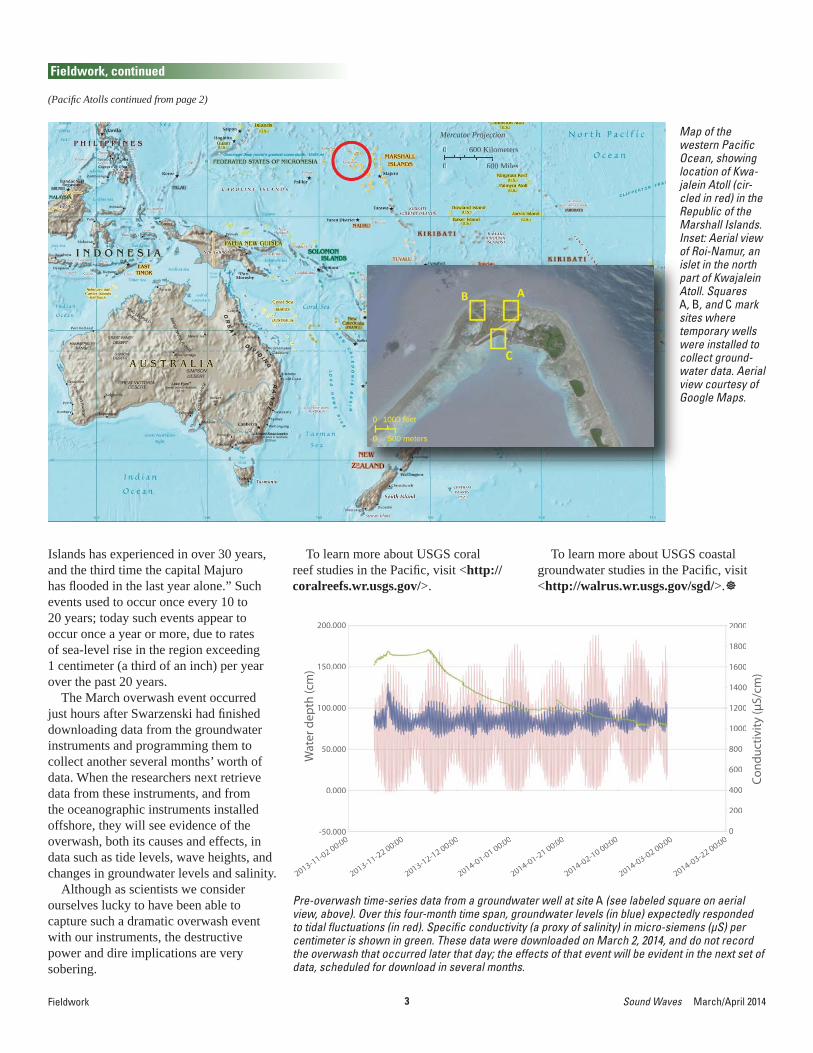
Map of the western Pacifi c Ocean, showing location of Kwa-jalein Atoll (cir-cled in red) in the Republic of the Marshall Islands. Inset: Aerial view of Roi-Namur, an islet in the north part of Kwajalein Atoll. Squares A, B, and C mark sites where temporary wells were installed to collect ground-water data. Aerial view courtesy of Google Maps.
Islands has experienced in over 30 years, and the third time the capital Majuro has fl ooded in the last year alone.” Such events used to occur once every 10 to 20 years; today such events appear to occur once a year or more, due to rates of sea-level rise in the region exceeding 1 centimeter (a third of an inch) per year over the past 20 years.
The March overwash event occurred just hours after Swarzenski had fi nished downloading data from the groundwater instruments and programming them to collect another several months’ worth of data. When the researchers next retrieve data from these instruments, and from the oceanographic instruments installed offshore, they will see evidence of the overwash, both its causes and effects, in data such as tide levels, wave heights, and changes in groundwater levels and salinity.
Although as scientists we consider ourselves lucky to have been able to capture such a dramatic overwash event with our instruments, the destructive power and dire implications are very sobering.
To learn more about USGS coral reef studies in the Pacifi c, visit <http://coralreefs.wr.usgs.gov/>.
To learn more about USGS coastal groundwater studies in the Pacifi c, visit <http://walrus.wr.usgs.gov/sgd/>.
Fieldwork
Fieldwork, continued
(Pacifi c Atolls continued from page 2)
Wat
er d
epth
(cm
)
Cond
uctiv
ity (μ
S/cm
)
200.000
150.000
100.000
50.000
0.000
-50.000
2013-11-02 00:00
2013-11-22 00:00
2013-12-12 00:00
2014-01-01 00:00
2014-01-21 00:00
2014-02-10 00:00
2014-03-02 00:00
2014-03-22 00:00
2000
1800
1600
1400
1200
1000
800
600
400
200
0
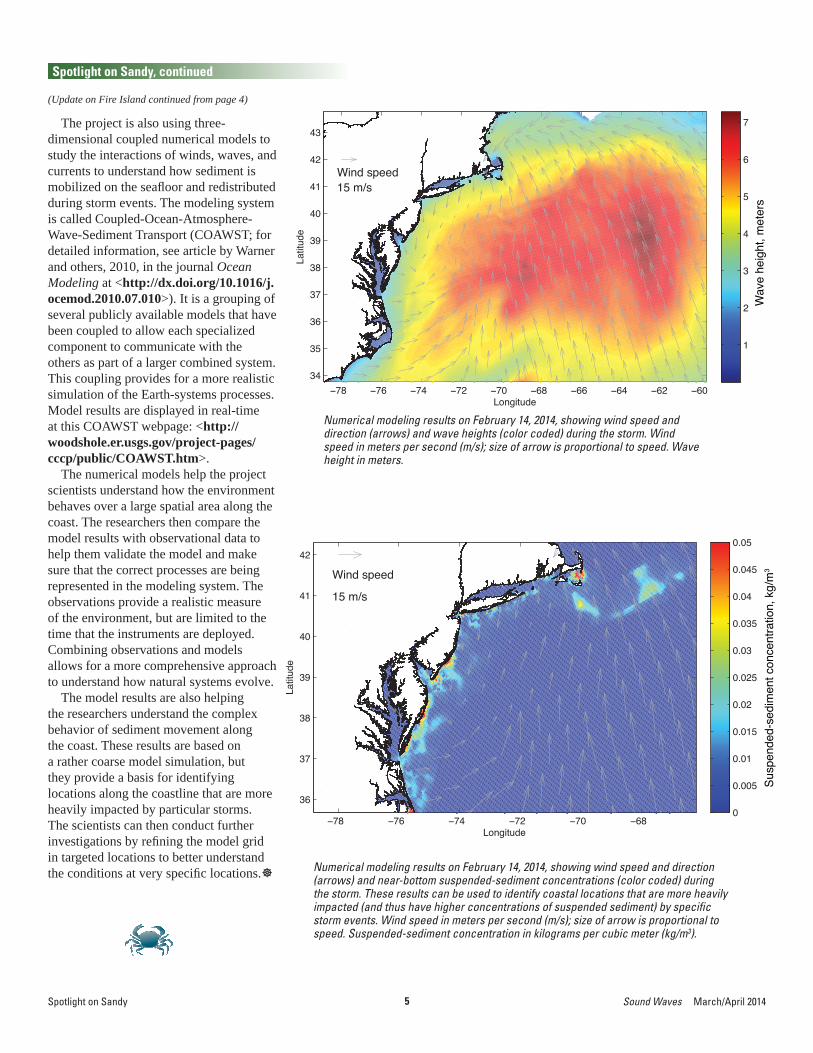
Pre-overwash time-series data from a groundwater well at site A (see labeled square on aerial view, above). Over this four-month time span, groundwater levels (in blue) expectedly responded to tidal fl uctuations (in red). Specifi c conductivity (a proxy of salinity) in micro-siemens (µS) per centimeter is shown in green. These data were downloaded on March 2, 2014, and do not record the overwash that occurred later that day; the effects of that event will be evident in the next set of data, scheduled for download in several months.
4March/April 2014 Sound Waves Spotlight on Sandy
Spotlight on Sandy
(Update on Fire Island continued on page 5)
Update on Oceanographic Study Offshore of Fire Island, New YorkBy John C. Warner and Jeffrey H. List
The U.S. Geological Survey (USGS) Coastal Change Processes Project is conducting a fi eld experiment on the inner continental shelf offshore of Fire Island, New York, to study the coastal response to storms (see <http://soundwaves.usgs.gov/2014/02/spotlight3.html>). In January 2014, the study team completed a reconnaissance mission during which they measured bathymetry (seafl oor depth) and backscatter (data that yield information about seafl oor sediment) to determine the best confi guration for an equipment array. Between February 3 and 10, 2014, the team deployed eight instrumented tripods at sites with water depths of approximately 12 meters (40 feet), and a specialized wave buoy at a site approximately 25 meters (80 feet) deep. Among the data being collected by the instruments are surface wave heights and directions; ocean current speeds and directions; water levels, salinity, and
temperature; near-seafl oor turbulence; and suspended-sediment concentrations. The researchers used the research vessel (R/V) Connecticut, which made three separate trips from Woods Hole, Massachusetts, to the deployment area. The gear is principally from the USGS and the Woods Hole Oceanographic Institution.
Recovery of the tripods is scheduled for the end of April 2014. The wave buoy, which will remain on site for several years, is now telemetering surface-wave data in real time to the Coastal Data Information Program (CDIP; <http://cdip.ucsd.edu/>). The data are being used by the local U.S. Coast Guard Station, local mariners, and tourists. View the data at the CDIP website, buoy 207 - Fire Island Nearshore, NY (<http://cdip.ucsd.edu/?sub=data&nav=historic&pub=public&stn=207&stream=p1>) or at the National Data Buoy Center, Station 44094 - Fire
Island Nearshore, NY - 207 (<http://www.ndbc.noaa.gov/station_page.php?station=44094>).
A major storm occurred shortly after deployment—on Valentine’s Day, Febru-ary 14, 2014—and so expectations are high for interesting sediment-transport data. During this storm, the CDIP buoy recorded wave heights exceeding 4 meters (13 feet) with a 13-second wave period (time between arrival of successive wave crests). The wave direction was initially from the east-southeast and gradually shifted to close to directly onshore, from the south-southeast (see graphs). These variable wave directions during a period of large waves are ideal for testing the hypothesis that the bathymetric ridge and troughs offshore of Fire Island modify in-coming storm waves and infl uence coastal sediment-transport processes.
(Waves from west)
(Waves from east)
(Waves onshore)
Data from Coastal Data Information Program (CDIP) buoy 207 showing wave height (Hs) in meters (m), wave period (Tp) in seconds (sec), and wave direction (Dp) in degrees (deg; north = 0 degrees) during the February Valentine’s Day storm.
5 Sound Waves March/April 2014
Spotlight on Sandy, continued
Spotlight on Sandy
(Update on Fire Island continued from page 4)
The project is also using three-dimensional coupled numerical models to study the interactions of winds, waves, and currents to understand how sediment is mobilized on the seafl oor and redistributed during storm events. The modeling system is called Coupled-Ocean-Atmosphere-Wave-Sediment Transport (COAWST; for detailed information, see article by Warner and others, 2010, in the journal Ocean Modeling at <http://dx.doi.org/10.1016/j.ocemod.2010.07.010>). It is a grouping of several publicly available models that have been coupled to allow each specialized component to communicate with the others as part of a larger combined system. This coupling provides for a more realistic simulation of the Earth-systems processes. Model results are displayed in real-time at this COAWST webpage: <http://woodshole.er.usgs.gov/project-pages/cccp/public/COAWST.htm>.
The numerical models help the project scientists understand how the environment behaves over a large spatial area along the coast. The researchers then compare the model results with observational data to help them validate the model and make sure that the correct processes are being represented in the modeling system. The observations provide a realistic measure of the environment, but are limited to the time that the instruments are deployed. Combining observations and models allows for a more comprehensive approach to understand how natural systems evolve.
The model results are also helping the researchers understand the complex behavior of sediment movement along the coast. These results are based on a rather coarse model simulation, but they provide a basis for identifying locations along the coastline that are more heavily impacted by particular storms. The scientists can then conduct further investigations by refi ning the model grid in targeted locations to better understand the conditions at very specifi c locations.
Numerical modeling results on February 14, 2014, showing wind speed and direction (arrows) and wave heights (color coded) during the storm. Wind speed in meters per second (m/s); size of arrow is proportional to speed. Wave height in meters.
Numerical modeling results on February 14, 2014, showing wind speed and direction (arrows) and near-bottom suspended-sediment concentrations (color coded) during the storm. These results can be used to identify coastal locations that are more heavily impacted (and thus have higher concentrations of suspended sediment) by specifi c storm events. Wind speed in meters per second (m/s); size of arrow is proportional to speed. Suspended-sediment concentration in kilograms per cubic meter (kg/m3).
6March/April 2014 Sound Waves
Spotlight on Sandy, continued
Spotlight on Sandy
Linking Coastal Processes and Vulnerability—Assateague Island Regional Study By Rob Thieler and Laura Brothers
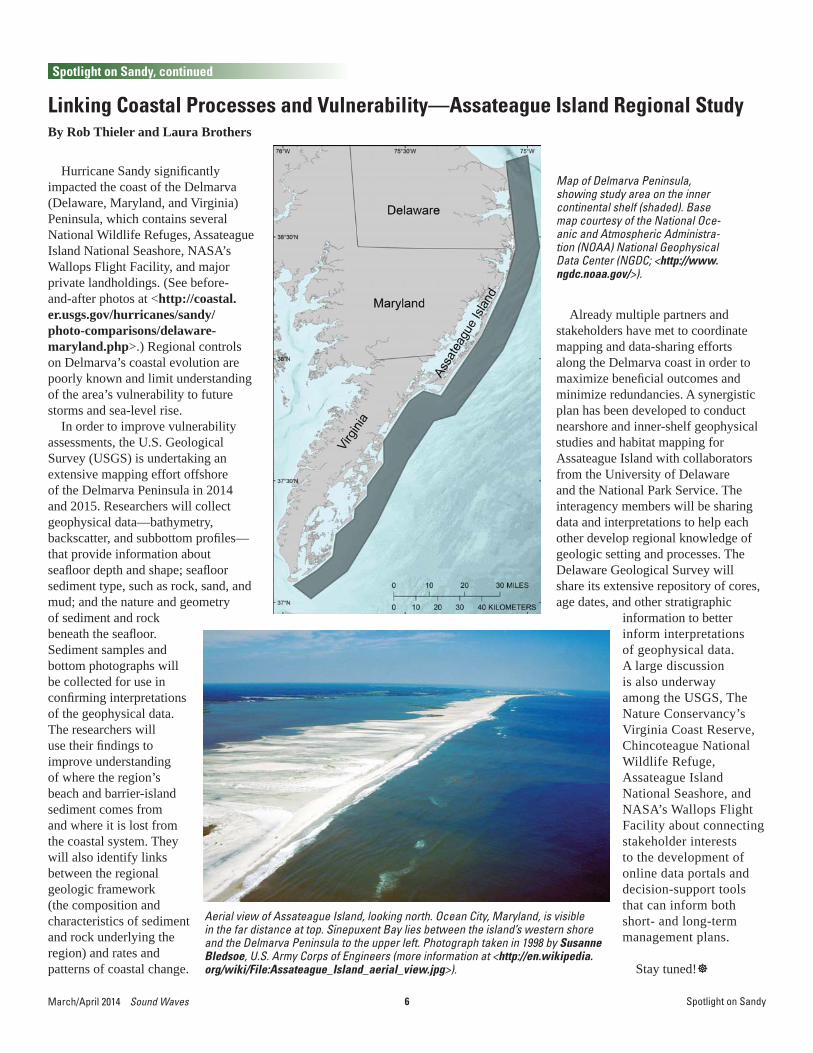
Hurricane Sandy signifi cantly impacted the coast of the Delmarva (Delaware, Maryland, and Virginia) Peninsula, which contains several National Wildlife Refuges, Assateague Island National Seashore, NASA’s Wallops Flight Facility, and major private landholdings. (See before-and-after photos at <http://coastal.er.usgs.gov/hurricanes/sandy/photo-comparisons/delaware-maryland.php>.) Regional controls on Delmarva’s coastal evolution are poorly known and limit understanding of the area’s vulnerability to future storms and sea-level rise.
In order to improve vulnerability assessments, the U.S. Geological Survey (USGS) is undertaking an extensive mapping effort offshore of the Delmarva Peninsula in 2014 and 2015. Researchers will collect geophysical data—bathymetry, backscatter, and subbottom profi les—that provide information about seafl oor depth and shape; seafl oor sediment type, such as rock, sand, and mud; and the nature and geometry
Already multiple partners and stakeholders have met to coordinate mapping and data-sharing efforts along the Delmarva coast in order to maximize benefi cial outcomes and minimize redundancies. A synergistic plan has been developed to conduct nearshore and inner-shelf geophysical studies and habitat mapping for Assateague Island with collaborators from the University of Delaware and the National Park Service. The interagency members will be sharing data and interpretations to help each other develop regional knowledge of geologic setting and processes. The Delaware Geological Survey will share its extensive repository of cores, age dates, and other stratigraphic
Map of Delmarva Peninsula, showing study area on the inner continental shelf (shaded). Base map courtesy of the National Oce-anic and Atmospheric Administra-tion (NOAA) National Geophysical Data Center (NGDC; <http://www.ngdc.noaa.gov/>).
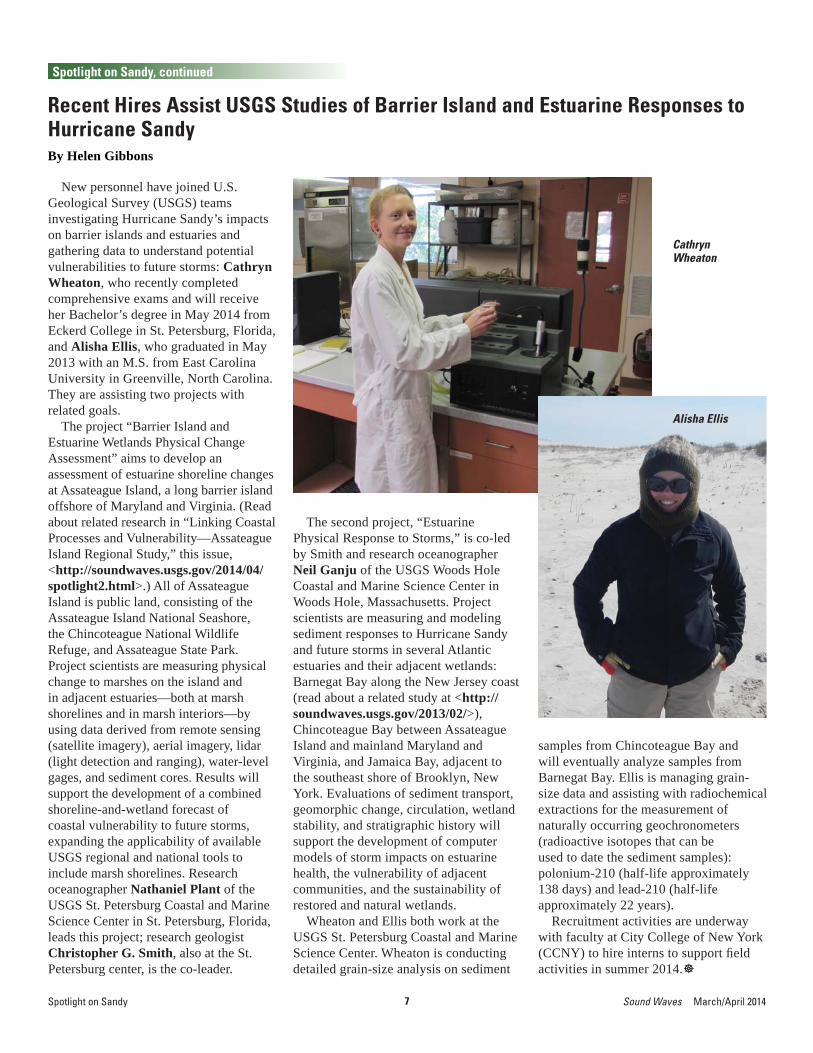
Aerial view of Assateague Island, looking north. Ocean City, Maryland, is visible in the far distance at top. Sinepuxent Bay lies between the island’s western shore and the Delmarva Peninsula to the upper left. Photograph taken in 1998 by Susanne Bledsoe, U.S. Army Corps of Engineers (more information at <http://en.wikipedia.org/wiki/File:Assateague_Island_aerial_view.jpg>).
of sediment and rock beneath the seafl oor. Sediment samples and bottom photographs will be collected for use in confi rming interpretations of the geophysical data. The researchers will use their fi ndings to improve understanding of where the region’s beach and barrier-island sediment comes from and where it is lost from the coastal system. They will also identify links between the regional geologic framework (the composition and characteristics of sediment and rock underlying the region) and rates and patterns of coastal change.
information to better inform interpretations of geophysical data. A large discussion is also underway among the USGS, The Nature Conservancy’s Virginia Coast Reserve, Chincoteague National Wildlife Refuge, Assateague Island National Seashore, and NASA’s Wallops Flight Facility about connecting stakeholder interests to the development of online data portals and decision-support tools that can inform both short- and long-term management plans.
Stay tuned!
7 Sound Waves March/April 2014
Recent Hires Assist USGS Studies of Barrier Island and Estuarine Responses to Hurricane SandyBy Helen Gibbons
New personnel have joined U.S. Geological Survey (USGS) teams investigating Hurricane Sandy’s impacts on barrier islands and estuaries and gathering data to understand potential vulnerabilities to future storms: Cathryn Wheaton, who recently completed comprehensive exams and will receive her Bachelor’s degree in May 2014 from Eckerd College in St. Petersburg, Florida, and Alisha Ellis, who graduated in May 2013 with an M.S. from East Carolina University in Greenville, North Carolina. They are assisting two projects with related goals.
The project “Barrier Island and Estuarine Wetlands Physical Change Assessment” aims to develop an assessment of estuarine shoreline changes at Assateague Island, a long barrier island offshore of Maryland and Virginia. (Read about related research in “Linking Coastal Processes and Vulnerability—Assateague Island Regional Study,” this issue, <http://soundwaves.usgs.gov/2014/04/spotlight2.html>.) All of Assateague Island is public land, consisting of the Assateague Island National Seashore, the Chincoteague National Wildlife Refuge, and Assateague State Park. Project scientists are measuring physical change to marshes on the island and in adjacent estuaries—both at marsh shorelines and in marsh interiors—by using data derived from remote sensing (satellite imagery), aerial imagery, lidar (light detection and ranging), water-level gages, and sediment cores. Results will support the development of a combined shoreline-and-wetland forecast of coastal vulnerability to future storms, expanding the applicability of available USGS regional and national tools to include marsh shorelines. Research oceanographer Nathaniel Plant of the USGS St. Petersburg Coastal and Marine Science Center in St. Petersburg, Florida, leads this project; research geologist Christopher G. Smith, also at the St. Petersburg center, is the co-leader.
samples from Chincoteague Bay and will eventually analyze samples from Barnegat Bay. Ellis is managing grain-size data and assisting with radiochemical extractions for the measurement of naturally occurring geochronometers (radioactive isotopes that can be used to date the sediment samples): polonium-210 (half-life approximately 138 days) and lead-210 (half-life approximately 22 years).
Recruitment activities are underway with faculty at City College of New York (CCNY) to hire interns to support fi eld activities in summer 2014.
Cathryn Wheaton
The second project, “Estuarine Physical Response to Storms,” is co-led by Smith and research oceanographer Neil Ganju of the USGS Woods Hole Coastal and Marine Science Center in Woods Hole, Massachusetts. Project scientists are measuring and modeling sediment responses to Hurricane Sandy and future storms in several Atlantic estuaries and their adjacent wetlands: Barnegat Bay along the New Jersey coast (read about a related study at <http://soundwaves.usgs.gov/2013/02/>), Chincoteague Bay between Assateague Island and mainland Maryland and Virginia, and Jamaica Bay, adjacent to the southeast shore of Brooklyn, New York. Evaluations of sediment transport, geomorphic change, circulation, wetland stability, and stratigraphic history will support the development of computer models of storm impacts on estuarine health, the vulnerability of adjacent communities, and the sustainability of restored and natural wetlands.
Wheaton and Ellis both work at the USGS St. Petersburg Coastal and Marine Science Center. Wheaton is conducting detailed grain-size analysis on sediment
Alisha Ellis
Spotlight on Sandy, continued
Spotlight on Sandy
8March/April 2014 Sound Waves
EDEN and EVE – Getting the Water Right in ParadiseBy Heather Henkel
In the winter months, it’s easy to un-derstand why people fl ock to the vibrant paradise that is south Florida. At the heart of that paradise is a vast landscape of end-less marshes, dense mangroves, towering palms, and tropical fauna—the Everglades. This watery wonder, however, has been al-tered over the past 100 years by the devel-opment of canals and levees, built to pro-vide fl ood control and water management. The Everglades’ natural fl ow of freshwater has been disrupted and drained off to the coasts, degrading the wetlands that so much wildlife depended upon. The current Everglades are still a paradise to many, but the Everglades of the past no longer exist. The need to preserve south Florida’s natural ecosystems, combined with man-aging water supply and fl ood controls, pushed agencies and organizations in the late 1990s to come together and develop a plan to restore the Everglades. In 2000, the Comprehensive Everglades Restoration Plan (CERP; <http://www.evergladesplan.org/>) was approved.
Successful restoration of the Everglades depends on restoring or approximating
the former natural volume, timing, and distribution of wetland sheetfl ow—the downslope movement of water as a con-tinuous fi lm over the land surface—and the corresponding response of the eco-system. Critical to this process is the Everglades Depth Estimation Network (EDEN; <http://sofi a.usgs.gov/eden/>), which provides online water-depth infor-mation for the entire freshwater portion of the Greater Everglades. Water depth is the difference between the ground-surface el-evation and the water-surface elevation, or water level. Water levels in the Everglades vary in response to such factors as rainfall and releases of water from canals and le-
vees. They greatly affect the ecology and biology of the region: too much or too lit-tle water will determine whether alligators can lay their eggs, whether wading birds can nest—in general, whether the condi-tions are right to support the ecosystem.
Real-time water-level measurements are provided to EDEN from a network of more than 280 gages maintained by mul-tiple State and Federal agencies, including the South Florida Water Management Dis-trict, the U.S. Geological Survey (USGS), Everglades National Park, and Big Cy-press National Preserve. To estimate water depths, EDEN integrates the real-time water-level data with ground-elevation and real-time water-surface modeling. (Learn more from the Sound Waves story at <http://soundwaves.usgs.gov/2008/03/pubs.html> and the USGS Fact Sheet at <http://sofi a.usgs.gov/publications/fs/2006-3087/>.) This integration provides scientists and managers with carefully estimated water depths from 1991 to the present for the entire freshwater portion of the greater Everglades, all available online. Presenting the integrated data on a 400-meter grid spacing, EDEN offers a consistent and documented dataset that can be applied by scientists and managers to guide large-scale fi eld operations, to in-tegrate data on hydrologic (water-related) and ecological responses, and to support biological and ecological assessments. Data from EDEN assist the measurement of ecosystem response for the implementa-tion of CERP.
Two recent additions to EDEN, described here, showcase the value of hydrologic in-formation and how it can be used.
Pine forest in Everglades National Park. USGS photograph by Heather Henkel.
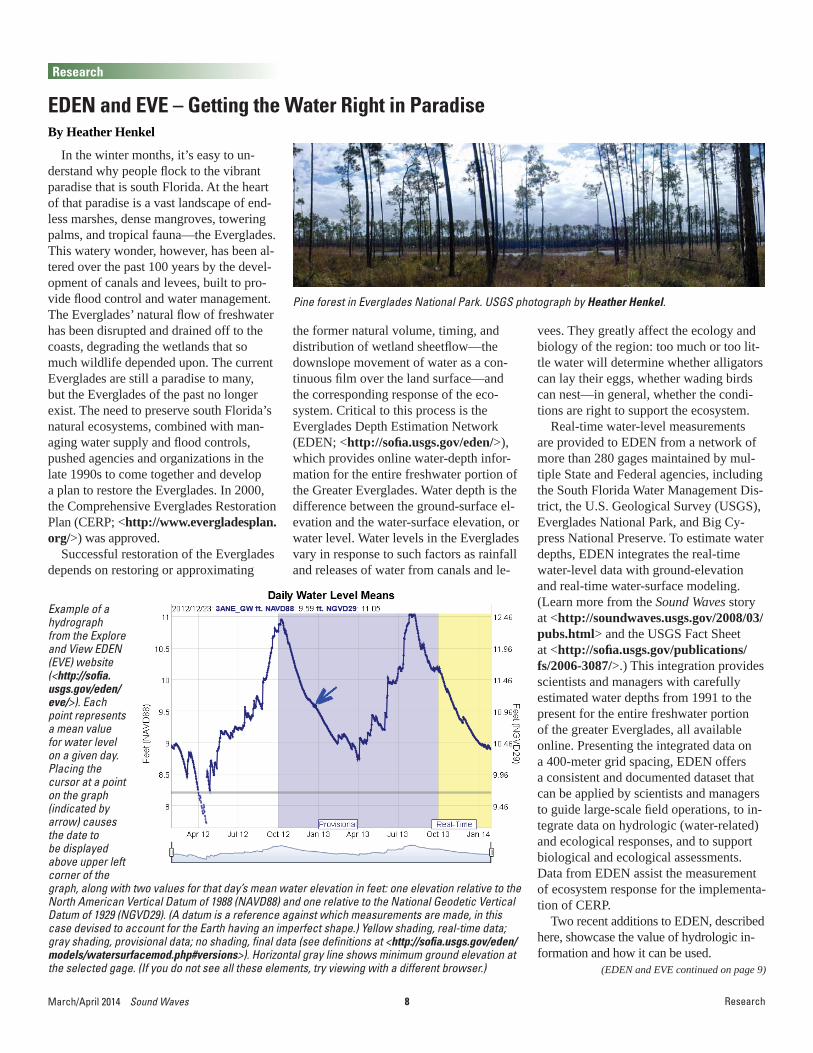
Example of a hydrograph from the Explore and View EDEN (EVE) website (<http://sofi a.usgs.gov/eden/eve/>). Each point represents a mean value for water level on a given day. Placing the cursor at a point on the graph (indicated by arrow) causes the date to be displayed above upper left corner of the graph, along with two values for that day’s mean water elevation in feet: one elevation relative to the North American Vertical Datum of 1988 (NAVD88) and one relative to the National Geodetic Vertical Datum of 1929 (NGVD29). (A datum is a reference against which measurements are made, in this case devised to account for the Earth having an imperfect shape.) Yellow shading, real-time data; gray shading, provisional data; no shading, fi nal data (see defi nitions at <http://sofi a.usgs.gov/eden/models/watersurfacemod.php#versions>). Horizontal gray line shows minimum ground elevation at the selected gage. (If you do not see all these elements, try viewing with a different browser.)
Research
Research
(EDEN and EVE continued on page 9)
9 Sound Waves March/April 2014
Explore and View EDEN (EVE) One of the main components of EDEN
is its distributed gage network. Water-level (gage) data are collected from multiple agencies and provided on the EDEN website to serve scientists, managers, and the public. The ability to view historical as well as recent hydrologic data allows users to observe trends as well as current conditions. The EDEN team, led by Bryan McCloskey of the USGS St. Petersburg Coastal and Marine Science Center in St. Petersburg, Florida, recently developed the Explore and View EDEN (EVE) web application (<http://sofi a.usgs.gov/eden/eve/>) to allow users to visualize this hydrologic information alongside supple-mental information. At the center of a typi-cal EVE webpage is a hydrograph (a graph showing change in a hydrologic variable over time) that displays daily mean water levels. (See example on page 8.) Ground elevation is plotted on the hydrograph to allow users to see when a gage is dry. Rainfall and evapotranspiration data can also be displayed, presenting a more com-plete picture of the water cycle.
Users of EVE specify a date range, select a gage or a group of gages (useful when viewing regional hydrology), select the parameters that interest them, and then choose whether to view the data graphically, in a table, or both. The data are also available for download. Provisional data and real-time data are color-coded to bring attention to the status of the gage data. (Real-time data have received little or no review; provisional data have received some review. Both data types may undergo substantial revision before they are considered fi nal; see <http://sofi a.usgs.gov/eden/models/watersurfacemod.php#versions>.) The hydrograph view is also interactive, allowing the user to move the mouse over the hydrograph to obtain readings for specifi c days. Clicking and dragging the hydrograph zooms in or out of the hydrograph. There is also a smaller hydrograph that lets users zoom in to a narrower range of dates.
Monitoring Water Levels at Tree IslandsWhen a new water-control plan was
instituted in 2012 as a part of CERP,
State and Federal agencies needed a real-time reporting tool for monitoring water levels at tree islands—areas formed by a slight rise in elevation that results in less frequent fl ooding and allows woody shrubs and trees to take hold. Local Native American tribes have used tree islands in the Everglades as burial sites for human remains and funerary objects and have expressed strong objection to the unnatural inundation of tree islands under current or future Everglades ecosystem restoration. At the request of local tribes, the USGS recently developed an EDEN application (<http://sofi a.usgs.gov/eden/water_lev-el_percentiles_map.php>) that reports near-real-time inundation at about 400 tree islands in two Water Conservation Areas and Everglades National Park. The maxi-mum ground elevation at each tree island is compared with the daily water level modeled by EDEN to determine if the tree island has been inundated. An automated email (<http://sofi a.usgs.gov/eden/wa-ter_level_percentiles_alert.php>) is sent to stakeholders to report tree islands that have been inundated each day. In addition, the EDEN website provides users with access to a map of the impact area where
tree islands are color-coded for the status of inundation on a daily basis.
To learn more about USGS research in the Everglades, read “Science in Support of Everglades Restoration—Some Con-tributions from the USGS in Florida” at <http://soundwaves.usgs.gov/2011/11/research.html>, visit the South Florida Information Access (SOFIA) Integrated Science for the Greater Everglades web-site at <http://sofi a.usgs.gov/>, and visit the EDEN website at <http://sofi a.usgs.gov/eden/>.
Distant view of a tree island—an area that can support woody shrubs and trees because of its slightly higher elevation. USGS photograph by Heather Henkel.
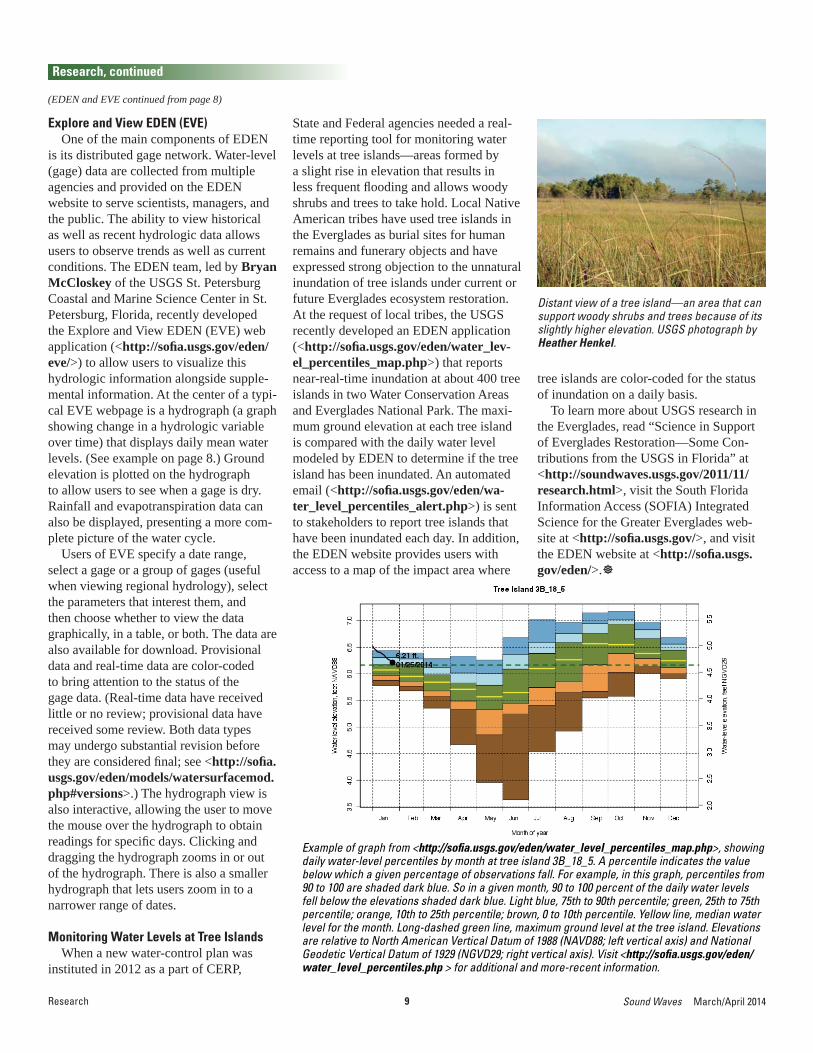
Example of graph from <http://sofi a.usgs.gov/eden/water_level_percentiles_map.php>, showing daily water-level percentiles by month at tree island 3B_18_5. A percentile indicates the value below which a given percentage of observations fall. For example, in this graph, percentiles from 90 to 100 are shaded dark blue. So in a given month, 90 to 100 percent of the daily water levels fell below the elevations shaded dark blue. Light blue, 75th to 90th percentile; green, 25th to 75th percentile; orange, 10th to 25th percentile; brown, 0 to 10th percentile. Yellow line, median water level for the month. Long-dashed green line, maximum ground level at the tree island. Elevations are relative to North American Vertical Datum of 1988 (NAVD88; left vertical axis) and National Geodetic Vertical Datum of 1929 (NGVD29; right vertical axis). Visit <http://sofi a.usgs.gov/eden/water_level_percentiles.php > for additional and more-recent information.
Research
(EDEN and EVE continued from page 8)
Research, continued
10March/April 2014 Sound Waves
“Ultra Marathon Champion” Bird May Plan Flights Based on Weather Across the Pacifi c By John Pearce, Robert Gill, David Douglas, Colleen Handel, and Lee Tibbitts
A recent U.S. Geological Survey (USGS)-led study of the Bar-tailed Godwit, a shorebird known famously as the ultimate marathon champion of bird fl ight, suggests that these birds can sense broad weather patterns and optimally time their long, nonstop, transoceanic migrations to destinations thousands of miles away.
Like airplane pilots examining weather charts for the course ahead, godwits wait-ing to take fl ight ultimately selected dates of departure that corresponded to the best atmospheric wind conditions possible within a two-week window. Remarkably, not only were the conditions optimal for takeoff, but they almost always provided the best possible conditions for the birds’ entire transoceanic fl ights.
“We think that these behaviors repre-sent a previously unknown cognitive abil-ity that allows Bar-tailed Godwits to as-sess changes in weather conditions across widely separated atmospheric regions in different parts of the Pacifi c Ocean and to time their migration patterns accord-ingly,” said Robert Gill, Jr., an emeritus scientist with the USGS and lead author of the study.
These fi ndings are part of a recent sci-entifi c publication by collaborators from the USGS, the National Oceanic and At-mospheric Administration, the University
of Groningen (in the Netherlands), and the NIOZ Royal Netherlands Institute for Sea Research. The researchers used de-tailed information on individuals tracked by satellite transmitters, along with data on wind conditions across the Pacifi c Ocean, to investigate migration patterns along the 18,000-mile annual route of the Bar-tailed Godwit. Their study deter-
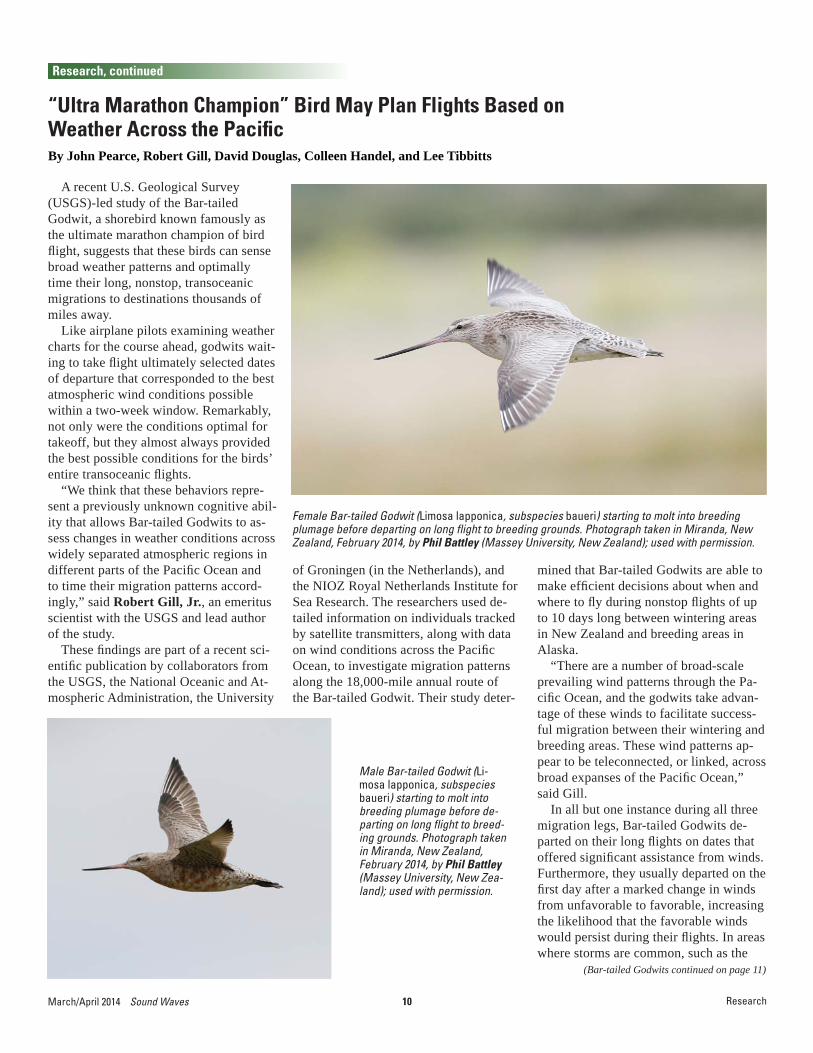
Female Bar-tailed Godwit (Limosa lapponica, subspecies baueri) starting to molt into breeding plumage before departing on long fl ight to breeding grounds. Photograph taken in Miranda, New Zealand, February 2014, by Phil Battley (Massey University, New Zealand); used with permission.
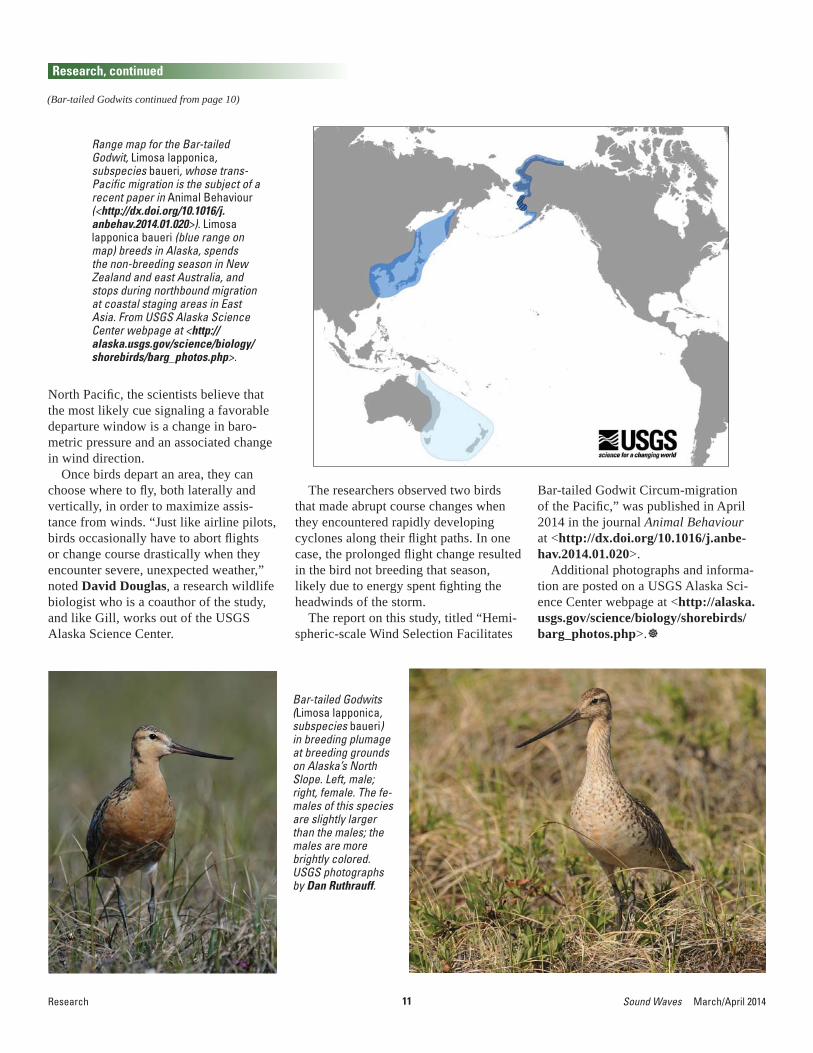
Male Bar-tailed Godwit (Li-mosa lapponica, subspecies baueri) starting to molt into breeding plumage before de-parting on long fl ight to breed-ing grounds. Photograph taken in Miranda, New Zealand, February 2014, by Phil Battley (Massey University, New Zea-land); used with permission.
mined that Bar-tailed Godwits are able to make effi cient decisions about when and where to fl y during nonstop fl ights of up to 10 days long between wintering areas in New Zealand and breeding areas in Alaska.
“There are a number of broad-scale prevailing wind patterns through the Pa-cifi c Ocean, and the godwits take advan-tage of these winds to facilitate success-ful migration between their wintering and breeding areas. These wind patterns ap-pear to be teleconnected, or linked, across broad expanses of the Pacifi c Ocean,” said Gill.
In all but one instance during all three migration legs, Bar-tailed Godwits de-parted on their long fl ights on dates that offered signifi cant assistance from winds. Furthermore, they usually departed on the fi rst day after a marked change in winds from unfavorable to favorable, increasing the likelihood that the favorable winds would persist during their fl ights. In areas where storms are common, such as the
Research, continued
Research
(Bar-tailed Godwits continued on page 11)
11 Sound Waves March/April 2014
North Pacifi c, the scientists believe that the most likely cue signaling a favorable departure window is a change in baro-metric pressure and an associated change in wind direction.
Once birds depart an area, they can choose where to fl y, both laterally and vertically, in order to maximize assis-tance from winds. “Just like airline pilots, birds occasionally have to abort fl ights or change course drastically when they encounter severe, unexpected weather,” noted David Douglas, a research wildlife biologist who is a coauthor of the study, and like Gill, works out of the USGS Alaska Science Center.
The researchers observed two birds that made abrupt course changes when they encountered rapidly developing cyclones along their fl ight paths. In one case, the prolonged fl ight change resulted in the bird not breeding that season, likely due to energy spent fi ghting the headwinds of the storm.
The report on this study, titled “Hemi-spheric-scale Wind Selection Facilitates
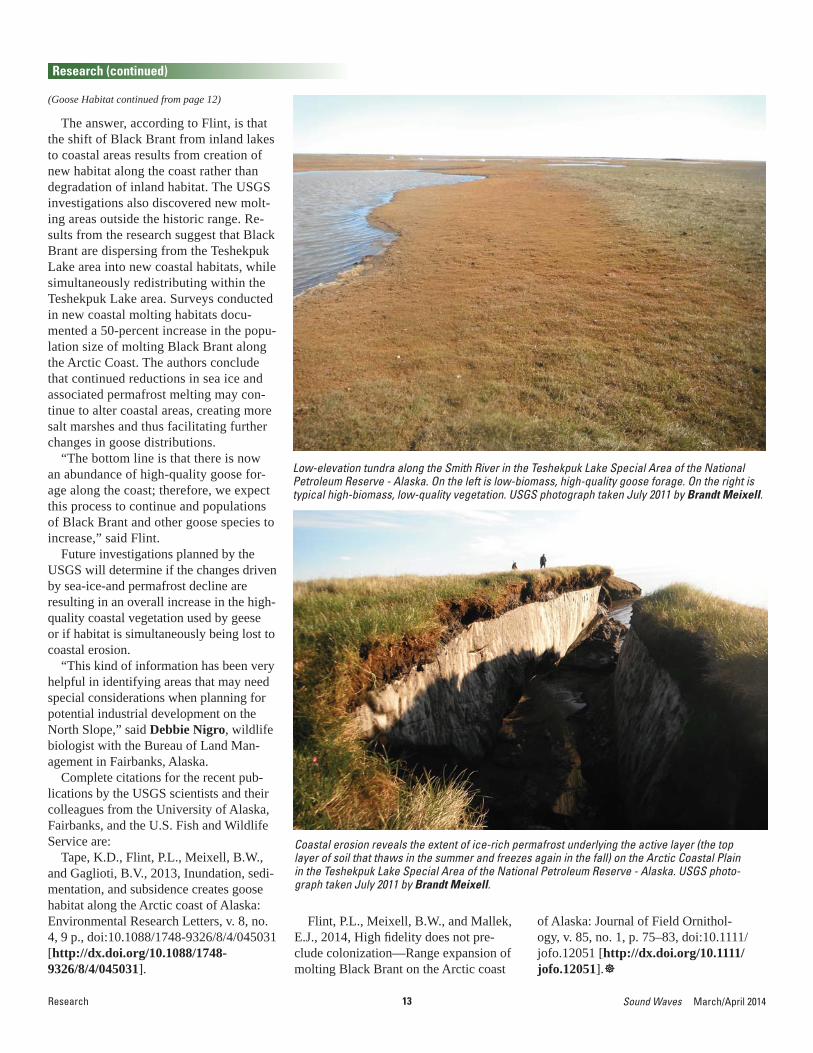
Range map for the Bar-tailed Godwit, Limosa lapponica, subspecies baueri, whose trans-Pacifi c migration is the subject of a recent paper in Animal Behaviour (<http://dx.doi.org/10.1016/j.anbehav.2014.01.020>). Limosa lapponica baueri (blue range on map) breeds in Alaska, spends the non-breeding season in New Zealand and east Australia, and stops during northbound migration at coastal staging areas in East Asia. From USGS Alaska Science Center webpage at <http://alaska.usgs.gov/science/biology/shorebirds/barg_photos.php>.
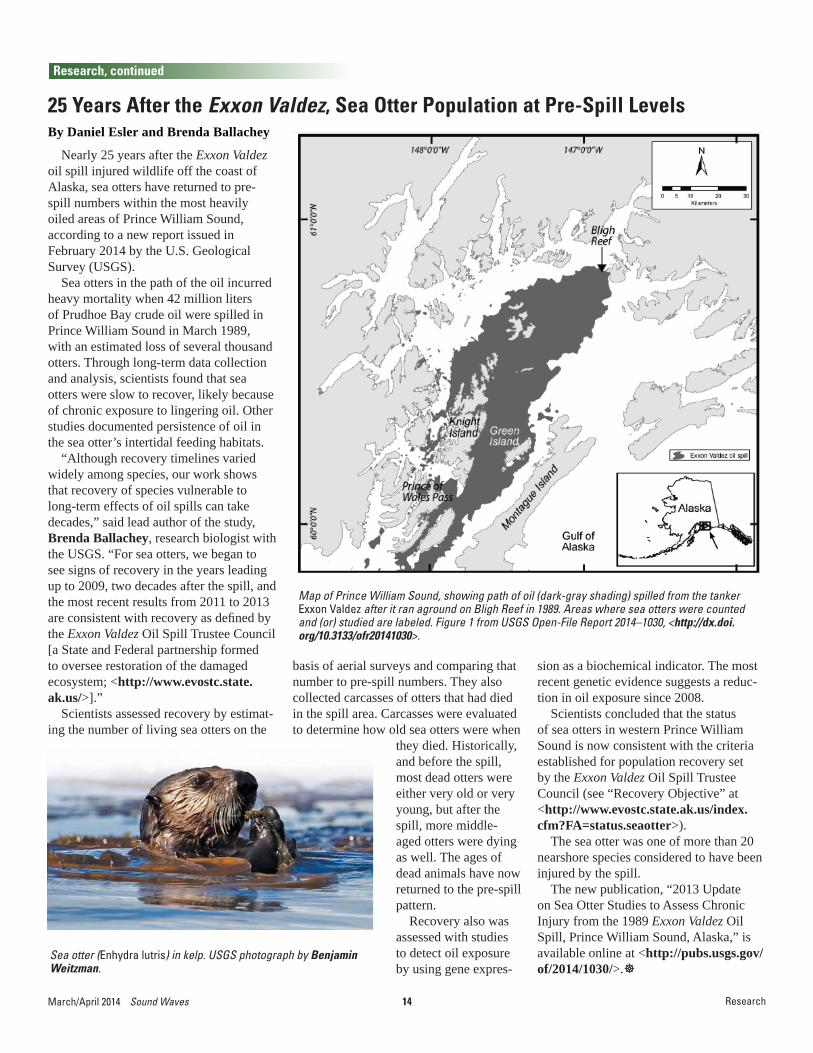
Bar-tailed Godwits (Limosa lapponica, subspecies baueri) in breeding plumage at breeding grounds on Alaska’s North Slope. Left, male; right, female. The fe-males of this species are slightly larger than the males; the males are more brightly colored. USGS photographs by Dan Ruthrauff.
Bar-tailed Godwit Circum-migration of the Pacifi c,” was published in April 2014 in the journal Animal Behaviour at <http://dx.doi.org/10.1016/j.anbe-hav.2014.01.020>.
Additional photographs and informa-tion are posted on a USGS Alaska Sci-ence Center webpage at <http://alaska.usgs.gov/science/biology/shorebirds/barg_photos.php>.
Research, continued
Research
(Bar-tailed Godwits continued from page 10)

12March/April 2014 Sound Waves
Sea-Ice Decline and Permafrost Thaw Create Goose Habitat in Arctic Alaska By John Pearce (USGS), Paul Flint (USGS), and Ken Tape (University of Alaska Fairbanks)
Warming temperatures are leading to the creation of high-quality habitats for geese along the Arctic coast of Alaska, according to scientists with the U.S. Geological Survey (USGS). This effect is in contrast to the deleterious impacts that warming global temperatures are having on the habitats of animals that depend on sea ice, such as polar bear and walrus. In response to the new habitats, goose distributions are shifting from inland lakes to coastal marshes. Additionally, geese are expanding their range beyond the area historically used to assess their numbers.
The USGS research fi ndings—reported in the journal Environmental Research Letters in December 2013 (<http://dx.doi.org/10.1088/1748-9326/8/4/045031>) and the Journal of Field Ornithology in January 2014 (<http://dx.doi.org/10.1111/jofo.12051>)—focus on Black Brant geese (Branta bernicla nigricans). These birds migrate by the thousands each summer to the Arctic Coastal Plain of Alaska to undergo their wing molt, during which they are fl ightless for three weeks. While they are molting, the birds require extensive open-water areas where they can escape from predators and high-quality food to give them the energy necessary to replace worn feathers.
Since the 1970s, the U.S. Fish and Wildlife Service has noted a shift in the distribution of Black Brant geese near Teshekpuk Lake, a large lake southeast of Barrow, Alaska, in the center of the Arc-tic Coastal Plain and within the National Petroleum Reserve. The most obvious change has been that geese are moving away from large inland lakes to coastal salt marshes.
“This was a case where we knew from the long-term survey data that geese were shifting their molting distribution, but ‘why’ was the question,” says Paul Flint, a research wildlife biologist with the USGS and one of the authors of the new reports.
Teshekpuk LakeSmith
River
Traditional survey area
Black Brant geese (Branta bernicla nigricans) congregate to molt their fl ight feathers in the Teshekpuk Lake Special Area of the National Petroleum Reserve, Alaska. The geese have shifted their distribution to take advantage of recently formed habitat in estuarine areas along the Arctic Coastal Plain. USGS photograph taken July 2008 by Tyler Lewis.
Location of Teshekpuk Lake within National Petroleum Reserve - Alaska. Data collected since 2010 show that signifi cant numbers of Black Brant geese molt outside the “traditional survey area” (bounded by orange line) where molting birds have been counted since 1976 (see Journal of Field Ornithology article at <http://dx.doi.org/10.1111/jofo.12051>). Base map courtesy of the Bureau of Land Management (<http://www.blm.gov/ak/st/en/prog/planning/npra_general.html>).
Research
(Goose Habitat continued on page 13)
Research, continued
13 Sound Waves March/April 2014
The answer, according to Flint, is that the shift of Black Brant from inland lakes to coastal areas results from creation of new habitat along the coast rather than degradation of inland habitat. The USGS investigations also discovered new molt-ing areas outside the historic range. Re-sults from the research suggest that Black Brant are dispersing from the Teshekpuk Lake area into new coastal habitats, while simultaneously redistributing within the Teshekpuk Lake area. Surveys conducted in new coastal molting habitats docu-mented a 50-percent increase in the popu-lation size of molting Black Brant along the Arctic Coast. The authors conclude that continued reductions in sea ice and associated permafrost melting may con-tinue to alter coastal areas, creating more salt marshes and thus facilitating further changes in goose distributions.
“The bottom line is that there is now an abundance of high-quality goose for-age along the coast; therefore, we expect this process to continue and populations of Black Brant and other goose species to increase,” said Flint.
Future investigations planned by the USGS will determine if the changes driven by sea-ice-and permafrost decline are resulting in an overall increase in the high-quality coastal vegetation used by geese or if habitat is simultaneously being lost to coastal erosion.
“This kind of information has been very helpful in identifying areas that may need special considerations when planning for potential industrial development on the North Slope,” said Debbie Nigro, wildlife biologist with the Bureau of Land Man-agement in Fairbanks, Alaska.
Complete citations for the recent pub-lications by the USGS scientists and their colleagues from the University of Alaska, Fairbanks, and the U.S. Fish and Wildlife Service are:
Tape, K.D., Flint, P.L., Meixell, B.W., and Gaglioti, B.V., 2013, Inundation, sedi-mentation, and subsidence creates goose habitat along the Arctic coast of Alaska: Environmental Research Letters, v. 8, no. 4, 9 p., doi:10.1088/1748-9326/8/4/045031 [http://dx.doi.org/10.1088/1748-9326/8/4/045031].
Low-elevation tundra along the Smith River in the Teshekpuk Lake Special Area of the National Petroleum Reserve - Alaska. On the left is low-biomass, high-quality goose forage. On the right is typical high-biomass, low-quality vegetation. USGS photograph taken July 2011 by Brandt Meixell.
Coastal erosion reveals the extent of ice-rich permafrost underlying the active layer (the top layer of soil that thaws in the summer and freezes again in the fall) on the Arctic Coastal Plain in the Teshekpuk Lake Special Area of the National Petroleum Reserve - Alaska. USGS photo-graph taken July 2011 by Brandt Meixell.
Flint, P.L., Meixell, B.W., and Mallek, E.J., 2014, High fi delity does not pre-clude colonization—Range expansion of molting Black Brant on the Arctic coast
of Alaska: Journal of Field Ornithol-ogy, v. 85, no. 1, p. 75–83, doi:10.1111/jofo.12051 [http://dx.doi.org/10.1111/jofo.12051].
Research
Research (continued)
(Goose Habitat continued from page 12)
14March/April 2014 Sound Waves
25 Years After the Exxon Valdez, Sea Otter Population at Pre-Spill LevelsBy Daniel Esler and Brenda Ballachey
Nearly 25 years after the Exxon Valdez oil spill injured wildlife off the coast of Alaska, sea otters have returned to pre-spill numbers within the most heavily oiled areas of Prince William Sound, according to a new report issued in February 2014 by the U.S. Geological Survey (USGS).
Sea otters in the path of the oil incurred heavy mortality when 42 million liters of Prudhoe Bay crude oil were spilled in Prince William Sound in March 1989, with an estimated loss of several thousand otters. Through long-term data collection and analysis, scientists found that sea otters were slow to recover, likely because of chronic exposure to lingering oil. Other studies documented persistence of oil in the sea otter’s intertidal feeding habitats.
“Although recovery timelines varied widely among species, our work shows that recovery of species vulnerable to long-term effects of oil spills can take decades,” said lead author of the study, Brenda Ballachey, research biologist with the USGS. “For sea otters, we began to see signs of recovery in the years leading up to 2009, two decades after the spill, and the most recent results from 2011 to 2013 are consistent with recovery as defi ned by the Exxon Valdez Oil Spill Trustee Council [a State and Federal partnership formed to oversee restoration of the damaged ecosystem; <http://www.evostc.state.ak.us/>].”
Scientists assessed recovery by estimat-ing the number of living sea otters on the
basis of aerial surveys and comparing that number to pre-spill numbers. They also collected carcasses of otters that had died in the spill area. Carcasses were evaluated to determine how old sea otters were when
Sea otter (Enhydra lutris) in kelp. USGS photograph by Benjamin Weitzman.
Map of Prince William Sound, showing path of oil (dark-gray shading) spilled from the tanker Exxon Valdez after it ran aground on Bligh Reef in 1989. Areas where sea otters were counted and (or) studied are labeled. Figure 1 from USGS Open-File Report 2014–1030, <http://dx.doi.org/10.3133/ofr20141030>.
sion as a biochemical indicator. The most recent genetic evidence suggests a reduc-tion in oil exposure since 2008.
Scientists concluded that the status of sea otters in western Prince William Sound is now consistent with the criteria established for population recovery set by the Exxon Valdez Oil Spill Trustee Council (see “Recovery Objective” at <http://www.evostc.state.ak.us/index.cfm?FA=status.seaotter>).
The sea otter was one of more than 20 nearshore species considered to have been injured by the spill.
The new publication, “2013 Update on Sea Otter Studies to Assess Chronic Injury from the 1989 Exxon Valdez Oil Spill, Prince William Sound, Alaska,” is available online at <http://pubs.usgs.gov/of/2014/1030/>.
they died. Historically, and before the spill, most dead otters were either very old or very young, but after the spill, more middle-aged otters were dying as well. The ages of dead animals have now returned to the pre-spill pattern.
Recovery also was assessed with studies to detect oil exposure by using gene expres-
Research
Research, continued
15 Sound Waves March/April 2014
USGS Intern Teaches Kids about Ocean Acidifi cation By Macy Carter and Lisa Robbins
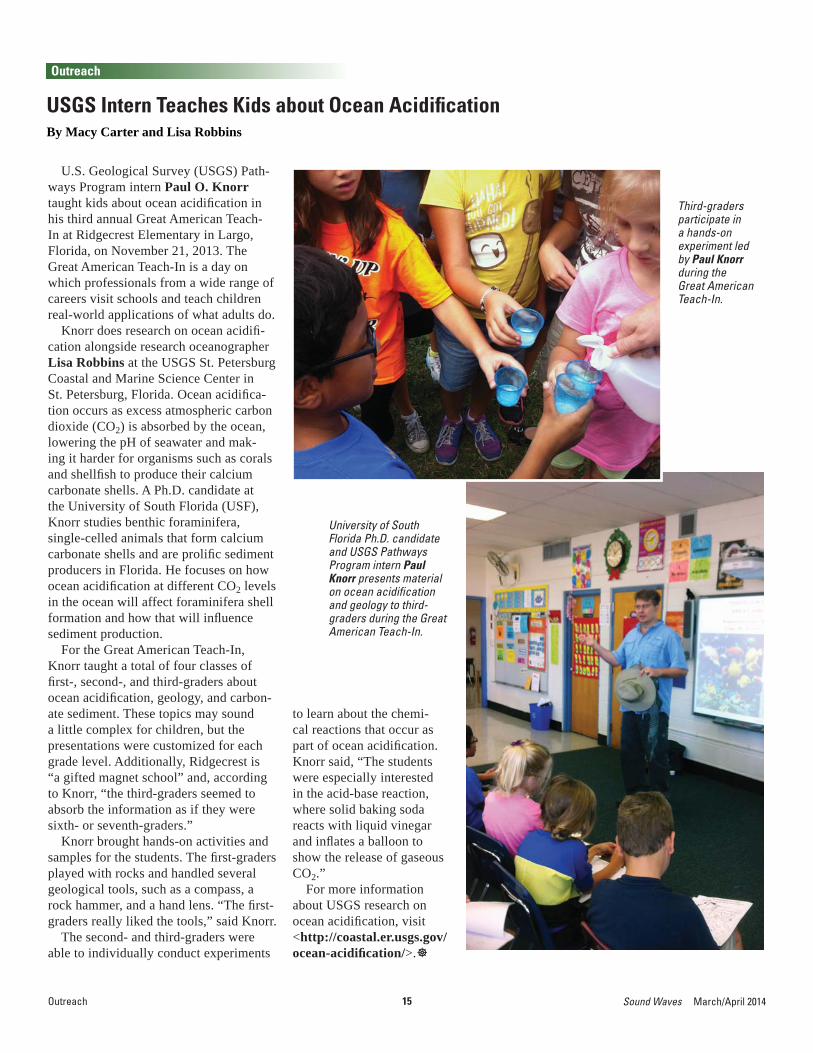
U.S. Geological Survey (USGS) Path-ways Program intern Paul O. Knorr taught kids about ocean acidifi cation in his third annual Great American Teach-In at Ridgecrest Elementary in Largo, Florida, on November 21, 2013. The Great American Teach-In is a day on which professionals from a wide range of careers visit schools and teach children real-world applications of what adults do.
Knorr does research on ocean acidifi -cation alongside research oceanographer Lisa Robbins at the USGS St. Petersburg Coastal and Marine Science Center in St. Petersburg, Florida. Ocean acidifi ca-tion occurs as excess atmospheric carbon dioxide (CO2) is absorbed by the ocean, lowering the pH of seawater and mak-ing it harder for organisms such as corals and shellfi sh to produce their calcium carbonate shells. A Ph.D. candidate at the University of South Florida (USF), Knorr studies benthic foraminifera, single-celled animals that form calcium carbonate shells and are prolifi c sediment producers in Florida. He focuses on how ocean acidifi cation at different CO2 levels in the ocean will affect foraminifera shell formation and how that will infl uence sediment production.
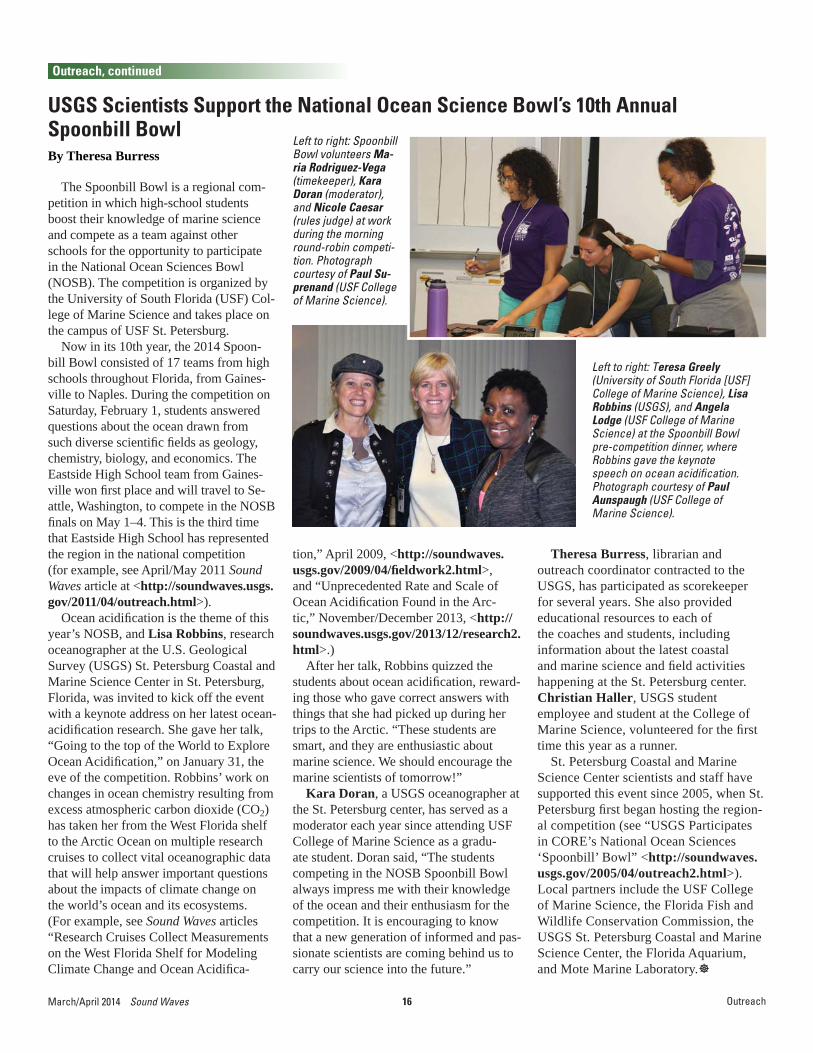
For the Great American Teach-In, Knorr taught a total of four classes of fi rst-, second-, and third-graders about ocean acidifi cation, geology, and carbon-ate sediment. These topics may sound a little complex for children, but the presentations were customized for each grade level. Additionally, Ridgecrest is “a gifted magnet school” and, according to Knorr, “the third-graders seemed to absorb the information as if they were sixth- or seventh-graders.”
Knorr brought hands-on activities and samples for the students. The fi rst-graders played with rocks and handled several geological tools, such as a compass, a rock hammer, and a hand lens. “The fi rst-graders really liked the tools,” said Knorr.
The second- and third-graders were able to individually conduct experiments
University of South Florida Ph.D. candidate and USGS Pathways Program intern Paul Knorr presents material on ocean acidifi cation and geology to third-graders during the Great American Teach-In.
Third-graders participate in a hands-on experiment led by Paul Knorr during the Great American Teach-In.
to learn about the chemi-cal reactions that occur as part of ocean acidifi cation. Knorr said, “The students were especially interested in the acid-base reaction, where solid baking soda reacts with liquid vinegar and infl ates a balloon to show the release of gaseous CO2.”
For more information about USGS research on ocean acidifi cation, visit <http://coastal.er.usgs.gov/ocean-acidifi cation/>.
Outreach
Outreach
16March/April 2014 Sound Waves
USGS Scientists Support the National Ocean Science Bowl’s 10th Annual Spoonbill BowlBy Theresa Burress
The Spoonbill Bowl is a regional com-petition in which high-school students boost their knowledge of marine science and compete as a team against other schools for the opportunity to participate in the National Ocean Sciences Bowl (NOSB). The competition is organized by the University of South Florida (USF) Col-lege of Marine Science and takes place on the campus of USF St. Petersburg.
Now in its 10th year, the 2014 Spoon-bill Bowl consisted of 17 teams from high schools throughout Florida, from Gaines-ville to Naples. During the competition on Saturday, February 1, students answered questions about the ocean drawn from such diverse scientifi c fi elds as geology, chemistry, biology, and economics. The Eastside High School team from Gaines-ville won fi rst place and will travel to Se-attle, Washington, to compete in the NOSB fi nals on May 1–4. This is the third time that Eastside High School has represented the region in the national competition (for example, see April/May 2011 Sound Waves article at <http://soundwaves.usgs.gov/2011/04/outreach.html>).
Ocean acidifi cation is the theme of this year’s NOSB, and Lisa Robbins, research oceanographer at the U.S. Geological Survey (USGS) St. Petersburg Coastal and Marine Science Center in St. Petersburg, Florida, was invited to kick off the event with a keynote address on her latest ocean-acidifi cation research. She gave her talk, “Going to the top of the World to Explore Ocean Acidifi cation,” on January 31, the eve of the competition. Robbins’ work on changes in ocean chemistry resulting from excess atmospheric carbon dioxide (CO2) has taken her from the West Florida shelf to the Arctic Ocean on multiple research cruises to collect vital oceanographic data that will help answer important questions about the impacts of climate change on the world’s ocean and its ecosystems. (For example, see Sound Waves articles “Research Cruises Collect Measurements on the West Florida Shelf for Modeling Climate Change and Ocean Acidifi ca-
tion,” April 2009, <http://soundwaves.usgs.gov/2009/04/fi eldwork2.html>, and “Unprecedented Rate and Scale of Ocean Acidifi cation Found in the Arc-tic,” November/December 2013, <http://soundwaves.usgs.gov/2013/12/research2.html>.)
After her talk, Robbins quizzed the students about ocean acidifi cation, reward-ing those who gave correct answers with things that she had picked up during her trips to the Arctic. “These students are smart, and they are enthusiastic about marine science. We should encourage the marine scientists of tomorrow!”
Kara Doran, a USGS oceanographer at the St. Petersburg center, has served as a moderator each year since attending USF College of Marine Science as a gradu-ate student. Doran said, “The students competing in the NOSB Spoonbill Bowl always impress me with their knowledge of the ocean and their enthusiasm for the competition. It is encouraging to know that a new generation of informed and pas-sionate scientists are coming behind us to carry our science into the future.”
Theresa Burress, librarian and outreach coordinator contracted to the USGS, has participated as scorekeeper for several years. She also provided educational resources to each of the coaches and students, including information about the latest coastal and marine science and fi eld activities happening at the St. Petersburg center. Christian Haller, USGS student employee and student at the College of Marine Science, volunteered for the fi rst time this year as a runner.
St. Petersburg Coastal and Marine Science Center scientists and staff have supported this event since 2005, when St. Petersburg fi rst began hosting the region-al competition (see “USGS Participates in CORE’s National Ocean Sciences ‘Spoonbill’ Bowl” <http://soundwaves.usgs.gov/2005/04/outreach2.html>). Local partners include the USF College of Marine Science, the Florida Fish and Wildlife Conservation Commission, the USGS St. Petersburg Coastal and Marine Science Center, the Florida Aquarium, and Mote Marine Laboratory.
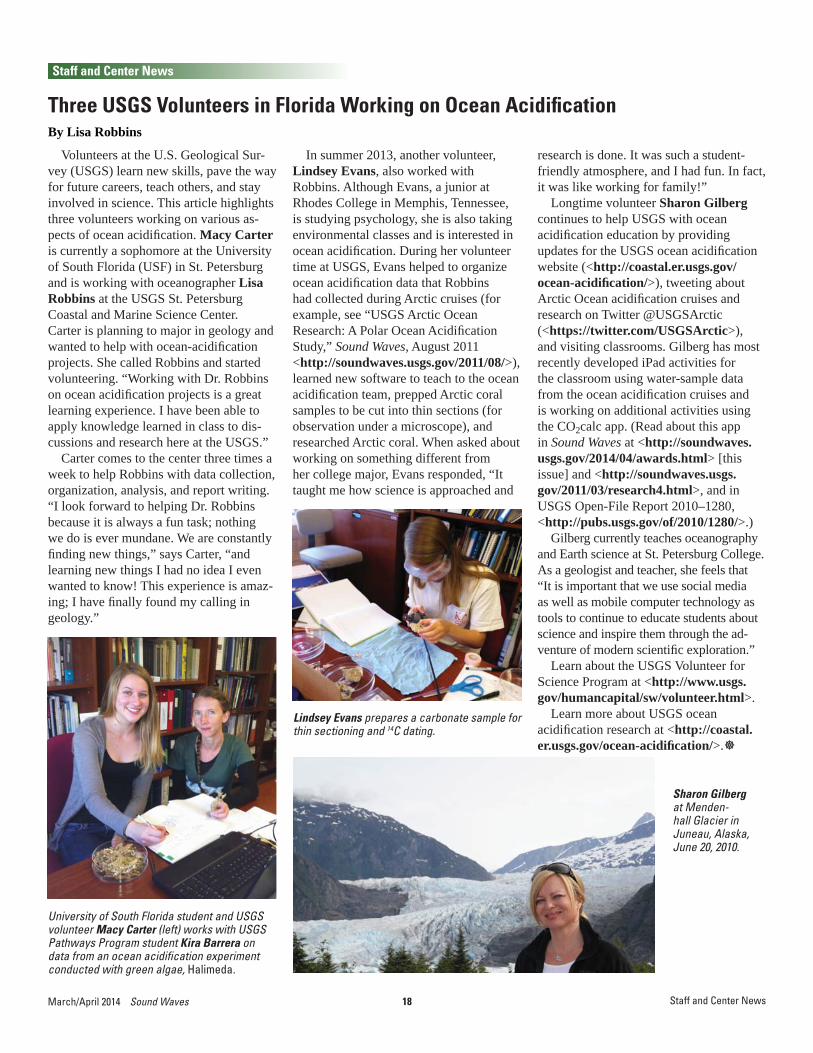
Left to right: Spoonbill Bowl volunteers Ma-ria Rodriguez-Vega (timekeeper), Kara Doran (moderator), and Nicole Caesar (rules judge) at work during the morning round-robin competi-tion. Photograph courtesy of Paul Su-prenand (USF College of Marine Science).
Left to right: Teresa Greely (University of South Florida [USF] College of Marine Science), Lisa Robbins (USGS), and Angela Lodge (USF College of Marine Science) at the Spoonbill Bowl pre-competition dinner, where Robbins gave the keynote speech on ocean acidifi cation. Photograph courtesy of Paul Aunspaugh (USF College of Marine Science).
Outreach
Outreach, continued

17 Sound Waves March/April 2014Awards
Awards
Communications Awards Recognize Ocean Chemistry TopicsLeading scientists share research, tools, and fi ndings with critical audiences
By Ann Tihansky, Sharon Gilberg, and Lisa Robbins
[Reprinted from NEWSWAVE, NEWS FROM THE U.S. DEPARTMENT OF THE INTERIOR: OCEANS, COASTS AND GREAT LAKES, Winter 2014 <http://www.doi.gov/pmb/ocean/news/Newswave/>.]
Understanding Mercury Sources and Cycling
The U.S. Geological Survey (USGS) awarded the Shoemaker Award for Life-time Achievement in Communications to research geochemist David Krabbenhoft of the USGS Wisconsin Water Science Center for his monumental contributions in effectively communicating the science of mercury and continuing diverse work with ongoing, multiagency research on aquatic mercury.
Krabbenhoft has educated an interna-tional audience on the deleterious effects of mercury in the environment and was instru-mental in crafting a binding international treaty for the United Nations (UN) on re-ducing man-made mercury emissions. This treaty was signed by 140 nations.
Together with Congress, the media, State and local offi cials, other Federal agencies, members of the public, and international agencies such as the UN, Krabbenhoft’s ef-forts have increased awareness of the dan-gers of mercury, as well as improved the research in understanding the sources and fates of mercury contamination. In the past 23 years, Dave has authored or coauthored more than 100 papers on mercury in the en-vironment, and in 2006, served as co-chair for the 8th International Conference on Mercury as a Global Pollutant. He helped establish the USGS’s Mercury Research Laboratory in 1994.
[See a Sound Waves story about some of Krabbenhoft’s research, “Landmark Study Demonstrates How Methylmercury, Known to Contaminate Seafood, Forms in the Ocean,” at <http://soundwaves.usgs.gov/2009/08/>.]
Carbon Chemistry App “CO2calc” The USGS also recognized CO2calc, a
new mobile app, with a USGS Shoemaker
communications award. USGS scientist Lisa Robbins and her team developed the app to be used by students, scientists, or the citizen scientist to calculate CO2 param-eters in water from a mobile device, stream-lining fi eld operations by eliminating the need for bulky computing equipment that was needed in the past. [See related Sound Waves article at <http://soundwaves.usgs.gov/2011/03/research4.html>.]
The tool is just part of the work being done by scientists at the USGS in St. Pe-tersburg, Florida, as they collaborate with the University of South Florida (USF) researching the issue of ocean acidifi cation in the Arctic Ocean [see <http://coastal.er.usgs.gov/ocean-acidifi cation/>].
Ocean acidifi cation is a signifi cant threat to marine life due to the lowering of pH in ocean water due to the uptake of excess car-bon dioxide (CO2) from the atmosphere. As oceanic pH lowers, marine biota, particu-larly corals and shellfi sh, have a harder time making their shells. Thinner, more brittle shells could lead to increased predation and lower numbers of individuals.
Since 2010, USGS scientist Lisa Rob-bins and USF colleague Jonathan Wynn
have collected over 30,000 water samples during three research cruises in the Arctic Ocean to study ocean acidifi cation in the Canada Basin and the role that sea ice may play in ocean chemistry [for example, see <http://soundwaves.usgs.gov/2012/02/>]. Although excess CO2 is likely the major contributor to ocean acidifi cation in the Arctic Ocean, fresh water from melt-ing ice lowers the buffering capacity of seawater, making the two contributors a one-two punch in lowering the pH of the Arctic Ocean [see <http://soundwaves.usgs.gov/2013/12/research2.html>]. The USGS ocean acidifi cation research team has also focused on educational outreach with a twitter feed @USGSArctic, cruise journals, and resources for teachers lo-cated on the USGS Ocean Acidifi cation webpages: <http://coastal.er.usgs.gov/ocean-acidifi cation/polar.html>.
A conceptual model for mercury sources and cycling in the Pacifi c Ocean. Learn more about mercury cycling in coastal and marine systems at the USGS Wiscon-sin Water Science Center’s Coastal and Marine Research webpage: <http://wi.water.usgs.gov/mercury/coastal-and-marine-re-search.html>. Image credit: USGS.
The mobile app is available in iTunes, and a larger version for use on lap-tops and desktops is available on the USGS website at <http://pubs.usgs.gov/of/2010/1280/>.
18March/April 2014 Sound Waves
Staff and Center News
Staff and Center News
Volunteers at the U.S. Geological Sur-vey (USGS) learn new skills, pave the way for future careers, teach others, and stay involved in science. This article highlights three volunteers working on various as-pects of ocean acidifi cation. Macy Carter is currently a sophomore at the University of South Florida (USF) in St. Petersburg and is working with oceanographer Lisa Robbins at the USGS St. Petersburg Coastal and Marine Science Center. Carter is planning to major in geology and wanted to help with ocean-acidifi cation projects. She called Robbins and started volunteering. “Working with Dr. Robbins on ocean acidifi cation projects is a great learning experience. I have been able to apply knowledge learned in class to dis-cussions and research here at the USGS.”
Carter comes to the center three times a week to help Robbins with data collection, organization, analysis, and report writing. “I look forward to helping Dr. Robbins because it is always a fun task; nothing we do is ever mundane. We are constantly fi nding new things,” says Carter, “and learning new things I had no idea I even wanted to know! This experience is amaz-ing; I have fi nally found my calling in geology.”
In summer 2013, another volunteer, Lindsey Evans, also worked with Robbins. Although Evans, a junior at Rhodes College in Memphis, Tennessee, is studying psychology, she is also taking environmental classes and is interested in ocean acidifi cation. During her volunteer time at USGS, Evans helped to organize ocean acidifi cation data that Robbins had collected during Arctic cruises (for example, see “USGS Arctic Ocean Research: A Polar Ocean Acidifi cation Study,” Sound Waves, August 2011 <http://soundwaves.usgs.gov/2011/08/>), learned new software to teach to the ocean acidifi cation team, prepped Arctic coral samples to be cut into thin sections (for observation under a microscope), and researched Arctic coral. When asked about working on something different from her college major, Evans responded, “It taught me how science is approached and
research is done. It was such a student-friendly atmosphere, and I had fun. In fact, it was like working for family!”
Longtime volunteer Sharon Gilberg continues to help USGS with ocean acidifi cation education by providing updates for the USGS ocean acidifi cation website (<http://coastal.er.usgs.gov/ocean-acidifi cation/>), tweeting about Arctic Ocean acidifi cation cruises and research on Twitter @USGSArctic (<https://twitter.com/USGSArctic>), and visiting classrooms. Gilberg has most recently developed iPad activities for the classroom using water-sample data from the ocean acidifi cation cruises and is working on additional activities using the CO2calc app. (Read about this app in Sound Waves at <http://soundwaves.usgs.gov/2014/04/awards.html> [this issue] and <http://soundwaves.usgs.gov/2011/03/research4.html>, and in USGS Open-File Report 2010–1280, <http://pubs.usgs.gov/of/2010/1280/>.)
Gilberg currently teaches oceanography and Earth science at St. Petersburg College. As a geologist and teacher, she feels that “It is important that we use social media as well as mobile computer technology as tools to continue to educate students about science and inspire them through the ad-venture of modern scientifi c exploration.”
Learn about the USGS Volunteer for Science Program at <http://www.usgs.gov/humancapital/sw/volunteer.html>.
Learn more about USGS ocean acidifi cation research at <http://coastal.er.usgs.gov/ocean-acidifi cation/>.
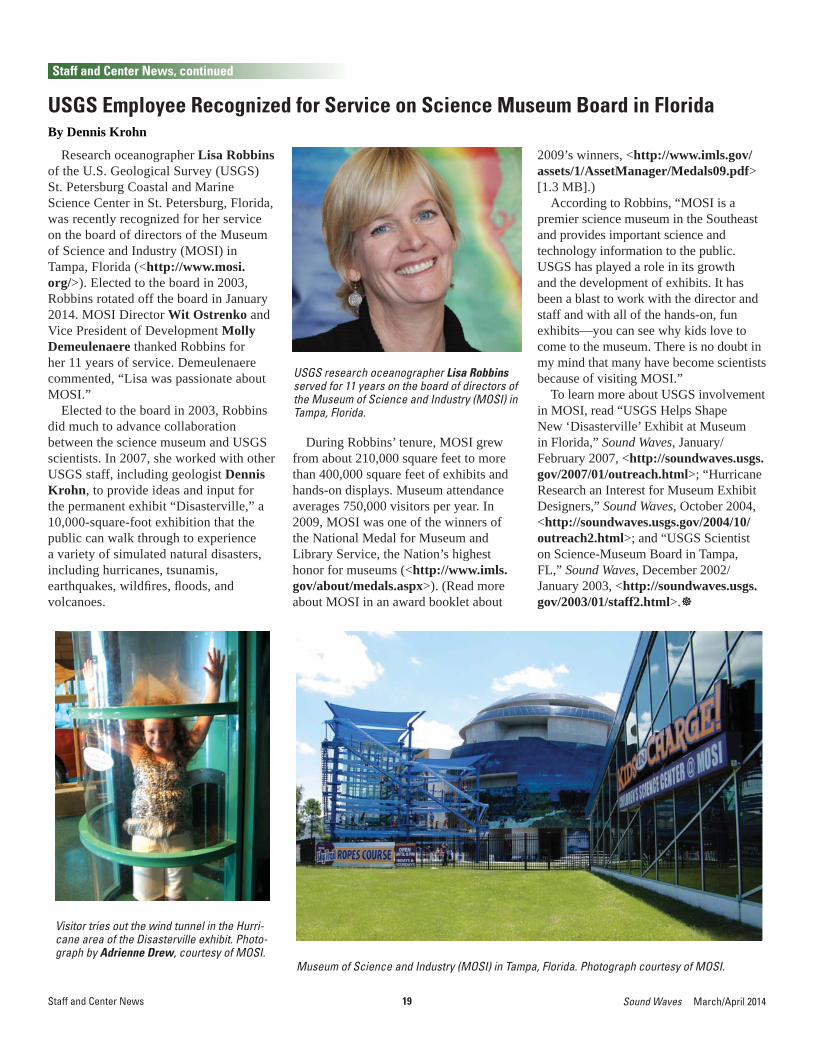
University of South Florida student and USGS volunteer Macy Carter (left) works with USGS Pathways Program student Kira Barrera on data from an ocean acidifi cation experiment conducted with green algae, Halimeda.
Lindsey Evans prepares a carbonate sample for thin sectioning and 14C dating.
Three USGS Volunteers in Florida Working on Ocean Acidifi cationBy Lisa Robbins
Sharon Gilberg at Menden-hall Glacier in Juneau, Alaska, June 20, 2010.
19 Sound Waves March/April 2014
USGS Employee Recognized for Service on Science Museum Board in FloridaBy Dennis Krohn
Research oceanographer Lisa Robbins of the U.S. Geological Survey (USGS) St. Petersburg Coastal and Marine Science Center in St. Petersburg, Florida, was recently recognized for her service on the board of directors of the Museum of Science and Industry (MOSI) in Tampa, Florida (<http://www.mosi.org/>). Elected to the board in 2003, Robbins rotated off the board in January 2014. MOSI Director Wit Ostrenko and Vice President of Development Molly Demeulenaere thanked Robbins for her 11 years of service. Demeulenaere commented, “Lisa was passionate about MOSI.”
Elected to the board in 2003, Robbins did much to advance collaboration between the science museum and USGS scientists. In 2007, she worked with other USGS staff, including geologist Dennis Krohn, to provide ideas and input for the permanent exhibit “Disasterville,” a 10,000-square-foot exhibition that the public can walk through to experience a variety of simulated natural disasters, including hurricanes, tsunamis, earthquakes, wildfi res, fl oods, and volcanoes.
USGS research oceanographer Lisa Robbins served for 11 years on the board of directors of the Museum of Science and Industry (MOSI) in Tampa, Florida.
Museum of Science and Industry (MOSI) in Tampa, Florida. Photograph courtesy of MOSI.
During Robbins’ tenure, MOSI grew from about 210,000 square feet to more than 400,000 square feet of exhibits and hands-on displays. Museum attendance averages 750,000 visitors per year. In 2009, MOSI was one of the winners of the National Medal for Museum and Library Service, the Nation’s highest honor for museums (<http://www.imls.gov/about/medals.aspx>). (Read more about MOSI in an award booklet about
2009’s winners, <http://www.imls.gov/assets/1/AssetManager/Medals09.pdf> [1.3 MB].)
According to Robbins, “MOSI is a premier science museum in the Southeast and provides important science and technology information to the public. USGS has played a role in its growth and the development of exhibits. It has been a blast to work with the director and staff and with all of the hands-on, fun exhibits—you can see why kids love to come to the museum. There is no doubt in my mind that many have become scientists because of visiting MOSI.”
To learn more about USGS involvement in MOSI, read “USGS Helps Shape New ‘Disasterville’ Exhibit at Museum in Florida,” Sound Waves, January/February 2007, <http://soundwaves.usgs.gov/2007/01/outreach.html>; “Hurricane Research an Interest for Museum Exhibit Designers,” Sound Waves, October 2004, <http://soundwaves.usgs.gov/2004/10/outreach2.html>; and “USGS Scientist on Science-Museum Board in Tampa, FL,” Sound Waves, December 2002/January 2003, <http://soundwaves.usgs.gov/2003/01/staff2.html>.
Staff and Center News, continued
Staff and Center News
Visitor tries out the wind tunnel in the Hurri-cane area of the Disasterville exhibit. Photo-graph by Adrienne Drew, courtesy of MOSI.
20March/April 2014 Sound Waves
Publications
(Recently Published continued on page 21)
Publications
New Kid on the Web: USGS Coastal and Marine Geology Program’s Redesigned Website Goes Live
On March 11, 2014, the U.S. Geological Survey (USGS) Coastal and Marine Geology Program launched its newly designed website, <http://marine.usgs.gov/>. The site features dynamic new “front end” webpages that highlight the Program’s research and expertise as they pertain to specifi c coastal and marine issues facing our Nation. Watch for a related article in the next issue of Sound Waves.
Ballachey, B.E., Monson, D.H., Esslinger, G.G., Kloecker, K., Bodkin, J., Bowen, L., and Miles, A.K., 2014, 2013 update on sea otter studies to assess recovery from the 1989 Exxon Valdez oil spill, Prince William Sound, Alaska: U.S. Geological Survey Open-File Report 2014–1030, 40 p., doi:10.3133/ofr20141030 [http://dx.doi.org/10.3133/ofr20141030].
Barnard, P., O’Neill, A., and Foxgrover, A., 2014, Coastal Storm Modeling System—CoSMoS: USGS webpage [http://walrus.wr.usgs.gov/coastal_processes/cosmos/].
Beeman, J.W., Evans, S.D., Haner, P.V., Hansel, H.C., Hansen, A.C., Smith, C.D., and Sprando, J.M., 2014, Passage and survival probabilities of juvenile Chinook salmon at Cougar Dam, Oregon, 2012: U.S. Geological Survey Open-File Report 2014-1038, 64 p., doi:10.3133/ofr20141038 [http://dx.doi.org/10.3133/ofr20141038].
Blazer, V.S., Mazik, P.M., Iwanowicz, L.R., Braham, R., Hahn, C., Walsh, H.L., and Sperry, A., 2014, Monitoring of wild fi sh health at selected sites in the Great Lakes Basin—Methods and preliminary results: U.S. Geological Survey Open-File
Report 2014–1027, 44 p., doi:10.3133/ofr20141027 [http://dx.doi.org/10.3133/ofr20141027].
Borker, A.L., McKown, M.W., Ackerman, J.T., Eagles-Smith, C.A., Tershy, B.R., and Croll, D.A., 2014, Vocal activity as a low cost and scalable index of seabird colony size: Conservation Biology, published online March 14, 2014, doi:10.1111/cobi.12264 [http://dx.doi.org/10.1111/cobi.12264].
Bricker, S.B., Rice, K.C., and Bricker, O.P., III, 2014, From headwaters to coast—Infl uence of human activities on water quality of the Potomac River Estuary: Aquatic Geochemistry, v. 20, no. 2–3, p. 291–323, doi:10.1007/s10498-014-9226-y [http://dx.doi.org/10.1007/s10498-014-9226-y].
Briggs, R.W., Engelhart, S.E., Nelson, A.R., Dura, T., Kemp, A.C., Haeussler, P.J., Corbett, D.R., Angster, S.J., and Bradley, L.-A., 2014, Uplift and subsidence reveal a non-persistent megathrust rupture boundary (Sitkinak Island, Alaska): Geophysical Research Letters, v. 41, no. 7, p. 2289–2296, doi:10.1002/2014GL059380 [http://dx.doi.org/10.1002/2014GL059380].
Brocher, T.M., Filson, J.R., Fuis, G.S., Haeussler, P.J., Holzer, T.L., Plafker, G., and Blair, J.L., 2014, The 1964 Great Alaska Earthquake and tsunamis—A modern perspective and enduring legacies: U.S. Geological Survey Fact Sheet 2014–3018, 6 p., doi:10.3133/fs20143018 [http://dx.doi.org/10.3133/fs20143018].
Chizinski, C.J., Martin, D.R., Hurley, K.L., and Pope, K.L., 2014, Self-imposed length limits in recreational fi sheries: Fisheries Research, v. 155, p. 83–89, doi:10.1016/j.fi shres.2014.02.022 [http://dx.doi.org/10.1016/j.fi shres.2014.02.022].
Dalyander, P.S., Long, J.W., Plant, N.G., and Thompson, D.M., 2014, Assessing mobility and redistribution patterns of sand and oil agglomerates in the surf zone: Marine Pollution Bulletin, v. 80, no. 1–2, p. 200–209, doi:10.1016/j.marpolbul.2014.01.004 [http://dx.doi.org/10.1016/j.marpolbul.2014.01.004].
Denny, J., Danforth, W.W., Worley, C.R., and Irwin, B.J., 2014, High-resolution geophysical and sample data collected in Moultonborough Bay, Lake Winnipesaukee, New Hampshire in 2005,
Recently Published Articles
21 Sound Waves March/April 2014
Publications, continued
(Recently Published continued on page 22)
(Recently Published continued from page 20)
Publications
USGS Field Activity 2005-004-FA: U.S. Geological Survey data set, doi:10.5066/F71N7Z4H [http://dx.doi.org/10.5066/F71N7Z4H].
Dusek, R.J., Hallgrimsson, G.T., Ip, H.S., Jónsson, J.E., Sreevatsan, S., Nashold, S.W., TeSlaa, J.L., Enomoto, S., Halpin, R.A., Lin, X., Federova, N., Stockwell, T.B., Dugan, V.G., Wentworth, D.E., and Hall, J.S., 2014, North Atlantic migratory bird fl yways provide routes for intercontinental movement of avian infl uenza viruses: PLOS ONE, published online March 19, 2014, doi:10.1371/journal.pone.0092075 [http://dx.doi.org/10.1371/journal.pone.0092075].
Flint, P.L., Meixell, B.W., and Mallek, E.J., 2014, High fi delity does not preclude colonization—Range expansion of molting Black Brant on the Arctic coast of Alaska: Journal of Field Ornithology, v. 85, no. 1, p. 75–83, doi:10.1111/jofo.12051 [http://dx.doi.org/10.1111/jofo.12051].
Foxgrover, A.C., Finlayson, D.P., Jaffe, B.E., and Fregoso, T.A., 2014, Bathymetry and digital elevation models of Coyote Creek and Alviso Slough, south San Francisco Bay, California (ver. 2, March, 2014): U.S. Geological Survey Open-File Report 2011–1315, 20 p., doi:10.3133/ofr20111315 [http://dx.doi.org/10.3133/ofr20111315].
García-Alonso, J., Rodriguez-Sanchez, N., Misra, S.K., Valsami-Jones, E., Croteau, M.-N., Luoma, S.N., and Rainbow, P.S., 2014, Toxicity and accumulation of silver nanoparticles during development of the marine polychaete Platynereis dumerilii: Science of the Total Environment, v. 476–477, p. 688–695, doi:10.1016/j.scitotenv.2014.01.039 [http://dx.doi.org/10.1016/j.scitotenv.2014.01.039].
Gill, R.E., Jr., Douglas, D.C., Handel, C.M., Tibbitts, T.L., Hufford, G., and Piersma, T., 2014, Hemispheric-scale wind selection facilitates bar-tailed godwit circum-migration of the Pacifi c: Animal Behaviour, v. 90, p. 117–130, doi:10.1016/j.anbehav.2014.01.020 [http://dx.doi.org/10.1016/j.anbehav.2014.01.020].
Hagar, J.C., Eskelson, B.N.I., Haggerty, P.K., Nelson, S.K., and Vesely, D.G.,
2014, Modeling marbled murrelet (Brachyramphus marmoratus) habitat using LiDAR-derived canopy data: Wildlife Society Bulletin, published online February 12, 2014, doi:10.1002/wsb.407 [http://dx.doi.org/10.1002/wsb.407].
Hartwell, S.R., Wingfi eld, D.K., Allwardt, A.O., Lightsom, F.L., and Wong, F.L., 2014, Polygons of global undersea features for geographic searches (undersea_features.shp): U.S. Geological Survey Open-File Report 2014–1040, 8 p., doi:10.3133/ofr20141040 [http://dx.doi.org/10.3133/ofr20141040].
Helweg, D., Nash, S., and Polhemus, D., 2014, The Pacifi c Islands Climate Science Center fi ve-year science agenda, 2014–2018: U.S. Geological Survey Open-File Report 2014–1075, 30 p., doi:10.3133/ofr20141075 [http://dx.doi.org/10.3133/ofr20141075].
Heywood, C.E., Griffi th, J.M., and Lovelace, J.K., 2014, Simulation of groundwater fl ow in the “1,500-foot” sand and “2,000-foot” sand, with scenarios to mitigate saltwater migration in the “2,000-foot” sand of the Baton Rouge area, Louisiana: U.S. Geological Survey Scientifi c Investigations Report 2013–5227, 63 p., doi:10.3133/sir20135227 [http://dx.doi.org/10.3133/sir20135227].
Johnson, S.Y., Dartnell, P., Cochrane, G.R., Golden, N.E., Phillips, E.L., Ritchie, A.C., Greene, H.G., Krigsman, L.M., Kvitek, R.G., Dieter, B.E., Endris, C.A., Seitz, G.G., Sliter, R.W., Erdey, M.E., Gutierrez, C.I., Wong, F.L., Yoklavich, M.M., Draut, A.E., Hart, P.E., and Conrad, J.E. (S.Y. Johnson and S.A. Cochran, eds.), 2013, California State Waters Map Series—Offshore of Santa Barbara, California: U.S. Geological Survey Scientifi c Investigations Map 3281, 45 p., 11 sheets, scale 1:24,000, doi:10.3133/sim3281 [http://dx.doi.org/10.3133/sim3281].
Kenner, M.C., Estes, J.A., Tinker, M.T., Bodkin, J.L., Cowen, R.K., Harrold, C., Hatfi eld, B.B., Novak, M., Rassweiler, A., and Reed, D.C., 2013, A multi-decade time series of kelp forest community structure at San Nicolas Island, California (USA): Ecology, v. 94, p. 2654–2654, doi:10.1890/13-0561R.1 [http://dx.doi.org/10.1890/13-0561R.1].
Kock, T.J., Liedtke, T.L., Ekstrom, B.K., Tomka, R.G., and Rondorf, D.W., 2014, Evaluation of juvenile salmonid behavior near a prototype weir box at Cowlitz Falls Dam, Washington, 2013: U.S. Geological Survey Open-File Report 2014–1042, 24 p., doi:10.3133/ofr20141042 [http://dx.doi.org/10.3133/ofr20141042].
Krauss, K.W., McKee, K.L., and Hester, M.W., 2014, Water use characteristics of black mangrove (Avicennia germinans) communities along an ecotone with marsh at a northern geographical limit: Ecohydrology, v. 7, no. 2, p. 354–365, doi:10.1002/eco.1353 [http://dx.doi.org/10.1002/eco.1353].
Krauss, K.W., McKee, K.L., Lovelock, C.E., Cahoon, D.R., Saintilan, N., Reef, R., and Chen, L., 2014, How mangrove forests adjust to rising sea level: New Phytologist, v. 202, no. 1, p. 19–34, doi:10.1111/nph.12605 [http://dx.doi.org/10.1111/nph.12605].
Lee, S.Y., Primavera, J.H., Dahdouh-Guebas, F., McKee, K., Bosire, J.O., Cannicci, S., Diele, K., Fromard, F., Koedam, N., Marchand, C., Mendelssohn, I., Mukherjee, N., and Record, S., 2014, Ecological role and services of tropical mangrove ecosystems—A reassessment: Global Ecology and Biogeography, published online March 6, 2014, doi:10.1111/geb.12155 [http://dx.doi.org/10.1111/geb.12155].
Lisle, J.T., Garrison, V.H., and Gray, M.A., 2014, Evaluation of coral pathogen growth rates after exposure to atmospheric African dust samples: U.S. Geological Survey Open-File Report 2014–1017, 12 p., doi:10.3133/ofr20141017 [http://dx.doi.org/10.3133/ofr20141017].
Lorenson, T.D., Wong, F.L., Dartnell, P., and Sliter, R.W., 2014, Greenhouse gases generated from the anaerobic biodegradation of natural offshore asphalt seepages in southern California: Geo-Marine Letters, published online February 20, 2014, doi:10.1007/s00367-014-0359-1 [http:/dx.doi.org/10.1007/s00367-014-0359-1].
MacVean, L.J., and Lacy, J.R., 2014, Interactions between waves, sediment, and turbulence on a shallow estuarine
22March/April 2014 Sound Waves
Publications, continued
(Recently Published continued on page 23)
(Recently Published continued from page 21)
Publications
mudfl at: Journal of Geophysical Research–Oceans, v. 119, no. 3, p. 1534–1553, doi:10.1002/2013JC009477 [http://dx.doi.org/10.1002/2013JC009477].
Madenjian, C.P., Johnson, N.S., Siefkes, M.J., Dettmers, J.M., Blum, J.D., and Johnson, M.W., 2014, Mercury accumulation in sea lamprey (Petromyzon marinus) from Lake Huron: Science of the Total Environment, v. 470–471, p. 1313–1319, doi:10.1016/j.scitotenv.2013.10.081 [http://dx.doi.org/10.1016/j.scitotenv.2013.10.081].
McMullen, K.Y., Poppe, L.J., Ackerman, S.D., Blackwood, D.S., Glomb, K.A., and Wood, D.A., 2014, Sea-fl oor geology in northwestern Block Island Sound, Rhode Island: U.S. Geological Survey Open-File Report 2014–1018, DVD-ROM, 13 p., doi:10.3133/ofr20141018 [http://dx.doi.org/10.3133/ofr20141018].
Miller, J.J., von Huene, R., and Ryan, H.F., 2014, The 1946 Unimak tsunami earthquake area—Revised tectonic structure in reprocessed seismic images and a suspect near-fi eld tsunami source: U.S. Geological Survey Open-File Report 2014–1024, 19 p., doi:10.3133/ofr20141024 [http://dx.doi.org/10.3133/ofr20141024].
Palaseanu-Lovejoy, M., Thatcher, C.A., and Barras, J.A., 2014, Levee crest elevation profi les derived from airborne lidar-based high resolution digital elevation models in south Louisiana: ISPRS Journal of Photogrammetry and Remote Sensing, v. 91, p. 114–126, doi:10.1016/j.isprsjprs.2014.02.010 [http://dx.doi.org/10.1016/j.isprsjprs.2014.02.010].
Pendleton, E.A., Andrews, B.D., Danforth, W.W., and Foster, D.S., 2014, High-resolution geophysical data collected aboard the U.S. Geological Survey research vessel Rafael to supplement existing datasets from Buzzards Bay and Vineyard Sound, Massachusetts: U.S. Geological Survey Open-File Report 2013–1020, 6 p., doi:10.3133/ofr20131020 [http://dx.doi.org/10.3133/ofr20131020].
Plant, N.G., Flocks, J., Stockdon, H.F., Long, J.W., Guy, K., Thompson, D.M., Cormier, J.M., Smith, C.G., Miselis, J.L., and Dalyander, P.S., 2014, Predictions
of barrier island berm evolution in a time-varying storm climatology: Journal of Geophysical Research–Earth Surface, v. 119, no. 2, p. 300–316, doi:10.1002/2013JF002871 [http://dx.doi.org/10.1002/2013JF002871].
Poppe, L.J., McMullen, K.Y., Danforth, W.W., Blankenship, M.A., Clos, A.R., Glomb, K.A., Lewit, P.G., Nadeau, M.A., Wood, D.A., and Parker, C.E., 2014, Combined multibeam and bathymetry data from Rhode Island Sound and Block Island Sound—A regional perspective: U.S. Geological Survey Open-File Report 2014–1012, DVD-ROM, 9 p., doi:10.3133/ofr20141012 [http://dx.doi.org/10.3133/ofr20141012].
Purcell, M.K., Hard, J.J., Neely, K.G., Park, L.K., Winton, J.R., and Elliott, D.G., 2014, Genetic variation in bacterial kidney disease (BKD) susceptibility in Lake Michigan Chinook Salmon and its progenitor population from the Puget Sound: Journal of Aquatic Animal Health, v. 26, no. 1, p.: 9–18, doi:10.1080/08997659.2013.860061 [http://dx.doi.org/10.1080/08997659.2013.860061].
Reed, R.N., and Snow, R.W., 2014, Assessing risks to humans from invasive Burmese pythons in Everglades National Park, Florida, USA: Wildlife Society Bulletin, published online February 27, 2014, doi:10.1002/wsb.413 [http://dx.doi.org/10.1002/wsb.413].
Reese, R.S., and Cunningham, K., 2014, Hydrogeologic framework and salinity distribution of the Floridan aquifer system of Broward County, Florida: U.S. Geological Survey Scientifi c Investigations Report 2014–5029, 60 p., doi:10.3133/sir20145029 [http://dx.doi.org/10.3133/sir20145029].
Riedel, T.E., Zimmer-Faust, A.G., Thulsiraj, V., Madi, T., Hanley, K.T., Ebentier, D.L., Byappanahalli, M., Layton, B., Raith, M., Boehm, A.B., Griffi th, J.F., Holden, P.A., Shanks, O.C., Weisberg, S.B., and Jay, J.A., 2014, Detection limits and cost comparisons of human- and gull-associated conventional and quantitative PCR assays in artifi cial and environmental waters: Journal of Environmental Management, v. 136, p. 112–120, doi:10.1016/j.jenvman.2014.01.029
[http://dx.doi.org/10.1016/j.jenvman.2014.01.029].
Roberts-Ashby, T.L., Brennan, S.T., Buursink, M.L., Covault, J.A., Craddock, W.H., Drake, R.M., II, Merrill, M.D., Slucher, E.R., Warwick, P.D., Blondes, M.S., Gosai, M.A., Freeman, P.A., Cahan, S.M., DeVera, C.A., and Lohr, C.D., 2014, Geologic framework for the national assessment of carbon dioxide storage resources—U.S. Gulf Coast, chap. H of Warwick, P.D., and Corum, M.D., eds., Geologic framework for the national assessment of carbon dioxide storage resources: U.S. Geological Survey Open-File Report 2012–1024–H, 77 p., doi:10.3133/ofr20121024H [http://dx.doi.org/10.3133/ofr20121024H].
Rosenberger, K., Noble, M.A., and Norris, B.K., 2013, Measurements of slope currents and internal tides on the continental shelf and slope off Newport Beach, California: U.S. Geological Survey Open-File Report 2014–1041, 65 p., doi:10.3133/ofr20141041 [http://dx.doi.org/10.3133/ofr20141041].
Rudershausen, P.J., Buckel, J.A., Dubreuil, T., O’Donnell, M.J., Hightower, J.E., Poland, S.J., and Letcher, B.H., 2014, Estimating movement and survival rates of a small saltwater fi sh using autonomous antenna receiver arrays and passive integrated transponder tags: Marine Ecology Progress Series, v. 499, p. 177–192, doi:10.3354/meps10656 [http://dx.doi.org/10.3354/meps10656].
Sanders, R., 2014, San Francisco Bay sand and mud: U.S. Geological Survey website, [http://walrus.wr.usgs.gov/coastal_processes/sfbsm/].
Sasser, C.E., Visser, J.M., Mouton, E., Linscombe, J., and Hartley, S.B., 2014, Vegetation types in coastal Louisiana in 2013: U.S. Geological Survey Scientifi c Investigations Map 3290, 1 sheet, scale 1:550,000, doi:10.3133/sim3290 [http://dx.doi.org/10.3133/sim3290].
Sheibley, R.W., and Paulson, A.J., 2014, Quantifying benthic nitrogen fl uxes in Puget Sound, Washington—A review of available data: U.S. Geological Survey Scientifi c Investigations Report 2014–5033, 44 p., doi:10.3133/
23 Sound Waves March/April 2014
(Bureau Approval continued on page 24)
Aretxabaleta, A.L., Butman, B., and Ganju, N.K., Water-level response in back-barrier bays unchanged following Hurricane Sandy: Geophysical Research Letters.
Baker, E.J., and Kellogg, C.A., Comparison of three DNA extraction kits to establish maximum yield and quality of coral-associated microbial DNA: U.S. Geological Survey Open-File Report.
Buster, N.A., Kelso, K.W., Miselis, J.L., Kindinger, J.L, and Taylor, C.A., Sediment data collected in 2010 from Cat Island, Mississippi: U.S. Geological Survey Data Series.
Challener, R.C., Robbins, L.L., and McClintock, J.B., Variability of the carbonate chemistry in a shallow, seagrass-dominated ecosystem—Implications for ocean acidifi cation
Publications That Have Received Bureau Approvalexperiments and the sea urchin Lytechinus variegatus [abs.]: North American Echinoderm Conference, 7th, Pensacola, Fla., June 1–6, 2014.
DeWitt, N.T., Reich, C.D., Smith, C.G., and Reynolds, B.J., Archive of single-beam bathymetry data collected from select areas in Weeks Bay and Weeks Bayou, southwest Louisiana, January 2013: U.S. Geological Survey Data Series.
Forde, A.S., Dadisman, S.V., Flocks, J.G., Fosness, R., Welcker, C., and Kelso, K.W., Archive of digital chirp subbottom profi le data collected during USGS cruise 13GFP01, Brownlee Dam and Hells Canyon Reservoir, Idaho and Oregon, 2013: U.S. Geological Survey Data Series.
Grifol, M., Aretxabaleta, A.L., Pelegri, J.L., Espino, M., Warner, J.C., and
Sanchez-Arcilla, A., Seasonal circulation over the Catalan inner shelf (northwest Mediterranean Sea): Journal of Geophysical Research–Oceans.
Guy, K.K., Doran, K.J., Stockdon, H.F., and Plant, N.G., Topographic lidar survey of the Alabama, Mississippi, and southeast Louisiana barrier islands, from September 5 to October 11, 2012: U.S. Geological Survey Data Series.
Guy, K.K., and Plant, N.G., Topographic lidar survey of Dauphin Island, Alabama, and Chandeleur, Stake, Grand Gosier and Breton Islands, Louisiana, July 12–14, 2013: U.S. Geological Survey Data Series.
Guy, K.K., Plant, N.G., and Bonisteel-Cormier, J.M., Topographic lidar survey
Publications, continued
(Recently Published continued from page 22)
Publications
sir20145033 [http://dx.doi.org/10.3133/sir20145033].
Sieges, M.L., Smolinsky, J.A., Baldwin, M.J., Barrow, W.C., Jr., Randall, L.A., and Buler, J.J., 2014, Assessment of bird response to the Migratory Bird Habitat Initiative using weather-surveillance radar: Southeastern Naturalist, v. 13, no.1, p. G36–G65, doi:10.1656/058.013.0112 [http://dx.doi.org/10.1656/058.013.0112].
Signell, R.P., and Snowden, D.P., 2014, Advances in a distributed approach for ocean model data interoperability: Journal of Marine Science and Engineering, v. 2, no. 1, p. 194–208, doi:10.3390/jmse2010194 [http://dx.doi.org/10.3390/jmse2010194].
Sloat, M.R., Fraser, D.J., Dunham, J.B., Falke, J.A., Jordan, C.E., McMillan, J.R., and Ohms, H.A., 2014, Ecological and evolutionary patterns of freshwater maturation in Pacifi c and Atlantic salmonines: Reviews in Fish Biology and Fisheries, published online March 8, 2104, doi:10.1007/s11160-014-9344-z [http://dx.doi.org/10.1007/s11160-014-9344-z].
Smith, C.G., Osterman, L.E., and Barras, J., 2014, Sea-level and storm impacts on estuarine environments and shorelines:
U.S. Geological Survey web site, [http://coastal.er.usgs.gov/ssiees/].
Smith, M.A., Walker, N.J., Free, C.M., Kirchhoff, M.J., Drew, G.S., Warnock, N., and Stenhouse, I.J., 2014, Identifying marine Important Bird Areas using at-sea survey data: Biological Conservation, v. 172, p. 180–189, doi:10.1016/j.biocon.2014.02.039 [http://dx.doi.org/10.1016/j.biocon.2014.02.039].
Steinman, B.A., Abbott, M.B., Mann, M.E., Ortiz, J.D., Feng, S., Pompeani, D.P., Stansell, N.D., Anderson, L., Finney, B.P., and Bird, B.W., 2014, Ocean-atmosphere forcing of centennial hydroclimatic variability in the Pacifi c Northwest: Geophysical Research Letters, v. 41, no. 7, p. 2553–2560, doi:10.1002/2014GL059499 [http://dx.doi.org/10.1002/2014GL059499].
Swain, E., Stefanova, L., and Smith, T., 2014, Applying downscaled global climate model data to a hydrodynamic surface-water and groundwater model: American Journal of Climate Change, v. 3, no. 1, p. 33–49, doi:10.4236/ajcc.2014.31004 [http://dx.doi.org/10.4236/ajcc.2014.31004] (4.3-MB PDF fi le).
Tape, K.D., Flint, P.L., Meixell, B.W., and Gaglioti, B.V., 2013, Inundation,
sedimentation, and subsidence creates goose habitat along the Arctic coast of Alaska: Environmental Research Letters, v. 8, no. 4, 9 p., doi:10.1088/1748-9326/8/4/045031 [http://dx.doi.org/10.1088/1748-9326/8/4/045031].
ten Brink, U.S., Chaytor, J.D., Geist, E.L., Brothers, D.S., and Andrews, B.D., 2014, Assessment of tsunami hazard to the U.S. Atlantic margin: Marine Geology, p. 31–54, doi:10.1016/j.margeo.2014.02.011 [http://dx.doi.org/10.1016/j.margeo.2014.02.011].
Wicklein, S.M., and Bennett, M.R., 2014, Coastal storm monitoring in Virginia: U.S. Geological Survey General Information Product 156, 2 p., doi:10.3133/gip156 [http://dx.doi.org/10.3133/gip156].
Work, T.M., and Aeby, G.S., 2014, Microbial aggregates within tissues infect a diversity of corals throughout the Indo-Pacifi c: Marine Ecology Progress Series, v. 500, p. 1–9, doi:10.3354/meps10698 [http://dx.doi.org/10.3354/meps10698].
Work, T.M., and Meteyer, C., 2014, To understand coral disease, look at coral cells: EcoHealth, published online April 11, 2014, doi:10.1007/s10393-014-0931-1 [http://dx.doi.org/10.1007/s10393-014-0931-1].
24March/April 2014 Sound Waves
of the Chandeleur Islands, Louisiana, February 6, 2012: U.S. Geological Survey Data Series.
Hart, P.E., Haines, S.S., Shedd, W., Frye, M., Agena, W., Miller, J., and Ruppel, C., High-resolution seismic refl ection study of two deep-water Gulf of Mexico gas hydrate sites [abs.]: Natural Gas Hydrate Systems Gordon Research Conference, Galveston, Tex., March 23–28, 2014.
Kindinger, J.L., Miselis, J.L., and Buster, N.A., The shallow stratigraphy and sand resources offshore from Cat Island, Mississippi: U.S. Geological Survey Open-File Report.
Long, J.W., de Bakker, A.T.M., and Plant, N.G., Scaling coastal dune elevation changes across storm-impact regimes: Geophysical Research Letters.
Long, J.W., Plant, N.G., Dalyander, P.S., and Thompson, D.M., A probabilistic method
for constructing wave time-series at inshore locations using model scenarios: Coastal Engineering.
Lorenson, T.D., and Collett, T.S., What the analysis of gases from drilling wells tells us about has hydrate formation, history, and gas sources on the Alaska North Slope [abs.]: Natural Gas Hydrate Systems Gordon Research Conference, Galveston, Tex., March 23–28, 2014.
Martin, J.B., Cable, J.E., Roy, M., and Smith, C.G., Transients in the biogeochemical reaction zone of subterranean estuaries [abs.]: Goldschmidt Conference, Sacramento, Calif., June 8–13, 2014.
Nelson, J., He, R., Warner, J.C., and Bane, J., Air-sea interactions during strong winter extratropical storms: Ocean Dynamics.
Prouty, N.G., Swarzenski, P., Johannesson, K.H., Fackrell, J., and Palmore, C.D., Cycling of nutrients and trace metals in subterranean estuaries of the Kona Coast,
Hawaii [abs.]: Goldschmidt Conference, Sacramento, Calif., June 8–13, 2014.
Prouty, N.G., and Roark, E.B., Cold seep mussel isotopic analyses [abs.]: Goldschmidt Conference, Sacramento, Calif., June 8–13, 2014.
Richey, J.N., Reynolds, C.E., Tappa, E., and Thunell, R., Weekly resolution particulate fl ux from a sediment trap in the northern Gulf of Mexico, 2008–2012: U.S. Geological Survey Open-File Report 2014–1035, 9 p.
Smith, C.G., Swarzenski, P.W., and Price, R.M., Geophysical and geochemical data reveal large-scale subterranean estuaries along west Florida coastal region [abs.]: Goldschmidt Conference, Sacramento, Calif., June 8–13, 2014.
Young, C.R., Kroeger, K.D., and Hanson, G.N., A thick unsaturated zone limits denitrifi cation in sandy coastal aquifers: Journal of Environmental Quality.
Publications, continued
(Bureau Approval continued from page 23)
Publications


![Poultry production in the atolls [typescript]](https://static.fdocuments.net/doc/165x107/568bd8db1a28ab2034a4e7ef/poultry-production-in-the-atolls-typescript.jpg)