
Field Testing of Suction Caissons at Bothkennar and … · Field Testing of Suction Caissons at...
69
Field Testing of Suction Caissons at Bothkennar and Luce Bay by G.T. Houlsby, R.B. Kelly, J. Huxtable and B.W. Byrne Report No. OUEL 2276/05 University of Oxford Department of Engineering Science Parks Road, Oxford, OX1 3PJ, U.K. Tel. 01865 273162/283300 Fax. 01865 283301 Email [email protected] http://www-civil.eng.ox.ac.uk/
Transcript of Field Testing of Suction Caissons at Bothkennar and … · Field Testing of Suction Caissons at...
Field Testing of Suction Caissons at Bothkennar and Luce Bay
by
G.T. Houlsby, R.B. Kelly, J. Huxtable and B.W. Byrne
Report No. OUEL 2276/05
University of Oxford Department of Engineering Science Parks Road, Oxford, OX1 3PJ, U.K.
Tel. 01865 273162/283300
Fax. 01865 283301 Email [email protected]
http://www-civil.eng.ox.ac.uk/

Field Testing of Suction Caissons at Bothkennar and Luce Bay
G.T. Houlsby, R.B. Kelly, J. Huxtable and B.W. Byrne
This report consists of three papers that have resulted from a joint industry project investigating the application of suction caissons to offshore wind turbines. The first two papers report field scale testing at two different locations in Scotland. The final paper presents some scaling relationships for use in comparing laboratory testing to the field testing. a) “Field trials of suction caissons in clay for offshore wind turbine foundations.” Houlsby, G.T., Kelly, R.B., Huxtable, J. and Byrne, B.W. Abstract: A programme of testing of caisson foundations in clay at the Bothkennar test site is described. The tests are relevant to the design of foundations for offshore wind turbines, either in the form of monopod or tetrapod foundations. Records are presented for installation of the caissons, cyclic moment loading under both dynamic and quasi-static conditions, cyclic inclined vertical loading and for pullout of the caisson. Variation of stiffness of the foundation is observed, with high initial stiffness followed by hysteretic behaviour at moderate loads and degradation of response at high loads. Some implications for the design of wind turbine foundations are briefly discussed. b) “Field trials of suction caissons in sand for offshore wind turbine foundations.” Houlsby, G.T., Kelly, R.B., Huxtable, J. and Byrne, B.W. Abstract: A programme of testing on suction caisson foundations in an artificially prepared sand test bed near Luce Bay, in Scotland, is described. The tests are relevant to the design of either monopod or tetrapod foundations for offshore wind turbines. Records are presented for suction installation of the caissons, cyclic moment loading under both quasi-static and dynamic conditions to simulate the behaviour of a monopod foundation, and cyclic vertical loading and pullout of caissons to simulate one footing in a quadruped foundation. Variations of stiffness with loading level of the foundation are observed, with high initial stiffness followed by hysteretic behaviour at moderate loads and degradation of response at high loads. Some implications for the design of wind turbine foundations are briefly discussed. c) “A comparison of field and laboratory tests of caisson foundations in sand and clay.” Kelly, R.B., Houlsby, G.T. and Byrne, B.W. Abstract: Laboratory tests applying vertical and moment loads to suction caissons founded in sand and clay have been conducted to simulate an equivalent series of field tests. The caissons used in the laboratory were 0.15m, 0.2m and 0.3m in diameter, while those for the field tests were 1.5m and 3.0m diameter. The loads applied to the caissons in the laboratory tests were scaled from those in the field tests, and the models were loaded in a near identical manner to the field trials. The test results are presented in non-dimensional form for comparison. The non-dimensional laboratory moment test data were similar to the field data in most cases. The non-dimensional data from vertically loaded caisson tests in the laboratory and in the field show some differences, and possible reasons for these are discussed.


1
Field trials of suction caissons in clay for offshore wind turbine foundations
G.T. Houlsby1, R.B. Kelly1, J. Huxtable2 and B.W. Byrne1 Keywords: bearing capacity, clay, dynamic test, foundations, stiffness
ABSTRACT
A programme of testing of caisson foundations in clay at the Bothkennar test site is described.
The tests are relevant to the design of foundations for offshore wind turbines, either in the form of
monopod or tetrapod foundations. Records are presented for installation of the caissons, cyclic
moment loading under both dynamic and quasi-static conditions, cyclic inclined vertical loading
and for pullout of the caisson. Variation of stiffness of the foundation is observed, with high initial
stiffness followed by hysteretic behaviour at moderate loads and degradation of response at high
loads. Some implications for the design of wind turbine foundations are briefly discussed.
INTRODUCTION
The offshore wind energy industry is a very rapidly expanding sector of vital economic
importance in the UK, and foundation costs are an important part of the costs of offshore wind
turbine installations (Byrne and Houlsby, 2003). Most current foundations for offshore wind
turbines are large “monopiles”, although some have been founded on gravity bases. However, with
the current expansion of the offshore wind energy industry, alternative foundation types are being
considered. One possibility is the use of “suction caisson” foundations (Houlsby and Byrne (2000),
Byrne and Houlsby (2003)). Suction caissons are now widely used as anchors for floating
structures, and have also been used offshore as foundations for a small number of fixed platforms
(Bye et al., 1995). They are large cylindrical structures, open at the base (see Figure 1). During
installation they cut a small distance into the seabed under their own weight, but are then installed
to their full depth (with the caisson lid flush with the seabed) by pumping out the water that is
trapped within the caisson. They can be installed in either clays or sands. The principal advantage
for the offshore wind application is that the caissons can be installed rapidly, using relatively
inexpensive equipment.
Methods for designing caisson foundations for offshore wind applications are in their infancy,
and in response to the need for design methods, a programme of research has been sponsored by the
DTI, EPSRC and a consortium of companies (see Acknowledgements) (Byrne et al. 2002). In this 1 Department of Engineering Science, Oxford University 2 Fugro Structural Monitoring Ltd.

2
study, design methods are being developed principally on the basis of small-scale model testing
(Byrne and Houlsby (2002, 2004), Byrne et al. (2003), Kelly et al. (2003, 2004)), but an important
part of the research is a programme of intermediate scale field trials to check on the scalability of
the results. In this paper tests on 1.5m and 3.0m diameter caissons at the Bothkennar test site are
reported. Typical sizes of prototype caissons are discussed below. Other studies of design methods
for suction caissons for foundation (as opposed to anchor) applications have concentrated on
analytical procedures (e.g. Bransby and Randolph, 1998) or finite element analysis (e.g. Gourvenec
and Randolph, 2003).
A key feature of offshore wind turbine structures is that (for their size) they are relatively light
(with a mass of the order of 600t for a 3.5MW turbine structure), yet they are subjected to large
horizontal forces and overturning moments from wind and waves (Byrne and Houlsby, 2003). The
horizontal load may, for instance, be of the order of 65% of the vertical load. Thus the challenge to
the foundation engineer is to carry large (and repetitive) horizontal loads and overturning moments,
but relatively little vertical load. Two main structural configurations using caissons are being
considered: either a “monopod” consisting of a single large caisson (typically 20m to 25m in
diameter for a modern large turbine structure), or a “tetrapod” in which the load is transferred
through a truss structure to four smaller caissons, see Figure 2 (preliminary calculations indicate
that the obvious alternative of a tripod is a less favourable configuration). Each of the smaller
caissons might be say 6m to 8m in diameter. For the monopod the most important load on the
foundation is the overturning moment. In the case of the tetrapod the moment loading is principally
carried by “push-pull” action by opposing footings, and it is the variation of vertical load (and in
particular the possibility of tension on a footing) that is most important. In both cases the design
objective is to select an appropriate diameter D and depth h of the caisson, and in the tetrapod case
the spacing s must also be determined (see Figure 2).
The testing programme described below includes tests directed towards the design of both the
monopod and tetrapod. Data were obtained from the installation phases for each caisson. Loading of
the caissons was by means of a combination of dead weights, hydraulic jacks and inertial loading
from a “Structural Eccentric Mass Vibrator” (SEMV). The test programme was designed by Oxford
University, and site operations were managed by Fugro Structural Monitoring Ltd. The tests were
carried out in December 2003 and January 2004.

3
EQUIPMENT AND TESTING PROCEDURES
The caissons were fabricated from mild steel, with the principal dimensions given in Table 1.
The lids of the caissons were stiffened by I-sections. Ports were provided for attaching the pump
and for venting the caissons. An A-frame structure was attached by pins to the 3.0m caisson to
transfer loads from the SEMV or hydraulic jack. Load cells were fitted to measure the axial load in
all four legs of the frame.
Reaction loads for testing were provided by a steel frame, and the layout of the entire testing
assembly is shown in Figure 3. The reaction frame was supported on two square foundations (2m x
2m x 1m deep), which were also installed by the suction method. The frame was installed in a pit of
depth approximately 1.5m at the Bothkennar test site, see Figure 4. Details of the soil properties at
Bothkennar are reported in the collection of papers in Géotechnique, Volume 42, Number 2 (June
1992). The best estimate is that the base of the pit corresponds to a depth of 1.75m in Nash et al.
(1992), so that the undrained shear strength (measured by the undrained triaxial test), taken from the
figures in Nash et al. (1992) is zsu 96.143.11 += where us is in kPa and z is the depth in metres
below the base of the excavation. Salient values are therefore kPa4.11=us at the soil surface,
13.4kPa at the base of the 1.5m caisson and 14.4kPa at the base of the 3.0m caisson. The bulk
density of the clay at relevant depths is estimated as 1680kg/m3. Throughout the testing period the
base of the test pit was covered by about 0.25m of water. The vertical bearing capacities of the
small and large caissons were estimated (using the method of Houlsby and Martin, 2003) as 164kN
and 746kN respectively.
In addition to the clevis pin load cells at the base of the A-frame on the 3.0m caisson, loads
applied by all hydraulic jacks used in the testing were measured by further load cells.
Displacements of the caissons were measured by draw-wire transducers attached to a scaffold frame
based at least 1.5m away from the outside of the caisson. The draw-wires were attached to the
caisson via upstand frames to keep the transducers clear of the water. Six transducers were used to
resolve all six degrees-of-freedom of movement. The co-ordinates of the transducers were first
determined using surveying techniques. During SEMV tests, displacements were also monitored by
means of accelerometers. One pore water pressure transducer was fixed centrally to the underside of
the lid of each caisson, and two more on the inside of the caisson just above the base of the skirt (at
opposite ends of a diameter). The general layout of the instrumentation is shown in Figure 5. All
transducer data were logged at 50Hz for most tests, with averages over 50 readings used for further
analysis, and at 400Hz for the SEMV tests (without data averaging).

4
The caissons were installed according to the following procedure. (a) The caisson was
lowered to the soil surface and allowed to penetrate under its own weight with the interior vented to
atmosphere. (b) Water was pumped into the caisson until it was full. (c) The vent was closed and
water pumped out of the caisson to install it to full depth. During phase (c) dead weights were
added to the caisson to correct (as far as possible) any errors in levelling of the caisson. All
subsequent testing (except where noted) was carried out with the caisson vents sealed.
The tests on the 3.0m caisson were relevant to a monopod. Small amplitude cyclic horizontal
loads were applied at the top of the A-frame (4.23m above the lid of the caisson) by means of the
SEMV, operating at 10Hz, at which frequency the applied load was kN0.5± . These loads are
intended to be primarily representative of wave loads experienced by a prototype structure, but
scale to waves of different magnitudes (and return periods) for different sizes of prototype. No
attempt has been made to scale the wave frequency, as undrained conditions are assumed in both
test and prototype, and dynamic effects may be accounted for as discussed below. A fixed bias to
the horizontal loading (representing a wind and/or current loading) was achieved by suspending a
400kg block from a pulley system attached to the top of the A-frame (see Figure 3(b)). The vertical
load on the caisson throughout these tests was augmented by a 2400kg concrete block. During the
first series of SEMV tests an interesting observation was that, whilst the caisson moved only
imperceptibly, vibration at 10Hz transmitted through the ground set up a resonance in the scaffold
reference frame for displacement measurement (thus effectively rendering the displacement
measurements useless). This could not be eliminated satisfactorily by stiffening the frame, and in
subsequent tests displacements were measured by accelerometers attached directly to the caisson.
A second set of tests on the 3.0m caisson involved large amplitude (but low frequency) cyclic
horizontal loading from a hydraulic jack placed approximately horizontally between the top of the
A-frame and the main reaction frame, Figure 3(a). The amplitude of the loads was steadily
increased until large (>200mm) movements of the loading point occurred. These tests were
principally intended to assess the performance of the caisson under extreme conditions.
The tests on the 1.5m caisson were relevant to the tetrapod design. It was first loaded to a
fixed vertical load by means of a hydraulic jack. Cyclic inclined loading was then applied using a
second jack (inclined at 2:1 to the horizontal). Packets of 10 cycles of increasing load amplitude
were applied. The intention was that during these cycles the load in the vertical jack would be held
constant, but the stiffness of the hydraulic system rendered it difficult to control this load, which
therefore showed significant fluctuations. At the end of the testing the inclined jack was
5
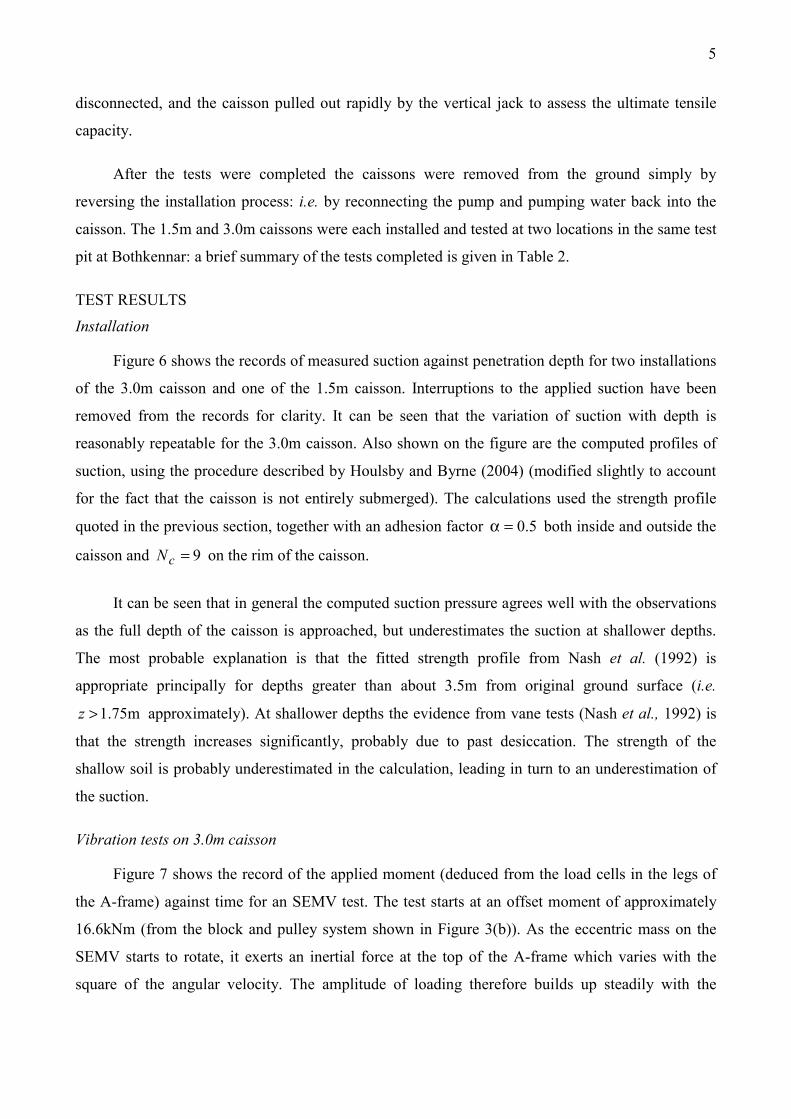
disconnected, and the caisson pulled out rapidly by the vertical jack to assess the ultimate tensile
capacity.
After the tests were completed the caissons were removed from the ground simply by
reversing the installation process: i.e. by reconnecting the pump and pumping water back into the
caisson. The 1.5m and 3.0m caissons were each installed and tested at two locations in the same test
pit at Bothkennar: a brief summary of the tests completed is given in Table 2.
TEST RESULTS
Installation
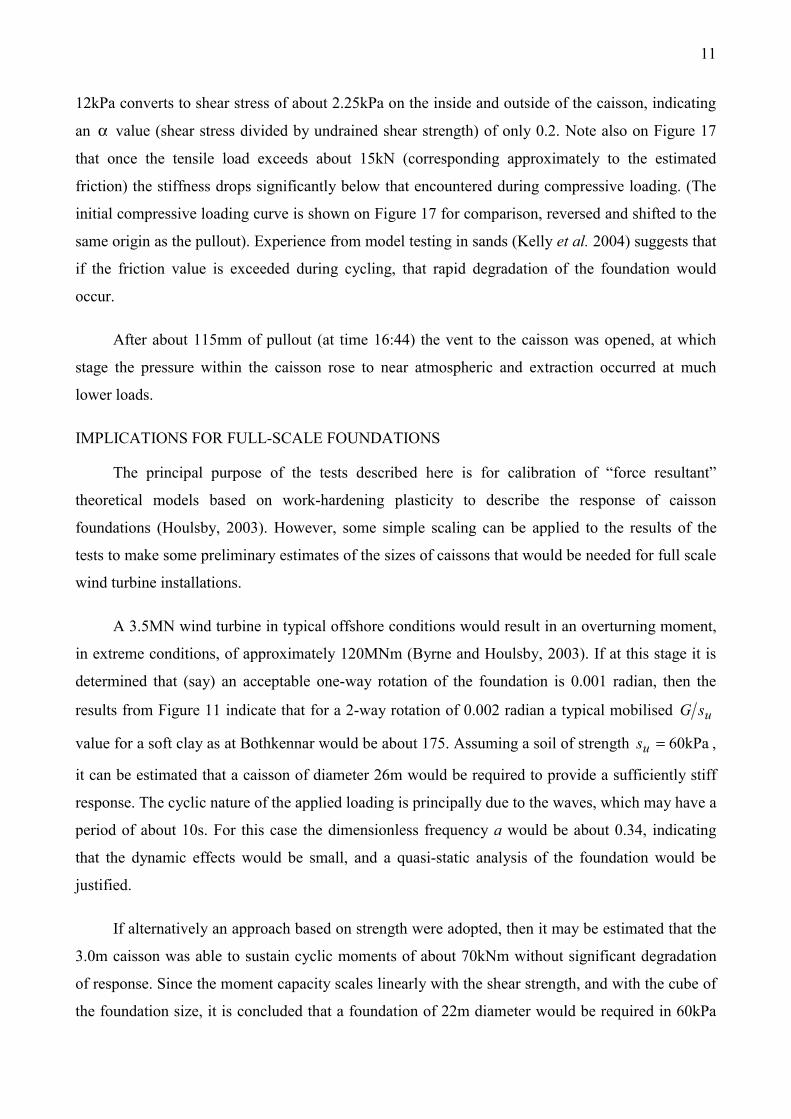
Figure 6 shows the records of measured suction against penetration depth for two installations
of the 3.0m caisson and one of the 1.5m caisson. Interruptions to the applied suction have been
removed from the records for clarity. It can be seen that the variation of suction with depth is
reasonably repeatable for the 3.0m caisson. Also shown on the figure are the computed profiles of
suction, using the procedure described by Houlsby and Byrne (2004) (modified slightly to account
for the fact that the caisson is not entirely submerged). The calculations used the strength profile
quoted in the previous section, together with an adhesion factor 5.0=α both inside and outside the
caisson and 9=cN on the rim of the caisson.
It can be seen that in general the computed suction pressure agrees well with the observations
as the full depth of the caisson is approached, but underestimates the suction at shallower depths.
The most probable explanation is that the fitted strength profile from Nash et al. (1992) is
appropriate principally for depths greater than about 3.5m from original ground surface (i.e.
m75.1>z approximately). At shallower depths the evidence from vane tests (Nash et al., 1992) is
that the strength increases significantly, probably due to past desiccation. The strength of the
shallow soil is probably underestimated in the calculation, leading in turn to an underestimation of
the suction.
Vibration tests on 3.0m caisson
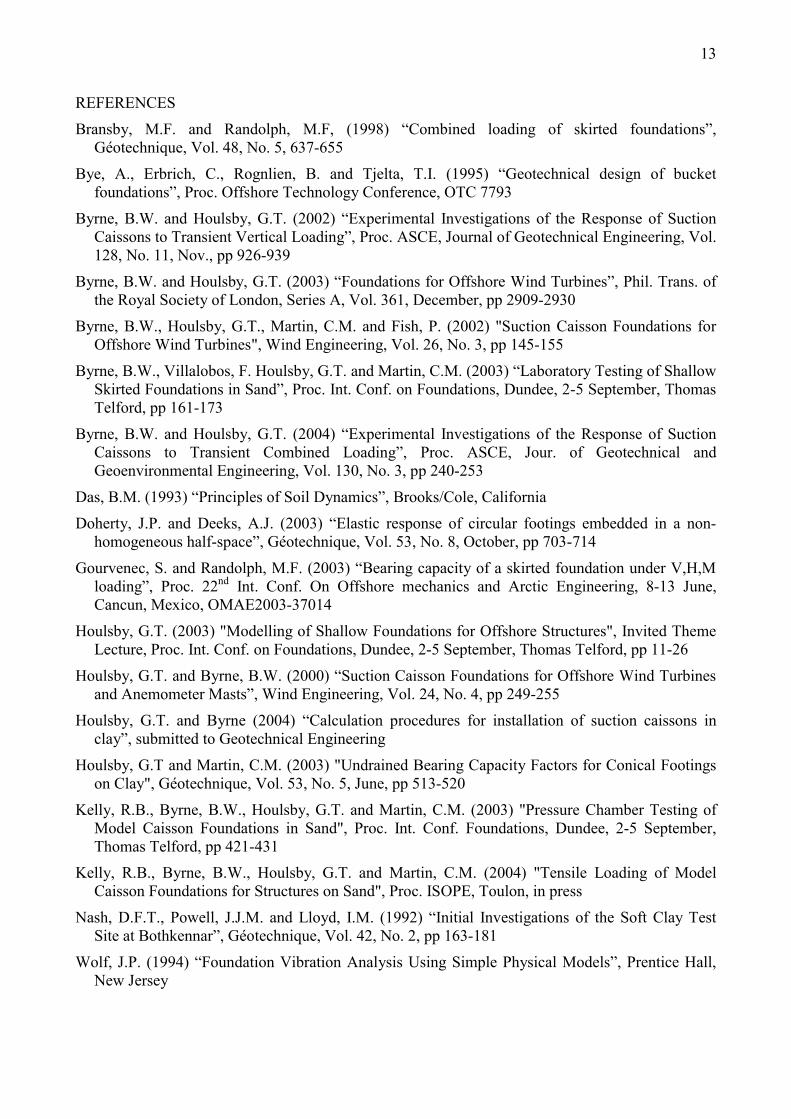
Figure 7 shows the record of the applied moment (deduced from the load cells in the legs of
the A-frame) against time for an SEMV test. The test starts at an offset moment of approximately
16.6kNm (from the block and pulley system shown in Figure 3(b)). As the eccentric mass on the
SEMV starts to rotate, it exerts an inertial force at the top of the A-frame which varies with the
square of the angular velocity. The amplitude of loading therefore builds up steadily with the

6
frequency, with a minor fluctuation at about 7Hz ( s11≈t in Figure 7) due to a resonance of the
suspended mass providing the offset moment.
Figure 8 shows the resulting moment-rotation response. The initial small amplitude cycles (at
low frequency) plot as the densely packed curves in the centre of the diagram, showing a high
stiffness and relatively little hysteresis. The line through the data shows a rotational stiffness of
225MNm/radian. As the amplitude of moment increases the moment-rotation loop opens up
gradually, until the steady state of 10Hz cycling is reached, at which stage an approximately
elliptical loop (the outer loop in the diagram) is continually retraced. The open loop arises from
damping which has three possible causes (a) viscous material damping, (b) plastic dissipation of
energy in the soil and (c) radiation damping.
The data can be interpreted by first taking the Fast Fourier Transform of both the moment and
rotation to convert to the frequency domain, and then taking the ratio between the two FFT’s to
obtain the complex, frequency-dependent impedance. The real part of the impedance represents the
stiffness and inertial effects, and the imaginary part the damping. The main information on the
effects of frequency on the response is contained within the transients at the beginning and end of
the test, and Figure 9 shows the real and imaginary parts of the transfer function computed for two
20s periods covering these transients. Also shown at 10Hz are the real and imaginary components
computed directly from the steady state response.
The data may be compared with theories for the behaviour of a circular foundation on an
elastic material. Wolf (1994) describes two lumped-parameter models for this case. Wolf presents
models both for surface and embedded footings. Whilst recognising that the caisson is in fact
embedded into the soil, we use here a preliminary analysis based on factors for surface footings.
The analysis of embedded footings requires consideration of cross-coupling between moment and
horizontal loading terms, and these coupling effects differ for the stiffness and damping.
Furthermore the role of the inertial terms in the rocking mode is not fully resolved. The principal
effect of ignoring the footing embedment is that, in the following, the stiffness coefficients may be
underestimated (by a factor which may be in the region of 1.5, but depending on the assumptions
about interactions on the side of the caisson, and the variation of stiffness with depth), and the shear
modulus correspondingly overestimated. Whilst this affects the absolute values of the moduli
discussed below, it does not affect their relative values.
7
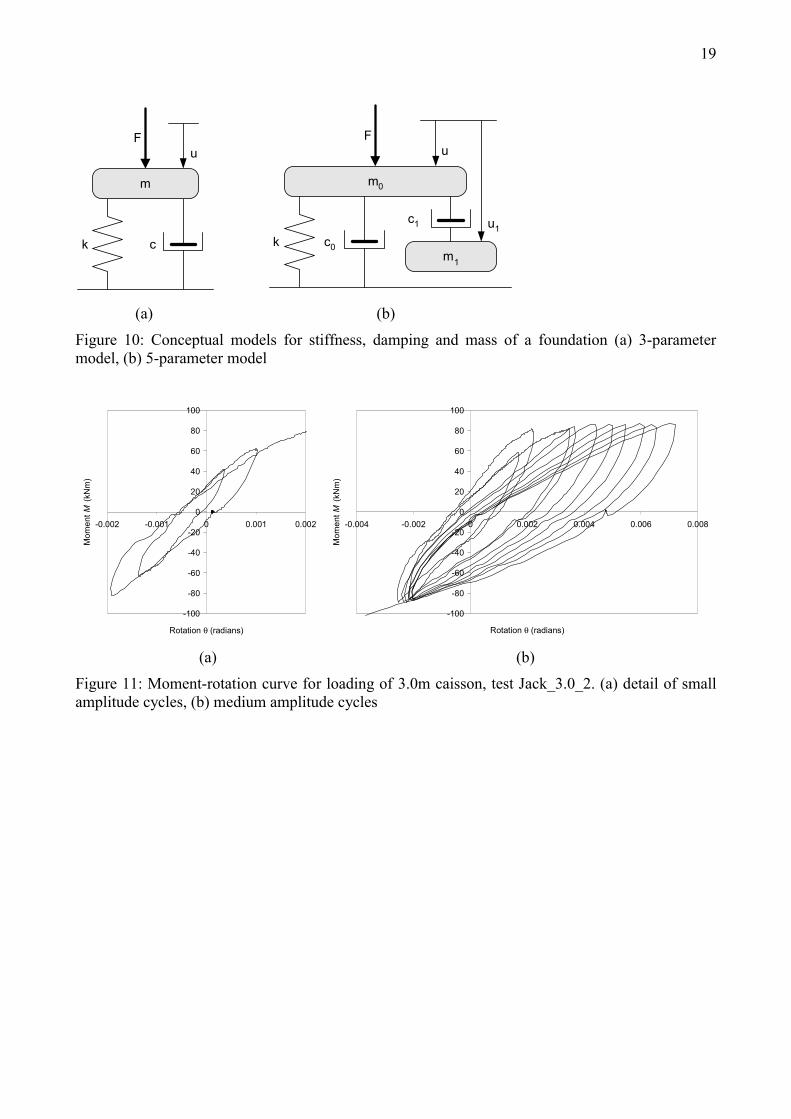
Wolf’s first model is a 3-parameter model represented conceptually by Figure 10(a). For a
rigid circular footing at the surface of an elastic soil subjected to moment loads, so that MF ≡ (the
applied moment) and θ≡u (the corresponding rotation), the rotational stiffness is ( )ν−=
138 3GRk ,
where G is the shear modulus and ν is Poisson’s ratio. The damping and mass coefficients are
calculated by kvRcs
γ= and kvRm
s2
2µ= , where γ and µ are dimensionless coefficients and
ρ= Gvs is the shear wave velocity ( ρ is the clay density). Note that although the soil is
assumed to be purely elastic, there is loss of energy through “radiation damping”, which accounts
for transmission of energy away from the foundation to an infinitely distant boundary. Adapting the
methods of Wolf (1994) and Das (1993) suggests the values 242.0=γ and 24.0=µ . The real part
of the impedance is mk 2ω− and the imaginary part is cω , and these are shown on Figure 9 for
comparison with the data, computed for MPa5.12=G . Examining first the real part, the theory
provides a reasonable fit to the data at low frequency, but overestimates the stiffness at higher
frequencies: this is because the higher frequencies involved higher amplitude cycling, for which the
secant shear stiffness of the soil would be expected to reduce.
Wolf (1994) suggested the alternative 5-parameter model shown conceptually in Figure 10(b)
as a more accurate representation of the foundation behaviour. The stiffness K is as for the 3-
parameter model, and damping and mass coefficients are defined in a similar way to those in the 3-
parameter model, but with suggested values for 5.0=ν of 00 =γ , 0267.00 =µ , 345.01 =γ ,
29.01 =µ . (Note that for the moment-rotation case the general 5-parameter model thus reduces
effectively to a 4-parameter model). In this case the real and imaginary parts of the impedance can
be calculated as
µ−
γµ+
µ− 0
221
21
21
2
11 a
aak and ( )
γ+
γµ+γ
µ02
121
21
21
2
1 aaak where svRa ω= is
the dimensionless angular velocity. Figure 9 shows that the 5-parameter model gives a very similar
variation of the real part of the impedance to the 3-parameter model. However, within the range of
frequencies tested it gives a lower imaginary part (which represents the damping).
Comparing with the data, it is clear that, in order to fit the real part of the impedance the
stiffness of the foundation would have to be reduced as the frequency increased (and amplitude of
loading increased). Of course this reduction in stiffness is accompanied by an increase in the
material damping, which is not taken into account by this model. One therefore expects the

8
damping (imaginary part of the impedance) to be underestimated at higher frequencies by the
simple elastic model. The 5-parameter model therefore provides a better representation of the real
behaviour, since this underestimates the damping. It is worth noting that whilst the rotation of the
caisson during steady state cycling is very closely fitted by a 10Hz sinusoid, the moment contains
significant higher frequencies, with the 20Hz component being about 15% of the amplitude of the
10Hz fundamental. Such a response is indicative of non-linearities (such as plastic dissipation) not
accounted for in the simple 3- or 5-parameter models.
Jacking tests on 3.0m caisson
Following the SEMV tests, the 3.0m caisson was subjected to further cycles of moment, but
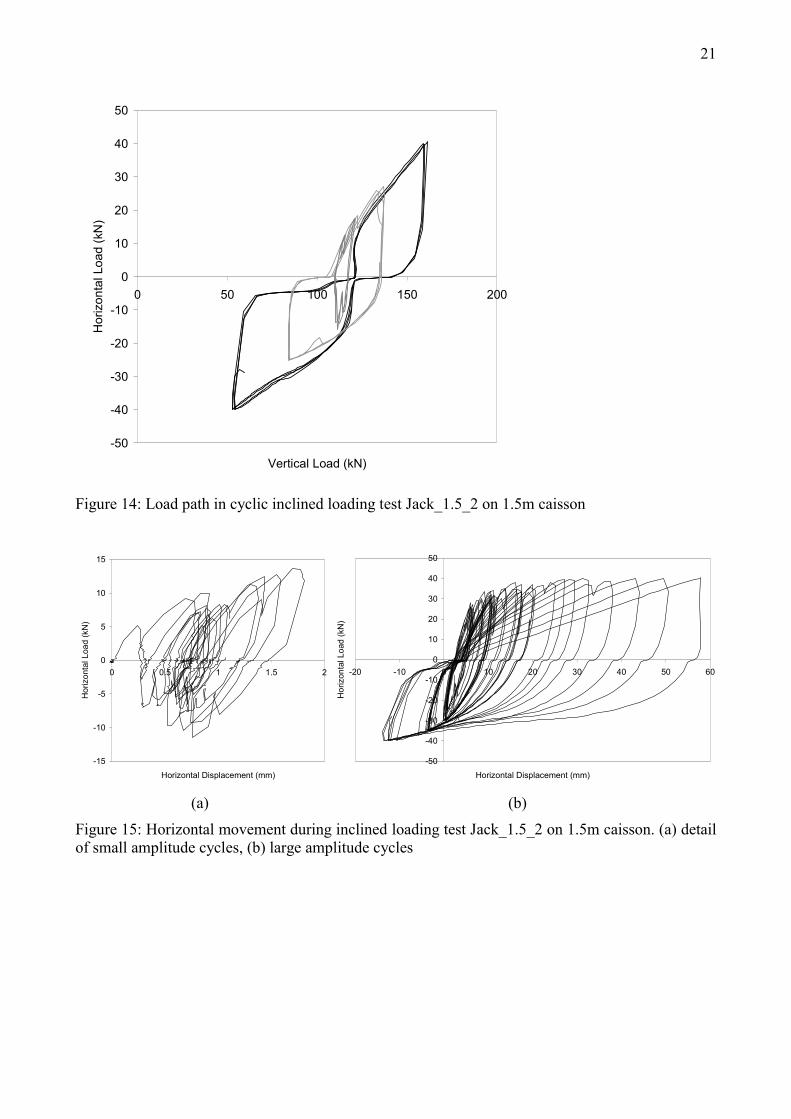
under quasi-static conditions, by loading with a hydraulic jack, Figure 3(a). Figure 11(a) shows an
example of the resulting moment-rotation curve for the first few, small amplitude, cycles of test
Jack_3.0_2, showing significant hysteresis even at this stage. Figure 11(b) shows the continuation
of the same test to larger amplitude, showing that not only does hysteresis increase with amplitude,
but also that there is a degradation of the stiffness over several cycles of loading. The degraded
response does, however, appear to be gradually stabilising.
Figure 12 shows very large amplitude cycles from test Jack_3.0_1. These cycles are largely of
curiosity value, since at such large displacements a full-size foundation would have “failed” for all
practical purposes. It is worth noting, however, the characteristic shape of the cycles in which, after
an initially stiff unloading, a very flexible response is observed, followed by a slight stiffening. This
behaviour is typical of a “gapping” response in which the stiffening occurs as a gap (created by the
previous half cycle) is closed. Indeed gaps several tens of millimetres wide and up to 1.02m deep
were measured down the side of the caisson during these cycles.
The SEMV and jacking tests may be compared as follows. At each frequency the real part of
the impedance can be used to deduce a secant shear stiffness of the soil. By making use of the fact
that the SEMV applies a load proportional to the square of the frequency, an amplitude of loading
can also be attributed to each frequency. Dividing the amplitude of loading by the impedance allows
an amplitude of rotation to be determined. Hence the secant stiffness can be expressed as a function
of amplitude of rotation. The results are shown on Figure 13, with the set of points for the initial
ramp up showing slightly higher stiffness than the ramp down, possibly because some degradation
of stiffness is attributable to the cycling. Also shown on the figure is a single point deduced from
the steady state conditions: the confidence attached to this value is much higher than for any of the
9
other data, because it is based on many more readings. It is, however, entirely consistent with the
transient data.
Also shown on Figure 13 are the secant stiffness values from jacking test Jack_3.0_2
(conducted immediately after SEMV_2_2), and Jack_3.0_1 (conducted during an earlier installation
of the caisson). These are consistent with the SEMV data in that they show a continuing reduction
of the stiffness with increasing amplitude of cycling, indeed the shape of the ( ) G−θ∆log curve is
very similar to the familiar pattern for variation of stiffness with strain on a ( ) G−γ∆log plot. The
rotation of the caisson is of course approximately proportional to the shear strain amplitude in the
soil. Test Jack_3.0_1 shows a somewhat higher stiffness than Jack_3.0_2, probably because better
control of level was achieved during installation of this caisson, so that a better contact between soil
and the lid of the caisson was probably achieved. (In practice it is likely that any void between the
soil and the lid would be grouted to ensure best performance of the caisson). Finally Figure 13
shows a simple fit to the variation of the secant shear stiffness based on the hyperbolic moment-
rotation relation AMMMM
KM
+−
=θ max
max
0, where 0K is the initial value of the rotational stiffness,
maxM is the maximum moment, and AKK += 2500 where 50K is the secant rotational stiffness
at half the maximum moment. The curve is constructed for MNm/radian2520 =K (corresponding
to MPa140 =G ), kNm135max =M and 8=A .
As mentioned above, a more accurate interpretation of the moment loading tests could be
made by accounting for the embedment of the foundation in the calculation of stiffness factors (see
e.g. Doherty and Deeks (2003)), but this would simply reduce the absolute values of the estimated
stiffness, and not significantly change the relative values or the overall interpretation of the pattern
of response.
Jacking tests on 1.5m caisson
The 1.5m caisson was first loaded to approximately 120kN by the vertical jack, and then
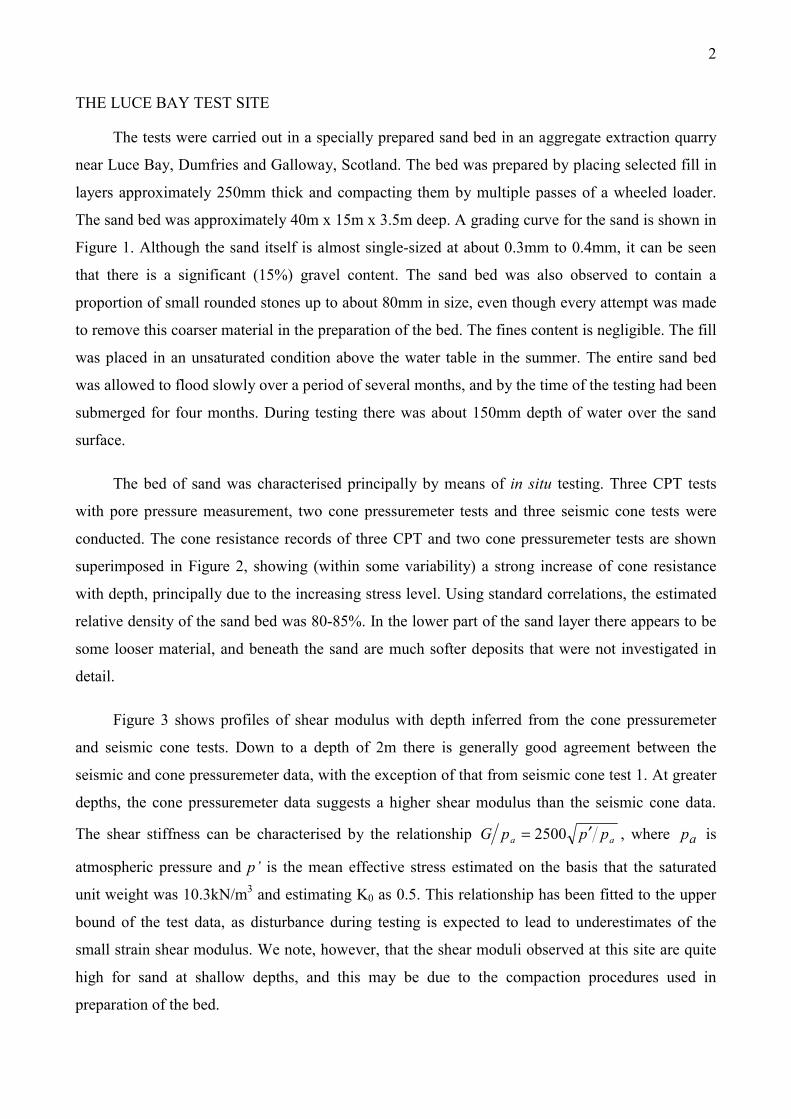
subjected to cyclic loading from the inclined jack. Because of practical difficulties with
simultaneous control of pressures in two hydraulic jacks, the load path was not, however a simple
line in V-H space, but involved a rather complex path as shown in Figure 14 (for clarity in this
figure a considerable amount of data has been removed, and the paths plotted only for a few cycles
near the beginning, middle and end of the test). Importantly, however, the path involved the main
element of loading in the field, in that horizontal loading is accompanied by changes in vertical
10
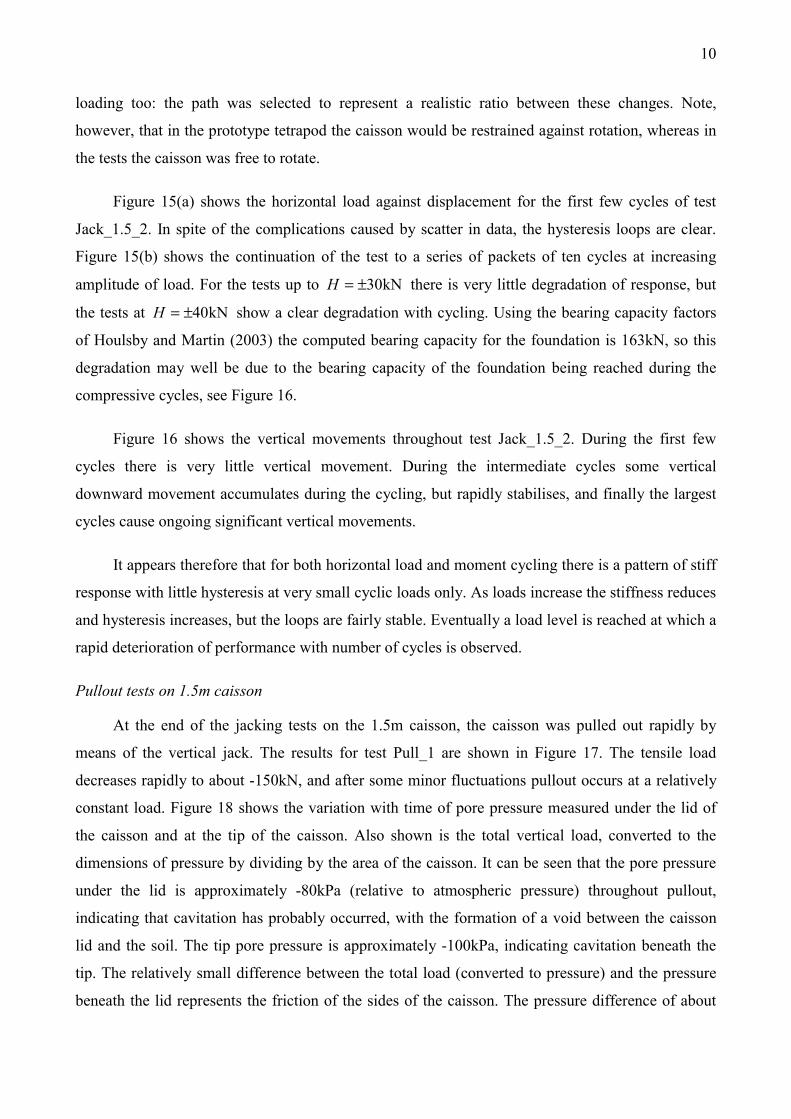
loading too: the path was selected to represent a realistic ratio between these changes. Note,
however, that in the prototype tetrapod the caisson would be restrained against rotation, whereas in
the tests the caisson was free to rotate.
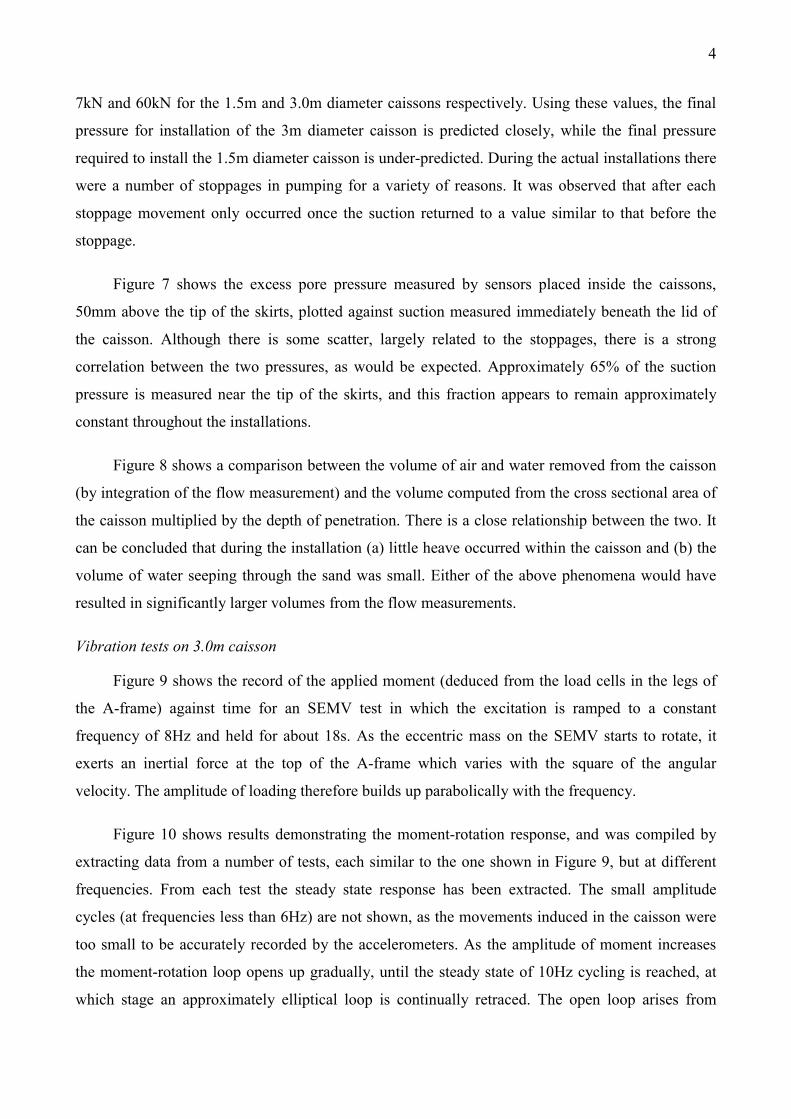
Figure 15(a) shows the horizontal load against displacement for the first few cycles of test
Jack_1.5_2. In spite of the complications caused by scatter in data, the hysteresis loops are clear.
Figure 15(b) shows the continuation of the test to a series of packets of ten cycles at increasing
amplitude of load. For the tests up to kN30±=H there is very little degradation of response, but
the tests at kN40±=H show a clear degradation with cycling. Using the bearing capacity factors
of Houlsby and Martin (2003) the computed bearing capacity for the foundation is 163kN, so this
degradation may well be due to the bearing capacity of the foundation being reached during the
compressive cycles, see Figure 16.
Figure 16 shows the vertical movements throughout test Jack_1.5_2. During the first few
cycles there is very little vertical movement. During the intermediate cycles some vertical
downward movement accumulates during the cycling, but rapidly stabilises, and finally the largest
cycles cause ongoing significant vertical movements.
It appears therefore that for both horizontal load and moment cycling there is a pattern of stiff
response with little hysteresis at very small cyclic loads only. As loads increase the stiffness reduces
and hysteresis increases, but the loops are fairly stable. Eventually a load level is reached at which a
rapid deterioration of performance with number of cycles is observed.
Pullout tests on 1.5m caisson
At the end of the jacking tests on the 1.5m caisson, the caisson was pulled out rapidly by
means of the vertical jack. The results for test Pull_1 are shown in Figure 17. The tensile load
decreases rapidly to about -150kN, and after some minor fluctuations pullout occurs at a relatively
constant load. Figure 18 shows the variation with time of pore pressure measured under the lid of
the caisson and at the tip of the caisson. Also shown is the total vertical load, converted to the
dimensions of pressure by dividing by the area of the caisson. It can be seen that the pore pressure
under the lid is approximately -80kPa (relative to atmospheric pressure) throughout pullout,
indicating that cavitation has probably occurred, with the formation of a void between the caisson
lid and the soil. The tip pore pressure is approximately -100kPa, indicating cavitation beneath the
tip. The relatively small difference between the total load (converted to pressure) and the pressure
beneath the lid represents the friction of the sides of the caisson. The pressure difference of about
11
12kPa converts to shear stress of about 2.25kPa on the inside and outside of the caisson, indicating
an α value (shear stress divided by undrained shear strength) of only 0.2. Note also on Figure 17
that once the tensile load exceeds about 15kN (corresponding approximately to the estimated
friction) the stiffness drops significantly below that encountered during compressive loading. (The
initial compressive loading curve is shown on Figure 17 for comparison, reversed and shifted to the
same origin as the pullout). Experience from model testing in sands (Kelly et al. 2004) suggests that
if the friction value is exceeded during cycling, that rapid degradation of the foundation would
occur.
After about 115mm of pullout (at time 16:44) the vent to the caisson was opened, at which
stage the pressure within the caisson rose to near atmospheric and extraction occurred at much
lower loads.
IMPLICATIONS FOR FULL-SCALE FOUNDATIONS
The principal purpose of the tests described here is for calibration of “force resultant”
theoretical models based on work-hardening plasticity to describe the response of caisson
foundations (Houlsby, 2003). However, some simple scaling can be applied to the results of the
tests to make some preliminary estimates of the sizes of caissons that would be needed for full scale
wind turbine installations.
A 3.5MN wind turbine in typical offshore conditions would result in an overturning moment,
in extreme conditions, of approximately 120MNm (Byrne and Houlsby, 2003). If at this stage it is
determined that (say) an acceptable one-way rotation of the foundation is 0.001 radian, then the
results from Figure 11 indicate that for a 2-way rotation of 0.002 radian a typical mobilised usG
value for a soft clay as at Bothkennar would be about 175. Assuming a soil of strength kPa60=us ,
it can be estimated that a caisson of diameter 26m would be required to provide a sufficiently stiff
response. The cyclic nature of the applied loading is principally due to the waves, which may have a
period of about 10s. For this case the dimensionless frequency a would be about 0.34, indicating
that the dynamic effects would be small, and a quasi-static analysis of the foundation would be
justified.
If alternatively an approach based on strength were adopted, then it may be estimated that the
3.0m caisson was able to sustain cyclic moments of about 70kNm without significant degradation
of response. Since the moment capacity scales linearly with the shear strength, and with the cube of
the foundation size, it is concluded that a foundation of 22m diameter would be required in 60kPa

12
clay with similar properties to that at Bothkennar. Either a strength or a stiffness criterion therefore
results in a foundation of comparable magnitude, but serviceability considerations (i.e.
deformations) lead to a requirement for a larger foundation.
If a tetrapod were to be designed then first the caisson spacing must be determined. For an
overturning moment of 120MNm and a weight of the structure of say 6MN, then a spacing of 40m
is needed if tension is to be avoided completely. The maximum loading on an individual caisson
would be 3MN, which could be carried in a clay of strength 60kPa with a factor of safety of about
1.5 by a caisson of diameter 4.0m. The estimated shear load of 4MN could also be carried by
foundations of this size. It is difficult, however, to assess the influence such a caisson would have
on the stiffness of the structure without more detailed knowledge of the structure itself.
CONCLUSIONS
A series of field trials of caisson foundations in soft clay are described. The tests are relevant
to both monopod and tetrapod designs for foundations for offshore wind turbines. Installation of the
caissons was achieved by suction. High frequency, low amplitude cyclic moment tests on a 3.0m
caisson showed that the response was affected by stiffness, inertial and damping effects. Low
frequency cyclic moment tests on the 3.0m caisson indicate a stiff response at low amplitude, with a
gradual reduction of stiffness and increase of hysteresis at large amplitude. There was evidence of
gapping at the side of the caisson under very large amplitude cycles. Cyclic inclined loading tests
on a 1.5m diameter caisson also show a reduction of stiffness and increase of hysteresis as load
amplitude increases, with a significant reduction in stiffness after the compression to tension
boundary is crossed and frictional capacity exceeded. Pullout of the 1.5m caisson indicated that
ultimate tensile resistance is governed by cavitation beneath the foundation. The tests contribute to
the development of design procedures for offshore wind turbines founded on caissons.
ACKNOWLEDGEMENTS
This research was sponsored by the DTI and a consortium of companies (Fugro Ltd, SLP
Engineering Ltd, Garrad Hassan, General Electric Wind Ltd, Aerolaminates Ltd and Shell
Renewables Ltd). The authors are very grateful to the Royal Society for the Protection of Birds (and
in particular to Mike Trubridge) for making the site available for this testing. The authors thank
Dr A. Blakeborough for use of the SEMV designed by him, and for advice on interpretation of the
SEMV tests.
13
REFERENCES
Bransby, M.F. and Randolph, M.F, (1998) “Combined loading of skirted foundations”, Géotechnique, Vol. 48, No. 5, 637-655
Bye, A., Erbrich, C., Rognlien, B. and Tjelta, T.I. (1995) “Geotechnical design of bucket foundations”, Proc. Offshore Technology Conference, OTC 7793
Byrne, B.W. and Houlsby, G.T. (2002) “Experimental Investigations of the Response of Suction Caissons to Transient Vertical Loading”, Proc. ASCE, Journal of Geotechnical Engineering, Vol. 128, No. 11, Nov., pp 926-939
Byrne, B.W. and Houlsby, G.T. (2003) “Foundations for Offshore Wind Turbines”, Phil. Trans. of the Royal Society of London, Series A, Vol. 361, December, pp 2909-2930
Byrne, B.W., Houlsby, G.T., Martin, C.M. and Fish, P. (2002) "Suction Caisson Foundations for Offshore Wind Turbines", Wind Engineering, Vol. 26, No. 3, pp 145-155
Byrne, B.W., Villalobos, F. Houlsby, G.T. and Martin, C.M. (2003) “Laboratory Testing of Shallow Skirted Foundations in Sand”, Proc. Int. Conf. on Foundations, Dundee, 2-5 September, Thomas Telford, pp 161-173
Byrne, B.W. and Houlsby, G.T. (2004) “Experimental Investigations of the Response of Suction Caissons to Transient Combined Loading”, Proc. ASCE, Jour. of Geotechnical and Geoenvironmental Engineering, Vol. 130, No. 3, pp 240-253
Das, B.M. (1993) “Principles of Soil Dynamics”, Brooks/Cole, California
Doherty, J.P. and Deeks, A.J. (2003) “Elastic response of circular footings embedded in a non-homogeneous half-space”, Géotechnique, Vol. 53, No. 8, October, pp 703-714
Gourvenec, S. and Randolph, M.F. (2003) “Bearing capacity of a skirted foundation under V,H,M loading”, Proc. 22nd Int. Conf. On Offshore mechanics and Arctic Engineering, 8-13 June, Cancun, Mexico, OMAE2003-37014
Houlsby, G.T. (2003) "Modelling of Shallow Foundations for Offshore Structures", Invited Theme Lecture, Proc. Int. Conf. on Foundations, Dundee, 2-5 September, Thomas Telford, pp 11-26
Houlsby, G.T. and Byrne, B.W. (2000) “Suction Caisson Foundations for Offshore Wind Turbines and Anemometer Masts”, Wind Engineering, Vol. 24, No. 4, pp 249-255
Houlsby, G.T. and Byrne (2004) “Calculation procedures for installation of suction caissons in clay”, submitted to Geotechnical Engineering
Houlsby, G.T and Martin, C.M. (2003) "Undrained Bearing Capacity Factors for Conical Footings on Clay", Géotechnique, Vol. 53, No. 5, June, pp 513-520
Kelly, R.B., Byrne, B.W., Houlsby, G.T. and Martin, C.M. (2003) "Pressure Chamber Testing of Model Caisson Foundations in Sand", Proc. Int. Conf. Foundations, Dundee, 2-5 September, Thomas Telford, pp 421-431
Kelly, R.B., Byrne, B.W., Houlsby, G.T. and Martin, C.M. (2004) "Tensile Loading of Model Caisson Foundations for Structures on Sand", Proc. ISOPE, Toulon, in press
Nash, D.F.T., Powell, J.J.M. and Lloyd, I.M. (1992) “Initial Investigations of the Soft Clay Test Site at Bothkennar”, Géotechnique, Vol. 42, No. 2, pp 163-181
Wolf, J.P. (1994) “Foundation Vibration Analysis Using Simple Physical Models”, Prentice Hall, New Jersey

14
Diameter Skirt length DL ratio Wall thickness Approximate mass (including appurtenances)
1.5m 1.0m 0.67 8mm 670kg
3.0m 1.5m 0.5 8mm 2000kg
Table 1: Details of caisson dimensions
Caisson Installation Test type Code Notes
Installation Inst_1.5_1
Jacking test Jack_1.5_1
1
Pull out Pull_1
Installation Inst_1.5_2 No suction data
Jacking test Jack_1.5_2
1.5m
2
Pull out Pull_2 Inclined jack attached, but not pressurised
Installation Inst_3.0_1
SEMV tests SEMV_1_1
SEMV_1_2
SEMV_1_3
No accelerometer data
No accelerometer data
No accelerometer data
1
Jacking test Jack_3.0_1
Installation Inst_3.0_4
SEMV tests SEMV_2_1
SEMV_2_2
50Hz logging
3.0m
2
Jacking test Jack_3.0_2
Table 2: Outline of caisson tests carried out at Bothkennar
Flow
Pressuredifferential
W
Flow
Figure 1: Installation of a suction caisson

15
CaissonCaissons
Turbinesupportstructure
Seabed
Water surface
h h
D
sD
Figure 2: Possible configurations for suction caisson foundations for wind turbines
4000 4000 6000
30001500
H
H
H B
CC
A
RR
W
V
A
B
C
V
LL
L
L L LL
(a) (b) Figure 3: Outline of field testing equipment, dimensions in mm (water in excavation and displacement reference frames not shown). (a) arrangement for jacking tests on 1.5m and 3.0m caissons, (b) alternative arrangement during SEMV tests. Labels indicate (A) A-frame, (B) concrete block, (C) caissons, (H) hydraulic jacks, (L) load cells, (R) foundations of reaction frame, (V) SEMV, (W) weight providing offset load for SEMV tests

16
Figure 4: Test rig showing the 1.5m caisson installed and 3.0m caisson in place for installation
Pressuresensors
Draw-wiredisplacementtransducers
VerticalAccelerometer
3-axisAccelerometer
Figure 5: Outline of instrumentation on caisson (draw wire transducer reference frame not shown)
17
0
200
400
600
800
1000
1200
1400
1600
0 5 10 15 20 25 30 35 40Suction (kPa)
Dis
plac
emen
t (m
m)
1.5m Inst_1.5_11.5m calculated3.0m Inst_3.0_13.0m Inst_3.0_23.0m calculated
Figure 6: Records of suction during penetration
-20
-10
0
10
20
30
40
0 2 4 6 8 10 12 14 16 18 20
Time (s)
Mom
ent M
(kN
m)
Figure 7: Moment v. time for initial phase of test SEMV_2_2

18
-10
0
10
20
30
40
50
-0.0004 -0.0003 -0.0002 -0.0001 0 0.0001 0.0002 0.0003 0.0004
Rotation θ (radians)
Mom
ent M
(kN
m)
Figure 8: Moment-rotation response of caisson in test SEMV_2_2
0
50000
100000
150000
200000
250000
0 1 2 3 4 5 6 7 8 9 10
Frequency (Hz)
Impe
danc
e (k
Nm
/radi
an)
Real, 3-parameterReal, 5-parameterReal SEMV, ramp upReal SEMV, ramp downReal, 10Hz steady stateImaginary, 3-parameterImaginary, 5-parameterImaginary SEMV, ramp upImaginary SEMV, ramp downImaginary, 10Hz steady state
Figure 9: Complex M−θ transfer function for test SEMV_2_2 compared with theoretical expressions for 3- and 5-parameter models
19
m
k c
Fu
m0
k c0
Fu
m1
u1c1
(a) (b)
Figure 10: Conceptual models for stiffness, damping and mass of a foundation (a) 3-parameter model, (b) 5-parameter model
-100
-80
-60
-40
-20
0
20
40
60
80
100
-0.002 -0.001 0 0.001 0.002
Rotation θ (radians)
Mom
ent M
(kN
m)
-100
-80
-60
-40
-20
0
20
40
60
80
100
-0.004 -0.002 0 0.002 0.004 0.006 0.008
Rotation θ (radians)
Mom
ent M
(kN
m)
(a) (b)
Figure 11: Moment-rotation curve for loading of 3.0m caisson, test Jack_3.0_2. (a) detail of small amplitude cycles, (b) medium amplitude cycles

20
-200
-150
-100
-50
0
50
100
150
200
250
-0.04 -0.02 0 0.02 0.04 0.06 0.08 0.1
Rotation θ (radians)
Mom
ent M
(kN
m)
Figure 12: Moment-rotation curve for loading of 3.0m caisson, test Jack_3.0_1: large amplitude cycles
0
2
4
6
8
10
12
14
16
0.00001 0.0001 0.001 0.01 0.1
∆θ (radians)
G (M
Pa)
SEMV_2_2, ramp upSEMV_2_2, ramp downSEMV_2_2, 10Hz steady stateJack_3.0_2Jack_3.0_1Hyperbolic fit
Figure 13: Computed secant shear modulus from test SEMV_2_2 and jacking tests on 3.0m caisson
21
-50
-40
-30
-20
-10
0
10
20
30
40
50
0 50 100 150 200
Vertical Load (kN)
Hor
izon
tal L
oad
(kN
)
Figure 14: Load path in cyclic inclined loading test Jack_1.5_2 on 1.5m caisson
-15
-10
-5
0
5
10
15
0 0.5 1 1.5 2
Horizontal Displacement (mm)
Hor
izon
tal L
oad
(kN
)
-50
-40
-30
-20
-10
0
10
20
30
40
50
-20 -10 0 10 20 30 40 50 60
Horizontal Displacement (mm)
Hor
izon
tal L
oad
(kN
)
(a) (b)
Figure 15: Horizontal movement during inclined loading test Jack_1.5_2 on 1.5m caisson. (a) detail of small amplitude cycles, (b) large amplitude cycles

22
0
20
40
60
80
100
120
140
160
180
0 5 10 15 20 25Vertical Displacement (mm)
Verti
cal L
oad
(kN
)
Figure 16: Vertical movement during inclined cyclic loading test Jack_1.5_2 on 1.5m caisson
-180
-160
-140
-120
-100
-80
-60
-40
-20
0-200 -175 -150 -125 -100 -75 -50 -25 0
Vertical displacement (mm)
Verti
cal l
oad
(kN
)
PulloutLoading curve (shifted and reversed)
Figure 17: Load v. displacement during pullout test Pull_1

23
-120
-100
-80
-60
-40
-20
0
20
16:25 16:30 16:35 16:40 16:45 16:50
Pres
sure
(kPa
)
Lid pressureSkirt pressureTotal load/area
Figure 18: Record of pull out of 1.5m caisson, test Pull_1


1
Field trials of suction caissons in sand for offshore wind turbine foundations
G.T. Houlsby1, R.B. Kelly1, J. Huxtable2 and B.W. Byrne1 Keywords: bearing capacity, sand, dynamic test, foundations, stiffness
ABSTRACT
A programme of testing on suction caisson foundations in an artificially prepared sand test
bed near Luce Bay, in Scotland, is described. The tests are relevant to the design of either monopod
or quadruped foundations for offshore wind turbines. Records are presented for suction installation
of the caissons, cyclic moment loading under both quasi-static and dynamic conditions to simulate
the behaviour of a monopod foundation, and cyclic vertical loading and pullout of caissons to
simulate one footing in a quadruped foundation. Variations of stiffness with loading level of the
foundation are observed, with high initial stiffness followed by hysteretic behaviour at moderate
loads and degradation of response at high loads. Some implications for the design of wind turbine
foundations are briefly discussed.
INTRODUCTION
The offshore wind energy industry is a very rapidly expanding sector of vital economic
importance in the UK, and the foundation represents an important part of the costs of offshore wind
turbine installations (Byrne and Houlsby, 2003). This paper describes a series of tests directed
towards the understanding of the behaviour of suction caisson foundations in sand, as possible
foundations for offshore wind turbines.
An earlier paper, by Houlsby et al. (2004), describes in detail the background motivation to
this testing, and presents equivalent data for tests in clay. The testing programme described here
follows a similar pattern to the tests in clay, and includes tests directed towards the design of both
monopod and quadruped foundations for offshore wind turbines. The most important load case for a
monopod foundation is the applied overturning moment, whilst for a quadruped foundation thee
vertical loading on an individual caissons is most important. Data were obtained from the
installation phases for each caisson. Loading of the caissons was by means of a combination of dead
weights, hydraulic jacks and inertial loading from a “Structural Eccentric Mass Vibrator” (SEMV).
The test programme was designed by Oxford University, and site operations were managed by
Fugro Structural Monitoring Ltd. The tests were carried out in February and March 2004. 1 Department of Engineering Science, Oxford University 2 Fugro Structural Monitoring Ltd.
2
THE LUCE BAY TEST SITE
The tests were carried out in a specially prepared sand bed in an aggregate extraction quarry
near Luce Bay, Dumfries and Galloway, Scotland. The bed was prepared by placing selected fill in
layers approximately 250mm thick and compacting them by multiple passes of a wheeled loader.
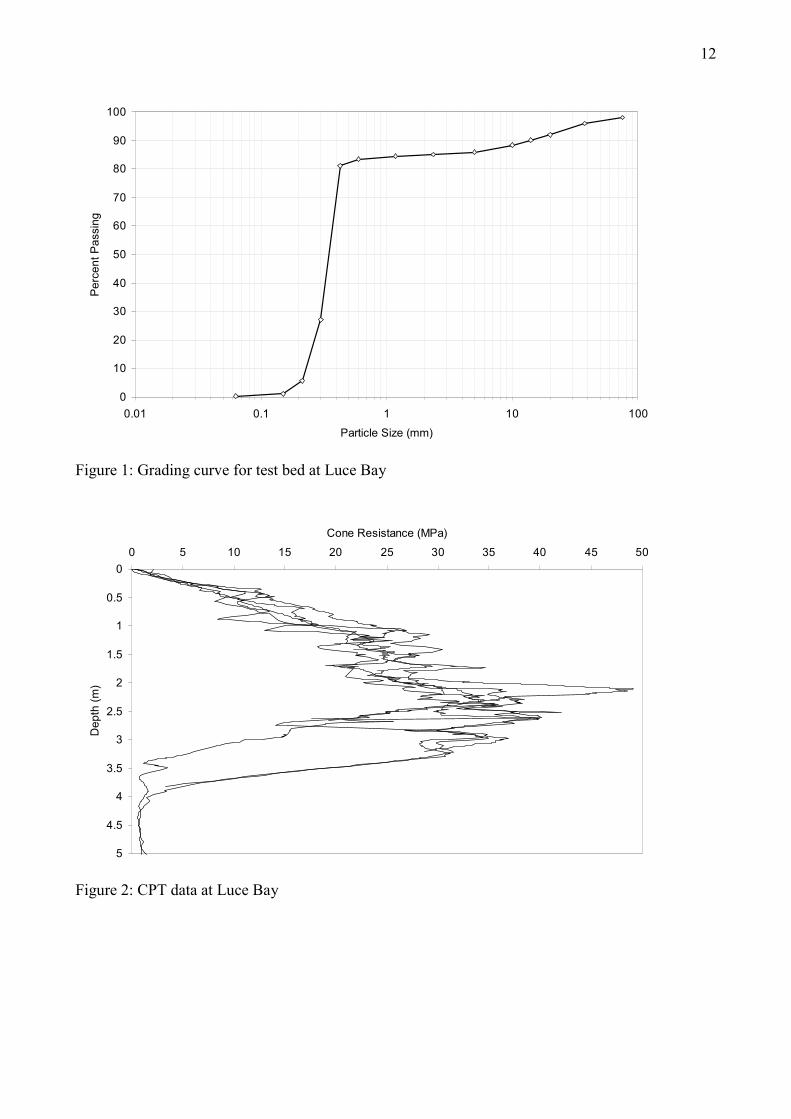
The sand bed was approximately 40m x 15m x 3.5m deep. A grading curve for the sand is shown in
Figure 1. Although the sand itself is almost single-sized at about 0.3mm to 0.4mm, it can be seen
that there is a significant (15%) gravel content. The sand bed was also observed to contain a
proportion of small rounded stones up to about 80mm in size, even though every attempt was made
to remove this coarser material in the preparation of the bed. The fines content is negligible. The fill
was placed in an unsaturated condition above the water table in the summer. The entire sand bed
was allowed to flood slowly over a period of several months, and by the time of the testing had been
submerged for four months. During testing there was about 150mm depth of water over the sand
surface.
The bed of sand was characterised principally by means of in situ testing. Three CPT tests
with pore pressure measurement, two cone pressuremeter tests and three seismic cone tests were
conducted. The cone resistance records of three CPT and two cone pressuremeter tests are shown
superimposed in Figure 2, showing (within some variability) a strong increase of cone resistance
with depth, principally due to the increasing stress level. Using standard correlations, the estimated
relative density of the sand bed was 80-85%. In the lower part of the sand layer there appears to be
some looser material, and beneath the sand are much softer deposits that were not investigated in
detail.
Figure 3 shows profiles of shear modulus with depth inferred from the cone pressuremeter
and seismic cone tests. Down to a depth of 2m there is generally good agreement between the
seismic and cone pressuremeter data, with the exception of that from seismic cone test 1. At greater
depths, the cone pressuremeter data suggests a higher shear modulus than the seismic cone data.
The shear stiffness can be characterised by the relationship aa pppG ′= 2500 , where ap is
atmospheric pressure and p’ is the mean effective stress estimated on the basis that the saturated
unit weight was 10.3kN/m3 and estimating K0 as 0.5. This relationship has been fitted to the upper
bound of the test data, as disturbance during testing is expected to lead to underestimates of the
small strain shear modulus. We note, however, that the shear moduli observed at this site are quite
high for sand at shallow depths, and this may be due to the compaction procedures used in
preparation of the bed.

3
EQUIPMENT AND TESTING PROCEDURES
The caissons, loading frame and instrumentation methods used for the tests in sand were
essentially identical to those employed in the previous clay tests at Bothkennar (Houlsby et al.,
2004). A caisson of diameter of 3.0m and a with skirt 1.5m deep was used for moment loading
tests. A second caisson of diameter of 1.5m and with a 1.0m skirt was used for vertical loading
tests. An outline diagram of the test set-up is given in Figure 4, and a photograph of the rig installed
at the Luce Bay testing site shown in Figure 5.
Prior to suction-assisted installation the caissons were allowed to penetrate under their own
weight with the vent to the caisson open to air. In the case of the 3m caisson a 2400kg mass was
added to the caisson to cause a slight further penetration. The caisson vent was then closed and
suction applied by pumping out the trapped air from inside the caisson. The pump used was capable
of pumping both air and water. A flow meter was installed between the caisson and pump.
The testing procedures in sand were very similar to those adopted for the tests in clay
(Houlsby et al, 2004). The principal exception related to the “SEMV” tests using a Structural
Eccentric Mass Vibrator to apply relatively high-frequency cyclic loading. Experience from the
earlier clay tests indicated the value of having a spread of data obtained at different frequencies of
loading. At Luce Bay a series of tests were therefore carried out, in which the frequency was
increased in steps, with approximately 15s of cycling at each frequency. A more reliable definition
of the variation of the complex impedance with frequency was possible using this method.
The 1.5m and 3.0m caissons were each installed and tested at two locations in the test bed at
Luce Bay: a brief summary of the tests completed is given in Table 1.
TEST RESULTS
Installation
Figure 6 shows the records of measured suction against penetration depth for one installation
of the 3.0m caisson and one of the 1.5m caisson. It can be seen that the variation of the required
suction with depth is similar for both caissons. Also shown on the figure are the computed profiles
of suction, using the procedure described by Houlsby and Byrne (2004) (modified slightly to
account for the fact that the caisson is not entirely submerged). The parameters used in the
calculations were a soil friction angle of 45°, Ktanδ = 1, an effective unit weight of 10.3kN/m3, the
ratio of permeability inside the caisson to outside the caisson was 3 and stress distribution factors
‘m’ and ‘n’ were taken as 1. The vertical load, including self weight, applied to the caissons was
4
7kN and 60kN for the 1.5m and 3.0m diameter caissons respectively. Using these values, the final
pressure for installation of the 3m diameter caisson is predicted closely, while the final pressure
required to install the 1.5m diameter caisson is under-predicted. During the actual installations there
were a number of stoppages in pumping for a variety of reasons. It was observed that after each
stoppage movement only occurred once the suction returned to a value similar to that before the
stoppage.
Figure 7 shows the excess pore pressure measured by sensors placed inside the caissons,
50mm above the tip of the skirts, plotted against suction measured immediately beneath the lid of
the caisson. Although there is some scatter, largely related to the stoppages, there is a strong
correlation between the two pressures, as would be expected. Approximately 65% of the suction
pressure is measured near the tip of the skirts, and this fraction appears to remain approximately
constant throughout the installations.
Figure 8 shows a comparison between the volume of air and water removed from the caisson
(by integration of the flow measurement) and the volume computed from the cross sectional area of
the caisson multiplied by the depth of penetration. There is a close relationship between the two. It
can be concluded that during the installation (a) little heave occurred within the caisson and (b) the
volume of water seeping through the sand was small. Either of the above phenomena would have
resulted in significantly larger volumes from the flow measurements.
Vibration tests on 3.0m caisson
Figure 9 shows the record of the applied moment (deduced from the load cells in the legs of
the A-frame) against time for an SEMV test in which the excitation is ramped to a constant
frequency of 8Hz and held for about 18s. As the eccentric mass on the SEMV starts to rotate, it
exerts an inertial force at the top of the A-frame which varies with the square of the angular
velocity. The amplitude of loading therefore builds up parabolically with the frequency.
Figure 10 shows results demonstrating the moment-rotation response, and was compiled by
extracting data from a number of tests, each similar to the one shown in Figure 9, but at different
frequencies. From each test the steady state response has been extracted. The small amplitude
cycles (at frequencies less than 6Hz) are not shown, as the movements induced in the caisson were
too small to be accurately recorded by the accelerometers. As the amplitude of moment increases
the moment-rotation loop opens up gradually, until the steady state of 10Hz cycling is reached, at
which stage an approximately elliptical loop is continually retraced. The open loop arises from

5
damping which has three possible causes (a) viscous material damping, (b) plastic dissipation of
energy in the soil and (c) radiation damping. The minor axes of these ellipses are much smaller than
those recorded at Bothkennar, indicating that much less damping occurs in dense sand than in soft
clay.
The data can be interpreted by first taking the Fast Fourier Transform of both the moment and
rotation signals to convert to the frequency domain, and then taking the ratio between the two FFT’s
to obtain the complex, frequency-dependent “impedance” (a generalised form of the rotational
stiffness). The real part of the impedance represents stiffness and inertial effects, and the imaginary
part the damping. At Bothkennar, the main information on the effects of frequency on the response
was obtained from the transients at the beginning and end of the test, while at Luce Bay the
information was gathered from the steady state of individual tests, stepped at 1Hz intervals from
1Hz to 10Hz. Figure 11 shows the real and imaginary parts of the transfer function computed from
5Hz-10Hz. Also shown as discrete points are the average responses computed at each steady state.
The averaged points can be regarded as much more reliable, as they are derived from much more
data, but it can be seen that in fact the transfer function deduced from the transient response agrees
well with the averaged points.
The data may be compared with theories for the behaviour of a circular foundation on an
elastic material. As discussed by Houlsby et al. (2004), Wolf (1994) describes two lumped-
parameter models for this case, a 3-parameter model and a 5-parameter model. The fitted response
from a 3-parameter model is shown on Figure 11 for comparison with the test data, computed for
MPa85=G and ν = 0.2. Examining first the real part, the stiffness is chosen to provide a reasonable
fit to the data at frequencies in the range 5Hz to 6Hz, but overestimates the stiffness at higher
frequencies. This is of course consistent with the common observation that the stiffness of soils
reduces with strain amplitude, so that a constant stiffness model cannot fit behaviour across a wide
range of strain amplitudes. No fit from a 5-parameter model is shown in Figure 11, as the 5-
parameter model gives a very similar variation of the real part of the impedance to the 3-parameter
model. However, within the range of frequencies tested the 5-parameter model gives a much lower
imaginary part of the impedance (representing the damping). The 3-parameter model appears to be
more satisfactory in this respect.
Jacking tests on 3.0m caisson
Following the SEMV tests, the 3.0m caisson was subjected to further cycles of moment, but
under quasi-static conditions, by loading with a hydraulic jack, Figure 4(a). Figure 12 shows the

6
moment-rotation curve for cycles from test LB_Jack_3.0_1. The moment-rotation response is
initially stiff with little hysteresis. At larger amplitudes of rotation the secant stiffness decreases and
hysteresis increases as the amplitude increases. The cycles at very large amplitude have a
characteristic shape in which, after an initially stiff unloading, a very flexible response is observed,
followed by slight stiffening. This behaviour is typical of a “gapping” response in which the
stiffening occurs as the gap created during the previous half cycle is closed. Gaps were observed
down the side of the caisson during these cycles.
The moment-rotation curve for jacking test LB_Jack_3.0_2 is shown in Figure 13. In this test
packets of 10 cycles were applied to the caisson with amplitudes of ±42kN/m, ±85kN/m, ±169kN/m
and ±254kN/m. As for the data in Figure 12, the displacement amplitude increases with load
amplitude and hysteresis occurs during the larger amplitude cycles. The unload-reload parts of the
curve in Figure 13 are stiffer than those in Figure 12. There is a slight shakedown apparent in the
data at low amplitudes of rotation, with a slight stiffening occurring over several cycles of the same
amplitude. The moment-rotation response during each packet of cycles appears to approach a steady
state by the end of the packet. Byrne and Houlsby (2004) have made similar observations about
hysteretic behaviour during cycling from small-scale moment loading tests on caissons in the
laboratory.
The SEMV and jacking tests may be compared by deducing the equivalent secant shear
modulus from the moment-rotation response of the footing using standard formulae for response of
a surface footing to moment loads. For the SEMV tests the moment range is taken as the difference
between the maximum and minimum values in any given cycle, and the corresponding rotations are
computed. The secant stiffness can then be expressed as a function of amplitude of rotation as
shown in Figure 14. Also shown on Figure 14 are the secant stiffness values from jacking test
LB_Jack_3.0_1. These are consistent with the SEMV data in that they show a continuing reduction
of the stiffness with increasing amplitude of cycling: indeed the shape of the ( ) G−θ∆log curve is
very similar to the familiar pattern for variation of stiffness with strain on a ( ) G−γ∆log plot. The
rotation of the caisson is of course approximately proportional to the shear strain amplitude in the
soil. Finally Figure 14 shows a simple fit to the variation of the secant shear stiffness based on the
hyperbolic moment-rotation relation AMMMM
KM
+−
=θ max
max
0, where 0K is the initial value of the
rotational stiffness, maxM is the maximum moment, and AKK += 2500 . The curve is
7
constructed for MNm/radian11250 =K (corresponding to MPa1000 =G ), kNm450max =M and
4=A .
More accurate interpretation of the moment loading tests could be made by accounting for the
embedment in the calculation of stiffness factors (see e.g. Doherty and Deeks (2003)), but this
would simply reduce the absolute values of the estimated soil stiffness, and not significantly change
the relative values in the overall interpretation of the pattern of response.
Jacking tests on 1.5m diameter caissons
Two jacking tests were conducted on the 1.5m caisson. Test LB_Jack_1.5_1 involved an
application of combined vertical and horizontal loads to the caisson via vertical and inclined jacks.
A vertical jack applied the mean vertical load, while the inclined jack provided a cyclic loading
component. This test was not successful, as it was not possible to control either the mean or cyclic
loads accurately, because the soil/caisson/jack system was sufficiently stiff that the jacks were not
able to operate independently of each other.
Cyclic vertical loading was applied to the 1.5m diameter caisson in Test LB_Jack_1.5_2
about a mean load of 60kN (not including the self-weight of the caisson). Packets of 10 cycles were
applied to the caisson with load amplitudes starting at ±10kN and increasing in steps of ±10kN to
±100kN, and these are shown in Figure 15. The data show that the secant stiffness decreases as the
amplitude of the load increases. Furthermore the displacements increase markedly during load
packets where the caisson was cycled into tension. It is of interest to note that the net displacement
after each cycle in the ±100kN load packet was downward, even though large tensile displacements
had occurred during each cycle. The implication of this is that, as long as the mean vertical load is
compressive, a caisson foundation cycled into tension will ratchet into the sand rather than out of
the sand. However, the data also suggest that caissons should not be loaded in tension for
serviceability reasons, as the stiffness of the caisson reduces to a level where foundation movements
would render a wind turbine inoperable. The data show that the caisson has a significant cyclic
tensile capacity (in excess of -40kN) but extremely large displacements are required to mobilise this
capacity. These data support conclusions made from small-scale laboratory tests (Byrne and
Houlsby 2002, Kelly et al., 2003, 2004), and this comparison was an important objective for the
large-scale testing programme.

8
Pullout tests on 1.5m caisson
At the end of the jacking tests on the 1.5m caisson, the caisson was pulled out rapidly by
means of the vertical jack. The results for test LB_Pull_2 are shown in Figure 16. The tensile load
decreases rapidly to about -120kN, when a vent plug in the lid of the caisson was opened to prevent
damage to the load cell. The tensile load had not reached a maximum by this stage. The proportion
of the tensile load generated by suction pressure inside the caisson is also shown in Figure 16. The
difference between the total load carried by the caisson and the suction load represents the friction
acting on the skirts of the caisson.
The frictional load generated on the skirts of the caisson, as it was pulled out of the sand, is
shown in Figure 17, along with an estimate of the friction load computed using the method
described by Kelly et al., (2003). The calculation was conducted with Ktanδ = 0.75. This
calculation is based on similar principles to that used to predict the suction during installation
shown in Figure 6. The parameters used in the calculations are identical, with the exception that
Ktanδ = 1 was used for installation. The differences between the values of Ktanδ used are
considered to be relatively small, given the approximations involved in modelling caisson
installation/extraction in an idealised soil.
IMPLICATIONS FOR FULL-SCALE FOUNDATIONS
The principal purpose of the tests described here is for calibration of “force resultant”
theoretical models based on work-hardening plasticity to describe the response of caisson
foundations (Houlsby, 2003). However, some simple scaling can be applied to the results of the
tests to make some preliminary estimates of the sizes of caissons that would be needed for full-scale
wind turbine installations.
A 3.5MN wind turbine in typical offshore conditions would result in an overturning moment,
in extreme conditions, of approximately 120MNm (Byrne and Houlsby, 2003). If at this stage it is
determined that (say) an acceptable two-way rotation of the foundation is 0.002 radian, then the
results from Figure 14 indicate that for this rotation the shear modulus would be about 15MPa. If it
is assumed that the shear modulus scales with the square root of the mean stress, then it can be
estimated that a caisson of diameter 20m would be required to provide a sufficiently stiff response
in sand with a relative density of about 80%. The cyclic nature of the applied loading is principally
due to the waves, which may have a period of about 10s. For this case the dimensionless frequency
a = ωR/cs, (where ω is the frequency, R is the caisson radius and cs is the shear wave velocity =
9
200m/s), would be about 0.03, indicating that the dynamic effects would be minimal (Wolf, 1994),
and a quasi-static analysis of the foundation would be fully justified.
If alternatively an approach based on strength were adopted, then it may be estimated that the
3.0m caisson was able to sustain cyclic moments of about 0.12MNm without significant
degradation of response. Since the moment capacity scales linearly with the effective unit weight,
and with the fourth power of the foundation size, it is concluded that a foundation of 17m diameter
would be required in sand with a unit weight of 10.3kN/m3 with similar properties to that at Luce
Bay. Byrne and Houlsby (2003) proposed Equation 1 as another method for estimating the diameter
of a monopod foundation at low vertical loads:
( )WVM
2RH2RM
3
1
21 fff +
+=−
(1)
where, M is the overturning moment, R is the radius of the caisson, H is the horizontal load, V is the
vertical load and W is the effective weight of the sand inside the caisson. The factors f1, f2 and f3
were obtained from a limited number of small-scale laboratory tests and are equal to 3.26, 1.07 and
0.71 respectively. If the weight of the structure was 6MN and the horizontal load was 4MN then
Equation 1 indicates that the diameter of the monopod foundation would be about 19m if the ratio
of the length of its skirt to its diameter were 0.5.
Either the strength or the stiffness criterion therefore results in a foundation of comparable
size, but the latter, which is related serviceability considerations (i.e. deformations) leads to a
requirement for a slightly larger foundation.
If a quadruped were to be designed then first the caisson spacing must be determined. For an
overturning moment of 120MNm and a weight of the structure of 6MN, then a spacing of 40m is
needed if tension is to be avoided completely. The confirmation on the basis of large scale tests that
tension should be avoided is considered an important, though negative, outcome from this research.
The maximum loading on an individual caisson would be 3MN, which could be carried in sand like
that at Luce Bay with a factor of safety of about 1.5 by a caisson of diameter 3.5m. The estimated
shear load of 4MN can be carried by a caisson with a diameter of 4m and a skirt length of 2.67m. In
this case the shear loading appears to govern the size of the caisson required, but it is considered
likely that this would change when deformations are taken into account. Unfortunately, however, it
is difficult to assess the influence the caisson size would have on the overall stiffness of the
structure, without more detailed knowledge of the structure itself.

10
A comparison of the estimated caisson diameters for a wind turbine foundation in dense sand
with those estimated for soft clay by Houlsby et al., (2004) shows that the size of a mono-caisson
foundation in dense sand would be about 60% of that in soft clay, whereas the sizes of caissons in a
quadruped foundation would be rather similar.
CONCLUSIONS
A series of field trials of caisson foundations in sand are described. The tests are relevant to
the design of both monopod and quadruped foundations for offshore wind turbines. Installation of
the caissons was achieved by suction. High frequency, low amplitude cyclic moment tests on a
3.0m caisson showed that the response was affected by stiffness, inertial and damping effects. Low
frequency cyclic moment tests on the 3.0m caisson indicate a stiff response at low amplitude, with a
gradual reduction of stiffness and increase of hysteresis at large amplitude. There was evidence of
gapping at the side of the caisson under very large amplitude cycles. Cyclic vertical loading tests on
a 1.5m diameter caisson also show a reduction of stiffness and increase of hysteresis as load
amplitude increases, with a significant reduction in stiffness after the compression to tension
boundary is crossed and frictional capacity exceeded. Pullout of the 1.5m caisson indicated that a
sizable ultimate tensile resistance can be generated but is accompanied by extremely large
displacements. The tests contribute to the development of design procedures for offshore wind
turbines founded on caissons.
ACKNOWLEDGEMENTS
This research was sponsored by the DTI and a consortium of companies (Fugro Ltd, SLP
Engineering Ltd, Garrad Hassan, General Electric Wind Ltd, Aerolaminates Ltd and Shell
Renewables Ltd). The authors are very grateful to Mr Adam Macintosh of Luce Bay Plant Hire for
making the site available for this testing. The authors thank Dr A. Blakeborough for use of the
SEMV designed by him, and for advice on interpretation of the SEMV tests. Dr B.W. Byrne
acknowledges the support provided by Magdalen College, Oxford.
REFERENCES
Byrne, B.W. and Houlsby, G.T. (2002) “Experimental investigations of the response of suction caissons to transient vertical loading”, Proc. ASCE, Journal of Geotechnical Engineering, Vol. 128, No. 11, Nov., pp 926-939.
Byrne, B.W. and Houlsby, G.T. (2003) “Foundations for offshore wind turbines”, Phil. Trans. of the Royal Society of London, Series A, Vol. 361, December, pp 2909-2930
11
Byrne, B.W. and Houlsby, G.T. (2004) “Experimental investigations of the response of suction caissons to transient combined loading”, Proc. ASCE, Journal of Geotechnical and Geoenvironmental Engineering 130, No 3, Mar., pp 240-253.
Doherty, J.P. and Deeks, A.J. (2003) “Elastic response of circular footings embedded in a non-homogeneous half-space”, Géotechnique, Vol. 53, No. 8, October, pp 703-714
Houlsby, G.T. (2003) "Modelling of Shallow Foundations for Offshore Structures", Invited Theme Lecture, Proc. Int. Conf. on Foundations, Dundee, 2-5 September, Thomas Telford, pp 11-26
Houlsby, G.T. and Byrne (2004) “Design procedures for installation of suction caissons in sand”, Proc. ICE, Geotechnical Engineering, in press
Houlsby, G.T., Kelly, R.B., Huxtable, J. and Byrne, B.W. (2004) “Field trials of suction caissons in clay for offshore wind turbine foundations”, submitted to Géotechnique,
Kelly, R.B., Byrne, B.W., Houlsby, G.T. and Martin, C.M. (2003) "Pressure Chamber Testing of Model Caisson Foundations in Sand", Proc. Int. Conf. Foundations, Dundee, 2-5 September, Thomas Telford, pp 421-431
Kelly, R.B., Byrne, B.W., Houlsby, G.T. and Martin, C.M. (2004) "Tensile Loading of Model Caisson Foundations for Structures on Sand", Proc. ISOPE, Toulon, Vol. 2, pp 638-641
Wolf, J.P. (1994) “Foundation Vibration Analysis Using Simple Physical Models”, Prentice Hall, New Jersey
Caisson Installation Test type Code Notes
Installation LB_Inst_1.5_1
Jacking test LB_Jack_1.5_1 Combined vertical and horizontal loading: unsuccessful because of control problems
1
Pull out LB_Pull_1
Installation LB_Inst_1.5_2
Jacking test LB_Jack_1.5_2 Vertical loading only
1.5m
2
Pull out LB_Pull_2
Installation LB_Inst_3.0_1
SEMV tests LB_SEMV_1 With offset weight (asymmetric cycling)
1
Jacking test LB_Jack_3.0_1 Increased amplitude cycling
Installation LB_Inst_3.0_2
SEMV tests LB_SEMV_2 Without offset weight (symmetric cycling)
3.0m
2
Jacking test LB_Jack_3.0_2 Multiple cycles at each amplitude
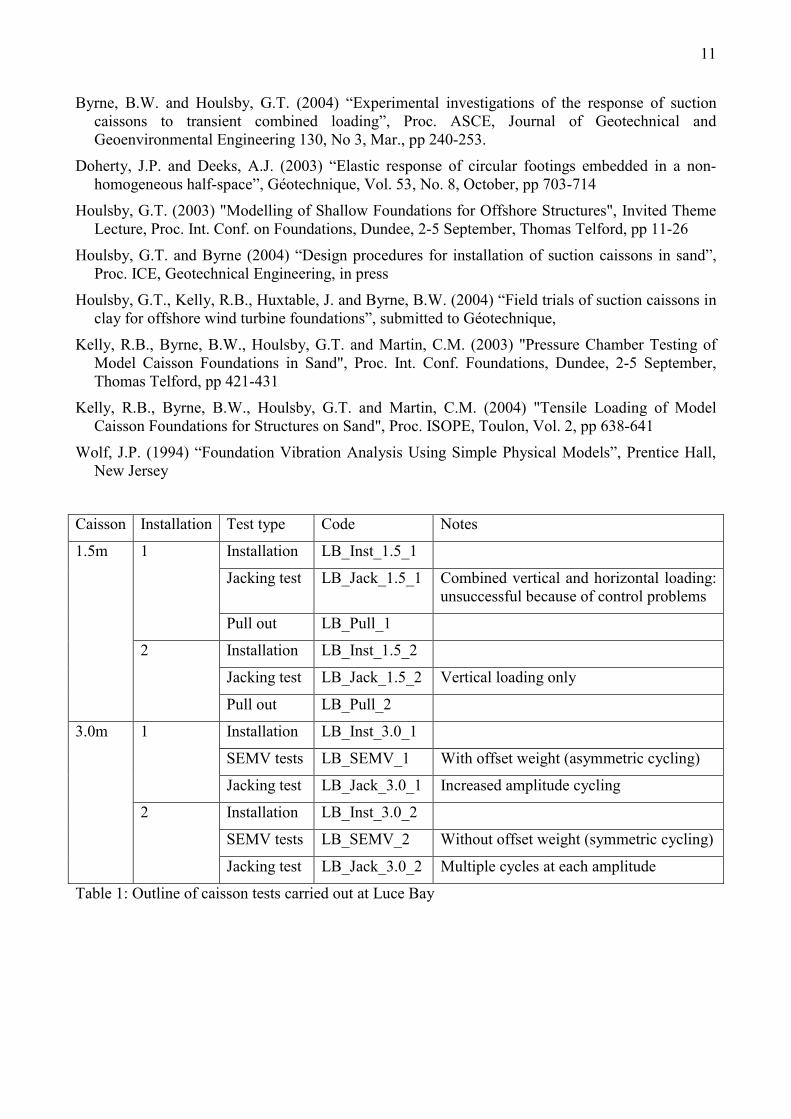
Table 1: Outline of caisson tests carried out at Luce Bay
12
0
10
20
30
40
50
60
70
80
90
100
0.01 0.1 1 10 100Particle Size (mm)
Perc
ent P
assi
ng
Figure 1: Grading curve for test bed at Luce Bay
0
0.5
1
1.5
2
2.5
3
3.5
4
4.5
5
0 5 10 15 20 25 30 35 40 45 50Cone Resistance (MPa)
Dep
th (m
)
Figure 2: CPT data at Luce Bay

13
Figure 3: Estimated profile of shear modulus with depth at Luce Bay
4000 4000 6000
30001500
H
H
H B
CC
A
RR
W
V
A
B
C
V
LL
L
L L LL
(a) (b) Figure 4: Outline of field testing equipment, dimensions in mm (water level and displacement reference frames not shown). (a) arrangement for jacking tests on 1.5m and 3.0m caissons, (b) alternative arrangement during SEMV tests. Labels indicate (A) A-frame, (B) concrete block, (C) caissons, (H) hydraulic jacks, (L) load cells, (R) foundations of reaction frame, (V) SEMV, (W) weight providing offset load for SEMV tests
0
0.5
1
1.5
2
2.5
3
3.5
4
0 20 40 60 80 100 120 140
Shear modulus G (MPa)
Dep
th z
(m) Fitted curve
Cone pressuremeterSeismic cone 1Seismic cone 2Seismic cone 3

14
Figure 5: Test rig showing the 1.5m caisson installed in foreground and 3.0m caisson in background after a jacking test had been completed
0
200
400
600
800
1000
1200
1400
0 5 10 15 20 25 30 35Suction (kPa)
Dis
plac
emen
t (m
m)
LB_Inst_1.5_2LB_Inst_3.0_21.5m prediction3.0m prediction
Figure 6: Records of suction during penetration
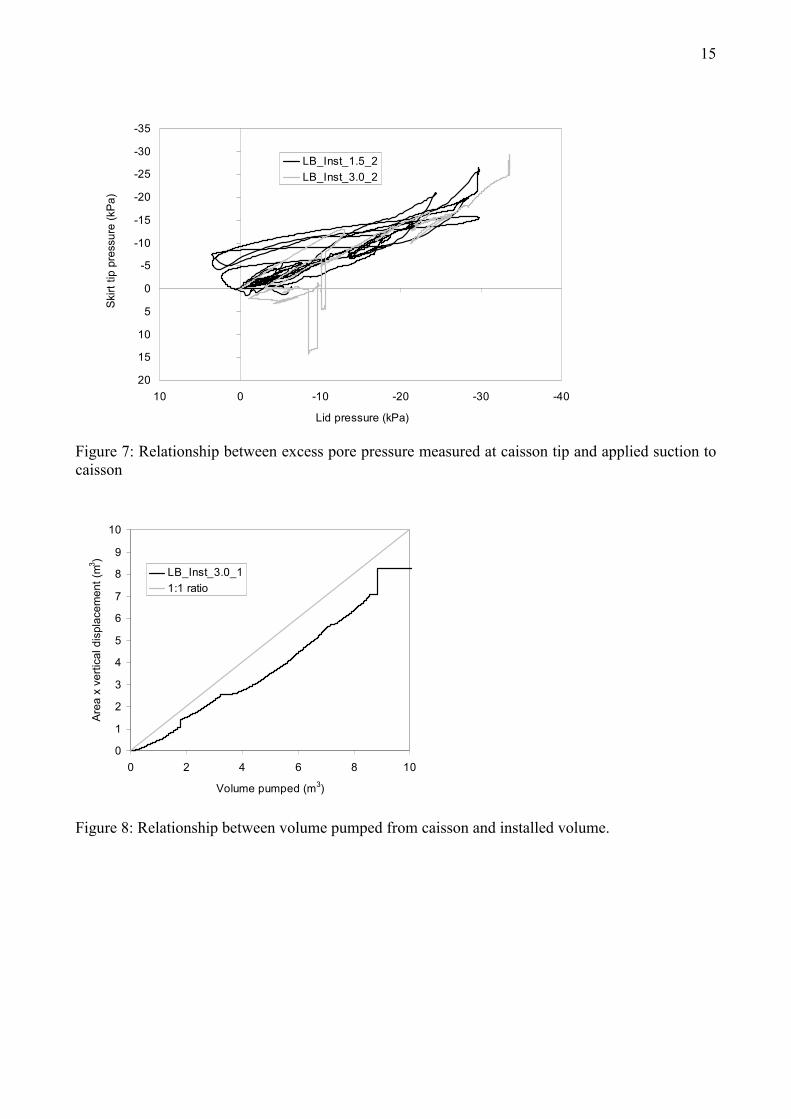
15
-35
-30
-25
-20
-15
-10
-5
0
5
10
15
20-40-30-20-10010
Lid pressure (kPa)
Skirt
tip
pres
sure
(kPa
)
LB_Inst_1.5_2LB_Inst_3.0_2
Figure 7: Relationship between excess pore pressure measured at caisson tip and applied suction to caisson
0
1
2
3
4
5
6
7
8
9
10
0 2 4 6 8 10
Volume pumped (m3)
Area
x v
ertic
al d
ispl
acem
ent (
m3 )
LB_Inst_3.0_11:1 ratio
Figure 8: Relationship between volume pumped from caisson and installed volume.
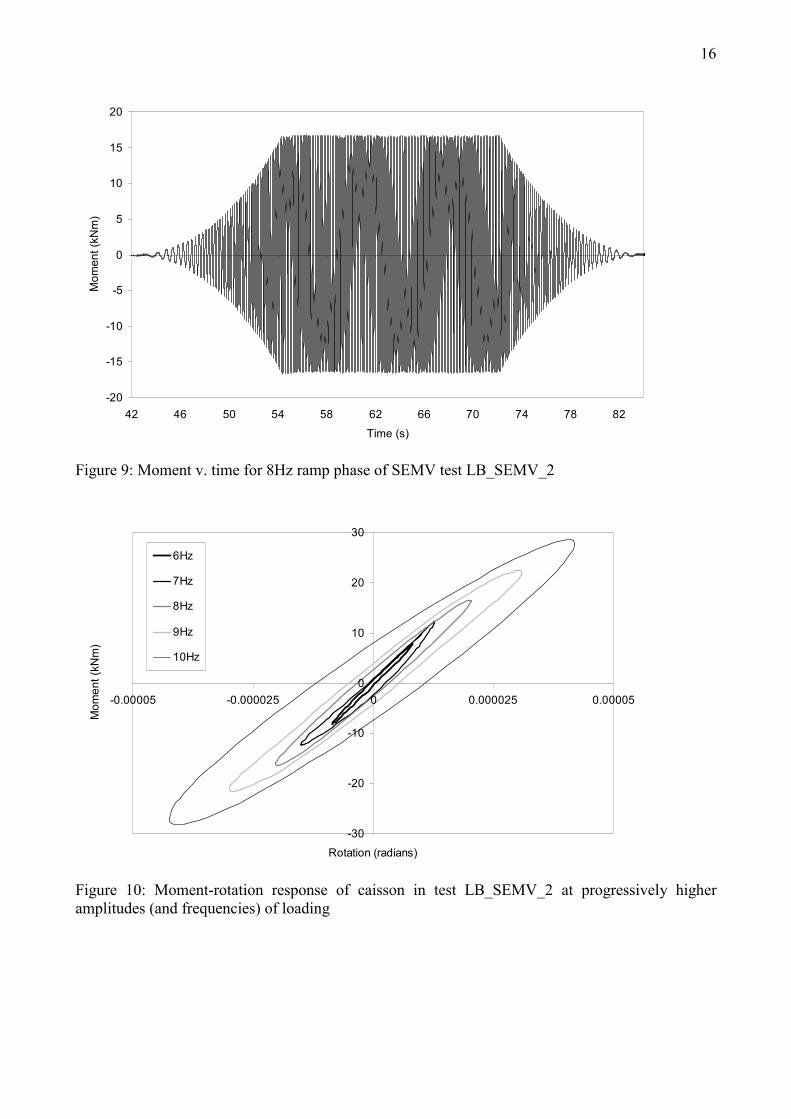
16
-20
-15
-10
-5
0
5
10
15
20
42 46 50 54 58 62 66 70 74 78 82Time (s)
Mom
ent (
kNm
)
Figure 9: Moment v. time for 8Hz ramp phase of SEMV test LB_SEMV_2
-30
-20
-10
0
10
20
30
-0.00005 -0.000025 0 0.000025 0.00005
Rotation (radians)
Mom
ent (
kNm
)
6Hz
7Hz
8Hz
9Hz
10Hz
Figure 10: Moment-rotation response of caisson in test LB_SEMV_2 at progressively higher amplitudes (and frequencies) of loading
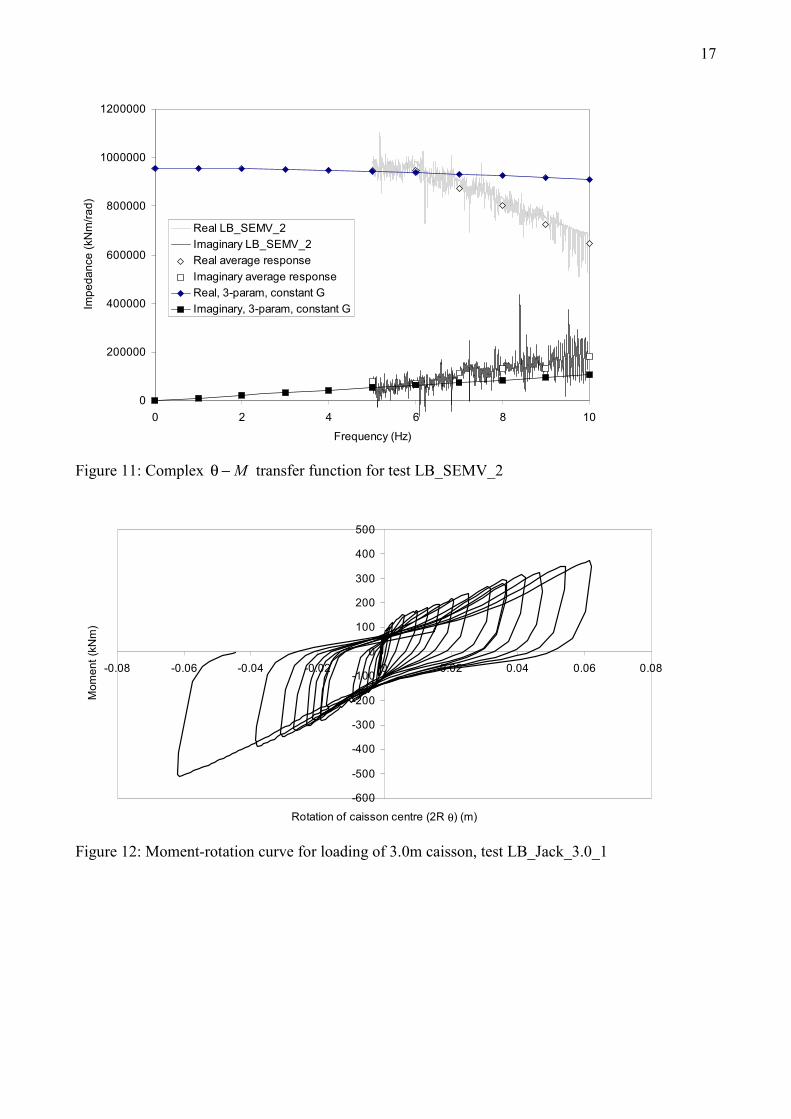
17
0
200000
400000
600000
800000
1000000
1200000
0 2 4 6 8 10Frequency (Hz)
Impe
danc
e (k
Nm
/rad)
Real LB_SEMV_2Imaginary LB_SEMV_2Real average responseImaginary average responseReal, 3-param, constant GImaginary, 3-param, constant G
Figure 11: Complex M−θ transfer function for test LB_SEMV_2
-600
-500
-400
-300
-200
-100
0
100
200
300
400
500
-0.08 -0.06 -0.04 -0.02 0 0.02 0.04 0.06 0.08
Rotation of caisson centre (2R θ) (m)
Mom
ent (
kNm
)
Figure 12: Moment-rotation curve for loading of 3.0m caisson, test LB_Jack_3.0_1

18
-300
-200
-100
0
100
200
300
-0.02 -0.015 -0.01 -0.005 0 0.005 0.01 0.015 0.02 0.025 0.03
Rotation (2Rθ) (m)
Mom
ent (
kNm
)
Figure 13: Moment-rotation curve for loading of 3.0m caisson, test LB_Jack_3.0_2
0
10
20
30
40
50
60
70
80
90
100
0.000001 0.00001 0.0001 0.001 0.01 0.1
∆θ (radians)
G (M
Pa)
JackingSEMVHyperbolic curve fit
Figure 14: Computed secant shear modulus from LB_SEMV_2 and LB_Jack_3.0_1

19
-50
0
50
100
150
200
0 5 10 15 20 25
Vertical displacement (mm)
Verti
cal L
oad
(kN
)
Figure 15: Cyclic vertical loading of 1.5m caisson from LB_Jack_1.5_2
-140
-120
-100
-80
-60
-40
-20
0-100-80-60-40-200
Vertical Displacement (mm)
Verti
cal L
oad
(kN
)
Total loadSuction load
Figure 16: Load v. displacement during pullout test LB_Pull_2

20
0
10
20
30
40
50
60
70
-100-80-60-40-200Displacement (mm)
Tens
ile L
oad
(kN
)
MeasuredEstimated
Figure 17: Measured and computed friction during pullout of 1.5m caisson in test LB_Pull_2


1
A Comparison of Field and Laboratory Tests of Caisson Foundations in Sand and Clay Kelly, R.B1., Houlsby, G.T2 and Byrne, B.W.3 1Research Assistant, Oxford University 2Professor of Civil Engineering, Oxford University 3Departmental Lecturer, Oxford University Contact address: Prof. G.T. Houlsby, Department of Engineering Science Oxford University, UK OX1 3PJ Tel. 01865 273138 Fax. 01865 283301 Email. [email protected]

2
ABSTRACT: Laboratory tests applying vertical and moment loads to suction caissons founded in sand and clay
have been conducted to simulate an equivalent series of field tests. The caissons used in the
laboratory were 0.15m, 0.2m and 0.3m in diameter, while those for the field tests were 1.5m and
3.0m diameter. The loads applied to the caissons in the laboratory tests were scaled from those in
the field tests, and the models were loaded in a near identical manner to the field trials. The test
results are presented in non-dimensional form for comparison. The non-dimensional laboratory
moment test data were similar to the field data in most cases. The non-dimensional data from
vertically loaded caisson tests in the laboratory and in the field show some differences, and possible
reasons for these are discussed.
Introduction Suction caissons have been used to provide innovative solutions to deep-water foundation and
anchoring problems during the last 15 to 20 years. For a number of these projects, programmes of
model testing designed to simulate prototype caisson behaviour have been conducted. Laboratory
studies of small-scale model caissons at 1g include Larsen (1989), Steensen-Bach (1992) and El-
Gharbawy and Olson (1998); and centrifuge studies were carried out by Watson et al. (2000),
House and Randolph (2001), Bang et al. (2001) and Clukey et al. (2003). Published data from field
trials using larger-scale caissons are less common, but include Hogervorst (1980), Tjelta (1986),
Dyvik et al. (1993), and Cho et al. (2003). In most of these studies the data are used to calibrate
theoretical models which are then used to predict prototype behaviour. No attempt has been made to
compare directly the load-displacement response of caissons at different scales. Such comparisons
are, however, vital if model testing is to be used to predict field behaviour.
Recently, a wide ranging programme of 1g laboratory tests, and larger scale field trials investigating
suction caissons as foundations for offshore wind turbines has been conducted at Oxford University
and reported by Byrne (2000), Byrne et al. (2002), Byrne et al. (2003), Kelly et al. (2003, 2004)
and Houlsby et al. (2005a, 2005b). Suction caissons for offshore wind turbines will initially be
founded in relatively shallow water. Compared to applications in the oil and gas industry they will
have lower vertical loads, but proportionately higher moment and horizontal loads. As foundations
for offshore wind turbines, caissons may be arranged to form a tetrapod or a monopod structure.
Caissons in the tetrapod arrangement resist the overturning moment through opposing vertical
reactions, while a mono-caisson resists the applied moment directly. As in previous studies, the
laboratory tests were designed to calibrate a theoretical model of caisson behaviour, and data from
field tests were used to validate the model. However, unlike previous studies, a series of laboratory
tests have been performed to shadow the field trials, in order to directly investigate effects of scale.

3
Vertical load tests in sand have been conducted using caissons with diameters of 0.15m and 0.2m in
the laboratory to compare with a 1.5m diameter caisson in the field. Moment load tests in sand were
conducted using 0.2m and 0.3m diameter caissons in the laboratory and 3.0m in the field. Moment
tests in clay used 0.2m diameter caissons in the laboratory and 3.0m in the field. Cyclic loading
tests involving purely vertical loading were not carried out as part of the field trials in clay.
Dimensionless equations are described below to compare the laboratory and the field test data.
Dimensionless equations for comparison of laboratory and field tests Laboratory and field tests are compared on the basis that, in dimensionless terms, both the stiffness
and the strength should be similar in equivalent tests. Consider first the strength, which is assumed
to be governed by a simple bearing capacity approach. In this case, a simple dimensional analysis
suggests that in clay vertical and horizontal loads will scale by 2Rsu , and moments by 3Rsu ,
where R is the caisson radius and us a representative undrained strength. In drained sand loads
scale by 3Rγ′ and moments by 4Rγ′ , where γ′ is the unit weight. This form of scaling applies
when the densities in laboratory and field are such that the bearing capacity factors are similar for
the two cases. This will require the laboratory tests to be at a lower relative density than the field
tests, to account for the reduction of friction angle with stress level. The tests reported here do not
precisely satisfy this condition. However, the applied vertical loads were only a small fraction of the
compressive bearing capacity, and in this case the issue of density appears to be less important, as
evidenced by the successful use of the scaling approach described below.
The consideration of stiffness is a little more complex. The elastic stiffness matrix for a caisson
subjected to vertical, moment and horizontal loads V, M, and H loading may be written as:
=
uRθw
kkkk
kRG
HRM
V2
00
0022
24
43
1 (1)
where G is the shear modulus of the soil, w, 2Rθ and u are vertical, rotational and horizontal
displacements and ki are dimensionless elastic constants
Consider the moment-rotation relationship, which can be obtained from Eq. (1) as:
( ) ( )
−
−=
MRHkk
kkkGRθM
22
42
2432
3
(2)
The shear modulus in sand is known to be related to the mean confining stress. One of the principal
objections to modelling structures at small scale in the laboratory, at 1g, is that the stresses are

4
much smaller than in the field. We attempt to account for the stress level by expressing the shear
modulus as:
n
a
v
a pσ
ApG
′= (3)
where pa is atmospheric pressure (used as a reference pressure), vσ′ is a representative effective
vertical stress, A is a dimensionless constant and n is the pressure exponent. Wroth et al. (1979) and
Coop and Jovicic (1999) have reported that the value of n is not unique, but depends on the strain
level. Wroth et al. (1979) suggest that n ranges from 0.435 at very small strain to 0.765 at large
strain For Ham River silica sand, Coop and Jovicic (1999) suggest that n = 0.59 for very small
strains. Wroth and Houlsby (1985) suggest that a value of 0.5 would capture most of the important
features of the increase in stiffness with pressure, and this value is used here to compare the
laboratory and field data.
Both stress magnitude and strain amplitude will vary around the caisson, but a representative stress
may be estimated (neglecting load spreading effects) at some depth aR below the caisson as:
( )aRhγRV
v +′+π
=σ′2
(4)
where, V is the applied vertical load, h is the length of the caisson skirt and a is a dimensionless
constant.
Substituting Eq. (4) into Eq. (3) gives:
( )
++
γ′πγ′= −
22)2(42 3
)1( aRh
RVRApG nn
a (5)
Which in turn may be substituted into (2) to give:
( )
( ) ( )( )
nna a
Rh
RγV
πMRHkk
kkkAγR
p
RγM
++
′
−
−
′θ=
′
−
2224
222 342
2432
1
4 (6)
If tests at different scale are conducted keeping M/2RH, ( )32RV γ′ and h/2R constant, and taking n
to be 0.5, then the moments and rotations in these tests will be related by:
( ) ( )
γ′
′=
′ Rh
RV
RHMf
γRp
θRγ
M a2
,2
,222 31
5.0
4 (7)
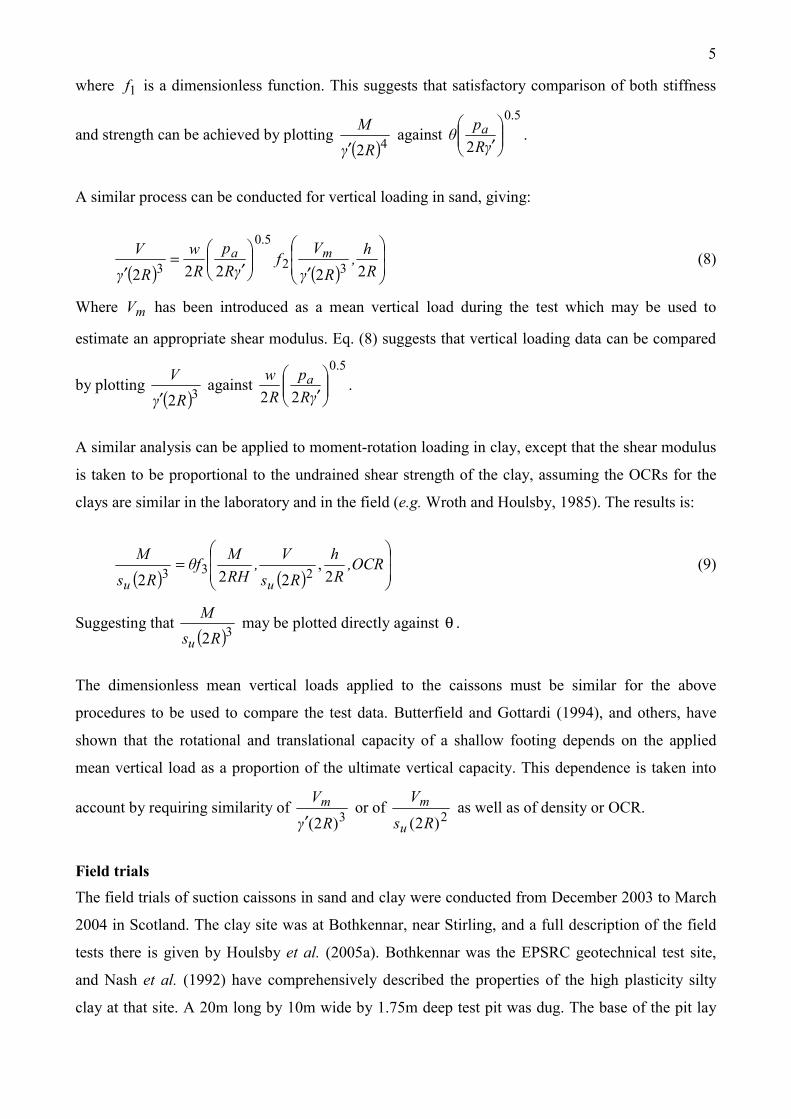
5
where 1f is a dimensionless function. This suggests that satisfactory comparison of both stiffness
and strength can be achieved by plotting ( )42RγM
′ against
5.0
2
′γRpθ a .
A similar process can be conducted for vertical loading in sand, giving:
( ) ( )
′
′=
′ Rh,
Rγ
Vf
γRp
Rw
RγV ma
22222 32
5.0
3 (8)
Where mV has been introduced as a mean vertical load during the test which may be used to
estimate an appropriate shear modulus. Eq. (8) suggests that vertical loading data can be compared
by plotting ( )32RγV
′ against
5.0
22
′γRp
Rw a .
A similar analysis can be applied to moment-rotation loading in clay, except that the shear modulus
is taken to be proportional to the undrained shear strength of the clay, assuming the OCRs for the
clays are similar in the laboratory and in the field (e.g. Wroth and Houlsby, 1985). The results is:
( ) ( )
= ,OCR
Rh
RsV,
RHMθf
RsM
uu 2,
222 233 (9)
Suggesting that ( )32RsM
u may be plotted directly against θ .
The dimensionless mean vertical loads applied to the caissons must be similar for the above
procedures to be used to compare the test data. Butterfield and Gottardi (1994), and others, have
shown that the rotational and translational capacity of a shallow footing depends on the applied
mean vertical load as a proportion of the ultimate vertical capacity. This dependence is taken into
account by requiring similarity of 3)2( Rγ
Vm′
or of 2)2( RsV
u
m as well as of density or OCR.
Field trials The field trials of suction caissons in sand and clay were conducted from December 2003 to March
2004 in Scotland. The clay site was at Bothkennar, near Stirling, and a full description of the field
tests there is given by Houlsby et al. (2005a). Bothkennar was the EPSRC geotechnical test site,
and Nash et al. (1992) have comprehensively described the properties of the high plasticity silty
clay at that site. A 20m long by 10m wide by 1.75m deep test pit was dug. The base of the pit lay
6
just beneath a shelly layer described by Nash et al. (1992). The undrained shear strength of the silty
clay at this level, as inferred from Nash et al. (1992), was 11.4kPa, increasing linearly by
1.96kPa/m. The pit was flooded with water to a depth of 200mm. A 3m diameter caisson having a
skirt 1.5m long and a wall thickness of 8mm was installed at two locations within the pit using
suction. A 1m3 concrete block was placed on the lid of the caisson to provide a constant vertical
load in addition to the self-weight of the caisson. Cyclic horizontal loads were applied 4.23m above
the lid of the caisson using a hydraulic jack mounted between a separate reaction frame and a
double A-frame structure fixed to the caisson. The loads applied to the caisson were measured by
shear pin load cells attached to the hydraulic jack. Displacements were measured using draw-wire
sensors attached to a reference frame installed around the caisson. Cyclic horizontal loads, with the
load amplitude increasing by 5kN per cycle, were applied to the caisson at its first location. Similar
tests were conducted at the second location, but a packet of 10 cycles with horizontal load
amplitude of ±20kN was included within the test programme.
The sand site was at Luce Bay, near Stranraer, and a full description of the field tests there is given
by Houlsby et al. (2005b). A purpose-built sand embankment was constructed from spoil material
within a working sand and gravel quarry at Luce Bay. The spoil material consisted of 85% fine to
medium grained silica sand, 15% fine to coarse grained gravel with the occasional cobble and peat
inclusion. The embankment was constructed in a worked-out area of the quarry during the summer
of 2003, when the water table was low. The embankment was constructed in 250mm thick layers,
which were compacted using the tracks of the construction machinery. The embankment was about
40m long by 10m wide and 3.5m deep. Cone penetrometer tests and maximum and minimum
density tests were performed by Fugro Ltd to determine the properties of the sand. The maximum
and minimum dry unit weights of the sand were 17.8kN/m3 and 13.7kN/m3 respectively. The
relative density of the compacted sand was inferred from the cone penetrometer data to be 80-85%.
The submerged unit weight at a relative density of 80% was determined to be 10.3kN/m3. The field
tests were conducted in the winter, when the water table had risen above the top of the
embankment.
Two caissons were tested at Luce Bay: a 1.5m diameter caisson, which had a skirt length of 1m and
a thickness of 8mm, and the 3m diameter caisson previously used at Bothkennar. Both caissons
were installed using suction. The 1.5m caisson was loaded using a hydraulic jack attached to the
caisson and a reaction frame. Packets of 10 cycles with amplitudes increasing by ±10kN per packet
up to ±100kN were applied to the caisson about a mean load of 60kN. The loads were again
measured using the clevis pin load cells, and the displacements by draw-wire sensors fixed to an
independent reference frame. The 3.0m diameter caisson was again installed at two locations. In the

7
first test it was loaded in a similar manner to the test Bothkennar. Packets of 10 cycles were applied
in the second test at horizontal load amplitudes of ±10kN, ±20kN, ±40kN and ±60kN.
Laboratory tests The laboratory tests were conducted using test beds constructed from Redhill 110 sand and
Speswhite kaolin clay. Redhill 110 is a poorly graded fine-grained silica sand. It has maximum and
minimum dry unit weights of 16.8kN/m3 and 12.8kN/m3 respectively. Saturated test beds 350mm
deep were constructed in a container 1.1m in diameter. The samples were densified using vibration.
The kaolin was consolidated from slurry in two 450mm diameter containers to create 430mm high
test beds. It was consolidated in stages over a period of one month, and was subject to a maximum
pressure of 200kPa. The undrained shear strengths of the clay, inferred from shear vane tests, were
10.8kPa and 9.0kPa at the surface of the two containers increasing to 12.4kPa at a depth of 100mm
in both containers.
Four caissons were used in the laboratory tests, two with aspect ratios (length to diameter) of 0.66
used to model the 1.5m field caisson and two with an aspect ratio of 0.5 to model the 3.0m field
caisson. The caisson geometry, test bed properties and mean vertical loads applied to the caissons
are given in Tables 1 to 4 for the vertical load tests in sand, moment load tests in sand and in clay.
The mean vertical loads applied to the field caissons in Tables 1 to 4 include the self-weight of the
caissons.
In the laboratory the caissons were installed either by suction or by pushing in sand, and just by
pushing in the clay. The loads were applied using a three-degree-of-freedom test rig designed by
Martin (1994). The rig can control vertical, horizontal and moment loads, or displacements,
independently to follow a desired load path (Byrne, 2000). The loads were recorded using a
Cambridge-type load cell (Bransby, 1973) and vertical, horizontal and rotational displacements
were recorded using LVDTs.
In the laboratory tests the cyclic vertical loads were load-controlled. In contrast, the tests applying
overturning moments were controlled by applying fixed rotations scaled from the field trial values.
Comparison of laboratory and field test data in sand Vertical load tests
Data from laboratory tests on 0.15m diameter caissons, where one caisson was installed by pushing
and one by suction are compared with data from the vertical field test in Figures 1(a) and 1(b). In
each test packets of cycles of increasing amplitude were applied. There are two key features of the

8
behaviour during the cycling: (a) the stiffness in a given cycle and (b) the accumulation of
deformation over several cycles. It is immediately apparent from Figure 1(a) that larger
accumulated deformation occurred in the laboratory test in which suction was used for installation
than with pushed installation. This is attributed to the probable loosening of the sand adjacent to the
caisson during the suction installation. By comparison the accumulated deformations in the field
test (also suction installed, but a caisson 10 times larger), Figure 1(b), fall between the two
laboratory tests in terms of the dimensionless plot. The implication is that disturbance due to
suction installation is relatively less important for the larger caisson, which seems entirely plausible.
Suction installation may create a localized zone of disturbance adjacent to a caisson, which does not
increase in proportion to caisson diameter
Figures 2(a) and 2(b) show two laboratory tests, of slightly different sizes, both with pushed
installation. The larger test shows less accumulated deformation, supporting the hypothesis that
accumulated deformation reduces with scale. Significantly more accumulated deformation occurs in
suction-installed tests than with pushed installation. These trends are shown in Figure 3 in which
the accumulated deformations are plotted against cycle number. (Note that the cyclic load amplitude
increases every 10 cycles). In most cases the accumulated deformations were downwards, except
for the smaller caisson installed by pushing, which initially moved slightly upwards as the cyclic
loads were applied, and only moved downwards when the minimum vertical loads became tensile.
Whilst clear trends can be discerned, it is difficult without more test data to quantify the
accumulated deformations as a function of size, loading amplitude and installation method.
Differences between the tests may also be attributable to minor variations in relative density.
Turning now to stiffness, Figure 4 shows the dimensionless stiffness plotted as a function of
dimensionless cyclic rotation amplitude (on a logarithmic scale). The stiffness is in each case
defined as the secant stiffness over the unloading branch of a cycle (which differs slightly from the
secant stiffness on loading because of the influence of the accumulated deformation). This plot may
be compared to the shape of a typical plot of shear modulus against shear strain amplitude. It is
clear that the stiffness drops rapidly with cyclic amplitude, but both laboratory and field tests show
remarkably similar trends, indicating that the method for normalising the data is highly successful
in achieving comparability of stiffness in any one cycle. Such comparability is in fact apparent from
the shapes of the larger cycles that can be seen in Figures 1 and 2: in each case the shape and size of
each individual cycle is closely comparable, with the differences between tests being mainly
attributable to the accumulated deformations. This point is emphasised in Figure 5, in which
individual cycles at small, medium and large amplitudes from the different tests have been
superimposed at normalised scale.

9
Note that the data fall onto two well-defined curves in Figure 4. The left hand curve relates to the
first set of cycles in each test, and the right hand curve the remaining cycles in each test. The
apparent separation in the data is to a certain extent an artefact of the requirement that, for each load
amplitude, the points fall on a single curve.
The variation of stiffness during packets of cycles is explored in more detail in Figure 6, which
shows the unloading stiffness plotted against cycle number. Note that after each 10 cycles the load
amplitude is increased, resulting in a lower stiffness. During each packet of cycling, however, there
is no discernable trend of variation of stiffness. Figure 6 also highlights differences of stiffness
between the tests that are more apparent here than in Figure 4. It should be emphasised though that
the normalisation process involves a factor of about 33 between the stiffness in the largest and
smallest tests: the remaining differences which fall within a factor of about two should be viewed
within this context. Note that on the normalised scale the field tests at small amplitude appear rather
stiffer than the laboratory test, whilst at larger amplitude they are less stiff. This systematic
variation may be attributable to the fact that different values of the exponent n in Eq. (3) would be
applicable at different amplitudes of rotation.
Note that as cyclic amplitude increases the hysteresis loops become more open (damping increases).
Once cycles become sufficiently large that the minimum vertical load becomes tensile, a transition
to a much more flexible response occurs and the hysteresis loops acquire a characteristic “banana”
shape (see Figure 5), similar to that reported by Byrne and Houlsby (2002). For practical foundation
designs it seems prudent to avoid this more flexible behaviour, so that caisson foundations should
be designed to avoid tensile loading. Note that, paradoxically, the rate of accumulated downward
movement increases once tensile loading is reached.
Moment load tests
Data from the moment loading laboratory and field tests, where the load amplitude increased with
each cycle, are compared in Figures 7(a) and (b). Scaled rotations were applied to the laboratory
tests to allow the resulting moment loads to be compared.
The first few cycles during the laboratory test are shown in Figure 8(a). The scatter in the data
reflects noise affecting the transducer readings at the very small displacements applied to the
caisson. The shape of the normalized moment-rotation curves in the laboratory test with pushed
installation and in the field test were similar at small rotations, see Figures 8(a) and (b), but
diverged as the magnitude of the rotations increased (Figure 7). The characteristic shape of the
hysteresis loops at large rotations in the field trial was due to gapping between the caisson and the
sand (which was observed visually). Gapping was not observed in the laboratory test. This may be

10
because the absolute (as opposed to normalised) magnitude of the rotations in the laboratory tests
was much smaller than that in the field test. The process of normalisation of loads and stiffness is
therefore unable to account entirely for all phenomena observed, although it seems very satisfactory
at small rotations. The fact that the magnitudes and shapes of the curves in Figures 8(a) and (b) are
similar is a very significant result. Foundations for offshore wind turbines are likely to be designed
to operate in the range of normalized rotations shown in Figures 8(a) and (b) rather than at larger
deformations, as shown in Figure 7, where the normalized responses of the field and laboratory
caissons differ. The maximum normalized moment continued to increase with rotation amplitude in
the field trial, whereas it seemed to approach a limit in the laboratory test. The normalized moment
loads were significantly smaller in the laboratory test where the caisson was installed by suction,
again indicating a detrimental effect of sand disturbance during installation at small scale.
The normalized moment-rotation responses in laboratory and field tests in sand where packets of 10
cycles were applied to the caissons are shown in Figure 9(a) and (b). The normalised behaviour of
the caissons is again similar at small rotations, and becomes increasingly different as the
deformations increase. Although the shapes of the loops are dissimilar, in fact the loads achieved at
comparable normalised rotations were very similar.
Normalised unloading stiffness data for all of the moment loading tests are presented in Figure 10.
The unloading stiffness is again defined as the peak-to-peak normalised moment divided by the
normalised rotation during the unloading half cycle. The normalised unloading stiffnesses are
remarkably similar for all of the tests, taking into consideration that the scaling incorporates a factor
in excess of 13600, which results from incorporating a stress-dependent stiffness into the non-
dimensional equations as well as from the direct scaling factor. The difference between the
normalised moment at larger rotations in the field and laboratory test data is probably due to the
non-dimensional equations not fully taking into account changes with stress level and density.
Comparison of laboratory and field data in clay Data from the first field test at Bothkennar are compared with laboratory test data in Figures 11(a)
and (b). The normalised strength and stiffness are (as for the sand) more similar at low rotations
(Figure 12) than at larger rotations (Figure 11). Data from the initial few cycles in these tests in
Figures 11(a) and (b) shows a good correlation between the normalised behaviour to rotations up to
about 0.0015 radians, although the caisson in the laboratory test showed a slightly stiffer response.
The ultimate capacity of the caisson in the laboratory test was less than in the field test by about
30%, and the peak-to-peak stiffness was also less in the laboratory than the field at large rotations.

11
Data from the moment-rotation tests, where a packet of 10 cycles was applied to the caissons, are
presented in Figures 13(a) and (b). The normalised strength and stiffness of the field caisson was
significantly lower than the laboratory caisson at low to medium rotations, particularly in the
positive quadrant. The normalised strength of the field caisson only exceeded that of the laboratory
caisson at large displacements. The stiffness of the field caisson in this test was less than in the first
test, Figure 11. This may be due to softening of the Bothkennar silty clay over time, given that the
second test was conducted 28 days after the first test, and 44 days after the test pit was excavated.
The lower strength and stiffness of the field caisson in the positive quadrant of Figure 13(b) might
have been caused by an uneven installation. At the end of installation there was a 90mm difference
of level across the caisson. One side of the caisson might have therefore have been in better contact
with the clay than the other side.
The normalised unloading stiffness data for the clay tests are shown in Figure 14. The normalised
stiffnesses are very similar, providing a very satisfactory verification of the normalisation procedure
involved, bearing in mind that before normalisation the stiffnesses differ by a factor of more than
3900.
Concluding remarks
Normalisation procedures have been proposed to allow laboratory tests and field trials of
foundations in sand and clay to be compared in terms of both stiffness and capacity. These have
been applied to a series of laboratory tests specially conducted to mimic a series of field trials. The
tests concentrated on cyclic loading conditions relevant to the design of offshore wind turbine
foundations.
In sand the normalisation procedures take account of differing stiffness at different stress levels.
Comparisons were made for both cyclic vertical and cyclic moment loading. In both cases the
normalisation procedures were found to achieve generally satisfactory comparison between tests at
very different scales. For vertical loading the normalised stiffness within any given cycle was
highly repeatable at different scales, but the accumulation of displacement with cycles could not be
compared quantitatively. Qualitative comparisons indicated less accumulation of displacement for
larger caissons, and (at least at small scale) much more for suction as opposed to pushed installation
of caissons. Moment loading tests in sand indicated an excellent comparison at low rotation
amplitude, with more divergence at higher amplitudes.

12
Moment loading tests in clay led to similar conclusions as for sand: again the comparison of
normalised performance was much closer at small rotation than at large rotation. The former are,
however, more relevant to realistic design cases.
It should be borne in mind that the scaling relationships proposed here address stiffness and
capacity values which, in absolute terms, differ by several orders of magnitude. In that context, the
quality of agreement between laboratory and field results is highly satisfactory, even when some
differences, highlighted above, remain. These comparisons lend confidence to the use of such
scaling relationships in the design of full-scale structures. Data from loading of such structures,
currently not available, would of course be essential for confirmation of the applicability of these
procedures across a wider range of scales.
Acknowledgements
The authors are grateful to the DTI and EPSRC for the funding of this research. The authors would
also like to acknowledge the industrial participants to this research project: SLP Engineering Ltd,
Fugro Ltd, Garrad Hassan, GE Wind, NEG Micon, Shell Renewables Ltd and HR Wallingford.
References
Bang, S., Cho. Y. and Kim, S.S. (2001), “Calibration of suction pile installation design with centrifuge model tests”, 20th Int. Conf. on Offshore Mechanics and Arctic Engineering, paper OMAE/OSU-5023
Bransby, P.L. (1973), “Cambridge contact stress transducers”, CUED/C-SOILS/LN2, Cambridge University
Butterfield, R. and Gottardi, G. (1994), “A complete three-dimensional failure envelope for shallow footings on sand”, Geotechnique, Vol. 44, No.1, pp 181-184
Byrne, B.W. (2000) “Investigations of suction caissons in dense sand”, DPhil thesis, University of Oxford
Byrne, B.W. and Houlsby, G.T.(2002), “Experimental investigations of response of suction caissons to transient vertical loading”, ASCE, J. of Geotech. and Geoenv. Eng., Vol. 128, No. 11, pp 926-939
Byrne, B.W., Houlsby, G.T., Martin, C.M. and Fish, P. (2002)"Suction Caisson Foundations for Offshore Wind Turbines", Wind Engineering, Vol. 26, No. 3, pp 145-155
Byrne, B.W., Villalobos, F., Houlsby, G.T. and Martin, C.M. (2003), “Laboratory Testing of Shallow Skirted Foundations in Sand”, Proc BGA International Conference on Foundations, pp 161-167
Cho, Y., Lee, T.H., Chung, E.S. and Bang, S. (2003), “Field tests on pullout loading capacity of suction piles in clay”, 22nd Int. Conf. On Offshore Mechanics and Arctic Engineering, paper OMAE-2003-37016
Clukey, E.C., Aubeny, C.P. and Murff, J.D. (2003), “Comparison of analytical and centrifuge model tests for suction caissons subjected to combined loads”, 22nd Int. Cont. on Offshore Mechanics and Arctic Engineering, paper OMAE2003-37503
Coop, M.R. and Jovicic, V. (1999), “The influence of state on the very small strain stiffness of sands”, Proc. conf. on Pre-failure deformation characteristics of geomaterials, Torino, pp 175-181

13
El-Gharbawy, S. and Olson, R. (1998), “Laboratory modelling of suction caisson foundations”, Proc. 10th Int. Conf. on Offshore and Polar Engineering, Vol. 1, pp 537-541
Dyvik, R., Andersen, K.H., Hansen, S.B. and Christophersen, H.P. (1993), “Field tests of anchors in clay. I: Description”, ASCE Journal of Geotechnical Engineering, Vol. 119, No. 10, pp 1515-1531
Hogervorst, J.R. (1980), “Field trials with large diameter suction piles”, Offshore Technology Conference, Houston, Texas, paper 3817
Houlsby, G.T., Kelly, R.B., Huxtable, J. and Byrne, B.W. (2005a), “Field trials of suction caissons in clay for offshore wind turbine foundations”, Geotechnique, in press
Houlsby, G.T., Kelly, R.B., Huxtable, J. and Byrne, B.W. (2005b), “Field trials of suction caissons in sand for offshore wind turbine foundations”, Geotechnique, submitted
House, A.R. and Randolph, M.F. (2001), “Installation and pull-out capacity of stiffened suction caissons in cohesive sediments”, proc. 11th Int. Conf. on Offshore and Polar Engineering, Vol.2, pp 574-580
Kelly, R.B., Byrne, B.W., Houlsby, G.T. and Martin, C.M. (2003), “Pressure chamber testing of model caisson foundations in sand”, Proc BGA International Conference on Foundations, pp 421-432
Kelly, R.B., Byrne, B.W., Houlsby, G.T. and Martin, C.M. (2004) "Tensile Loading of Model Caisson Foundations for Structures on Sand", Proc. 12th Int. Conf. on Offshore and Polar Engineering, Toulon, Vol. 2, pp 638-641
Larsen, P. (1989), “Suction anchors as an anchoring system for floating offshore constructions”, Offshore Technology Conference, paper 6029
Martin, C.M. (1994), “Physical and numerical modelling of spudcan behaviour”, DPhil thesis, Oxford University
Nash, D.F.T., Powell, J.J.M. and Lloyd, I.M. (1992), “Initial investigations of the soft clay test site at Bothkennar”, Geotechnique, Vol. 42, No. 2, pp 163-181
Steensen-Bach, J.O. (1992), “Recent model tests with suction piles in clay and sand”, Offshore Technology Conference, Houston, Texas, paper 6844
Tjelta, T.I. (1986), “Large-scale penetration test at a deep water site”, Offshore Technology Conference, Houston, Texas, paper 5103
Watson, P.G., Randolph, M.F. and Bransby, M.F. (2000), “Combined lateral and vertical loading of caisson foundations”, Offshore Technology Conference, Houston, Texas, paper 12195
Wroth, C.P., Randolph, M.F., Houlsby, G.T. and Fahey, M. (1979), “A review of the engineering properties of soils with particular reference to the shear modulus”, University of Cambridge report CUED/D-SOILS TR75
Wroth, C.P. and Houlsby, G.T. (1985), “Soil mechanics – property characterisation and analysis procedures”, Proc. 11th Int. Conf. on Soil Mechanics and Foundation Engineering, San Francisco, Vol. 1, pp 1-50

14
Table 1 Caisson geometry and soil properties for vertical load tests in sand Diameter
(m) Installation
Method Unit Weight
(kN/m3) Relative Density
Mean Load(kN)
Aspect ratio (h/D)
(t/D)
1.5 Suction 10.3 0.80 66 0.66 0.0053 0.2 Pushing 10.0 0.84 0.152 0.66 0.0165 0.15 Suction 9.5 0.69 0.065 0.66 0.0067 0.15 Pushing 9.7 0.77 0.062 0.66 0.0067
Table 2 Caisson geometry and soil properties for moment load tests in sand with increasing
cyclic amplitude Diameter
(m) Installation
Method Unit Weight
(kN/m3) Relative Density
Mean Load(kN)
Aspect ratio (h/D)
(t/D)
3.0 Suction 10.3 0.80 42.4 0.5 0.0027 0.3 Pushing 10.0 0.84 0.041 0.5 0.0117 0.2 Suction 9.5 0.69 0.012 0.5 0.0050 0.2 Pushing 9.7 0.77 0.012 0.5 0.0050
Table 3 Caisson geometry and soil properties for moment load tests in sand with packets of
cycles Diameter
(m) Installation
Method Unit Weight
(kN/m3) Relative Density
Mean Load(kN)
Aspect ratio (h/D)
(t/D)
3.0 Suction 10.3 0.80 42.4 0.5 0.0027 0.3 Pushing 10.0 0.84 0.041 0.5 0.0117 0.2 Pushing 10.0 0.84 0.012 0.5 0.0050
Table 4 Caisson geometry and soil properties for all moment load tests in clay Diameter
(m) Installation
Method su
(kN/m2) Mean Load
(kN) Aspect ratio
(h/D) (t/D)
3.0 Suction 14.4 42.4 0.5 0.0027 0.2 Pushing 12.4 0.162 0.5 0.0050

15
-2
-1
0
1
2
3
4
5
6
-0.01 0.01 0.03 0.05 0.07 0.09
[w/(2R)][pa/(2Rγ')]1/2
V/[ γ'
(2R
)3 ]
Suction installationPushed installation
Figure 1(a): Vertical load: Laboratory test data using
0.15m diameter caissons
-2
-1
0
1
2
3
4
5
-0.005 0 0.005 0.01 0.015
[w/(2R)][pa/(2Rγ')]1/2
V/[ γ'
(2R
)3 ]
Figure 2(a): Laboratory test: 0.15m diameter caisson:
Pushed installation
-2
-1
0
1
2
3
4
5
6
-0.01 0.01 0.03 0.05 0.07 0.09
[w/(2R)][pa/(γ'2R)]1/2
V/[ γ'
(2R
)3 ]
Figure 1(b): Vertical load: Field test data: 1.5m
diameter caisson
-2
-1
0
1
2
3
4
5
-0.005 0 0.005 0.01 0.015
[w/(2R)][pa/(2Rγ')]1/2
V/[ γ
'(2R
)3 ]
Figure 2(b): Laboratory test: 0.2m diameter caisson:
Pushed installation

16
-0.01
0
0.01
0.02
0.03
0.04
0.05
0.06
0.07
0.08
0.09
0 10 20 30 40 50 60 70 80 90
Number of cycles
Nor
mal
ised
cum
ulat
ive
disp
lace
men
t [w
/(2R
)][p a
/( γ'2
R)]1/
2
Field test0.15m Suction installed0.15m Pushed0.2m Pushed
Figure 3: Cumulative displacements during vertical loading as a function of cycle number
0
10000
20000
30000
40000
50000
60000
0.00001 0.0001 0.001 0.01
∆w/(2R)[pa/(γ'2R)]1/2
K v/[(
γ'pa)
1/2 (2
R)3/
2 ]
Field test0.15m Sucked0.15m Pushed0.2m Pushed
Figure 4: Normalised vertical unloading stiffness plotted against normalised displacement

17
-1
0
1
2
3
4
5
0 0.005 0.01 0.015 0.02 0.025 0.03 0.035 0.04 0.045 0.05
[w/(2R)][pa/(2Rγ')]1/2
V/[ γ
'(2R
)3 ]1.5m Field0.15m Suction installed0.2m Pushed0.15m Pushed
Figure 5: Superimposed small, medium and large cycles of vertical displacement from different
tests
0
1000
2000
3000
4000
5000
6000
7000
8000
0 10 20 30 40 50 60 70 80 90Number of cycles
Scal
ed u
nloa
ding
stif
fnes
sK v
/[(γ'p
a)1/
2 (2R
)3/2 ]
Field test0.15m Suction installed0.15m Pushed0.2m Pushed
Figure 6: variation of normalised stiffness with cycle number

18
-0.6
-0.4
-0.2
0.0
0.2
0.4
0.6
-0.05 -0.03 -0.01 0.01 0.03 0.05
θ[pa/(2Rγ')]1/2
M/[ γ
'(2R
)4 ]
Lab. suckedLab. pushed
Figure 7(a): Moment loading: Laboratory test data:
0.2m diameter caisson
-0.30-0.25
-0.20-0.15-0.10
-0.050.000.05
0.100.150.200.25
-0.01 -0.005 0 0.005 0.01
θ[pa/(γ'2R)]1/2
M/[ γ
'(2R
)4 ]
Figure 8(a): Small deformation moment loading:
0.2m diameter caisson
-0.4
-0.3
-0.2
-0.1
0.0
0.1
0.2
0.3
0.4
-0.02 -0.015 -0.01 -0.005 0 0.005 0.01
θ[pa/(γ'2R)]1/2
M/[ γ
'(2R
)4 ]
Figure 9(a): Multiple cycle moment loading:
Laboratory test data: 0.2m diameter caisson
-0.6
-0.4
-0.2
0.0
0.2
0.4
0.6
-0.05 -0.03 -0.01 0.01 0.03 0.05
θ[pa/(γ'2R)]1/2
M/[ γ
'(2R
)4 ]
Figure 7(b): Moment loading: Field test data: 3.0m
diameter caisson
-0.25
-0.20
-0.15
-0.10
-0.05
0.00
0.05
0.10
0.15
0.20
0.25
-0.01 -0.005 0 0.005 0.01
θ[pa/(γ'2R)]1/2
M/[ γ
'(2R
)4 ]
Figure 8(b): Small deformation moment loading:
3.0m diameter caisson
-0.4
-0.3
-0.2
-0.1
0.0
0.1
0.2
0.3
0.4
-0.02 -0.015 -0.01 -0.005 0 0.005 0.01
θ[pa/(γ'2R)]1/2
M/[ γ
'(2R
)4 ]
Figure 9(b): Multiple cycle moment loading: Field
test data: 3.0m diameter caisson

19
0
50
100
150
200
250
300
350
400
450
500
0.0001 0.001 0.01 0.1
∆θ[pa/(γ'2R)1/2]
K m/[(
γ'pa)
1/2 (2
R)7/
2 ]
3.0m sand_13.0m sand_20.2m sand_10.2m sand_20.3m sand_2
Figure 10: Normalised unloading stiffness data for moment load tests in sand

20
-0.5
-0.4
-0.3
-0.2
-0.1
0
0.1
0.2
0.3
0.4
0.5
-0.015 -0.01 -0.005 0 0.005 0.01 0.015 0.02
θ
M/[s
u(2R
)3 ]
Figure 11(a): Moment loading: Laboratory test data in
clay: 0.2m diameter caisson
-0.3
-0.2
-0.1
0
0.1
0.2
0.3
-0.002 -0.001 0 0.001 0.002 0.003
θ
M/[s
u(2R
)3 ]
Figure 12(a): Small deformation moment loading:
Laboratory test data in clay
-0.4
-0.3
-0.2
-0.1
0
0.1
0.2
0.3
-0.015 -0.01 -0.005 0 0.005 0.01
θ
M/[s
u(2R
)3 ]
Figure 13(a): Multi-cycle moment loading:
Laboratory test data: 0.2m diameter caisson
-0.5
-0.4
-0.3
-0.2
-0.1
0.0
0.1
0.2
0.3
0.4
0.5
-0.015 -0.01 -0.005 0 0.005 0.01 0.015 0.02
θ
M/[s
u(2R
)3 ]
Figure 11(b): Moment loading: Field test data: 3.0m
diameter caisson
-0.3
-0.2
-0.1
0.0
0.1
0.2
0.3
-0.002 -0.001 0 0.001 0.002 0.003
θ
M/[s
u(2R
)3 ]
Figure 12(b) Small deformation moment loading:
Field test data in clay
-0.4
-0.3
-0.2
-0.1
0
0.1
0.2
0.3
-0.015 -0.01 -0.005 0 0.005 0.01
θ
M/[s
u(2R
)3 ]
Figure 13(b): Multi-cycle moment loading: Field test
data: 3.0m diameter caisson
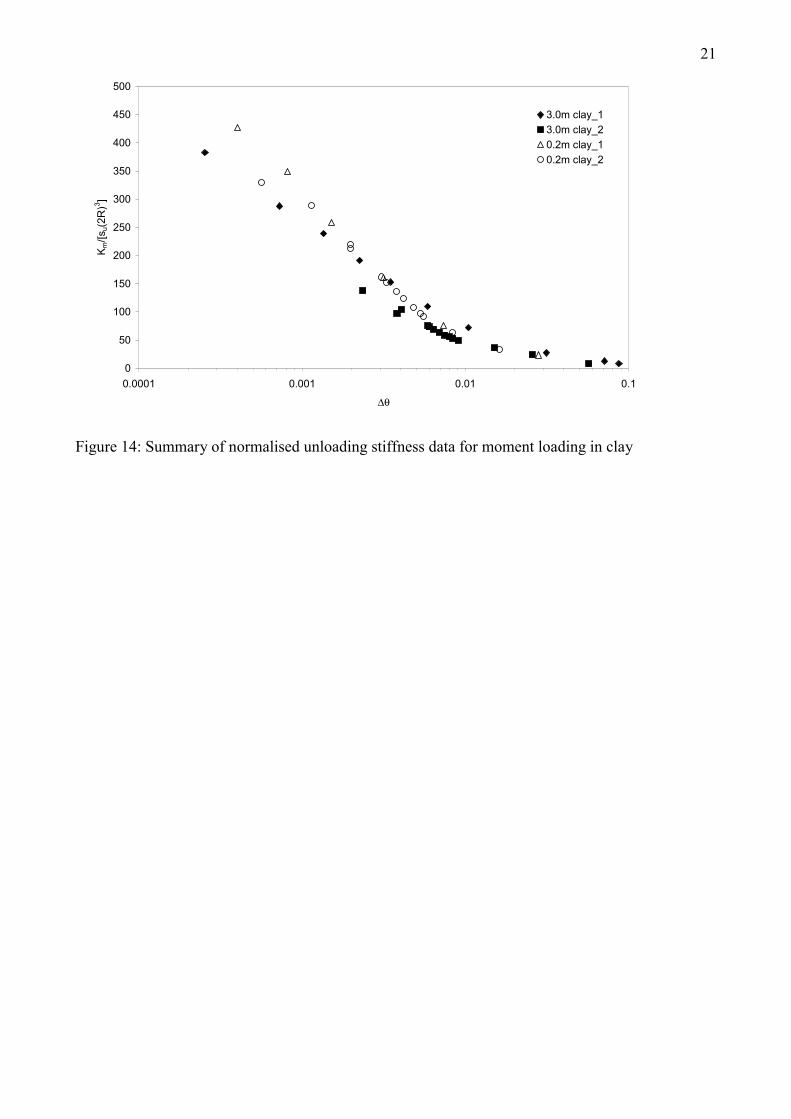
21
0
50
100
150
200
250
300
350
400
450
500
0.0001 0.001 0.01 0.1
∆θ
K m/[s
u(2R
)3 ]3.0m clay_13.0m clay_20.2m clay_10.2m clay_2
Figure 14: Summary of normalised unloading stiffness data for moment loading in clay


