FIELD TESTING OF AN OPTICAL FIBER TEMPERATURE … · FIELD TESTING OF AN OPTICAL FIBER TEMPERATURE...
10
Geothermics, Vol. 19, No.3, pp. 285-294,1990. Printed in Grcat Britain. 0375-6505/90 $3.00 + 0.00 Pergamon Press pic CNR. FIELD TESTING OF AN OPTICAL FIBER TEMPERATURE SENSOR IN A GEOTHERMAL WELL S. K, SHARMA,*t A. SEKI,t S. M. ANGEL:!: and D. G. GARVIS:j: • Hawaii Institute of Geophysics. t Hawaii Natural Energy Institute, University of Hawaii at Manoa, Honolulu, Hawaii 96822, U.S.A, and tEnvironmental Sciences Division, Lawrence Livermore National Laboratory, Livermore. California 94550. U.S.A. (Received March 1989; accepted September 1989) Abstract-A program has been initiated for developing and field testing optical fiber sensors to monitor in situ physical and chemical parameters in highly corrosive environments. such as geothermal wells. oil wells. and hot-water boiler reactors. The difficulty of sampling hot geothermal fluids or reliably measuring physical and chemical properties of brines in wells limits our understanding of in situ conditions in geothermal fields. In this communication. the authors report a test of the concept of utilizing optical fiber based sensors by measuring the temperature profile of a geothermal steam well. The purpose of this work is not only to demonstrate that a temperature optical chemical sensor (optrode) can be used to obtain real- time information from a geothermal well, but also that great potential of the optrodes can be exploited for measuring physical and chemical parameters in the field, It is believed that this is the first real-time. in situ. geothermal well measurement to have been made using an optical fiber sensor. INTRODucnON The State of Hawaii has focused a large amount of time and support on developing geothermal energy in the state. The Hawaii Geothermal Project-Abbott (HGP-A) power plant, which was developed in collaboration with the U.S. Department of Energy, the County of Hawaii, and the local utility, has been operational since 1981. This power plant has proven that geothermal development is a viable goal for the private sector, and recently a number of private developers have drilled wells around HGP-A (Fig. 1) in the Kilauea east rift zone. While technology has advanced in certain aspects of geothermal exploration, development of down-hole instrumentation has not advanced significantly. At temperatures :s300°C, tempera- ture measurements can routinely be made. However, pressure and, especially, fluid chemistry measurements are more restrictive. Up to 300°C wireline measurements can be made for temperature and pressure. Above this temperature, the measurements are more difficult. The present method for gathering temperature, pressure, and fluid chemistry information about geothermal well fluids involves lowering mechanical and electronic instruments into the well, retrieving the instruments, and finally analyzing the data at the surface. The success rate of such measurement techniques is often low and the types of sensors available are limited. Current methods for determining chemical composition cannot account for immediate changes in constituents and concentrations because results are often obtained a few hours or days after the measurement was taken, and only a limited number of chemical compounds can be measured in real time. Results for water chemistry are suspect because water from another depth may have leaked into the samples. Present downhole data collection by electronic instruments is limited by high temperatures and the need to use heavy conducting cables. As a result, instruments for monitoring physical-chemical parameters for geothermal brines and for downhole logging are very limited at present, as reported by Lamers (1979) and Baxter et ai. (1987). 285
Transcript of FIELD TESTING OF AN OPTICAL FIBER TEMPERATURE … · FIELD TESTING OF AN OPTICAL FIBER TEMPERATURE...
Geothermics, Vol. 19, No.3, pp. 285-294,1990.Printed in Grcat Britain.
0375-6505/90 $3.00 + 0.00Pergamon Press pic
CNR.
FIELD TESTING OF AN OPTICAL FIBER TEMPERATURESENSOR IN A GEOTHERMAL WELL
S. K, SHARMA,*t A. SEKI,t S. M. ANGEL:!: and D. G. GARVIS:j:
• Hawaii Institute of Geophysics. t Hawaii Natural Energy Institute, University of Hawaii at Manoa,Honolulu, Hawaii 96822, U.S.A, and tEnvironmental Sciences Division, Lawrence Livermore National
Laboratory, Livermore. California 94550. U.S.A.
(Received March 1989; accepted September 1989)
Abstract-A program has been initiated for developing and field testing optical fiber sensors to monitor insitu physical and chemical parameters in highly corrosive environments. such as geothermal wells. oilwells. and hot-water boiler reactors. The difficulty of sampling hot geothermal fluids or reliably measuringphysical and chemical properties of brines in wells limits our understanding of in situ conditions ingeothermal fields. In this communication. the authors report a test of the concept of utilizing optical fiberbased sensors by measuring the temperature profile of a geothermal steam well. The purpose of this workis not only to demonstrate that a temperature optical chemical sensor (optrode) can be used to obtain realtime information from a geothermal well, but also that great potential of the optrodes can be exploited formeasuring physical and chemical parameters in the field, It is believed that this is the first real-time. in situ.geothermal well measurement to have been made using an optical fiber sensor.
INTRODucnON
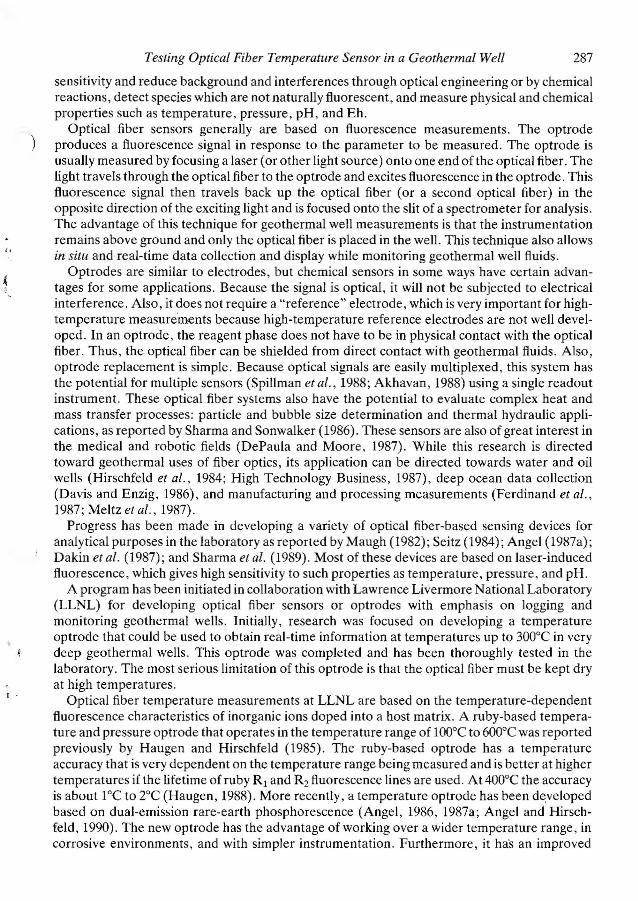
The State of Hawaii has focused a large amount of time and support on developinggeothermal energy in the state. The Hawaii Geothermal Project-Abbott (HGP-A) power plant,which was developed in collaboration with the U.S. Department of Energy, the County ofHawaii, and the local utility, has been operational since 1981. This power plant has proven thatgeothermal development is a viable goal for the private sector, and recently a number of privatedevelopers have drilled wells around HGP-A (Fig. 1) in the Kilauea east rift zone.
While technology has advanced in certain aspects of geothermal exploration, development ofdown-hole instrumentation has not advanced significantly. At temperatures :s300°C, temperature measurements can routinely be made. However, pressure and, especially, fluid chemistrymeasurements are more restrictive. Up to 300°C wireline measurements can be made fortemperature and pressure. Above this temperature, the measurements are more difficult. Thepresent method for gathering temperature, pressure, and fluid chemistry information aboutgeothermal well fluids involves lowering mechanical and electronic instruments into the well,retrieving the instruments, and finally analyzing the data at the surface. The success rate of suchmeasurement techniques is often low and the types of sensors available are limited. Currentmethods for determining chemical composition cannot account for immediate changes inconstituents and concentrations because results are often obtained a few hours or days after themeasurement was taken, and only a limited number of chemical compounds can be measured inreal time. Results for water chemistry are suspect because water from another depth may haveleaked into the samples. Present downhole data collection by electronic instruments is limitedby high temperatures and the need to use heavy conducting cables. As a result, instruments formonitoring physical-chemical parameters for geothermal brines and for downhole logging arevery limited at present, as reported by Lamers (1979) and Baxter et ai. (1987).
285
286 S. K. Sharma et al.
.,'
(
10I
5I
KILOMETERS
Well Date of Completion
Geotherma I IGeothermal 2Geothermal 3HGP-AAshida IKapoho 1Lani punaKapoho 2Lanipuna 6Kapoho 1A
GEOTHERMAL 3
oI
flGP-A~....:>rte --...,. ,.-.-- ~
. . "1" "LANIPUNA 6
\.:"ANI PUtlA 1
/.e..:-:-- to <; it Of,
\GEOTflERMAl I & 2
PAflOA
Fig. 1. Geothermal development on the Big Island of Hawaii.
BACKGROUND
New methods are being developed by scientists that could make remote measurements ofphysical and chemical properties more feasible. These methods employ optical fiber to makespectroscopic measurements in inaccessible locations. In some cases, optical chemical sensors(optrodes) are used to make specific chemical measurements. Optrodes are modified fiberterminations which enhance sensitivity and specificity over direct optical fiber measurementsand increase the number of species which can be measured. An optrode can be used to enhance
u·
Testing Optical Fiber Temperature Sensor in a Geothermal Well 287
sensitivity and reduce background and interferences through optical engineering or by chemicalreactions, detect species which are not naturally fluorescent, and measure physical and chemicalproperties such as temperature, pressure, pH, and Eh.
Optical fiber sensors generally are based on fluorescence measurements. The optrodeproduces a fluorescence signal in response to the parameter to be measured. The optrode isusually measured by focusing a laser (or other light source) onto one end of the optical fiber. Thelight travels through the optical fiber to the optrode and excites fluorescence in the optrode. Thisfluorescence signal then travels back up the optical fiber (or a second optical fiber) in theopposite direction of the exciting light and is focused onto the slit of a spectrometer for analysis.The advantage of this technique for geothermal well measurements is that the instrumentationremains above ground and only the optical fiber is placed in the well. This technique also allowsin situ and real-time data collection and display while monitoring geothermal well fluids.
Optrodes are similar to electrodes, but chemical sensors in some ways have certain advantages for some applications. Because the signal is optical, it will not be subjected to electricalinterference. Also, it does not require a "reference" electrode, which is very important for hightemperature measure'ments because high-temperature reference electrodes are not well developed. In an optrode, the reagent phase does not have to be in physical contact with the opticalfiber. Thus, the optical fiber can be shielded from direct contact with geothermal fluids. Also,optrode replacement is simple. Because optical signals are easily multiplexed, this system hasthe potential for multiple sensors (Spillman et al., 1988; Akhavan, 1988) using a single readoutinstrument. These optical fiber systems also have the potential to evaluate complex heat andmass transfer processes: particle and bubble size determination and thermal hydraulic applications, as reported by Sharma and Sonwalker (1986). These sensors are also of great interest inthe medical and robotic fields (DePaula and Moore, 1987). While this research is directedtoward geothermal uses of fiber optics, its application can be directed towards water and oilwells (Hirschfeld et al., 1984; High Technology Business, 1987), deep ocean data collection(Davis and Enzig, 1986), and manufacturing and processing measurements (Ferdinand et al.,1987; Meltz et al., 1987).
Progress has been made in developing a variety of optical fiber-based sensing devices foranalytical purposes in the laboratory as reported by Maugh (1982); Seitz (1984); Angel (1987a);Dakin et al. (1987); and Sharma et al. (1989). Most of these devices are based on laser-inducedfluorescence, which gives high sensitivity to such properties as temperature, pressure, and pH.
A program has been initiated in collaboration with Lawrence Livermore National Laboratory(LLNL) for developing optical fiber sensors or optrodes with emphasis on logging andmonitoring geothermal wells. Initially, research was focused on developing a temperatureoptrode that could be used to obtain real-time information at temperatures up to 300°C in verydeep geothermal wells. This optrode was completed and has been thoroughly tested in thelaboratory. The most serious limitation of this optrode is that the optical fiber must be kept dryat high temperatures.
Optical fiber temperature measurements at LLNL are based on the temperature-dependentfluorescence characteristics of inorganic ions doped into a host matrix. A ruby-based temperature and pressure optrode that operates in the temperature range of 100°C to 600°C was reportedpreviously by Haugen and Hirschfeld (1985). The ruby-based optrode has a temperatureaccuracy that is very dependent on the temperature range being measured and is better at highertemperatures if the lifetime of ruby R1 and R2 fluorescence lines are used. At 400°C the accuracyis about 1°C to 2°C (Haugen, 1988). More recently, a temperature optrode has been developedbased on dual-emission rare-earth phosphorescence (Angel, 1986, 1987a; Angel and Hirschfeld, 1990). The new optrode has the advantage of working over a wider temperature range, incorrosive environments, and with simpler instrumentation. Furthermore, it has an improved
288 S. K. Sharma et at.
accuracy because the intensity ratio of two emission bands are measured. The objective of theresearch reported here is to demonstrate that a temperature optrode can be used to obtain realtime information from a geothermal well and that it can be used interactively.
OPERATION OF AN OPTICAL FIBER TEMPERATURE OPTRODE
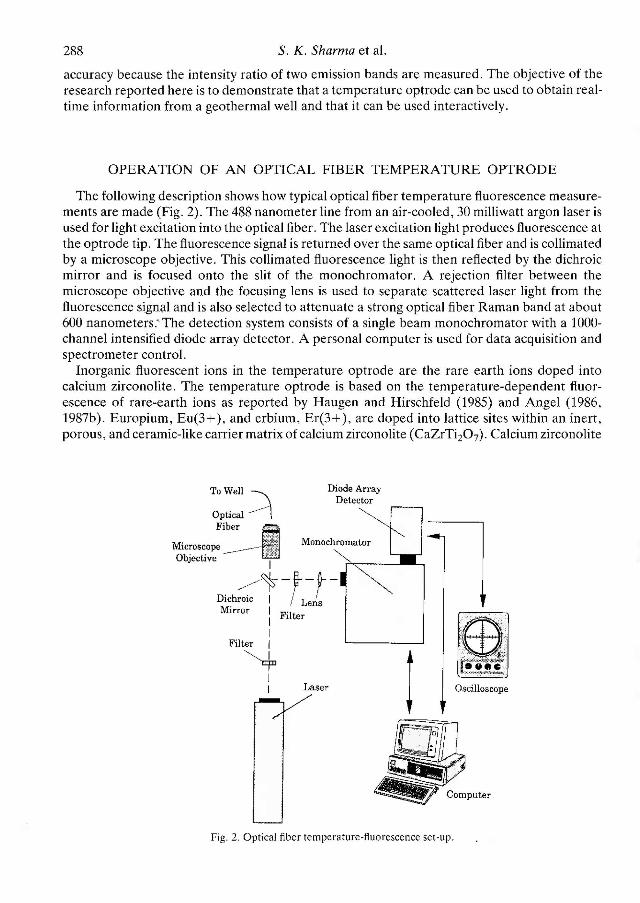
The following description shows how typical optical fiber temperature fluorescence measurements are made (Fig. 2). The 488 nanometer line from an air-cooled, 30 milliwatt argon laser isused for light excitation into the optical fiber. The laser excitation light produces fluorescence atthe optrode tip. The fluorescence signal is returned over the same optical fiber and is collimatedby a microscope objective. This collimated fluorescence light is then reflected by the dichroicmirror and is focused onto the slit of the monochromator. A rejection filter between themicroscope objective and the focusing lens is used to separate scattered laser light from thefluorescence signal and is also selected to attenuate a strong optical fiber Raman band at about600 nanometers.' The detection system consists of a single beam monochromator with a 1000channel intensified diode array detector. A personal computer is used for data acquisition andspectrometer control.
Inorganic fluorescent ions in the temperature optrode are the rare earth ions doped intocalcium zirconolite. The temperature optrode is based on the temperature-dependent fluorescence of rare-earth ions as reported by Haugen and Hirschfeld (1985) and Angel (1986,1987b). Europium, Eu(3+). and erbium, Er(3+). are doped into lattice sites within an inert,porous, and ceramic-like carrier matrix of calcium zirconolite (CaZrTi20 7). Calcium zirconolite
Laser
Monochromator
Oscilloscope!
Diode ArrayDetector
ToWell \
Optical~
Fiber I····Microscope ~- ":~.::':.
~ ""'IiObjective I'
~-~-t-Dichroic I / LensMirror : Filter
IFilter I
~II
Fig. 2. Optical fiber temperature·fluorescence set-up.
Testing Optical Fiber Temperature Sensor in a Geothermal Well 289
)
was chosen as the carrier matrix because of its ability to immobilize rare earths and actinideswithout leaching in extremely corrosive environments.
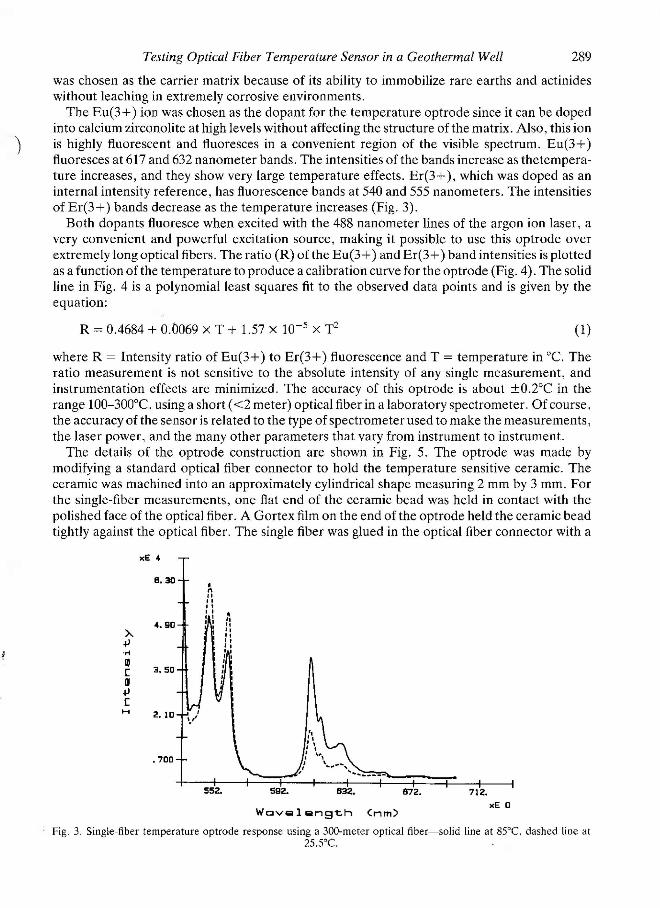
The Eu(3+) ion was chosen as the dopant for the temperature optrode since it can be dopedinto calcium zirconolite at high levels without affecting the structure ofthe matrix. Also, this ionis highly fluorescent and fluoresces in a convenient region of the visible spectrum. Eu(3+)fluoresces at 617 and 632 nanometer bands. The intensities ofthe bands increase as thetemperature increases, and they show very large temperature effects. Er(3+), which was doped as aninternal intensity reference, has fluorescence bands at 540 and 555 nanometers. The intensitiesof Er(3+) bands decrease as the temperature increases (Fig. 3).
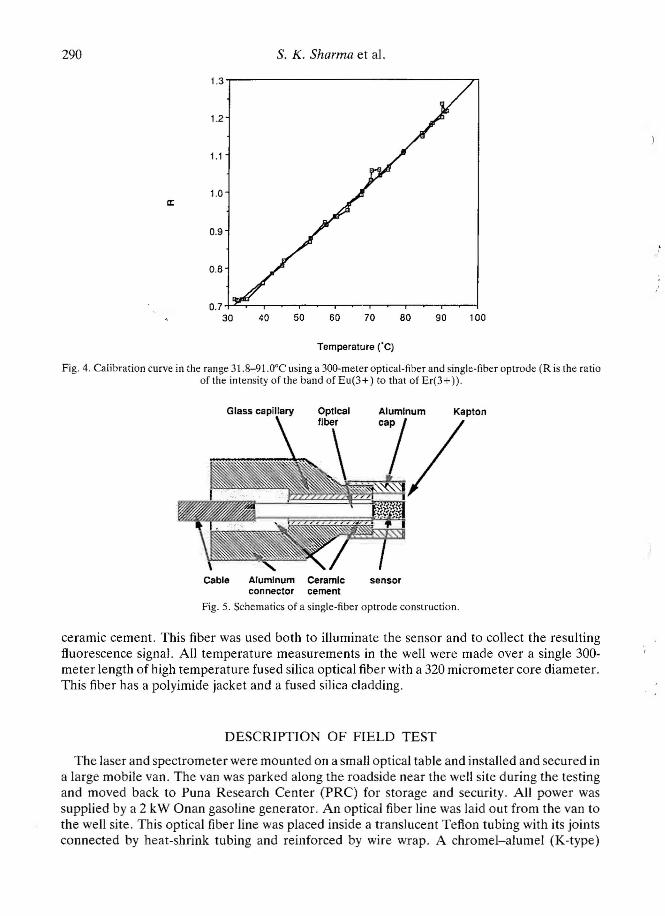
Both dopants fluoresce when excited with the 488 nanometer lines of the argon ion laser, avery convenient and powerful excitation source, making it possible to use this optrode overextremely long optical fibers. The ratio (R) of the Eu(3 +) and Er(3+) band intensities is plottedas a function of the temperature to produce a calibration curve for the optrode (Fig. 4). The solidline in Fig. 4 is a polynomial least squares fit to the observed data points and is given by theequation:
R = 0.4684 + 0.D069 x T + 1.57 X 10⁻⁵ x T2 (1)
where R = Intensity ratio of Eu(3+) to Er(3+) fluorescence and T = temperature in °C. Theratio measurement is not sensitive to the absolute intensity of any single measurement, andinstrumentation effects are minimized. The accuracy of this optrode is about ±0.2°C in therange 100-300°C, using a short «2 meter) optical fiber in a laboratory spectrometer. Of course,the accuracy of the sensor is related to the type of spectrometer used to make the measurements,the laser power, and the many other parameters that vary from instrument to instrument.
The details of the optrode construction are shown in Fig. 5. The optrode was made bymodifying a standard optical fiber connector to hold the temperature sensitive ceramic. Theceramic was machined into an approximately cylindrical shape measuring 2 mm by 3 mm. Forthe single-fiber measurements, one flat end of the ceramic bead was held in contact with thepolished face of the optical fiber. A Gortex film on the end of the optrode held the ceramic beadtightly against the optical fiber. The single fiber was glued in the optical fiber connector with a
"E •
712.
"E 0672.632.
3.50
.700
•• 90
6.30
WCVlOlllOl""gth <,..,m)Fig. 3. Single-fiber temperature optrode response using a 300-meter optical fiber-solid line at 8SOC. dashed line at
2S,jOC.
290 S. K. Sharma et al.
1.3 .......-------------------r1
1.2
1.1
1.0
0.9
0.8
100908070605040O.7 +':....,....---r--..-~__r~__,r__~__,_~__r-..___l
30
Temperature ee)
Fig. 4. Calibration curve in the range 31.8-91.0°C using a 300-meter optical-fiber and single-fiber optrode (R is the ratioof the intensity of the band of Eu(3+) to that of Er(3+ )).
Glass capillary
Cable Aluminum Ceramic sensorconnector cement
Fig. 5. Schematics of a single-fiber optrode construction.
ceramic cement. This fiber was used both to illuminate the sensor and to collect the resultingfluorescence signal. All temperature measurements in the well were made over a single 300meter length of high temperature fused silica optical fiber with a 320 micrometer core diameter.This fiber has a polyimide jacket and a fused silica cladding.
DESCRIPTION OF FIELD TEST
The laser and spectrometer were mounted on a small optical table and installed and secured ina large mobile van. The van was parked along the roadside near the well site during the testingand moved back to Puna Research Center (PRe) for storage and security. All power wassupplied by a 2 kW Onan gasoline generator. An optical fiber line was laid out from the van tothe well site. This optical fiber line was placed inside a translucent Teflon tubing with its jointsconnected by heat-shrink tubing and reinforced by wire wrap. A chromel~alumel (K-type)
Testing Optical Fiber Temperature Sensor in a Geothermal Well 291
thermocouple served a dual purpose as a reference in the data collected and a support line forthe optical fiber cable. The thermocouple line was secured to the optical fiber line with wire atroughly 3-meter intervals. This was important because the force of the steam from the steamwell was strong enough to cause damage to the optical fiber cable. A 0.9-kilogram lead weightwas attached to the end to facilitate getting the optical fiber cable into the well against the forceofthe upcoming steam. The optical fiber cable assembly was lowered into the well with apulley/wireline depth meter set-up.
The Teflon tube used to protect the optical fiber cable was translucent, which allowed sunlightto leak radially into the optical fiber and resulted in very high background signals. Varying cloudconditions made it very difficult to subtract background signals from each spectrum accurately.The problem was nearly eliminated by wrapping the above-ground portion of the optical fibercable with aluminum foil; however, some small amount of signal variation always remained dueto incomplete elimination of the sunlight signal. This led ultimately to lower precision in thetemperature measurements. However, since the main purpose of these tests was to demonstrateinteractive real-time optical fiber measurements, there was no attempt to solve this problemcompletely or to obta~n maximum accuracy in the measurements.
DESCRIPTION OF FIELD TEST SITE
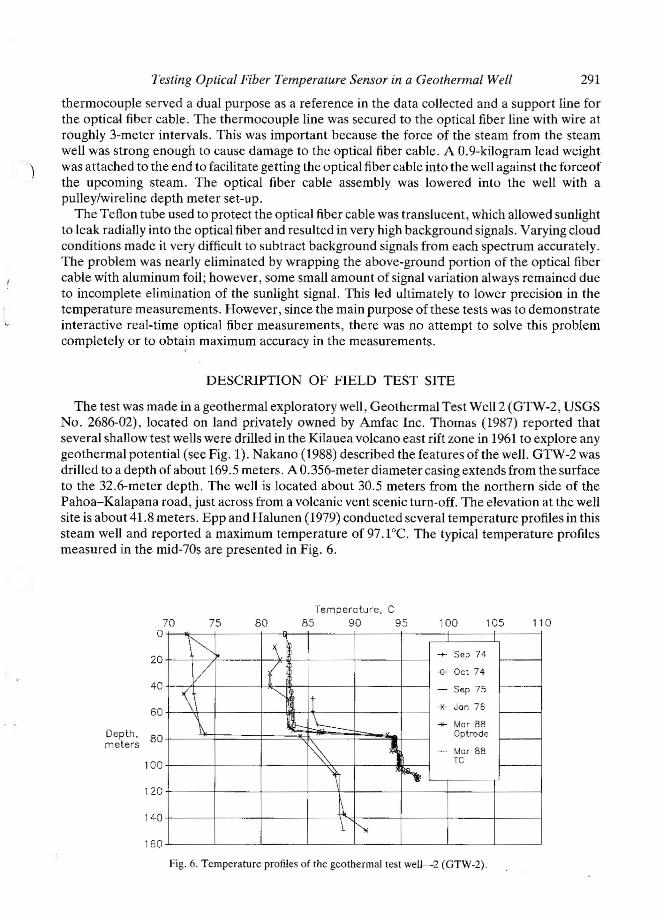
The test was made in a geothermal exploratory well, Geothermal Test Well 2 (GTW-2, USGSNo. 2686-02), located on land privately owned by Amfac Inc. Thomas (1987) reported thatseveral shallow test wells were drilled in the Kilauea volcano east rift zone in 1961 to explore anygeothermal potential (see Fig. 1). Nakano (1988) described the features of the well. GTW-2 wasdrilled to a depth of about 169.5 meters. A O. 356-meter diameter casing extends from the surfaceto the 32.6-meter depth. The well is located about 30.5 meters from the northern side of thePahoa-Kalapana road, just across from a volcanic vent scenic turn-off. The elevation at the wellsite is about 41.8 meters. Epp and Halunen (1979) conducted several temperature profiles in thissteam well and reported a maximum temperature of 97.1DC. The typical temperature profilesmeasured in the mid-70s are presented in Fig. 6.
~,I \ ..... Sep 74
/ ( -B- Oct 74
~ ""'" II- Sep 75
* Jon 76
\ ~ L .... Mar 88Optrode
~ ~ - Mar 88TC
~ ~~
.J..
~
70o
20
40
60
Depth, 80meters
100
120
140
160
75 80Temperature, C
85 90 95 100 105 110
Fig. 6. Temperature profiles of the geothermal test well-2 (GTW.2).
292 S. K. Sharma et al.
RESULTS AND DISCUSSION
The optrode was calibrated at LLNL using the same 300-meter optical fiber that was used inthe experiments. The calibration was done in the dark and without subtracting the Ramanbackground component of the optrode signal. A 37.9-liter thermostat water bath was usedforthe calibration between room temperature (about 25°C) and 95°C. The water temperaturewas measured using a K-type thermocouple. The water temperature varied by ±2°C, which is,therefore, the accuracy of the optrode calibration. Optrode measurements were made while thetemperature of the water bath was increased from 25 to 95°C, and again as the water bath cooledback to room temperature.
The well temperature measurements were made by lowering the optrode to a particular depthwhile monitoring the real-time response of the detector on an oscilloscope. This was found to bevery useful for quickly locating and examining interesting spots in the well (large steps intemperature profiles). After positioning the probe to a particular depth, the sensor response wasallowed to reach equilibrium «1 sec), and three spectra were measured. One spectrum wasmeasured with the,sensor illuminated (fluorescence signal plus background signal), followed byone with the laser shuttered (background signal only), and a second spectrum with the fiberilluminated. The shuttered spectrum was used for subtracting the variable background signalthat was due to sunlight leaking into the optical fiber. A thermocouple reading was also recordedat each depth. After completing the measurements at a particular depth, the probe wasrepositioned and the procedure repeated. This was done on lowering into the well and again onretrieval. In some cases, interesting regions were repeated several times. Our measurementswere slowed by manual repositioning of the sensors in the well. Automation of the positioningdevice will allow a continuous depth versus temperature profile (well log) in a short period oftime.
Figure 6 shows temperature profiles that were obtained for GTW-2 using the optrode andthermocouple against earlier profiles by Epp and Halunen (1979), who used calibratedthermistors. Optrode temperature measurements were made to a depth of 150 meters. Theagreement between the optical measurements and the thermocouple measurements is withinthe error of the calibration data (±2°C). The accuracy is not as good as that found in thelaboratory, especially near the surface. This is partly because of errors in the calibration dataand also because of the difficulty of accurately subtracting the varying sunlight backgroundsignals.
The accuracy of the single-fiber optrode measurements depends to a great degree on theability to remove and subtract the background signals generated in the fiber itself. The sunlightcontribution to the background can be easily eliminated by properly shielding the fiber. Theoptical fiber Raman signal can be greatly reduced by using separate fibers to illuminate theoptrode fiber and to collect the fluorescence from the optrode. The Raman signal is generatedin the optical fiber by the exciting laser light and propagates in both directions within thefiber. Thus, in a single-fiber probe the Raman signal travels directly back to the spectrometerand, for long optical fibers, is a major source of background signal. Using a separate opticalfiber to collect the fluorescence eliminates a direct path for the Raman signal to return to thedetector.
A discontinuous change in the temperature at 75 m was accurately detected by the optrodesensor as well as by the thermocouple (Fig. 6). It is interesting to note that previousmeasurements have also observed this discontinuity in GTW-2. Over a period of about 12 years,the temperature of the well has decreased by only lOoC, indicating the presence of a large heatsource in the vicinity of the well.
Testing Optical Fiber Temperature Sensor in a Geothermal Well
CONCLUSIONS
293
)
We have successfully tested our concept of utilizing optical fiber sensors for making in situtemperature measurements in a geothermal steam well using over 300 m of optical fiber. It wasdemonstrated that this optrode can be used in situ in an interactive manner to obtain real-timeinformation in geothermal wells. The Raman signal generated in the optical fiber can be amajorsource of background noise in a single-fiber optrode system. Based on the magnitudecofthe fluorescence signal generated by the optrode over 300 m of optical fiber and the knownattenuation of the optical fiber, it is believed that wells up to 1000 m in depth can be logged.Using the present instrument configuration, spectra can be obtained at a rate of about 30 per sec.This will allow very high spatial resolution measurements to be made as the probe iscontinuously lowered into the well. In our present experiment, our measurements were,however, limited by our crude manual repositioning equipment.
In the future, other types of optrodes will be tested to measure chemical parameters ingeothermal wells. High temperature pH and Eh optrodes are already being tested for thispurpose. In the mordfQmediate future, the temperature optrode should be tested in hotter anddeeper geothermal wells. It has been tested in the laboratory to 320°C at several thousandkilopascals pressure for extended periods of time. However, to be used at such high temperatures the optical fiber has to be well shielded and kept from directly contacting the geothermalfluids.
Acknowledgemenl.~-Funding for this project was provided by the U.S. Department of Energy (USDOE) underContract W-7405-Eng-48 and the Hawaii Natural Energy Institute (HNEI). The authors would like to express thanks toDr Marshall Reed of USDOE and Dr Paul Kasameyer of LLNL for their interest and support of this work. We wouldlike to thank Dr Patrick Takahashi and Dr Harry Olsen of HNEI for their support and encouragement. In addition, weexpress thanks to Dr Tom Kulp for his role in the experiments, Mr Jack Huizingh and Roy Nakanishi of the NaturalEnergy Laboratory of Hawaii for use and access to PRC and HGP-A brine, Mr Don Heinzen of Amfac for access toGTW-2, and Mr Ben Respicio of the University of Hawaii engineering shop for fabrication of the fiber-optic line pulleystand. This is Hawaii Institute of Geophysics contribution No. 2280.
REFERENCES
Akhavan, P. (1988) Optical fiber point temperature sensor. Proc. SPIE, the International Society for OpticalEngineering 838,231-237.
Angel, S. M. (1986) Fiber optic temperature sensor for use in a geothermal well. Paper presented at the 1986 PittsburghConference and Exposition, Atlantic City, New Jersey. Abstract No. 673, March 10-13.
Angel, S. M. (1987a) Development of fiber optics sensors for temperature measurement and chemical analysis ingeothermal wells. Geoth. Res. Counc. Trans. 11, 155.
Angel, S. M. (1987b) Optrodes: chemically selective fiber-optics sensors. Spectroscopy 2. 38-46.Angel, M. and Hirschfeld, T. (1990) Dual-emission rare-earth temperature optrode (in preparation).Baxter, R. D., Clack, P. J., Phlen, D. M. and Taylor, R. M. (1987) R&D, fabrication and testing of pH C0:2 sensors for
geothermal brines. Prepared by Leeds and Northrup Company for Pacific Northwest Laboratory under contract DEAC06-76RLO 1830, March.
Dakin, J. P., Wade, C. A. and Withers, P. B. (1987) An optical fibre sensor for the measurement of pressure. Proc.SPIE, the International Society fOT Optical Engineering 798, pp. 48-55.
Davis, C. M. and Einzig, R. E. (1986) Fiber optic potential offer unbridled potential. Sea Technol., November, pp. 1924.
DePaula, R. P. and Moore, E. L. (1987) Overview of fiber-optic sensors. NASA Tech Brief, II, No.7. Item #84 for JPLInvention Report NPO-16817/6329.
Epp, D. and Halunen, A. (1979) Temperature profiles in wells on the island of Hawaii. Geothermal Resources. Exploration in Hawaii: Number 7. Hawaii Institute of Geophysics, University of Hawaii.Ferdinand, P., Liu, C. and Kleitz, A. (1987) Fiber optic sensor for temperature measurement in gas flow and steam
turhines. Proc. SPIE. the International Society for Optical Engineering 798, pp. 142-148.Haugen, G. (1988) Personal communication, staff scientist, Lawrence Livermore National Laboratory.
294 S. K. Sharma et ai.
Haugen G. and Hirschfeld, T (1985) Fiber optics temperature and pressure probes. Lawrence Livermore NationalLaboratory internal publication, UCID·2(JS63. October.
High Technology Business (1987) Fiber optics fight pollution, December, p. 12.Hirschfeld, T, Deaton, T, Milanovich, F., Klainer, S. M. and Fitzsimmons, C. (1984) The feasibility of using fiber
optics for monitoring groundwater contaminants. Project Report, AD-89-F-2A07, U .S.E.P.A., p. 82.Lamers, M. D. (1979) Measure requirements and methods for geothermal reservoir system parameters (an appraisal).
Technical Report LBL-9090IGREMP-61Uc-66b, Earth Sciences, Lawrence Berkeley Laboratory. University ofCalifornia, Berkeley, p. 42.
Maugh, T. H., 11 (1982) Remote spectrometry with fiber optics. Science 218,875-876.Meltz, G., Dunphy. J. R., Glenn, W. H., Farina, J. D. and Leonberger, F. J. (1987) Fiber optic temperature and strain
sensors. Proc. SPlE, the InternaTional Society for Optical Engineering 798, pp. 104-114.Nakano. Dean (1988) Personal communication. Division of Water and Land Development, Department of Land and
Natural Resources, State of Hawaii.Seitz, W. R. (1984) Chemical sensors based on fiber optics. Anal. Chem. 56, 16A-34A.Sharma, S. K. and Sonwalker, N. (1986) Preliminary feasibility studies of optical fiber based laser diagnostic techniques
for remole in SiTU monitoring of thermal hydraulic systems. Unpublished report.Sharma, S. K., Zhang, J. D. and Weldon, E. J. Jr. (1989) Remote in situ monitoring of pressure and temperature with
fiber optics. Hawaiilnstitute of Geophysics, 1988 Report, pp. 8-11.Spillman, W. B., Kline. B. R. and Lord, J. R. (1988) Self-referencing frequency division multiplexing technique for
fiber optic sensors. Proc. SPIE. the InTernaTional SocieTy for OpTical Engineering 838, 200-205.Thomas, D. (1987.) A geochemical model of the Kilauea east rift zone. Volcanism in Hawaii II, U.S.O.S. Professional
Paper, pp. 1507-i525.