Field Manual for Rapid Assessment Metrics for Wildlife … Manual for Rapid Assessment Metrics for...
36
Field Manual for Rapid Assessment Metrics for Wildlife and Biodiversity in Southern Open Pine Ecosystems May 6, 2016 Prepared by: Rickie White & Carl Nordman NatureServe 601-A Foster Street Durham, NC 27701 Based on work originated by: F. Joseph Rocchio Washington Natural Heritage Program Washington Department of Natural Resources Olympia, Washington 98504-7014
Transcript of Field Manual for Rapid Assessment Metrics for Wildlife … Manual for Rapid Assessment Metrics for...

Field Manual for Rapid Assessment Metrics for Wildlife
and Biodiversity in Southern Open Pine Ecosystems
May 6, 2016
Prepared by:
Rickie White & Carl Nordman
NatureServe
601-A Foster Street
Durham, NC 27701
Based on work originated by:
F. Joseph Rocchio
Washington Natural Heritage Program
Washington Department of Natural Resources
Olympia, Washington 98504-7014


Field Manual for Open Pine Rapid Assessment Metrics (2016)
i
Contents
1.0 INTRODUCTION ............................................................................................. 1
2.0 APPLYING RAPID ASSESSMENT METRICS IN SOUTHERN OPEN PINE ECOSYSTEMS....................................................................................................... 3
2.1 DETERMINE THE ASSESSMENT AREA AND DETERMINE THE TARGET SOUTHERN OPEN PINE GROUPINGS (BASED ON FABER-LANGENDOEN ET AL. 2012, ROCCHIO 2015). ................. 3
2.2 CONDUCT THE FIELD ASSESSMENT AND ENTER DATA COLLECTED ON FIELDSHEET............ 7
2.3 COMPLETE METRIC ASSESSMENT SCORES TO CALCULATE A SCORE FOR THE CANOPY, MIDSTORY, GROUND LAYER, AND AN OVERALL SCORE. ............................................................ 8
2.4 ENTER/UPLOAD RESULTS. ..................................................................................................... 8
3.0 DEFINITIONS OF KEY FIELDS ON DATA SHEETS ............................................... 8
SITE / ASSESSMENT AREA INFORMATION .................................................................................. 8
LOCATION .................................................................................................................................... 9
CLASSIFICATION ........................................................................................................................ 10
REFERENCES ...................................................................................................... 11
APPENDIX A. KEY TO SOUTHERN OPEN PINE HABITAT GROUPINGS ........................................ 13
Key to Open Pine Groupings ................................................................................................. 14
Notes on Some Ambiguous or Confusing Habitats ............................................................... 20
APPENDIX B. RAPID ASSESSMENT FIELD COVER SHEET ............................................................ 21
APPENDIX C. RAPID ASSESSMENT METRICS DATA/SCORING SHEETS (BY HABITAT GROUPING)................................................................................................................................................... 23

Field Manual for Open Pine Rapid Assessment Metrics (2016)
ii
Figures Figure 1. Example of delineated Assessment Areas (AAs). .......................................................................... 6
Tables
Table 1. Cover Classes .................................................................................... Error! Bookmark not defined.

Field Manual for Open Pine Rapid Assessment Metrics (2016)
1
1.0 Introduction
This document describes a new, highly flexible, rapid, efficient approach to assessment of open
pine ecosystems that can be applied by a wide range of landowners, land managers, wildlife
technicians, biologists, and other natural resource scientists to help them understand their land’s
contribution to biodiversity and target species’ wildlife habitat.
Specifically, the protocols describe a way to apply field-based desired forest condition metrics
within Southern Open Pine Ecosystems specifically for those managers whose primary goal is
maintenance of biodiversity or enhancement of wildlife habitat for species dependent on open
pine ecosystems. The metrics in this protocols document are based directly on Nordman et al.
2016, and more exhaustive descriptions of each metric can be found there. Discussion of the
concepts behind this type of assessment, which is often referred to as an ecological integrity
assessment, can be found in Rocchio and Crawford (2011) and Faber-Langendoen et al. (2006,
2012, and 2014).
What is Southern Open Pine?
In the southeastern United States, there are several large-scale (or formerly large-scale)
ecosystems dominated by an open canopy of pine trees that are used by a great variety of
game and non-game wildlife species and plants. Due to changes in land use and lack of fire,
these open pine ecosystems have undergone extensive declines over the last 100 years and
continue to be threatened with further decline. These ecosystems are found from the West
Gulf Coastal Plain and Ozark and Ouachita Mountains to the Southern Appalachians, Piedmont,
Atlantic and East Gulf Coastal Plains, and south into the Florida Peninsula.
In the past, these ecosystems have consisted of open pine stands with a diverse ground cover
composed of native warm season grasses and forbs, often with some low shrubs and only
sparse tall shrubs. These open conditions were historically maintained by natural processes,
including fire and grazing. Today, these ecosystems require active management to maintain or
to restore the open herbaceous conditions preferred by many species of wildlife (for a fuller
discussion of the wildlife targeted in this assessment, please refer to Nordman et al. 2016).
While these ecosystems occur across the southeastern United States, this current project more
specifically focuses on southern open pine wildlife systems dominated by southern yellow
pines, particularly longleaf pine (Pinus palustris) and shortleaf pine (Pinus echinata), which
occur in the southern coastal plains and the Ozark and Ouachita mountains. We also focus on
natural stands of slash pine (Pinus elliottii) and loblolly pine (Pinus taeda).
Who is the intended user for these protocols?

Field Manual for Open Pine Rapid Assessment Metrics (2016)
2
This protocols document can be utilized by anyone who is working within the geographic range
of our project. The protocols have been specifically developed for landowners and land
managers on lands where conservation and/or restoration of open pine ecosystems and their
associated wildlife is the highest priority.
How do these protocols help users meet conservation goals?
After years of steady decline in acreage and quality, the remaining examples of southern open
pine ecosystems are a patchwork of existing and restored tracts. In order to restore the
function of this formerly grand ecosystem and to fully protect the species that rely on the
ecosystem, we must first understand the amount of land that is currently providing high quality
habitat to our target species. These protocols help us at two different scales:
At the finest scale, these protocols give land managers with a conservation focus a
powerful, efficient tool that allows them to collect data and quickly understand whether
stands are in good or excellent condition (providing priority wildlife species’ habitat) or
not.
At larger scales, these protocols can contribute to our understanding of the overall
condition of open pine ecosystems regionally and allow us to more precisely plan for a
better future for this ecosystem.

Field Manual for Open Pine Rapid Assessment Metrics (2016)
3
2.0 Applying Rapid Assessment Metrics in Southern
Open Pine Ecosystems
Below are general guidelines for applying the desired forest condition metrics to southern open
pine occurrences.
Step 1: Determine the assessment area, determine your target Southern Open Pine Groupings
(community type(s)), and choose your sampling strategy. Look at a map of your study
area and determine the extent and size of the southern open pine occurrences or stands
on your site and any stands that you wish to manage as southern open pine but that are
currently other community types (for example, an old field or low quality hardwood
stand that you are managing to become open pine in the future). Using the guidance in
Section 2.2 below, delineate boundaries of the occurrences or stands of the different
southern open pine groupings and choose a sampling strategy that best fits your needs.
Step 2: Conduct the field assessment and enter data collected on field datasheet. Assess point
or polygon. Assessment will consist of walking stands or visits to sets of random points
within stands, and can be completed as data collection added to an ongoing natural
resource inventory or timber cruise procedure. Use the sample field data sheet
provided, or create your own.
Step 3: Complete metric assessment scores to calculate a score for the canopy, midstory,
ground layer, and an overall score using the worksheet provided in this document.
Step 4: Enter/upload results into a database. Our Ecology Observation Database for open pine
is currently under development, but should be available later in 2016.
2.1 Determine the Assessment Area and Determine the Target Southern
Open Pine Groupings (based on Faber-Langendoen et al. 2012, Rocchio 2015). The assessment area is “the entire area, subarea, or point of an occurrence of an ecosystem type
with a relatively homogeneous ecology and condition” (Faber-Langendoen et al. 2012). In other
words, it is the area where the desired forest condition metrics will be applied. There are different
approaches for determining the assessment area boundaries. The approach used depends on
natural resource management goals, project objectives, southern open pine ecosystem
restoration targets, etc. The approaches for assessment area delineation are generally of two
categories: (1) point-based and (2) polygon-based.

Field Manual for Open Pine Rapid Assessment Metrics (2016)
4
A single point-based approach typically defines a relatively small area (.1 hectare, for example)
around a point, where the assessment is conducted. This could be a circle of a certain radius for
most metrics, and basal area could be measured with a prism from the center.
A point based approach in which a fixed area is sampled around a point offers some advantages
and disadvantages (Fennessy et al. 2007, Stevens and Jensen 2007):
simple sampling design
no mapped boundary of ecosystem type is required for assessment unit
limited practical difficulties in the field of assessing the entire area, as the area is typically relatively small (.1-1 hectare); long-term monitoring programs often use a point-based approach because of these advantages
Flexible so user can take one point per stand or can take multiple points per stand depending upon goals and resources available for sampling.
For collection of multiple points, can take a large amount of sampling time as compared to the polygon approach.
A polygon approach is based on a specific southern open pine ecosystem extent or stand that is
delineated to create a mapped area. The polygon approach is used when a more comprehensive
assessment of ecological integrity is desired. Its advantages and disadvantages are:
Mapping boundaries facilitates whole ecosystem and landscape interpretations
Decision-makers and managers are often more interested in “stands” or “occurrences,” rather than points
Involves assessing the polygon as a whole with one sample, which can speed up the process of data collection but can also lead to spurious conclusions if area sampled is not truly characteristic of polygon as a whole. In areas that turn out to be more heterogeneous than originally intended, there may still need to be some assessment of multiple distinct patches to come up with an average score for the polygon.
How to determine your assessment area (regardless of polygon or point-based approach):
1. Estimate Southern Open Pine Boundaries/assessment area: The first action
needed is to map (formally or informally) the southern open pine ecosystem assessment
area, if there isn’t already a useable map of the area. Readily observable ecological
criteria such as vegetation, soil, and hydrological characteristics can all be used to define
the assessment area where it is most appropriate to apply the rapid assessment protocols
(i.e. areas that are either currently in southern open pine or where managers wish to
manage for a future with open pine. This map could be as simple as a hand drawing
(preferably to scale) or could be a remotely sensed map with a GIS environment.
Field Manual for Open Pine Rapid Assessment Metrics (2016)
5
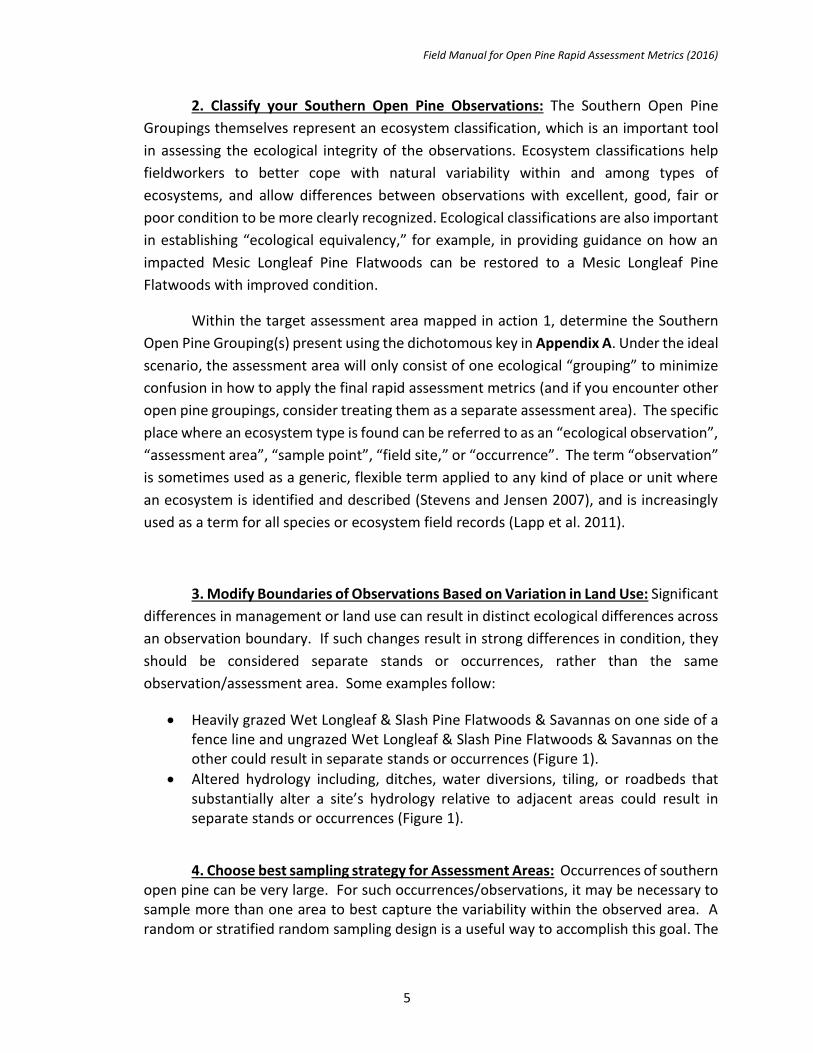
2. Classify your Southern Open Pine Observations: The Southern Open Pine
Groupings themselves represent an ecosystem classification, which is an important tool
in assessing the ecological integrity of the observations. Ecosystem classifications help
fieldworkers to better cope with natural variability within and among types of
ecosystems, and allow differences between observations with excellent, good, fair or
poor condition to be more clearly recognized. Ecological classifications are also important
in establishing “ecological equivalency,” for example, in providing guidance on how an
impacted Mesic Longleaf Pine Flatwoods can be restored to a Mesic Longleaf Pine
Flatwoods with improved condition.
Within the target assessment area mapped in action 1, determine the Southern
Open Pine Grouping(s) present using the dichotomous key in Appendix A. Under the ideal
scenario, the assessment area will only consist of one ecological “grouping” to minimize
confusion in how to apply the final rapid assessment metrics (and if you encounter other
open pine groupings, consider treating them as a separate assessment area). The specific
place where an ecosystem type is found can be referred to as an “ecological observation”,
“assessment area”, “sample point”, “field site,” or “occurrence”. The term “observation”
is sometimes used as a generic, flexible term applied to any kind of place or unit where
an ecosystem is identified and described (Stevens and Jensen 2007), and is increasingly
used as a term for all species or ecosystem field records (Lapp et al. 2011).
3. Modify Boundaries of Observations Based on Variation in Land Use: Significant
differences in management or land use can result in distinct ecological differences across
an observation boundary. If such changes result in strong differences in condition, they
should be considered separate stands or occurrences, rather than the same
observation/assessment area. Some examples follow:
Heavily grazed Wet Longleaf & Slash Pine Flatwoods & Savannas on one side of a fence line and ungrazed Wet Longleaf & Slash Pine Flatwoods & Savannas on the other could result in separate stands or occurrences (Figure 1).
Altered hydrology including, ditches, water diversions, tiling, or roadbeds that substantially alter a site’s hydrology relative to adjacent areas could result in separate stands or occurrences (Figure 1).
4. Choose best sampling strategy for Assessment Areas: Occurrences of southern open pine can be very large. For such occurrences/observations, it may be necessary to sample more than one area to best capture the variability within the observed area. A random or stratified random sampling design is a useful way to accomplish this goal. The

Field Manual for Open Pine Rapid Assessment Metrics (2016)
6
Generalized Random Tessellation Stratified (GRTS) survey design can be used to create a spatially balanced random sample of points within the AA. This method allows for some points to be dropped while maintaining spatially balanced random sampling. The R statistics software package called spsurvey, can be used for GRTS survey design. Details are available online at:
https://science.nature.nps.gov/im/datamgmt/statistics/r/advanced/grts.cfm
http://www.inside-r.org/packages/cran/spsurvey/docs/grts
https://cran.r-project.org/web/packages/spsurvey/index.html
Alternatively, subdivide large occurrences based on ecological or practical criteria
and delineate such that they provide a practical assessment area for rapid assessment
application.
Figure 1. Example of delineated Assessment Areas (AAs). Although contiguous with each other, the savanna and riparian shrubland were delineated as distinct AAs because they were distinct wetland types (e.g., savanna vs. riparian shrubland). The savanna was divided into sub-AAs due to a human-induced disturbance (e.g., ditching) which could significantly alter a large portion of an otherwise contiguous wetland type (e.g., intact vs. disturbed savanna). A decision as to whether to formally recognize two sub assessment areas within a larger assessment area or
4
Plot A– Intact Savanna
Sub AA Intact Savanna
Plot B – Disturbed Savanna
Sub AA – Disturbed Savanna
Plot C – Riparian Shrubland
Full AA – Riparian
ó ó ó ó ó ó ó ó ó ó ó ó ó ó ó ó ó ó ó ó ó ó ó ó ó ó ó ó Full AA – Savanna
Ditch and
Influence
Groundwater
Flow Stream Flow
Fence

Field Manual for Open Pine Rapid Assessment Metrics (2016)
7
to simply incorporate the variation into a single evaluation depends on the observed differences in integrity and the size of the main assessment area versus sub-AAs (adapted from Rocchio 2007).
2.2 Conduct the field assessment and enter data collected on fieldsheet.
The great advantage to our methodology is that it is both fast and flexible. Users can apply the
methodology as rigorously or loosely as is possible using their available resources. Similarly,
users may choose to either apply all metrics or just a subset depending upon the amount of
time and resources they feel they can spare.
Assessment can consist of simply walking through the stands using a polygon-based
assessment, visits to sets of random points within stands using a point-based approach, or can
be completed as data collection added to an ongoing natural resource inventory or timber
cruise procedure. Use the sample field data coversheet provided in Appendix B to document
your entire assessment area and choose the appropriate field form from Appendix C to take
specific data for each point or polygon within your assessment area. Since this is the first
version of this document, we encourage input and feedback on these forms so that we can
improve them for the next iteration of this protocols document.
At the beginning of your project, choose the metrics that you wish to apply. Under the ideal
scenario, users would collect data on all metrics suggested in the document for the open pine
grouping that is applicable. If time is a major factor, at a minimum choose at least 1-2 metrics
per strata (for a total of 3-6 metrics) to ensure that you have metrics representing the canopy,
midstory, and ground layer.
Also for canopy layer, keep in mind that users may use the yellow pine stand density index
measurement INSTEAD OF yellow pine canopy cover and yellow pine basal area. The stand
density index is still in early development stages, so we are allowing users to consider this as an
optional alternative where they feel comfortable applying it.
We highly recommend that users that have the resources to do so collect exact
measurements in the field. In this way, we can potentially look back at the raw data to better
understand how far measurements were from cutoffs between categories of excellent, good,
fair, poor. However, if time is highly limited, then simply marking the
excellent/good/fair/poor category on the datasheet without recording the actual specific
measure is acceptable.

Field Manual for Open Pine Rapid Assessment Metrics (2016)
8
2.3 Complete metric assessment scores to calculate a score for the canopy,
midstory, ground layer, and an overall score.
Once all data is filled in for an assessment area (see appendix C for data sheet templates), it is
time to score each point or polygon assessed. If only scoring one sample, convert any raw data
to a score using the metric cutoffs on the data sheet. Add up all metrics for a particular strata
and follow instructions on sheet for developing a score for that strata. Finally, add up all three
strata scores and divide by 3 to obtain the final total score.
Scores can be useful in two ways:
Scores for each strata can help users better understand which strata are in good condition
vs. which strata are in poor/fair condition. These results may help users understand
which strata need the most “help” to improve condition in the future, thereby potentially
focusing future management.
Overall scores can help users understand how their stand is performing overall and can be
rolled up and used at a large stand or regional scale to better quantify larger scale wildlife
habitat and biodiversity contributions at these larger scales.
2.4 Enter/upload Results.
Enter/upload results into database. The Ecology Observation Database for open pine is not yet
available, but we hope for a release in late 2016.
3.0 Definitions of key fields on data sheets This section provides guidance on how to populate the field form. The first four sections address
basic site-level data. Thereafter, protocols for each metric are described. They are organized by
Rank Factor categories. The majority of protocols used for the WA wetland/riparian Level 2 EIAs
are the same as outlined by Faber-Langendoen et al. (2012. We occasionally use regional
language for some of the metric ratings.
Site / Assessment Area Information Date: the date of the survey
Project: name of field data collection project
Site ID: unique ID of site
Field Crew Team Members
Leader: leader of the field team, with first and last name
Assistants: field team assistants, with first and last names

Field Manual for Open Pine Rapid Assessment Metrics (2016)
9
Photographer: name of the photographer
Photos of Site: descriptions of each photo (in order, separated by commas). A brief description
of each photo’s content should be documented in a previous image taken of the top of that field
form, or (1) a field notebook or (2) file name; or (3) in the photo’s metadata.
Photo filenames: filenames of photos, these ideally should have the photographer’s initials and
a number (e.g., fjr_001), or siteID and a number (e.g., Black_Creek_stand12_1).
Assessment Area Shape: shape of assessment area, such as circle, rectangle or polygon
Bearing: compass bearing of length of rectangle or polygon assessment area
Assessment Area Dimensions: radius of circle, or width and length of rectangle or polygon
State: State in which the assessment area occurs.
County: County in which the assessment area occurs.
Twp: Township, only for areas where TRS (Township, Range, Section) land designations are used
Range: Range, only for areas where TRS (Township, Range, Section) land designations are used
Section: Section, only for areas where TRS (Township, Range, Section) land designations are used
USGS 7.5’ Quad: 7.5 Minute Quadrangle map name from US Geological Survey
Landowner/Managed Area Name:
Contact Person: name of contact person associated with the site
Stand Name: name of stand where assessment area is, could be a stand code or name.
Permit Required? Yes/No, if a permit is required the field team should always carry it in the field.
Locked Gate? Yes/No, the field team should leave locked gates as they are instructed to by
contact person. If there is a series of locks, be careful to relock as found when team is done
working beyond gate.
Access Difficulties? (describe): Any particular access difficulties should be clearly noted, on an
extra sheet if needed. These notes will enable future visits to be efficient.
Site Description: General description of the site, provide a written description of the site’s
characteristics with details appropriate for project needs. Focus on the setting in which the site
occurs, ecological and vegetation patterns both within and adjacent to the site, notable stressors
or human activity, signs of wildlife, etc. A drawing may also be helpful.
General Drawing (Optional): A clear drawing is optional but can be useful.
Location Assessment Area CENTRUM (check one) Original Moved (why? how far?)
GPS Unit: GPS make, model and number (if numbered)
GPS Filename: filename of saved new GPS point at assessment area
Projection: projection of GPS data
UTM Zone: UTM zone, which is the same for most project areas.
UTM X Easting: Easting of field recorded new GPS point
UTM Y Northing: Northing of field recorded new GPS point

Field Manual for Open Pine Rapid Assessment Metrics (2016)
10
Datum: Circle either NAD83 or WGS84, or write in other datum
LAT (decimal degree): Latitude of field recorded new GPS point
LONG (decimal degree): Longitude of field recorded new GPS point
GPS Accuracy: reported accuracy, such as from a Garmin GPS (e.g. 5 feet)
PDOP: PDOP is reported for Trimble GPS units
# of Sats: number of satellites used by GPS for recorded point
Original (e.g. GRTS): original random, stratified random, or GRTS random point location which
was navigated to with GPS
Post-processed: values if GPS point taken in the field was post-processed to improve accuracy
Classification Southern Open Pine Grouping: use the key provided to determine Southern Open Pine Grouping
Other Community Classification Reference: optional other classification reference used, such as
Eyre 1980 (SAF), Florida Natural Areas Inventory 2010, Edwards, Ambrose & Kirkman 2013, etc.
Name: optional name of other open pine community name following classification reference
USNVC Association (Optional): the US National Vegetation Classification Plant Association name
is optional, and can be added if known.
Classification Comments: any comments on classification of assessment area
Notes: any notes, specify which field or topic they pertain to
11
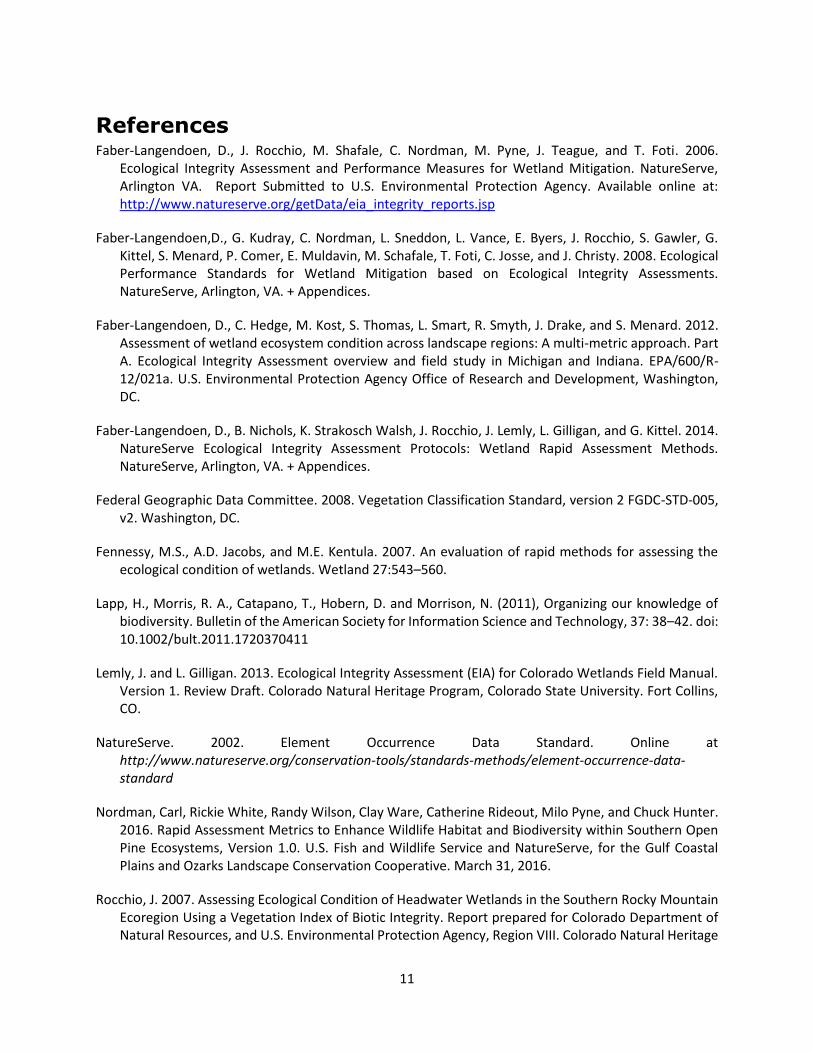
References Faber-Langendoen, D., J. Rocchio, M. Shafale, C. Nordman, M. Pyne, J. Teague, and T. Foti. 2006.
Ecological Integrity Assessment and Performance Measures for Wetland Mitigation. NatureServe, Arlington VA. Report Submitted to U.S. Environmental Protection Agency. Available online at: http://www.natureserve.org/getData/eia_integrity_reports.jsp
Faber-Langendoen,D., G. Kudray, C. Nordman, L. Sneddon, L. Vance, E. Byers, J. Rocchio, S. Gawler, G. Kittel, S. Menard, P. Comer, E. Muldavin, M. Schafale, T. Foti, C. Josse, and J. Christy. 2008. Ecological Performance Standards for Wetland Mitigation based on Ecological Integrity Assessments. NatureServe, Arlington, VA. + Appendices.
Faber-Langendoen, D., C. Hedge, M. Kost, S. Thomas, L. Smart, R. Smyth, J. Drake, and S. Menard. 2012. Assessment of wetland ecosystem condition across landscape regions: A multi-metric approach. Part A. Ecological Integrity Assessment overview and field study in Michigan and Indiana. EPA/600/R-12/021a. U.S. Environmental Protection Agency Office of Research and Development, Washington, DC.
Faber-Langendoen, D., B. Nichols, K. Strakosch Walsh, J. Rocchio, J. Lemly, L. Gilligan, and G. Kittel. 2014. NatureServe Ecological Integrity Assessment Protocols: Wetland Rapid Assessment Methods. NatureServe, Arlington, VA. + Appendices.
Federal Geographic Data Committee. 2008. Vegetation Classification Standard, version 2 FGDC-STD-005, v2. Washington, DC.
Fennessy, M.S., A.D. Jacobs, and M.E. Kentula. 2007. An evaluation of rapid methods for assessing the ecological condition of wetlands. Wetland 27:543–560.
Lapp, H., Morris, R. A., Catapano, T., Hobern, D. and Morrison, N. (2011), Organizing our knowledge of biodiversity. Bulletin of the American Society for Information Science and Technology, 37: 38–42. doi: 10.1002/bult.2011.1720370411
Lemly, J. and L. Gilligan. 2013. Ecological Integrity Assessment (EIA) for Colorado Wetlands Field Manual. Version 1. Review Draft. Colorado Natural Heritage Program, Colorado State University. Fort Collins, CO.
NatureServe. 2002. Element Occurrence Data Standard. Online at http://www.natureserve.org/conservation-tools/standards-methods/element-occurrence-data-standard
Nordman, Carl, Rickie White, Randy Wilson, Clay Ware, Catherine Rideout, Milo Pyne, and Chuck Hunter. 2016. Rapid Assessment Metrics to Enhance Wildlife Habitat and Biodiversity within Southern Open Pine Ecosystems, Version 1.0. U.S. Fish and Wildlife Service and NatureServe, for the Gulf Coastal Plains and Ozarks Landscape Conservation Cooperative. March 31, 2016.
Rocchio, J. 2007. Assessing Ecological Condition of Headwater Wetlands in the Southern Rocky Mountain Ecoregion Using a Vegetation Index of Biotic Integrity. Report prepared for Colorado Department of Natural Resources, and U.S. Environmental Protection Agency, Region VIII. Colorado Natural Heritage
12
Program, Colorado State University, Fort Collins, CO. Online: http://www.cnhp.colostate.edu/download/documents/2007/AssessingEcologicalConditionOfHeadwaterWetlandsInTheSouthernRockyMountainsUsingAVegIBI_Final_V1.pdf
Rocchio, F.J. and R.C. Crawford. 2008. Draft Field Guide to Washington’s Ecological Systems. Draft report prepared by the Washington Natural Heritage Program, Washington Department of Natural Resources. Olympia, WA. Online: http://www1.dnr.wa.gov/nhp/refdesk/pubs/wa_ecological_systems.pdf
Rocchio, F.J. and R.C. Crawford. 2011. Applying NatureServe’s Ecological Integrity Assessment Methodology to Washington’s Ecological Systems. Washington Natural Heritage Program, Washington Department of Natural Resources. Olympia, WA. Online: http://www1.dnr.wa.gov/nhp/refdesk/communities/pdf/eia/applying_eia.pdf
Rocchio, F.J. and R.C. Crawford. In Progress. Ecological Classification of Native Wetland & Riparian Vegetation of Western Washington. Report prepared for U.S. Environmental Protection Agency, Region 10, Seattle, WA. Natural Heritage Washington Natural Heritage Program, Washington Department of Natural Resources, Olympia, WA.
Stevens, D.L. and S.F. Jensen. 2007. Sample design, execution, and analysis for wetland assessment. Wetlands 27: 515–523.
Vance, Linda, Karen Newlon, Joanna Lemly, and George Jones. 2012. Assessing the Natural Range of Variability in Minimally Disturbed Wetlands Across the Rocky Mountains: the Rocky Mountain ReMAP Project. Report to the U.S. Environmental Protection Agency. Montana Natural Heritage Program, Helena, Montana. 40 pp. plus appendices. Online: http://www.cnhp.colostate.edu/download/documents/2012/RockyMountainREMAP_2012.pdf

13
Appendix A. Key to Southern Open Pine Habitat Groupings
This key should help determine which southern open pine habitat grouping desired forest condition
metrics are most appropriate for particular lands. A map of states and USDA Forest Service sections
(Cleland et al. 2007), is provided (see Figure A-1, below). Some of the southern open pine habitat
groupings occur within the range of longleaf pine (Pinus palustris) as defined by Little (1971). This
general range is not precise in all places, so it is possible that a stand of a longleaf pine grouping could
be found outside this range. In the vast majority of cases, a user should be able to place a stand in a
southern open pine grouping, then chose the appropriate set of metric values for that grouping.
The key is specifically designed for use within the boundaries of the Gulf Coast Plains and Ozarks
Landscape Conservation Cooperative (GCPOLCC), which includes the Missouri and Arkansas highlands of
the Ozark, Boston and Ouachita mountain ranges, and the Gulf Coastal Plains, which extend from
eastern Texas to the Florida panhandle. It also applies to stands dominated by Longleaf Pine (Pinus
palustris) throughout the range of this species, but makes no attempt to accommodate other related
vegetation east and north of the GCPOLCC footprint.
The key will lead a user through a series of choices (“couplets”) related to the geographic location of the
area under consideration, as well as choices about stand composition and environment. At its higher
levels, the key is constructed around these Forest Service regions. Further into the key, the choices
related to stand composition and environment come into play. A user should read both statements and
see which one best applies to the area and stands under question. If an obviously incorrect answer is
obtained, it may be necessary to repeat the exercise.
Common terms rather than highly technical ones are used (wet, dry, sandy, upland, seasonally, etc.).
One term that may be unfamiliar to some users is “mesic”. This is a kind of shorthand for an
environment that is neither very dry nor very wet (i.e. “in the middle” of a broad ecological moisture
continuum). It is most frequently applied to species-rich hardwood stands (“coves”), but in this context
it would refer to stands that are not “wet”, i.e. without standing water), but have enough available soil
moisture to support diverse and possibly dense herbaceous layers. Similarly “dry-mesic” refers to stands
that are on the dry side of mesic, but not notably dry. These terms may roughly correlate with soil
texture, in that under similar hydrological conditions, coarser-textured soils are more likely to be drier
that those with finer particle size.
Following the key, a table of distributions of the open pine groupings by state and region (Table A-1), a
map of the relevant USDA Forest Service Sections (Figure A-1), and a table of USDA Forest Service
Provinces and Sections referred to in the key (Table A-2) are provided to assist in its use.

14
Key to Open Pine Groupings
1a. Forests and woodlands in the coastal plains (Outer Coastal Plains Mixed Forest Province 232;
Southeastern Mixed Forest Province 231, southern parts of Sections 231B, 231E and 231H within the
range of Longleaf Pine [Pinus palustris] as defined by Little [1971]), typically dominated by Longleaf
Pine (Pinus palustris) and/or Slash Pine (Pinus elliottii), habitat ranging from very dry sandy uplands,
mesic finer-textured soils, and seasonally wet or saturated flatwoods and savannas .......................... 2
1b. Forests and woodlands landward of the coastal plains (Southeastern Mixed Forest Province 231,
Sections 231A, 231C, 231D, 231G, 231I; also Central Interior Broadleaf Forest Province 223, Section
223A; Ozark Broadleaf Forest Province M223, and Ouachita Mixed Forest-Meadow Province M231);
or in the inner portions of the coastal plains landward of the range of Longleaf Pine (Southeastern
Mixed Forest Province 231, most of Sections 231B, 231E, lowland parts of Section 231G, 231H)
dominated by Shortleaf Pine (Pinus echinata) and/or Loblolly Pine (Pinus taeda), OR dominated by
Longleaf Pine (Pinus palustris) and found landward of the coastal plains as mentioned above ........... 3
2a. Longleaf Pine / Slash Pine Woodlands (wet and mesic flatwoods and savannas); the wet examples
found on poorly drained, somewhat poorly drained, and seasonally saturated mineral soils with
seasonally high water tables; the mesic examples found on flat sites with a spodosol soil which has a
hardpan (spodic horizon) impeding drainage which can cause sites to be wet in the winter and dry in
the summer ............................................................................................................................................ 4
2b. Stands of longleaf pine (Pinus palustris) on sandy to loamy soils on upland sites ranging from gently
rolling lands, broad ridgetops to steeper side slopes, and in mesic swales and terraces.. ................... 5
3a. Stands with Longleaf Pine (Pinus palustris) in combination with Shortleaf Pine (Pinus echinata) and
dry Oak (Quercus) species, found landward of the coastal plains (Southeastern Mixed Forest Province
231, Sections 231A, 231C, 231D, 231I) ................................................................... “Mountain Longleaf”
...................................... Dry & Mesic Highlands Pine Woodlands, in part; [part of US NVC GROUP G012]
3b. Forests and woodlands dominated by Shortleaf Pine (Pinus echinata) and/or Loblolly Pine (Pinus
taeda) found landward of the coastal plains (Southeastern Mixed Forest Province 231, Sections 231E,
231G); and in the inner portions of the coastal plains landward of the range of Longleaf Pine
(Southeastern Mixed Forest Province 231, most of Sections 231B, 231E and 231H); also west of the
Mississippi River in the Central Interior Broadleaf Forest Province 223, Section 223A; Ozark Broadleaf
Forest Province M223, and Ouachita Mixed Forest-Meadow Province M231, as well as the Crowley’s
Ridge Subsection 234Db) ......................................................................................................................... 6

15
4a. Mesic Longleaf Pine flatwood woodlands found on flat sites with spodic horizons (Spodosols) or
some factor impeding drainage which can cause sites to be wet in the winter and dry in the summer ..
........................................................................... Mesic Longleaf Pine Flatwoods [US NVC GROUP G596]
4b. Wet Longleaf Pine / Slash Pine flatwoods and savannas found on poorly drained, somewhat poorly
drained, and seasonally saturated mineral soils with seasonally high water tables .................................
............................................ Wet Longleaf & Slash Pine Flatwoods & Savannas [US NVC GROUP G190]
5a. Stands of longleaf pine (Pinus palustris) on deep sandy soils, in the fall-line sandhills (Subsection
232Bq) as well as on other sandy sites in the outer coastal plains, typically with scrub oaks (Turkey
Oak, Bluejack Oak, Sand Post Oak) in the subcanopy ..............................................................................
...............................................................................Xeric Longleaf Pine Barrens [US NVC GROUP G154]
5b. Other stands of longleaf pine (Pinus palustris) on sandy to loamy soils on upland sites ranging from
gently rolling lands, broad ridgetops to steeper side slopes, and in mesic swales and terraces.
Subcanopy oaks include White Oak, Southern Red Oak, Black Oak, Blackjack Oak ................................
............................................................. Dry & Mesic Longleaf Pine Woodlands [US NVC GROUP G009]
6a. Dry and dry-mesic forests and woodlands dominated by Shortleaf Pine (Pinus echinata) found west
of the Mississippi River in the Central Interior Broadleaf Forest Province 223, Section 223A; Ozark
Broadleaf Forest Province M223; Ouachita Mixed Forest-Meadow Province M231; Southeastern
Mixed Forest Province 231, Section 231G ........................................... “Shortleaf-Loblolly Woodlands”
................................ Dry & Mesic Highlands Pine Woodlands, in part; [part of US NVC GROUP G012]
6b. Forests and woodlands, including flatwoods, dominated by Shortleaf Pine (Pinus echinata) and/or
Loblolly Pine (Pinus taeda) found in the inner portions of the coastal plains landward of the range of
Longleaf Pine (Southeastern Mixed Forest Province 231, most of Sections 231B, 231E, 231H), as well
as in portions of the Mississippi River Alluvial Basin Section 234A. [this Grouping would also apply to
the lower/outer parts of the Piedmont (Sections 231A, 231I but this area is not within the GCPOLCC
footprint] ................................................................................................................................................ 7
7a. Dry and dry-mesic forests and woodlands dominated by Shortleaf Pine (Pinus echinata) and/or
Loblolly Pine (Pinus taeda) found in the inner portions of the coastal plains landward of the range of
Longleaf Pine (Southeastern Mixed Forest Province 231, most of Sections 231B, 231E, 231H), as well
as the Crowley’s Ridge Subsection 234Db (Lower Mississippi Riverine Forest Province 234) [this

16
Grouping would also apply to the lower/outer parts of the Piedmont (Sections 231A, 231I) but this
area is not within the GCPOLCC footprint] ...............................................................................................
......................................... Dry and Mesic Hilly Pine Woodlands [US NVC GROUP G013, part of G012]
7b. Flatwoods (nonriverine wetland or seasonally wet pine-hardwood forests) in the coastal plains
(Outer Coastal Plains Mixed Forest Province 232; Southeastern Mixed Forest Province 231, most of
Sections 231B, 231E, 231H) and the Lower Mississippi Riverine Forest Province 234 ............................
......................................................................... Upper Coastal Plain Flatwoods [US NVC GROUP G130]
References
Cleland, D. T., J. A. Freeouf, J. E. Keys Jr., G. J. Nowacki, C. Carpenter, and W. H. McNab. 2007. Ecological
Subregions: Sections and Subsections of the Conterminous United States [1:3,500,000] [CD-ROM].
Sloan, A.M., cartog. Gen. Tech. Report WO-76. Washington, DC: U.S. Department of Agriculture,
Forest Service.
Little E. L. Jr. 1971. Atlas of United States trees, volume 1, conifers and important hardwoods: U.S.
Department of Agriculture Miscellaneous Publication 1146, 9 p., 200 maps, available at
http://esp.cr.usgs.gov/data/little/. Accessed 22 Jan 2016.

17
States Region Dominant
Pines
Site Southern Open Pine
Grouping AR, MO, OK Ozark and
Ouachita
Highlands
Shortleaf Pine Dry & Mesic
Uplands
Dry & Mesic Highlands Pine
Woodlands
AR, LA, TX Coastal Plain Shortleaf Pine,
Loblolly Pine
Dry & Mesic
Uplands
Dry & Mesic Hilly Pine
Woodlands
AR, LA, TX Coastal Plain Shortleaf Pine,
Loblolly Pine
Wet-Mesic to Wet
Flats
Upper Coastal Plain Pine
Flatwoods
LA, TX Coastal Plain Longleaf Pine Xeric Uplands on
deep sandy soils
Xeric Longleaf Pine Barrens
LA, TX Coastal Plain Longleaf Pine Dry & Mesic
Uplands
Dry & Mesic Longleaf Pine
Woodlands
LA, TX Coastal Plain Longleaf Pine Wet Flats Wet Longleaf & Slash Pine
Flatwoods & Savannas
AL, GA, NC,
SC
Appalachians and
Piedmont
Longleaf Pine Dry Uplands, on
ridges and upper
slopes
Dry & Mesic Highlands Pine
Woodlands
AL, GA, NC,
SC
Piedmont Shortleaf Pine,
Loblolly Pine
Dry & Mesic
Uplands
Dry & Mesic Hilly Pine
Woodlands
AL, GA, FL,
MS, NC, SC
Coastal Plain Shortleaf Pine,
Loblolly Pine
Dry & Mesic
Uplands
Dry & Mesic Hilly Pine
Woodlands
AL, GA, MS,
NC, SC
Coastal Plain Longleaf Pine Xeric Uplands on
deep sandy soils
Xeric Longleaf Pine Barrens
AL, GA, MS,
NC, SC
Coastal Plain Longleaf Pine Dry & Mesic
Uplands
Dry & Mesic Longleaf Pine
Woodlands
AL, GA, MS,
NC, SC
Coastal Plain Longleaf Pine,
Slash Pine
Mesic to Wet Flats,
Spodosols
Mesic Longleaf Pine
Flatwoods
AL, GA, MS,
NC, SC
Coastal Plain Longleaf Pine,
Slash Pine
Wet Flats Wet Longleaf & Slash Pine
Flatwoods & Savannas
FL Coastal Plain Longleaf Pine Dry & Mesic
Uplands
Dry & Mesic Longleaf Pine
Woodlands
FL Coastal Plain Longleaf Pine Xeric Uplands on
deep sandy soils
Xeric Longleaf Pine Barrens
FL Coastal Plain Longleaf Pine,
Slash Pine, South
Florida Slash Pine
Mesic to Wet Flats,
Spodosols
Mesic Longleaf Pine
Flatwoods
FL Coastal Plain Longleaf Pine,
Slash Pine, South
Florida Slash Pine
Wet Flats Wet Longleaf & Slash Pine
Flatwoods & Savannas
Table A-1. States, Regions, and Southern Open Pine Groupings

18
Figure A-1. USDA Forest Service Provinces and Sections (from Cleland et al. 2007)
PROVINCE
/SECTION
PROVINCE/SECTION_NAME
223 Central Interior Broadleaf Forest
223A Ozark Highlands
M223 Ozark Broadleaf Forest
M223A Boston Mountains
231 Southeastern Mixed Forest
231A Southern Appalachian Piedmont
231B Coastal Plains-Middle

19
231C Southern Cumberland Plateau
231D Southern Ridge and Valley
231E Mid Coastal Plains-Western
231G Arkansas Valley
231H Coastal Plains-Loess
231I Central Appalachian Piedmont
M231 Ouachita Mixed Forest-Meadow
M231A Ouachita Mountains
232 Outer Coastal Plain Mixed Forest
232B Gulf Coastal Plains and Flatwoods
232C Atlantic Coastal Flatwoods
232D Florida Coastal Lowlands-Gulf
232F Coastal Plains and Flatwoods-Western Gulf
232G Florida Coastal Lowlands-Atlantic
232H Middle Atlantic Coastal Plains and Flatwoods
232I Northern Atlantic Coastal Flatwoods
232J Southern Atlantic Coastal Plains and
Flatwoods
232K Florida Coastal Plains Central Highlands
232L Gulf Coastal Lowlands
234 Lower Mississippi Riverine Forest
234A Southern Mississippi Alluvial Plain
234C Atchafalaya and Red River Alluvial Plains
234D White and Black River Alluvial Plains
234E Arkansas Alluvial Plains

20
Table A-2. USDA Forest Service Provinces and Sections referred to in the Key
Notes on Some Ambiguous or Confusing Habitats
There are some possible situations related to open pine habitats in the southeastern United States
which are ambiguous or may present uncertainties in terms of which habitat is best managed for in a
particular locale.
1. Sites found landward of the coastal plains (Southeastern Mixed Forest Province 231,
Sections 231A, 231C, 231D) with Longleaf Pine as a dominant or codominant should be
treated as examples of “Mountain Longleaf”. These could be proximal to, or interfingered
with, stands dominated by Shortleaf Pine without Longleaf Pine. The issue here is that
“Mountain Longleaf” would be evaluated with the metrics for the Dry & Mesic
Highlands Pine Woodlands Grouping, and the adjacent Shortleaf Pine stands would be
evaluated with the metrics for the Dry & Mesic Hilly Pine Woodlands Grouping. In this
area, both of these Groupings are related to US NVC GROUP G012. A distinction may
need to be made between stands dominated by Shortleaf Pine without Longleaf Pine
which are landward of the coastal plain and do not have loblolly pine or are outside the
range of loblolly pine, then their grouping would be Dry & Mesic Highlands Pine
Woodlands, otherwise. Stands that are within the range of Loblolly Pine would be part of
the Dry & Mesic Hilly Pine Woodlands Grouping.
2. In a portion of the inner coastal plain (Section 231B), there are quite rugged landforms
found north of the black belt region and southwest of the southern end of the Ridge and
Valley (this is within the ranges of both Longleaf Pine and Chestnut Oak [Quercus
prinus]). Using our key to Open Pine Groupings, this would be part of the Dry & Mesic
Longleaf Pine Woodlands, but has some characteristics of the “Mountain Longleaf”
discussed above. This area includes the Oakmulgee District of the Talladega National
Forest in Bibb, Hale, Perry, and Tuscaloosa counties of Alabama. It is not clear which
metrics are better applied in this area.
3. The third exception or anomaly would be stands dominated by Shortleaf Pine found
within the range of Longleaf Pine in the inner or outer coastal plains (Provinces 231 and
232). This type of stand would have been far less common in the outer coastal plain, and
more likely in the inner coastal plain. More information is needed about this vegetation
and its characteristics and environment. One example is Shortleaf Pine vegetation of the
Red Hills of Florida and Georgia. In this case, the metrics for Dry & Mesic Hilly Pine
Woodlands [US NVC GROUP G012] would apply.

21
Appendix B. Rapid Assessment Field Cover Sheet

22
Field Form for Rapid Assessment Metrics for Wildlife and Biodiversity in Southern Open Pine Ecosystems
Date: Project: Site ID:
Field Crew Team Members:
Leader: ______________________________ Assistants:______________________________________________________________
Photographer: _______________________ Photos of Site: __ AA Centrum out: _N _E_ S _W ; __Buffer in: _N _E _S _W; Add’l: Y / N
Photo filenames: ______________________________________________________________________________________________
Assessment Area Shape: Circle, Rectangle, Square, Polygon Bearing: __________
Assessment Area Dimensions: radius 18m, 40m, ______ m/ft. or rectangle ______ m/ft wide x ______m/ft long (fill in values, units)
State:_____County:____________________ Twp:____Range:____Section:____USGS 7.5’ Quad:______________________________
Landowner/Managed Area Name:______________________________ Contact Person: ___________________________________
Stand Name: _____________ Permit Required? ___ Locked Gate? ___ Access Difficulties? (describe)___________________________
SITE DESCRIPTION:
GENERAL DRAWING (Optional): Provide a drawing of the assessment area, including its boundaries, either aerial view or transect view.
Classification (use to select appropriate Southern Open Pine Metrics Datasheet for page 2 of field form) Southern Open Pine Grouping: ___________________________________________________________________________________
Other Community Classification Reference: ______________________ Name: ____________________________________________
USNVC Association (Optional):____________________________________________________________________________________
Classification Comments:
Notes:
LOCATION: Assessment Area CENTRUM (check one) ___ ORIGINAL ___ MOVED (why? how far?)
GPS Unit: GPS Filename: Projection:
UTM Zone: Datum: NAD83 WGS84 GPS Accuracy: ___ m/ ft
PDOP: # of Sat’s:
UTM X Easting: __ __ __ __ __ __
LAT: decimal degree
Original (GRTS): Field: Post-processed:
UTM Y Northing: __ __ __ __ __ __ __
LONG: decimal degree

23
Appendix C. Rapid Assessment Metrics Data/Scoring Sheets (By Habitat Grouping)

24
Dry & Mesic Highlands Pine Woodlands (Mountain Longleaf) Metrics Data Sheet Recorded Measured Value of Metric
Recorded Metric Score (1.0-4.0)
Canopy Metrics
If the optional Stand Density Index metric is used, then Canopy Southern Pine Basal Area and Southern Yellow Pine Canopy Cover do not need to be used as metrics
Excellent = 4.0 Good = 3.0 Fair = 2.0 Poor = 1.0
Canopy Southern Yellow Pine Basal Area
>35 to 75 ft2/acre basal area of longleaf & shortleaf pine
30 to 35 or >75 to 90 ft2/acre basal area of longleaf & shortleaf pine
10 to <30 or >90 to 110 ft2/acre basal area of longleaf & shortleaf pine
<10 or >110 ft2/acre basal area of longleaf & shortleaf pine
ft2/acre BA x0.25
Southern Yellow Pine Canopy Cover
>25 to 70% canopy cover of longleaf & shortleaf pine
20-25% or >70 to 80% canopy cover of longleaf & shortleaf
10 to <20% or >80 to 90% canopy cover of longleaf & shortleaf
<10% or >90% canopy cover of longleaf & shortleaf pine
% cover x0.25
Southern Yellow Pine Stand Age Structure
BA ≥20 ft2/acre of flat-top longleaf pine of any diameter and/or longleaf or shortleaf pine trees ≥14” DBH class
BA ≥10 ft2/acre of longleaf or shortleaf pine trees ≥14” DBH class
Longleaf or shortleaf pine trees ≥14” DBH class are present, but at<10 ft2/acre BA
No longleaf or shortleaf pine trees ≥14” DBH or flat-top longleaf pine are present
ft2/acre BA x0.25
Canopy Hardwood Basal Area
<20 ft2/acre BA of hardwood trees
>20 to 40 ft2/acre BA of hardwood trees
>40 to 50 ft2/acre BA of hardwood trees
>50 ft2/acre BA of hardwood trees
ft2/acre BA x0.25
Stand Density Index (applies to longleaf pine)
SDI = 55 – 120 (14 - 30% of Maximum SDI of 400)
SDI = 40 – 55 or 120 -160 (10-14% or 30-40% of Maximum SDI of 400)
SDI = 15 – 40 or 160 - 200 (4-10% or 40-50% of maximum SDI)
SDI <15 or >200 (<4% or >50%, 240 is 60% of Maximum SD of 400)
SDI value x0.5
Midstory/Shrub Metrics Canopy Score= Excellent = 4.0 Good = 3.0 Fair = 2.0 Poor = 1.0
Midstory Fire Tolerant Hardwood Cover
<10% cover of midstory fire tolerant hardwoods
10-30% cover of midstory fire tolerant hardwoods
>30 to 40% cover of midstory fire tolerant hardwoods
>40% cover of midstory fire tolerant hardwoods
% cover x0.25
Midstory Overall Cover
<20% cover of woody midstory
>20 to 25% cover of woody midstory
>25 to 35% cover of woody midstory
>35% cover of woody midstory
% cover x0.25
Short Shrub (<3 ft tall) Cover
Short shrubs average <20% cover
Short shrubs average 20- 25% cover
Short shrubs average >25 to 40% cover
Short shrubs average >40% cover
% cover x0.25
Tall Shrub (3-10 ft) Cover
Tall shrubs average < 15% cover.
Tall shrubs average 15 - 20% cover.
Tall shrubs average >20 to 30% cover.
Tall shrubs average >30% cover.
% cover x0.25
Ground Layer Metrics Midstory Score= Excellent = 4.0 Good = 3.0 Fair = 2.0 Poor = 1.0
Overall Native Herbaceous Ground Cover
>45 to 80% herbaceous cover
30-45% or >80% herbaceous cover
15 to <30% herbaceous cover
<15% herbaceous cover % cover x0.25
Longleaf Pine Regeneration
Longleaf pine regeneration cover is >1% of stand (Good and Excellent)
Longleaf pine regeneration cover is >1% of stand (Good and Excellent)
Longleaf pine regen cover is present but is <1% of stand, or no regen seen, but cone producing longleaf pine are present
Longleaf pine regen cover is apparently absent, and no cone producing longleaf pine are present in the stand
% of stand Regen? Cones?
x0.25
Native Warm Season Grass Cover
>25 to 85% foliar cover of all native warm season grasses
20-25% or >85% foliar cover of all native warm season grasses
10 to <20% foliar cover of all native warm season grasses
<10% foliar cover of all native warm season grasses
% foliar cover
x0.25
Invasive Plant Presence / Distribution
Invasive nonnative plant species absent or cover is very low (<1% cover)
Invasive nonnative plant species in any stratum present but sporadic (1-5% cover)
Invasive nonnative plant species in any stratum uncommon (5-10% cover)
Invasive nonnative plant species in any stratum common (>10% cover)
% cover x0.25
Final Score is : Canopy Score _______x0.33 + Midstory Score________x0.33 + Ground Layer Score________x0.33 = Evaluation Scale: 4.0 to 3.5 = Excellent, 3.5 to 2.5 = Good, 2.5 to 1.5 = Fair, 1.5 to 1.0 = Poor
Ground Layer Score =

25
Dry & Mesic Highlands Pine Woodlands Metrics Data Sheet Recorded Measured Value of Metric
Recorded Metric Score (1.0-4.0)
Canopy Metrics
If the optional Stand Density Index metric is used, then Canopy Southern Pine Basal Area and Southern Yellow Pine Canopy Cover do not need to be used as metrics
Excellent = 4.0 Good = 3.0 Fair = 2.0 Poor = 1.0
Canopy Southern Yellow Pine Basal Area
>35 to 75 ft2/acre basal area of shortleaf pine
30 to 35 or >75 to 90 ft2/acre basal area of shortleaf pine
10 to <30 or >90 to 110 ft2/acre basal area of shortleaf pine
<10 or >110 ft2/acre basal area of shortleaf pine
ft2/acre BA x0.25
Southern Yellow Pine Canopy Cover
>25 to 70% canopy cover of shortleaf pine
20-25% or >70 to 80% canopy cover of shortleaf pine
10 to <20% or >80 to 90% canopy cover of shortleaf pine
<10% or >90% canopy cover of shortleaf pine
% cover x0.25
Southern Yellow Pine Stand Age Structure
Basal area ≥20 ft2/acre of shortleaf pine trees ≥14” DBH class
Basal area ≥10 ft2/acre of shortleaf pine trees ≥14” DBH class
Shortleaf pine trees ≥14” DBH class are present, but <10 ft2/acre basal area of those large trees
No shortleaf pine trees ≥14” DBH are present
ft2/acre BA x0.25
Canopy Hardwood Basal Area
<20 ft2/acre BA of hardwood trees
>20 to 40 ft2/acre BA of hardwood trees
>40 to 50 ft2/acre BA of hardwood trees
>50 ft2/acre BA of hardwood trees
ft2/acre BA x0.25
Stand Density Index (applies to shortleaf pine)
SDI = 65 – 135 (14 - 30% of Maximum SDI of 450)
SDI = 45 – 65 or 135 -180 (10-14% or 30-40% of Maximum SDI of 450)
SDI = 20 – 45 or 180 - 225 (4-10% or 40-50% of maximum SDI of 450)
SDI <20 or >225 (<4% or >50%, 270 is 60% of Maximum SD of 450)
SDI value x0.5
Midstory/Shrub Metrics Canopy Score= Excellent = 4.0 Good = 3.0 Fair = 2.0 Poor = 1.0
Midstory Fire Tolerant Hardwood Cover
<10% cover of midstory fire tolerant hardwoods
10-30% cover of midstory fire tolerant hardwoods
>30 to 40% cover of midstory fire tolerant hardwoods
>40% cover of midstory fire tolerant hardwoods
% cover x0.25
Midstory Overall Cover
<20% cover of woody midstory
20-25% cover of woody midstory
>25 to 35% cover of woody midstory
>35% cover of woody midstory
% cover x0.25
Short Shrub (<3 ft tall) Cover
Short shrubs average <20% cover
Short shrubs average 20 - 25% cover
Short shrubs average >25 to 40% cover
Short shrubs average >40% cover
% cover x0.25
Tall Shrub (3-10 ft tall) Cover
Tall shrubs average < 15% cover.
Tall shrubs average 15 - 20% cover.
Tall shrubs average >20 to 30% cover.
Tall shrubs average >30% cover.
% cover x0.25
Ground Layer Metrics Midstory Score= Excellent = 4.0 Good = 3.0 Fair = 2.0 Poor = 1.0
Overall Native Herbaceous Ground Cover
>45 to 80% herbaceous cover
30-45% or >80% herbaceous cover
15 to <30% herbaceous cover
<15% herbaceous cover % cover x0.33
Native Warm Season Grass Cover
>25 to 85% foliar cover of all native warm season grasses
>15 to 25% or >85% foliar cover of native warm season grasses
10-15% foliar cover of all native warm season grasses
<10% foliar cover of all native warm season grasses
% foliar cover
x0.33
Invasive Plant Presence / Distribution
Invasive nonnative plant species absent or cover is very low (<1% cover)
Invasive nonnative plant species in any stratum present but sporadic (1-5 % cover)
Invasive nonnative plant species in any stratum uncommon (5-10% cover)
Invasive nonnative plant species in any stratum common (>10% cover)
% cover x0.33
Final Score is : Canopy Score _______x0.33 + Midstory Score________x0.33 + Ground Layer Score________x0.33 = Evaluation Scale: 4.0 to 3.5 = Excellent, 3.5 to 2.5 = Good, 2.5 to 1.5 = Fair, 1.5 to 1.0 = Poor
Ground Layer Score =

26
Dry & Mesic Hilly Pine Woodlands Metrics Data Sheet Recorded Measured Value of Metric
Recorded Metric Score (1.0-4.0)
Canopy Metrics
If the optional Stand Density Index metric is used, then Canopy Southern Pine Basal Area and Southern Yellow Pine Canopy Cover do not need to be used as metrics
Excellent = 4.0 Good = 3.0 Fair = 2.0 Poor = 1.0
Canopy Southern Yellow Pine Basal Area
30-85 ft2/acre basal area of loblolly or shortleaf pine
20 to <30 or >85 to 100 ft2/acre basal area of loblolly or shortleaf pine
10 to <20 or >100 to 115 ft2/acre basal area of loblolly or shortleaf pine
<10 or >115 ft2/acre basal area of loblolly or shortleaf pine
ft2/acre BA x0.25
Southern Yellow Pine Canopy Cover
>25 to 75% canopy cover of loblolly or shortleaf pine
>15 to 25% canopy cover or >75 to 85% canopy cover of loblolly or shortleaf pine
10-15% canopy cover or >85 to 95% canopy cover of loblolly or shortleaf pine
<10% cover or >95% cover of loblolly or shortleaf pine
% cover x0.25
Southern Yellow Pine Stand Age Structure
BA ≥20 ft2/acre of loblolly and/or shortleaf pine trees ≥14” DBH class
BA ≥10 ft2/acre of loblolly and/or shortleaf pine trees ≥14” DBH class
Loblolly and/or shortleaf pine trees ≥14” DBH class are present, but <10 ft2/acre basal area of those large trees
No loblolly and/or shortleaf pine trees ≥14” DBH are present
ft2/acre BA x0.25
Canopy Hardwood Basal Area
<20 ft2/acre BA of hardwood trees
>20 to 30 ft2/acre BA of hardwood trees
>30 to 50 ft2/acre BA of hardwood trees
>50 ft2/acre BA of hardwood trees
ft2/acre BA x0.25
Stand Density Index (applies to shortleaf pine)
SDI = 55 – 155 (12 - 34% of Maximum SDI of 450)
SDI = 35 – 55 or 155 -205 (8-12% or 34-45% of Maximum SDI of 450)
SDI = 20 – 35 or 205 - 225 (4-8% or 45-50% of maximum SDI of 450)
SDI <20 or >225 (<4% or >50%, 270 is 60% of Maximum SD of 450)
SDI value x0.5
Midstory/Shrub Metrics Canopy Score= Excellent = 4.0 Good = 3.0 Fair = 2.0 Poor = 1.0
Midstory Fire Tolerant Hardwood Cover
<10% cover of midstory fire tolerant hardwoods
10-20% cover of midstory fire tolerant hardwoods
>20 to 35% cover of midstory fire tolerant hardwoods
>35% cover of midstory fire tolerant hardwoods
% cover x0.25
Midstory Overall Cover
<20% cover of woody midstory
>20 to 30% cover of woody midstory
>30 to 50% cover of woody midstory
>50% cover of woody midstory
% cover x0.25
Short Shrub (<3 ft tall) Cover
Short shrubs average <20% cover
Short shrubs average 20 - 30% cover
Short shrubs average >30 to 45% cover
Short shrubs average >45% cover
% cover x0.25
Tall Shrub (3-10 ft tall) Cover
Tall shrubs average <15% cover.
Tall shrubs average 15 to 20% cover.
Tall shrubs average >20 to 30% cover.
Tall shrubs average >30% cover.
% cover x0.25
Ground Layer Metrics Midstory Score= Excellent = 4.0 Good = 3.0 Fair = 2.0 Poor = 1.0
Overall Native Herbaceous Ground Cover
35-80% herbaceous cover
20 to <35% or >80% herbaceous cover
10 to <20% herbaceous cover
<10% herbaceous cover % cover x0.33
Native Warm Season Grass Cover
25-100% foliar cover of all native warm season grasses
>15 to <25% foliar cover of all native warm season grasses
10-15% foliar cover of all native warm season grasses
<10% foliar cover of all native warm season grasses
% foliar cover
x0.33
Invasive Plant Presence / Distribution
Invasive nonnative plant species absent or cover is very low (<1% cover)
Invasive nonnative plant species in any stratum present but sporadic (1-5 % cover)
Invasive nonnative plant species in any stratum uncommon (5-10% cover)
Invasive nonnative plant species in any stratum common (>10% cover)
% cover x0.33
Final Score is : Canopy Score _______x0.33 + Midstory Score________x0.33 + Ground Layer Score________x0.33 = Evaluation Scale: 4.0 to 3.5 = Excellent, 3.5 to 2.5 = Good, 2.5 to 1.5 = Fair, 1.5 to 1.0 = Poor
Ground Layer Score =

27
Dry & Mesic Longleaf Pine Woodlands Metrics Data Sheet Recorded Measured Value of Metric
Recorded Metric Score (1.0-4.0)
Canopy Metrics
If the optional Stand Density Index metric is used, then Canopy Southern Pine Basal Area and Southern Yellow Pine Canopy Cover do not need to be used as metrics
Excellent = 4.0 Good = 3.0 Fair = 2.0 Poor = 1.0
Canopy Southern Yellow Pine Basal Area
30-80 ft2/acre basal area of longleaf pine
20 to <30 or >80 to 90 ft2/acre basal area of longleaf pine
10 to <20 or >90 to 105 ft2/acre basal area of longleaf pine
<10 or >105 ft2/acre basal area of longleaf pine
ft2/acre BA x0.25
Southern Yellow Pine Canopy Cover
30-65% canopy cover of longleaf pine
>20 to <30% or >65 to 75% canopy cover of longleaf
10-20% canopy cover or >75 to 85% canopy cover of longleaf pine
<10% cover or >85% cover of longleaf pine
% cover x0.25
Southern Yellow Pine Stand Age Structure
BA ≥20 ft2/acre of flat-top longleaf pine of any diameter and/or longleaf pine trees ≥14” DBH class
BA ≥10 ft2/acre of longleaf pine trees ≥14” DBH class
Longleaf pine trees ≥ 14” DBH class are present, but at <10 ft2/acre BA
No longleaf pine trees ≥14” DBH or flat-top longleaf pine are present
ft2/acre BA x0.25
Canopy Hardwood Basal Area
<20 ft2/acre BA of hardwood trees
>20 to 25 ft2/acre BA of hardwood trees
>25 to 35 ft2/acre BA of hardwood trees
>35 ft2/acre BA of hardwood trees
ft2/acre BA x0.25
Stand Density Index (applies to longleaf pine)
SDI = 60 – 125 (15 - 31% of Maximum SDI of 400)
SDI = 40 – 60 or 125 -160 (10-15% or 31-40% of Maximum SDI of 400)
SDI = 20 – 40 or 160 - 200 (5-10% or 40-50% of maximum SDI)
SDI <20 or >200 (<5% or >50%, 240 is 60% of Maximum SD of 400)
SDI value x0.5
Midstory/Shrub Metrics Canopy Score= Excellent = 4.0 Good = 3.0 Fair = 2.0 Poor = 1.0
Midstory Fire Tolerant Hardwood Cover
<15% cover of midstory fire tolerant hardwoods
15 to <20% cover of midstory fire tolerant hardwoods
20-25% cover of midstory fire tolerant hardwoods
>25% cover of midstory fire tolerant hardwoods
% cover x0.25
Midstory Overall Cover
<20% cover of woody midstory
20 to <30% cover of woody midstory
30-40% cover of woody midstory
>40% cover of woody midstory
% cover x0.25
Short Shrub (<3 ft tall) Cover
Short shrubs average <30% cover
Short shrubs average 30 to 35% cover
Short shrubs average >35 to 45% cover
Short shrubs average >45% cover
% cover x0.25
Tall Shrub (3-10 ft tall) Cover
Tall shrubs average <20% cover.
Tall shrubs average 20 to 30% cover.
Tall shrubs average >30 to 40% cover.
Tall shrubs average >40% cover.
% cover x0.25
Ground Layer Metrics Midstory Score= Excellent = 4.0 Good = 3.0 Fair = 2.0 Poor = 1.0
Overall Native Herbaceous Ground Cover
40-98% herbaceous cover
30 to <40% or >98% herbaceous cover
20 to <30% herbaceous cover
<20% herbaceous cover % cover x0.25
Longleaf Pine Regeneration
Longleaf pine regeneration cover is >1% of stand (Good and Excellent)
Longleaf pine regeneration cover is >1% of stand (Good and Excellent)
Longleaf pine regen cover is present but is <1% of stand, or no regen seen, but cone producing longleaf pine are present
Longleaf pine regen cover is apparently absent, and no cone producing longleaf pine are present in the stand
% of stand Regen? Cones?
x0.25
Native Warm Season Grass Cover
>25 to 97% foliar cover of all native warm season grasses
>15 to 25% or >97% foliar cover of native warm season grasses
10-15% foliar cover of all native warm season grasses
<10% foliar cover of all native warm season grasses
% foliar cover
x0.25
Invasive Plant Presence / Distribution
Invasive nonnative plant species cover is very low (<1% cover)
Invasive nonnative plant species in any stratum present, but sporadic (1-5% cover)
Invasive nonnative plant species in any stratum uncommon (5-10% cover)
Invasive nonnative plant species in any stratum common (>10% cover)
% cover x0.25
Final Score is : Canopy Score _______x0.33 + Midstory Score________x0.33 + Ground Layer Score________x0.33 = Evaluation Scale: 4.0 to 3.5 = Excellent, 3.5 to 2.5 = Good, 2.5 to 1.5 = Fair, 1.5 to 1.0 = Poor
Ground Layer Score =

28
Mesic Longleaf Pine Flatwoods Metrics Data Sheet Recorded Measured Value of Metric
Recorded Metric Score (1.0-4.0)
Canopy Metrics
If the optional Stand Density Index metric is used, then Canopy Southern Pine Basal Area and Southern Yellow Pine Canopy Cover do not need to be used as metrics
Excellent = 4.0 Good = 3.0 Fair = 2.0 Poor = 1.0
Canopy Southern Yellow Pine Basal Area
30-80 ft2/acre basal area of longleaf or slash pine
20 to <30 or >80 to 90 ft2/acre basal area of longleaf or slash pine
10 to <20 or >90 to 105 ft2/acre basal area of longleaf or slash pine
<10 or >105 ft2/acre basal area of longleaf or slash pine
ft2/acre BA x0.25
Southern Yellow Pine Canopy Cover
30 to 65% canopy cover of longleaf or slash pine
20 to <30% canopy cover or >65 to75% canopy cover of longleaf or slash pine
10 to <20% canopy cover or >75 to 85% canopy cover of longleaf or slash pine
<10% cover or >85% cover of longleaf or slash pine
% cover x0.25
Southern Yellow Pine Stand Age Structure
BA ≥20 ft2/acre of flat-top longleaf or slash pine of any diameter and/or longleaf or slash pine trees ≥14” DBH class
BA ≥10 ft2/acre of longleaf or slash pine trees ≥ 4” DBH class
Longleaf or slash pine trees ≥14” DBH class are present, but at < 10 ft2/acre BA
No longleaf or slash pine trees ≥14” DBH or flat-top slash or longleaf pine
ft2/acre BA x0.25
Canopy Hardwood Basal Area
<20 ft2/acre BA of hardwood trees
>20 to 25 ft2/acre BA of hardwood trees
>25 to 35 ft2/acre BA of hardwood trees
>35 ft2/acre BA of hardwood trees
ft2/acre BA x0.25
Stand Density Index (applies to longleaf pine)
SDI = 60 – 125 (15 - 31% of Maximum SDI of 400)
SDI = 40 – 60 or 125 -160 (10-15% or 31-40% of Maximum SDI of 400)
SDI = 20 – 40 or 160 - 190 (5-10% or 40-48% of maximum SDI)
SDI <20 or >190 (<5% or >48%, 240 is 60% of Maximum SD of 400)
SDI value x0.5
Midstory/Shrub Metrics Canopy Score= Excellent = 4.0 Good = 3.0 Fair = 2.0 Poor = 1.0
Midstory Fire Tolerant Hardwood Cover
<10% cover of midstory fire tolerant hardwoods
10 to <20% cover of midstory fire tolerant hardwoods
20 to 25% cover of midstory fire tolerant hardwoods
>25% cover of midstory fire tolerant hardwoods
% cover x0.25
Midstory Overall Cover
<20% cover of woody midstory
20 to <30% cover of woody midstory
30-40% cover of woody midstory
>40% cover of woody midstory
% cover x0.25
Short Shrub (<3 ft tall) Cover
Short shrubs average <30% cover
Short shrubs average 30 to <40% cover
Short shrubs average 40-45% cover
Short shrubs average >45% cover
% cover x0.25
Tall Shrub (3-10 ft) Cover
Tall shrubs average <20% cover.
Tall shrubs average 20 to <30% cover.
Tall shrubs average 30-35% cover.
Tall shrubs average >35% cover.
% cover x0.25
Ground Layer Metrics Midstory Score= Excellent = 4.0 Good = 3.0 Fair = 2.0 Poor = 1.0
Overall Native Herbaceous Ground Cover
40-98% herbaceous cover
30 to <40% or >98% herbaceous cover
20 to <30% herbaceous cover
<20% herbaceous cover % cover x0.25
Longleaf Pine Regeneration
Longleaf pine regeneration cover is >1% of stand (Good and Excellent)
Longleaf pine regeneration cover is >1% of stand (Good and Excellent)
Longleaf pine regen cover is present but is <1% of stand, or no regen seen, but cone producing longleaf pine are present
Longleaf pine regen cover is apparently absent, and no cone producing longleaf pine are present in the stand
% of stand Regen? Cones?
x0.25
Native Warm Season Grass Cover
>25 to 97% foliar cover of all native warm season grasses
>15 to 25% or >97% foliar cover of native warm season grasses
10-15% foliar cover of all native warm season grasses
<10% foliar cover of all native warm season grasses
% foliar cover
x0.25
Invasive Plant Presence / Distribution
Invasive nonnative plant species absent or cover is very low (<1% cover)
Invasive nonnative plant species in any stratum present but sporadic (1-5% cover)
Invasive nonnative plant species in any stratum uncommon (5-10% cover)
Invasive nonnative plant species in any stratum common (>10% cover)
% cover x0.25
Final Score is : Canopy Score _______x0.33 + Midstory Score________x0.33 + Ground Layer Score________x0.33 = Evaluation Scale: 4.0 to 3.5 = Excellent, 3.5 to 2.5 = Good, 2.5 to 1.5 = Fair, 1.5 to 1.0 = Poor
Ground Layer Score =

29
Upper Coastal Plain Pine Flatwoods Metrics Data Sheet Recorded Measured Value of Metric
Recorded Metric Score (1.0-4.0)
Canopy Metrics
If the optional Stand Density Index metric is used, then Canopy Southern Pine Basal Area and Southern Yellow Pine Canopy Cover do not need to be used as metrics
Excellent = 4.0 Good = 3.0 Fair = 2.0 Poor = 1.0
Canopy Southern Yellow Pine Basal Area
30-80 ft2/acre basal area of loblolly or shortleaf pine
20 to <30 or >80 to 90 ft2/acre basal area of loblolly or shortleaf pine
10 to <20 or >90 to 110 ft2/acre basal area of loblolly or shortleaf pine
<10 or >110 ft2/acre basal area of loblolly or shortleaf pine
ft2/acre BA x0.25
Southern Yellow Pine Canopy Cover
>25 to 70% canopy cover of loblolly or shortleaf pine
>15 to 25% canopy cover or >70 to 80% canopy cover of loblolly or shortleaf pine
10-15% canopy cover or >80 to 90% canopy cover of loblolly or shortleaf pine
<10% cover or >90% cover of loblolly or shortleaf pine
% cover x0.25
Southern Yellow Pine Stand Age Structure
BA ≥20 ft2/acre of loblolly and/or shortleaf pine trees ≥14” DBH class
BA ≥10 ft2/acre of loblolly and/or shortleaf pine trees ≥14” DBH class
Loblolly and/or shortleaf pine trees ≥14” DBH class are present, but <10 ft2/acre basal area of those large trees
No loblolly and/or shortleaf pine trees ≥14” DBH are present
ft2/acre BA x0.25
Canopy Hardwood Basal Area
<20 ft2/acre BA of hardwood trees
>20 to 30 ft2/acre BA of hardwood trees
>30 to 50 ft2/acre BA of hardwood trees
>50 ft2/acre BA of hardwood trees
ft2/acre BA x0.25
Stand Density Index (applies to shortleaf pine)
SDI = 55 – 145 (12 - 32% of Maximum SDI of 450)
SDI = 35 – 55 or 145 -180 (8-12% or 32-40% of Maximum SDI of 450)
SDI = 20 – 35 or 180 - 225 (4-8% or 40-50% of maximum SDI of 450)
SDI <20 or >225 (<4% or >50%, 270 is 60% of Maximum SD of 450)
SDI value x0.5
Midstory/Shrub Metrics Canopy Score= Excellent = 4.0 Good = 3.0 Fair = 2.0 Poor = 1.0
Midstory Fire Tolerant Hardwood Cover
<10% cover of midstory fire tolerant hardwoods
10 to 20% cover of midstory fire tolerant hardwoods
>20 to 35% cover of midstory fire tolerant hardwoods
>35% cover of midstory fire tolerant hardwoods
% cover x0.25
Midstory Overall Cover
<20% cover of woody midstory
20-30% cover of woody midstory
>30 to 50% cover of woody midstory
>50% cover of woody midstory
% cover x0.25
Short Shrub (<3 ft tall) Cover
Short shrubs average <20% cover
Short shrubs average 20 to 30% cover
Short shrubs average >30 to 45% cover
Short shrubs average >45% cover
% cover x0.25
Tall Shrub (3-10 ft tall) Cover
Tall shrubs average <15% cover.
Tall shrubs average 15 - 20% cover.
Tall shrubs average >20 to 30% cover.
Tall shrubs average >30% cover.
% cover x0.25
Ground Layer Metrics Midstory Score= Excellent = 4.0 Good = 3.0 Fair = 2.0 Poor = 1.0
Overall Native Herbaceous Ground Cover
35-80% herbaceous cover
20 to <35% or >80% herbaceous cover
10 to <20% herbaceous cover
<10% herbaceous cover % cover x0.33
Native Warm Season Grass Cover
>25% foliar cover of all native warm season grasses
20-25% foliar cover of all native warm season grasses
10 to <20% foliar cover of all native warm season grasses
<10% foliar cover of all native warm season grasses
% foliar cover
x0.33
Invasive Plant Presence / Distribution
Invasive nonnative plant species absent or cover is very low (<1% cover)
Invasive nonnative plant species in any stratum present but sporadic (1-5 % cover)
Invasive nonnative plant species in any stratum uncommon (5-10% cover)
Invasive nonnative plant species in any stratum common (>10% cover)
% cover x0.33
Final Score is : Canopy Score _______x0.33 + Midstory Score________x0.33 + Ground Layer Score________x0.33 = Evaluation Scale: 4.0 to 3.5 = Excellent, 3.5 to 2.5 = Good, 2.5 to 1.5 = Fair, 1.5 to 1.0 = Poor
Ground Layer Score =

30
Wet Longleaf & Slash Pine Flatwoods & Savannas Metrics Data Sheet Recorded Measured Value of Metric
Recorded Metric Score (1.0-4.0)
Canopy Metrics
If the optional Stand Density Index metric is used, then Canopy Southern Pine Basal Area and Southern Yellow Pine Canopy Cover do not need to be used as metrics
Excellent = 4.0 Good = 3.0 Fair = 2.0 Poor = 1.0
Canopy Southern Yellow Pine Basal Area
20-80 ft2/acre basal area of longleaf or slash pine
10 to <20 or >80 to <90 ft2/acre basal area of longleaf or slash pine
5 to <10 or 90 to <100 ft2/acre basal area of longleaf or slash pine
<5 or >100 ft2/acre basal area of longleaf or slash pine
ft2/acre BA x0.25
Southern Yellow Pine Canopy Cover
20-65% canopy cover of longleaf or slash pine
15 to <20% canopy cover or >65-75% canopy cover of longleaf or slash pine
10 to <15% canopy cover or >75-85% canopy cover of longleaf or slash pine
<10% cover or >85% cover of longleaf or slash pine
% cover x0.25
Southern Yellow Pine Stand Age Structure
BA ≥20 ft2/acre of flat-top longleaf or slash pine of any diameter and/or longleaf or slash pine trees ≥14” DBH class
BA ≥10 ft2/acre of longleaf or slash pine trees ≥14” DBH class
Longleaf or slash pine trees ≥14” DBH class present, but at <10 ft2/acre BA
No longleaf or slash pine trees ≥14” DBH or with flat-top slash or longleaf pine
ft2/acre BA x0.25
Canopy Hardwood Basal Area
<20 ft2/acre BA of hardwood trees
>20 to 25 ft2/acre BA of hardwood trees
>25 to 35 ft2/acre BA of hardwood trees
>35 ft2/acre BA of hardwood trees
ft2/acre BA x0.25
Stand Density Index (applies to longleaf pine)
SDI = 35 – 120 (9 - 30% of Maximum SDI of 400)
SDI = 20 – 35 or 120 -155 (5-9% or 30-39% of Maximum SDI of 400)
SDI = 10 – 20 or 155 - 180 (2.5-5% or 39-45% of maximum SDI)
SDI <10 or >180 (<2.5% or > 45%, 240 is 60% of Maximum SD of 400)
SDI value x0.5
Midstory/Shrub Metrics Canopy Score= Excellent = 4.0 Good = 3.0 Fair = 2.0 Poor = 1.0
Midstory Fire Tolerant Hardwood Cover
<10% cover of midstory fire tolerant hardwoods
10-15% cover of midstory fire tolerant hardwoods
>15 to 25% cover of midstory fire tolerant hardwoods
>25% cover of midstory fire tolerant hardwoods
% cover x0.25
Midstory Overall Cover
<20% cover of woody midstory
20-30% cover of woody midstory
>30 to 40% cover of woody midstory
>40% cover of woody midstory
% cover x0.25
Short Shrub (<3 ft tall) Cover
Short shrubs average <30% cover
Short shrubs average 30 to <40% cover
Short shrubs average 40-45% cover
Short shrubs average >45% cover
% cover x0.25
Tall Shrub (3-10 ft) Cover
Tall shrubs average < 15% cover.
Tall shrubs average 15 to <25% cover.
Tall shrubs average 25-35% cover.
Tall shrubs average >35% cover.
% cover x0.25
Ground Layer Metrics Midstory Score= Excellent = 4.0 Good = 3.0 Fair = 2.0 Poor = 1.0
Overall Native Herbaceous Ground Cover
40-100% herbaceous cover
30 to <40% herbaceous cover
20 to <30% herbaceous cover
<20% herbaceous cover % cover x0.25
Longleaf Pine Regeneration
Longleaf pine regeneration cover is >1% of stand (Good and Excellent)
Longleaf pine regeneration cover is >1% of stand (Good and Excellent)
Longleaf pine regen cover is present but is <1% of stand, or no regen seen, but cone producing longleaf pine are present
Longleaf pine regen cover is apparently absent, and no cone producing longleaf pine are present in the stand
% of stand Regen? Cones?
x0.25
Native Warm Season Grass Cover
25-97% foliar cover of all native warm season grasses
>15 to <25% or >97% foliar cover of native warm season grasses
10-15% foliar cover of all native warm season grasses
<10% foliar cover of all native warm season grasses
% foliar cover
x0.25
Invasive Plant Presence / Distribution
Invasive nonnative plant species absent or cover is very low (<1% cover)
Invasive nonnative plant species in any stratum present but sporadic (1-5% cover)
Invasive nonnative plant species in any stratum uncommon (5-10% cover)
Invasive nonnative plant species in any stratum common (>10% cover)
% cover x0.25
Final Score is : Canopy Score _______x0.33 + Midstory Score________x0.33 + Ground Layer Score________x0.33 = Evaluation Scale: 4.0 to 3.5 = Excellent, 3.5 to 2.5 = Good, 2.5 to 1.5 = Fair, 1.5 to 1.0 = Poor
Ground Layer Score =

31
Xeric Longleaf Pine Barrens Metrics Data Sheet Recorded Measured Value of Metric
Recorded Metric Score (1.0-4.0)
Canopy Metrics
If the optional Stand Density Index metric is used, then Canopy Southern Pine Basal Area and Southern Yellow Pine Canopy Cover do not need to be used as metrics
Excellent = 4.0 Good = 3.0 Fair = 2.0 Poor = 1.0
Canopy Southern Yellow Pine Basal Area
25-80 ft2/acre basal area of longleaf pine
>15 to <25 or >80 to 90 ft2/acre basal area of longleaf pine
10 to 15 or >90 to <100 ft2/acre basal area of longleaf pine
<10 or >100 ft2/acre basal area of longleaf pine
ft2/acre BA x0.25
Southern Yellow Pine Canopy Cover
>20 to 55% canopy cover of longleaf pine
>15 to 20% canopy cover or >55 to 70% canopy cover of longleaf pine
5-15% canopy cover or >70 to 80% canopy cover of longleaf pine
<5% cover or >80% cover of longleaf pine
% cover x0.25
Southern Yellow Pine Stand Age Structure
BA ≥20 ft2/acre of flat-top longleaf pine of any diameter and/or longleaf pine trees ≥12” DBH class
BA ≥10 ft2/acre of longleaf pine trees ≥12” DBH class
Longleaf pine trees ≥12” DBH class are present, but at <10 ft2/acre BA
No longleaf pine trees ≥12” DBH or flat-top longleaf pine are present
ft2/acre BA x0.25
Canopy Hardwood Basal Area
<20 ft2/acre BA of hardwood trees
>20 to 25 ft2/acre BA of hardwood trees
>25 to 35 ft2/acre BA of hardwood trees
>35 ft2/acre BA of hardwood trees
ft2/acre BA x0.25
Stand Density Index (applies to longleaf pine)
SDI = 50 – 120 (13 - 30% of Maximum SDI of 400)
SDI = 30 – 50 or 120 -160 (8-13% or 30-40% of Maximum SDI of 400)
SDI = 20 – 30 or 160 - 180 (5-8% or 40-45% of maximum SDI)
SDI <20 or >180 (<5% or >45%, 240 is 60% of Maximum SD of 400)
SDI value x0.5
Midstory/Shrub Metrics Canopy Score= Excellent = 4.0 Good = 3.0 Fair = 2.0 Poor = 1.0
Midstory Fire Tolerant Hardwood Cover
<10% cover of midstory fire tolerant hardwoods
10-20% cover of midstory fire tolerant hardwoods
>20 to 25% cover of midstory fire tolerant hardwoods
>25% cover of midstory fire tolerant hardwoods
% cover x0.25
Midstory Overall Cover
<20% cover of woody midstory
20 to <30% cover of woody midstory
30-40% cover of woody midstory
>40% cover of woody midstory
% cover x0.25
Short Shrub (<3 ft tall) Cover
Short shrubs average <25% cover
Short shrubs average 25 - 35% cover
Short shrubs average >35 to 45% cover
Short shrubs average >45% cover
% cover x0.25
Tall Shrub (3-10 ft) Cover
Tall shrubs average <15% cover.
Tall shrubs average 15 to <25% cover.
Tall shrubs average 25-30% cover.
Tall shrubs average >30% cover.
% cover x0.25
Ground Layer Metrics Midstory Score= Excellent = 4.0 Good = 3.0 Fair = 2.0 Poor = 1.0
Overall Native Herbaceous Ground Cover
40-100% herbaceous cover
>25 to <40% herbaceous cover
>15 to 25% herbaceous cover
0-15% herbaceous cover
% cover x0.25
Longleaf Pine Regeneration
Longleaf pine regeneration cover is >1% of stand (Good and Excellent)
Longleaf pine regeneration cover is >1% of stand (Good and Excellent)
Longleaf pine regen cover is present but is <1% of stand, or no regen seen, but cone producing longleaf pine are present
Longleaf pine regen cover is apparently absent, and no cone producing longleaf pine are present in the stand
% of stand Regen? Cones?
x0.25
Native Warm Season Grass Cover
25-95% foliar cover of all native warm season grasses
15 to <25% or >95% foliar cover of native warm season grasses
10 to <15% foliar cover of all native warm season grasses
<10% foliar cover of all native warm season grasses
% foliar cover
x0.25
Invasive Plant Presence / Distribution
Invasive nonnative plant species absent or cover is very low (<1% cover)
Invasive nonnative plant species in any stratum present but sporadic (1-5% cover)
Invasive nonnative plant species in any stratum uncommon (5-10% cover)
Invasive nonnative plant species in any stratum common (>10% cover)
% cover x0.25
Final Score is : Canopy Score _______x0.33 + Midstory Score________x0.33 + Ground Layer Score________x0.33 = Evaluation Scale: 4.0 to 3.5 = Excellent, 3.5 to 2.5 = Good, 2.5 to 1.5 = Fair, 1.5 to 1.0 = Poor
Ground Layer Score =

32