Field and Laboratory Measurement of Radon Flux and ...
112
i Field and Laboratory Measurement of Radon Flux and Diffusion for Uranium Mill Tailings Cover Systems By Nick Stefani A Thesis submitted in partial fulfillment of the requirements for the degree of Master of Science (Geological Engineering) at the UNIVERSITY OF WISCONSIN-MADISON 2016
Transcript of Field and Laboratory Measurement of Radon Flux and ...

i
Field and Laboratory Measurement of Radon Flux and
Diffusion for Uranium Mill Tailings Cover Systems
By
Nick Stefani
A Thesis submitted in partial fulfillment of the requirements for the degree of
Master of Science
(Geological Engineering)
at the
UNIVERSITY OF WISCONSIN-MADISON
2016

ii
MASTER OF SCIENCE
(Geological Engineering)
At the
UNIVERSITY OF WISCONSIN-MADISON
2016
Approved by:
______________________________________________________________
William J. Likos, PhD

iii
ABSTRACT
Disposal Facilities for uranium mill tailings have been constructed as required by the Uranium
Mine Tailing Radiation Control Act (UMTRCA) of 1978. Nearly all of these facilities rely on a low-
permeability, compacted clay surface cover to control the rate at which contaminants migrate in
the gas and water phase from the tailings into the environment. The primary engineered
component of the surface cover is typically referred to as the “low permeability Radon barrier, (or
Rn Barrier). The Rn Barrier is designed to have low hydraulic conductivity and low gaseous
diffusivity to effectivity control the emission of Radon and other contaminants into the
environment.
Several of the UMTRCA sites are over 20 years of service life. It is well understood that
near-surface clay covers can experience significant structure development (e.g., cracking) due to
process related to environmental exposure, including seasonal wetting and drying and bio-
intrusion from vegetation and animal activity. Over many seasons, there is the potential that the
Rn Barrier system may not contain contaminants as well as when the barrier was initially
constructed. Studies conducted on UMTRCA sites have indicated significant variability in Radon
Flux (Rn Flux) emanating through the top of the Rn Barrier (e.g., from as little as 0.3 pCi/m2-s to
as much as 200 pCi/m2-s) (CNWRA 2012). When UMTRCA was first passed, the intended service
life of cover systems was 1,000 years and Rn Flux was stipulated to not exceed 20 pCi/m2-s.
This study first seeks to develop and calibrate alternative measurement techniques for
accurately and reliably measuring Rn Flux at UMTRCA field sites. The study is motivated partly
to address limitations in current regulatory measurement techniques, where Radon surface flux
is measured using Activated Carbon (AC) placed directly on the cover surface and Radon is
measured by passive sorption. Advances in Radon measurement technologies have led to the
development of continuous, electronic Radon monitors. These monitors are capable of measuring
Radon concentration at user-specified intervals and thus can be used to measure the buildup of
iv
Radon inside a closed sampling chamber placed on the cover system over time. Continuous data
afforded by this approach provides significant advantages for measuring Rn flux over the historical
AC measurement approach. The calibration effort of this study employed an electronic RAD7
Radon detection system (Durridge Company Inc.) to measure Rn flux emanating from two Radon
sources in the laboratory (granite aggregate and a poured concrete slab). Results were used to
develop an experimental protocol for field measurements and to identify and characterize
variables that affect the measurements.
AC canisters were placed into chambers containing the Radon sources in tandem with the
electronic radon monitors so that radon concentrations measured using the two approaches could
be directly compared. The AC to RAD7 Rn Concentration ratio averaged 0.58 (+/- 0.07) for five
tests under the same conditions. A second suite of experiments was conducted to examine the
effects of process variables on the measurements, including relative humidity, chamber size,
exposure duration, and Rn flux. Similar differences in the two techniques were observed. The lab
analysis properly corrected varying levels of exposure to RH before Rn exposure to the same Rn
concentration (198.5 +/- 23.8 Bq/m3), but that concentration consistently averaged 0.60 (+/- 0.07)
in the AC to RAD7 Rn Concentration Ratio. Varying chamber size, Rn flux, and exposure time all
failed to produce statistically significant trends with R2 = 0.73, 0.42, and 0.28 respectively.
Field measurements were conducted at a uranium mill tailings disposal cell located in Falls
City, Texas. Continuous (RAD7) and passive (AC canisters) Radon detectors were deployed at
six test pits that were excavated to expose the Rn barrier at the site and to measure radon flux at
locations representative of different site conditions. Test pit locations were selected to compare
varying vegetation conditions, Rn barrier thicknesses, and underlying tailings activities. Rn flux
measured at the top of the barrier within the six test pits ranged from 0.06 - 24.74 pCi/m2-s. Radon
flux measurements were also conducted directly on top of the tailings layer, which was exposed
by excavating through the Rn Barrier. Radon flux from the tailings layer was measured as high
v
as 1148.07 pCi/m2-s. Results from this suite of measurements were used to assess performance
of the alternative Radon measurement approaches in a typical field application. The AC to RAD7
Rn concentration ratio was consistent with the laboratory measurements, averaging 0.59 with a
variance of 0.07. Corresponding ratio of Rn flux between the two devices was 0.60-0.93
depending on the size of the chamber and length of the test.
Finally, a laboratory procedure was developed to simulate desiccation and structure
development inside compacted clay samples and the associated effects on gaseous Radon
diffusion coefficient. Experiments were conducted in a modified flexible wall permeameters to
measure Radon diffusion coefficients through several wetting and drying cycles. Results were
used to understand how structure develops in different types of clays that may be considered
representative of compacted cover materials and to quantify the associated effects on Radon
diffusivity. Measured Rn diffusion coefficients across all clays ranged from a maximum of 3.98e-
7 m2/s to a minimum of 1.24e-09 m2/s. These values fall within the expected diffusion coefficients
boundaries of air (1e-5 m2/s) and water (1e-9 m2/s).

vi
ACKNOWLEDGEMENTS
The UW-Madison Geological Engineering Department has been a fantastic home for the past two
years of my Master’s Degree work. The professors, staff, and other graduate students have been
incredibly helpful in guiding my personal growth and professional development. Together, they
have taught me engineering fundamentals, critical thinking skills, writing proficiency, and
presentation skills.
First, I must thank my advisor, Professor Bill Likos. He provided me with my first taste of
academic research when I was still and undergraduate and to offer an opportunity to pursue a
Master’s Degree in Geological Engineering. Professor Likos has been extremely helpful in
pushing my critical thinking, creative thinking and engineering skills on a day to day basis. In
addition he has fermented a wonderful environment for me to explore my personal and
engineering interests. Thanks must also be extended to Professor Benson, who has continually
pushed me to be a better engineer, presenter, and writer. I would also like to thank Professor Edil
for following this research progress, providing his input and serving on my committee.
Supplementary help and appreciation must also be extended to other groups that made
this research possible; Professor Phil Brown of the UW Geoscience and Tom Elias of Johnson
and Johnson Mining Company for willingness to help acquire a Radon source, Victor Gortesky
and Yulia Henes for helping identify potential safety issues, loaning a RAD7 unit, and providing
helpful advice in the early stages of the project, Dr. Danta Galan of RTCA for sharing data and
laboratory procedures to better understand the underlying phenomena at work, which proved to
be more than critical, Professor Robert McTaggert of South Dakota State University for loaning
and additional RAD7 unit and unmeasurable advice, guidance, and patience must be extended
to Xiadong “Buff” Wang, head of the GLE Soils Lab, for assistance in laboratory work and field
measurements related to the project.

vii
Finally, friends and family in and out of the GLE department must be thanked for helping
progress this project and aiding my Master’s Degree work, and providing the support I needed to
successfully conclude my work.
Financial support for this study is from the University of Wisconsin – Madison, The Legacy
Management of the Department of Energy and The Nuclear Regulatory Commission. This support
is gratefully acknowledged. The findings and recommendations that have been presented are
solely those of the author, and do not necessarily represent the policies or opinions of the
sponsors.

viii
TABLE OF CONTENTS
CHAPTER 1. LABORATORY CALIBRATION OF ELECTRONIC AND ACTIVATED CARBON
METHODS TO MEASURE RADON FLUX IN SURFACE COVER APPLICATIONS……………1
1.1. INTRODUCTION………………………………………………………………………..…………..1
1.2. BACKGROUND…………………………………………………………………………..……...…1
1.3 MATERIALS………………………………………………………………………………………….3
1.3.1. Radon Sources……………………………………………………………………….…3
1.3.2. Activated Carbon (AC) Canisters……………………………………………………4
1.3.3. Electronic Radon Monitor…………………………………………………………….5
1.3.4. Flux Chambers…………………………………………………………………….……5
1.4. METHODS…………………………………………………………………………………………..6
1.4.1. Theory for Calculating Rn Flux………………………………………………………6
1.4.1.1. Theory for Continuous Rn Monitor Data (RAD7)……………………....6
1.4.1.2. Determining Me……………………………..………………………………..7
1.4.1.3. Theory for Passive Measurement Data (AC)…………………………...8
1.4.2. Source Radon Flux………………………………………………………………….....9
1.4.3. Direct Comparison Between AC and RAD7 Technicians in the Same
Chamber..........................................................................................................................9
1.4.4. Effects of water vapor exposure on AC measurements……………………….10

ix
1.5. RESULTS……………………………………………………………………………………….....10
1.5.1. Concentration Buildup Curves……………………………………………………..10
1.5.2. Effect of Scale (Chamber Size)………………………………………………….….12
1.5.3. Direct Comparison of RAD7 and AC Results……………………………………12
1.5.4. Effects of Pre-exposure to Water Vapor……………………………………….…14
1.6. SUMMARY AND CONCLUSIONS…………………………………………………………...…14
1.7 REFERENCES……………………………………………………………………………………..16
CHAPTER 2. EFFECTS OF WET-DRY CYCLING ON RADON DIFFUSION COEFFICIENTS
FOR COMPACTED CLAYS…………………………………………………………………………..40
2.1. ABSTRACT…...………………………………………………………………………..………….40
2.2. BACKGROUND…………………………………………………………………………..……….42
2.3 METHODS AND MATERIALS……………………………………………………………………44
2.3.1. Compacted Clays……………………………………………………………………...44
2.3.2. Electronic Radon Monitor …........…………………………………………………..44
2.3.3. Permeameter……………………………………………………………………………45
2.3.4. Wet-Dry Cycling Procedure……………………………………………………..……45
2.3.5. Calculating DRn…………………………………………………….……………….…..46
2.4. RESULTS…………………………………………………………………………………………...47
2.4.1. Desiccation Cracks………………………………………………………………..…..47
x
2.4.2. Changes to DRn……………………………………………….……………………………..….47
1.5. SUMMARY AND CONCLUSIONS…………………………………………………….……...…49
1.6 REFERENCES………………………………………………………………………………….…..51
APPENDIX A. RADON FLUX MEASURMENTS AT FALLS CITY,
TEXAS……………………………………………………………………………………………….…..67
A.1. OBJECTIVE…...………………………………………………………………………..…….…...67
A.2. MATERIALS………………………………………………………………………..………….…..67
A.3. PROCEDURE AND METHODOLOGY…………………………………………………….……68
A.4. RESULTS………………………………………………………………………………………......70
A.4.1. RAD7 Buildup Curves………………………………………………………………….....…..70
A.4.2. Activated Carbon Canister Measurements.…………….…………………….…………..72
A.4.2. Water Content Profile………………………...…………….………………………..74
A.5. CONCLUSTIONS……………………………………………………………………………...…75

xi
LIST OF TABLES
Table 1.1 Summary of all concrete slab tests. Jo averaged 4.89 Bq/m2-h over all tests. The back diffusion coefficeint (D) cannont be averaged across all tests because not all tests were run to equilibrium………………………………………………………………………………………………..19
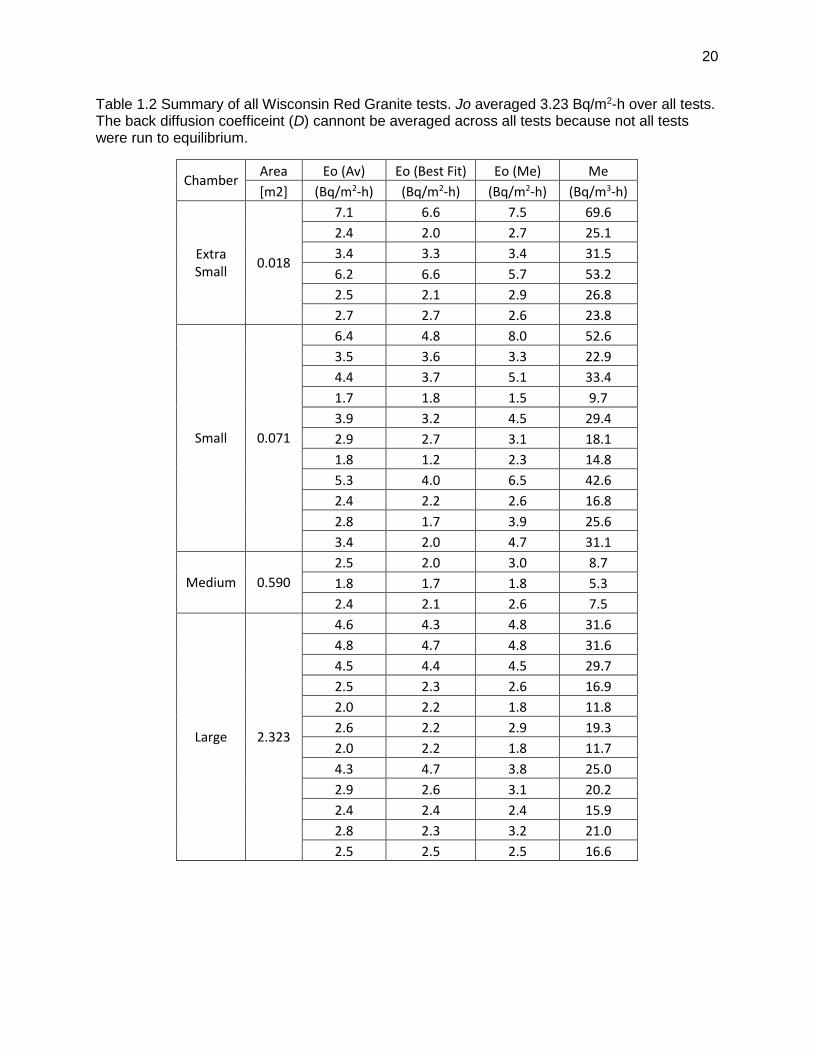
Table 1.2 Summary of all Wisconsin Red Granite tests. Jo averaged 3.23 Bq/m2-h over all tests. The back diffusion coefficeint (D) cannont be averaged across all tests because not all tests were run to equilibrium……………………………………………………………………………………..….20
Table 1.3 Rn Fluxes from granite, tuff, and volcanic ashes……………………………………….....21
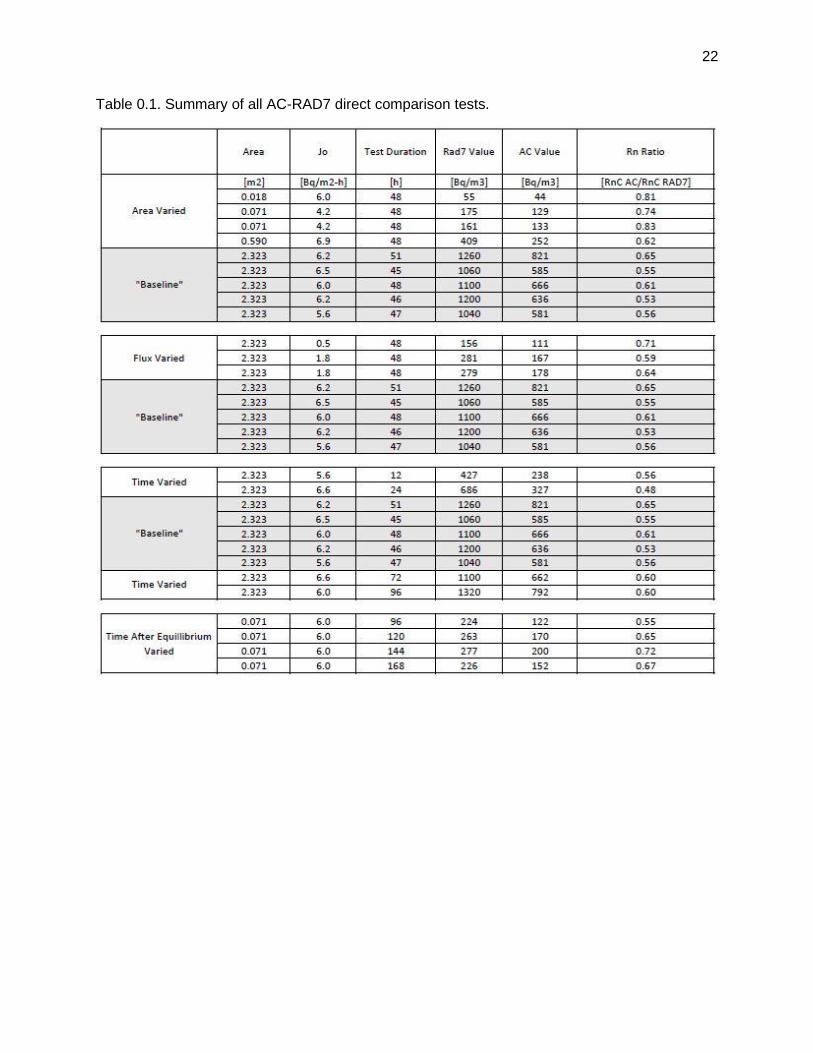
Table 1.4 Summary of all AC-RAD7 direct comparison tests.……………………………………...22
Table 2.1 Atteberg limits for clays used in this study……………………………………...…………55
Table 2.2 Compaction data used with standard proctor for compacting clay specimens………....55
Table A.1 Test Pit conditions selected to be compared. Test Pits 1 and 2, 3 and 4, and 5 and 6 where located spatially very close, > 10 m, so they could be compared directly……………...…...77
Table A.2 Summary of all Radon Flux Measurements taken at Falls City……………………........78
Table A.3 Summary of reliable AC-RAD7 direct comparison measurements……………………..79

xii
LIST OF FIGURES
Figure 1.1 Photo of a 0.071 m2 Rn flux chamber passively accumulating radon with activated
carbon. This is the standard practice currently used by UMTRCA guidelines…………………......23
Figure 1.2 (Left) AC canister placed on granite aggregate Rn source; (right) RAD7 sampling the atmosphere within a large chamber overlying a layer of granite on top of the plastic sheeting…...23
Figure 1.3 Scaled image of the dimensions of each flux chamber…………………………………..24
Figure 1.4 Experimental set up for the small flux chamber…………………………………………..24
Figure 1.5 A Rn buildup curve and three approaches to determine Me……………………………..25
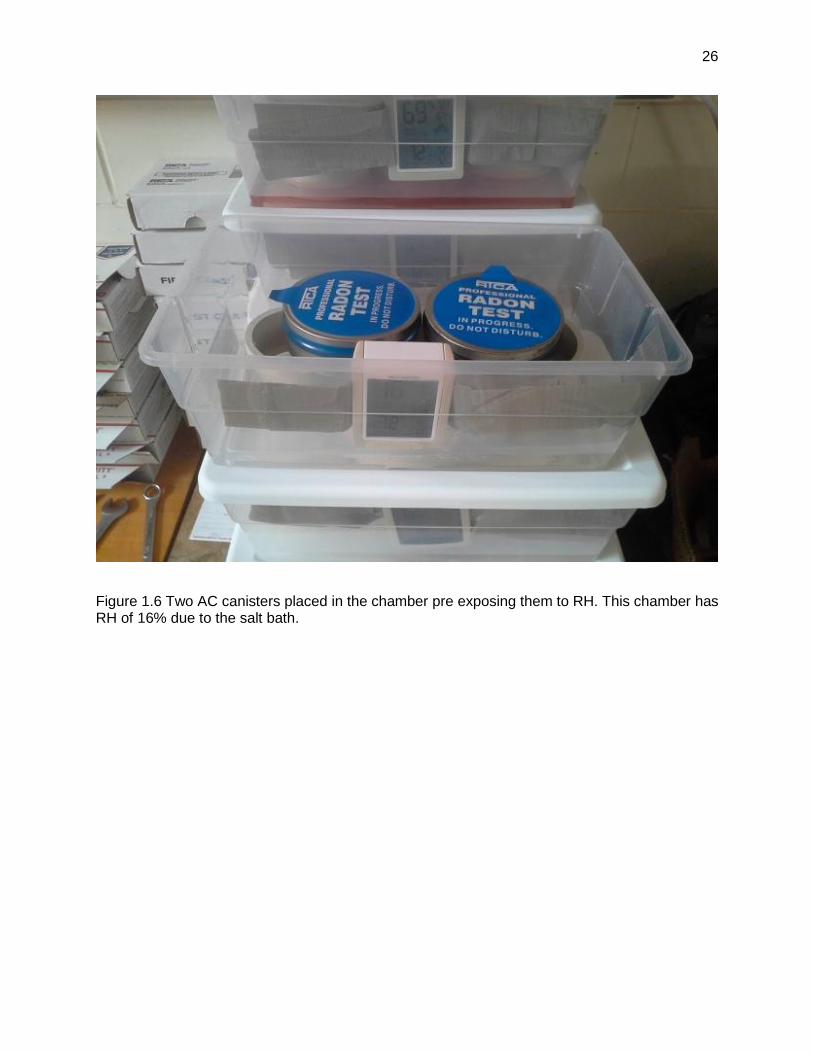
Figure 1.6 Two AC canisters placed in the chamber pre exposing them to RH. This chamber has RH of 16% due to the salt bath………………………………………………………………………….26
Figure 1.7 Experimental set up of AC canisters pre exposed to different RH ready to be exposed to Rn in the large chamber………………………………………………………………………….…..27
Figure 1.8 Radon concentration buildup curves for the concrete slab. One test representative of each chamber is presented………………………………………………………………………….....28
Figure 1.9 If the volume to area ratio is similar between each chamber, the equilibrium concentration increases as the flux area increases.....................................................................29
Figure 1.10 The medium buildup curve (half-filled data points) builds slower than the other three chambers that all have a smaller volume to area ratios………………………………………….....30
Figure 1.11 Rn flux tests as a function of flux area for both concrete (top) and granite (bottom). The average flux for all tests is the flat dashed line. The average flux for each chamber size is the large open square……………………………………………………………………………………….31
Figure 1.12 Direct comparison of measured Radon between AC and RAD7 observed data. AC to RAD7 Rn concentration averages 0.58……………………………………………………………….32
Figure 1.13 Direct comparison of AC and RAD7 measurements as flux area is varied………….33
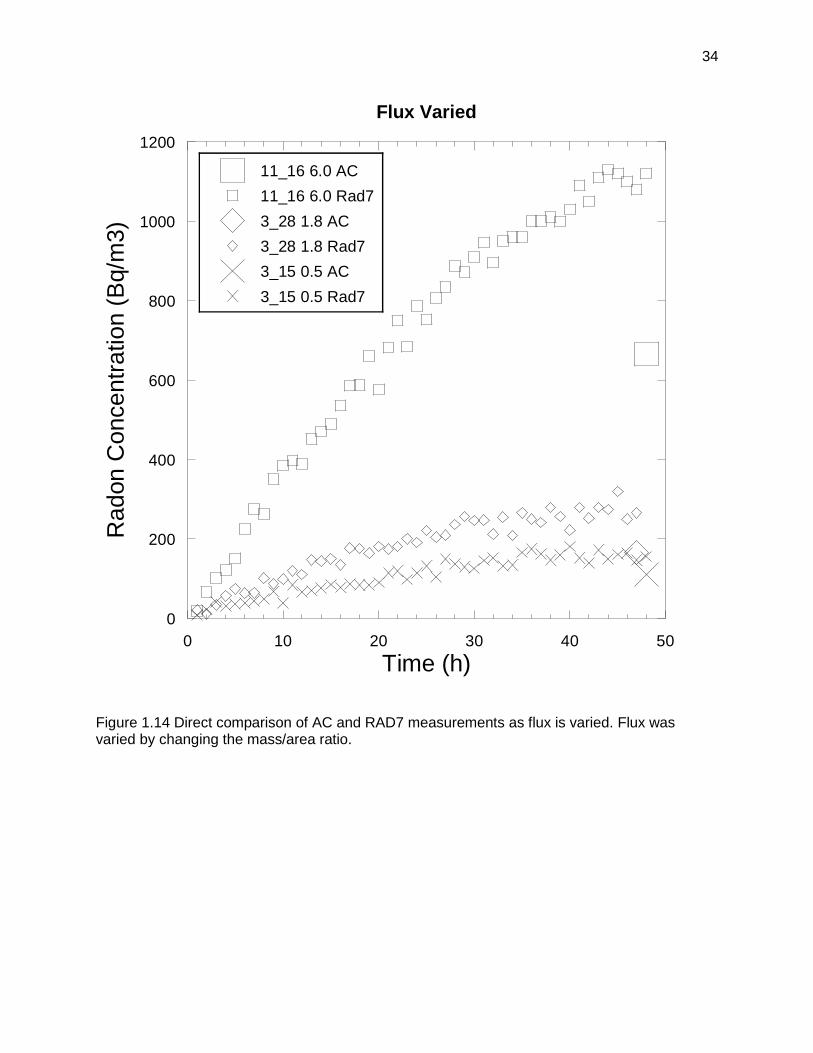
Figure 1.14 Direct comparison of AC and RAD7 measurements as flux is varied. Flux was varied by changing the mass/area ratio……………………………………………………………………….34
Figure 1.15 Direct comparison of AC and RAD7 measurements as exposure time is varied……35
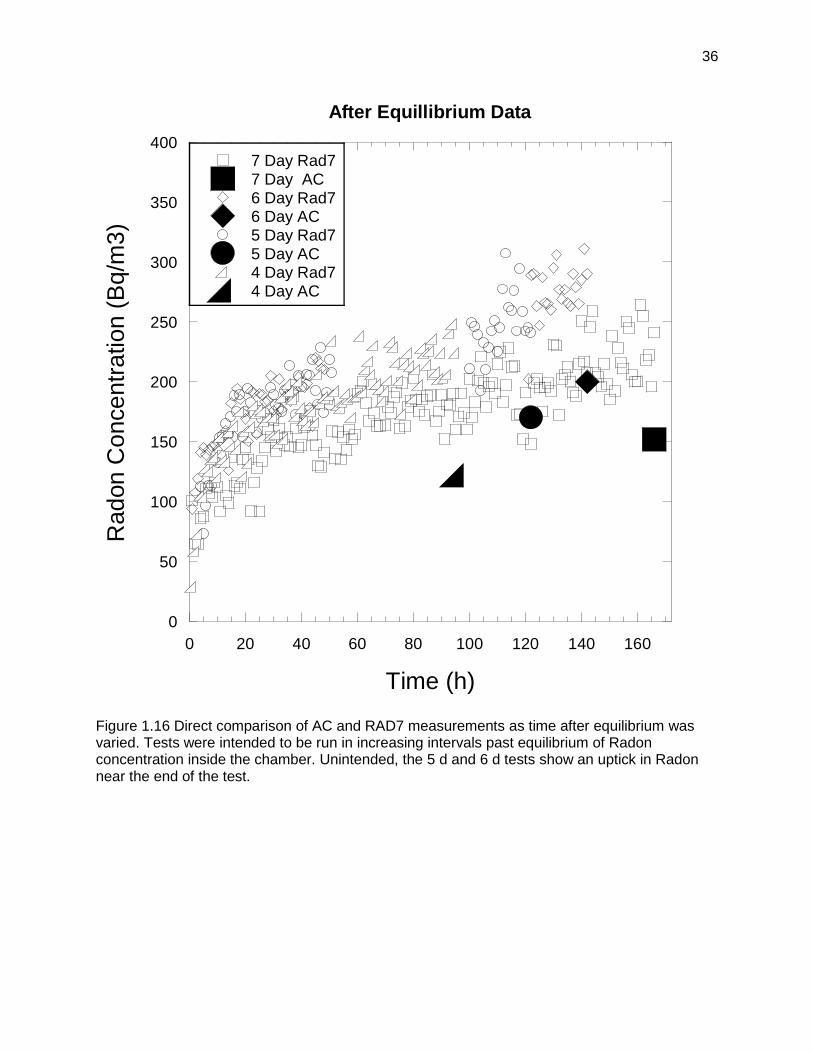
Figure 1.16 Direct comparison of AC and RAD7 measurements as time after equilibrium was varied. Tests were intended to be run in increasing intervals past equilibrium of Radon concentration inside the chamber. Unintended, the 5 d and 6 d tests show an uptick in Radon near the end of the test………………………………………………………………………………….36
Figure 1.17 Moisture gained on the AC canister increased as the pre exposure Relative Humidity increased ……………………………………………………………………………………………...…37

xiii
Figure 1.18 Passive sorption of Radon decreased as it was pre exposed to higher levels of
Relative Humidity…………………………………………………………………………………..……38
Figure 1.19 RAD7 buildup curve from RH variation test. The average corrected AC value was
198.5 Bq/m3, the filled circle. The error bars are the maximum and minimum corrected values
from RTCA’s analysis, 218.5 and 174.7 Bq/m3……………………………………………………….39
Figure 2.1 General UMTCA design approach for constructing UMTCA disposal cells…….........56
Figure 2.2 Testing apparatus used to provide a solid surface inside the permeameter…...........57
Figure 2.3 Testing schematic (top) of the permeameter adapted to measure DRn. Air flows from the RAD7 to the corresponding PVC chamber. The right RAD7 samples the source tube that is also exposed to the bottom chamber, creating a constant radon concentration………………….58
Figure 2.4 Compaction curves for Phoenix, Atlanta, and KF2 clays. The Zero Air Voids curve is the black, solid line. Optimum water content and max dry unit weight was already calculated from previous studies…………………………………………………………………………………………59
Figure 2.5 Three clay samples being prepared to be nearly fully submerged in a desiccator under vacuum to saturate for 24 h…………………………………………………………………………....60
Figure 2.6 Denver effective Radon Diffusion Coefficients…….…………………………………….61
Figure 2.7 KF2 effective Radon Diffusion Coefficients………………………………………………62
Figure 2.8 New Orleans effective Radon Diffusion Coefficients……………………………………63
Figure 2.9 Atlanta effective Radon Diffusion Coefficients……………………………..………...….64
Figure 2.10 Lodgement effective Radon Diffusion Coefficients………………………….………...65
Figure 2.11 Phoenix effective Radon Diffusion Coefficients……………………............................66
Figure A.1 Design Cross Section for the Falls City, TX UMTRCA cover system: (a.) top of cell, (b.) slope apron, and (c.) side slope…………………………………………………………………...80
Figure A.2 Shallow grasses that cover the Falls City disposal cell. The right part of the picture shows mowed grass…………………………………………………………………………………….81
Figure A.3 Woodier vegetation at the surface (mesquite brush) can be seen in clusters…….....82
Figure A.4 The top figure shows the transition from the vegetative cell cover to the rock apron. The bottom image looks up the rock armored slope…………………………………………………83
Figure A.5 Aerial view of the Falls City UMTRCA cell with each approximate Test Pit location identified………………………………………………………………………………………………….84
Figure A.6 General layout of each Test Pit with the large, medium, small, and extra small chambers measured Rn build up curves at the top of the Rn Barrier………………………………85
Figure A.7 Radon build up curves measured in Test Pit 1 are plotted together………………….86
Figure A.8 Radon build up curves measured in Test Pit 2 are plotted together………………….87
Figure A.9 Radon build up curves measured in Test Pit 3 are plotted together………………….88

xiv
Figure A.10 Radon build up curves measured in Tit Pit 4 are plotted together. The abnormal rise and fall of the large chamber buildup curve is expected to be due to a large drop in ambient air pressure from a storm front that moved in after installation…………………………………………89
Figure A.11 Radon build up curves measured in Test Pit 5 are plotted together…………………90
Figure A.12 Radon build up curves measured in Test Pit 6 are plotted together…………………91
A.13 All Rn flux measurements taken at Falls City from April 25th to 29th…………………………92
Figure A.14 (Left) From the Falls City field data, each flux value has been normalized by averaging the 4 flux measurements in each Test Pit. Each flux was then rationed by its Test Pit average. (Right) The laboratory flux ratios to the average over all flux measurements from Chapter 1….93
Figure A.15 Three Rad7 (small open data points) and AC (single large filled data point) flux test data……………………………………………………………………………………………………….94
Figure A.16 Comparing the slopes and flux calculation for AC and RAD7 data for the large chamber in Test Pit 6……………………………………………………………………………………95
Figure A.17 Water content profiles derived from ASTM D2216 -10 and Shelby tube sampling from the top of the Rn barrier…………………………………………………………………………………96
Figure A.18 Smaller roots, only 1 mm in thickness observed in the top of TP1A tube and throughout TP3A tube…………………………………………………………………………………..97
Figure A.19 Larger mesquite brush roots found in TP3A tube found 150 mm deep into the Rn barrier. Roots are about 5 mm in thickness……………………………………………………………98

1
CHAPTER 1
LABORATORY CALIBRATION OF ELECTRONIC AND ACTIVATED CARBON
METHODS TO MEASURE RADON FLUX IN SURFACE COVER APPLICATIONS
1.1. INTRODUCTION
Continuous electronic Radon monitors are a relatively new development in the radon
measurement field (Ferry et al. 2002; ORAU 2014). By employing a solid state alpha detector,
they can measure the concentration of radon inside a closed chamber at discrete intervals over
long periods of time. Through this method, the buildup in the concentration of radon (buildup
curve) can be recorded and used to calculate an initial flux of radon emanating from the source.
Such monitors have also been widely used in academic lab work. One common application is
measuring emanation rates of common building and architectural materials, like concrete and
granite, to predict the indoor concentration of radon in residential or commercial environments
(e.g., basements). These monitors have proven to be reliable and useful for calculating radon
fluxes.
This study aims to adapt a continuous radon monitoring method for field measurements
of Radon flux (Rn flux) through clay covers on UMTRCA sites. The calibration and calculation
process is described for conducting Rn flux measurements on a surface emanating radon. Current
UMTRCA measurement techniques (activated carbon canisters) are directly compared to results
obtained using the RAD7 approach to assess differences, advantages, and potential issues
between the two processes.
1.2. BACKGROUND
Rn barriers at UMTRCA facilities are evaluated immediately after construction to determine if they
meet the Rn flux requirement. Current practice involves deployment of an activated carbon (AC)

2
canister placed directly on top of the Rn barrier for about 24 h in a flux accumulator with an area
equal to 0.071 m2 (Figure 1.1). Sorption of Radon on the carbon surface occurs in the gas phase.
After some time, the carbon inside the chamber is analyzed for counts of radon, which may be
calculated into an Rn flux. Rn flux is stipulated by UMTRCA to be less than 2664 Bq/m2-h (20
pCi/m2-s) (UMTRCA 2013). The AC procedure is simple, low-cost and can be repeated
numerously over a large (several acre) UMTRCA disposal cell.
The Center for Nuclear Waste Regulatory Analyses (2012) conducted Rn flux
measurements on Rn barriers using passive AC samplers over several years in an attempt to
understand how Rn flux changes temporally, seasonally, annually, and over the life of UMTRCA
clay covers. Significant variations in measured Rn flux were observed for measurements
conducted over a six year period. Over just one year, Rn flux measured using the AC canister
approach was as high as 26,640 Bq/m2-h (200 pCi/m2-s) and as low as 39.9 Bq/m2-h (0.3 pCi/m2-
s). While, some variation may be attributable to variation in environmental factors that limit or
enhance Rn flux (e.g., water saturation of the Rn barrier and ambient air pressure), significant
scatter in the results motivates effort to understand sources of uncertainty in the measurement
approach and to explore alternative measurement approaches for application at UMTRCA sites.
Uncertainty in the AC measurement approach arises from several potential sources. The
activated carbon measurement approach is a sorption based, passive measurement technique.
Accuracy of the accumulated radon count is affected by the presence of water vapor in the
sensing chamber, which can reduce sorption sites available on the AC that are otherwise
available for radon (Vargas and Ortega 2007). Correction factors designed for lab analysis may
be improperly calculated for flux chambers that buildup radon. Additionally, final covers for
UMTRCA facilities are designed to have an indefinite service life. Degradation of the Rn barrier
can occur over long periods of time (Suter 1993; Benson et. al. 2007, 2011; Waugh et. al. 2015).
Freeze-thaw and wet-dry cycling of compacted clay barriers are known to cause increases in

3
saturated hydraulic conductivity of several orders of magnitude (Benson and Othman 1993;
Othman et. al. 1994, Benson et. al. 1995; Albrecht and Benson 2001; Albright el al. 2006 a, b).
Rn fluxes are likely affected similarly, changing the amount of radon diffusing from the tailings into
the environment.
1.3. MATERIALS
1.3.1. Radon Sources
Radon sources were obtained to provide consistent and measurable Rn flux for sensor calibration.
Materials with low levels of Radon emanation were required to simulate typical Radon Fluxes
consistent with UMTRCA site conditions. Radon Fluxes as low as 39.9 Bq/m2-h (0.3 pCi/m2-s),
for example, have been measured with Activated Carbon on UMTRCA cells.
The first source used in this study was Wisconsin Red Granite. Wisconsin Red Granite is
found in North Central Wisconsin and used in monument stone, landscape, and other
applications. When mined, the crushed granite is sieved and separated into different grain sizes.
For this study, Red Granite was selected from a span of grain sizes from 40 mm to 4.75 mm.
Radon emanation of a granitic material is highly variable because the content of the father decay
progeny (Uranium) can be highly variable from location to location within the rock formation (Chao
et al. 1997).
It has also been observed that concrete can emanate low levels of Radon (Daoud and
Renken 1999). If the natural material used to make up the concrete aggregate contains high
enough levels of Uranium, concrete slabs will produce Radon flux at levels similar to levels
expected at UMTRCA cells. Likewise, if the concrete contains a significant degree of cracking,
radon may diffuse from the underlying surface through a concrete floor slab. The Computer Aided
Engineering Building basement at the University of Wisconsin-Madison campus was the

4
laboratory for Rn flux measurements and also has a poured concrete slab as its floor. It was also
used as a source material for laboratory measurements.
1.3.2. Activated Carbon (AC) Canisters
AC canisters are based on passive sorption of gaseous radon onto granular activated carbon
(Gervino et al. 2004). After a period of exposure (e.g., placement of the canister in a closed
environment), the canister is sealed and shipped to a laboratory for analysis. AC canisters can be
deployed for less than a day to a week for short term tests, or for long term tests that could last
90 days to a year. The amount of adsorbed Rn is measured (e.g., by counting with a sodium
iodide detector) and corresponding Rn concentration is calculated according to
𝑅𝑛𝐶 = (𝐶𝑅−𝐵𝑅)
(𝐸∗𝐶∗𝑡∗ 𝜆) (1)
where CR is the counting rate (counts/min). BR is the background rate (counts/min). E is the
efficiency (unit less) of the machine used and is calibrated each day by the lab. C is the calibration
factor (counts/pCi-min/L). This value is derived from numerous tests calibrating the AC canister
to a known Rn concentration and measured moisture gained. The time of exposure (min) is t.
Finally, λ is the decay factor (1/min) that accounts for the amount of time from the end of exposure
to the time of measurement in the laboratory. Equation (1) used in this study comes from the
Radon Testing Corporation of America (Elmsford, NY) but the method to convert counts of Radon
into a concentration or flux is similar to that used in other studies (Hartley and Freeman 1985).
The AC canisters used in this study were 100 mm diameter open-faced charcoal canisters
(Figure 1.1) obtained from the Radon Testing Corporation of America (RTCA). They contained 90
g of AC. The National Radon Safety Board device code is 10331. Laboratory analysis was
conducted and reported back by RTCA.

5
1.3.3. Electronic Radon Monitor
Continuous Electronic Radon monitors contain a solid state alpha defector to measure
disintegrations of alpha progenies of Radon over a designated time period. The detector used in
this study was the RAD7 (Durridge Company, Inc. Billerica, MA) (Figure 1.2), which has been
used extensively in other studies of Rn exhalation (flux) rates from building materials such as
granite and concrete (Chao et al. 1997: Tuccimei et al. 2006: Ujic et al. 2008). A pump in the
RAD7 continually cycles air from the sampling environment (e.g., closed chamber) through the
detector to distinguish between different energy levels so that only Radon is measured. A pump
flow rate of 800 mL/min and a sampling frequency (cycle time) of one hour were used for all tests
reported in this study. Measured counts of Radon during buildup in the sampling chamber are
then calculated into a corresponding concentration. Monotonic increase in Rn concentration can
be used to quantify an initial Radon flux from the source into the chamber.
1.3.4. Flux Chambers
Different sized sampling chambers were used to assess any effects that scale may have on
Radon flux measurements using the AC and RAD7 measurement approaches. Four sizes were
selected with different flux areas (A). These are designated herein as large, medium, small, and
extra small. Flux area is defined as the projected cross-sectional area of the Rn source material
exposed to the flux chamber, and is equal to the cross-sectional area of the chamber. The large
chamber (1.5 m x 1.5 m square cross section, A = 2.32 m2, V = 0.352 m3) was adapted from the
sealed double ring infiltrometer (SDRI) measurement technique to measure large scale field
hydraulic conductivities (ASTM D5093 - 15). The medium chamber was a rectangular HDPE
container (A = 0.590 m2, V = 0.204 m3). The small chamber was a 0.3 m diameter circular polyvinyl
chloride (PVC) end cap (A = 0.071 m2, V = 0.011 m3) and resembles the same dimensions and
design of the flux chamber used in the CNWRA report in 2012 that measured Rn flux with AC
over a six-year period. This construction is also most commonly used in UMTRCA guidelines for

6
the post construction Rn flux measurements for compliance once the Rn barrier is completed.
Lastly, the extra small chamber was a 0.15 m diameter circular polyvinyl chloride (PVC) end cap
(A = 0.017 m2, V = 0.002 m3). A scaled image containing the dimensions in plan view and in cross
section can be found in Figure 1.3.
Two holes were drilled in the top surface of the flux chambers and fitted with air tight ports
used to attach tubing that would connect the RAD7 to the flux chamber. When the granite
aggregate was used as an Rn source, a polyethylene sheet (25 µm thick) was placed between
the granite and the concrete floor slab to minimize back diffusion of Rn into the concrete, as well
as transmission of Rn from the concrete. When the concrete slab was used as the Rn source, the
chamber was placed directly on top of the slab with no polyethylene sheet. For laboratory tests,
the chamber (interface between the chamber edge and floor surface) was sealed with duct tape
to prevent Rn leakage from the chamber. Figure 1.4 contains a schematic of the experimental
set up.
1.4. METHODS
1.4.1. Theory for Calculating Rn Flux
1.4.1.1. Theory for Continuous Rn Monitor Data (RAD7)
Transient Rn concentration in a closed flux chamber containing a constant Rn source can be
modeled by considering mass balance of the system (Chao et al. 1997; Tuccimei et al. 2006; Ujic
et al. 2008):
𝑑𝐶
𝑑𝑡= −𝜆𝐶 − 𝐷𝐶 +
𝐽𝑜𝐴
𝑉+
𝑞(𝐶𝑜−𝐶)
𝑉 (2)
where C (Bq/m3) is Rn concentration, t (h) is time, λ (1/h) is a decay coefficient, D (1/h) is the back
diffusion coefficient, J0 (Bq/m2-h) is initial Rn flux into the flux chamber, A (m2) is the flux area of
the chamber, V (m3) is the volume of the chamber, q (1/h) is a leakage coefficient, and C0 is the

7
background (e.g., ambient) Rn concentration. The decay term is necessary because of the short
half-life of Rn (3.8 d). For an unvented chamber, the back-diffusion term accounts for diffusion of
Rn back into the source material as the concentration builds up inside the chamber. Jo is the
radon emanating from the source into the chamber at time zero (before any back diffusion). The
right-most term in Eq. 2 is used to quantify leakage of Rn from the chamber.
Eq. 2 is solved with the initial conditions t = 0 and C = Ci , to yield
𝐶 = (𝐶𝑖 −𝐽𝑜𝐴+𝑞𝐶𝑜
𝑉(𝜆𝑒𝑓𝑓)) (1 − 𝑒−(𝜆𝑒𝑓𝑓∗𝑡)) +
𝐽𝑜𝐴+𝑞𝐶𝑜
𝑉(𝜆𝑒𝑓𝑓) (3)
where
𝜆𝑒𝑓𝑓 = 𝜆 + 𝐷 +𝑞
𝑉 (4)
Eq. 3 is fit to the Rn build up curve using least-squares analysis by adjusting Jo, and eff.
If back diffusion is not significant (e.g., early in the measurement period), the initial slope
(Me) of the curve relating Rn concentration inside the chamber and time can be used to estimate
the initial flux (Jo) from Eqs. 5 and 6.
𝑑𝐶
𝑑𝑡 𝑡→0= 𝑀𝑒 =
𝐽𝑜𝐴+𝑞𝐶𝑜
𝑉 (5)
𝐽𝑜 = (𝑀𝑒 − 𝑞
𝑉𝐶𝑜) (
𝑉
𝐴) (6)
For each Rn buildup curve, the optimization method and Me method were averaged,
producing the flux reported for each test.
1.4.1.2. Determining Me
Me was calculated by averaging three different methods. First, linear regression was conducted
for each data point. Meaning for t = 5 h, linear regression was conducted from t = 1 h to t = 5 h.
8
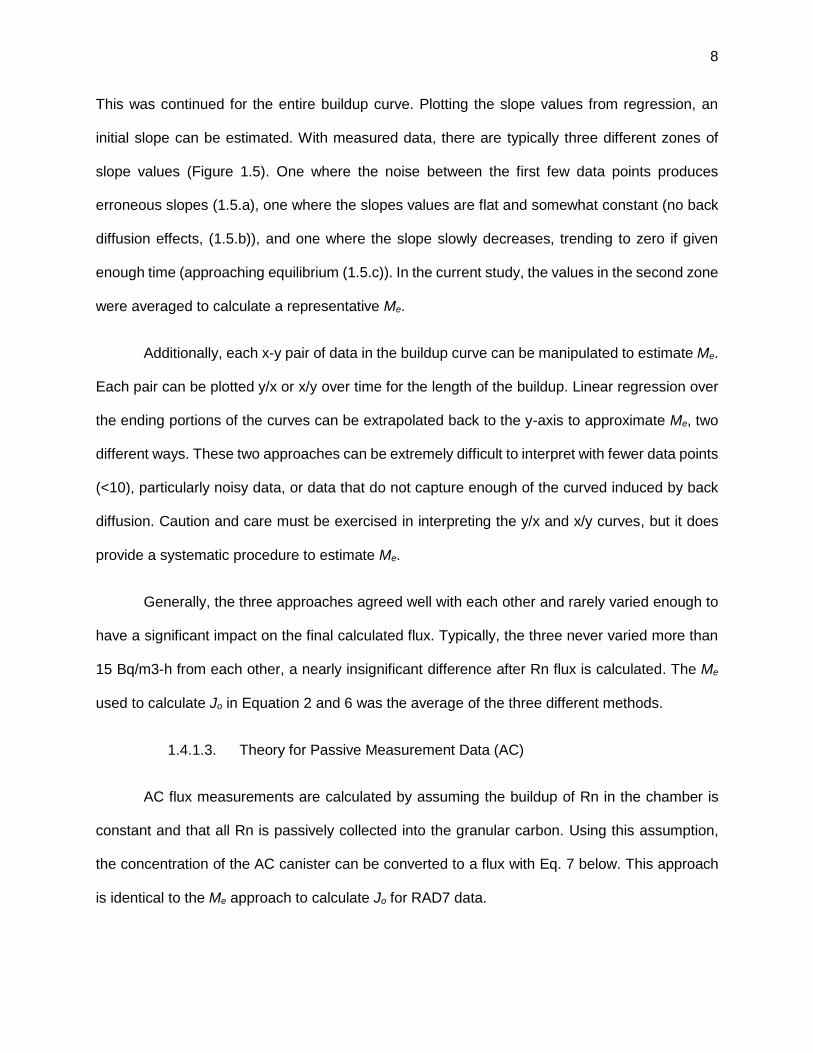
This was continued for the entire buildup curve. Plotting the slope values from regression, an
initial slope can be estimated. With measured data, there are typically three different zones of
slope values (Figure 1.5). One where the noise between the first few data points produces
erroneous slopes (1.5.a), one where the slopes values are flat and somewhat constant (no back
diffusion effects, (1.5.b)), and one where the slope slowly decreases, trending to zero if given
enough time (approaching equilibrium (1.5.c)). In the current study, the values in the second zone
were averaged to calculate a representative Me.
Additionally, each x-y pair of data in the buildup curve can be manipulated to estimate Me.
Each pair can be plotted y/x or x/y over time for the length of the buildup. Linear regression over
the ending portions of the curves can be extrapolated back to the y-axis to approximate Me, two
different ways. These two approaches can be extremely difficult to interpret with fewer data points
(<10), particularly noisy data, or data that do not capture enough of the curved induced by back
diffusion. Caution and care must be exercised in interpreting the y/x and x/y curves, but it does
provide a systematic procedure to estimate Me.
Generally, the three approaches agreed well with each other and rarely varied enough to
have a significant impact on the final calculated flux. Typically, the three never varied more than
15 Bq/m3-h from each other, a nearly insignificant difference after Rn flux is calculated. The Me
used to calculate Jo in Equation 2 and 6 was the average of the three different methods.
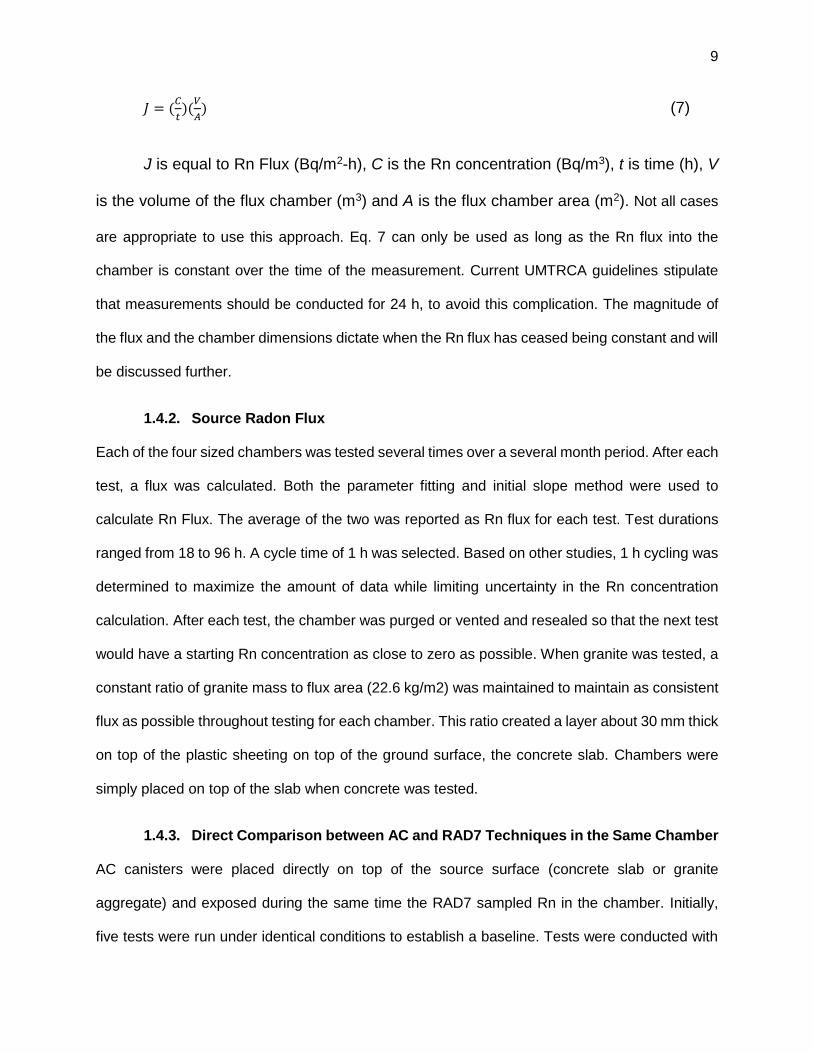
1.4.1.3. Theory for Passive Measurement Data (AC)
AC flux measurements are calculated by assuming the buildup of Rn in the chamber is
constant and that all Rn is passively collected into the granular carbon. Using this assumption,
the concentration of the AC canister can be converted to a flux with Eq. 7 below. This approach
is identical to the Me approach to calculate Jo for RAD7 data.
9
𝐽 = (𝐶
𝑡)(
𝑉
𝐴) (7)
J is equal to Rn Flux (Bq/m2-h), C is the Rn concentration (Bq/m3), t is time (h), V
is the volume of the flux chamber (m3) and A is the flux chamber area (m2). Not all cases
are appropriate to use this approach. Eq. 7 can only be used as long as the Rn flux into the
chamber is constant over the time of the measurement. Current UMTRCA guidelines stipulate
that measurements should be conducted for 24 h, to avoid this complication. The magnitude of
the flux and the chamber dimensions dictate when the Rn flux has ceased being constant and will
be discussed further.
1.4.2. Source Radon Flux
Each of the four sized chambers was tested several times over a several month period. After each
test, a flux was calculated. Both the parameter fitting and initial slope method were used to
calculate Rn Flux. The average of the two was reported as Rn flux for each test. Test durations
ranged from 18 to 96 h. A cycle time of 1 h was selected. Based on other studies, 1 h cycling was
determined to maximize the amount of data while limiting uncertainty in the Rn concentration
calculation. After each test, the chamber was purged or vented and resealed so that the next test
would have a starting Rn concentration as close to zero as possible. When granite was tested, a
constant ratio of granite mass to flux area (22.6 kg/m2) was maintained to maintain as consistent
flux as possible throughout testing for each chamber. This ratio created a layer about 30 mm thick
on top of the plastic sheeting on top of the ground surface, the concrete slab. Chambers were
simply placed on top of the slab when concrete was tested.
1.4.3. Direct Comparison between AC and RAD7 Techniques in the Same Chamber
AC canisters were placed directly on top of the source surface (concrete slab or granite
aggregate) and exposed during the same time the RAD7 sampled Rn in the chamber. Initially,
five tests were run under identical conditions to establish a baseline. Tests were conducted with

10
the large (A = 2.32 m2) chamber, a layer of granite and no plastic sheeting, which produced a
consistent flux of 6.0 Bq/m2-h, and 48 h exposure time. Next, several variables were altered to
observe any differences in measured Radon between the two techniques. The flux area,
magnitude of flux, and time of exposure were all varied to observe any differences in measured
Rn between AC and RAD7 methods.
1.4.4. Effects of water vapor exposure on AC measurements
AC canisters were pre exposed to varying relative humidity (RH) conditions to determine the
effects of water vapor exposure on Radon measurements using AC measurement approach. Two
canisters were placed in sealed containers (0.004 m3) with different super saturated salt solutions
to produce RH ranging from 10 to 90% RH at 10% intervals (Figure 1.6). The AC canisters were
allowed to equilibrate for 2 d in the controlled vapor pressure environments and were then all
placed simultaneously inside the large chamber with a layer of granite and no plastic sheeting
(Figure 1.7). The canisters were then sent to RTCA to be analyzed for the amount of moisture
gained and Rn concentration to be compared directly to the buildup measured by the RAD7.
1.5. RESULTS
1.5.1. Concentration Buildup Curves
A total of 32 tests to measure Radon concentration buildup curves were run using the granite
source and 28 tests were run using the concrete source. Examples of concentration build up
curves from each chamber size with the granite aggregate as the Rn source are shown in Figure
1.4. The dashed tangent lines estimate the initial slope (Me) using a manual curve fitting approach.
Solid lines are best fit curves obtained by least-squared regression by optimizing Jo and λeff.
Results from the entire suite of tests are summarized in Table 1.1 for the concrete and in Table
1.2. for the granite.

11
Tests using all four chamber sizes yielded an average Rn Flux of 3.23 Bq/m2-h for
Wisconsin Red Granite and 4.89 Bq/m2-h for the concrete slab. These values are in good
agreement with other data sets for other types of rock (Chao et al. 1997; Chao and Tung 1999;
Tuccimei et al. 2006), as summarized in Table 1.3.
Results show that the dimensions of the chamber have an effect on the shape and timing
of the buildup curve. As illustrated in Figure 1.8, the equilibrium concentration and the time to
approach that equilibrium systematically increases as the chamber size increases. The large,
small, and extra small chambers all have similar volume to area ratios (0.15, 0.15, and 0.11
respectively), so they can be compared directly (Figure 1.9). The medium chamber has a smaller
volume to area ratio (0.35), and has a differently shaped buildup (Figure 1.10). In general, it takes
longer to reach equilibrium and has a lower initial slope to the other chamber sizes (Figure 1.6).
This difference is inconsequential for calculating initial Rn fluxes from the RAD7 data using either
the manual slope fitting method or least squares regression. As discussed later, however, this
effect can be problematic for AC canister measurements where the buildup of Radon is assumed
to be linear with time during the duration of exposure.
Back diffusion coefficients (D) calculated from regression of for each test are also
presented in Table 1.1. and 1.2. for concrete and granite respectively. D cannot be averaged over
each test because not all tests were run to the point where back diffusion took place. Tests that
were run for less than 24 h in the large chamber, for example, do not show evidence of back
diffusion in the buildup curves and the corresponding buildup curve is linear. When Jo and Cequ
are optimized, D is effectively zero. One test for each the granite and concrete that did run for a
sufficient time to calculate D is presented in Table 1.3. Results for other measured values from
similar materials from other studies are in good agreement.
12
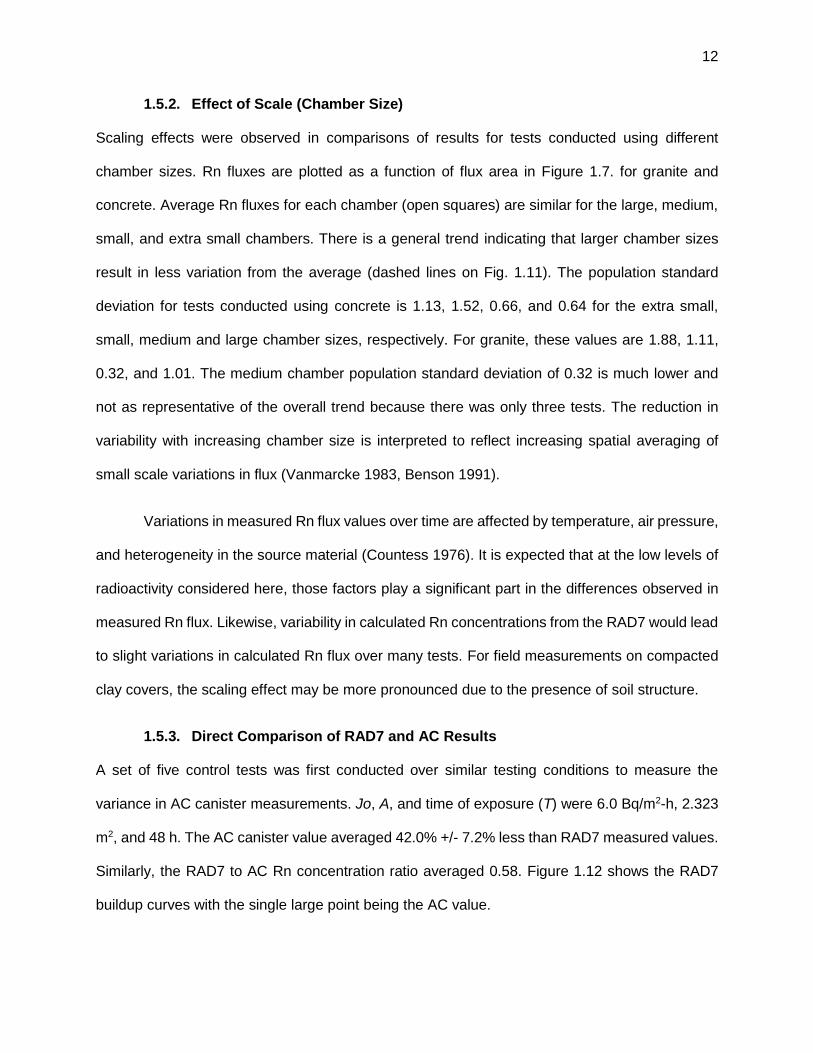
1.5.2. Effect of Scale (Chamber Size)
Scaling effects were observed in comparisons of results for tests conducted using different
chamber sizes. Rn fluxes are plotted as a function of flux area in Figure 1.7. for granite and
concrete. Average Rn fluxes for each chamber (open squares) are similar for the large, medium,
small, and extra small chambers. There is a general trend indicating that larger chamber sizes
result in less variation from the average (dashed lines on Fig. 1.11). The population standard
deviation for tests conducted using concrete is 1.13, 1.52, 0.66, and 0.64 for the extra small,
small, medium and large chamber sizes, respectively. For granite, these values are 1.88, 1.11,
0.32, and 1.01. The medium chamber population standard deviation of 0.32 is much lower and
not as representative of the overall trend because there was only three tests. The reduction in
variability with increasing chamber size is interpreted to reflect increasing spatial averaging of
small scale variations in flux (Vanmarcke 1983, Benson 1991).
Variations in measured Rn flux values over time are affected by temperature, air pressure,
and heterogeneity in the source material (Countess 1976). It is expected that at the low levels of
radioactivity considered here, those factors play a significant part in the differences observed in
measured Rn flux. Likewise, variability in calculated Rn concentrations from the RAD7 would lead
to slight variations in calculated Rn flux over many tests. For field measurements on compacted
clay covers, the scaling effect may be more pronounced due to the presence of soil structure.
1.5.3. Direct Comparison of RAD7 and AC Results
A set of five control tests was first conducted over similar testing conditions to measure the
variance in AC canister measurements. Jo, A, and time of exposure (T) were 6.0 Bq/m2-h, 2.323
m2, and 48 h. The AC canister value averaged 42.0% +/- 7.2% less than RAD7 measured values.
Similarly, the RAD7 to AC Rn concentration ratio averaged 0.58. Figure 1.12 shows the RAD7
buildup curves with the single large point being the AC value.

13
Jo, A, and T was varied from 0.5 – 6.5 Bq/m2-h, 0.018 – 2.323 m2, and 12 – 96 h. The
results of these tests are summarized in Table 1.4, which includes the AC to RAD7 Rn
concentration. Only in tests were A and Jo was varied (Figure 1.13 and Figure 1.14) was there a
noticeable trend. However, linear regression of the varied Jo data produced an R2 = 0.42 and the
standard deviation of five tests run under the same conditions was 0.044. Both indicate that
increasing the flux is not statistically significant in altering the RAD7 to AC Rn concentration ratio.
For the varied A data, regression produced a R2 = 0.73, but there is not enough data to have
confidence that a true trend exists. More testing is required. The data from varying T is pretend in
Figure 1.15.
The difference between the two techniques appears to be systematic and independent of
changes in Jo, A, and T. It is likely that there is a kinetic factor that must be corrected to better
match the AC canister value to the value inside the flux chamber. A final test was conducted to
maximize the exposure to Radon after the flux chamber was at a constant equilibrium. Four tests
were run in the small flux chambers where the total time of exposure was be 4, 5, 6, and 7 d. 7 d
was the maximum time of exposure recommended by RTCA to calculate Rn concentration.
The same variability in the average AC to RAD7 Rn concentration ratio for the 4, 5, 6, and
7 d tests was observed, 0.65. Figure 1.16 also shows that the 5 and 6 d tests show an increase
in Rn concentration near the end of the test. This increase in Radon may be attributed to changes
in air pressure or temperature. This compromises the underlying assumptions in this test’s
objective and limits its use in determining if at any point the two measurement techniques will
have measured values will less than the spread of 0.48-0.83 RAD7 to AC Rn concentration ratio.
Despite this, it is much more likely that there is a systematic issue in directly comparing
with AC canisters and RAD7 methods. The AC canisters are constructed and measured for
residential use. The sampling environment (typically a basement) is assumed to be essentially

14
constant over the exposure time. The flux chambers used in this study have vastly different
volumes and build up Rn concentration during exposure. It is expected that these factors create
a systematic error in the correction factors used by RTCA.
1.5.4. Effects of Pre-exposure to Water Vapor
The AC canisters pre exposed to water vapor under controlled RH conditions displayed a clear
trend of increasing moisture gained with increasing humidity (Figure 1.17). Water vapor competes
with Radon to occupy sorption sites on the activated carbon (Vargas and Ortega 2007) and as
expected in Figure 1.18, the net counts of measured radon for each canister decreases as RH
was increased. RTCA’s calibration factor is designed to correct for any moisture gained. All AC
canisters were corrected to a narrow range of radon concentrations. The maximum value was
218.5 Bq/m3, the minimum value was 174.4 Bq/m3, and the average was 198.5 Bq/m3. Based on
other AC and RAD7 observations, this is a small band of difference.
While the corrections all lead to a consistent value, that value still did not measure the
same level of radon built up inside the flux chamber. Figure 1.19 presents the RAD7 buildup curve
for the flux chamber that all AC canisters were exposed to. The average AC canister value still
had an AC to RAD7 Rn concentration ratio of 0.60, which is consistent with the previously
discussed AC-RAD7 tandem tests. While RH does play a role in passive sorption, the corrections
used in the lab analysis do account for it consistently, however they do not correct to the same
RAD7 measured Rn concentration.
1.6. SUMMARY AND CONCLUSIONS
This laboratory and mass balance calculation approach has been properly adapted to measure
Rn flux. Measured and calculated flux values of the two source materials yielded Rn fluxes of 3.32
and 4.89 Bq/m2-h for Wisconsin Red granite and a common concrete slab. These values are in
good agreement with other published results of similar materials. It should be stated that an
15
accurate flux of Rn emanating from both Wisconsin Red Granite and the concrete slab used have
never been tested directly. This studies measurements can only be compared to similar materials
measured in other studies. Further testing should be done to ensure that the RAD7 counts
accurately and consistently measure the correct Rn concentration inside the flux chamber.
Similar average Rn fluxes are obtained using small, medium and large flux chambers, but
measurement variability is systematically greater for the smaller chambers. The extra small, small,
medium, and large chambers had 45.4%, 32.5%, 37.8%, and 29.6% variability from the average
flux for the Wisconsin Red Granite. The same chambers had 32.8%, 31.6%, 10.8%, and 11.2%
variability for the concrete slab tested. For field measurements, where structure within the Rn
barrier will be more variable, these trends are expected to be exaggerated. Large flux chambers
(e.g., > 2.0 m2) are recommended to limit measurement variability.
Radon concentrations measured using AC canisters are approximately 30-40% lower than
concentrations measured using the RAD7. The AC to RAD7 Rn concentration averaged 0.58 and
the difference appears systematic. When Jo, A, T and RH were varied, no variable showed
statistically convincing evidence that they were affecting the AC canister’s ability to measure
radon. Most likely, the error is related to a kinetic delay that prevents passive sorption of Rn from
accurately measuring an increasing Rn concentration inside the flux chamber or the correction
factors developed for a relatively static residential basement are not appropriate for these types
of flux chambers where there is a Radon buildup curve.

16
1.7. REFERENCES
ASTM D5093 (2015) Standard Test Method for Field Measurment of Infiltration Rate Using
Double Ring Infiltrometer with Sealed-Inner Double Ring. Annual Book of ASTM Standards,
ASTM International, West Conshohocken, PA.
Albrecht, B. and Benson, C. (2001), Effect of Desiccation on Compacted Natural Clays. J.
Geotechnical and Geoenvironmental Engineering, 127(1), 67-75.
Albright, W., Benson, C., Gee, G., Abichou, T., McDonald, E., Tyler, S., and Rock, S. (2006), Field
Performance of a Compacted Clay Landfill Final Cover at a Humid Site. J. Geotechnical and
Geoenvironmental Engineering, 132 (11) 1393-1403.
Albright, W., Benson, C., Gee, G., Abichou, T., Tyler, S., Rock, S. (2006), Field Performance of Three
Compacted Clay Landfill Covers, Vadose Zone J., 5(6), 1157-1171.
Benson, C. (1991), Predicting Excursions Beyond Regulatory Thresholds of Hydraulic
Conductivity Using Quality Control Measurements, Proc. of the First Canadian Conference on
Environmental Geotechnics, Montreal, May 14-17, 447-454.
Benson, C., Abichou, T., Olson, M., and Bosscher, P. (1995), Winter Effects on the Hydraulic
Conductivity of Compacted Clay, J. Geotech. Eng., 121(1), 69-79.
Benson, C., Albright, W., Fratta, D., Tinjum, J., Kucukkirca, E., Lee, S., Scalia, J., Schlicht, P.,
Wang, X. (2011), Engineered Covers for Waste Containment: Changes in Engineering
Properties and Implications for Long-Term Performance Assessment, NUREG/CR-7028, Office
of Research, U.S. Nuclear Regulatory Commission, Washington, DC.
Benson, C. and Othman, M. (1993), Hydraulic Conductivity of Compacted Clay Frozen and
Thawed In Situ, J. Geotech. Eng., 119(2), 276-294.
Benson, C., Sawangsuriya, A., Trzebiatowski, B., and Albright, W. (2007), Post-Construction
Changes in the Hydraulic Properties of Water Balance Cover Soils, J. Geotech. and
Geoenvironmental Eng., 133(4), 349-359.
17
Chao, C. and Tung, T. (1999), Radon Emanation of Building Material-Impact of Back Diffusion
and Difference Between One-Dimensional and Three-Dimensional Tests. Health Physics 76 (6)
675-681.
Chao, C., Tung, T., Chan, D. and Burnett, J. (1997), Determination of Radon Emanation and Back
Diffusion Characteristics of Building Materials in Small Chamber Tests. Building and
Environment, 32(4), 355-362.
Center for Nuclear Waste Regulatory Analysis (2012), Analysis of Mill Tailings Cover
Performance. Prepared for Nuclear Regulatory Commission, by the Center for Nuclear Waste
Regulatory Analysis, Rockville, MD
Countess, R.J. (1976), Radon Flux Measurment with Charcoal Canister. Health Physics, 31, 455-
456
Daoud and Renken (1999), Laboratory Measurments of the Radon Gas Diffusion Coefficeint for
a Fractured Concrete Sample and Radon Gas Barrier Systems. International Radon
Symposium, Report 14.
DOE (1989), Technical Approach Document. Albuquerque, NM: Prepared for The Uranium Mill
Tailings Remedial Action Program. US Department of Energy, Washington, DC.
Ferry, C., Richon, P., Beneito, A., and Robe, M.C. (2002) Evaluation of the effect of a cover layer
on radon exhalation from uranium mill tailings: transient radon flux analysis. Journal of
Enviornmental Radioactivity. 63, 49-64.
Gervino, G., Bonetti, R., Cigolini, C., Marino, C., Prati, D. and Pruiti, L. (2004), Environmental
Radon Monitoring: Comparing Drawbacks and Performance of Charcoal Canisters, Alpha Track
and E-PERM detectors. Nuclear Instruments and Methods in Physics Research, 518, 452-455.
Hartley, J.N. and Freeman H.D. (1985) Radon Flux Measurements on Gardinier and Royster
Phosphogypsum Piles Near Tampa and Mulberry, Florida. Prepared for US Environmental
Protection Agency. DE-ACO6-76RLO 1830.

18
Othman, M., Benson, C., Chamberlain, E., and Zimmie, T. (1994), Laboratory Testing to Evaluate
Changes in Hydraulic Conductivity Caused by Freeze-Thaw: State-of-the-Art, Hydraulic
Conductivity and Waste Containment Transport in Soils, STP 1142, ASTM, S. Trautwein and
D. Daniel, eds., 227-254.
Oak Ridge Associated Universities (ORAU) (2014), Pilot Study Report for Radon Exhalation
Measurements. Prepared for US Nuclear Regulatory Commission. DCN: 2052-TR-01-0(RFTA
11-016)
Suter, G. (1993), Compacted Soil Barriers at Abandoned Landfill Sites are Likely to fail in the
Long Term. Journal of Environmental Quality, 22 (2), 217-226.
Tuccimei P., Moroni, M. and Norcia, D. (2006), Simultaneous Determination of 222Rn and 220Rn
Exhalation Rates from Building Materials Used in Central Italy with Accumulation Chambers
and Continuous Solid State Alpha Detectors: Influence of Particle Size, Humidity and
Precursors Concentration. Applied Radiation and Isotopes, 64, 254-263.
Ujic, P., Celikovic, I., Kandic, A. and Zunic Z. (2008) Standardization and Difficulties of Thoron
Exhalation Rate Measurements Using an Accumulation Chamber. Radiation Measurements,
43, 1396-1401.
UMTRCA (2013), Uranium Mill Tailings Radiation Control Act Sites. Office of Legacy
Management, US Department of Energy, Washington, DC.
Vanmarcke, E. (1983), Random Fields–Analysis and Synthesis, MIT Press, Cambridge, MA.
Vargas, A. and Ortega, X. (2007) Influence of Environmental Changes on Integrating Radon
Detectors: Results of and Intercomparsion Exercise. Radiation Protection Dosimetry, 123 (4)
529-536.
Waugh, W., Benson, C., and Albright, W. (2015), Evaluation of Soil Manipulation Methods to
Transform Engineered Earthen Covers for Long-Term Waste Containment" J. Environmental
Quality, doi:10.2134/jeq2015.01.0001.

19
1.8. TABLES
Table 1.1 Summary of all concrete slab tests. Jo averaged 4.89 Bq/m2-h over all tests. The back diffusion coefficeint (D) cannont be averaged across all tests because not all tests were run to equilibrium.
Chamber
Flux Area Jo (Av) Jo (Best Fit) Jo (Me) Me
[m2] (Bq/m2-h) (Bq/m2-h) (Bq/m2-h) (Bq/m3-h)
Extra Small
0.018
3.0 2.5 3.5 23.2
4.1 2.9 5.2 48.1
2.7 2.2 3.1 28.6
2.5 2.1 2.8 26.3
2.5 2.2 2.7 25.4
5.8 5.9 5.7 52.6
5.4 4.0 6.8 63.4
Small 0.071
8.1 7.9 8.3 54.6
3.7 3.6 3.7 24.0
4.1 3.7 4.4 28.9
5.8 5.2 6.3 41.6
6.5 4.2 8.8 57.6
6.4 8.7 4.1 26.9
Medium 0.590
6.3 5.8 6.8 19.1
4.3 4.5 4.0 11.6
4.9 4.4 5.5 15.8
5.0 4.8 5.2 14.9
5.4 4.9 5.9 16.9
5.4 4.4 6.5 18.8
4.1 4.2 4.1 11.7
4.6 4.5 4.7 13.7
Large 2.323
6.5 6.4 6.5 42.7
5.3 4.9 5.7 37.3
4.7 5.1 4.2 33.9
5.7 5.0 6.4 42.5
4.4 4.3 4.5 29.5
4.9 4.6 5.2 34.5
5.2 5.2 5.2 34.2
20
Table 1.2 Summary of all Wisconsin Red Granite tests. Jo averaged 3.23 Bq/m2-h over all tests. The back diffusion coefficeint (D) cannont be averaged across all tests because not all tests were run to equilibrium.
Chamber Area Eo (Av) Eo (Best Fit) Eo (Me) Me
[m2] (Bq/m2-h) (Bq/m2-h) (Bq/m2-h) (Bq/m3-h)
Extra Small
0.018
7.1 6.6 7.5 69.6
2.4 2.0 2.7 25.1
3.4 3.3 3.4 31.5
6.2 6.6 5.7 53.2
2.5 2.1 2.9 26.8
2.7 2.7 2.6 23.8
Small 0.071
6.4 4.8 8.0 52.6
3.5 3.6 3.3 22.9
4.4 3.7 5.1 33.4
1.7 1.8 1.5 9.7
3.9 3.2 4.5 29.4
2.9 2.7 3.1 18.1
1.8 1.2 2.3 14.8
5.3 4.0 6.5 42.6
2.4 2.2 2.6 16.8
2.8 1.7 3.9 25.6
3.4 2.0 4.7 31.1
Medium 0.590
2.5 2.0 3.0 8.7
1.8 1.7 1.8 5.3
2.4 2.1 2.6 7.5
Large 2.323
4.6 4.3 4.8 31.6
4.8 4.7 4.8 31.6
4.5 4.4 4.5 29.7
2.5 2.3 2.6 16.9
2.0 2.2 1.8 11.8
2.6 2.2 2.9 19.3
2.0 2.2 1.8 11.7
4.3 4.7 3.8 25.0
2.9 2.6 3.1 20.2
2.4 2.4 2.4 15.9
2.8 2.3 3.2 21.0
2.5 2.5 2.5 16.6

21
Table 1.3 Rn Fluxes from granite, tuff, and volcanic ashes.
Source Rn Flux, J
Diffusion Coefficient, D
(Bq/m2-h) (pCi/m2-h) (1/h)
This Study Wisconsin Red Granite 3.23 0.030 6.27E-03
Concrete Slab 4.89 0.037 1.66E-03
Chao et al. (1997)
Granite 1 13.42 0.101 7.22E-04
Granite 1, repeat 13.45 0.101 6.55E-04
Granite 2 0.58 0.004 5.40E-03
Concrete Slab 8.69 0.065 6.18E-03
Chao and Tung (1999)
Granite - Highest 13.44 0.101 -
Granite - Lowest 0.38 0.003 -
Granite - Average 1.82 0.014 -
Tuccimei et al. (2006)
Various Tuffs 5.47 - 1.12 0.041 -0.008
-
Rosso Veronese 0.04 0.0003 -
Various Volcanic Ashes 37.08 -
.086 0.278 - 0.007
-
Notes: D for Wisconsin Red Granite and the concrete slab are obtained from a test that ran to
equilibrium. Hyphen indicates data not available.
22
Table 0.1. Summary of all AC-RAD7 direct comparison tests.

23
1.9. FIGURES
Figure 1.1 Photo of a 0.071 m2 Rn flux chamber passively accumulating radon with activated
carbon. This is the standard practice currently used by UMTRCA guidelines.
Figure 1.2 (Left) AC canister placed on granite aggregate Rn source; (right) RAD7 sampling the atmosphere within a large chamber overlying a layer of granite on top of the plastic sheeting.

24
Figure 1.3 Scaled image of the dimensions of each flux chamber.
Figure 1.4 Experimental set up for the small flux chamber.

25
200
400
600
800
1000
1200
1400
1600
1800
0 10 20 30 40 50 60 70
Rn Buildup Curve for a Large Chamber Test
Rn Buildup Curve
Rn C
once
ntr
atio
n (
Bq/m
3)
Time (h)
0
10
20
30
40
50
0 10 20 30 40 50 60 70
Rn Buildup Regression Slopes for a Large Chamber Test
Slopes From Regression
(a) (b) (c)
Regre
ssio
n S
lope
s (
Bq/m
3-h
)
Time (h)
Average = 27.0 Bq/m3
0
50
100
150
200
250
0 10 20 30 40 50 60 70
X/Y Approach to estimate Me
Y/X
Y/X
(B
q/m
3-h
)
Time (h)
Initial Y/X = 40.5 Bq/m3-h
0
0.01
0.02
0.03
0.04
0.05
0 10 20 30 40 50 60 70
X/Y Approach to estimate Me
X/Y
X/Y
(h-m
3/B
q)
Time (h)
Initial X/Y = 0.023,
1/0.023 = 43.5 Bq/m3-h
Figure 1.5 A Rn buildup curve and three approaches to determine Me.
26
Figure 1.6 Two AC canisters placed in the chamber pre exposing them to RH. This chamber has RH of 16% due to the salt bath.

27
Figure 1.7 Experimental set up of AC canisters pre exposed to different RH ready to be exposed
to Rn in the large chamber.

28
Figure 1.8 Radon concentration buildup curves for the concrete slab. One test representative of each chamber is presented.

29
0
500
1000
1500
2000
0 20 40 60 80 100
Comparing Equillibrium Concentrations
Large ChamberSmall ChamberExtra Small Chamber
Radon C
oncentr
ation
(B
q/m
3)
Time (h)
Figure 1.9 If the volume to area ratio is similar between each chamber, the equilibrium concentration increases as the flux area increases.

30
0
500
1000
1500
2000
0 20 40 60 80 100
Comparing Area/Volume Ratios
Large ChamberMedium ChamberSmall ChamberExtra Small Chamber
Radon C
oncentr
ation
(B
q/m
3)
Time (h)
Figure 1.10 The medium buildup curve (half-filled data points) builds slower than the other three chambers that all have a smaller volume to area ratios.

31
0
2
4
6
8
10
0.01 0.1 1 10
Flux (Bq/m2-h)
Average Flux By Chamber (Bq/m2-h)
Flu
x (
Bq/m
2-h
)
Chamber Flux Area (m2)
Average Flux of all
tests = 4.89 Bq/m2-h
0
2
4
6
8
10
0.01 0.1 1 10
Flux (Bq/m2-h)
Average Flux By Chamber (Bq/m2-h)
Flu
x (
Bq/m
2-h
)
Chamber Flux Area (m2)
Average Flux of all
tests = 3.32 Bq/m2-h
Figure 1.11 Rn flux tests as a function of flux area for both concrete (top) and granite (bottom). The average flux for all tests is the flat dashed line. The average flux for each chamber size is the large open square.

32
0
200
400
600
800
1000
1200
1400
0 10 20 30 40 50 60
Tandem Tests Under the Same Conditions
(Large Chamber, 48 Hours, same J)
11_2 Rad711_2 AC11_4 Rad711_4 AC11_16 Rad711_16 AC11_18 Rad711_18 AC2_1 Rad72_1 AC
Rn
Co
nce
ntr
atio
n (
Bq
/m3
)
Time (h)
Figure 1.12 Direct comparison of measured Radon between AC and RAD7 observed data. AC to RAD7 Rn concentration averages 0.58.

33
0
200
400
600
800
1000
1200
0 10 20 30 40 50
Tandem Tests, Area Varied
3_14 ES Rad73_14 ES AC3_14 S Rad73_14 S AC3_14 M Rad73_14 M AC11_16 L Rad711_16 L AC3_8 S Rad73_8 S AC
Rn
Co
nce
ntr
atio
n (
Bq
/m3
)
Time (h)
Figure 1.13 Direct comparison of AC and RAD7 measurements as flux area is varied.
34
0
200
400
600
800
1000
1200
0 10 20 30 40 50
Flux Varied
11_16 6.0 AC
11_16 6.0 Rad7
3_28 1.8 AC
3_28 1.8 Rad7
3_15 0.5 AC
3_15 0.5 Rad7
Ra
don
Co
nce
ntr
atio
n (
Bq/m
3)
Time (h)
Figure 1.14 Direct comparison of AC and RAD7 measurements as flux is varied. Flux was varied by changing the mass/area ratio.

35
0
500
1000
1500
0 20 40 60 80 100
Tandem Tests, Time is Varied
3_1 12 h Rad73_1 12 h AC2_29 24 h Rad72_29 24 h AC11_16 24 h Rad711_16 24 h AC2_26 72 h Rad72_26 72 h AC3_4 96 h Rad73_4 96 h AC
Rn C
oncen
tratio
n (
Bq
/m3
)
Time (h)
Figure 1.15 Direct comparison of AC and RAD7 measurements as exposure time is varied.
36
0
50
100
150
200
250
300
350
400
0 20 40 60 80 100 120 140 160
After Equillibrium Data
7 Day Rad77 Day AC6 Day Rad76 Day AC5 Day Rad75 Day AC4 Day Rad74 Day AC
Ra
don
Co
nce
ntr
atio
n (
Bq
/m3
)
Time (h)
Figure 1.16 Direct comparison of AC and RAD7 measurements as time after equilibrium was varied. Tests were intended to be run in increasing intervals past equilibrium of Radon concentration inside the chamber. Unintended, the 5 d and 6 d tests show an uptick in Radon near the end of the test.

37
0
5
10
15
20
25
0 20 40 60 80 100
Moisture Gained (g)
Mois
ture
Gain
ed (
g)
Pre-exposed RH
Figure 1.17 Moisture gained on the AC canister increased as the pre exposure Relative Humidity increased

38
1400
1500
1600
1700
1800
1900
2000
2100
0 20 40 60 80 100
Net Counts of Radon (c)
Net
Co
unts
of
Ra
don (
c)
Relative Humidity (%)
Figure 1.18 Passive sorption of Radon decreased as it was pre exposed to higher levels of
Relative Humidity.

39
50
100
150
200
250
300
350
400
0 10 20 30 40 50
RAD7 Measured DataAC Corrected AverageAC Max and Min Values
Ra
don
Co
nce
ntr
atio
n (
Bq/m
3)
Time (h)
Figure 1.19 RAD7 buildup curve from RH variation test. The average corrected AC value was
198.5 Bq/m3, the filled circle. The error bars are the maximum and minimum corrected values
from RTCA’s analysis, 218.5 and 174.7 Bq/m3.

40
Chapter 2
EFFECTS OF WET-DRY CYCLING ON RADON DIFFUSION COEFFICIENTS FOR
COMPACTED CLAYS
2.1. ABSTRACT
Effective Radon diffusion coefficients (DRn) were measured for compacted clay specimens
subjected to wet-dry cycles to quantify the effects of soil structure development on gaseous
Radon diffusion coefficient. A new laboratory apparatus was developed by modifying a flexible-
wall permeameter cell to accommodate circulation and measurement of Radon gas on the top
and bottom boundaries of the specimen. Six clays with varying plasticity index (PI) values (9 < PI
< 26) were compacted at optimum moisture and density conditions to replicate initial placement
conditions common of compacted clay cover systems. All soils tested have been used for actual
cover systems, and thus are considered representative of typical barrier materials. Compacted
clay specimens with dimensions of ~50 mm in thickness and 100 mm in diameter were placed
inside a 100 mm (4”) diameter permeameter cell. Two solid state alpha detectors (RAD7 from
Durridge Company Inc.) were used to continuously measure radon concentrations in two
chambers forming the top and bottom specimen boundaries. The bottom boundary was circulated
with a fixed, source concentration of Radon created by circulating air through a column filled with
granite aggregate. The top boundary was used to monitor buildup of Radon with time as the gas
form the source at the bottom boundary diffused through the specimen. About 24 h was needed
to determine a radon flux and calculate corresponding diffusion coefficient. Samples could be
tested multiple times to produce replicate data by periodically purging the top boundary and
reinitializing subsequent build up curves.

41
Effective radon diffusion coefficients were measured after initial compaction of specimens
at optimum water content, after the specimens were fully saturated, and after the specimens were
dried in an oven at 50 °C. Specimens were subjected to four wet-dry cycles between full saturation
and drying at 50 °C. Diffusion coefficients were measured at each step in the cycle. Measured
effective diffusion coefficients for the six clays ranged from 3.98E-7 m2/s to 1.24E-9 m2/s. Diffusion
coefficients at full saturation were systematically about 0.9 to 0.3 orders of magnitude less than
for oven dried conditions. The difference between the oven dried and fully saturated samples
ranged from 3.28E-7 m2/s and 6.76E-8 m2/s. For the presented data, DRn for all six clays do not
show any clear trends with wet-dry cycling. In some cases, DRn decreased significantly after the
first cycle and continued to gradually trend downward with increasing wet-dry cycles. Trends for
the clays of higher plasticity (Denver and KF2, PI = 26) indicated that the dry DRn and saturated
DRn increased and decreased through multiple cycles. For clays of lower plasticity (Lodgement
and Phoenix, PI = 11 and 9 respectively), trends in DRn were essentially constant regardless of
the number of wet-dry cycles. Despite the lack of clear trends, the methodology was found to
produce DRn measurements that are in good agreement with other studies reporting DRn or other
gaseous diffusion coefficients (O2 and CO2) through compacted clay cover materials.

42
2.2. BACKGROND
In 1978, the Uranium Mill Tailings Radiation Control Act (UMTRCA) was passed to manage low-
level radioactive waste tailings. UMTRCA disposal cells are located throughout much of the
western US and are exposed to varying environmental conditions. The UMTRCA act designated
the lifespan of each disposal cell to be 1,000 years. While each UMTRCA site is different, the
primary component of the barrier system is a low-permeability layer, called the Radon Barrier
(Figure 2.1). A supplementary protection layer is designed to limit environmental exposure that
could lead to degradation of the primary Radon barrier. In some cases an additional bedding
layer is present below rip rap or topsoil to support vegetation at the surface.
The Rn barrier is compacted to limit transport of water and gas. Water can leach into the
tailings and seep into the ground water creating a human health risk. However this study will
focus on the transport of a gas, primarily radon. Radon is an airborne, alpha decay contaminant
and the constructed Rn barrier creates a diffusion barrier for radon to pass through.
The radon diffusion coefficient (DRn) is the primary value in determining the Rn barrier
thickness. DRn also quantifies how much radon diffuses through the barrier and out through the
top into the environment (radon flux). This radon flux was measured once the Rn barrier was
completed to comply with the maximum allowable radon flux stipulated by UMTRCA (2664
Bq/m2-h or 20 pCi/m2-s). However, the Center for Nuclear Waste Regulatory Analyses (2012)
conducted measurements of radon fluxes many years after at select sites and found that Rn flux
varied from 26,640 Bq/m2-h (200 pCi/m2-s) and as low as 39.9 Bq/m2-h (0.3 pCi/m2-s). Even
though diffusion is heavily controlled by the saturation of the Rn Barrier and this varies
throughout the year, there is the potential that pedogenisis (structural development in response
to soil formation processes) is degrading the Rn barrier, especially over long periods of time
(20+ years).
43
At these time scales, Suter (1993), Benson et al. (2007), and Waugh et. al (2015) have
all observed degradation of compacted clay cover systems. Freeze-thaw cycles, wet-dry cycles,
and bio-intrusion are all potential sources that could compromise the Rn Barrier. These
processes are known to alter the hydraulic conductivity of cover systems by several orders of
magnitude (Benson and Othman 1993, Othman et al. 1994, Benson et al. 1995).
Because DRn is a critical value in the initial design and it dictates radon flux through the
top of the cover, it has been measured and analyzed through different testing contexts,
comparing field measurements to lab measurements, comparing steady state vs transient
calculation approaches and comparing how DRn is different through different borrow materials
selected for the Rn barrier (Kalkwarf et al 1982 and Lepel 1982). Other mine tailings sites also
have data on diffusion coefficients of other gases that can be adapted to measuring radon
diffusion (Elberling et al. 1994 and Aachib et al. 2004). Ideally, these approaches can be used to
correlate lab and in situ measurements and also understand how the Rn barrier is changing due
to environmental factors.
There have been many approaches to model gas diffusion coefficients through soil
media. Elberling et al. (1994) sampled gas concentrations along the profile of the soil column.
However this method requires the sampling points be separated enough to not affect the
diffusion process and requires multiple sensors. Alternative approaches use two sensors to
measure gas concentrations on either side of the soil medium (Lepel et al. 1983; Yanful 1993;
and Jiranek and Hulka 2000). Aachib et al. (2004) flooded one side of the soil medium with O2
and continually purged the other. To begin the test, both chambers on the sides of the soil were
sealed and the concentrations were measured continuously until they reached equilibrium. This
method and solution are applicable for gas species that remain chemically inert with the soil
sample. Because radon has a short half-life (3.8 days), decay must be accounted into the

44
solution and can create complications for transient solutions to track the mass of radon diffusion
from one chamber to the other.
Kalkwarf et al. (1982) compared transient and steady state solutions for Rn diffusion.
Through steady state analysis, two of the four boundary conditions are needed to arrive at a
solution; (a) the initial Rn flux from the bare radon source, (b) the Rn flux from the exit end of the
sample column, (c) the Rn concentration at the entrance of the soils sample, or (d) the Rn
concentration at the exit of the column. These four variables are easy to monitor and control
with a continuous radon monitor (RAD7).
2.3. METHODS AND MATERIALS
2.3.1. Compacted Clays
All six clays used in this study were selected because they all have been used in compacted clay
cover systems and are representative of borrow material used in its construction. The clays have
been used in previous studies (Benson 1995; Albrecht and Benson 2001; Benson 1997) to
quantify changes to hydraulic conductivity in cover systems. The plasticity index values are
summarized in Table 2.1.
2.3.2. Electronic Radon Monitor (RAD7)
Continuous electronic radon monitors employ a solid state alpha detector to measure the alpha
decay chain of Radium. The RAD7 (Durridge Company Inc.) is capable of distinguishing specific
disintegrations to accurately and reliably measure radon. RAD7 devices are common in laboratory
work measuring radon build up in hermetically sealed chambers (Chao et al. 1997; Tuccimei et
al. 2006; Ujic et al. 2008). A common flow rate of 800 mL/min is used to cycle air from the chamber
to the RAD7. Data intervals are specified by the operator, allowing calculation of buildup curves
in radon concentration to calculate the initial radon flux. One hour is a common sampling interval
to maximize data and minimize error. 15 minutes was occasionally used for testing when more

45
data points in the beginning of the buildup curve was necessary. The RAD7 provides a more
robust and useful measurement technique for this application.
2.3.3. Permeameter
Permeameters commonly used for measuring hydraulic conductivity were used to measure DRn.
(ASTM 5084-3). After compaction, wetting, and drying, clay pucks where placed between two
plastic discs, drilled with 3 mm diameter holes spaced 7 mm apart, to provide a stable base and
sufficient air flow (Figure 2.2). Polyvinyl chloride (PVC) tubes were cut into cylinders to act as
chambers that were placed above and below the clay sample. They varied in length but were
generally 30 mm. The base plate of the permeameter and a disc with two ports provided sampling
locations for the RAD7 to measure radon. The entire column of clay and chambers was
surrounded by a flexible wall membrane and sealed with O rings so that the chamber could be
filled with water. 2.5 kPa water pressure was used to provide side wall pressure could ensure that
there would be no side wall leakage and all radon diffused through the clay sample.
Radon sources were connected in line with the bottom chamber of the permeameter and
one RAD7 to provide a constant radon concentration. Wisconsin Red Granite aggregate 40 – 4.75
mm in diameter was placed in 100 mm diameter, 500 mm length PVC tubes. Air tight fittings
where drilled into the tube to provide easy connection to and from the tube. A schematic of the
testing apparatus can be seen in Figure 2.3.
2.3.4. Wet-Dry Cycling Procedure
Clay samples were compacted to standard proctor at optimum water content and max dry unit
weight (ASTM D698). Compacting the samples will match typical initial conditions of clay cover
designs. Data for compaction came from Albrecht and Benson (2001) and from compaction
curves (Figure 2.4) generated for this study. The summary of optimum water content and max dry
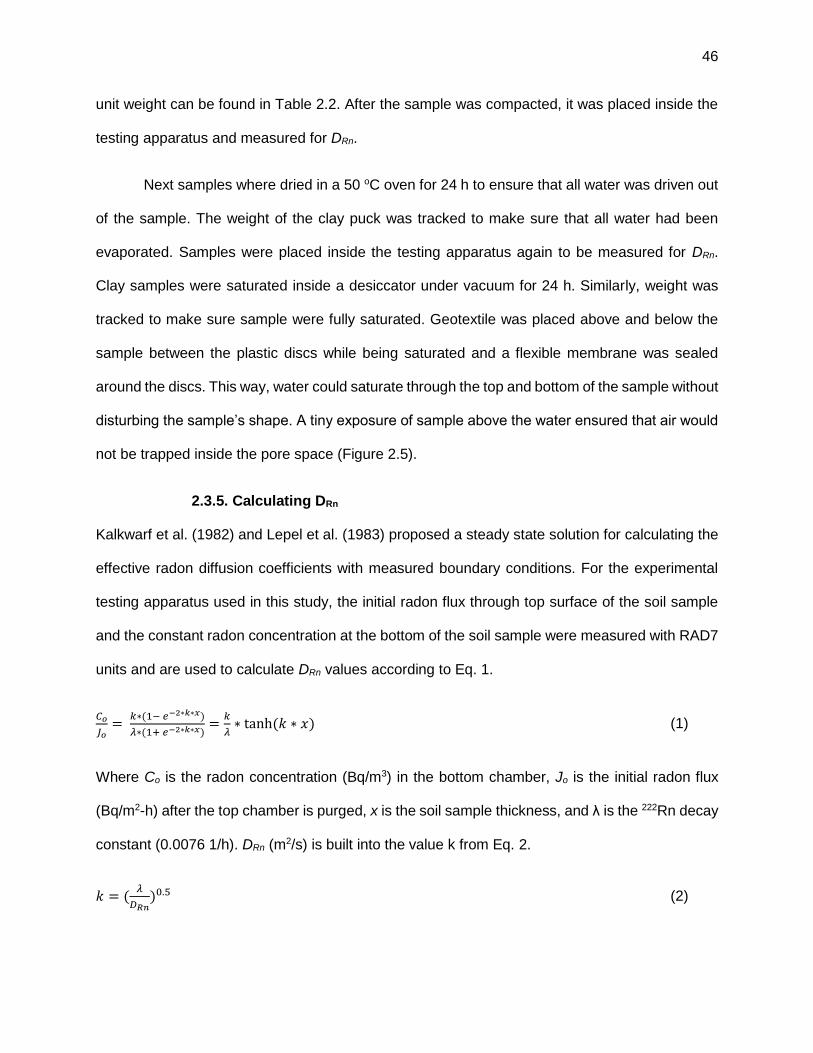
46
unit weight can be found in Table 2.2. After the sample was compacted, it was placed inside the
testing apparatus and measured for DRn.
Next samples where dried in a 50 oC oven for 24 h to ensure that all water was driven out
of the sample. The weight of the clay puck was tracked to make sure that all water had been
evaporated. Samples were placed inside the testing apparatus again to be measured for DRn.
Clay samples were saturated inside a desiccator under vacuum for 24 h. Similarly, weight was
tracked to make sure sample were fully saturated. Geotextile was placed above and below the
sample between the plastic discs while being saturated and a flexible membrane was sealed
around the discs. This way, water could saturate through the top and bottom of the sample without
disturbing the sample’s shape. A tiny exposure of sample above the water ensured that air would
not be trapped inside the pore space (Figure 2.5).
2.3.5. Calculating DRn
Kalkwarf et al. (1982) and Lepel et al. (1983) proposed a steady state solution for calculating the
effective radon diffusion coefficients with measured boundary conditions. For the experimental
testing apparatus used in this study, the initial radon flux through top surface of the soil sample
and the constant radon concentration at the bottom of the soil sample were measured with RAD7
units and are used to calculate DRn values according to Eq. 1.
𝐶𝑜
𝐽𝑜=
𝑘∗(1− 𝑒−2∗𝑘∗𝑥)
𝜆∗(1+ 𝑒−2∗𝑘∗𝑥)=
𝑘
𝜆∗ tanh (𝑘 ∗ 𝑥) (1)
Where Co is the radon concentration (Bq/m3) in the bottom chamber, Jo is the initial radon flux
(Bq/m2-h) after the top chamber is purged, x is the soil sample thickness, and λ is the 222Rn decay
constant (0.0076 1/h). DRn (m2/s) is built into the value k from Eq. 2.
𝑘 = (𝜆
𝐷𝑅𝑛)0.5 (2)

47
DRn is solved iteratively until a suitable solution is found.
Rn flux was calculated using the method discussed in Chapter 1.4.1. When time permitted, the
top chamber was purged after one test so that replicate DRn data could be produced and
compared.
2.4. RESULTS
2.4.1. Desiccation cracks
Figures 2.6 to 2.11 show photos taken after samples were saturated and dried. The dried samples
show clear desiccation cracks. Many times after saturation, the cracks at the surface appear to
fully anneal. Structural changes may be different inside the sample. Additionally, it does not
appear that the extent of desiccation cracking increased as wet-dry cycles are increased.
However, this conclusion is limited since it can only be assessed through visual observation.
2.4.2. Changes to DRn
Calculated DRn values are presented in Figures 2.6 to 2.11 for each of the six clays. The red data
points are the fully dried measurements and the blue data are the fully saturated measurements.
The plots are bounded by the diffusion coefficient of air (1e-5 m2/s) and of water (1e-9 m2/s) at
the top and bottom of each plot (Kalkwarf et al. 1982; Hassan 2009; Ishimori et al. 2013). Since
the pore space with either be comprised of air or water, measurements conducted on the clay
samples should fall within this range. The black, open data point is the DRn measurement taken
after compaction. Each data point in each wet-dry stage is the average DRn of all the tests run and
the error bars show the maximum and minimum value measured at that stage.
The highest DRn was 3.98e-7 m2/s and the lowest value was 1.24e-09 m2/s. The range of
data matches well with similar materials. Lepel et al. (1983) conducted laboratory measurements
on an inorganic, low plasticity clay, representative of an UMTRCA clay cover to be 3.6e-7 m2/s.
Kalkwarf et al. (1982) compared steady state and transient solutions of different soils and found
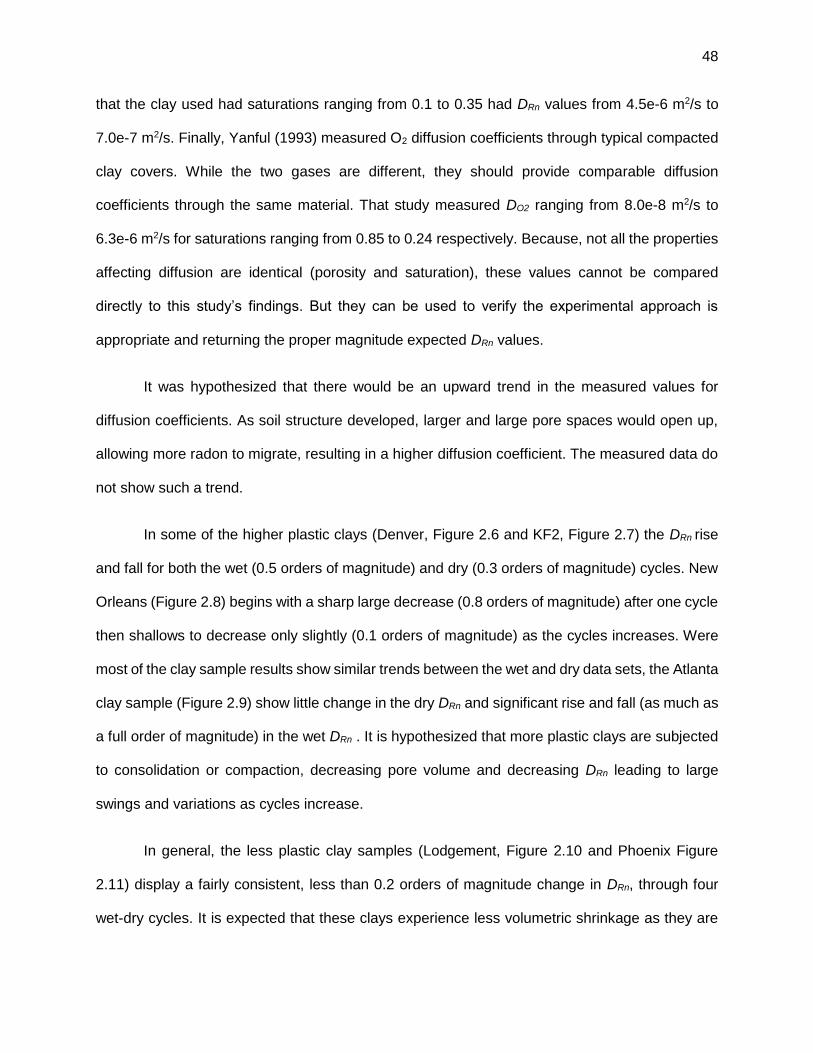
48
that the clay used had saturations ranging from 0.1 to 0.35 had DRn values from 4.5e-6 m2/s to
7.0e-7 m2/s. Finally, Yanful (1993) measured O2 diffusion coefficients through typical compacted
clay covers. While the two gases are different, they should provide comparable diffusion
coefficients through the same material. That study measured DO2 ranging from 8.0e-8 m2/s to
6.3e-6 m2/s for saturations ranging from 0.85 to 0.24 respectively. Because, not all the properties
affecting diffusion are identical (porosity and saturation), these values cannot be compared
directly to this study’s findings. But they can be used to verify the experimental approach is
appropriate and returning the proper magnitude expected DRn values.
It was hypothesized that there would be an upward trend in the measured values for
diffusion coefficients. As soil structure developed, larger and large pore spaces would open up,
allowing more radon to migrate, resulting in a higher diffusion coefficient. The measured data do
not show such a trend.
In some of the higher plastic clays (Denver, Figure 2.6 and KF2, Figure 2.7) the DRn rise
and fall for both the wet (0.5 orders of magnitude) and dry (0.3 orders of magnitude) cycles. New
Orleans (Figure 2.8) begins with a sharp large decrease (0.8 orders of magnitude) after one cycle
then shallows to decrease only slightly (0.1 orders of magnitude) as the cycles increases. Were
most of the clay sample results show similar trends between the wet and dry data sets, the Atlanta
clay sample (Figure 2.9) show little change in the dry DRn and significant rise and fall (as much as
a full order of magnitude) in the wet DRn . It is hypothesized that more plastic clays are subjected
to consolidation or compaction, decreasing pore volume and decreasing DRn leading to large
swings and variations as cycles increase.
In general, the less plastic clay samples (Lodgement, Figure 2.10 and Phoenix Figure
2.11) display a fairly consistent, less than 0.2 orders of magnitude change in DRn, through four
wet-dry cycles. It is expected that these clays experience less volumetric shrinkage as they are

49
saturated and desiccated and do not develop soil structure. Since they maintain a relatively
consistent pore volume, the DRn changes little.
Unfortunately, measured thickness through the wet-dry cycles could not alone be used to
characterize volumetric changes in the pore space. Clay material stuck to the plastic discs
throughout different stages of the procedure, causing continual sample trimming and small
amounts of material to be lost. Additionally, clays fully saturated, especially the more plastic ones,
could easily be jostled or disturbed throughout various steps of the procedure, changing the soil
structure or pore space unintentionally, compromising reliable DRn measurements attempting to
capture changes in soil structure.
2.5. SUMMARY AND CONCLUSTIONS
Overall, there is a high degree of confidence that testing apparatus used is capable of
measuring DRn reliably through soil samples. Measured Rn diffusion coefficients across all clays
ranged from a maximum of 3.98e-7 m2/s to a minimum of 1.24e-09 m2/s. They also fall within
the expected diffusion coefficients boundaries of air (1e-5 m2/s) and water (1e-9 m2/s).
Additionally, they agree well with other measurements on other compacted clay layers,
measuring diffusion of radon or similar gasses. Data cannot be compared directly because the
saturation condition is different, but they can be compared to make sure observations are in the
correct order of magnitude.
The adapted testing apparatus used contains a few distinct advantages to other
research approaches. RAD7 and other continuous radon monitors can measure and record
radon concentration data more accurately for better analysis of Rn flux through the top of the
clay surface. The apparatus also makes it easy for replicate testing trials in the same wet-dry
stage.
50
Unfortunately, there is no evidence to suggest that the wetting and drying procedure
used created the intended desiccation and soil structure desired. None of the clay samples
displayed an upward trend in DRn as hypothesized. However we can see that less plastic clays
showed a flat trend and consistent DRn throughout wetting-drying cycles. On the other hand,
more plastic clays showed more variance in DRn and even developed a shallow decrease in DRn.
It is expected a combination of consolidation, compaction, or disturbance is having a negative
impact on the development of soil structure being measured through steady state diffusion
coefficients measurement.

51
2.6. REFERENCES
Aachib M., Mbonimpa. M, and Aubertin M., (2004) Measurement and Prediction of the Oxygen
Diffusion Coefficient in Unsaturated Media, with Applications to Soil Covers. Water, Air, and Soil
Pollution. 156, 163-193.
ASTM D698 Standard Test Methods for Laboratory Compaction Characteristics of Soil Using
Standard Effort, Annual Book of ASTM Standards, ASTM International, West Conshohocken,
PA.
ASTM 5084 (2003) Standard Test Methods for Measurement of Hydraulic Conductivity of
Saturated Porous Materials Using a Flexible Wall Permeameters. Annual Book of ASTM
Standards, ASTM International, West Conshohocken, PA.
Albrecht, B. and Benson, C. (2001), Effect of Desiccation on Compacted Natural Clays. J.
Geotechnical and Geoenvironmental Engineering, 127(1), 67-75.
Center for Nuclear Waste Regulatory Analysis (2012), Analysis of Mill Tailings Cover
Performance. Prepared for Nuclear Regulatory Commission, by the Center for Nuclear Waste
Regulatory Analysis, Rockville, MD
Benson, C. (1991), Predicting Excursions Beyond Regulatory Thresholds of Hydraulic
Conductivity Using Quality Control Measurements, Proc. of the First Canadian Conference on
Environmental Geotechnics, Montreal, May 14-17, 447-454.
Benson, C. and Othman, M. (1993), Hydraulic Conductivity of Compacted Clay Frozen and
Thawed In Situ, J. Geotech. Eng., 119(2), 276-294.

52
Benson, C., Abichou, T., Olson, M., and Bosscher, P. (1995), Winter Effects on the Hydraulic
Conductivity of Compacted Clay, J. Geotech. Eng., 121(1), 69-79.
Benson, C.H. and Trast, J.M., (1995), Hydrauilc conductivity of thirteen compacted clays, Clays
and Clay Minerals, 43; 669-681.
Benson, C.H., (1997) Hydraulic Characteristics of Barrier Soils for Alternative Landfill Cover
Demonstration, Report Completed for RUST Environmental and Infrastructure.
Benson, C., Sawangsuriya, A., Trzebiatowski, B., and Albright, W. (2007), Post-Construction
Changes in the Hydraulic Properties of Water Balance Cover Soils, J. Geotech. and
Geoenvironmental Eng., 133(4), 349-359.
Benson, C., Albright, W., Fratta, D., Tinjum, J., Kucukkirca, E., Lee, S., Scalia, J., Schlicht, P.,
Wang, X. (2011), Engineered Covers for Waste Containment: Changes in Engineering
Properties and Implications for Long-Term Performance Assessment, NUREG/CR-7028, Office
of Research, U.S. Nuclear Regulatory Commission, Washington, DC.
Elberling B., Nicholson R.V., Reardon E.J., and Tibble, P. (1994) Evaluation of Sulphide Oxidation
Rates: a Laboratory Study Comparing Oxygen Fluxes and Rates of Oxidation Product Release.
Canadian Geotechnical Journal. 31, 375-383.
Hassan N., et al. (2009) Radon Migration Process and Its Influence Factors; Review. J. Health
Physics. 44 (2), 218.

53
Ishimori, Y., Lange K., Martin P., Mayya Y.S., and Phaneuf M., (2013) Measurement and
Calculation of Radon Releases from NORM Residues. Prepared for the International Atomic
Energy Agency. Technical Reports Series Number 474.
Jiranek M. and Hulka J. (2000) Radon Diffusion Coefficient in Radon-Proof Membranes –
Determination and Applicability for the Design of Radon Barriers. International Journal on
Architectural Science. 1, Number 4, 149-155.
Kalkwarf D.R, Nielson K.K., Rich D.C., and Rodgers V.C., (1983) Comparison of Radon Diffusion
Coefficients Measured by Transieint-Diffusion and Steady-State Laboratory Methods. Prepared
for US Nuclear Regulatory Commission. NUREG/CR-2875, NPL-4370, RAE-18-3.
Lepel E.A., Silker W.B., Thomas V.W., Kalkwarf D.R., (1984) Comparison of Field-Measured
Radon Diffusion Coefficients with Laboratory-Measured Coefficients. Prepared for US Nuclear
Regulatory Commission. NUREG/CR-2769, PNL-4414.
Othman, M., Benson, C., Chamberlain, E., and Zimmie, T. (1994), Laboratory Testing to Evaluate
Changes in Hydraulic Conductivity Caused by Freeze-Thaw: State-of-the-Art, Hydraulic
Conductivity and Waste Containment Transport in Soils, STP 1142, ASTM, S. Trautwein and
D. Daniel, eds., 227-254.
Suter, G. (1993), Compacted Soil Barriers at Abandoned Landfill Sites are Likely to Fail in the
Long Term. Journal of Environmental Quality, 22 (2), 217-226.
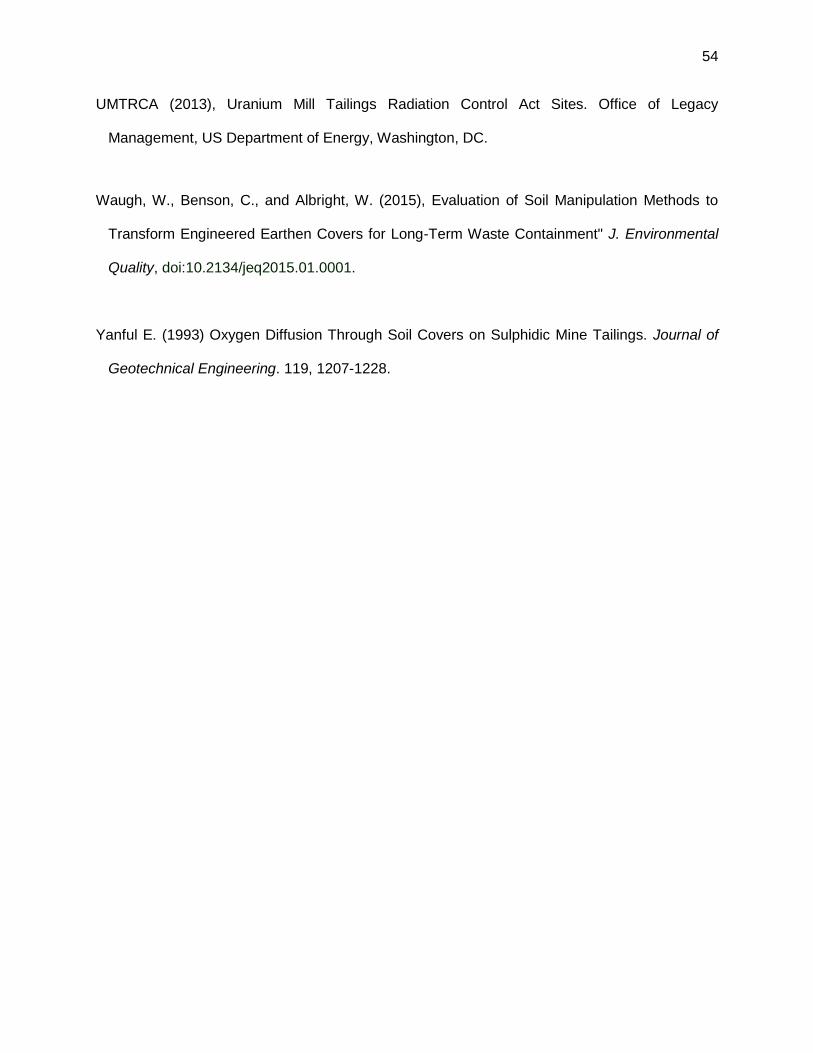
54
UMTRCA (2013), Uranium Mill Tailings Radiation Control Act Sites. Office of Legacy
Management, US Department of Energy, Washington, DC.
Waugh, W., Benson, C., and Albright, W. (2015), Evaluation of Soil Manipulation Methods to
Transform Engineered Earthen Covers for Long-Term Waste Containment" J. Environmental
Quality, doi:10.2134/jeq2015.01.0001.
Yanful E. (1993) Oxygen Diffusion Through Soil Covers on Sulphidic Mine Tailings. Journal of
Geotechnical Engineering. 119, 1207-1228.
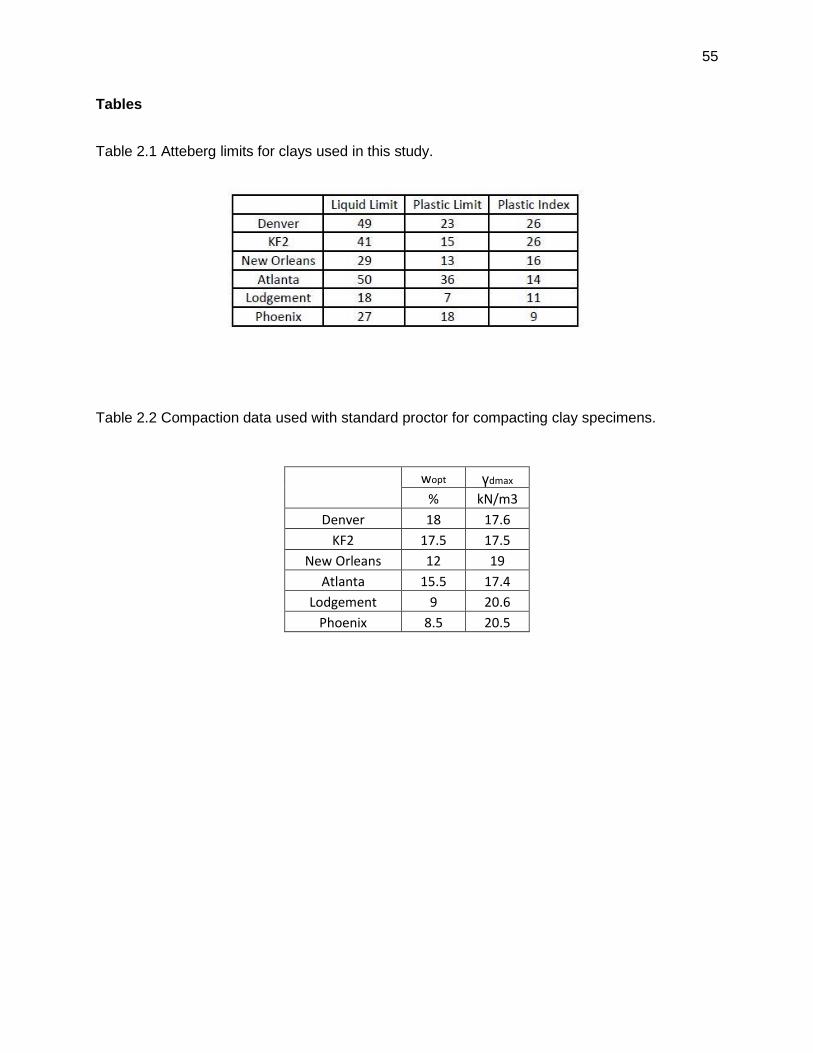
55
Tables
Table 2.1 Atteberg limits for clays used in this study.
Table 2.2 Compaction data used with standard proctor for compacting clay specimens.
wopt γdmax
% kN/m3
Denver 18 17.6
KF2 17.5 17.5
New Orleans 12 19
Atlanta 15.5 17.4
Lodgement 9 20.6
Phoenix 8.5 20.5
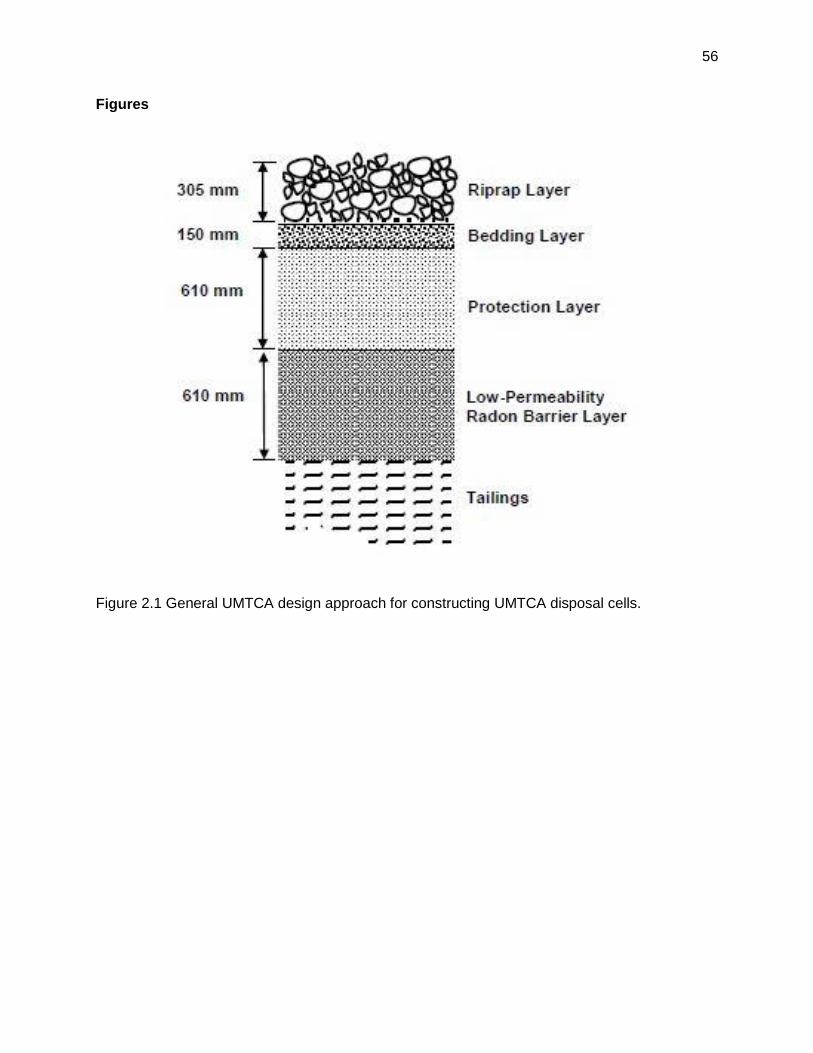
56
Figures
Figure 2.1 General UMTCA design approach for constructing UMTCA disposal cells.

57
Figure 2.2 Testing apparatus used to provide a solid surface inside the permeamter.

58
Figure 2.3 Testing schematic (top) of the permeameter adapted to measure DRn. Air flows from
the RAD7 to the corresponding PVC chamber. The right RAD7 samples the source tube that is
also exposed to the bottom chamber, creating a constant radon concentration.
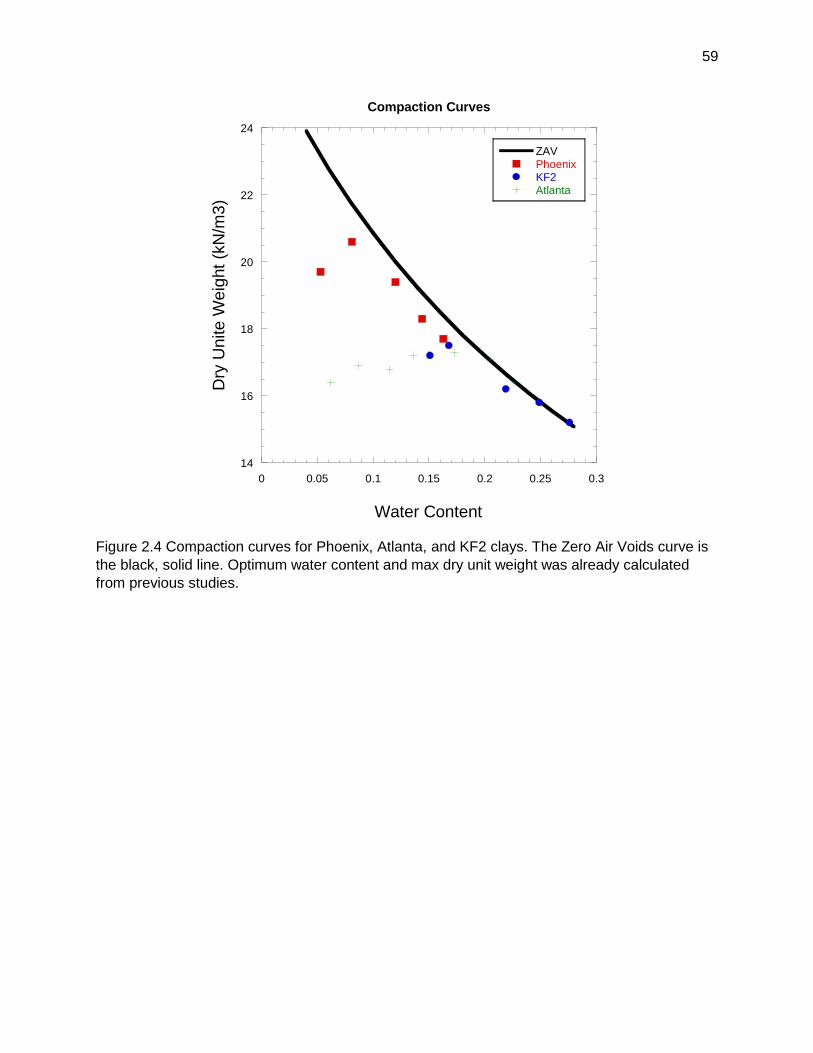
59
14
16
18
20
22
24
0 0.05 0.1 0.15 0.2 0.25 0.3
Compaction Curves
ZAVPhoenix KF2Atlanta
Dry
Un
ite
We
ight
(kN
/m3
)
Water Content
Figure 2.4 Compaction curves for Phoenix, Atlanta, and KF2 clays. The Zero Air Voids curve is
the black, solid line. Optimum water content and max dry unit weight was already calculated
from previous studies.

60
Figure 2.5 Three clay samples being prepared to be nearly fully submerged in a desiccator
under vacuum to saturate for 24 h.

61
Figure 2.6 Denver effective Radon Diffusion Coefficients.
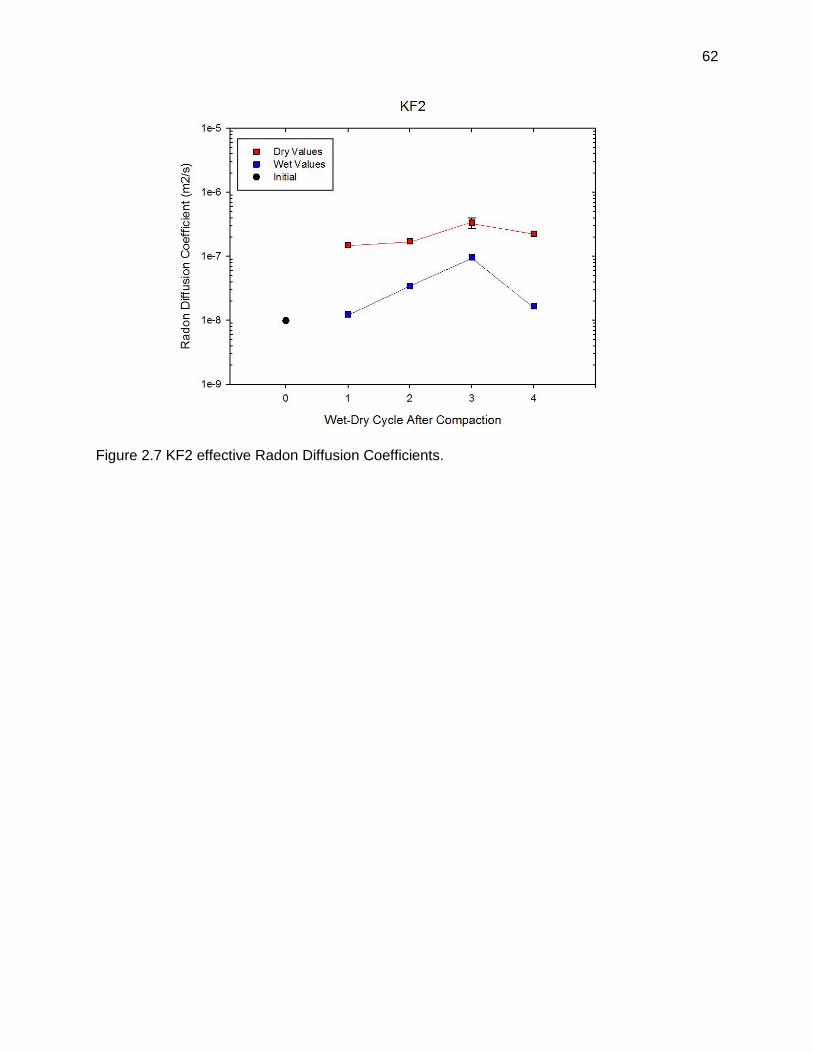
62
Figure 2.7 KF2 effective Radon Diffusion Coefficients.

63
Figure 2.8 New Orleans effective Radon Diffusion Coefficients.
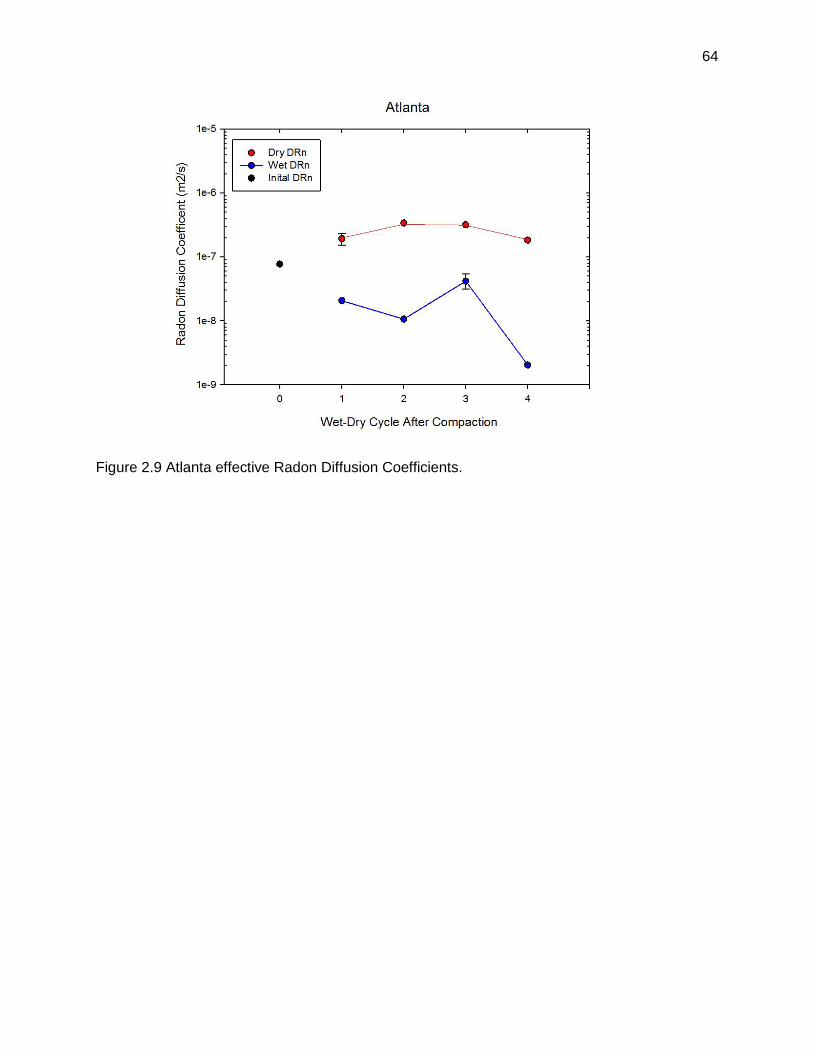
64
Figure 2.9 Atlanta effective Radon Diffusion Coefficients.

65
Figure 2.10 Lodgement effective Radon Diffusion Coefficients.

66
Figure 2.11 Phoenix effective Radon Diffusion Coefficients.

67
APPENDIX A
2. RADON FLUX MEASUREMENTS AT FALLS CITY, TEXAS
A.1. OBJECTIVE
Measurements taken in this study are part of a larger project scope to compare how compacted
clay covers change over long term (>20 years) periods of time driven by environmental factors
(e.g. wet-dry cycles, freeze-thaw cycles, bio-intrusion). The Falls City UMTRCA tailings disposal
cell in Texas was selected as the first site. Falls City contains higher than average radioactivity
and a smaller Radon Barrier (Rn Barrier) thickness compared to other UMTRCA sites. Both traits
are desirable for an initial study when the experimental procedure and set up need to be verified.
Different Test Pits were dug in different locations to compare and contrast varying
conditions. Flux chambers were installed in each pit so that the Radon flux (Rn flux) emanating
through the barrier could be compared. Additionally, activated carbon (AC) canisters were used
in tandem with the RAD7 radon monitors to directly relate the two measurement techniques.
Lastly, excavation through the Rn barrier was completed to install a flux chamber at top of the
tailings. A morphological characterization was also done for each Test Pit but will not be presented
here.
A.2. MATERIALS
UMTRCA cover designs typically employ a compacted clay cover about 1 m (3 ft) over the
Uranium tailings with a protection layer, typically 0.5 m (1.5 ft), above to limit environmental
exposure of wet-dry cycles and root penetration. The Falls City cell closely matches this design.
Figure A.1 shows the design thicknesses for each layer at three different locations across the site.

68
Test Pit locations were selected to contrast the different designed layer thicknesses,
surface conditions, and protective layers which will affect long term changes to the Rn barrier.
Test Pits span the three different design thicknesses across the site. The top of the cell is covered
with shallow grasses (Figure A.2) and intermittent mesquite brush. Mesquite has a woodier and
more widespread root structure that has the potential to reach the Rn barrier (Figure A.3).
Mesquite is managed and cut each season but its root structure remains even if the surface
structures are removed. The top of the cell has the thickest total cover system (Figure A.1.a).
Slopes are covered with large stone (about 20 cm on average) that limit vegetative growth (Figure
A.4) near the top, the rock top layer flattens out and transitions into the vegetative top slope for
about 10 m (30 ft). The design called for a 1 ft rock layer (Figure A.1.b). However, it was
discovered to be thicker, about 2 ft. The side slope contains the thinnest cover system, with a 12
in rock layer, 6 in sandy bedding layer, and a 24 in Rn barrier. In 1996, when the Rn barrier was
completed, AC flux measurements were conducted in a 100 ft grid and were also used to pick
Test Pit locations, prioritizing areas that had higher Rn flux readings.
The same RAD7 (Durridge Company Inc.) measurement devices were used as continuous
radon monitors that were used in Chapter 1. AC canisters were also used to measure radon. They
were placed inside flux chambers so that the measured radon and corresponding Rn Flux could
be compared directly.
Four different Radon flux chambers were used. Similar to Chapter 1, they were named
Large, Medium, Small, and Extra Small with the flux areas, A = 2.32 m2, 0.590 m2, 0.071 m2, and
0.018 m2 respectively (identical to Chapter 1).
A.3. PROCEDURE AND METHODOLOGY
A walkthrough of the Falls City UMTRCA disposal cell was first done to identify where the Test
Pits would be located. Post construction AC measurements within the completion report submitted
69
in 1996 were also used to identify important conditions. Figure A.5 identifies the approximate
locations of each Test Pit that was excavated. The Rn flux across the whole site ranged from 0.1
pCi/m2-s to 4.4 pCi/m2-s, though the average 0.51 pCi/m2-s. Table A.1 provides summarized
rational for each Test Pit location. Test Pits 1 and 2, 3 and 4, and 5 and 6 where located close, <
8 m, to each other to try and match the same underlying tailings concentration so that the other
selected conditions could be compared directly (e.g. presence of woodier vegetation or shallow
grass).
Once the Test Pit location was selected, an excavator was used to remove the top soil
and protective layer above the Rn Barrier. In most cases, excavation stopped based on a
measured depth rather than visual cues because material differences between the protective
layer and Rn barrier were extremely difficult to delineate. The surface was then smoothened and
flattened as much as possible for installation of the flux chambers.
Four different flux chambers were used, large, medium, small and extra small. All four
chambers were sealed with moistened bentonite slurry to prevent Radon leakage under the flux
chamber edge. Once sealed, all four chamber sizes were installed with a RAD7 unit to begin
measuring the buildup of Radon. Each large and small chamber were given an AC canister to
passively adsorb Radon during the time of the measurement. Figure A.6 displays the general set
up for each Test Pit at the surface of the Rn Barrier. Buildups where ideally started in the morning
and stopped the following morning for an approximate 24 h test. However due to time and
logistical restrictions, this was not always possible. Rn fluxes can be calculated with less data
points, but the more data, the more reliable and easier the calculation. In some instances, the first
test failed either due to RAD7 error or an ineffective seal. When possible the chamber was purged,
the seal fixed, and measured again for Rn buildup. These tests were only about five hours in
length due to logistical constraints. The methodology and approach to calculating Rn flux from
the two measurement techniques was identical to Chapter 1. Several thin wall sampling tubes

70
were also driven into the Rn barrier. These tubes would later be used to profile water content into
the Rn barrier.
Next, a hole was dug through the Rn Barrier big enough for the small flux chamber to be
sealed directly on top of the tailings. An AC canister and RAD7 were installed and allowed to build
up Radon inside the chamber. Likewise, tests were run for 24 h. But due to logistical and timing
constraints tests where occasionally shortened.
Other supplementary tests were also being done in tandem with these Rn flux
measurements. Morphological observations in the pedogenisis of the clay cover were conducted
by other researchers to further quantify how different Rn Barrier thicknesses or vegetation affect
long term soil structure changes in UMTRCA compacted clay covers.
A.4. RESULTS
A.4.1. RAD7 Buildup Curves
In total, six Test Pits with four different sized flux chambers were excavated to compare several
different variables that could affect changes in soil structure in the clay cover. Figures A.7 – A.12
contain the buildup curves for each Test Pit (1 to 6 respectively) for each chamber size. The blue
data are each measurement taken at the top of the Rn Barrier and the red data are the small
chambers that accumulated Radon directly on top of the tailings.
Testing length was designed to be about 24 h. But depending on when the Test Pit was
opened during the day, the time of the test could be shortened. In some cases, poor installation
of the bentonite seal prevented Radon from building up (Test Pit 1 – extra small and Test Pit 2 –
medium) and logistics prevented a second test from being conducted. In other cases, the test
length is limited to about five hours. However, all the buildup curves in Figs. A.7 to A.12 contain
sufficient data to calculate a flux with both calculation approaches from the RAD7 data.

71
All RAD7 tests, including the ones conducted at the bottom of the Rn barrier, are
summarized in Table A.2. The table also presents AC canister flux measurements completed
immediately after the Rn barrier was constructed in 1996. As expected the flux at the top of the
tailings (bottom of the Rn barrier) is significantly higher. The flux measurements conducted at the
top of the Rn barrier are plotted in Figure A.13.
Because there is no other Rn buildup curve data sets like this on UMTRCA sites,
assessing the RAD7 data quality can be challenging. Test Pits 1 to 4 all contain flux
measurements higher than any AC tests conducted in 1996. This should not be too alarming as
the Rn barrier would have been compacted to optimal water content and have been quite wet,
perhaps the wettest it has ever been. Also at that point too, zero structural change had taken
place due to wet-dry cycling. Both of the Test Pit 5 and 6 contain significantly lower Rn fluxes but
are on the same scale as the 1996 measurements. Not surprisingly, the water content is much
higher for these two Test Pit (discussed later). Water content or saturation is a critical component
in determining Rn flux and it should be no surprise that the Test Pit with the higher water content
contain lower Rn fluxes. The presented Rn fluxes are one data point in time making it difficult to
compare directly to the 1996 measurements.
Additionally, an effect of scale due to soil structure is difficult to parse out with this data
set alone. However, each flux test has been normalized to account for the large differences in
magnitude for all the measured fluxes. All tests run in each tests pit were averaged. The ratio of
each Rn flux to its corresponding Test Pit average is plotted in Figure A.14. The one data point
that falls outside of the dashed lines was a medium chamber test that produced a noticeably
significant low flux. It is presumed that this test was not sealed adequately and that the calculated
flux is not representative of the actual flux present at that time. When testing was going on, it was
documented and observed that the medium chamber wall was less rigid than the other chambers.

72
This same issue led to a failed medium chamber test in Test Pit 2 and it is not unreasonable to
suspect that a similar issue occurred with this medium chamber in Test Pit 4.
The standard deviation of data can also be compared directly with the normalization of
concrete tests run in the laboratory in Figure A.14. Concrete tests have been normalized to the
average flux of the concrete slab. As expected, the field measurements have quite a bit more
spread and variability than the much more homogenous and isolated concrete slab. After
normalization, the concrete slab had population standard deviations of 0.37, 0.20, 0.14, and 0.09
for the extra small, small, medium, and large chambers respectively. The field Rn flux chambers
are 0.95, 0.35, 0.52, and 0.42. Both sets of data show downward trends in standard deviation
while, as expected, the field measurements are larger due to the significantly more heterogeneous
composition of the compacted clay layer.
A.4.2. Activated Carbon Canister Measurements
AC canisters were run in tandem with RAD7 buildup curves, but not all buildup curves were
reliable enough to compare to AC directly. In several instances, the Rn concentration built up
normally but then dropped suddenly, only to rise back up again. It is expected that nightly storm
fronts supplied pressure changes affected the transport of Rn from the tailings into the flux
chamber. It would be inappropriate to attempt to directly compare the end RAD7 data to the AC
canister concentration. Similarly, second tests were run inside flux chambers due to RAD7 errors
or poor bentonite seals that leaked too much radon. Rn fluxes where still calculated from the
RAD7 because the whole curve is not needed; only the initial points in the buildup curve. But for
AC methods, they cannot be used with any degree of confidence.
The six successful tests are summarized in Table A.3. The AC to RAD7 Rn Concentration
ratio ranged from 0.49 to 0.69 with an average of 0.60. This range and average agrees well with

73
laboratory measurements discussed in Chapter 1. Even in the field measurements, there appears
to be a systematic biasing where AC canisters consistently measure less radon then the RAD7.
Figure A.15 presents the AC and RAD7 buildup data for three of the discussed tests. The
blue data - RAD7 build up show a decrease in concentration near the end of the test. This was
due to a low battery in the RAD7 unit and the max value of Rn concentration was presumed to be
the actual concentration inside the flux chamber. The results agree well with the similar laboratory
tests.
Upon review of the data, it is clear that the AC data, as analyzed by RTCA and as
presented here, should not be used to determine Rn flux. To determine Rn flux with one data
point at the end of an exposure period, it must be assumed that the buildup curve is linear. This
slope can then be used identically to the Me approach in calculating a flux with RAD7 data. In
practicality, Eq. 7 from Chapter 1 achieves the same thing and is used to convert the AC data into
flux data.
Figure A.16 show the initial slope for the RAD7 data and the assumed linear buildup
measured with AC. For Test Pit 6, the large chamber, the slopes are 398.2 and 171.6 Bq/m3-h.
Those values correspond to 0.59 and 0.195 pCi/m2-s respectively. The other six successful Rn
flux comparisons are summarized in Table A.3. At best, the AC to RAD7 Rn flux ratio is 0.38, a
significant difference in observed flux. As could be expected, the two large chamber tests
performed better (0.24 and 0.38) than the small chambers with an average ratio of 0.07, nearly a
full magnitude of difference. Large chambers take longer to be affected by back diffusion and
maintain the linear regime longer than small chambers. AC canisters have severe limitations in
the lab analysis and procedure used here but because the Rn concentration is systematic,
corrections can be used to provide more accurate data measurements.

74
A.4.3. Water Content Profile
Two to three Shelby tubes where driven into the top of the Rn barrier to collect water content data.
Clay pucks, about 30 mm were extruded and assessed for gravimetric water content according
to ASTM D2216 – 10. All six profiles are summarized in Figure A.17. Paired Test Pits are similar
shades of color and generally agree well with each other. The high degree of scatter in TP 1A,
2A, and 4A is expected to be due to pre-existing clay structure from the burrow source for the Rn
Barrier.
It was observed that much of the original clay structure in the borrow source was still intact.
Clumps (as big as 50 mm in diameter) could easily be identified within the Rn barrier. When the
barrier was constructed, this burrow material was not kneaded enough and is has distinct material
properties compared to the rest of the barrier, water content being one of them. Additionally, this
orginal structure was much higher strength and made it difficult to impossible to maintain clean
cuts of clay pucks when extruding the Shelby tubes. As a result, it was difficult to get accurate
bulk unit weight data.
Finally, some roots were observed in two of the Shelby tubes sampled through the Rn
barrier. Small roots (about 1 mm in thickness) were observed in the first 30 mm of tube TP1A
(Figure A.18). They were also found throughout the whole profile of TP3A. TP3A also had a few
large roots (5 mm in thickness) found 150 mm deep into the tube (Figure A.19). Perhaps because
clear evidence of roots, the slight increase in average Rn flux from Test Pit 1 to Test Pit 2 and
much large increase in Rn flux from Test Pit 3 and Test Pit 4 can be attributed to this bio intrusion.

75
A.5. CONCLUSIONS
Field measurements were conducted to evaluate Rn flux under several different conditions the
Rn barrier is exposed to. Four different chamber sizes where used to compare scale effects and
determine best variability in collected data. AC canisters were used in tandem with several RAD7
measurements to compare the two measurement techniques. Based on the collected data,
several conclusions can be made.
The RAD7 experimental set up can be used to effectively and reliably to measure Rn flux.
This approach provides a continuous buildup in concentration that provides more data and a
superior window into calculating Rn flux that AC cannot provide. More data is needed to have a
higher degree in confidence in the scaling effects observed. But, they follow the same pattern as
lab data. With this data set, Test Pit 1 (and to a lesser extent Test Pit 3 and 5) demonstrate that
as the chamber size decreases, the Rn equilibrium concentration increases, also congruent with
lab data. Additionally, normalizing flux values to the Test Pit average shows that the larger the
chamber, the less variability with repeated measurement, also identical to laboratory results.
Finally, the presence of woodier, deeper penetrating root systems do slightly affect Rn flux when
those roots penetrate the Rn barrier as observed with comparing Test Pits 1 and 2 and Test Pits
3 and 4.
AC used as a measurement technique must be properly calibrated to be used reliably.
Clearly, there appears to be a systematic error of AC measuring less radon then RAD7 (the AC
to RAD7 Rn concentration ratio averaged 0.60). This is consistent with similar laboratory
measurements and possibly stems from a kinetic delay or inappropriate use of correction factors.
As radon flushes into the chamber, it takes time before it is properly equilibrated with the AC.
From reviewing the AC measurements conducted after the Rn barrier was initially constructed in
1996, it does appear that calibration to a standard was done for their measurements. However,
each flux chamber experienced significant back diffusion well after 7 h in ever flux chamber. The
76
longer the test, the shallower the slope and less accurate it gets from the actual flux that can be
reliably calculated from the RAD7 buildup curves. Even if the radon concentration perfectly
matches the RAD7 data, the flux will still be inaccurate when compared to the RAD7 data. From
this data set, it would be recommended that AC tests should not run past 7 h, though this could
be adjusted depending on the chamber size and initial Rn flux.

77
TABLES
Table A.1 Test Pit conditions selected to be compared. Test Pits 1 and 2, 3 and 4, and 5 and 6 where located spatially very close, > 10 m, so they could be compared directly.
Test Pit
Condition
Vegetation Tailings Concentration Designed Cover System
1 Mesquite Higher than site average (1.0-4.0 pCi/m2-s) Top of Cell (Figure A.1.a)
2 Shallow Grasses
Higher than site average (1.0-4.0 pCi/m2-s) Top of Cell (Figure A.1.a)
3 Mesquite Site Average (~0.5 pCi/m2-s) Top of Cell (Figure A.1.a)
4 Shallow Grasses
Site Average (~0.5 pCi/m2-s) Top of Cell (Figure A.1.a)
5 None: Rip Rap
Higher than site average (1.0-4.0 pCi/m2-s) Top of Slope (Figure A.1.b.)
6 None: Rip Rap
Higher than site average (1.0-4.0 pCi/m2-s) Side Slope (Figure A.1.c.)
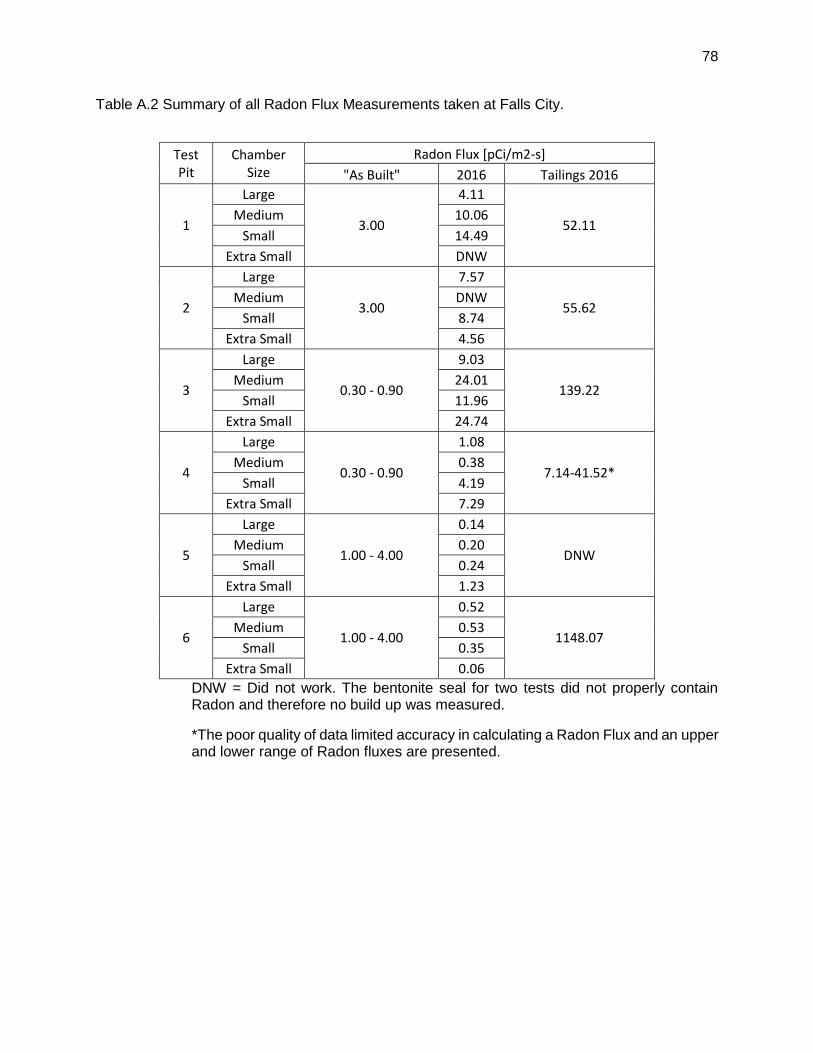
78
Table A.2 Summary of all Radon Flux Measurements taken at Falls City.
Test Pit
Chamber Size
Radon Flux [pCi/m2-s]
"As Built" 2016 Tailings 2016
1
Large
3.00
4.11
52.11 Medium 10.06
Small 14.49
Extra Small DNW
2
Large
3.00
7.57
55.62 Medium DNW
Small 8.74
Extra Small 4.56
3
Large
0.30 - 0.90
9.03
139.22 Medium 24.01
Small 11.96
Extra Small 24.74
4
Large
0.30 - 0.90
1.08
7.14-41.52* Medium 0.38
Small 4.19
Extra Small 7.29
5
Large
1.00 - 4.00
0.14
DNW Medium 0.20
Small 0.24
Extra Small 1.23
6
Large
1.00 - 4.00
0.52
1148.07 Medium 0.53
Small 0.35
Extra Small 0.06
DNW = Did not work. The bentonite seal for two tests did not properly contain Radon and therefore no build up was measured.
*The poor quality of data limited accuracy in calculating a Radon Flux and an upper and lower range of Radon fluxes are presented.

79
Table A.3 Summary of reliable AC-RAD7 direct comparison measurements.
Test Pit Chamber AC
Concentration RAD7 VALUE
Ratio AC/RAD7 Rn
Concentration
Ratio AC/RAD7 Rn Flux
[pCi/L] [Bq/m3] [Bq/m3]
1 Large 418.8 15497 27000 0.57 0.24
1 - Bottom Small 966.2 35750 73400 0.49 0.14
2 Small 195.1 7220 10400 0.69 0.06
4 - Bottom Small 195.4 7228 11800 0.61 0.02
6 Large 76.5 2831 4480 0.63 0.28
6 - Bottom Small 31097.1 1150594 1930000 0.60 0.05

80
FIGURES
Figure A.1 Design Cross Section for the Falls City, TX UMTRCA cover system: (a.) top of cell, (b.) slope apron, and (c.) side slope.
(a.)
(c.)
(b.)

81
Figure A.2 Shallow grasses that cover the Falls City disposal cell. The right part of the picture shows mowed grass.

82
Figure A.3 Woodier vegetation at the surface (mesquite brush) can be seen in clusters.

83
Figure A.4 The top figure shows the transition from the vegetative cell cover to the rock apron.
The bottom image looks up the rock armored slope.

84
Figure A.5 Aerial view of the Falls City UMTRCA cell with each approximate Test Pit location identified.

85
Figure A.6 General layout of each Test Pit with the large, medium, small, and extra small chambers measured Rn build up curves at the top of the Rn Barrier.
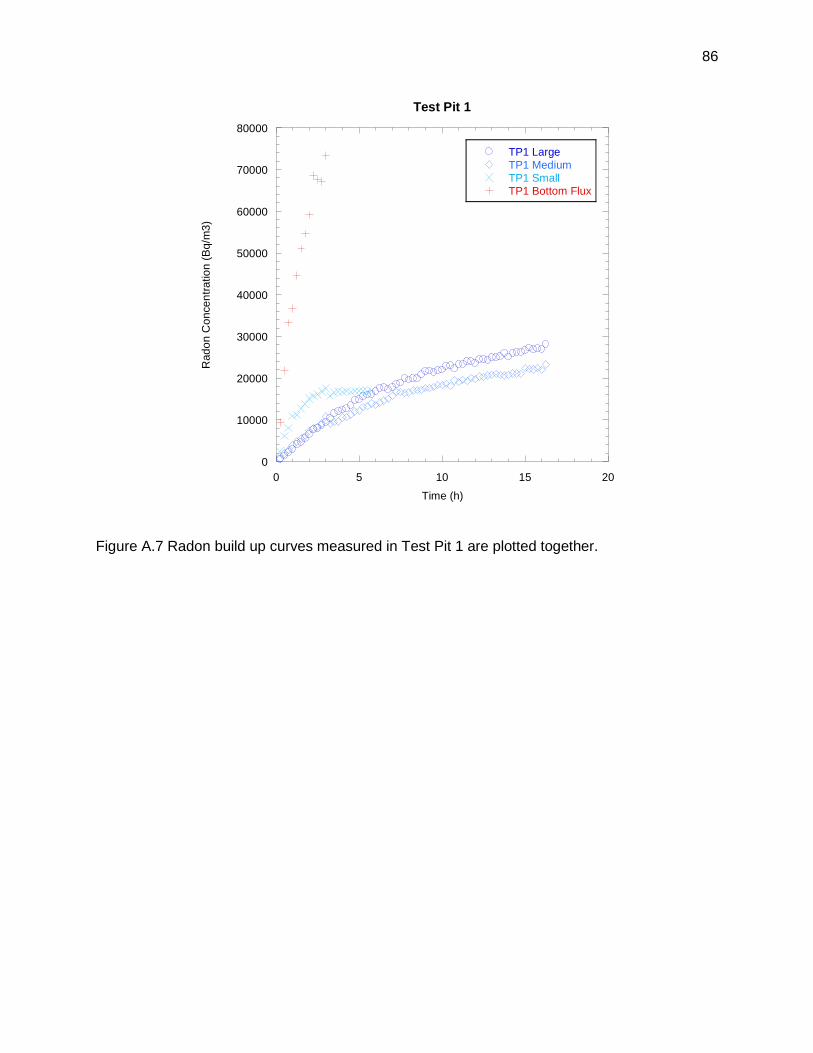
86
0
10000
20000
30000
40000
50000
60000
70000
80000
0 5 10 15 20
Test Pit 1
TP1 LargeTP1 MediumTP1 SmallTP1 Bottom Flux
Rad
on
Co
nce
ntr
atio
n (
Bq
/m3
)
Time (h)
Figure A.7 Radon build up curves measured in Test Pit 1 are plotted together.

87
0
10000
20000
30000
40000
50000
60000
0 5 10 15 20
Test Pit 2
TP2 LargeTP2 SmallTP2 Extra SmallTP 2 Bottom Flux
Rad
on
Co
nce
ntr
atio
n (
Bq
/m3
)
Time (h)
Figure A.8 Radon build up curves measured in Test Pit 2 are plotted together.

88
0
50000
100000
150000
200000
0 5 10 15 20
Test Pit 3
TP3 LargeTP3 MediumTP3 SmallTP3 Extra SmallTP3 Bottom Flux
Rad
on
Co
ncen
tra
tio
n (
Bq
/m3
)
Time (h)
Figure A.0.2
Figure A.9 Radon build up curves measured in Test Pit 3 are plotted together.

89
0
5000
10000
15000
20000
0 5 10 15 20
Test Pit 4
TP4 LargeTP4 MediumTP4 SmallTP4 Extra SmallTP4 Bottom Flux
Rad
on
Co
nce
ntr
atio
n (
Bq
/m3
)
Time (h)
Figure A.0.3
Figure A.10 Radon build up curves measured in Tit Pit 4 are plotted together. The abnormal rise and fall of the large chamber buildup curve is expected to be due to a large drop in ambient air pressure from a storm front that moved in after installation.

90
0
1000
2000
3000
4000
5000
6000
7000
0 5 10 15 20
Test Pit 5
TP5 LargeTP5 MediumTP5 Small TP5 Extra SmallTP5 Bottom Flux
Rado
n C
on
cen
tration
(B
q/m
3)
Time (h)
Figure A.11 Radon build up curves measured in Test Pit 5 are plotted together.
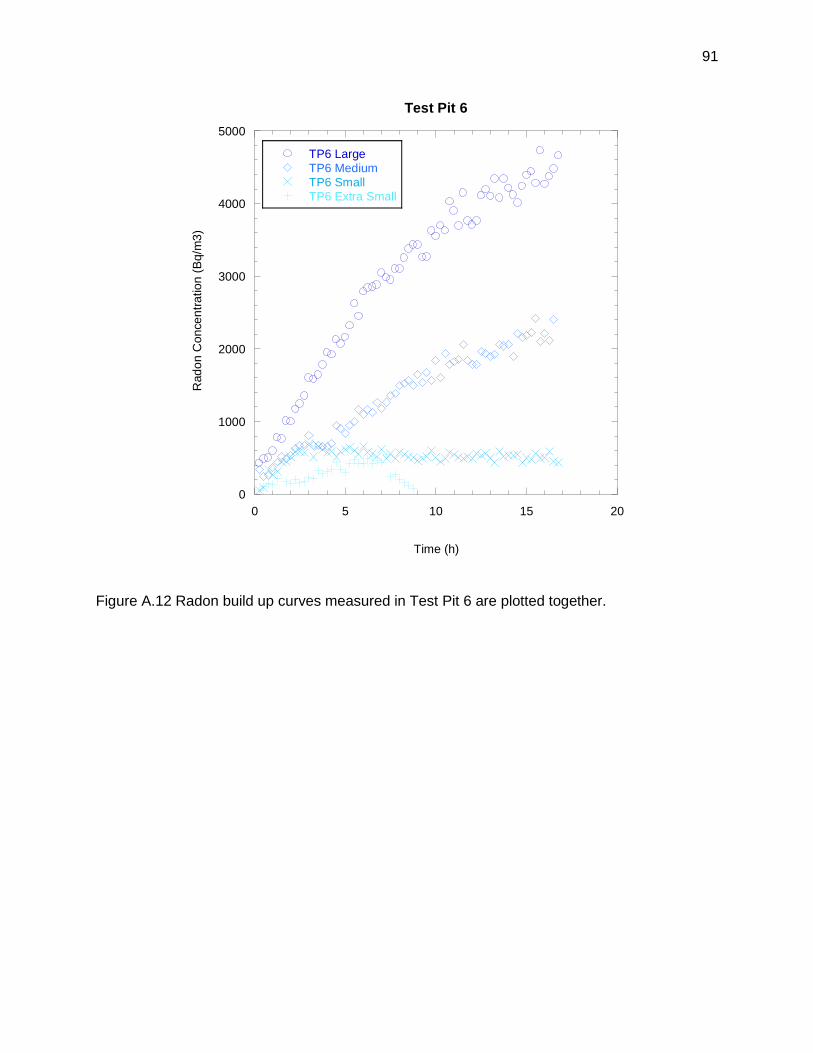
91
0
1000
2000
3000
4000
5000
0 5 10 15 20
Test Pit 6
TP6 LargeTP6 MediumTP6 SmallTP6 Extra Small
Rad
on
Co
nce
ntr
atio
n (
Bq
/m3
)
Time (h)
Figure A.12 Radon build up curves measured in Test Pit 6 are plotted together.
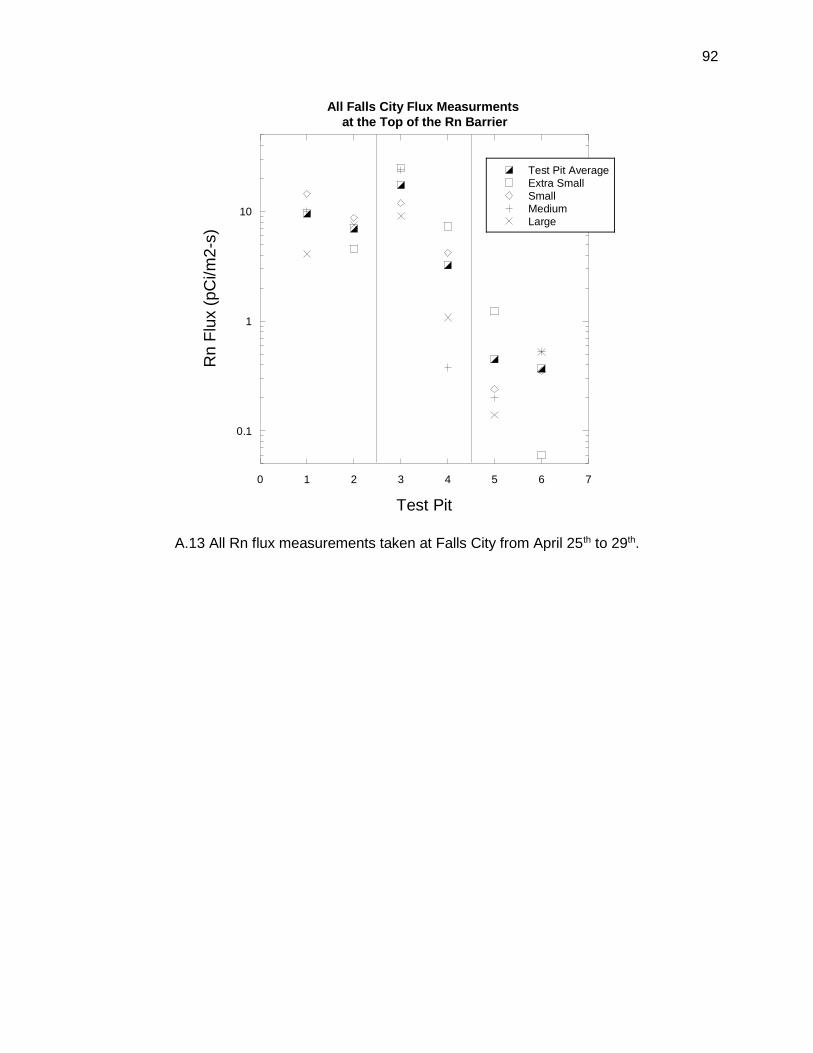
92
0.1
1
10
0 1 2 3 4 5 6 7
All Falls City Flux Measurments
at the Top of the Rn Barrier
Test Pit AverageExtra SmallSmallMediumLarge
Rn
Flu
x (
pC
i/m
2-s
)
Test Pit
A.13 All Rn flux measurements taken at Falls City from April 25th to 29th.

93
0.1
1
10
0.01 0.1 1 10
Ratio (Flux/TP average)
Ra
tio
(F
lux/T
P a
ve
rage
)
Flux Area (m2)
Falls City, TX Normalized Flux Measurments
0.1
1
10
0.01 0.1 1 10
Ratio (Flux/Average)
Ratio
(F
lux/T
P a
vera
ge)
Flux Area (m2)
Concrete Slab Normalized Flux Measurments
Figure A.14 (Left) From the Falls City field data, each flux value has been normalized by averaging the 4 flux measurements in each Test Pit. Each flux was then rationed by its Test Pit average. (Right) The laboratory flux ratios to the average over all flux measurements from Chapter 1.

94
0
5 103
1 104
1.5 104
2 104
2.5 104
3 104
0 5 10 15
Comparing RAD7 and AC - Falls City, TX
TP1 RAD7 (L)TP1 AC (L)TP2 RAD7 (S)TP2 AC (S)TP6 RAD7 (L)TP6 AC (L)Expected RnC Trend
Rad
on
Concentr
ation (
Bq/m
3)
Time (h)
Figure A.15 Three Rad7 (small open data points) and AC (single large filled data point) flux test data.

95
0
1 103
2 103
3 103
4 103
5 103
0 5 10 15 20 25
TP 6 - Large Chamber
TP6 RAD7 (L)TP6 AC (L)
Ra
don
Concentr
ation (
Bq/m
3)
Time (h)
Slope = 171.6 Bq/m3-h
Flux = 0.195 pCi/m2-s
Slope = 398.2 Bq/m3-h
Flux = 0.59 pCi/m2-s
Figure A.16 Comparing the slopes and flux calculation for AC and RAD7 data for the large chamber in Test Pit 6.
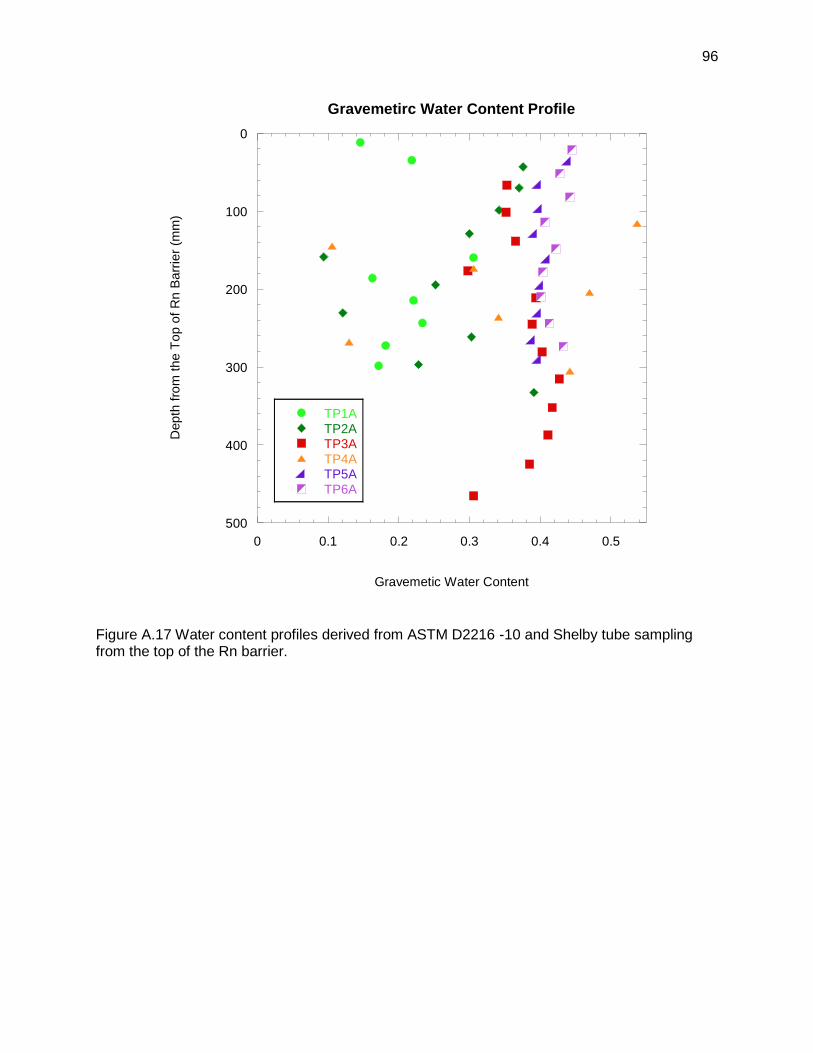
96
0
100
200
300
400
500
0 0.1 0.2 0.3 0.4 0.5
Gravemetirc Water Content Profile
TP1ATP2ATP3ATP4ATP5ATP6A
Dep
th f
rom
th
e T
op o
f R
n B
arr
ier
(mm
)
Gravemetic Water Content
Figure A.17 Water content profiles derived from ASTM D2216 -10 and Shelby tube sampling from the top of the Rn barrier.

97
Figure A.18 Smaller roots, only 1 mm in thickness observed in the top of TP1A tube and throughout TP3A tube.

98
Figure A.19 Larger mesquite brush roots found in TP3A tube found 150 mm deep into the Rn barrier. Roots are about 5 mm in thickness.