Fidelity New York AMT Tax-Free Money Market Fund
52
Fidelity ® New York AMT Tax-Free Money Market Fund Annual Report January 31, 2021
Transcript of Fidelity New York AMT Tax-Free Money Market Fund

Fidelity® New York AMT Tax-Free Money Market Fund
Annual ReportJanuary 31, 2021

Annual Report
Note to Shareholders 4Investment Summary/Performance
5
Schedule of Investments 6Financial Statements 17Notes to Financial Statements
23
Report of Independent Registered Public Accounting Firm
29
Trustees and Officers 30Shareholder Expense Example
39
Distributions 41Board Approval of Investment Advisory Contracts and Management Fees
42
To view a fund’s proxy voting guidelines and proxy voting record for the 12-month period ended June 30, visit http://www.fidelity.com/proxyvotingresults or visit the Securities and Exchange Commission’s (SEC) web site at http://www.sec.gov.You may also call 1-800-544-8544, or for Institutional and Service Class, call 1-877-208-0098, to request a free copy of the proxy voting guidelines.Standard & Poor’s, S&P and S&P 500 are registered service marks of The McGraw-Hill Companies, Inc. and have been licensed for use by Fidelity Distributors Corporation.Other third-party marks appearing herein are the property of their respective owners.All other marks appearing herein are registered or unregistered trademarks or service marks of FMR LLC or an affiliated company. © 2021 FMR LLC. All rights reserved.
Contents

Annual Report
This report and the financial statements contained herein are submitted for the general information of the shareholders of the Fund. This report is not authorized for distribution to prospective investors in the Fund unless preceded or accompanied by an effective prospectus.A fund files its complete schedule of portfolio holdings with the SEC for the first and third quarters of each fiscal year on Form N-PORT. Forms N-PORT are available on the SEC’s web site at http://www.sec.gov. A fund’s Forms N-PORT may be reviewed and copied at the SEC’s Public Reference Room in Washington, DC. Information regarding the operation of the SEC’s Public Reference Room may be obtained by calling 1-800-SEC-0330.For a complete list of a fund’s portfolio holdings, view the most recent holdings listing, semiannual report, or annual report on Fidelity’s web site at http://www.fidelity.com, http://www.institutional.fidelity.com, or http://www.401k.com, as applicable.NOT FDIC INSURED •MAY LOSE VALUE •NO BANK GUARANTEENeither the Fund nor Fidelity Distributors Corporation is a bank.

4Annual Report
Note to Shareholders:
Early in 2020, the outbreak and spread of a new coronavirus emerged as a public health emergency that had a major influence on financial markets, primarily based on its impact on the global economy and the outlook for corporate earnings. The virus causes a respiratory disease known as COVID-19. On March 11, the World Health Organization declared the COVID-19 outbreak a pandemic, citing sustained risk of further global spread.
In the weeks following, as the crisis worsened, we witnessed an escalating human tragedy with wide-scale social and economic consequences from coronavirus-containment measures. The outbreak of COVID-19 prompted a number of measures to limit the spread, including travel and border restrictions, quarantines, and restrictions on large gatherings. In turn, these resulted in lower consumer activity, diminished demand for a wide range of products and services, disruption in manufacturing and supply chains, and – given the wide variability in outcomes regarding the outbreak – significant market uncertainty and volatility. Amid the turmoil, global governments and central banks took unprecedented action to help support consumers, businesses, and the broader economies, and to limit disruption to financial systems.
The situation continues to unfold, and the extent and duration of its impact on financial markets and the economy remain highly uncertain. Extreme events such as the coronavirus crisis are “exogenous shocks” that can have significant adverse effects on mutual funds and their investments. Although multiple asset classes may be affected by market disruption, the duration and impact may not be the same for all types of assets.
Fidelity is committed to helping you stay informed amid news about COVID-19 and during increased market volatility, and we’re taking extra steps to be responsive to customer needs. We encourage you to visit our websites, where we offer ongoing updates, commentary, and analysis on the markets and our funds.
5 Annual Report
Investment Summary/Performance (Unaudited)
Effective Maturity Diversification
Days % of fund’s investments 1/31/21
1 – 7 78.88 – 30 3.831 – 60 11.891 – 180 5.5> 180 0.1
Effective maturity is determined in accordance with the requirements of Rule 2a-7 under the Investment Company Act of 1940.
Asset Allocation (% of fund’s net assets)
As of January 31, 2021
Variable Rate Demand Notes (VRDNs) 16.6%
Tender Option Bond 54.5%
Other Municipal Security 17.9%
Investment Companies 11.0%
Current 7-Day Yields
1/31/21Fidelity® New York AMT Tax-Free Money Market Fund 0.01%Institutional Class 0.01%Service Class 0.01%
Yield refers to the income paid by the Fund over a given period. Yield for money market funds is usually for seven-day periods, as it is here, though it is expressed as an annual percentage rate. Past performance is no guarantee of future results. Yield will vary and it’s possible to lose money investing in the Fund. A portion of the Fund’s expenses was reimbursed and/or waived. Absent such reimbursements and/or waivers the yield for the period ending January 31, 2021, the most recent period shown in the table, would have been (.24)% for New York AMT Tax-Free Money Market Fund, (.19)% for Institutional Class and (.44)% for Service Class.

6Annual Report
See accompanying notes which are an integral part of the financial statements.
Variable Rate Demand Note – 16.6%Principal Amount
Value
Connecticut – 0.1%Connecticut Gen. Oblig. Series 2016 C, 0.11% 2/5/21 (Liquidity Facility Bank of America NA),
VRDN (a) $ 1,700,000 $ 1,700,000Indiana – 0.2%Lawrenceburg Poll. Cont. Rev. (Indiana Michigan Pwr. Co. Proj.) Series H, 0.14% 2/5/21, VRDN (a) 2,900,000 2,900,000Kansas – 0.6%Burlington Envir. Impt. Rev. (Kansas City Pwr. and Lt. Co. Proj.):
Series 2007 A, 0.16% 2/5/21, VRDN (a) 700,000 700,000Series 2007 B, 0.16% 2/5/21, VRDN (a) 2,600,000 2,600,000
Wamego Kansas Poll. Cont. Rfdg. Rev.:(Kansas Gas & Elec. Co. Proj.) Series 1994, 0.14% 2/5/21, VRDN (a) 500,000 500,000(Western Resources, Inc. Proj.) Series 1994, 0.14% 2/5/21, VRDN (a) 6,500,000 6,500,000
10,300,000Louisiana – 0.9%Saint James Parish Gen. Oblig. (Nucor Steel Louisiana LLC Proj.):
Series 2010 A1, 0.12% 2/5/21, VRDN (a) 9,800,000 9,800,000Series 2010 B1, 0.14% 2/5/21, VRDN (a) 6,900,000 6,900,000
16,700,000New York – 14.8%Amherst Dev. Corp. Student Hsg. Facility Rev. (South Lake Village Proj.) Series 2010 B, 0.11%
2/5/21, LOC HSBC Bank U.S.A., NA, VRDN (a) 4,395,000 4,395,000Build NYC Resource Corp. Rev. (The Asia Society Proj.) Series 2015, 0.05% 2/5/21, LOC TD
Banknorth, NA, VRDN (a) 3,005,000 3,005,000Franklin County Civic Dev. Co. (Alice Hyde Med. Ctr. Proj.) Series 2013 A, 0.06% 2/5/21, LOC HSBC
Bank U.S.A., NA, VRDN (a) 4,845,000 4,845,000Liberty Dev. Corp. Rev. (377 Greenwich LLC Proj.) Series 2004, 0.04% 2/5/21, LOC Wells Fargo
Bank NA, VRDN (a) 18,525,000 18,525,000New York Hsg. Fin. Agcy. Rev.:
(Tribeca Green Hsg. Proj.) Series 2003 A, 0.07% 2/5/21, LOC Landesbank Hessen-Thuringen, VRDN (a) 62,425,000 62,425,000
Series 2013 A, 0.01% 2/1/21, LOC Landesbank Hessen-Thuringen, VRDN (a) 8,150,000 8,150,000Triborough Bridge & Tunnel Auth. Revs.:
Series 2005 B 2A, 0.099% 2/5/21, LOC State Street Bank & Trust Co., Boston, VRDN (a) 6,600,000 6,600,000Series 2005 B 2B, 0.049% 2/5/21, LOC State Street Bank & Trust Co., Boston, VRDN (a) 33,200,000 33,200,000
FHLMC:New York City Hsg. Dev. Corp. Multi-family Mtg. Rev.:
Series 2011 A, 0.04% 2/5/21, LOC Freddie Mac, VRDN (a) 21,820,000 21,820,000Series 2011 B, 0.04% 2/5/21, LOC Freddie Mac, VRDN (a) 3,700,000 3,700,000
New York Hsg. Fin. Agcy. Rev. Series 2010 A, 0.05% 2/5/21, LOC Freddie Mac, VRDN (a) 24,730,000 24,730,000FNMA:
New York City Hsg. Dev. Corp. Multi-family Rental Hsg. Rev. (90 West Street Proj.) Series 2006 A, 0.04% 2/5/21, LOC Fannie Mae, VRDN (a) 9,395,000 9,395,000
Schedule of Investments January 31, 2021Showing Percentage of Net Assets

7 Annual Report
See accompanying notes which are an integral part of the financial statements.
Variable Rate Demand Note – continuedPrincipal Amount
Value
New York – continuedFNMA: – continued
New York Hsg. Fin. Agcy. Rev. Series 2009 A, 0.05% 2/5/21, LOC Fannie Mae, VRDN (a) $ 57,000,000 $ 57,000,000257,790,000
TOTAL VARIABLE RATE DEMAND NOTE(Cost $289,390,000) 289,390,000
Tender Option Bond – 54.5%
California – 0.1%Dignityhealthxx Participating VRDN Series DBE 80 11, 0.24% 2/5/21 (Liquidity Facility Deutsche
Bank AG New York Branch) (a) (b) (c) 2,000,000 2,000,000Colorado – 0.1%Colorado Health Facilities Auth. Rev. Participating VRDN Series MIZ 90 22, 0.15% 2/5/21 (Liquidity
Facility Mizuho Cap. Markets Llc) (a) (b) (c) 900,000 900,000Tender Option Bond Trust Receipts Participating VRDN Series XG 00 68, 0.12% 2/5/21 (Liquidity
Facility Deutsche Bank AG New York Branch) (a) (b) (c) 480,000 480,0001,380,000
Connecticut – 0.2%Connecticut Gen. Oblig. Participating VRDN Series Floaters 014, 0.19% 3/12/21 (Liquidity Facility
Barclays Bank PLC) (a) (b) (c) 1,890,000 1,890,000Connecticut Spl. Tax Oblig. Trans. Infrastructure Rev. Bonds Series Floaters G 110, 0.22%, tender
4/1/21 (Liquidity Facility Royal Bank of Canada) (a) (b) (c) (d) 1,900,000 1,900,0003,790,000
Florida – 0.4%Jacksonville Elec. Auth. Elec. Sys. Rev. Participating VRDN Series 2019, 0.34% 3/12/21 (Liquidity
Facility Wells Fargo Bank NA) (a) (b) (c) 7,170,000 7,170,000Illinois – 0.3%Illinois Fin. Auth. Rev. Participating VRDN Series Floaters 017, 0.19% 3/12/21 (Liquidity Facility
Barclays Bank PLC) (a) (b) (c) 3,850,000 3,850,000Illinois Gen. Oblig. Participating VRDN Series XM 07 59, 0.17% 2/5/21 (Liquidity Facility Bank of
America NA) (a) (b) (c) 1,120,000 1,120,0004,970,000
Indiana – 0.2%Indiana Fin. Auth. Rev. Participating VRDN Series 2020 004, 0.19% 3/12/21 (Liquidity Facility
Wells Fargo Bank NA) (a) (b) (c) 2,900,000 2,900,000Kentucky – 0.1%CommonSpirit Health Participating VRDN Series MIZ 90 21, 0.15% 2/5/21 (Liquidity Facility Mizuho
Cap. Markets Llc) (a) (b) (c) 1,300,000 1,300,000Kentucky State Property & Buildings Commission Rev. Bonds Series G 116, 0.24%, tender 5/3/21
(Liquidity Facility Royal Bank of Canada) (a) (b) (c) (d) 500,000 500,0001,800,000

8Annual Report
See accompanying notes which are an integral part of the financial statements.
Schedule of Investments – continued
Tender Option Bond – continuedPrincipal Amount
Value
Maryland – 0.6%Baltimore Proj. Rev. Bonds Series Floaters G 28, 0.24%, tender 7/1/21 (Liquidity Facility Royal Bank
of Canada) (a) (b) (c) (d) $ 1,100,000 $ 1,100,000Maryland Gen. Oblig. Participating VRDN Series DB 80 76, 0.11% 2/5/21 (Liquidity Facility
Deutsche Bank AG New York Branch) (a) (b) (c) 10,275,000 10,275,00011,375,000
Massachusetts – 0.1%Massachusetts Gen. Oblig. Bonds:
Series Clipper 09 67, 0.22%, tender 6/10/21 (Liquidity Facility State Street Bank & Trust Co., Boston) (a) (b) (c) (d) 1,800,000 1,800,000
Series Clipper 09 69, 0.22%, tender 6/17/21 (Liquidity Facility State Street Bank & Trust Co., Boston) (a) (b) (c) (d) 600,000 600,000
2,400,000New York – 50.3%Battery Park City Auth. Rev. Participating VRDN Series E 137, 0.07% 2/5/21 (Liquidity Facility Royal
Bank of Canada) (a) (b) (c) 50,050,000 50,050,000Clipper Tax-Exempt Trust Participating VRDN Series Clipper 07 43, 0.14% 2/5/21 (Liquidity Facility
State Street Bank & Trust Co., Boston) (a) (b) (c) 16,315,000 16,315,000Dorm. Auth. New York Univ. Rev. Participating VRDN:
Series 2017 XG 0114, 0.06% 2/5/21 (Liquidity Facility Morgan Stanley Bank, West Valley City Utah) (a) (b) (c) 7,760,000 7,760,000
Series Floaters XF 05 98, 0.09% 2/5/21 (Liquidity Facility Toronto-Dominion Bank) (a) (b) (c) 6,200,000 6,200,000Series XF 25 99, 0.07% 2/5/21 (Liquidity Facility Citibank NA) (a) (b) (c) 4,800,000 4,800,000
Hudson Yards Infrastructure Corp. New York Rev. Participating VRDN:Series Floaters XF 05 49, 0.14% 2/5/21 (Liquidity Facility Toronto-Dominion Bank) (a) (b) (c) 1,200,000 1,200,000Series Floaters XF 05 51, 0.14% 2/5/21 (Liquidity Facility Toronto-Dominion Bank) (a) (b) (c) 2,700,000 2,700,000Series Floaters XF 06 77, 0.09% 2/5/21 (Liquidity Facility Toronto-Dominion Bank) (a) (b) (c) 2,100,000 2,100,000Series Floaters XF 24 57, 0.16% 2/5/21 (Liquidity Facility Morgan Stanley Bank, West Valley
City Utah) (a) (b) (c) 2,333,500 2,333,500Series Floaters XF 24 80, 0.08% 2/5/21 (Liquidity Facility JPMorgan Chase Bank) (a) (b) (c) 9,600,000 9,600,000Series Floaters XM 07 00, 0.09% 2/5/21 (Liquidity Facility Toronto-Dominion Bank) (a) (b) (c) 4,020,000 4,020,000Series Floaters ZM 07 37, 0.12% 2/5/21 (Liquidity Facility JPMorgan Chase Bank) (a) (b) (c) 3,000,000 3,000,000Series XF 28 59, 0.14% 2/5/21 (Liquidity Facility Morgan Stanley Bank, West Valley City
Utah) (a) (b) (c) 4,250,000 4,250,000Monroe County Indl. Dev. Corp. Participating VRDN:
Series 20 XM 08 99, 0.07% 2/5/21 (Liquidity Facility Morgan Stanley Bank, West Valley City Utah) (a) (b) (c) 5,900,000 5,900,000
Series XF 09 91, 0.07% 2/5/21 (Liquidity Facility Toronto-Dominion Bank) (a) (b) (c) 5,200,000 5,200,000Series XF 29 17, 0.08% 2/5/21 (Liquidity Facility Barclays Bank PLC) (a) (b) (c) 2,470,000 2,470,000
MTA Hudson Rail Yards Trust Oblig. Participating VRDN Series XX 1042, 0.08% 2/5/21 (Liquidity Facility Barclays Bank PLC) (a) (b) (c) 6,730,000 6,730,000
Nassau County Gen. Oblig. Participating VRDN Series Floaters G5, 0.07% 2/5/21 (Liquidity Facility Royal Bank of Canada) (a) (b) (c) 5,000,000 5,000,000

9 Annual Report
See accompanying notes which are an integral part of the financial statements.
Tender Option Bond – continuedPrincipal Amount
Value
New York – continuedNew York City Gen. Oblig. Participating VRDN:
Series 15 ZF0197, 0.07% 2/5/21 (Liquidity Facility JPMorgan Chase Bank) (a) (b) (c) $ 2,500,000 $ 2,500,000Series 2015 ZF0206, 0.07% 2/5/21 (Liquidity Facility JPMorgan Chase Bank) (a) (b) (c) 2,700,000 2,700,000Series 2020 003, 0.24% 3/12/21 (Liquidity Facility Wells Fargo Bank NA) (a) (b) (c) 19,100,000 19,100,000Series E 133, 0.07% 2/5/21 (Liquidity Facility Royal Bank of Canada) (a) (b) (c) 5,250,000 5,250,000Series Floaters E87, 0.07% 2/5/21 (Liquidity Facility Royal Bank of Canada) (a) (b) (c) 12,995,000 12,995,000Series Floaters E88, 0.07% 2/5/21 (Liquidity Facility Royal Bank of Canada) (a) (b) (c) 15,830,000 15,830,000Series Floaters XM 07 06, 0.07% 2/5/21 (Liquidity Facility Royal Bank of Canada) (a) (b) (c) 4,000,000 4,000,000Series MS 3324, 0.07% 2/5/21 (Liquidity Facility Sumitomo Mitsui Banking Corp.) (a) (b) (c) 6,650,000 6,650,000Series RBC G 55, 0.07% 2/5/21 (Liquidity Facility Royal Bank of Canada) (a) (b) (c) 5,000,000 5,000,000Series RBC G 56, 0.07% 2/5/21 (Liquidity Facility Royal Bank of Canada) (a) (b) (c) 4,500,000 4,500,000Series Solar 2017 0057, 0.09% 2/5/21 (Liquidity Facility U.S. Bank NA, Cincinnati) (a) (b) (c) 1,570,000 1,570,000
New York City Indl. Dev. Agcy. Rev. Participating VRDN:Series XF 29 10, 0.08% 2/5/21 (Liquidity Facility Barclays Bank PLC) (a) (b) (c) 4,230,000 4,230,000Series XF 29 11, 0.08% 2/5/21 (Liquidity Facility Barclays Bank PLC) (a) (b) (c) 1,705,000 1,705,000
New York City Muni. Wtr. Fin. Auth. Participating VRDN Series ZF 23 15, 0.07% 2/5/21 (Liquidity Facility Barclays Bank PLC) (a) (b) (c) 8,040,000 8,040,000
New York City Muni. Wtr. Fin. Auth. Wtr. & Swr. Sys. Rev. Participating VRDN:Series 15 XF0128, 0.07% 2/5/21 (Liquidity Facility JPMorgan Chase Bank) (a) (b) (c) 8,940,000 8,940,000Series 15 XF0129, 0.07% 2/5/21 (Liquidity Facility JPMorgan Chase Bank) (a) (b) (c) 16,700,000 16,700,000Series 16 ZM0161, 0.07% 2/5/21 (Liquidity Facility Royal Bank of Canada) (a) (b) (c) 8,265,000 8,265,000Series 2015 ZF0207, 0.07% 2/5/21 (Liquidity Facility JPMorgan Chase Bank) (a) (b) (c) 6,500,000 6,500,000Series 2017 ZM 0495, 0.07% 2/5/21 (Liquidity Facility Morgan Stanley Bank, West Valley City
Utah) (a) (b) (c) 3,000,000 3,000,000Series Floaters E 129, 0.07% 2/5/21 (Liquidity Facility Royal Bank of Canada) (a) (b) (c) 37,400,000 37,400,000Series Floaters XF 07 45, 0.07% 2/5/21 (Liquidity Facility Royal Bank of Canada) (a) (b) (c) 4,500,000 4,500,000Series Floaters XF 10 11, 0.07% 2/5/21 (Liquidity Facility Barclays Bank PLC) (a) (b) (c) 7,060,000 7,060,000Series Floaters XF 25 69, 0.07% 2/5/21 (Liquidity Facility Citibank NA) (a) (b) (c) 4,000,000 4,000,000Series Floaters XL 00 67, 0.07% 2/5/21 (Liquidity Facility Citibank NA) (a) (b) (c) 7,425,000 7,425,000Series Floaters XM 03 83, 0.07% 2/5/21 (Liquidity Facility JPMorgan Chase Bank) (a) (b) (c) 2,500,000 2,500,000Series Floaters XM 04 36, 0.07% 2/5/21 (Liquidity Facility Barclays Bank PLC) (a) (b) (c) 11,800,000 11,800,000Series Floaters XM 07 31, 0.07% 2/5/21 (Liquidity Facility Bank of America NA) (a) (b) (c) 4,000,000 4,000,000Series Floaters ZF 06 87, 0.07% 2/5/21 (Liquidity Facility Bank of America NA) (a) (b) (c) 5,025,000 5,025,000Series Floaters ZM 05 47, 0.07% 2/5/21 (Liquidity Facility Wells Fargo Bank NA) (a) (b) (c) 6,540,000 6,540,000Series MS 00 3387, 0.07% 2/5/21 (Liquidity Facility Morgan Stanley Bank, West Valley City
Utah) (a) (b) (c) 2,500,000 2,500,000Series MS 3373, 0.07% 2/5/21 (Liquidity Facility Morgan Stanley Bank, West Valley City
Utah) (a) (b) (c) 6,125,000 6,125,000Series Putters 15 XM0002, 0.07% 2/5/21 (Liquidity Facility JPMorgan Chase Bank) (a) (b) (c) 49,070,000 49,070,000Series XG 0112, 0.07% 2/5/21 (Liquidity Facility Barclays Bank PLC) (a) (b) (c) 2,800,000 2,800,000Series XX 1046, 0.07% 2/5/21 (Liquidity Facility Barclays Bank PLC) (a) (b) (c) 1,500,000 1,500,000

10Annual Report
See accompanying notes which are an integral part of the financial statements.
Schedule of Investments – continued
Tender Option Bond – continuedPrincipal Amount
Value
New York – continuedNew York City Transitional Fin. Auth. Participating VRDN:
Series XM 03 03, 0.07% 2/5/21 (Liquidity Facility Royal Bank of Canada) (a) (b) (c) $ 5,620,000 $ 5,620,000Series XM 03 51, 0.07% 2/5/21 (Liquidity Facility JPMorgan Chase Bank) (a) (b) (c) 4,080,000 4,080,000
New York City Transitional Fin. Auth. Bldg. Aid Rev. Participating VRDN:Series Floaters XF 05 61, 0.08% 2/5/21 (Liquidity Facility Toronto-Dominion Bank) (a) (b) (c) 8,250,000 8,250,000Series Floaters XF 25 55, 0.06% 2/5/21 (Liquidity Facility Morgan Stanley Bank, West Valley
City Utah) (a) (b) (c) 5,920,000 5,920,000Series Floaters XM 06 19, 0.07% 2/5/21 (Liquidity Facility Wells Fargo Bank NA) (a) (b) (c) 3,750,000 3,750,000Series Floaters XM 06 20, 0.07% 2/5/21 (Liquidity Facility Wells Fargo Bank NA) (a) (b) (c) 7,385,000 7,385,000Series MS 3414, 0.12% 2/5/21 (Liquidity Facility Morgan Stanley Bank, West Valley City
Utah) (a) (b) (c) 4,000,000 4,000,000New York City Transitional Fin. Auth. Rev. Participating VRDN:
Series 002, 0.19% 3/12/21 (Liquidity Facility Wells Fargo Bank NA) (a) (b) (c) 38,500,000 38,500,000Series 2014 XM0029, 0.07% 2/5/21 (Liquidity Facility Royal Bank of Canada) (a) (b) (c) 5,200,000 5,200,000Series Floaters E99, 0.07% 2/5/21 (Liquidity Facility Royal Bank of Canada) (a) (b) (c) 12,495,000 12,495,000Series Floaters XF 07 16, 0.08% 2/5/21 (Liquidity Facility Toronto-Dominion Bank) (a) (b) (c) 4,200,000 4,200,000Series Floaters XF 07 17, 0.09% 2/5/21 (Liquidity Facility Toronto-Dominion Bank) (a) (b) (c) 12,285,000 12,285,000Series Floaters ZF 26 37, 0.07% 2/5/21 (Liquidity Facility Morgan Stanley Bank, West Valley City
Utah) (a) (b) (c) 2,795,000 2,795,000Series Floaters ZM 05 44, 0.07% 2/5/21 (Liquidity Facility Bank of America NA) (a) (b) (c) 4,445,000 4,445,000Series MS 3360, 0.07% 2/5/21 (Liquidity Facility Morgan Stanley Bank, West Valley City
Utah) (a) (b) (c) 4,800,000 4,800,000Series MS 3393, 0.07% 2/5/21 (Liquidity Facility Morgan Stanley Bank, West Valley City
Utah) (a) (b) (c) 3,615,000 3,615,000Series ROC II R 14082, 0.06% 2/5/21 (Liquidity Facility Morgan Stanley Bank, West Valley City
Utah) (a) (b) (c) 14,155,000 14,155,000Series XF 06 37, 0.08% 2/5/21 (Liquidity Facility Toronto-Dominion Bank) (a) (b) (c) 14,520,000 14,520,000Series ZF 09 62, 0.08% 2/5/21 (Liquidity Facility Toronto-Dominion Bank) (a) (b) (c) 3,800,000 3,800,000
New York Dorm. Auth. Personal Income Tax Rev. Participating VRDN:Series 15 XF1030, 0.07% 2/5/21 (Liquidity Facility Wells Fargo Bank NA) (a) (b) (c) 23,240,000 23,240,000Series ROC II R 14005, 0.07% 2/5/21 (Liquidity Facility JPMorgan Chase Bank) (a) (b) (c) 2,600,000 2,600,000
New York Dorm. Auth. Rev. Participating VRDN:Series ROC II R 11955, 0.05% 2/5/21 (Liquidity Facility Citibank NA) (a) (b) (c) 9,000,000 9,000,000Series XF 08 38, 0.07% 2/5/21 (Liquidity Facility Bank of America NA) (a) (b) (c) 1,600,000 1,600,000Series XF 28 88, 0.08% 2/5/21 (Liquidity Facility Barclays Bank PLC) (a) (b) (c) 6,100,000 6,100,000Series XG 02 76, 0.07% 2/5/21 (Liquidity Facility Bank of America NA) (a) (b) (c) 12,960,000 12,960,000Series XG 02 77, 0.07% 2/5/21 (Liquidity Facility Bank of America NA) (a) (b) (c) 13,260,000 13,260,000Series XL 01 53, 0.08% 2/5/21 (Liquidity Facility Barclays Bank PLC) (a) (b) (c) 2,500,000 2,500,000
New York Envir. Facilities Corp. Clean Wtr. & Drinking Wtr. Participating VRDN:Series 16 XL0002, 0.07% 2/5/21 (Liquidity Facility Barclays Bank PLC) (a) (b) (c) 8,100,000 8,100,000Series Floaters XF 25 86, 0.07% 2/5/21 (Liquidity Facility JPMorgan Chase Bank) (a) (b) (c) 3,750,000 3,750,000Series Floaters XG 01 69, 0.07% 2/5/21 (Liquidity Facility Barclays Bank PLC) (a) (b) (c) 10,800,000 10,800,000

11 Annual Report
See accompanying notes which are an integral part of the financial statements.
Tender Option Bond – continuedPrincipal Amount
Value
New York – continuedNew York Gen. Oblig. Participating VRDN Series Floaters XG 01 05, 0.07% 2/5/21 (Liquidity Facility
Bank of America NA) (a) (b) (c) $ 3,000,000 $ 3,000,000New York Liberty Dev. Corp. Participating VRDN:
Series Floaters XF 10 27, 0.11% 2/5/21 (Liquidity Facility Deutsche Bank AG New York Branch) (a) (b) (c) 12,259,000 12,259,000
0.09% 2/5/21 (Liquidity Facility JPMorgan Chase Bank) (a) (b) (c) 25,185,000 25,185,000New York Metropolitan Trans. Auth. Rev. Participating VRDN:
Series RBC E 126, 0.09% 2/5/21 (Liquidity Facility Royal Bank of Canada) (a) (b) (c) 26,065,000 26,065,000Series XF 05 91, 0.1% 2/5/21 (Liquidity Facility Bank of America NA) (a) (b) (c) 2,000,000 2,000,000Series XF 06 57, 0.1% 2/5/21 (Liquidity Facility Bank of America NA) (a) (b) (c) 6,065,000 6,065,000Series XF 08 65, 0.1% 2/5/21 (Liquidity Facility Bank of America NA) (a) (b) (c) 9,450,000 9,450,000Series XF 29 14, 0.1% 2/5/21 (Liquidity Facility Barclays Bank PLC) (a) (b) (c) 14,245,000 14,245,000Series XM 06 97, 0.1% 2/5/21 (Liquidity Facility Bank of America NA) (a) (b) (c) 1,500,000 1,500,000Series XM 08 43, 0.1% 2/5/21 (Liquidity Facility Bank of America NA) (a) (b) (c) 11,800,000 11,800,000
New York Sales Tax Asset Receivables Corp. Participating VRDN:Series 15 XF0139, 0.07% 2/5/21 (Liquidity Facility JPMorgan Chase Bank) (a) (b) (c) 3,340,000 3,340,000Series 16 ZM0174, 0.12% 2/5/21 (Liquidity Facility Morgan Stanley Bank, West Valley City
Utah) (a) (b) (c) 9,145,000 9,145,000Series 2015 ZF0209, 0.07% 2/5/21 (Liquidity Facility JPMorgan Chase Bank) (a) (b) (c) 1,000,000 1,000,000
New York State Gen. Oblig. Participating VRDN Series ROC II R 11936, 0.07% 2/5/21 (Liquidity Facility JPMorgan Chase Bank) (a) (b) (c) 14,000,000 14,000,000
New York Thruway Auth. Gen. Rev. Participating VRDN:Series XF 08 29, 0.07% 2/5/21 (Liquidity Facility Royal Bank of Canada) (a) (b) (c) 5,075,000 5,075,000Series XF 08 47, 0.07% 2/5/21 (Liquidity Facility Royal Bank of Canada) (a) (b) (c) 5,710,000 5,710,000Series XX 11 27, 0.08% 2/5/21 (Liquidity Facility Barclays Bank PLC) (a) (b) (c) 3,220,000 3,220,000Series ZF 08 32, 0.07% 2/5/21 (Liquidity Facility Bank of America NA) (a) (b) (c) 2,820,000 2,820,000Series ZF 09 29, 0.07% 2/5/21 (Liquidity Facility Bank of America NA) (a) (b) (c) 2,400,000 2,400,000
New York Thruway Auth. Second Gen. Hwy. & Bridge Trust Fund Participating VRDN Series ROC II R 11997, 0.07% 2/5/21 (Liquidity Facility JPMorgan Chase Bank) (a) (b) (c) 9,080,000 9,080,000
Oneida County Local Dev. Corp. Rev. Participating VRDN Series XG 02 82, 0.08% 2/5/21 (Liquidity Facility Bank of America NA) (a) (b) (c) 1,650,000 1,650,000
Util. Debt Securitization Auth. Participating VRDN:Series 2015 ZF0195, 0.07% 2/5/21 (Liquidity Facility JPMorgan Chase Bank) (a) (b) (c) 7,700,000 7,700,000Series Floaters ZF 27 40, 0.07% 2/5/21 (Liquidity Facility Morgan Stanley Bank, West Valley City
Utah) (a) (b) (c) 2,600,000 2,600,000Series Floaters ZM 01 22, 0.07% 2/5/21 (Liquidity Facility Royal Bank of Canada) (a) (b) (c) 4,000,000 4,000,000Series Floaters ZM 04 56, 0.07% 2/5/21 (Liquidity Facility JPMorgan Chase Bank) (a) (b) (c) 2,500,000 2,500,000Series Floaters ZM 04 62, 0.07% 2/5/21 (Liquidity Facility Royal Bank of Canada) (a) (b) (c) 4,000,000 4,000,000
Westchester County Local Dev. Co. Participating VRDN Series Floaters XF 24 81, 0.08% 2/5/21 (Liquidity Facility Barclays Bank PLC) (a) (b) (c) 3,160,000 3,160,000
876,042,500
12Annual Report
See accompanying notes which are an integral part of the financial statements.
Schedule of Investments – continued
Tender Option Bond – continuedPrincipal Amount
Value
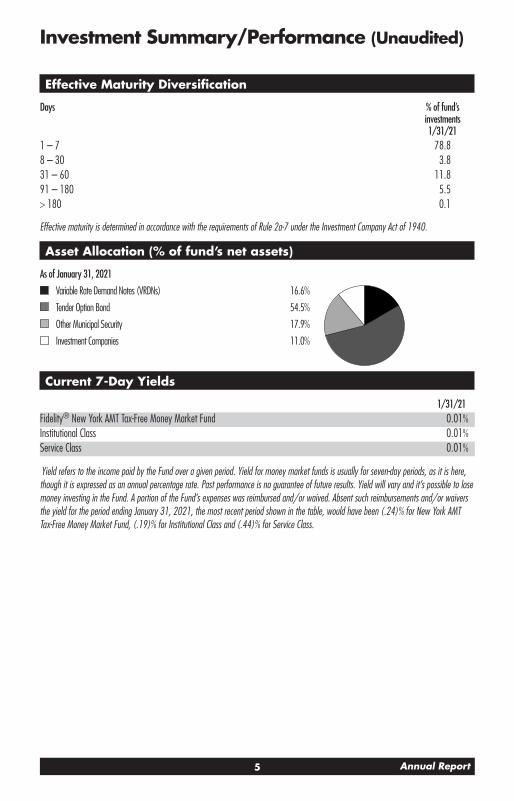
New York And New Jersey – 1.3%Port Auth. of New York & New Jersey Participating VRDN:
Series Floaters XF 05 65, 0.08% 2/5/21 (Liquidity Facility Toronto-Dominion Bank) (a) (b) (c) $ 14,935,000 $ 14,935,000Series Floaters XF 06 97, 0.12% 2/5/21 (Liquidity Facility Bank of America NA) (a) (b) (c) 5,910,000 5,910,000Series MS 15 ZM0099, 0.12% 2/5/21 (Liquidity Facility Morgan Stanley Bank, West Valley City
Utah) (a) (b) (c) 1,100,000 1,100,00021,945,000
Ohio – 0.3%Columbus Gen. Oblig. Participating VRDN Series DB 80 75, 0.11% 2/5/21 (Liquidity Facility
Deutsche Bank AG New York Branch) (a) (b) (c) 1,225,000 1,225,000Middletown Hosp. Facilities Rev. Participating VRDN Series Floaters 003, 0.19% 3/12/21 (Liquidity
Facility Barclays Bank PLC) (a) (b) (c) 785,000 785,000Ohio Hosp. Rev. Participating VRDN Series 002, 0.19% 3/12/21 (Liquidity Facility Barclays Bank
PLC) (a) (b) (c) 1,600,000 1,600,000Ohio Univ. Gen. Receipts Athens Bonds Series Floaters G 27, 0.24%, tender 6/1/21 (Liquidity Facility
Royal Bank of Canada) (a) (b) (c) (d) 800,000 800,0004,410,000
Pennsylvania – 0.1%Pennsylvania Higher Edl. Facilities Auth. Rev. Bonds Series 2016 E75, 0.21%, tender 6/1/21
(Liquidity Facility Royal Bank of Canada) (a) (b) (c) (d) 800,000 800,000Pennsylvania Tpk. Commission Tpk. Rev. Bonds Series Floaters G 43, 0.24%, tender 6/1/21
(Liquidity Facility Royal Bank of Canada) (a) (b) (c) (d) 300,000 300,0001,100,000
South Carolina – 0.0%South Carolina Trans. Infrastructure Bank Rev. Bonds Series Floaters G 109, 0.24%, tender 4/1/21
(Liquidity Facility Royal Bank of Canada) (a) (b) (c) (d) 400,000 400,000Texas – 0.0%Alamo Cmnty. College District Rev. Bonds Series G-111, 0.24%, tender 5/3/21 (Liquidity Facility
Royal Bank of Canada) (a) (b) (c) (d) 400,000 400,000Virginia – 0.4%Lynchburg Econ. Dev. Participating VRDN Series 2020 10, 0.19% 3/12/21 (Liquidity Facility
Barclays Bank PLC) (a) (b) (c) 4,945,000 4,945,000Suffolk Econ. Dev. Auth. Hosp. Facilities Rev. Participating VRDN Series MIZ 90 25, 0.12% 2/5/21
(Liquidity Facility Mizuho Cap. Markets Llc) (a) (b) (c) 2,125,000 2,125,000Virginia Pub. Bldg. Auth. Pub. Facilities Rev. Bonds Series Floaters G 40, 0.24%, tender (a) (b) (c) (d) 500,000 500,000
7,570,000
TOTAL TENDER OPTION BOND(Cost $949,652,500) 949,652,500

13 Annual Report
See accompanying notes which are an integral part of the financial statements.
Other Municipal Security – 17.9%Principal Amount
Value
Massachusetts – 0.2%Massachusetts Indl. Fin. Agcy. Poll. Cont. Rev. Bonds:
Series 1992, 0.15% tender 2/3/21, CP mode $ 3,100,000 $ 3,100,000Series 2021, 0.13% tender 2/19/21, CP mode 1,200,000 1,200,000
4,300,000Michigan – 0.0%Kent Hosp. Fin. Auth. Hosp. Facilities Rev. Bonds (Spectrum Health Sys. Proj.) Series 2015 A, SIFMA
Municipal Swap Index + 0.250% 0.29%, tender 8/27/21 (a) (e) 100,000 100,000New York – 15.9%Albany County Gen. Oblig. TAN Series 2020, 1.5% 5/28/21 12,600,000 12,651,156Babylon Union Free School District TAN Series 2020, 2% 6/18/21 5,100,000 5,131,757Hudson Yards Infrastructure Corp. New York Rev. Bonds Series 2012 A, 5.75% 2/15/21
(Pre-Refunded to 2/15/21 @ 100) 18,670,000 18,701,235Kings Park Central School District TAN Series 2020, 2% 6/25/21 12,100,000 12,182,095Locust Valley Central School District TAN Series 2020, 2.5% 6/25/21 6,300,000 6,350,353Manhasset Union Free School District TAN Series 2020, 2% 6/24/21 7,600,000 7,650,575New York City Transitional Fin. Auth. Rev. Bonds Series 2003 B, 4% 2/1/21 4,855,000 4,855,000New York City Trust For Cultural Bonds Series 2014, 0.22%, tender 8/14/21 (a) 7,600,000 7,600,000New York Dorm. Auth. Personal Income Tax Rev. Bonds Series 2016 D, 5% 2/15/21 24,000,000 24,033,017New York Dorm. Auth. Sales Tax Rev. Bonds Series 2015 A, 5% 3/15/21 25,985,000 26,111,334New York Pwr. Auth.:
Series 1:0.29% 7/13/21, CP 1,662,000 1,662,0000.29% 8/3/21, CP 450,000 450,000
Series 2:0.32% 2/3/21, CP 8,700,000 8,700,0000.4% 3/11/21, CP 12,300,000 12,300,0000.4% 3/11/21, CP 9,700,000 9,700,000
New York State Dorm. Auth.:Bonds Series 2017 A, 5% 2/15/21 750,000 751,365RAN Series 2020 B, 5% 3/31/21 60,435,000 60,866,608
New York State Urban Eev Corp. Bonds Series 2019 A, 5% 3/15/21 430,000 432,368New York Urban Dev. Corp. Rev. Bonds:
Series 2004 A2, 5.5% 3/15/21 1,850,000 1,861,283Series 2013 C, 5% 3/15/21 200,000 201,085Series 2016 A, 5% 3/15/21 5,000,000 5,019,909
Plainedge Union Free School District TAN Series 2020, 2% 6/25/21 6,400,000 6,440,969Riverhead Central School District TAN:
Series 2020 A, 1.5% 2/26/21 6,100,000 6,105,189Series 2020 B, 1.5% 6/25/21 2,000,000 2,009,912
Rockville Ctr. Union Free School District TAN Series 2020, 1.5% 6/25/21 1,000,000 1,004,617Sayville Union Free School District TAN Series 2020, 2% 6/25/21 9,100,000 9,159,158

14Annual Report
See accompanying notes which are an integral part of the financial statements.
Schedule of Investments – continued
Other Municipal Security – continuedPrincipal Amount
Value
New York – continuedThree Village Central School District TAN Series 2020, 2% 6/25/21 $ 10,000,000 $ 10,061,607Uniondale Union Free School District TAN Series 2020, 2% 6/25/21 15,000,000 15,096,034
277,088,626New York And New Jersey – 1.8%Port Auth. of New York & New Jersey Series 2020:
0.22% 3/17/21, CP 3,500,000 3,500,0000.26% 2/3/21, CP 8,700,000 8,700,0000.28% 2/10/21, CP 11,100,000 11,100,0000.28% 3/3/21, CP 2,800,000 2,800,0000.3% 2/17/21, CP 4,500,000 4,500,000
30,600,000
TOTAL OTHER MUNICIPAL SECURITY(Cost $312,088,626) 312,088,626
Investment Company – 11.0%Shares
Fidelity Tax-Free Cash Central Fund .04% (f) (g)(Cost $191,372,073) 191,337,334 191,372,073
TOTAL INVESTMENT IN SECURITIES – 100.0%(Cost $1,742,503,199) 1,742,503,199
NET OTHER ASSETS (LIABILITIES) – 0.0% 729,828
NET ASSETS – 100% $1,743,233,027
Security Type AbbreviationsCP – COMMERCIAL PAPER
RAN – REVENUE ANTICIPATION NOTE
TAN – TAX ANTICIPATION NOTE
VRDN – VARIABLE RATE DEMAND NOTE (A debt instrument that is payable upon demand, either daily, weekly or monthly)
The date shown for securities represents the date when principal payments must be paid, taking into account any call options exercised by the issuer and any permissible maturity shortening features other than interest rate resets.
Legend(a) Coupon rates for floating and adjustable rate securities
reflect the rates in effect at period end.
(b) Provides evidence of ownership in one or more underlying municipal bonds.
(c) Coupon rates are determined by re-marketing agents based on current market conditions.
(d) Restricted securities (including private placements) – Investment in securities not registered under the Securities Act of 1933 (excluding 144A issues). At the end of the period, the value of restricted securities (excluding 144A issues) amounted to $9,100,000 or 0.5% of net assets.

15 Annual Report
See accompanying notes which are an integral part of the financial statements.
(e) Coupon is indexed to a floating interest rate which may be multiplied by a specified factor and/or subject to caps or floors.
(f) Information in this report regarding holdings by state and security types does not reflect the holdings of the Fidelity Tax-Free Cash Central Fund.
(g) Affiliated fund that is available only to investment companies and other accounts managed by Fidelity Investments. The rate quoted is the annualized seven-day yield of the fund at period end. A complete unaudited listing of the fund’s holdings as of its most recent quarter end is available upon request. In addition, each Fidelity Central Fund’s financial statements, which are not covered by the Fund’s Report of Independent Registered Public Accounting Firm, are available on the SEC’s website or upon request.
Additional information on each restricted holding is as follows:
Security Acquisition Date Cost
Alamo Cmnty. College District Rev. Bonds Series G-111, 0.24%, tender 5/3/21 (Liquidity Facility Royal Bank of Canada) 11/2/20 $ 400,000
Baltimore Proj. Rev. Bonds Series Floaters G 28, 0.24%, tender 7/1/21 (Liquidity Facility Royal Bank of Canada) 1/4/21 $ 1,100,000
Connecticut Spl. Tax Oblig. Trans. Infrastructure Rev. Bonds Series Floaters G 110, 0.22%, tender 4/1/21 (Liquidity Facility Royal Bank of Canada) 10/1/20 $ 1,900,000
Kentucky State Property & Buildings Commission Rev. Bonds Series G 116, 0.24%, tender 5/3/21 (Liquidity Facility Royal Bank of Canada) 11/2/20 $ 500,000
Security Acquisition Date Cost
Massachusetts Gen. Oblig. Bonds Series Clipper 09 67, 0.22%, tender 6/10/21 (Liquidity Facility State Street Bank & Trust Co., Boston) 8/12/20 $ 1,800,000
Massachusetts Gen. Oblig. Bonds Series Clipper 09 69, 0.22%, tender 6/17/21 (Liquidity Facility State Street Bank & Trust Co., Boston)
11/6/19 – 8/20/20 $ 600,000
Ohio Univ. Gen. Receipts Athens Bonds Series Floaters G 27, 0.24%, tender 6/1/21 (Liquidity Facility Royal Bank of Canada) 12/1/20 $ 800,000
Pennsylvania Higher Edl. Facilities Auth. Rev. Bonds Series 2016 E75, 0.21%, tender 6/1/21 (Liquidity Facility Royal Bank of Canada) 6/3/20 $ 800,000
Pennsylvania Tpk. Commission Tpk. Rev. Bonds Series Floaters G 43, 0.24%, tender 6/1/21 (Liquidity Facility Royal Bank of Canada) 12/1/20 $ 300,000
South Carolina Trans. Infrastructure Bank Rev. Bonds Series Floaters G 109, 0.24%, tender 4/1/21 (Liquidity Facility Royal Bank of Canada) 10/1/20 $ 400,000
Virginia Pub. Bldg. Auth. Pub. Facilities Rev. Bonds Series Floaters G 40, 0.24%, tender 8/2/21 (Liquidity Facility Royal Bank of Canada) 8/3/20 $ 500,000

16Annual Report
See accompanying notes which are an integral part of the financial statements.
Schedule of Investments – continued
Affiliated Central FundsInformation regarding fiscal year to date income earned by the Fund from investments in Fidelity Central Funds is as follows:
Fund Income earnedFidelity Tax-Free Cash Central Fund $ 331,226Total $ 331,226
Amounts in the income column in the above table include any capital gain distributions from underlying funds, which are presented in the corresponding line-item in the Statement of Operations, if applicable.
The value, beginning of period, for the Fidelity Tax-Free Central Fund was $58,754,000. Net realized gain (loss) and change in net unrealized appreciation (depreciation) on Fidelity Cash Central Fund is presented in the Statement of Operations, if applicable. Purchases and sales of the Fidelity Cash Central Fund were $944,432,999 and $811,815,400, respectively, during the period.
Investment ValuationAll investments are categorized as Level 2 under the Fair Value Hierarchy. The inputs or methodology used for valuing securities may not be an indication of the risk associated with investing in those securities. For more information on valuation inputs please refer to the Investment Valuation section in the accompanying Notes to Financial Statements.

17 Annual Report
See accompanying notes which are an integral part of the financial statements.
Financial Statements
Statement of Assets and LiabilitiesJanuary 31, 2021
Assets Investment in securities, at value — See accompanying schedule:
Unaffiliated issuers (cost $1,551,131,126) $ 1,551,131,126Fidelity Central Funds (cost $191,372,073) 191,372,073
Total Investment in Securities (cost $1,742,503,199) $ 1,742,503,199Cash 6,071,895Receivable for fund shares sold 2,345,534Interest receivable 4,573,983Distributions receivable from Fidelity Central Funds 9,467Receivable from investment adviser for expense reductions 50,727Other receivables 18
Total assets 1,755,554,823
Liabilities Payable for fund shares redeemed 12,041,347Distributions payable 1,847Accrued management fee 277,633Other affiliated payables 969
Total liabilities 12,321,796
Net Assets $ 1,743,233,027
Net Assets consist of: Paid in capital $ 1,742,998,857Total accumulated earnings (loss) 234,170Net Assets $ 1,743,233,027
Net Asset Value and Maximum Offering Price New York AMT Tax-Free Money Market Fund: Net Asset Value, offering price and redemption price per share ($468,985,826 ÷
468,571,403 shares) $ 1.00
Institutional Class: Net Asset Value, offering price and redemption price per share ($1,274,107,065 ÷
1,273,109,431 shares) $ 1.00
Service Class: Net Asset Value, offering price and redemption price per share ($140,136 ÷ 140,024
shares) $ 1.00
18Annual Report
See accompanying notes which are an integral part of the financial statements.
Financial Statements – continued
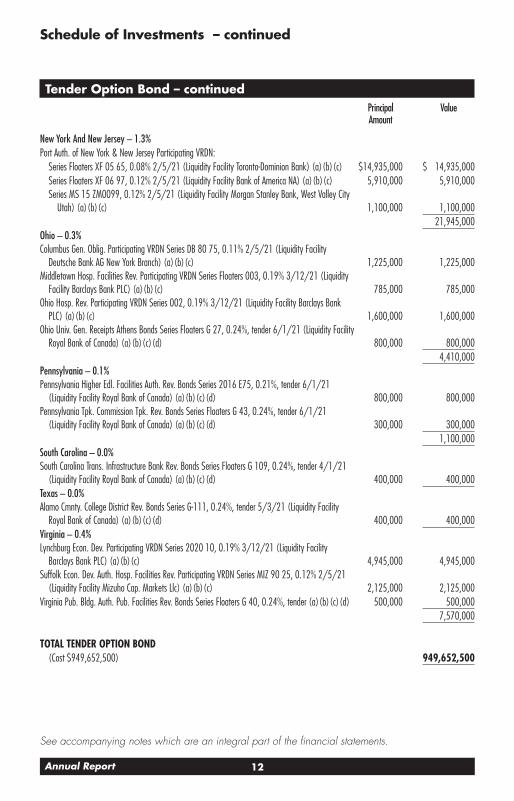
Statement of OperationsYear ended January
31, 2021
Investment Income Interest $ 12,503,422Income from Fidelity Central Funds 329,199
Total income 12,832,621
Expenses Management fee $ 4,174,792Transfer agent fees 1,300,278Distribution and service plan fees 739Independent trustees’ fees and expenses 7,040Miscellaneous 40,805
Total expenses before reductions 5,523,654Expense reductions (1,064,521)Total expenses after reductions 4,459,133
Net investment income (loss) 8,373,488Realized and Unrealized Gain (Loss) Net realized gain (loss) on:
Investment securities: Unaffiliated issuers 506,677Fidelity Central Funds 474
Capital gain distributions from Fidelity Central Funds 2,027Total net realized gain (loss) 509,178Net increase in net assets resulting from operations $ 8,882,666

19 Annual Report
See accompanying notes which are an integral part of the financial statements.
Statement of Changes in Net AssetsYear ended
January 31, 2021
Year ended January 31,
2020Increase (Decrease) in Net Assets Operations
Net investment income (loss) $ 8,373,488 $ 28,703,140Net realized gain (loss) 509,178 446,597Net increase in net assets resulting from operations 8,882,666 29,149,737
Distributions to shareholders (8,555,119) (28,847,521)Share transactions – net increase (decrease) (791,972,341) 597,924,359
Total increase (decrease) in net assets (791,644,794) 598,226,575
Net Assets Beginning of period 2,534,877,821 1,936,651,246End of period $ 1,743,233,027 $ 2,534,877,821
20Annual Report
See accompanying notes which are an integral part of the financial statements.
Financial Highlights
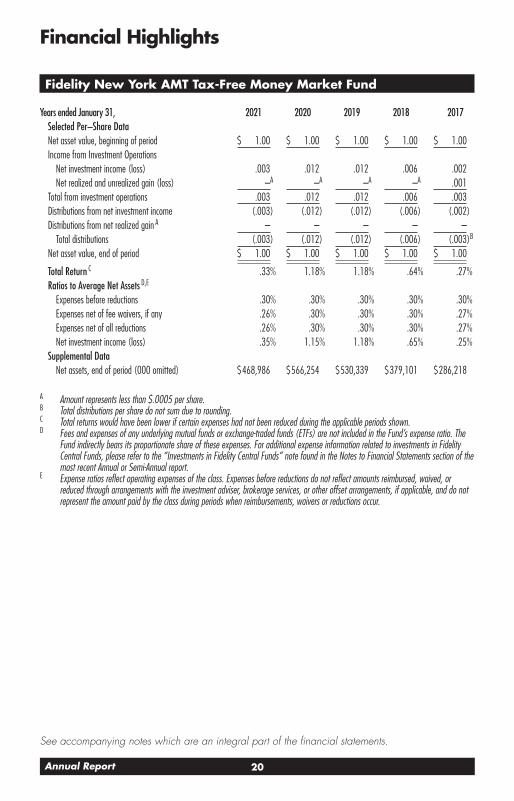
Fidelity New York AMT Tax-Free Money Market Fund
Years ended January 31, 2021 2020 2019 2018 2017Selected Per–Share Data Net asset value, beginning of period $ 1.00 $ 1.00 $ 1.00 $ 1.00 $ 1.00Income from Investment Operations
Net investment income (loss) .003 .012 .012 .006 .002Net realized and unrealized gain (loss) –A –A –A –A .001
Total from investment operations .003 .012 .012 .006 .003Distributions from net investment income (.003) (.012) (.012) (.006) (.002)Distributions from net realized gain A – – – – –
Total distributions (.003) (.012) (.012) (.006) (.003)B
Net asset value, end of period $ 1.00 $ 1.00 $ 1.00 $ 1.00 $ 1.00
Total Return C .33% 1.18% 1.18% .64% .27%Ratios to Average Net Assets D,E
Expenses before reductions .30% .30% .30% .30% .30%Expenses net of fee waivers, if any .26% .30% .30% .30% .27%Expenses net of all reductions .26% .30% .30% .30% .27%Net investment income (loss) .35% 1.15% 1.18% .65% .25%
Supplemental Data Net assets, end of period (000 omitted) $ 468,986 $ 566,254 $ 530,339 $ 379,101 $ 286,218
A Amount represents less than $.0005 per share.B Total distributions per share do not sum due to rounding.C Total returns would have been lower if certain expenses had not been reduced during the applicable periods shown.D Fees and expenses of any underlying mutual funds or exchange-traded funds (ETFs) are not included in the Fund’s expense ratio. The
Fund indirectly bears its proportionate share of these expenses. For additional expense information related to investments in Fidelity Central Funds, please refer to the “Investments in Fidelity Central Funds” note found in the Notes to Financial Statements section of the most recent Annual or Semi-Annual report.
E Expense ratios reflect operating expenses of the class. Expenses before reductions do not reflect amounts reimbursed, waived, or reduced through arrangements with the investment adviser, brokerage services, or other offset arrangements, if applicable, and do not represent the amount paid by the class during periods when reimbursements, waivers or reductions occur.

21 Annual Report
See accompanying notes which are an integral part of the financial statements.
Fidelity New York AMT Tax-Free Money Market Fund Institutional Class
Years ended January 31, 2021 2020 2019 2018 2017Selected Per–Share Data Net asset value, beginning of period $ 1.00 $ 1.00 $ 1.00 $ 1.00 $ 1.00Income from Investment Operations
Net investment income (loss) .004 .013 .013 .007 .003Net realized and unrealized gain (loss) A – – – – –
Total from investment operations .004 .013 .013 .007 .003Distributions from net investment income (.004) (.013) (.013) (.007) (.003)Distributions from net realized gain –A –A –A –A –
Total distributions (.004) (.013) (.013) (.007) (.003)Net asset value, end of period $ 1.00 $ 1.00 $ 1.00 $ 1.00 $ 1.00
Total Return B .39% 1.28% 1.28% .74% .32%Ratios to Average Net Assets C,D
Expenses before reductions .25% .25% .25% .25% .25%Expenses net of fee waivers, if any .20% .20% .20% .20% .19%Expenses net of all reductions .20% .20% .20% .20% .19%Net investment income (loss) .42% 1.25% 1.28% .75% .33%
Supplemental Data Net assets, end of period (000 omitted) $ 1,274,107 $ 1,968,318 $ 1,405,962 $ 1,013,988 $ 639,741
A Amount represents less than $.0005 per share.B Total returns would have been lower if certain expenses had not been reduced during the applicable periods shown.C Fees and expenses of any underlying mutual funds or exchange-traded funds (ETFs) are not included in the Fund’s expense ratio. The
Fund indirectly bears its proportionate share of these expenses. For additional expense information related to investments in Fidelity Central Funds, please refer to the “Investments in Fidelity Central Funds” note found in the Notes to Financial Statements section of the most recent Annual or Semi-Annual report.
D Expense ratios reflect operating expenses of the class. Expenses before reductions do not reflect amounts reimbursed, waived, or reduced through arrangements with the investment adviser, brokerage services, or other offset arrangements, if applicable, and do not represent the amount paid by the class during periods when reimbursements, waivers or reductions occur.

22Annual Report
See accompanying notes which are an integral part of the financial statements.
Financial Highlights – continued
Fidelity New York AMT Tax-Free Money Market Fund Service Class
Years ended January 31, 2021 2020 2019 2018 2017Selected Per–Share Data Net asset value, beginning of period $ 1.00 $ 1.00 $ 1.00 $ 1.00 $ 1.00Income from Investment Operations
Net investment income (loss) .003 .010 .010 .005 .001Net realized and unrealized gain (loss) A – – – – –
Total from investment operations .003 .010 .010 .005 .001Distributions from net investment income (.003) (.010) (.010) (.005) (.001)Distributions from net realized gain A – – – – –
Total distributions (.003) (.010) (.010) (.005) (.001)Net asset value, end of period $ 1.00 $ 1.00 $ 1.00 $ 1.00 $ 1.00
Total Return B .27% 1.03% 1.02% .49% .13%Ratios to Average Net Assets C,D
Expenses before reductions .50% .50% .50% .50% .50%Expenses net of fee waivers, if any .36% .45% .45% .45% .38%Expenses net of all reductions .36% .45% .45% .45% .38%Net investment income (loss) .26% 1.00% 1.03% .50% .14%
Supplemental Data Net assets, end of period (000 omitted) $ 140 $ 306 $ 350 $ 134 $ 133
A Amount represents less than $.0005 per share.B Total returns would have been lower if certain expenses had not been reduced during the applicable periods shown.C Fees and expenses of any underlying mutual funds or exchange-traded funds (ETFs) are not included in the Fund’s expense ratio. The
Fund indirectly bears its proportionate share of these expenses. For additional expense information related to investments in Fidelity Central Funds, please refer to the “Investments in Fidelity Central Funds” note found in the Notes to Financial Statements section of the most recent Annual or Semi-Annual report.
D Expense ratios reflect operating expenses of the class. Expenses before reductions do not reflect amounts reimbursed, waived, or reduced through arrangements with the investment adviser, brokerage services, or other offset arrangements, if applicable, and do not represent the amount paid by the class during periods when reimbursements, waivers or reductions occur.

23 Annual Report
Notes to Financial StatementsFor the period ended January 31, 2021
1. Organization.
Fidelity New York AMT Tax-Free Money Market Fund (the Fund) is a fund of Fidelity New York Municipal Trust II (the Trust) and is authorized to issue an unlimited number of shares. The Trust is registered under the Investment Company Act of 1940, as amended (the 1940 Act), as an open-end management investment company organized as a Delaware statutory trust. The Fund offers New York AMT Tax-Free Money Market Fund, Institutional Class and Service Class shares, each of which has equal rights as to assets and voting privileges. Each class has exclusive voting rights with respect to matters that affect that class. Shares of the Fund are only available for purchase by retail shareholders The Fund may be affected by economic and political developments in the state of New York.
2. Investments in Fidelity Central Funds.
The Fund invests in Fidelity Central Funds, which are open-end investment companies generally available only to other investment companies and accounts managed by the investment adviser and its affiliates. The Fund’s Schedule of Investments lists each of the Fidelity Central Funds held as of period end, if any, as an investment of the Fund, but does not include the underlying holdings of each Fidelity Central Fund. As an Investing Fund, the Fund indirectly bears its proportionate share of the expenses of the underlying Fidelity Central Funds.
The Money Market Central Funds seek preservation of capital and current income and are managed by the investment adviser. Annualized expenses of the Money Market Central Funds as of their most recent shareholder report date ranged from less than .005% to .01%.
A complete unaudited list of holdings for each Fidelity Central Fund is available upon request or at the Securities and Exchange Commission (the SEC) website at www.sec.gov. In addition, the financial statements of the Fidelity Central Funds, which are not covered by the Fund’s Report of Independent Registered Public Accounting Firm, are available on the SEC website or upon request.
3. Significant Accounting Policies.
The Fund is an investment company and applies the accounting and reporting guidance of the Financial Accounting Standards Board (FASB) Accounting Standards Codification Topic 946 Financial Services – Investment Companies. The financial statements have been prepared in conformity with accounting principles generally accepted in the United States of America (GAAP), which require management to make certain estimates and assumptions at the date of the financial statements. Actual results could differ from those estimates. Subsequent events, if any, through the date that the financial statements were issued have been evaluated in the preparation of the financial statements. The following summarizes the significant accounting policies of the Fund:
Investment Valuation. The Fund categorizes the inputs to valuation techniques used to value its investments into a disclosure hierarchy consisting of three levels as shown below:
Level 1 – quoted prices in active markets for identical investments
Level 2 – other significant observable inputs (including quoted prices for similar investments, interest rates, prepayment speeds, etc.)
Level 3 – unobservable inputs (including the Fund’s own assumptions based on the best information available)

24Annual Report
Notes to Financial Statements – continued
As permitted by compliance with certain conditions under Rule 2a-7 of the 1940 Act, securities are valued at amortized cost, which approximates fair value. The amortized cost of an instrument is determined by valuing it at its original cost and thereafter amortizing any discount or premium from its face value at a constant rate until maturity. Securities held by a money market fund are generally high quality and liquid; however, they are reflected as Level 2 because the inputs used to determine fair value are not quoted prices in an active market.
Investment Transactions and Income. The net asset value per share for processing shareholder transactions is calcu-lated as of the close of business of the New York Stock Exchange (NYSE), normally 4:00 p.m. Eastern time. Security transactions, including the Fund’s investment activity in the Fidelity Central Funds, are accounted for as of trade date. Gains and losses on securities sold are determined on the basis of identified cost. Income and capital gain distributions from Fidelity Central Funds, if any, are recorded on the ex-dividend date. Interest income is accrued as earned and includes coupon interest and amortization of premium and accretion of discount on debt securities as applicable.
Class Allocations and Expenses. Investment income, realized and unrealized capital gains and losses, common expenses of the Fund, and certain fund-level expense reductions, if any, are allocated daily on a pro-rata basis to each class based on the relative net assets of each class to the total net assets of the Fund. Each class differs with respect to transfer agent and distribution and service plan fees incurred. Certain expense reductions may also differ by class. For the reporting period, the allocated portion of income and expenses to each class as a percent of its average net assets may vary due to the timing of recording these transactions in relation to fluctuating net assets of the classes. Expenses directly attributable to a fund are charged to that fund. Expenses attributable to more than one fund are allo-cated among the respective funds on the basis of relative net assets or other appropriate methods. Expense estimates are accrued in the period to which they relate and adjustments are made when actual amounts are known.
Income Tax Information and Distributions to Shareholders. Each year, the Fund intends to qualify as a regulated investment company under Subchapter M of the Internal Revenue Code, including distributing substantially all of its taxable income and realized gains. As a result, no provision for U.S. Federal income taxes is required. During the period, the Fund incurred a corporate tax liability on undistributed short-term capital gain and undistributed long-term capital gain, which are included in Miscellaneous expense on the Statement of Operations. As of January 31, 2021, the Fund did not have any unrecognized tax benefits in the financial statements; nor is the Fund aware of any tax positions for which it is reasonably possible that the total amounts of unrecognized tax benefits will significantly change in the next twelve months. The Fund files a U.S. federal tax return, in addition to state and local tax returns as required. The Fund’s federal income tax returns are subject to examination by the Internal Revenue Service (IRS) for a period of three fiscal years after they are filed. State and local tax returns may be subject to examination for an additional fiscal year depending on the jurisdiction.
Distributions are declared and recorded daily and paid monthly from net investment income. Distributions from realized gains, if any, are declared and recorded on the ex-dividend date. Income and capital gain distributions are declared separately for each class. Income and capital gain distributions are determined in accordance with income tax regulations, which may differ from GAAP. In addition, the Fund claimed a portion of the payment made to redeeming shareholders as a distribution for income tax purposes.
Capital accounts within the financial statements are adjusted for permanent book-tax differences. These adjustments have no impact on net assets or the results of operations. Capital accounts are not adjusted for temporary book-tax differences which will reverse in a subsequent period.
25 Annual Report
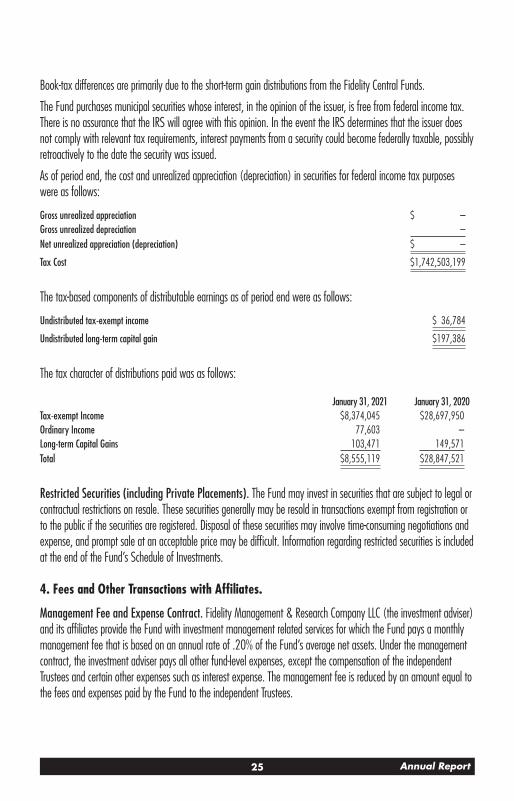
Book-tax differences are primarily due to the short-term gain distributions from the Fidelity Central Funds.
The Fund purchases municipal securities whose interest, in the opinion of the issuer, is free from federal income tax. There is no assurance that the IRS will agree with this opinion. In the event the IRS determines that the issuer does not comply with relevant tax requirements, interest payments from a security could become federally taxable, possibly retroactively to the date the security was issued.
As of period end, the cost and unrealized appreciation (depreciation) in securities for federal income tax purposes were as follows:
Gross unrealized appreciation $ –Gross unrealized depreciation –Net unrealized appreciation (depreciation) $ –
Tax Cost $ 1,742,503,199
The tax-based components of distributable earnings as of period end were as follows:
Undistributed tax-exempt income $ 36,784
Undistributed long-term capital gain $ 197,386
The tax character of distributions paid was as follows:
January 31, 2021 January 31, 2020Tax-exempt Income $ 8,374,045 $ 28,697,950Ordinary Income 77,603 –Long-term Capital Gains 103,471 149,571Total $ 8,555,119 $ 28,847,521
Restricted Securities (including Private Placements). The Fund may invest in securities that are subject to legal or contractual restrictions on resale. These securities generally may be resold in transactions exempt from registration or to the public if the securities are registered. Disposal of these securities may involve time-consuming negotiations and expense, and prompt sale at an acceptable price may be difficult. Information regarding restricted securities is included at the end of the Fund’s Schedule of Investments.
4. Fees and Other Transactions with Affiliates.
Management Fee and Expense Contract. Fidelity Management & Research Company LLC (the investment adviser) and its affiliates provide the Fund with investment management related services for which the Fund pays a monthly management fee that is based on an annual rate of .20% of the Fund’s average net assets. Under the management contract, the investment adviser pays all other fund-level expenses, except the compensation of the independent Trustees and certain other expenses such as interest expense. The management fee is reduced by an amount equal to the fees and expenses paid by the Fund to the independent Trustees.

26Annual Report
Notes to Financial Statements – continued
In addition, under the expense contract, the investment adviser pays class-level expenses for New York AMT Tax-Free Money Market Fund so that the total expenses do not exceed .35%, expressed as a percentage of class average net assets, with certain exceptions such as interest expense.
Distribution and Service Plan Fees. In accordance with Rule 12b-1 of the 1940 Act, the Fund has adopted separate Distribution and Service Plans for each class of shares. Service Class pays Fidelity Distributors Company LLC (FDC), an affiliate of the investment adviser, a Service Fee based on an annual percentage of Service Class’ average net assets. In addition, FDC may pay financial intermediaries for selling shares of the Fund and providing shareholder support services. For the period, the Service Fee rate, total service fees and amounts retained by FDC were as follows:
Service Fee Total Fees Retained by FDCService Class .25% $ 739 $ 380
During the period, the investment adviser or its affiliates waived a portion of these fees.
Transfer Agent Fees. Fidelity Investments Institutional Operations Company LLC (FIIOC), an affiliate of the investment adviser, is the transfer, dividend disbursing and shareholder servicing agent for the Fund. FIIOC receives asset-based fees with respect to each account. FIIOC pays for typesetting, printing and mailing of shareholder reports, except proxy statements. Each class, with the exception of New York AMT Tax-Free Money Market Fund, pays a transfer agent fee equal to an annual rate of .05% of class-level average net assets. New York AMT Tax-Free Money Market Fund pays a transfer agent fee equal to an annual rate of .10% of class-level average net assets. For the period, transfer agent fees for each class were as follows:
AmountNew York AMT Tax-Free Money Market Fund $ 509,640Institutional Class 790,490Service Class 148
$ 1,300,278
During the period, the investment adviser or its affiliates waived a portion of these fees.
Interfund Trades. Funds may purchase from or sell securities to other Fidelity Funds under procedures adopted by the Board. The procedures have been designed to ensure these interfund trades are executed in accordance with Rule 17a-7 of the 1940 Act. Interfund trades amounted to $180,039,035 and $423,205,500, respectively.
5. Expense Reductions.
The investment adviser contractually agreed to reimburse Institutional Class and Service Class to the extent annual operating expenses, expressed as a percentage of each class’ average net assets, exceed .20% and .45%, respec-tively. Some expenses, for example the compensation of the independent Trustees and certain other expenses such as interest expense, are excluded from this reimbursement. During the period, this reimbursement reduced Institutional Class and Service Class expenses by $795,345 and $151, respectively.

27 Annual Report
Additionally, the investment adviser or its affiliates voluntarily agreed to waive certain fees in order to avoid a negative yield. Such arrangements may be discontinued by the investment adviser at any time. For the period, the amount of the waiver for each class was as follows:
New York AMT Tax-Free Money Market Fund $ 211,035Institutional Class 55,378Service Class 276
In addition, through arrangements with the Fund’s custodian, credits realized as a result of certain uninvested cash balances were used to reduce the Fund’s expenses. During the period, custodian credits reduced the Fund’s expenses by $2,336.
6. Distributions to Shareholders.
Distributions to shareholders of each class were as follows:
Year ended January 31, 2021
Year ended January 31, 2020
Distributions to shareholders New York AMT Tax-Free Money Market Fund $ 1,752,983 $ 6,503,807Institutional Class 6,800,969 22,339,323Service Class 1,167 4,391Total $ 8,555,119 $ 28,847,521
7. Share Transactions.
Share transactions for each class of shares at a $1.00 per share were as follows and may contain automatic conver-sions between classes or exchanges between affiliated funds:
Shares Shares Dollars DollarsYear
ended January 31,
2021
Year ended
January 31, 2020
Year ended
January 31, 2021
Year ended
January 31, 2020
New York AMT Tax-Free Money Market Fund
Shares sold 333,996,746 459,937,173 $ 333,996,746 $ 459,937,173Reinvestment of distributions 1,621,170 5,999,667 1,621,170 5,999,667Shares redeemed (433,008,309) (430,068,494) (433,008,309) (430,068,494)Net increase (decrease) (97,390,393) 35,868,346 $ (97,390,393) $ 35,868,346
Institutional Class Shares sold 1,436,909,619 2,176,417,079 $ 1,436,909,619 $ 2,176,417,079Reinvestment of distributions 5,832,425 19,766,099 5,832,425 19,766,099Shares redeemed (2,137,158,639) (1,634,082,440) (2,137,158,639) (1,634,082,440)Net increase (decrease) (694,416,595) 562,100,738 $ (694,416,595) $ 562,100,738

28Annual Report
Notes to Financial Statements – continued
Shares Shares Dollars DollarsYear
ended January 31,
2021
Year ended
January 31, 2020
Year ended
January 31, 2021
Year ended
January 31, 2020
Service Class Shares sold 180,367 228,450 $ 180,367 $ 228,450Reinvestment of distributions 1,167 4,393 1,167 4,393Shares redeemed (346,887) (277,568) (346,887) (277,568)Net increase (decrease) (165,353) (44,725) $ (165,353) $ (44,725)
8. Other.
The Fund’s organizational documents provide former and current trustees and officers with a limited indemnification against liabilities arising in connection with the performance of their duties to the Fund. In the normal course of busi-ness, the Fund may also enter into contracts that provide general indemnifications. The Fund’s maximum exposure under these arrangements is unknown as this would be dependent on future claims that may be made against the Fund. The risk of material loss from such claims is considered remote.
9. Coronavirus (COVID-19) Pandemic.
An outbreak of COVID-19 first detected in China during December 2019 has since spread globally and was declared a pandemic by the World Health Organization during March 2020. Developments that disrupt global economies and financial markets, such as the COVID-19 pandemic, may magnify factors that affect the Fund’s performance.

29 Annual Report
Report of Independent Registered Public Accounting FirmTo the Board of Trustees of Fidelity New York Municipal Trust II and Shareholders of Fidelity New York AMT Tax-Free Money Market Fund
Opinion on the Financial Statements and Financial HighlightsWe have audited the accompanying statement of assets and liabilities of Fidelity New York AMT Tax-Free Money Market Fund (the “Fund”), a fund of Fidelity New York Municipal Trust II, including the schedule of investments, as of January 31, 2021, the related statement of operations for the year then ended, the statement of changes in net assets for each of the two years in the period then ended, the financial highlights for each of the five years in the period then ended, and the related notes. In our opinion, the financial statements and financial highlights present fairly, in all material respects, the financial position of the Fund as of January 31, 2021, and the results of its operations for the year then ended, the changes in its net assets for each of the two years in the period then ended, and the financial highlights for each of the five years in the period then ended in conformity with accounting principles generally accepted in the United States of America.
Basis for OpinionThese financial statements and financial highlights are the responsibility of the Fund’s management. Our responsibility is to express an opinion on the Fund’s financial statements and financial highlights based on our audits. We are a public accounting firm registered with the Public Company Accounting Oversight Board (United States) (PCAOB) and are required to be independent with respect to the Fund in accordance with the U.S. federal securities laws and the applicable rules and regulations of the Securities and Exchange Commission and the PCAOB.
We conducted our audits in accordance with the standards of the PCAOB. Those standards require that we plan and perform the audit to obtain reasonable assurance about whether the financial statements and financial highlights are free of material misstatement, whether due to error or fraud. The Fund is not required to have, nor were we engaged to perform, an audit of its internal control over financial reporting. As part of our audits we are required to obtain an understanding of internal control over financial reporting but not for the purpose of expressing an opinion on the effectiveness of the Fund’s internal control over financial reporting. Accordingly, we express no such opinion.
Our audits included performing procedures to assess the risks of material misstatement of the financial statements and financial highlights, whether due to error or fraud, and performing procedures that respond to those risks. Such procedures included examining, on a test basis, evidence regarding the amounts and disclosures in the financial statements and financial highlights. Our audits also included evaluating the accounting principles used and significant estimates made by management, as well as evaluating the overall presentation of the financial statements and financial highlights. Our procedures included confirmation of securities owned as of January 31, 2021, by correspondence with the custodian and brokers; when replies were not received from brokers, we performed other auditing procedures. We believe that our audits provide a reasonable basis for our opinion.
/s/ Deloitte & Touche LLP Boston, Massachusetts March 16, 2021
We have served as the auditor of one or more of the Fidelity investment companies since 1999.

30Annual Report
Trustees and Officers
The Trustees, Members of the Advisory Board (if any), and officers of the trust and fund, as applicable, are listed below. The Board of Trustees governs the fund and is responsible for protecting the interests of shareholders. The Trustees are experienced executives who meet periodically throughout the year to oversee the fund’s activities, review contractual arrangements with companies that provide services to the fund, oversee management of the risks associated with such activities and contractual arrangements, and review the fund’s performance. Each of the Trustees oversees 280 funds.
The Trustees hold office without limit in time except that (a) any Trustee may resign; (b) any Trustee may be removed by written instrument, signed by at least two-thirds of the number of Trustees prior to such removal; (c) any Trustee who requests to be retired or who has become incapacitated by illness or injury may be retired by written instrument signed by a majority of the other Trustees; and (d) any Trustee may be removed at any special meeting of sharehold-ers by a two-thirds vote of the outstanding voting securities of the trust. Each Trustee who is not an interested person (as defined in the 1940 Act) of the trust and the fund is referred to herein as an Independent Trustee. Each Independent Trustee shall retire not later than the last day of the calendar year in which his or her 75th birthday occurs. The Independent Trustees may waive this mandatory retirement age policy with respect to individual Trustees. Officers and Advisory Board Members hold office without limit in time, except that any officer or Advisory Board Member may resign or may be removed by a vote of a majority of the Trustees at any regular meeting or any special meeting of the Trustees. Except as indicated, each individual has held the office shown or other offices in the same company for the past five years.
The fund’s Statement of Additional Information (SAI) includes more information about the Trustees. To request a free copy, call Fidelity at 1-800-544-8544 for Fidelity® New York AMT Tax-Free Money Market Fund or at 1-877-208-0098 for Institutional Class and Service Class.
Experience, Skills, Attributes, and Qualifications of the Trustees. The Governance and Nominating Committee has adopted a statement of policy that describes the experience, qualifications, attributes, and skills that are necessary and desirable for potential Independent Trustee candidates (Statement of Policy). The Board believes that each Trustee satisfied at the time he or she was initially elected or appointed a Trustee, and continues to satisfy, the standards con-templated by the Statement of Policy. The Governance and Nominating Committee also engages professional search firms to help identify potential Independent Trustee candidates who have the experience, qualifications, attributes, and skills consistent with the Statement of Policy. From time to time, additional criteria based on the composition and skills of the current Independent Trustees, as well as experience or skills that may be appropriate in light of future changes to board composition, business conditions, and regulatory or other developments, have also been considered by the professional search firms and the Governance and Nominating Committee. In addition, the Board takes into account the Trustees’ commitment and participation in Board and committee meetings, as well as their leadership of standing and ad hoc committees throughout their tenure.
In determining that a particular Trustee was and continues to be qualified to serve as a Trustee, the Board has considered a variety of criteria, none of which, in isolation, was controlling. The Board believes that, collectively, the Trustees have balanced and diverse experience, qualifications, attributes, and skills, which allow the Board to operate effectively in governing the fund and protecting the interests of shareholders. Information about the specific experi-ence, skills, attributes, and qualifications of each Trustee, which in each case led to the Board’s conclusion that the Trustee should serve (or continue to serve) as a trustee of the fund, is provided below.
31 Annual Report
Board Structure and Oversight Function. Abigail P. Johnson is an interested person and currently serves as Chairman. The Trustees have determined that an interested Chairman is appropriate and benefits shareholders because an interested Chairman has a personal and professional stake in the quality and continuity of services provided to the fund. Independent Trustees exercise their informed business judgment to appoint an individual of their choosing to serve as Chairman, regardless of whether the Trustee happens to be independent or a member of management. The Independent Trustees have determined that they can act independently and effectively without having an Independent Trustee serve as Chairman and that a key structural component for assuring that they are in a position to do so is for the Independent Trustees to constitute a substantial majority for the Board. The Independent Trustees also regularly meet in executive session. Arthur E. Johnson serves as Chairman of the Independent Trustees and as such (i) acts as a liaison between the Independent Trustees and management with respect to matters important to the Independent Trustees and (ii) with management prepares agendas for Board meetings.
Fidelity® funds are overseen by different Boards of Trustees. The fund’s Board oversees Fidelity’s investment-grade bond, money market, asset allocation and certain equity funds, and other Boards oversee Fidelity’s high income and other equity funds. The asset allocation funds may invest in Fidelity® funds that are overseen by such other Boards. The use of separate Boards, each with its own committee structure, allows the Trustees of each group of Fidelity® funds to focus on the unique issues of the funds they oversee, including common research, investment, and operational issues. On occasion, the separate Boards establish joint committees to address issues of overlapping consequences for the Fidelity® funds overseen by each Board.
The Trustees operate using a system of committees to facilitate the timely and efficient consideration of all matters of importance to the Trustees, the fund, and fund shareholders and to facilitate compliance with legal and regulatory requirements and oversight of the fund’s activities and associated risks. The Board, acting through its committees, has charged FMR and its affiliates with (i) identifying events or circumstances the occurrence of which could have demon-strably adverse effects on the fund’s business and/or reputation; (ii) implementing processes and controls to lessen the possibility that such events or circumstances occur or to mitigate the effects of such events or circumstances if they do occur; and (iii) creating and maintaining a system designed to evaluate continuously business and market condi-tions in order to facilitate the identification and implementation processes described in (i) and (ii) above. Because the day-to-day operations and activities of the fund are carried out by or through FMR, its affiliates, and other service providers, the fund’s exposure to risks is mitigated but not eliminated by the processes overseen by the Trustees. While each of the Board’s committees has responsibility for overseeing different aspects of the fund’s activities, oversight is exercised primarily through the Operations and Audit Committees. In addition, an ad hoc Board committee of Independent Trustees has worked with FMR to enhance the Board’s oversight of investment and financial risks, legal and regulatory risks, technology risks, and operational risks, including the development of additional risk report-ing to the Board. The Operations Committee also worked and continues to work with FMR to enhance the stress tests required under SEC regulations for money market funds. Appropriate personnel, including but not limited to the fund’s Chief Compliance Officer (CCO), FMR’s internal auditor, the independent accountants, the fund’s Treasurer and port-folio management personnel, make periodic reports to the Board’s committees, as appropriate, including an annual review of Fidelity’s risk management program for the Fidelity® funds. The responsibilities of each standing committee, including their oversight responsibilities, are described further under “Standing Committees of the Trustees.”
Interested Trustees*:
Correspondence intended for a Trustee who is an interested person may be sent to Fidelity Investments, 245 Summer Street, Boston, Massachusetts 02210.
32Annual Report
Trustees and Officers – continued
Name, Year of Birth; Principal Occupations and Other Relevant Experience+
Abigail P. Johnson (1961)
Year of Election or Appointment: 2009 Trustee Chairman of the Board of Trustees
Ms. Johnson also serves as Trustee of other Fidelity® funds. Ms. Johnson serves as Chairman (2016-pres-ent), Chief Executive Officer (2014-present), and Director (2007-present) of FMR LLC (diversified financial services company), President of Fidelity Financial Services (2012-present) and President of Personal, Workplace and Institutional Services (2005-present). Ms. Johnson is Chairman and Director of Fidelity Management & Research Company LLC (investment adviser firm, 2011-present). Previously, Ms. Johnson served as Chairman and Director of FMR Co., Inc. (investment adviser firm, 2011-2019), Vice Chairman (2007-2016) and President (2013-2016) of FMR LLC, President and a Director of Fidelity Management & Research Company (2001-2005), a Trustee of other investment companies advised by Fidelity Management & Research Company, Fidelity Investments Money Management, Inc. (investment adviser firm), and FMR Co., Inc. (2001-2005), Senior Vice President of the Fidelity® funds (2001-2005), and managed a number of Fidelity® funds. Ms. Abigail P. Johnson and Mr. Arthur E. Johnson are not related.
Jennifer Toolin McAuliffe (1959)
Year of Election or Appointment: 2016 Trustee
Ms. McAuliffe also serves as Trustee of other Fidelity® funds. Previously, Ms. McAuliffe served as Co-Head of Fixed Income of Fidelity Investments Limited (now known as FIL Limited (FIL)) (diversified financial services company), Director of Research for FIL’s credit and quantitative teams in London, Hong Kong and Tokyo and Director of Research for taxable and municipal bonds at Fidelity Investments Money Management, Inc. Ms. McAuliffe previously served as a member of the Advisory Board of certain Fidelity® funds (2016). Ms. McAuliffe was previously a lawyer at Ropes & Gray LLP and currently serves as director or trustee of several not-for-profit entities.
* Determined to be an “Interested Trustee” by virtue of, among other things, his or her affiliation with the trust or various entities under common control with FMR.
+ The information includes the Trustee’s principal occupation during the last five years and other information relating to the experience, attributes, and skills relevant to the Trustee’s qualifications to serve as a Trustee, which led to the conclusion that the Trustee should serve as a Trustee for the fund.
Independent Trustees:
Correspondence intended for an Independent Trustee may be sent to Fidelity Investments, P.O. Box 55235, Boston, Massachusetts 02205-5235.
Name, Year of Birth; Principal Occupations and Other Relevant Experience+
Elizabeth S. Acton (1951)
Year of Election or Appointment: 2013 Trustee
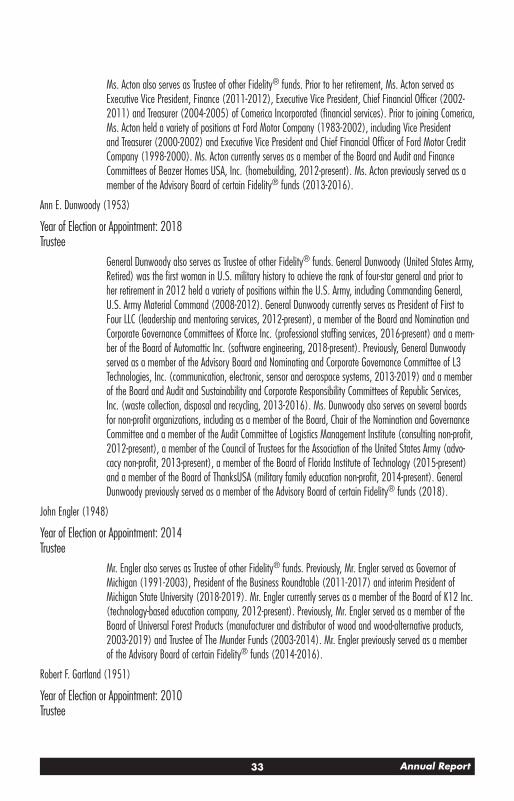
33 Annual Report
Ms. Acton also serves as Trustee of other Fidelity® funds. Prior to her retirement, Ms. Acton served as Executive Vice President, Finance (2011-2012), Executive Vice President, Chief Financial Officer (2002-2011) and Treasurer (2004-2005) of Comerica Incorporated (financial services). Prior to joining Comerica, Ms. Acton held a variety of positions at Ford Motor Company (1983-2002), including Vice President and Treasurer (2000-2002) and Executive Vice President and Chief Financial Officer of Ford Motor Credit Company (1998-2000). Ms. Acton currently serves as a member of the Board and Audit and Finance Committees of Beazer Homes USA, Inc. (homebuilding, 2012-present). Ms. Acton previously served as a member of the Advisory Board of certain Fidelity® funds (2013-2016).
Ann E. Dunwoody (1953)
Year of Election or Appointment: 2018 Trustee
General Dunwoody also serves as Trustee of other Fidelity® funds. General Dunwoody (United States Army, Retired) was the first woman in U.S. military history to achieve the rank of four-star general and prior to her retirement in 2012 held a variety of positions within the U.S. Army, including Commanding General, U.S. Army Material Command (2008-2012). General Dunwoody currently serves as President of First to Four LLC (leadership and mentoring services, 2012-present), a member of the Board and Nomination and Corporate Governance Committees of Kforce Inc. (professional staffing services, 2016-present) and a mem-ber of the Board of Automattic Inc. (software engineering, 2018-present). Previously, General Dunwoody served as a member of the Advisory Board and Nominating and Corporate Governance Committee of L3 Technologies, Inc. (communication, electronic, sensor and aerospace systems, 2013-2019) and a member of the Board and Audit and Sustainability and Corporate Responsibility Committees of Republic Services, Inc. (waste collection, disposal and recycling, 2013-2016). Ms. Dunwoody also serves on several boards for non-profit organizations, including as a member of the Board, Chair of the Nomination and Governance Committee and a member of the Audit Committee of Logistics Management Institute (consulting non-profit, 2012-present), a member of the Council of Trustees for the Association of the United States Army (advo-cacy non-profit, 2013-present), a member of the Board of Florida Institute of Technology (2015-present) and a member of the Board of ThanksUSA (military family education non-profit, 2014-present). General Dunwoody previously served as a member of the Advisory Board of certain Fidelity® funds (2018).
John Engler (1948)
Year of Election or Appointment: 2014 Trustee
Mr. Engler also serves as Trustee of other Fidelity® funds. Previously, Mr. Engler served as Governor of Michigan (1991-2003), President of the Business Roundtable (2011-2017) and interim President of Michigan State University (2018-2019). Mr. Engler currently serves as a member of the Board of K12 Inc. (technology-based education company, 2012-present). Previously, Mr. Engler served as a member of the Board of Universal Forest Products (manufacturer and distributor of wood and wood-alternative products, 2003-2019) and Trustee of The Munder Funds (2003-2014). Mr. Engler previously served as a member of the Advisory Board of certain Fidelity® funds (2014-2016).
Robert F. Gartland (1951)
Year of Election or Appointment: 2010 Trustee

34Annual Report
Trustees and Officers – continued
Mr. Gartland also serves as Trustee of other Fidelity® funds. Prior to his retirement, Mr. Gartland held a variety of positions at Morgan Stanley (financial services, 1979-2007), including Managing Director (1987-2007) and Chase Manhattan Bank (1975-1978). Mr. Gartland previously served as Chairman and an investor in Gartland & Mellina Group Corp. (consulting, 2009-2019), as a member of the Board of National Securities Clearing Corporation (1993-1996) and as Chairman of TradeWeb (2003-2004).
Arthur E. Johnson (1947)
Year of Election or Appointment: 2008 Trustee Chairman of the Independent Trustees
Mr. Johnson also serves as Trustee of other Fidelity® funds. Prior to his retirement, Mr. Johnson served as Senior Vice President of Corporate Strategic Development of Lockheed Martin Corporation (defense contractor, 1999-2009). Mr. Johnson currently serves as a member of the Board of Booz Allen Hamilton (management consulting, 2011-present). Mr. Johnson previously served as a member of the Board of Eaton Corporation plc (diversified power management, 2009-2019) and a member of the Board of AGL Resources, Inc. (holding company, 2002-2016). Mr. Johnson previously served as Vice Chairman (2015-2018) of the Independent Trustees of certain Fidelity® funds. Mr. Arthur E. Johnson is not related to Ms. Abigail P. Johnson.
Michael E. Kenneally (1954)
Year of Election or Appointment: 2009 Trustee Vice Chairman of the Independent Trustees
Mr. Kenneally also serves as Trustee of other Fidelity® funds. Prior to his retirement, Mr. Kenneally served as Chairman and Global Chief Executive Officer of Credit Suisse Asset Management and Executive Vice President and Chief Investment Officer of Bank of America Corporation. Earlier roles at Bank of America included Director of Research, Senior Portfolio Manager for various institutional equity accounts and mutual funds and Portfolio Manager for a number of institutional fixed-income clients. Mr. Kenneally began his career as a Research Analyst in 1983 and was awarded the Chartered Financial Analyst (CFA) designation in 1991.
Marie L. Knowles (1946)
Year of Election or Appointment: 2001 Trustee
Ms. Knowles also serves as Trustee of other Fidelity® funds. Prior to her retirement, Ms. Knowles held several positions at Atlantic Richfield Company (diversified energy), including Executive Vice President and Chief Financial Officer (1996-2000), Senior Vice President (1993-1996) and President of ARCO Transportation Company (pipeline and tanker operations, 1993-1996). Ms. Knowles currently serves as a member of the Board of McKesson Corporation (healthcare service, since 2002), a member of the Board of the Santa Catalina Island Company (real estate, 2009-present), a member of the Investment Company Institute Board of Governors and a member of the Governing Council of the Independent Directors Council (2014-present). Ms. Knowles also serves as a member of the Advisory Board for the School of Engineering of the University of Southern California. Ms. Knowles previously served as Chairman (2015-2018) and Vice Chairman (2012-2015) of the Independent Trustees of certain Fidelity® funds.

35 Annual Report
Mark A. Murray (1954)
Year of Election or Appointment: 2016 Trustee
Mr. Murray also serves as Trustee of other Fidelity® funds. Previously, Mr. Murray served as Co-Chief Executive Officer (2013-2016), President (2006-2013) and Vice Chairman (2013-2020) of Meijer, Inc. Mr. Murray serves as a member of the Board and Nuclear Review and Public Policy and Responsibility Committees of DTE Energy Company (diversified energy company, 2009-present) and a member of the Board and Audit Committee and Chairman of the Nominating and Corporate Governance Committee of Universal Forest Products, Inc. (manufacturer and distributor of wood and wood-alternative products, 2004-2016). Mr. Murray previously served as a member of the Board of Spectrum Health (not-for-profit health system, 2015-2019). Mr. Murray also serves as a member of the Board of many community and professional organizations. Mr. Murray previously served as a member of the Advisory Board of certain Fidelity® funds (2016).
+ The information includes the Trustee’s principal occupation during the last five years and other information relating to the experience, attributes, and skills relevant to the Trustee’s qualifications to serve as a Trustee, which led to the conclusion that the Trustee should serve as a Trustee for the fund.
Advisory Board Members and Officers:
Correspondence intended for an officer may be sent to Fidelity Investments, 245 Summer Street, Boston, Massachusetts 02210. Officers appear below in alphabetical order.
Name, Year of Birth; Principal Occupation
Craig S. Brown (1977)
Year of Election or Appointment: 2019 Assistant Treasurer
Mr. Brown also serves as Assistant Treasurer of other funds. Mr. Brown is an employee of Fidelity Investments (2013-present).
John J. Burke III (1964)
Year of Election or Appointment: 2018 Chief Financial Officer
Mr. Burke also serves as Chief Financial Officer of other funds. Mr. Burke serves as Head of Investment Operations for Fidelity Fund and Investment Operations (2018-present) and is an employee of Fidelity Investments (1998-present). Previously Mr. Burke served as head of Asset Management Investment Operations (2012-2018).
David J. Carter (1973)
Year of Election or Appointment: 2020 Assistant Secretary
Mr. Carter also serves as Assistant Secretary of other funds. Mr. Carter serves as Vice President, Associate General Counsel (2010-present) and is an employee of Fidelity Investments (2005-present).

36Annual Report
Trustees and Officers – continued
Jonathan Davis (1968)
Year of Election or Appointment: 2010 Assistant Treasurer
Mr. Davis also serves as Assistant Treasurer of other funds. Mr. Davis serves as Assistant Treasurer of FMR Capital, Inc. (2017-present) and is an employee of Fidelity Investments. Previously, Mr. Davis served as Vice President and Associate General Counsel of FMR LLC (diversified financial services company, 2003-2010).
Laura M. Del Prato (1964)
Year of Election or Appointment: 2018 President and Treasurer
Ms. Del Prato also serves as an officer of other funds. Ms. Del Prato is an employee of Fidelity Investments (2017-present). Previously, Ms. Del Prato served as President and Treasurer of The North Carolina Capital Management Trust: Cash Portfolio and Term Portfolio (2018-2020). Prior to joining Fidelity Investments, Ms. Del Prato served as a Managing Director and Treasurer of the JPMorgan Mutual Funds (2014-2017). Prior to JPMorgan, Ms. Del Prato served as a partner at Cohen Fund Audit Services (accounting firm, 2012-2013) and KPMG LLP (accounting firm, 2004-2012).
Colm A. Hogan (1973)
Year of Election or Appointment: 2016 Assistant Treasurer
Mr. Hogan also serves as an officer of other funds. Mr. Hogan serves as Assistant Treasurer of FMR Capital, Inc. (2017-present) and is an employee of Fidelity Investments (2005-present). Previously, Mr. Hogan served as Deputy Treasurer of certain Fidelity® funds (2016-2020) and Assistant Treasurer of certain Fidelity® funds (2016-2018).
Cynthia Lo Bessette (1969)
Year of Election or Appointment: 2019 Secretary and Chief Legal Officer (CLO)
Ms. Lo Bessette also serves as an officer of other funds. Ms. Lo Bessette serves as CLO, Secretary, and Senior Vice President of Fidelity Management & Research Company LLC (investment adviser firm, 2019-present); and CLO of Fidelity Management & Research (Hong Kong) Limited, FMR Investment Management (UK) Limited, and Fidelity Management & Research (Japan) Limited (investment adviser firms, 2019-present). She is a Senior Vice President and Deputy General Counsel of FMR LLC (diversified financial services company, 2019-present), and is an employee of Fidelity Investments. Previously, Ms. Lo Bessette served as CLO, Secretary, and Senior Vice President of FMR Co., Inc. (investment adviser firm, 2019); Secretary of Fidelity SelectCo, LLC and Fidelity Investments Money Management, Inc. (investment adviser firms, 2019). Prior to joining Fidelity Investments, Ms. Lo Bessette was Executive Vice President, General Counsel (2016-2019) and Senior Vice President, Deputy General Counsel (2015-2016) of OppenheimerFunds (investment management company) and Deputy Chief Legal Officer (2013-2015) of Jennison Associates LLC (investment adviser firm).

37 Annual Report
Chris Maher (1972)
Year of Election or Appointment: 2013 Assistant Treasurer
Mr. Maher also serves as an officer of other funds. Mr. Maher serves as Assistant Treasurer of FMR Capital, Inc. (2017-present), and is an employee of Fidelity Investments (2008-present). Previously, Mr. Maher served as Assistant Treasurer of certain funds (2013-2020); Vice President of Asset Management Compliance (2013), Vice President of the Program Management Group of FMR (investment adviser firm, 2010-2013), and Vice President of Valuation Oversight (2008-2010).
Jamie Pagliocco (1964)
Year of Election or Appointment: 2020 Vice President
Mr. Pagliocco also serves as Vice President of other funds. Mr. Pagliocco serves as President of Fixed Income (2020-present), and is an employee of Fidelity Investments (2001-present). Previously, Mr. Pagliocco served as Co-Chief Investment Officer – Bond (2017-2020), Global Head of Bond Trading (2016-2019), and as a portfolio manager.
Kenneth B. Robins (1969)
Year of Election or Appointment: 2020 Chief Compliance Officer
Mr. Robins also serves as an officer of other funds. Mr. Robins serves as Compliance Officer of Fidelity Management & Research Company LLC (investment adviser firm, 2016-present) and is an employee of Fidelity Investments (2004-present). Previously, Mr. Robins served as Compliance Officer of FMR Co., Inc. (investment adviser firm, 2016-2019), as Executive Vice President of Fidelity Investments Money Management, Inc. (investment adviser firm, 2013-2016) and served in other fund officer roles.
Brett Segaloff (1972)
Year of Election or Appointment: 2021 Anti-Money Laundering (AML) Officer
Mr. Segaloff also serves as an AML Officer of other funds and other related entities. He is Director, Anti-Money Laundering (2007-present) of FMR LLC (diversified financial services company) and is an employee of Fidelity Investments (1996-present).
Stacie M. Smith (1974)
Year of Election or Appointment: 2013 Assistant Treasurer
Ms. Smith also serves as an officer of other funds. Ms. Smith serves as Assistant Treasurer of FMR Capital, Inc. (2017-present), is an employee of Fidelity Investments (2009-present), and has served in other fund officer roles. Prior to joining Fidelity Investments, Ms. Smith served as Senior Audit Manager of Ernst & Young LLP (accounting firm, 1996-2009). Previously, Ms. Smith served as Assistant Treasurer (2013-2019) and Deputy Treasurer (2013-2016) of certain Fidelity® funds.
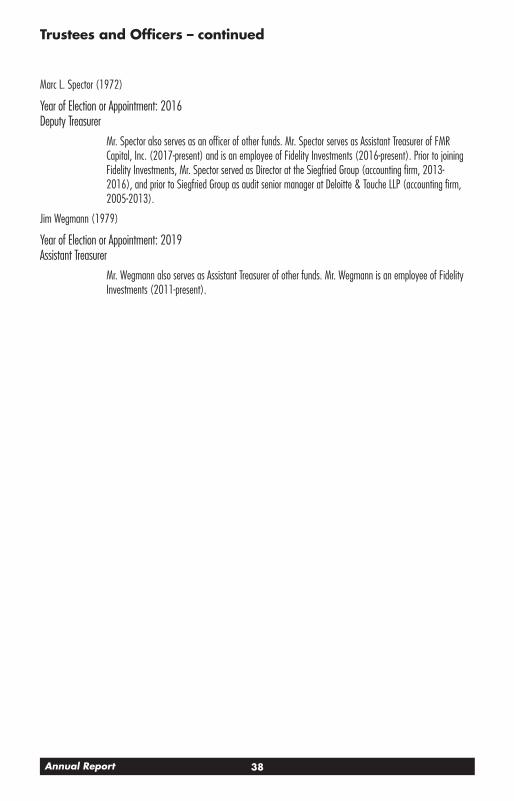
38Annual Report
Trustees and Officers – continued
Marc L. Spector (1972)
Year of Election or Appointment: 2016 Deputy Treasurer
Mr. Spector also serves as an officer of other funds. Mr. Spector serves as Assistant Treasurer of FMR Capital, Inc. (2017-present) and is an employee of Fidelity Investments (2016-present). Prior to joining Fidelity Investments, Mr. Spector served as Director at the Siegfried Group (accounting firm, 2013-2016), and prior to Siegfried Group as audit senior manager at Deloitte & Touche LLP (accounting firm, 2005-2013).
Jim Wegmann (1979)
Year of Election or Appointment: 2019 Assistant Treasurer
Mr. Wegmann also serves as Assistant Treasurer of other funds. Mr. Wegmann is an employee of Fidelity Investments (2011-present).

39 Annual Report
Shareholder Expense Example
As a shareholder, you incur two types of costs: (1) transaction costs, which may include sales charges (loads) on purchase payments or redemption proceeds, as applicable and (2) ongoing costs, which generally include manage-ment fees, distribution and/or service (12b-1) fees and other Fund expenses. This Example is intended to help you understand your ongoing costs (in dollars) of investing in a fund and to compare these costs with the ongoing costs of investing in other mutual funds.The Example is based on an investment of $1,000 invested at the beginning of the period and held for the entire period (August 1, 2020 to January 31, 2021).Actual ExpensesThe first line of the accompanying table provides information about actual account values and actual expenses. You may use the information in this line, together with the amount you invested, to estimate the expenses that you paid over the period. Simply divide your account value by $1,000.00 (for example, an $8,600 account value divided by $1,000.00 = 8.6), then multiply the result by the number in the first line for a class/Fund under the heading entitled “Expenses Paid During Period” to estimate the expenses you paid on your account during this period. If any fund is a shareholder of any underlying mutual funds or exchange-traded funds (ETFs) (the Underlying Funds), such fund indirectly bears its proportional share of the expenses of the Underlying Funds in addition to the direct expenses incurred presented in the table. These fees and expenses are not included in the annualized expense ratio used to calculate the expense estimate in the table below.Hypothetical Example for Comparison PurposesThe second line of the accompanying table provides information about hypothetical account values and hypothetical expenses based on the actual expense ratio and an assumed rate of return of 5% per year before expenses, which is not the actual return. The hypothetical account values and expenses may not be used to estimate the actual ending account balance or expenses you paid for the period. You may use this information to compare the ongoing costs of investing in the Fund and other funds. To do so, compare this 5% hypothetical example with the 5% hypothetical examples that appear in the shareholder reports of the other funds. If any fund is a shareholder of any Underlying Funds, such fund indirectly bears its proportional share of the expenses of the Underlying Funds in addition to the direct expenses as presented in the table. These fees and expenses are not included in the annualized expense ratio used to calculate the expense estimate in the table below.Please note that the expenses shown in the table are meant to highlight your ongoing costs only and do not reflect any transaction costs. Therefore, the second line of the table is useful in comparing ongoing costs only, and will not help you determine the relative total costs of owning different funds.
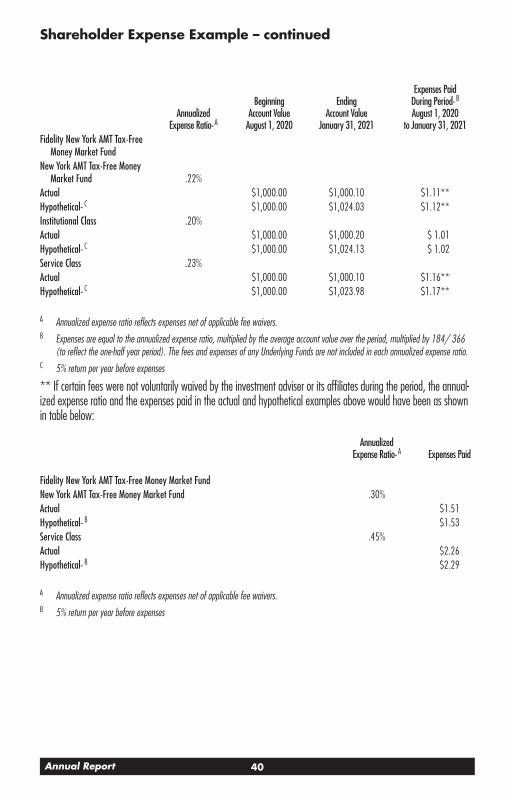
40Annual Report
Shareholder Expense Example – continued
Annualized Expense Ratio- A
Beginning Account Value
August 1, 2020
Ending Account Value
January 31, 2021
Expenses Paid During Period- B
August 1, 2020 to January 31, 2021
Fidelity New York AMT Tax-Free Money Market Fund
New York AMT Tax-Free Money Market Fund .22%
Actual $1,000.00 $1,000.10 $1.11**Hypothetical- C $1,000.00 $1,024.03 $1.12**Institutional Class .20%Actual $1,000.00 $1,000.20 $ 1.01Hypothetical- C $1,000.00 $1,024.13 $ 1.02Service Class .23%Actual $1,000.00 $1,000.10 $1.16**Hypothetical- C $1,000.00 $1,023.98 $1.17**
A Annualized expense ratio reflects expenses net of applicable fee waivers.B Expenses are equal to the annualized expense ratio, multiplied by the average account value over the period, multiplied by 184/ 366
(to reflect the one-half year period). The fees and expenses of any Underlying Funds are not included in each annualized expense ratio.C 5% return per year before expenses
** If certain fees were not voluntarily waived by the investment adviser or its affiliates during the period, the annual-ized expense ratio and the expenses paid in the actual and hypothetical examples above would have been as shown in table below:
Annualized Expense Ratio- A Expenses Paid
Fidelity New York AMT Tax-Free Money Market FundNew York AMT Tax-Free Money Market Fund .30%Actual $1.51Hypothetical- B $1.53Service Class .45%Actual $2.26Hypothetical- B $2.29
A Annualized expense ratio reflects expenses net of applicable fee waivers.B 5% return per year before expenses

41 Annual Report
Distributions (Unaudited)
The fund hereby designates as a capital gain dividend with respect to the taxable year ended January 31, 2021, $392,847, or, if subsequently determined to be different, the net capital gain of such year.
During fiscal year ended 2021, 100% of the fund’s income dividends were free from federal income tax, and 0% of the fund’s income dividends was subject to the federal alternative minimum tax.
The fund will notify shareholders in January 2022 of amounts for use in preparing 2021 income tax returns.
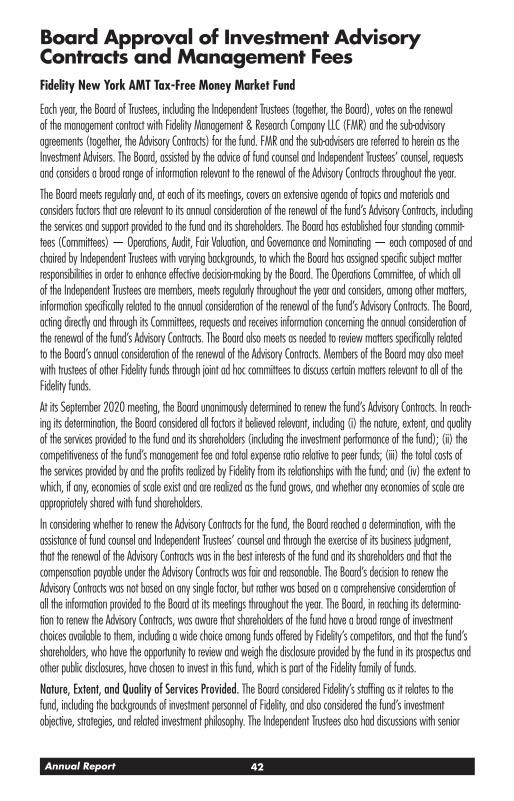
42Annual Report
Board Approval of Investment Advisory Contracts and Management FeesFidelity New York AMT Tax-Free Money Market Fund
Each year, the Board of Trustees, including the Independent Trustees (together, the Board), votes on the renewal of the management contract with Fidelity Management & Research Company LLC (FMR) and the sub-advisory agreements (together, the Advisory Contracts) for the fund. FMR and the sub-advisers are referred to herein as the Investment Advisers. The Board, assisted by the advice of fund counsel and Independent Trustees’ counsel, requests and considers a broad range of information relevant to the renewal of the Advisory Contracts throughout the year.
The Board meets regularly and, at each of its meetings, covers an extensive agenda of topics and materials and considers factors that are relevant to its annual consideration of the renewal of the fund’s Advisory Contracts, including the services and support provided to the fund and its shareholders. The Board has established four standing commit-tees (Committees) — Operations, Audit, Fair Valuation, and Governance and Nominating — each composed of and chaired by Independent Trustees with varying backgrounds, to which the Board has assigned specific subject matter responsibilities in order to enhance effective decision-making by the Board. The Operations Committee, of which all of the Independent Trustees are members, meets regularly throughout the year and considers, among other matters, information specifically related to the annual consideration of the renewal of the fund’s Advisory Contracts. The Board, acting directly and through its Committees, requests and receives information concerning the annual consideration of the renewal of the fund’s Advisory Contracts. The Board also meets as needed to review matters specifically related to the Board’s annual consideration of the renewal of the Advisory Contracts. Members of the Board may also meet with trustees of other Fidelity funds through joint ad hoc committees to discuss certain matters relevant to all of the Fidelity funds.
At its September 2020 meeting, the Board unanimously determined to renew the fund’s Advisory Contracts. In reach-ing its determination, the Board considered all factors it believed relevant, including (i) the nature, extent, and quality of the services provided to the fund and its shareholders (including the investment performance of the fund); (ii) the competitiveness of the fund’s management fee and total expense ratio relative to peer funds; (iii) the total costs of the services provided by and the profits realized by Fidelity from its relationships with the fund; and (iv) the extent to which, if any, economies of scale exist and are realized as the fund grows, and whether any economies of scale are appropriately shared with fund shareholders.
In considering whether to renew the Advisory Contracts for the fund, the Board reached a determination, with the assistance of fund counsel and Independent Trustees’ counsel and through the exercise of its business judgment, that the renewal of the Advisory Contracts was in the best interests of the fund and its shareholders and that the compensation payable under the Advisory Contracts was fair and reasonable. The Board’s decision to renew the Advisory Contracts was not based on any single factor, but rather was based on a comprehensive consideration of all the information provided to the Board at its meetings throughout the year. The Board, in reaching its determina-tion to renew the Advisory Contracts, was aware that shareholders of the fund have a broad range of investment choices available to them, including a wide choice among funds offered by Fidelity’s competitors, and that the fund’s shareholders, who have the opportunity to review and weigh the disclosure provided by the fund in its prospectus and other public disclosures, have chosen to invest in this fund, which is part of the Fidelity family of funds.
Nature, Extent, and Quality of Services Provided. The Board considered Fidelity’s staffing as it relates to the fund, including the backgrounds of investment personnel of Fidelity, and also considered the fund’s investment objective, strategies, and related investment philosophy. The Independent Trustees also had discussions with senior

43 Annual Report
management of Fidelity’s investment operations and investment groups. The Board considered the structure of the investment personnel compensation program and whether this structure provides appropriate incentives to act in the best interests of the fund. Additionally, the Board considered the portfolio managers’ investments, if any, in the funds that they manage.
Resources Dedicated to Investment Management and Support Services. The Board reviewed the general qualifications and capabilities of Fidelity’s investment staff, including its size, education, experience, and resources, as well as Fidelity’s approach to recruiting, managing, and compensating investment personnel. The Board noted that Fidelity has continued to increase the resources devoted to non-U.S. offices, including expansion of Fidelity’s global investment organization. The Board also noted that Fidelity’s analysts have extensive resources, tools and capabilities that allow them to conduct sophisticated quantitative and fundamental analysis, as well as credit analysis of issuers, counterpar-ties and guarantors. Further, the Board considered that Fidelity’s investment professionals have sufficient access to global information and data so as to provide competitive investment results over time, and that those professionals also have access to sophisticated tools that permit them to assess portfolio construction and risk and performance attribution characteristics continuously, as well as to transmit new information and research conclusions rapidly around the world. Additionally, in its deliberations, the Board considered Fidelity’s trading, risk management, compliance, and technology and operations capabilities and resources, which are integral parts of the investment management process. The Board also considered Fidelity’s investments in business continuity planning, and its success in continuously provid-ing services to the fund notwithstanding the severe disruptions caused by the COVID-19 pandemic.
Shareholder and Administrative Services. The Board considered (i) the nature, extent, quality, and cost of advisory, administrative, and shareholder services performed by the Investment Advisers and their affiliates under the Advisory Contracts and under separate agreements covering transfer agency and pricing and bookkeeping services for the fund; (ii) the nature and extent of the supervision of third party service providers, principally custodians, subcustodians, and pricing vendors; and (iii) the resources devoted to, and the record of compliance with, the fund’s compliance policies and procedures.
The Board noted that the growth of fund assets over time across the complex allows Fidelity to reinvest in the development of services designed to enhance the value and convenience of the Fidelity funds as investment vehicles. These services include 24-hour access to account information and market information over the Internet and through telephone representatives, investor education materials and asset allocation tools, and the expanded availability of Fidelity Investor Centers.
Investment in a Large Fund Family. The Board considered the benefits to shareholders of investing in a Fidelity fund, including the benefits of investing in a fund that is part of a large family of funds offering a variety of investment disciplines and providing a large variety of mutual fund investor services. The Board noted that Fidelity had taken, or had made recommendations that resulted in the Fidelity funds taking, a number of actions over the previous year that benefited particular funds, including: (i) continuing to dedicate additional resources to Fidelity’s investment research process, which includes meetings with management of issuers of securities in which the funds invest, and to the support of the senior management team that oversees asset management; (ii) continuing efforts to enhance Fidelity’s global research capabilities; (iii) launching new funds and ETFs with innovative structures, strategies and pricing and making other enhancements to meet client needs; (iv) launching new share classes of existing funds; (v) eliminat-ing purchase minimums and broadening eligibility requirements for certain funds and share classes; (vi) reducing management fees and total expenses for certain target date funds or classes and index funds; (vii) lowering expenses

44Annual Report
Board Approval of Investment Advisory Contracts and Management Fees – continued
for certain funds and classes by implementing or lowering expense caps; (viii) rationalizing product lines and gaining increased efficiencies from fund mergers, liquidations, and share class consolidations; (ix) continuing to develop, acquire and implement systems and technology to improve services to the funds and shareholders, strengthen information security, and increase efficiency; and (x) continuing to implement enhancements to further strengthen Fidelity’s product line to increase investors’ probability of success in achieving their investment goals, including retire-ment income goals.
Investment Performance. The Board considered whether the fund has operated in accordance with its investment objective, as well as its record of compliance with its investment restrictions and its performance history.
The Board took into account discussions that occur at Board meetings throughout the year with representatives of the Investment Advisers about fund investment performance. In this regard the Board noted that as part of regularly scheduled fund reviews and other reports to the Board on fund performance, the Board considers annualized return information for the fund for different time periods, measured against an appropriate peer group of funds with similar objectives (peer group).
In addition to reviewing absolute and relative fund performance, the Independent Trustees periodically consider the appropriateness of fund performance metrics in evaluating the results achieved. In general, the Independent Trustees believe that fund performance should be evaluated based on gross performance (before fees and expenses but after transaction costs) compared to the gross performance of appropriate peer groups, over appropriate time periods that may include full market cycles, taking into account relevant factors including the following: general market conditions; expectations for interest rate levels and credit conditions; issuer-specific information including credit quality; the fund’s market value NAV over time and its resilience under various stressed conditions; and fund cash flows and other factors. The Independent Trustees generally give greater weight to fund performance over longer time periods than over shorter time periods.
The Board recognizes that in interest rate environments where many competitors waive fees to maintain a minimum yield, relative money market fund performance on a net basis (after fees and expenses) may not be particularly meaningful due to miniscule performance differences among competitor funds. Depending on the circumstances, the Independent Trustees may be satisfied with a fund’s performance notwithstanding that it lags its peer group for certain periods.
The Independent Trustees recognize that shareholders evaluate performance on a net basis over their own holding periods, for which one-, three-, and five-year periods are often used as a proxy. For this reason, the performance information reviewed by the Board also included net cumulative calendar year total return information for the fund and an appropriate peer group for the most recent one-, three-, and five-year periods. The Independent Trustees recognize that shareholders who are not investing through a tax-advantaged retirement account also consider tax consequences in evaluating performance.
Based on its review, the Board concluded that the nature, extent, and quality of services provided to the fund under the Advisory Contracts should continue to benefit the shareholders of the fund.
Competitiveness of Management Fee and Total Expense Ratio. The Board considered the fund’s management fee and total expense ratio compared to “mapped groups” of competitive funds and classes created for the purpose of facilitating the Trustees’ competitive analysis of management fees and total expenses. Fidelity creates “mapped groups” by combining similar Lipper investment objective categories that have comparable investment mandates.
45 Annual Report
Combining Lipper investment objective categories aids the Board’s management fee and total expense ratio compari-sons by broadening the competitive group used for comparison.
Management Fee. The Board considered two proprietary management fee comparisons for the 12-month periods shown in basis points (BP) in the chart below. The group of Lipper funds used by the Board for management fee comparisons is referred to below as the “Total Mapped Group” and is broader than the Lipper peer group used by the Board for performance comparisons. The Total Mapped Group comparison focuses on a fund’s standing in terms of gross management fees before expense reimbursements or caps relative to the total universe of funds with compa-rable investment mandates, regardless of whether their management fee structures also are comparable. Funds with comparable investment mandates offer exposure to similar types of securities. Funds with comparable management fee structures have similar management fee contractual arrangements (e.g., flat rate charged for advisory services, all-inclusive fee rate, etc.). “TMG %” represents the percentage of funds in the Total Mapped Group that had manage-ment fees that were lower than the fund’s. For example, a hypothetical TMG % of 20% would mean that 80% of the funds in the Total Mapped Group had higher, and 20% had lower, management fees than the fund. The fund’s actual TMG %s and the number of funds in the Total Mapped Group are in the chart below. The “Asset-Sized Peer Group” (ASPG) comparison focuses on a fund’s standing relative to a subset of non-Fidelity funds within the Total Mapped Group that are similar in size and management fee structure. For example, if a fund is in the first quartile of the ASPG, the fund’s management fee ranks in the least expensive or lowest 25% of funds in the ASPG. The ASPG represents at least 15% of the funds in the Total Mapped Group with comparable asset size and management fee structures, subject to a minimum of 50 funds (or all funds in the Total Mapped Group if fewer than 50). Additional information, such as the ASPG quartile in which the fund’s management fee rate ranked, is also included in the chart and was considered by the Board. Because the vast majority of competitor funds’ management fees do not cover non-management expenses, in prior years, the fund was compared on the basis of a hypothetical “net management fee,” which was derived by subtracting payments made by Fidelity for “fund-level” non-management expenses (including pricing and bookkeeping fees and fees paid to non-affiliated custodians), as well as “class-level” expenses paid by Fidelity under expense limitation arrangements in effect for the fund, from the fund’s management fee. Given the fund’s competitive management fee rate, Fidelity no longer calculates a hypothetical net management fee for the fund and, as a result, the chart does not include a hypothetical net management fee for periods after 2016.

46Annual Report
Board Approval of Investment Advisory Contracts and Management Fees – continued
Fidelity New York AMT Tax-Free Money Market Fund
The Board noted that the fund’s management fee rate ranked below the median of its Total Mapped Group and below the median of its ASPG for 2019.
The Board noted that it and the boards of other Fidelity funds formed an ad hoc Committee on Group Fee, which meets periodically, to conduct an in-depth review of the “group fee” component of the management fee of funds with such management fee structures. The Committee’s focus included the mechanics of the group fee, the competitive landscape of group fee structures, Fidelity funds with no group fee component (such as the fund) and investment products not included in group fee assets. The Board also considered that, for funds subject to the group fee, FMR agreed to voluntarily waive fees over a specified period of time in amounts designed to account for assets converted from certain funds to certain collective investment trusts.
Based on its review, the Board concluded that the fund’s management fee is fair and reasonable in light of the services that the fund receives and the other factors considered.
Total Expense Ratio. In its review of each class’s total expense ratio, the Board considered the fund’s management fee rate as well as other “fund-level” expenses, such as pricing and bookkeeping fees and custodial, legal, and audit fees, paid by FMR under the fund’s management contract. The Board also considered other “class-level” expenses, such as transfer agent fees and fund-paid 12b-1 fees. The Board also noted that Fidelity may agree to waive fees or reimburse expenses from time to time, and the extent to which, if any, it has done so for the fund. As part of its review, the Board also considered the current and historical total expense ratios of each class of the fund compared to competitive fund median expenses. Each class of the fund is compared to those funds and classes in the Total Mapped Group (used by the Board for management fee comparisons) that have a similar sales load structure.
The Board noted that the total expense ratio of each of Institutional Class and the retail class ranked below the competitive median for 2019 and the total expense ratio of Service Class ranked above the competitive median for

47 Annual Report
2019. The Board considered that, in general, various factors can affect total expense ratios. The Board considered that the competitive data for the fund reflects periods for which many competitor funds waived fees or reimbursed expenses in order to maintain a minimum yield. The Board noted that, excluding fee waivers and reimbursements and 12b-1 fees, the total expense ratio for Service Class ranked below the median.
The Board further considered that current contractual arrangements for the fund oblige FMR to pay all “class-level” expenses of the retail class of the fund to the extent necessary to limit total operating expenses, with certain excep-tions, to 0.35%. These contractual arrangements may not be amended to increase the fees or expenses payable except by a vote of a majority of the Board and by a vote of a majority of the outstanding voting securities of the class. The Board further considered that FMR has contractually agreed to reimburse Institutional Class and Service Class of the fund to the extent that total operating expenses, with certain exceptions, as a percentage of their respec-tive average net assets, exceed 0.20% and 0.45% through at least March 31, 2021.
Fees Charged to Other Fidelity Clients. The Board also considered Fidelity fee structures and other information with respect to clients of Fidelity, such as other funds advised or subadvised by Fidelity, pension plan clients, and other institutional clients with similar mandates. The Board noted that a joint ad hoc committee created by it and the boards of other Fidelity funds periodically reviews and compares Fidelity’s institutional investment advisory business with its business of providing services to the Fidelity funds and also noted the most recent findings of the committee. The Board noted that the committee’s review included a consideration of the differences in services provided, fees charged, and costs incurred, as well as competition in the markets serving the different categories of clients.
Based on its review of total expense ratios and fees charged to other Fidelity clients, the Board concluded that the total expense ratio of each class of the fund was reasonable in light of the services that the fund and its shareholders receive and the other factors considered.
Costs of the Services and Profitability. The Board considered the revenues earned and the expenses incurred by Fidelity in conducting the business of developing, marketing, distributing, managing, administering and servicing the fund and servicing the fund’s shareholders. The Board also considered the level of Fidelity’s profits in respect of all the Fidelity funds.
On an annual basis, Fidelity presents to the Board information about the profitability of its relationships with the fund. Fidelity calculates profitability information for each fund, as well as aggregate profitability information for groups of Fidelity funds and all Fidelity funds, using a series of detailed revenue and cost allocation methodologies which originate with the books and records of Fidelity on which Fidelity’s audited financial statements are based. The Audit Committee of the Board reviews any significant changes from the prior year’s methodologies and the full Board approves such changes.
A public accounting firm has been engaged annually by the Board as part of the Board’s assessment of Fidelity’s profitability analysis. The engagement includes the review and assessment of the methodologies used by Fidelity in determining the revenues and expenses attributable to Fidelity’s mutual fund business, and completion of agreed-upon procedures in respect of the mathematical accuracy of certain fund profitability information and its conformity to estab-lished allocation methodologies. After considering the reports issued under the engagement and information provided by Fidelity, the Board concluded that while other allocation methods may also be reasonable, Fidelity’s profitability methodologies are reasonable in all material respects.

48Annual Report
Board Approval of Investment Advisory Contracts and Management Fees – continued
The Board also reviewed Fidelity’s non-fund businesses and potential indirect benefits such businesses may have received as a result of their association with Fidelity’s mutual fund business (i.e., fall-out benefits) as well as cases where Fidelity’s affiliates may benefit from the funds’ business. The Board considered areas where potential indirect benefits to the Fidelity funds from their relationships with Fidelity may exist. The Board also considered that in 2019 a joint ad hoc committee created by it and the boards of other Fidelity funds evaluated potential fall-out benefits (PFOB Committee). The Board noted that it considered the PFOB Committee’s findings in connection with its consideration of the renewal of the Advisory Contracts.
The Board considered the costs of the services provided by and the profits realized by Fidelity in connection with the operation of the fund, including the conclusions of the PFOB Committee, and was satisfied that the profitability was not excessive.
Economies of Scale. The Board considered whether there have been economies of scale in respect of the manage-ment of the Fidelity funds, whether the Fidelity funds (including the fund) have appropriately benefited from any such economies of scale, and whether there is potential for realization of any further economies of scale. The Board con-sidered the extent to which the fund will benefit from economies of scale as assets grow through increased services to the fund, through waivers or reimbursements, or through fee or expense ratio reductions. The Board recognized that, due to the fund’s current contractual arrangements, the expense ratio of the retail class will not decline if the class’s operating costs decrease as assets grow, or rise as assets decrease. The Board also noted that a committee (the Economies of Scale Committee) created by it and the boards of other Fidelity funds periodically analyzes whether Fidelity attains economies of scale in respect of the management and servicing of the Fidelity funds, whether the Fidelity funds have appropriately benefited from such economies of scale, and whether there is potential for realization of any further economies of scale.
The Board concluded, taking into account the analysis of the Economies of Scale Committee, that economies of scale, if any, are being appropriately shared between fund shareholders and Fidelity.
Additional Information Requested by the Board. In order to develop fully the factual basis for consideration of the Fidelity funds’ advisory contracts, the Board requested and received additional information on certain topics, including: (i) Fidelity’s fund profitability methodology, profitability trends for certain funds, the allocation of various costs to different funds, and the impact of certain factors on fund profitability results; (ii) portfolio manager changes that have occurred during the past year and the amount of the investment that each portfolio manager has made in the Fidelity fund(s) that he or she manages; (iii) Fidelity’s compensation structure for portfolio managers, research analysts, and other key personnel, including its effects on fund profitability, the rationale for the compensation structure, and the extent to which current market conditions have affected retention and recruitment; (iv) the arrangements with and compensation paid to certain fund sub-advisers on behalf of the Fidelity funds and the treatment of such compensa-tion within Fidelity’s fund profitability methodology; (v) the terms of the funds’ various management fee structures, including the basic group fee and the terms of Fidelity’s voluntary expense limitation agreements; (vi) Fidelity’s transfer agent fee, expense, and service structures for different funds and classes relative to competitive trends; (vii) the impact on fund profitability of recent industry trends, such as the growth in passively managed funds and outflows from actively managed equity funds; and (viii) explanations regarding the relative total expense ratios of certain funds and classes, total expense competitive trends and methodologies for total expense competitive comparisons, and actions that might be taken by Fidelity to reduce total expense ratios for certain classes. In addition, the Board

49 Annual Report
considered its discussions with Fidelity regarding Fidelity’s efforts to maintain the continuous investment and share-holder services necessary for the funds during the current pandemic and economic circumstances.
Based on its evaluation of all of the conclusions noted above, and after considering all factors it believed relevant, the Board concluded that the advisory fee arrangements are fair and reasonable, and that the fund’s Advisory Contracts should be renewed.

50Annual Report

51 Annual Report

NYS-ANN-0321 1.700624.124