
FICHA CATALOGRÁFICA ELABORADA PELA BIBLIOTECA DO...
93
i
Transcript of FICHA CATALOGRÁFICA ELABORADA PELA BIBLIOTECA DO...
i
FICHA CATALOGRÁFICA ELABORADA PELA BIBLIOTECA DO INSTITUTO DE BIOLOGIA – UNICAMP
Título em inglês: Serum and salivary cortisol as stress marker. Palavras-chave em inglês : Stress; Cortisol; Hormones; Athete; Vestibular. Área de concentração: Fisiologia. Titulação: Doutora em Biologia Funcional e Molecular. Banca examinadora : Regina Célia Spadari, Dora Maria Grassi-Kassisse, Joaquim Maria Ferreira Antunes Neto, Lila Missae Oyama, Patrícia da Silva Melo. Data da defesa : 14/08/2008. Programa de Pós-Graduação: Biologia Funcional e Molecular.
Garcia, Márcia Carvalho G165c Cortisol sanguíneo e salivar como indicadores de
estresse / Márcia Carvalho Garcia. – Campinas, SP: [s.n.], 2008.
Orientadora: Regina Célia Spadari. Tese (doutorado) – Universidade Estadual de Campinas, Instituto de Biologia. 1. Estresse. 2. Cortisol. 3. Hormônios. 4. Atletas. 5. Vestibular. I. Spadari, Regina Célia. II. Universidade Estadual de Campinas. Instituto de Biologia. III. Título.
iii
iv
DEDICO
Ao meu pai Jadir José Garcia (in memorian) e a minha mãe Maria de Lourdes
Carvalho Garcia (in memorian). Os valores que me ensinaram, tais como: amor ao trabalho,
dedicação, respeito, amizade, lealdade, prazer, entre outros, permitiram que eu continuasse
parte da minha história. E aqui estou muito feliz! Tudo isto me faz sentir vocês muito perto
de mim. Obrigada!
v
Agradecimentos Especiais
A Margareth e Jadir, meus irmãos, amigos, queridos. Não há nada melhor do que a
troca que praticamos diariamente, apoiando a caminhada individual de cada um. Com vocês
já me sinto vitoriosa. Obrigada!
A Olivieri Giovani Rusciolelli Neto, meu namorado. Como é bom ter alguém como
você. Obrigada pelo apoio, pelas correções, dedicação, respeito e amor. Sabemos que
construir é difícil, mas com foco fica prazeroso. É simples assim!
vi
Agradecimentos Especiais
À Profa e Dra. Regina Célia Spadari, minha orientadora. Segundo o dicionário, orientar é
indicar o rumo de, dirigir, encaminhar, guiar, nortear. Mas a Dra. Regina fez mais. Se permitiu
estar presente em momentos que ensinam como se comportar, como agir, como escutar,
pensar, ler e reler, para depois, colocar sua visão sobre o assunto. Além disso, a atenção
desprendida quando precisamos é apaziguadora. Obrigada, me sinto “grande” com sua
ajuda e presença.
vii
AGRADECIMENTOS
Agradeço a toda minha família, avós, tios, primos, vocês me fazem evoluir.
Obrigada. Viver para mim, é assim; em uma grande família!
Em especial agradeço meus primos Lidia e Ricardo, vocês são maravilhosos! Adoro
estar com vocês!
Aos meus primos Rosane, Ademir, Eduardo e Octávio. Que delícia são os
momentos que jogamos conversa fora ou mesmo trocamos experiências de estrada!
Aos eternos amigos do LABEEST: Elaine, Juliana, Heloisa Thiago, Augusto, Janir,
Edla, Geruza, Carolina (babalu), é muito divertido trabalhar assim. Saudades daqueles que
passaram por aqui e fizeram história comigo: Karina, Heder, Iraídes, Alexandre, Silvia,
valeu! E àqueles que continuam na minha história: Danilo (ponta esquerda do meu coração)
e Viviane, que bom ter vocês perto assim.
As grandes amigas Aline (fisioterapeuta), Daniela e Ana Maria (AztraZeneca),
Marcão, Joyce, Natália, Liamara, Leônia, Mariana, Paulo, Luis Octávio, pessoas que
permanecem na minha vida, simplesmente porque dividimos os mesmos focos. Adoro
vocês!
A todo o departamento de Fisiologia e Biofísica – IB - Unicamp, pela atenção
desprendida. Aos funcionários Ivo, Alexandra, Andréia, pelo respeito e compreensão nos
momentos críticos.
Às entidades de fomento à pesquisa CNPq e FAPESP que financiaram este projeto.
viii
Resumo Hans Selye definiu stress como a ″resposta não específica do organismo frente a
agentes ameaçadores de sua integridade″. O avanço de técnicas e métodos tanto de coleta
de material biológico, quanto de análises destes tornaram esta definição polêmica.
Apresentamos neste trabalho a evolução do conceito de estresse e os termos a ele
associados, levando em conta que a resposta de estresse tem caráter adaptativo e visa
proteger o organismo e garantir a sua sobrevivência, quando se refere a experiências de
tempo limitado que o indivíduo pode superar. Por outro lado, o estresse torna-se perigoso
para a saúde quando o senso de controle e o domínio são perdidos. O sistema de resposta de
estresse envolve regiões cerebrais que se conectam entre si e desencadeiam estímulos por
meio de dois eixos: um neural e outro hormonal aos sistemas periféricos. Os
glicocorticóides participam em todas as etapas da resposta de estresse, e são, por isso,
considerados como marcadores biológicos desta resposta. A determinação da concentração
salivar de cortisol é, atualmente, a técnica de eleição para este fim. O objetivo deste
trabalho foi avaliar se a determinação da concentração salivar de cortisol pode ser utilizada
como indicador biológico de estresse relacionado a diversas atividades humanas.
Determinamos a concentração sérica de cortisol em jogadores de futebol durante duas
temporadas esportivas, e a concentração salivar de cortisol em atletas de basquetebol
também durante duas temporadas esportivas, em estudantes durante o ano de preparo para o
vestibular, além de utilizar esta técnica para investigar o índice de estresse associado ao
baixo status socioeconômico. Nossos resultados mostraram que a concentração salivar de
cortisol apresenta vantagens sobre a determinação da concentração sanguínea deste
hormônio por ser não invasiva, ser indolor e de fácil manejo. Além disso, os dados
permitiram avaliar o índice de estresse associado à prática esportiva, em duas modalidades
diferentes, a uma atividade intelectual, representada pelo esforço realizado para entrar na
universidade, e à condição socioeconômica adversa. Por outro lado, verificamos que
cuidados devem ser tomados para garantir a adesão dos voluntários aos protocolos de
coleta, uma vez que esta tende a ser baixa neste tipo de abordagem. Além disso, esta
técnica é adequada para avaliar a concentração de cortisol como indicadora do índice de
estresse relacionado à prática esportiva, à atividade intelectual, e o estresse associado ao
ix
baixo status socioeconômico. Nós também concluímos que no início da temporada
esportiva os atletas ficam expostos a concentrações mais altas de cortisol, embora o ritmo
circadiano do hormônio seja mantido. Nos jogos matinais, mas não nos vespertinos ou
noturnos foi possível estabelecer correlação positiva entre concentração de cortisol e
vitória. Concluímos que, estudantes brasileiros candidatos a ingressar na Universidade
apresentaram stress, depressão e ansiedade. A concentração de cortisol salivar oscilou
durante o ano, com altas concentrações nos meses que os estudantes tiveram que decidir
sobre a carreira a seguir e a universidade. No mês novembro, concentrações moderadas de
cortisol salivar foram significativamente correlacionadas com sucesso no exame. Em
pessoas de baixo status socioeconômico verificamos que os altos índices de estresse
percebido e da concentração salivar de cortisol impactam negativamente em sua saúde e se
correlacionam com o estresse experimentado diariamente. Considerando que esta
corresponde a 30% da população brasileira, isto pode representar um grande impacto nas
políticas públicas de saúde.
x
Abstract Hans Selye defined stress as ″the organism non specific response to any threat to its
integrity″. During most of the past century, Selye`s theory has been challenged by a number
of scientists who discussed many of its aspects based on new data. In this work we present
the evolution of stress theory and associated terms, considering that the stress response is
adaptive and that it has been conserved to protect and to guarantee survival. This happens
when the stressor is present for a short period, and when the subject can overcomes it. On
the other hand, the stress response turns into harmful when the subject looses control over
the situation. The stress system includes cerebral regions that are connected and that trigger
stimuli through a neural and a hormonal axis towards the periphery, preparing the organism
to the fight-or flight reaction or adaptation. Because glucocorticoids play a role in every
phase of the stress response these hormones have been recognized as biological markers of
the stress reaction. The aim of this work was to evaluate the salivary cortisol levels (SCL)
related to several human activities and conditions. We determined the seric cortisol levels
in soccer players and the salivary cortisol levels in basketball athletes during two
competitive seasons, in Brazilian students during the year they prepare to enter the
University, and in a group of people with low socioeconomic status. Results have shown
that using salivary cortisol is better than blood levels because it is easier, painless and can
be done by the subject anywhere. Moreover, this technique was suitable to evaluate the
cortisol level as an indicator of the stress index related to sports practice, to intellectual
activity, represented by the students fight to conquer a vacancy in the public university, and
associated to low socioeconomic status (LSES). On the other hand, we also concluded that
the volunteers’ adhesion to the protocol of sample collection is poor and may represent a
challenge to the researcher. By using this technique we concluded that in the beginning of
the competitive season athletes are exposed to higher levels of cortisol. However, the
cortisol circadian rhythm has been preserved during all the season. In the morning games
the increase of cortisol levels are related to the game result, with higher increases correlated
with victory. This does not happen for the afternoon and evening games. The Brazilian
students, preparing for university entrance exams, were pronounced stressed, and have
shown high levels of depression and anxiety. The salivary cortisol levels oscillate during
xi
the year, with higher values in the months when the students are choosing their courses and
university. Although the levels of salivary cortisol diminished in November, SCL were not
correlated with success in the exam. We have concluded that the LSES is associated with
high index stress perceived (PSI) and salivary cortisol levels which could impact negatively
in health and it is related to the daily life stress experienced by LSES group. Because the
LSES corresponds to about 30% of the total Brazilian population, it might have a great
impact on public health policies and costs.
xii
SUMÁRIO
Introdução..................................................................................................................... 13 Objetivo........................................................................................................................
21
Primeiro Manuscrito: Cortisol and testosterone seric concentration in young soccer players……
22
Segundo Manuscrito: Salivary cortisol levels in basketball athletes...............................................
40
Terceiro Manuscrito: Stress levels in students preparing for university entrance exams in the State of São Paulo, Brazil………………………………………………….
58
Quarto Manuscrito: Salivary cortisol levels in Brazilian citizens of distinct socioeconomic and cultural levels…………………………………………………………........
76
Conclusão……………………………………………………………………………. 85 Referências Bibliográficas…………………………………………………………...
86
Anexo: 1- Comitê de Ética..........................................................................................
90
Anexo: 2- Comitê de Ética.......................................................................................... 92
13
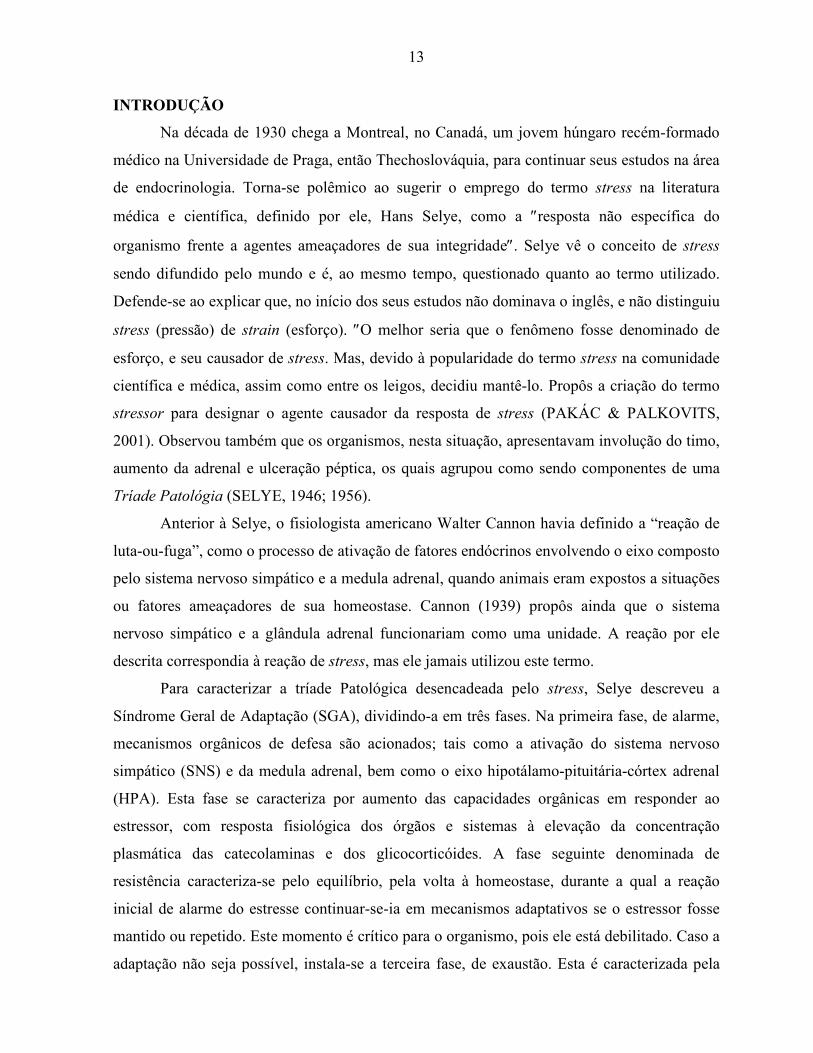
INTRODUÇÃO
Na década de 1930 chega a Montreal, no Canadá, um jovem húngaro recém-formado
médico na Universidade de Praga, então Thechoslováquia, para continuar seus estudos na área
de endocrinologia. Torna-se polêmico ao sugerir o emprego do termo stress na literatura
médica e científica, definido por ele, Hans Selye, como a ″resposta não específica do
organismo frente a agentes ameaçadores de sua integridade″. Selye vê o conceito de stress
sendo difundido pelo mundo e é, ao mesmo tempo, questionado quanto ao termo utilizado.
Defende-se ao explicar que, no início dos seus estudos não dominava o inglês, e não distinguiu
stress (pressão) de strain (esforço). ″O melhor seria que o fenômeno fosse denominado de
esforço, e seu causador de stress. Mas, devido à popularidade do termo stress na comunidade
científica e médica, assim como entre os leigos, decidiu mantê-lo. Propôs a criação do termo
stressor para designar o agente causador da resposta de stress (PAKÁC & PALKOVITS,
2001). Observou também que os organismos, nesta situação, apresentavam involução do timo,
aumento da adrenal e ulceração péptica, os quais agrupou como sendo componentes de uma
Tríade Patológia (SELYE, 1946; 1956).
Anterior à Selye, o fisiologista americano Walter Cannon havia definido a “reação de
luta-ou-fuga”, como o processo de ativação de fatores endócrinos envolvendo o eixo composto
pelo sistema nervoso simpático e a medula adrenal, quando animais eram expostos a situações
ou fatores ameaçadores de sua homeostase. Cannon (1939) propôs ainda que o sistema
nervoso simpático e a glândula adrenal funcionariam como uma unidade. A reação por ele
descrita correspondia à reação de stress, mas ele jamais utilizou este termo.
Para caracterizar a tríade Patológica desencadeada pelo stress, Selye descreveu a
Síndrome Geral de Adaptação (SGA), dividindo-a em três fases. Na primeira fase, de alarme,
mecanismos orgânicos de defesa são acionados; tais como a ativação do sistema nervoso
simpático (SNS) e da medula adrenal, bem como o eixo hipotálamo-pituitária-córtex adrenal
(HPA). Esta fase se caracteriza por aumento das capacidades orgânicas em responder ao
estressor, com resposta fisiológica dos órgãos e sistemas à elevação da concentração
plasmática das catecolaminas e dos glicocorticóides. A fase seguinte denominada de
resistência caracteriza-se pelo equilíbrio, pela volta à homeostase, durante a qual a reação
inicial de alarme do estresse continuar-se-ia em mecanismos adaptativos se o estressor fosse
mantido ou repetido. Este momento é crítico para o organismo, pois ele está debilitado. Caso a
adaptação não seja possível, instala-se a terceira fase, de exaustão. Esta é caracterizada pela
14
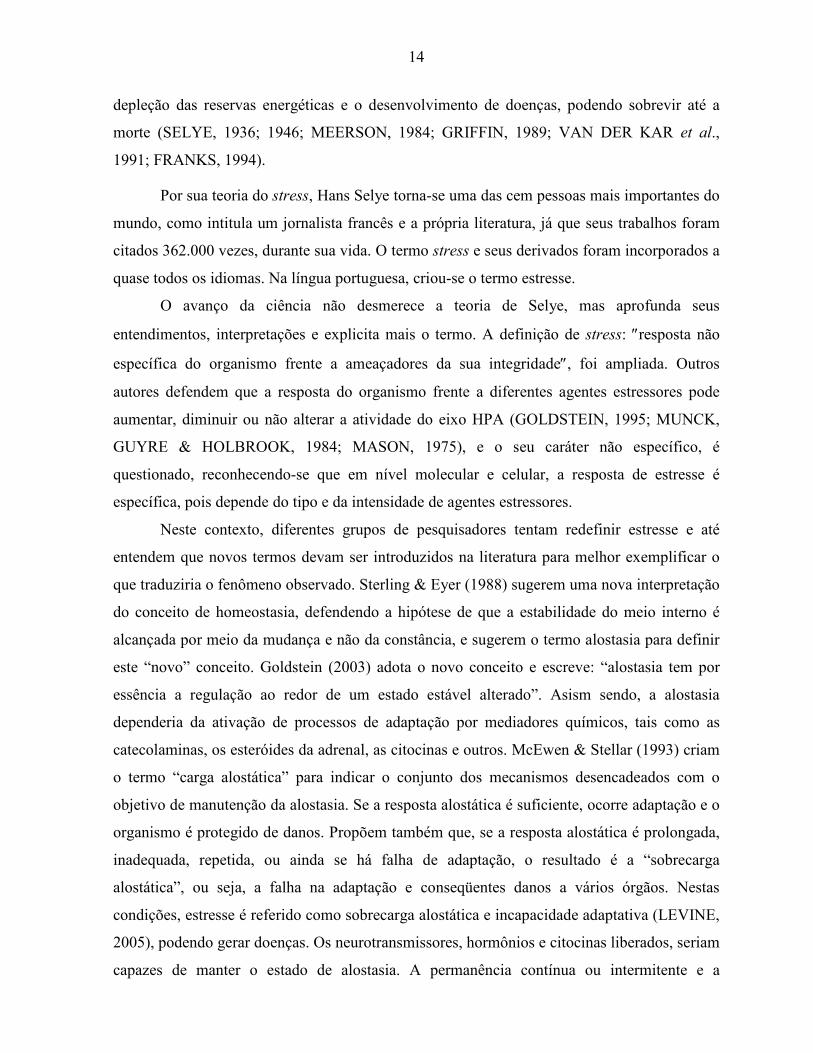
depleção das reservas energéticas e o desenvolvimento de doenças, podendo sobrevir até a
morte (SELYE, 1936; 1946; MEERSON, 1984; GRIFFIN, 1989; VAN DER KAR et al.,
1991; FRANKS, 1994).
Por sua teoria do stress, Hans Selye torna-se uma das cem pessoas mais importantes do
mundo, como intitula um jornalista francês e a própria literatura, já que seus trabalhos foram
citados 362.000 vezes, durante sua vida. O termo stress e seus derivados foram incorporados a
quase todos os idiomas. Na língua portuguesa, criou-se o termo estresse.
O avanço da ciência não desmerece a teoria de Selye, mas aprofunda seus
entendimentos, interpretações e explicita mais o termo. A definição de stress: ″resposta não
específica do organismo frente a ameaçadores da sua integridade″, foi ampliada. Outros
autores defendem que a resposta do organismo frente a diferentes agentes estressores pode
aumentar, diminuir ou não alterar a atividade do eixo HPA (GOLDSTEIN, 1995; MUNCK,
GUYRE & HOLBROOK, 1984; MASON, 1975), e o seu caráter não específico, é
questionado, reconhecendo-se que em nível molecular e celular, a resposta de estresse é
específica, pois depende do tipo e da intensidade de agentes estressores.
Neste contexto, diferentes grupos de pesquisadores tentam redefinir estresse e até
entendem que novos termos devam ser introduzidos na literatura para melhor exemplificar o
que traduziria o fenômeno observado. Sterling & Eyer (1988) sugerem uma nova interpretação
do conceito de homeostasia, defendendo a hipótese de que a estabilidade do meio interno é
alcançada por meio da mudança e não da constância, e sugerem o termo alostasia para definir
este “novo” conceito. Goldstein (2003) adota o novo conceito e escreve: “alostasia tem por
essência a regulação ao redor de um estado estável alterado”. Asism sendo, a alostasia
dependeria da ativação de processos de adaptação por mediadores químicos, tais como as
catecolaminas, os esteróides da adrenal, as citocinas e outros. McEwen & Stellar (1993) criam
o termo “carga alostática” para indicar o conjunto dos mecanismos desencadeados com o
objetivo de manutenção da alostasia. Se a resposta alostática é suficiente, ocorre adaptação e o
organismo é protegido de danos. Propõem também que, se a resposta alostática é prolongada,
inadequada, repetida, ou ainda se há falha de adaptação, o resultado é a “sobrecarga
alostática”, ou seja, a falha na adaptação e conseqüentes danos a vários órgãos. Nestas
condições, estresse é referido como sobrecarga alostática e incapacidade adaptativa (LEVINE,
2005), podendo gerar doenças. Os neurotransmissores, hormônios e citocinas liberados, seriam
capazes de manter o estado de alostasia. A permanência contínua ou intermitente e a
15
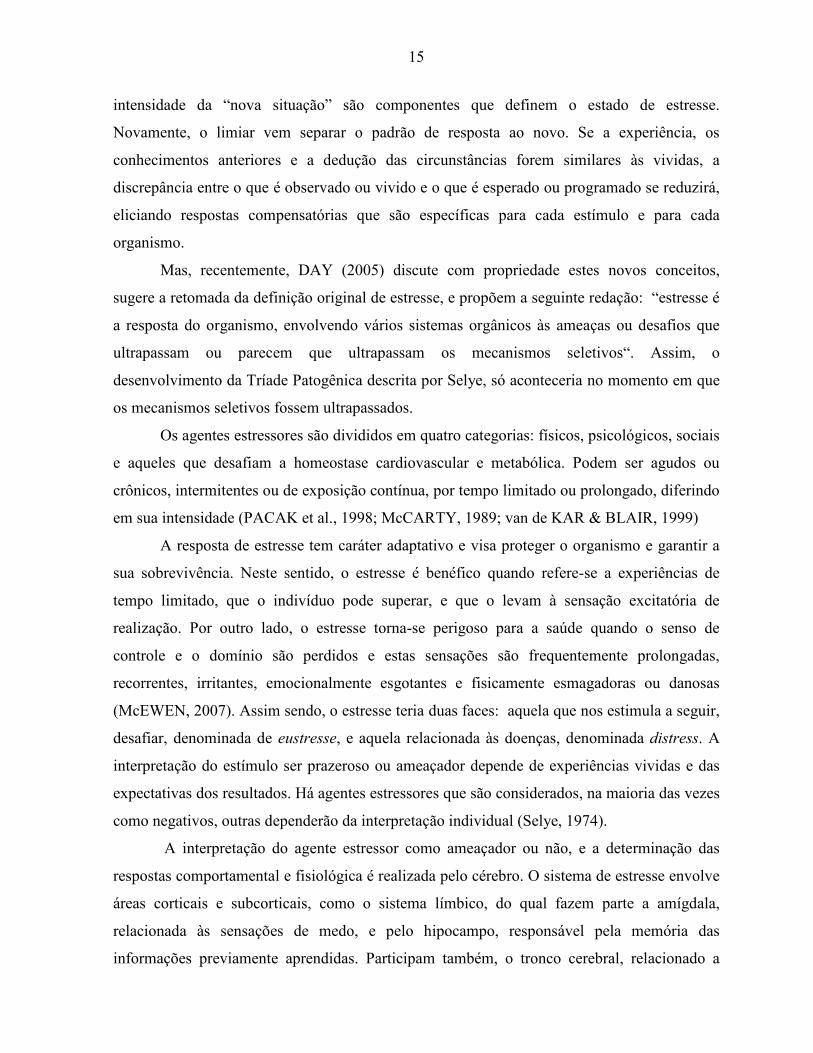
intensidade da “nova situação” são componentes que definem o estado de estresse.
Novamente, o limiar vem separar o padrão de resposta ao novo. Se a experiência, os
conhecimentos anteriores e a dedução das circunstâncias forem similares às vividas, a
discrepância entre o que é observado ou vivido e o que é esperado ou programado se reduzirá,
eliciando respostas compensatórias que são específicas para cada estímulo e para cada
organismo.
Mas, recentemente, DAY (2005) discute com propriedade estes novos conceitos,
sugere a retomada da definição original de estresse, e propõem a seguinte redação: “estresse é
a resposta do organismo, envolvendo vários sistemas orgânicos às ameaças ou desafios que
ultrapassam ou parecem que ultrapassam os mecanismos seletivos“. Assim, o
desenvolvimento da Tríade Patogênica descrita por Selye, só aconteceria no momento em que
os mecanismos seletivos fossem ultrapassados.
Os agentes estressores são divididos em quatro categorias: físicos, psicológicos, sociais
e aqueles que desafiam a homeostase cardiovascular e metabólica. Podem ser agudos ou
crônicos, intermitentes ou de exposição contínua, por tempo limitado ou prolongado, diferindo
em sua intensidade (PACAK et al., 1998; McCARTY, 1989; van de KAR & BLAIR, 1999)
A resposta de estresse tem caráter adaptativo e visa proteger o organismo e garantir a
sua sobrevivência. Neste sentido, o estresse é benéfico quando refere-se a experiências de
tempo limitado, que o indivíduo pode superar, e que o levam à sensação excitatória de
realização. Por outro lado, o estresse torna-se perigoso para a saúde quando o senso de
controle e o domínio são perdidos e estas sensações são frequentemente prolongadas,
recorrentes, irritantes, emocionalmente esgotantes e fisicamente esmagadoras ou danosas
(McEWEN, 2007). Assim sendo, o estresse teria duas faces: aquela que nos estimula a seguir,
desafiar, denominada de eustresse, e aquela relacionada às doenças, denominada distress. A
interpretação do estímulo ser prazeroso ou ameaçador depende de experiências vividas e das
expectativas dos resultados. Há agentes estressores que são considerados, na maioria das vezes
como negativos, outras dependerão da interpretação individual (Selye, 1974).
A interpretação do agente estressor como ameaçador ou não, e a determinação das
respostas comportamental e fisiológica é realizada pelo cérebro. O sistema de estresse envolve
áreas corticais e subcorticais, como o sistema límbico, do qual fazem parte a amígdala,
relacionada às sensações de medo, e pelo hipocampo, responsável pela memória das
informações previamente aprendidas. Participam também, o tronco cerebral, relacionado a
16
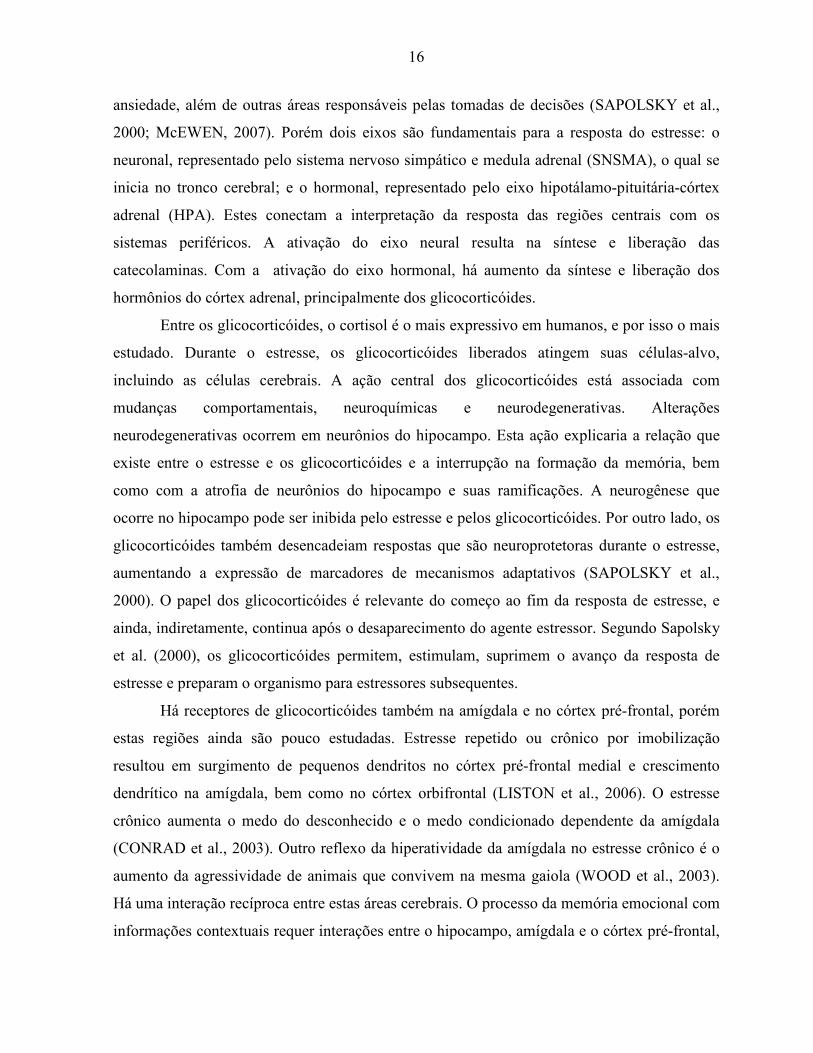
ansiedade, além de outras áreas responsáveis pelas tomadas de decisões (SAPOLSKY et al.,
2000; McEWEN, 2007). Porém dois eixos são fundamentais para a resposta do estresse: o
neuronal, representado pelo sistema nervoso simpático e medula adrenal (SNSMA), o qual se
inicia no tronco cerebral; e o hormonal, representado pelo eixo hipotálamo-pituitária-córtex
adrenal (HPA). Estes conectam a interpretação da resposta das regiões centrais com os
sistemas periféricos. A ativação do eixo neural resulta na síntese e liberação das
catecolaminas. Com a ativação do eixo hormonal, há aumento da síntese e liberação dos
hormônios do córtex adrenal, principalmente dos glicocorticóides.
Entre os glicocorticóides, o cortisol é o mais expressivo em humanos, e por isso o mais
estudado. Durante o estresse, os glicocorticóides liberados atingem suas células-alvo,
incluindo as células cerebrais. A ação central dos glicocorticóides está associada com
mudanças comportamentais, neuroquímicas e neurodegenerativas. Alterações
neurodegenerativas ocorrem em neurônios do hipocampo. Esta ação explicaria a relação que
existe entre o estresse e os glicocorticóides e a interrupção na formação da memória, bem
como com a atrofia de neurônios do hipocampo e suas ramificações. A neurogênese que
ocorre no hipocampo pode ser inibida pelo estresse e pelos glicocorticóides. Por outro lado, os
glicocorticóides também desencadeiam respostas que são neuroprotetoras durante o estresse,
aumentando a expressão de marcadores de mecanismos adaptativos (SAPOLSKY et al.,
2000). O papel dos glicocorticóides é relevante do começo ao fim da resposta de estresse, e
ainda, indiretamente, continua após o desaparecimento do agente estressor. Segundo Sapolsky
et al. (2000), os glicocorticóides permitem, estimulam, suprimem o avanço da resposta de
estresse e preparam o organismo para estressores subsequentes.
Há receptores de glicocorticóides também na amígdala e no córtex pré-frontal, porém
estas regiões ainda são pouco estudadas. Estresse repetido ou crônico por imobilização
resultou em surgimento de pequenos dendritos no córtex pré-frontal medial e crescimento
dendrítico na amígdala, bem como no córtex orbifrontal (LISTON et al., 2006). O estresse
crônico aumenta o medo do desconhecido e o medo condicionado dependente da amígdala
(CONRAD et al., 2003). Outro reflexo da hiperatividade da amígdala no estresse crônico é o
aumento da agressividade de animais que convivem na mesma gaiola (WOOD et al., 2003).
Há uma interação recíproca entre estas áreas cerebrais. O processo da memória emocional com
informações contextuais requer interações entre o hipocampo, amígdala e o córtex pré-frontal,
17
pois este atua inibindo o medo, através da sua ação sobre a amígdala (MILAD & QUIRK,
2002; MORGAN & LeDOUX, 1995).
A capacidade de conviver com o agente estressor, caso não seja possível eliminá-lo, é
definida por alguns autores, como resiliência e os mecanismos acionados para obtê-la
constituem as estratégias de convivência (ou coping). A percepção do agente estressor pode
ser reduzida ou diminuída quando este proporciona uma resposta positiva (ERIKSEN &
URSIN, 2004). Estilos de enfrentamento (coping styles) aos agentes estressores podem ser
baseados em experiências ou recompensas, principalmente aquelas que resultaram em sucesso
(FOLKMAN & LAZARUS, 1990).
Vários são os estilos de coping além de estilos pessoais. Entretanto, a grande
desigualdade social na manifestação de queixas e doenças pode estar relacionada à motivação
para escolha do estilo de vida. Esta pode representar padrões desiguais de reforço para o
desenvolvimento de coping (ERIKSEN & URSIN, 2002).
Marcadores da resposta de estresse
Os hormônios sintetizados e liberados pelo córtex adrenal, bem como as
catecolaminas, sintetizadas e liberadas pelos neurônios simpáticos e pela medula adrenal são
considerados marcadores da resposta de estresse. Determinar suas concentrações plasmáticas
exige o emprego de técnica invasiva via punção venosa, de modo que interpretar seus
resultados exige cautela. Além disso, esta técnica permite apenas a informação de um valor
pontual, em um determinado momento do dia, e a quantificação das concentrações das
catecolaminas é feita por cromatografia líquida de alto desempenho, que apresenta
considerável dificuldade técnica e alto custo. Por outro lado, os hormônios esteróides do
córtex adrenal podem ser detectados por meio de técnicas mais simples.
Assim sendo, a determinação dos biomarcadores de estresse na saliva é um método
alternativo que apresenta vantagens, pois não é invasivo, não causa estresse e pode ser feito
pela própria pessoa, em qualquer lugar. Por ser inócua e indolor, favorece a colaboração de
voluntários e permite a coleta de material em diversas situações do cotidiano. A concentração
salivar é diretamente proporcional à concentração da fração livre, biologicamente ativa, do
hormônio no sangue (VINING & MCGINLEY, 1987), e é independente do fluxo salivar
(KIRSCHBAUM & HELLHAMMER, 1994; DUCLOS et al., 1998). Somado a isso, podem
ser feitas coletas seriadas de amostras que permitem determinar, além da concentração
18
instantânea, o ritmo de secreção do hormônio ao longo de períodos (dia, noite, ou outros
diferentes períodos), bem como sua variação durante fases distintas e/ou críticas da vida de
qualquer população a ser estudada (KIRSCHBAUM & HELLHAMMER, 1994).
Nossa colaboração
O grupo de pesquisa do qual fazemos parte tem uma vasta e enraizada experiência nos
estudos dos mecanismos biológicos do estresse e na determinação da concentração sanguínea
ou salivar dos hormônios esteróides como biomarcadores do estresse e da recuperação,
principalmente o cortisol e a testosterona. Estes foram determinados em estudantes durante o
ano de preparo para o exame vestibular, em atletas jogadores de futebol, basquetebol e
nadadores durante fases de treinamento e de competições, em jovens executivos também
durante suas rotinas de trabalho ou dias de repouso, em indivíduos de baixo status
socioeconômico (GARCIA et al., 2008), e em portadoras de endometriose (PETRELLUZZI et
al., 2006). O cortisol também foi utilizado como marcador biológico do índice de estresse em
mães cuidadoras de crianças portadoras de paralisia cerebral (BELLA et al., 2008).
Os estudos com estresse em humanos foram iniciados no Laboratório de Estudo do
Estresse (LABEEST) em 2001, quando trabalhamos com jogadores juniores de futebol de uma
equipe de Campinas. Acompanhamos duas temporadas esportivas consecutivas que ocorreram
de março à janeiro. Naqueles atletas determinamos concentração sérica de cortisol e de
testosterona, correlacionando-as com o condicionamento físico e com os resultados obtidos
nos jogos (GARCIA et al., 2008).
O pressuposto de que, sendo o Brasil considerado “o país do futebol” facilitaria o
encontro de voluntários, não se mostrou verdadeiro. Não obstante, a equipe enfrentou os mais
diversos obstáculos ao iniciar este trabalho: as freqüentes alterações na equipe técnica, que
resultavam em dificuldades para dar andamento ao protocolo de pesquisa, dificuldades com a
implantação da metodologia, resistência das equipes técnicas em avaliar regularmente o
desempenho físico dos atletas, além do conturbado calendário futebolístico brasileiro,
dificultaram a realização da pesquisa científica e, a nosso ver, contribuem para o empirismo do
trabalho nesta modalidade esportiva.
Outro fator limitante foi a coleta de sangue, que per se é um agente estressor para a
maioria das pessoas, especialmente para atletas em momentos de competições. Para superar
esta dificuldade implantamos a técnica de coleta da saliva e determinação da concentração
19
salivar de cortisol como indicativo do índice de estresse. Esta técnica nos permitiu avaliar
momentos que seriam impossíveis de serem analisados por meio da tradicional coleta de
sangue. Agora podemos fazer seqüências seriadas em dias específicos, que permitem
determinar o ritmo circadiano de cortisol e a área sob a curva, bem como a resposta do cortisol
ao acordar, além de realizar coletas em dias de competição, como também minutos antes e
após cada prova ou jogo.
Não obstante, questões pertinentes à técnica da coleta surgiram. O processo seria
através de um tubo coletor? O fluxo salivar alteraria o resultado? Haveria a necessidade de um
meio de transporte especial? As amostras deveriam ser mantidas em baixa temperatura?
A literatura existente àquela época apontava o método de determinação da
concentração salivar de cortisol como sendo de fácil execução, simples de coletar, indolor e
sem maiores complicações para o procedimento. O cortisol é estável à temperatura ambiente,
o que diminuía as exigências quanto à temperatura de conservação e transporte das amostras,
além de sua concentração na saliva ser independente do fluxo salivar (KIRSCHBAUM &
HELLHAMMER, 1994). Ficou definido que o transporte até o laboratório poderia ser feito em
caixas com gelo ou até em temperatura ambiente sem perigo de degradação das amostras, e
que estas podem ser conservadas em geladeira e/ou freezer domésticos até o envio ao
laboratório.
A utilização de salivette®, facilitando a coleta pelo voluntário foi a alternativa com o
melhor grau de viabilidade e eficácia. A seleção do material a ser utilizado privilegiou kits
diagnósticos com características de boa especificidade e sensibilidade.
Após os primeiros ensaios detectamos que a presença de muco nas amostras
prejudicava as análises, o que obrigou uma alteração no protocolo de centrifugação.
Atualmente o procedimento orienta a centrifugação durante 20 minutos, a 2800 rpm e a uma
temperatura de 4°C. Isto resultou em maior precisão na pipetagem, redução na diferença entre
as duplicatas e na variação intra e inter-ensaio.
Após a centrifugação, a distribuição de pequenos volumes da amostra total em
microtubos evita o descongelar e recongelar de amostras e garante a possibilidade de repetição
do ensaio, quando isto se faz necessário, utilizando amostras intactas.
Com a melhora dos protocolos de coleta e análise, e o aumento da confiança no
método, problemas com a aderência aos horários do protocolo de coletas começaram a ser
percebidos, como bem corrobora a literatura (KUDIELKA et al., 2003; THORN et al., 2006;
20
LASIKIEWICZ et al., 2008). A partir de então, todos os cuidados passaram a ser tomados
para que o voluntário tenha total consciência da importância da sua colaboração, da
importância da pesquisa que está sendo realizada, e de que em caso de dúvida, possa entrar em
contato com os membros da equipe de pesquisa. A presença do pesquisador responsável junto
dos voluntários se mostrou um aspecto bastante importante no sentido de aumentar a adesão
ao protocolo, entre outros aspectos. Para tanto, foi implantados no laboratório um protocolo de
controle rígido de acompanhamento das pesquisas com coleta de saliva em seres humanos.
A partir desta trajetória, determinamos o índice de estresse em jogadores de futebol
durante duas temporadas esportivas consecutivas, em estudantes durante o ano de preparo para
o vestibular, em atletas de basquetebol também duas temporadas esportivas e em cidadãos
brasileiros pertencentes a duas classes sócio-econômicas distintas. Os resultados obtidos foram
organizados em manuscritos, os quais serão aqui apresentados.
21
OBJETIVO
Foram objetivos deste trabalho: determinar a concentração salivar de cortisol como
indicador dos índices de estresse em:
1- atletas jogadores de futebol e de basquetebol durante temporadas esportivas e
correlacionar estes índices com desempenho físico e desempenho nos jogos;
2- estudantes durante o ano de preparo para o vestibular;
3- indivíduos de baixo status sócio-econômico;
4- atletas de basquetebol durante temporada esportiva e correlacionar este índice com
resultados obtidos nos jogos: vitória ou derrota.
22
PRIMEIRO MANUSCRITO
CORTISOL AND TESTOSTERONE SERIC CONCENTRATIONS IN YOUNG
SOCCER PLAYERS
23
CORTISOL AND TESTOSTERONE SERIC CONCENTRATIONS IN YOUNG
SOCCER PLAYERS
Marcia Carvalho Garcia1, Dora Maria Grassi- Kassisse1, Regina Celia Spadari-
Bratfisch*1,2
1 Laboratory of Stress Study, Department of Physiology and Biophysics, Institute of Biology,
State University of Campinas (UNICAMP), Campinas, São Paulo, Brazil2 Department of
Biosciences, Federal University of São Paulo (UNIFESP), Santos, São Paulo, Brazil
* Corresponding author
R.C. Spadari-Bratfisch
Depto. de Biociências
Campus da Baixada Santista
Universidade Federal de São Paulo
Rua Ana Costa no. 95
11060-001 Santos SP Brasil
E-mail: [email protected]
Running title: cortisol and testosterone levels in soccer players
24
Abstract
The aim of this study was to evaluate the basal serum concentrations of cortisol and
testosterone, as reliable markers of stress and recovery, respectively, in young soccer players
of a first ranking Brazilian team. The hormone concentrations were assessed 7 times during
two training seasons, immediately before and after two consecutive tournaments. Cortisol
serum concentrations were maintained near the maximum of the normal range (467.4 ± 30.6
nmol.L-1), increased by the end of the season (692.4 ± 41.5 nmol.L-1), and returned to the basal
levels after the playoffs (565.5 ± 46.8 nmol.L-1). Testosterone concentrations remained stable
throughout the entire period, although near the lower normal limit, independent of athletes’
position. These results indicate that during this period, the team experienced a predominant
catabolic state, which might have contributed to the decrease in body fat percentage observed
and in the 12-min run test, mostly in the midfielders. We conclude that intensive training and
sequence of tournaments with no intervening resting periods contributed to stress. Therefore,
sport practice schedules need to be more carefully organized, in order to decrease its impact on
player’s physiology. Constant monitoring, with the determination of hormonal levels should
be included in routine evaluations of soccer players.
Keywords: soccer, cortisol, testosterone, stress
25
Introduction Soccer involves high-intensity, intermittent exercise relying predominantly on aerobic
energy pathways combined with intermittent anaerobic incidents (Kinkerdall, 1985; Ekblom,
1986; Bangsbo, 1994). That is why conditioning programs for soccer players must focus on
aerobic capacity, strength, power, speed, and speed endurance. Appropriate conditioning must
also focuses on the maintenance or improvement of standards of performance, associated with
the ability of body systems to recover and regenerate following strenuous training sessions and
games, as well as the ability to cope with the psychological stress related to tournaments
(Carli, Di Prisco, Martelli, & Vitti, 1982; Ekblom, 1986; Kraemer, French, Paxton, Hakkinen,
Volek, Sebastianelli et al., 2004). Therefore, the training programs and competitions are
constantly challenging the athlete’s body's homeostasis, thus triggering the stress reaction,
which may lead to adaptation in higher levels of performance or reduced performance and
overtraining.
Stress has been defined as the body multi-system response to any challenge that
overwhelms, or is judge to overwhelm, selective homeostatic mechanisms (Day, 2005).
Although the stress response involves many organic systems, cortisol has been identified as a
reliable marker of stress. On the other hand, testosterone has been pointed out as an indicator
of explosive performance (Cardinale & Stone, 2006) and recovery, and the balance between
cortisol and testosterone has been proposed as indicating predominance of catabolism or
anabolism during pre-season training and competition (Kraemer, Patton, Gordon, Harman,
Deschenes, Reynolds et al., 1995; Kraemer, 2000). Such balance might be influenced by
playing out of or at home (Neave & Wolfson, 2003), the outcomes (Suay, Salvador, Gonzalez-
Bono, Sanchís, Martinez, Martinez-Sanches,et al., 1999; Edwards, Wetzel & Wyner, 2006)
and if the player is a starter or a replacer (Kraemer et al., 2004).
However, the data in the literature related to this issue are not consistent, especially for
team sports such as soccer (Banfi & Dolci, 2006). It has been demonstrated that during the
course of a competitive soccer season, basal levels of both cortisol and testosterone can
become significantly higher than those found during the pre-season period (Carli et al., 1982).
Other studies have shown increases in the resting serum concentration of testosterone (Staron,
Karapondo, Kraemer, Fry, Gordon, Falkel et al., 1994) and decreases in that of cortisol (Staron
et al., 1994; Kraemer et al., 1995) during long term, normal strength training programs. On the
other hand, those alterations were claimed to occur only in starting players but not in non-
starters (Gorostiaga, Izquerdo, Ruesta, Iribarren, Gonzalez-Badillo & Ibánez , 2004).
26
An additional component of the stress of soccer involves the calendar of matches
which frequently deprives players of resting periods between sequences of competitions, so
that the players may enter the competitive season in a predominantly catabolic state which
may negatively influence the performance and, then, outcomes.
In the present study, the serum concentrations of cortisol and testosterone were
evaluated as markers of the catabolic/anabolic balance in young soccer players, during two
training periods, before and after two consecutive tournaments. The aim was to evaluate the
interference of the training program and sequence of tournaments in the performance and in
the basal concentrations of these hormones as markers of the players’ metabolic state.
Methods
Subjects
Thirty male soccer players (16 to 19 years old) of a soccer team which was classified in
the top rank league in the State of São Paulo, Brazil (Associação Atlética Ponte Preta,
Campinas, SP, Brazil) participated in this study. The research design was approved by the
Committee for Ethics in Human Research of the Medical School, of the State University of
Campinas, and it was explained to the players, their parents and the team coaches. The players
volunteered for the study, and they and their parents signed the written informed consent
forms. Before engaging in the study, players were submitted to a clinical examination by the
team physician in order to verify their health conditions, height and body mass. Those who
reported health problems or who were taking any medication were excluded from the study.
Body mass and clinical conditions were again evaluated at the end of the training season. At
the conclusion of the study, all the subjects met the predetermined criteria and had completed
the season without serious injury, except for one athlete who had a shoulder injury with
indication for surgery.
Conditioning program and tournament features
The training season started in March. The training program macro cycle consisted of
three consecutive phases respectively focused in strength, power and velocity lasts from
March to July, before the first tournament, that occurred in August and September. The second
macro
27
cycle lasts from October till December, following the same program, although for a shorter
period. The tournament occurred in January. During the training season, players trained 20 h a
week distributed in 10-12 periods. Both tournaments consisted of two phases. In the first phase
of the tournament, all teams played ten games. Those which won more games were classified
for the second phase. The team that we evaluated won only two of ten games and it was
eliminated. The second tournament first phase consisted of three games. The team won only
one and it was again out of the tournament after the first phase. All games were played out of
home and the team participants in 2 or 3 games a week. In the days with no games, throughout
the tracking, the players continued to participate in regular team practice (for speed, agility,
and endurance, as well as in simulated games). All workouts were supervised by the team
coaches.
Experimental approach
Monitoring started in June, after three months of training, and continued for 26 weeks,
until the following January. This period included two training periods and two tournaments,
one occurring in August and September, and the other in January. Measurements of physical
performance were made once in June (after the power phase of the first training season, T1)
and again in November (during the power phase of the second training season, T5); serum
concentration of cortisol and testosterone were assessed seven times during this period: in
June (T1) and July (immediately before the first tournament, T2); in October (4 days after the
end of the tournament and at the beginning of the second training period, T3); in November
and December (after the strength phase of the second training season, T4 and after the power
phase of the second training season, T5, respectively); and two times in January (immediately
before and after the second tournament, T6 and T7, respectively). A minimum interval of 15
days separated evaluations.
Therefore, T1 and T5; T2 and T6; T3 and T7 were correspondent phases for the first
and second seasons; before and after the first and the second tournaments, respectively.
Physical performance testing
Physical performance was tested on a previously determined morning in the club
gymnasium. All the players were familiar with the environment and the tests, which were
conducted under the supervision of the team coaches and the investigators.
28
Following instructions, the subjects performed three continuous maximal effort
contractions (extension/flexion) throughout the complete range of motion of the leg. The
greatest strength produced during each of the assessments was recorded, and the data were
used to represent the maximal isokinetic strength of knee for that velocity.
Aerobic capacity was evaluated using the “12-minute run test” in which the athlete
must run at least 2700 m in 12 min. These two tests must be performed by each athlete before
being included in an official competition, as ruled by the “Federation Internationale de
Football Association” (FIFA) and the “Union of European Football Association (UEFA)”.
Blood sample collection and analysis
Blood samples were collected by a qualified nurse in the club infirmary, between 8:00
and 10:00 am, under the supervision of the investigators, always on Mondays, since the
athletes did not train on Sundays and Saturdays. The subjects had fasted for 12-h prior to the
tests. There was no control on their activities did on the weekend. A 10-ml blood sample was
obtained from the antecubital vein of each soccer player. Blood samples were allowed to clot
at room temperature, and centrifuged at 2500 rpm, for 10 minutes, at 4oC. The serum was
them removed and stored at -80oC until subsequent analysis. Serum concentrations of
testosterone and cortisol were determined in duplicate using a commercial immunoassay kit
(Diagnostic System Laboratories Inc., Webster, TX, USA). The intra- and inter-assay
variances for cortisol were 5 and 8%, respectively, and for testosterone, 6 and 4 %,
respectively.
Statistical analyses
Data are presented as means ± s.e.m. Student t test, one-way analysis of variance or
Kruskall-Wallis test were used for comparison between periods. When a significant F value
was obtained, the Tukey or Dunn tests were used to locate the differences between means. The
level of significance was set at p<0.05.
Results
The soccer players participating in this study were 18.3 ± 0.1 years old and 1.78 ± 0.01
m height. Although the mean players body mass showed no significant difference between
29
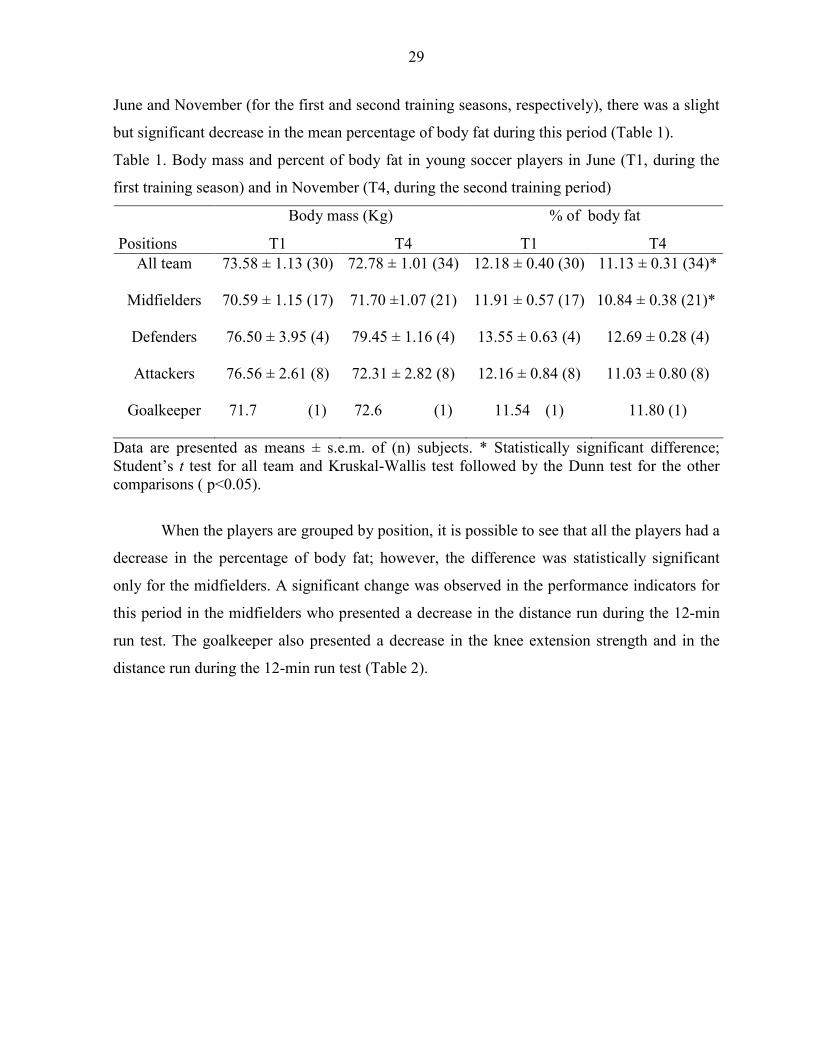
June and November (for the first and second training seasons, respectively), there was a slight
but significant decrease in the mean percentage of body fat during this period (Table 1).
Table 1. Body mass and percent of body fat in young soccer players in June (T1, during the
first training season) and in November (T4, during the second training period)
Body mass (Kg) % of body fat
Positions T1 T4 T1 T4 All team 73.58 ± 1.13 (30) 72.78 ± 1.01 (34) 12.18 ± 0.40 (30) 11.13 ± 0.31 (34)*
Midfielders 70.59 ± 1.15 (17) 71.70 ±1.07 (21) 11.91 ± 0.57 (17) 10.84 ± 0.38 (21)*
Defenders 76.50 ± 3.95 (4) 79.45 ± 1.16 (4) 13.55 ± 0.63 (4) 12.69 ± 0.28 (4)
Attackers 76.56 ± 2.61 (8) 72.31 ± 2.82 (8) 12.16 ± 0.84 (8) 11.03 ± 0.80 (8)
Goalkeeper 71.7 (1) 72.6 (1) 11.54 (1) 11.80 (1)
Data are presented as means ± s.e.m. of (n) subjects. * Statistically significant difference; Student’s t test for all team and Kruskal-Wallis test followed by the Dunn test for the other comparisons ( p<0.05).
When the players are grouped by position, it is possible to see that all the players had a
decrease in the percentage of body fat; however, the difference was statistically significant
only for the midfielders. A significant change was observed in the performance indicators for
this period in the midfielders who presented a decrease in the distance run during the 12-min
run test. The goalkeeper also presented a decrease in the knee extension strength and in the
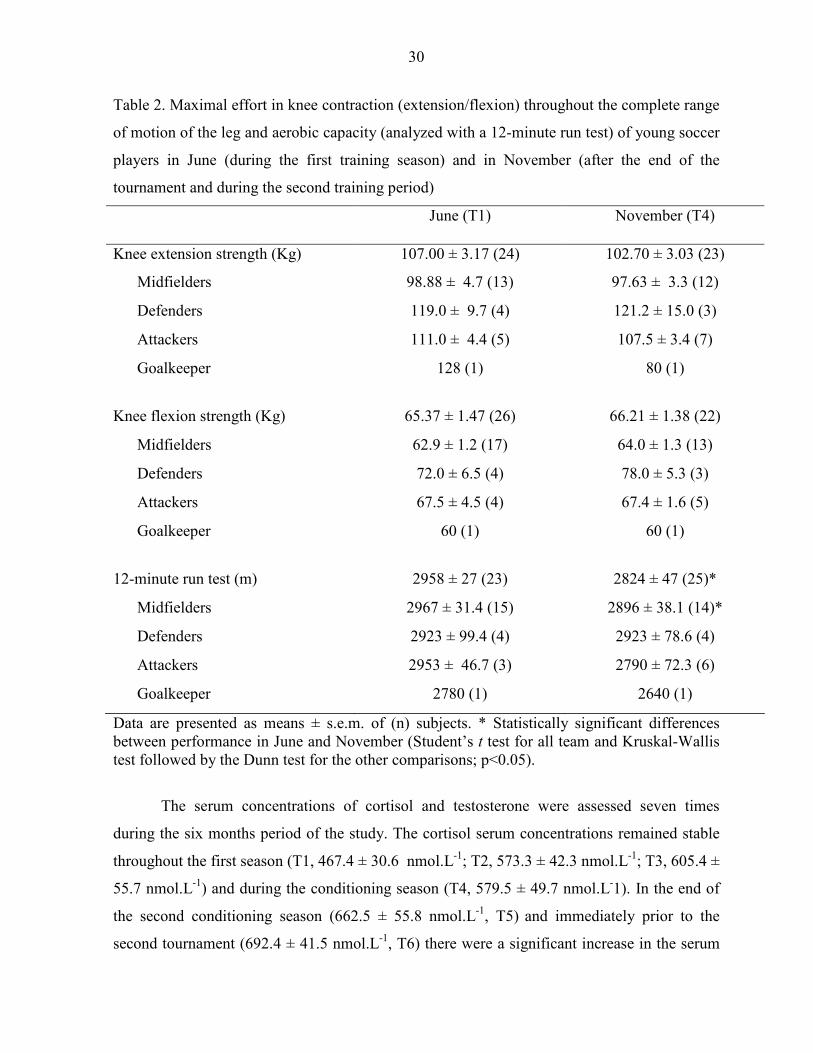
distance run during the 12-min run test (Table 2).
30
Table 2. Maximal effort in knee contraction (extension/flexion) throughout the complete range
of motion of the leg and aerobic capacity (analyzed with a 12-minute run test) of young soccer
players in June (during the first training season) and in November (after the end of the
tournament and during the second training period)
June (T1) November (T4)
Knee extension strength (Kg) 107.00 ± 3.17 (24) 102.70 ± 3.03 (23)
Midfielders 98.88 ± 4.7 (13) 97.63 ± 3.3 (12)
Defenders 119.0 ± 9.7 (4) 121.2 ± 15.0 (3)
Attackers 111.0 ± 4.4 (5) 107.5 ± 3.4 (7)
Goalkeeper 128 (1) 80 (1)
Knee flexion strength (Kg) 65.37 ± 1.47 (26) 66.21 ± 1.38 (22)
Midfielders 62.9 ± 1.2 (17) 64.0 ± 1.3 (13)
Defenders 72.0 ± 6.5 (4) 78.0 ± 5.3 (3)
Attackers 67.5 ± 4.5 (4) 67.4 ± 1.6 (5)
Goalkeeper 60 (1) 60 (1)
12-minute run test (m) 2958 ± 27 (23) 2824 ± 47 (25)*
Midfielders 2967 ± 31.4 (15) 2896 ± 38.1 (14)*
Defenders 2923 ± 99.4 (4) 2923 ± 78.6 (4)
Attackers 2953 ± 46.7 (3) 2790 ± 72.3 (6)
Goalkeeper 2780 (1) 2640 (1)
Data are presented as means ± s.e.m. of (n) subjects. * Statistically significant differences between performance in June and November (Student’s t test for all team and Kruskal-Wallis test followed by the Dunn test for the other comparisons; p<0.05).
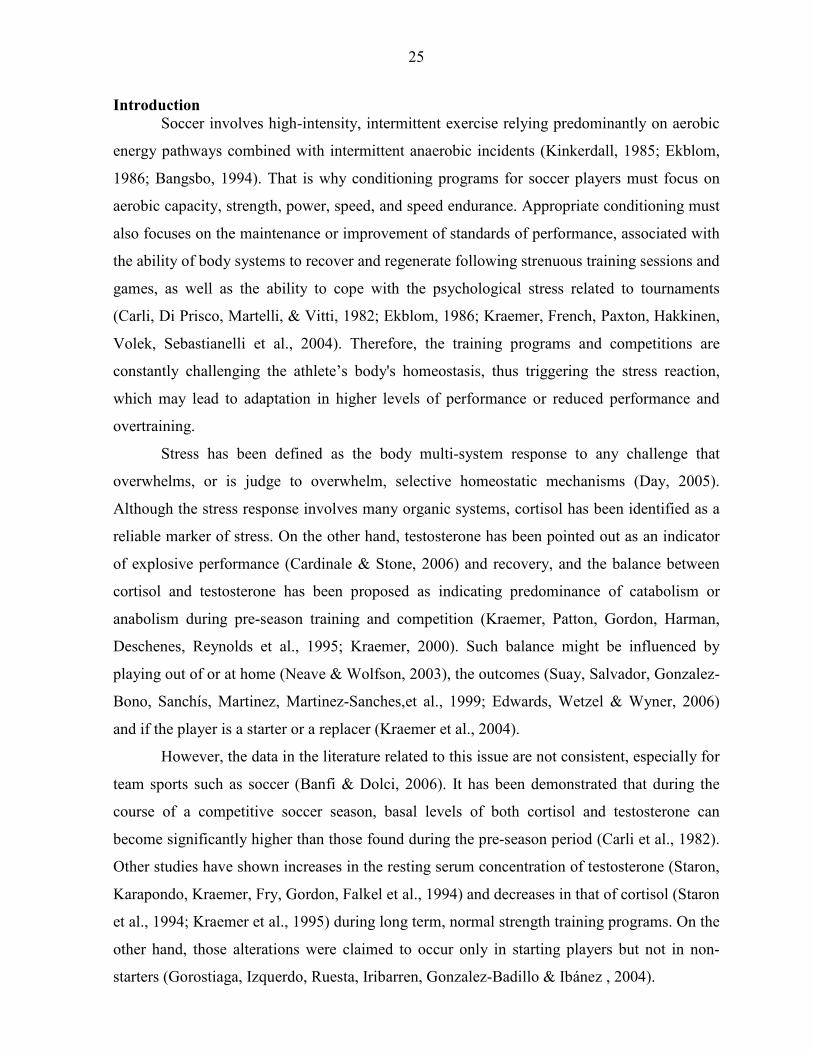
The serum concentrations of cortisol and testosterone were assessed seven times
during the six months period of the study. The cortisol serum concentrations remained stable
throughout the first season (T1, 467.4 ± 30.6 nmol.L-1; T2, 573.3 ± 42.3 nmol.L-1; T3, 605.4 ±
55.7 nmol.L-1) and during the conditioning season (T4, 579.5 ± 49.7 nmol.L-1). In the end of
the second conditioning season (662.5 ± 55.8 nmol.L-1, T5) and immediately prior to the
second tournament (692.4 ± 41.5 nmol.L-1, T6) there were a significant increase in the serum
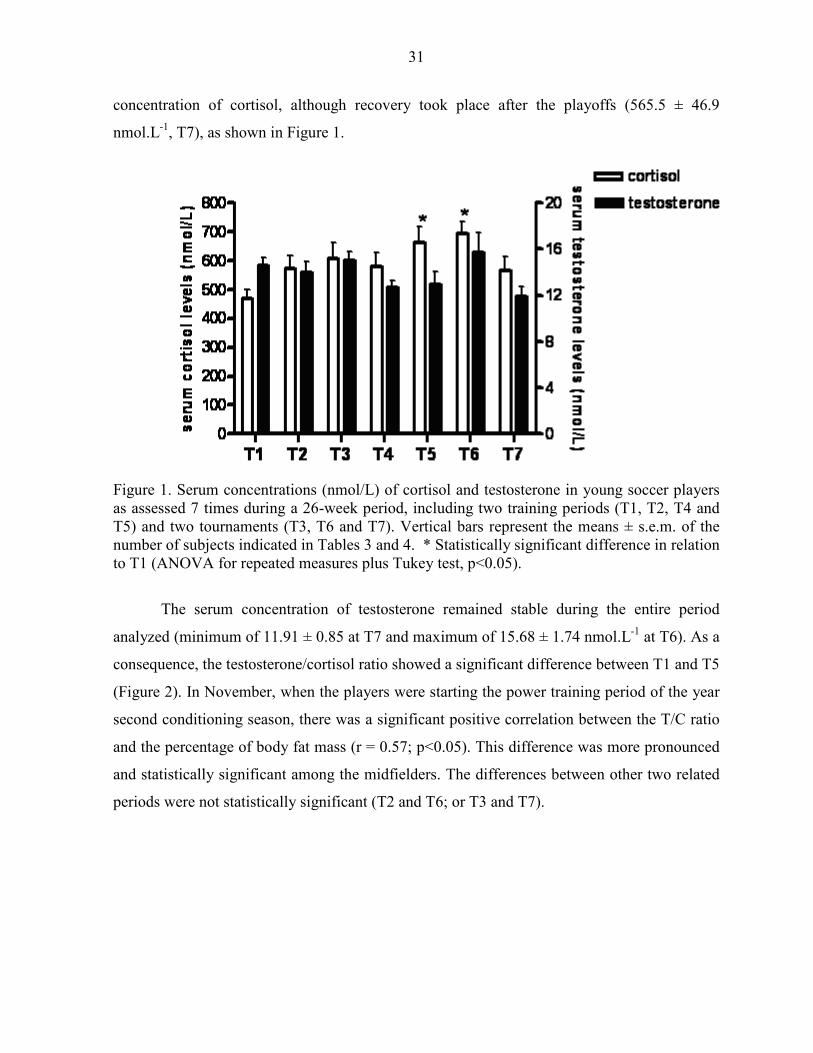
31
concentration of cortisol, although recovery took place after the playoffs (565.5 ± 46.9
nmol.L-1, T7), as shown in Figure 1.
Figure 1. Serum concentrations (nmol/L) of cortisol and testosterone in young soccer players as assessed 7 times during a 26-week period, including two training periods (T1, T2, T4 and T5) and two tournaments (T3, T6 and T7). Vertical bars represent the means ± s.e.m. of the number of subjects indicated in Tables 3 and 4. * Statistically significant difference in relation to T1 (ANOVA for repeated measures plus Tukey test, p<0.05).
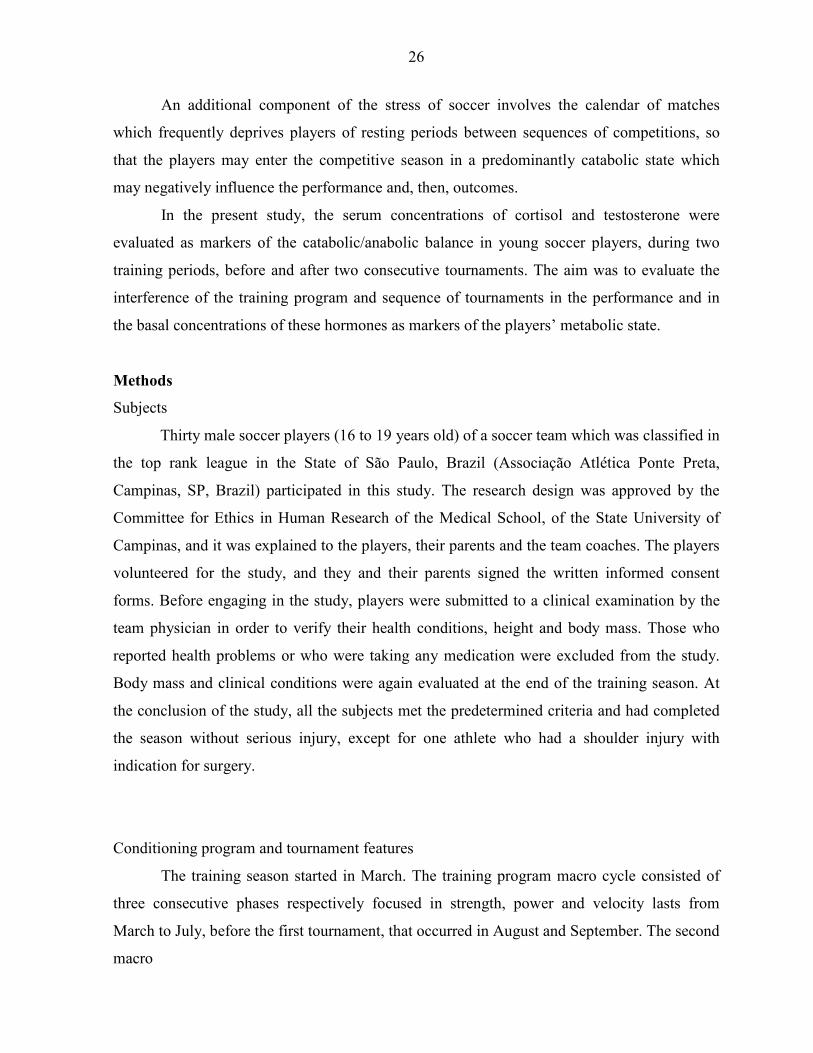
The serum concentration of testosterone remained stable during the entire period
analyzed (minimum of 11.91 ± 0.85 at T7 and maximum of 15.68 ± 1.74 nmol.L-1 at T6). As a
consequence, the testosterone/cortisol ratio showed a significant difference between T1 and T5
(Figure 2). In November, when the players were starting the power training period of the year
second conditioning season, there was a significant positive correlation between the T/C ratio
and the percentage of body fat mass (r = 0.57; p<0.05). This difference was more pronounced
and statistically significant among the midfielders. The differences between other two related
periods were not statistically significant (T2 and T6; or T3 and T7).
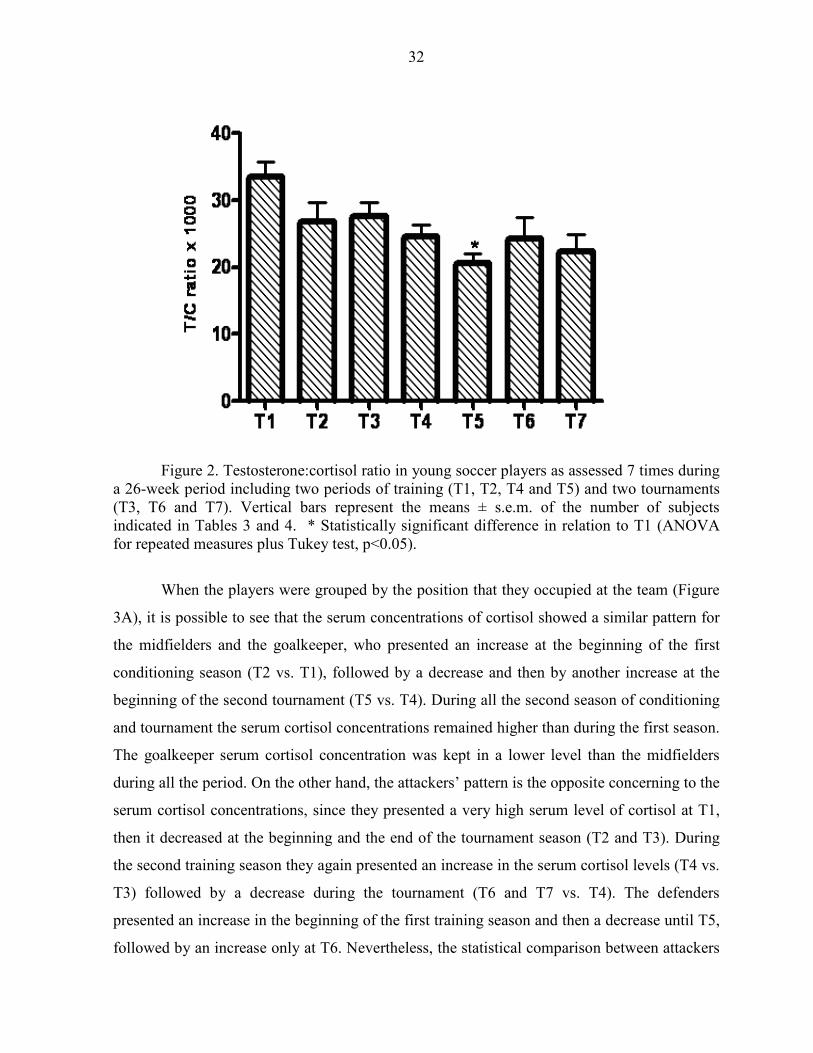
32
Figure 2. Testosterone:cortisol ratio in young soccer players as assessed 7 times during a 26-week period including two periods of training (T1, T2, T4 and T5) and two tournaments (T3, T6 and T7). Vertical bars represent the means ± s.e.m. of the number of subjects indicated in Tables 3 and 4. * Statistically significant difference in relation to T1 (ANOVA for repeated measures plus Tukey test, p<0.05).
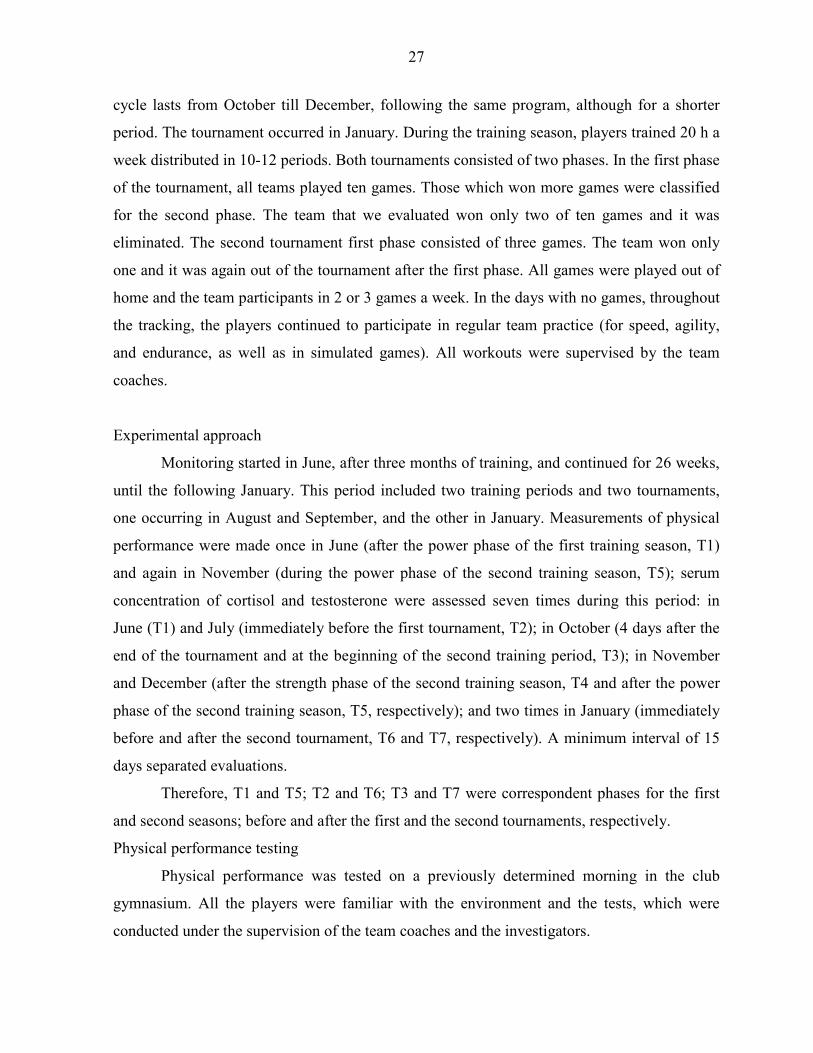
When the players were grouped by the position that they occupied at the team (Figure
3A), it is possible to see that the serum concentrations of cortisol showed a similar pattern for
the midfielders and the goalkeeper, who presented an increase at the beginning of the first
conditioning season (T2 vs. T1), followed by a decrease and then by another increase at the
beginning of the second tournament (T5 vs. T4). During all the second season of conditioning
and tournament the serum cortisol concentrations remained higher than during the first season.
The goalkeeper serum cortisol concentration was kept in a lower level than the midfielders
during all the period. On the other hand, the attackers’ pattern is the opposite concerning to the
serum cortisol concentrations, since they presented a very high serum level of cortisol at T1,
then it decreased at the beginning and the end of the tournament season (T2 and T3). During
the second training season they again presented an increase in the serum cortisol levels (T4 vs.
T3) followed by a decrease during the tournament (T6 and T7 vs. T4). The defenders
presented an increase in the beginning of the first training season and then a decrease until T5,
followed by an increase only at T6. Nevertheless, the statistical comparison between attackers
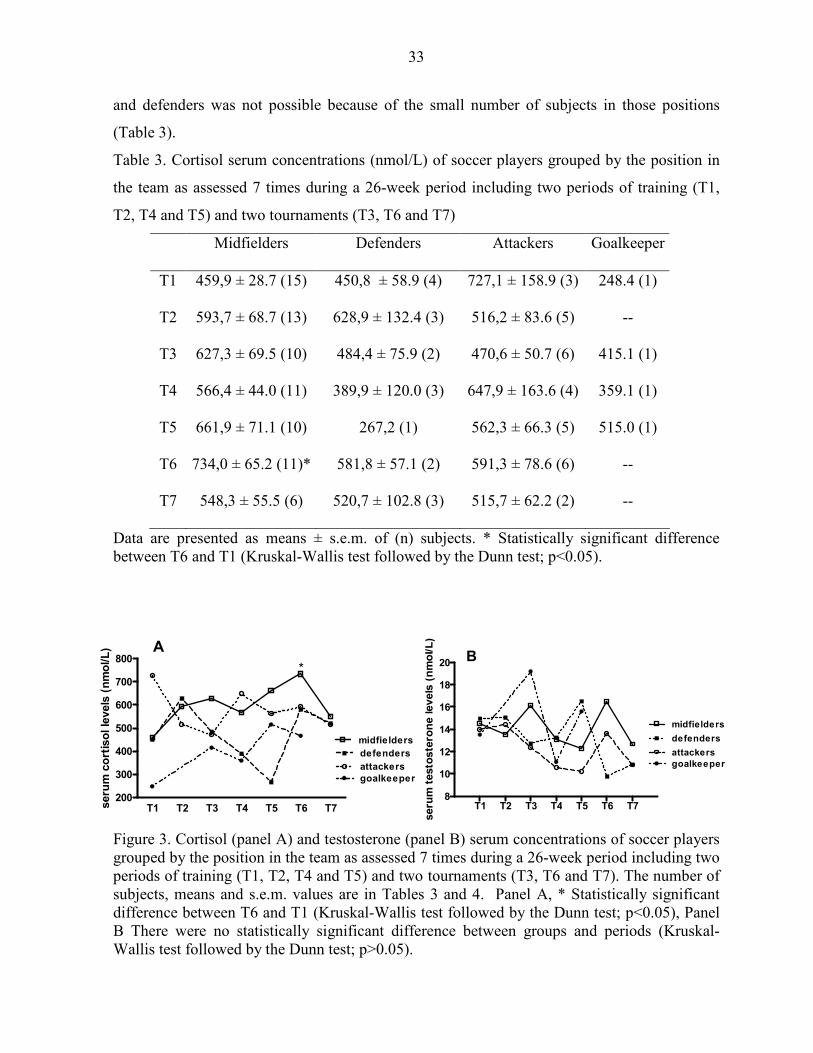
33
and defenders was not possible because of the small number of subjects in those positions
(Table 3).
Table 3. Cortisol serum concentrations (nmol/L) of soccer players grouped by the position in
the team as assessed 7 times during a 26-week period including two periods of training (T1,
T2, T4 and T5) and two tournaments (T3, T6 and T7)
Midfielders Defenders Attackers Goalkeeper
T1 459,9 ± 28.7 (15) 450,8 ± 58.9 (4) 727,1 ± 158.9 (3) 248.4 (1)
T2 593,7 ± 68.7 (13) 628,9 ± 132.4 (3) 516,2 ± 83.6 (5) --
T3 627,3 ± 69.5 (10) 484,4 ± 75.9 (2) 470,6 ± 50.7 (6) 415.1 (1)
T4 566,4 ± 44.0 (11) 389,9 ± 120.0 (3) 647,9 ± 163.6 (4) 359.1 (1)
T5 661,9 ± 71.1 (10) 267,2 (1) 562,3 ± 66.3 (5) 515.0 (1)
T6 734,0 ± 65.2 (11)* 581,8 ± 57.1 (2) 591,3 ± 78.6 (6) --
T7 548,3 ± 55.5 (6) 520,7 ± 102.8 (3) 515,7 ± 62.2 (2) --
Data are presented as means ± s.e.m. of (n) subjects. * Statistically significant difference between T6 and T1 (Kruskal-Wallis test followed by the Dunn test; p<0.05).
Figure 3. Cortisol (panel A) and testosterone (panel B) serum concentrations of soccer players grouped by the position in the team as assessed 7 times during a 26-week period including two periods of training (T1, T2, T4 and T5) and two tournaments (T3, T6 and T7). The number of subjects, means and s.e.m. values are in Tables 3 and 4. Panel A, * Statistically significant difference between T6 and T1 (Kruskal-Wallis test followed by the Dunn test; p<0.05), Panel B There were no statistically significant difference between groups and periods (Kruskal-Wallis test followed by the Dunn test; p>0.05).
T1 T2 T3 T4 T5 T6 T78
10
12
14
16
18
20
midfielders
defenders
attackersgoalkeeper
B
seru
m t
esto
ste
ron
e levels
(n
mo
l/L
)
T1 T2 T3 T4 T5 T6 T7200
300
400
500
600
700
800
midfielders
attackers
defenders
goalkeeper
A
*
seru
m c
ort
iso
l le
vels
(n
mo
l/L
)

34
Moreover, some of the players did not show up in some of the evaluations, reducing
even more the number of subjects in each group. Those considerations should be extended to
the serum concentrations of testosterone, since no significant alterations were observed in any
group (Figure 3B and table 4).
Table 4. Testosterone serum concentration (nmol/L) of soccer players grouped by the position
in the team as assessed 7 times during a 26-week period including two periods of training (T1,
T2, T4 and T5) and two tournaments (T3, T6 and T7)
Midfielders Defenders Attackers Goalkeeper
T1 14.53 ± 1.2 (15) 14.97 ± 1.1 (4) 14.00 ±1.5 (3) 13.53 (1)
T2 13.57 ± 1.1 (12) 15.07 ± 1.9 (3) 14.43 ± 3.9(5) --
T3 16.13 ± 1.2 (11) 12.74± 1.3 (3) 12.38 ± 0.9 (6) 19.21 (1)
T4 13.10 ± 1.0 (11) 13.26 ± 2.3 (3) 10.61 ± 0.9 (5) 11.08 (1)
T5 12.31 ± 1.2 (10) 9.20 ± 0.0 (2) 10.20 ± 1.4 (5) 15.62 (1)
T6 16.52 ± 2.4 (11) 9.79 ± 3.1 (2) 13.63 ± 3.7 (6) --
T7 12.69 ± 1.4 (6) 10.84 ± 1.8 (3) 10.80 ± 2.0 (2) 13.53 (1)
Data are presented as means ± s.e.m. of (n) subjects. There were no statistically significant difference between groups and periods (Kruskal-Wallis test followed by the Dunn test; p>0.05).
Discussion
The aim of a conditioning program is to improve athletic performance. The program
adopted for Brazilian players tends to be divided in periods during which specific aspects such
as strength, power resistance and velocity are worked on. The results presented here have
shown that the conditioning program imposed on this team of young soccer players did not
35
result in any improvement or decrease neither in knee extension and flexion strength nor in
performance on the 12-minute run test, except for the midfielders that showed a decrease in
the distance run during the test and in the percent of body fat after the end of the two
consecutive training periods and the intervening tournament. Filaire, Bernain, Sagnol & Lac
(2001) examined adult soccer players during a season of competitions, and reported no
alteration in body mass or percentage of body fat for the entire team, although there was an
increase in the maximum oxygen consumption at the end of the season. Those authors did not
group the athletes by position in the team. The data presented here show that the decrease in
the body fat percentage, which was significant for the whole team is due to the midfielders
profile. (Table1).
Kraemer et al. (2004) studied the evolution of the physical performance of young
soccer players during an 11-week competitive season and compared the results of the starters
and non-starters. These authors demonstrated a decrease in isokinetic leg strength and in the
peak torque of knee extensors, but no changes in the peak torque of knee flexors or sprint
time. Starters also revealed a significant decrease in vertical jump performance not shared by
non-starters. Those authors observed that all the players presented a decrease in performance,
especially at the end of the season, a finding suggesting that performance adaptations may be
independent of total match play (Kraemer et al., 2004). We did not monitor total match play
and did not evaluated starters or non-starters apart.
Whereas cortisol have been identified as a reliable marker of catabolism and training
stress, the presence of testosterone leading to anabolism has been suggested to be an indication
of recovery (Aldercreutz, Harkonen, Kuoppasalmi, Naveri, Huhtaniemi, Tikkanen, et al.,
1986; Hakkinen, Pakarinen, Alen, & Komi, 1987; Passelergue, & Lac, 1999; Kraemer et al.,
2004). The data reported here have shown that testosterone serum concentrations did not
change during the analyzed period and that these concentrations were near to the lower limit,
although within the normal range, which is between 10.4 and 41.6 nmol.L-1. These data
suggest that the anabolic processes have been kept to a low level throughout the entire season.
Moreover, considering that testosterone is important to explosive performance (Cardinale &
Stone, 2006), those low levels might have contributed to the poor results obtained by this
team, i.e., it was eliminated in the first phase of both tournaments.
Reports on changes in resting testosterone concentrations during resistance training
have been inconsistent (Alen, Pakarinenm Hakkinen, et al., 1988; Potteiger, Judge, Cerny, et
36
al., 1995; Kraemer & Ratamess, 2005). Substantial changes in volume and intensity may elicit
transient changes in resting testosterone concentrations; however, values may return to
baseline when the individual returns to ‘normal’ training (Kraemer & Ratamess, 2005).
On the other hand, in the team analyzed here, cortisol serum concentrations were
maintained, in the entire period, near the maximum value of the normal concentration range
which is between 110.4 and 745.2 nmol.L-1. The serum concentrations of cortisol were higher
at T5 and T6, indicating that the team had suffered more stress during the second than the first
training season. At the end of tournament (T7), serum concentrations of cortisol had returned
to values similar to those observed at T1. These results indicate that throughout the period, the
team had experienced predominantly a catabolic state. This might have contributed to the
decrease in the percentage of body fat observed mostly in the midfielders that presented a
significant increase in the serum cortisol concentrations at T6 and reduction in the fat
percentage as well as a decreased performance in the 12-min run test. The testosterone/cortisol
ratio also decreased significantly at T5, mostly due to an increase in the cortisol. At this time
(T5), there is a positive correlation between T/C ratio and body fat mass percentage. The T/C
ratio has been suggested to be an indirect measure of the anabolic/catabolic properties of the
skeletal muscle (Fry & Kraemer, 1997). Some studies have previously shown changes in the
T/C ratio during strength and power training, which were positively related to performance
improvements, whereas others have shown no changes (for a review, see Kraemer &
Ratamess, 2005).
The basal concentrations of cortisol and testosterone reported here are quite similar to
those reported by Kraemer et al. (2004). However, those authors observed an increase in the
circulating testosterone levels at the end of the season, signaling a reduction in total stress
which revealed a situation contrasting with what was observed in the team analyzed here.
These changes may be related to a difference in the approach to training of the team, and may
have contributed to team performance during tournaments. Whereas Kraemer’s athletes
trained about 10 h/week, the athletes that we analyzed used to train 20 h/week. Probably, a
large period of rest between the training sessions is important to allow the increase on
testosterone serum concentrations and then to lead to anabolism and recovery in a higher level,
what was not done in the team that we analyzed. Whether the changes in hormonal profile are
a consequence of the soccer training approach, some alternative strategies should be devised to
reduce cortisol serum concentration or enhance testosterone concentrations immediately prior

37
to tournaments. This would change the prevailing catabolism into an anabolic state that will
contribute to a better performance during games. The increase in testosterone concentration
observed by Kraemer et al. (2004), not observed in the present study, may represent a rebound
of physiological functioning with the reduction of stress, possibly related to the team’s
performance. Florini (1989) has reported the antagonistic relationship between anabolic and
catabolic hormones, and indicated that a decrease in plasma testosterone coupled with a
catabolic state accompanying elevated cortisol levels can result in a reduced physical
performance. Testosterone levels were unaltered in the team that we analyzed; however, there
was an increase in the already elevated concentration of cortisol, although this did not surpass
the level of normality. This change may have influenced the strength of the catabolic state,
contributing to the poor results obtained by the team.
As previously emphasized by Kraemer et al. (2004) and also shown in the present
study, the soccer players entered the tournaments in a catabolic state; whether this metabolic
condition is reverted during the tournament (as occurred in the study of Kraemer and his
colleagues) or not (as occurred in the present study) may determine the performance of the
team. Therefore, it can be speculated that some strategies to increase testosterone serum
concentration or decrease cortisol concentration might lead to better results. The data
presented here reinforce the hypothesis of Kraemer et al. (2004) that intensive training both
during practice and tournaments contributes to chronically elevated cortisol concentrations and
low concentrations of testosterone. An additional source of stress in the case of the team
analyzed in the present study was the sequence of tournaments with no intervening resting
periods for the athletes, contributing even more to the catabolic state. These results suggest
that sport practice schedules may need to be more carefully organized by the heads of soccer
federations, who may not appreciate the impact of decisions about training on the
physiological status of the players. In this context, constant monitoring, including the
evaluation of hormonal levels of the athletes during conditioning and tournaments, should be
considered as part of the training program and included in routine evaluations of soccer
players.
Acknowledgements: This study was supported by the “Foundation for the Support of
Research in the State of São Paulo” (FAPESP grant number 02/00800-2) and the “Council for
38
Improvement of University Staff / CAPES). This report is part of the work of the Master’s
thesis for Marcia C. Garcia. The authors acknowledge the cooperation of the “Associação
Atlética Ponte Preta” that allowed the researchers’ access to their athletes, and also
acknowledge the assistance of L. Gentry El-Dash for the linguistic revision of the text.
References
Aldercreutz, H., Harkonen, K., Kuoppasalmi, H., Naveri, I., Huhtaniemi, H., & Tikkanen, K. et al. (1986). Effect of training on plasma anabolic and catabolic steroid hormones and their response during physical exercise. International Journal of Sports, 7, 27-28.
Alen, M., Pakarinen, A., Hakkinen, K. et al. (1988). Responses of serum androgenic-anabolic and catabolic hormones to prolonged strength training. International Journal of Sports and Medicine, 9: 229-233.
Banfi, G. & Dolci, A. (2006). Free testosterone/cortisol ratio in soccer: usefulness of a categorization of values. The Journal of Sports Medicine and Physical Fitness, 46 (4), 611-616.
Bangsbo, J. (1994). The physiology of soccer with special reference to intense intermittent exercise. Acta Physiologica Scandinavica, 151 (suppl 619), 1-155.
Cardinale, M. & Stone, M.H. (2006). Is testosterone influencing explosive performance? Journal of Strength and Conditioning Research, 20 91), 103-107.
Carli, G., Di Prisco, C.L., Martelli, G., & Viti, A. (1982). Hormonal changes in soccer players during an agonistic season. Journal Sports of Medicine and Physical Fitness, 22, 489-494.
Day, T. A. (2005). Defining stress as a prelude to mapping its neurocircuitry: No help from allostasis. Progress in Neuro-Psychopharmacology & Biological Psychiatry, 20: 1195-1200.
Edwards, D.A., Wetzel, K. & Wyner, D.R. (2006). Intercollegiate soccer: saliva cortisol and testosterone are elevated during competition, and testosterone is related to status and social connectedness with teammates. Physiology & Behavior, 87, 135-143.
Ekblom, B. (1986). Applied physiology of soccer. Sports Medicine, 3, 50-60. Filaire, E., Bernain, X., Sagnol, M., & Lac, G. (2001). Preliminary results on mood state,
salivary testosterone:cortisol ratio and team performance in a professional soccer team. European Journal of Applied Physiology, 86, 179-184.
Florini, J. R. (1987). Hormonal control of muscle growth. Muscle Nerve 10: 577-598. Fry, A.C. & Kraemer, W. J. (1997). Resistance exercise overtraining and overreaching:
neuroendocrine responses. Sports Medicine, 23, 106-129. Gorostiaga, E. M., Izquerdo, M., Ruesta, M., Iribarren, J., Gonzalez-Badillo, J. J., & Ibáñez, J.
(2004). Strength training effects on physical performance and serum hormones in young soccer players. European Journal of Applied Physiology, 91, 698-707.
Hakkinen, K., Pakarinen, A., Alen, M., Kauhanen, H., & Komi, P.V. (1987). Relationships between training volume, physical performance capacity, and serum hormone concentrations during prolonged training in elite weight lifters. International Journal of Sports (suppl), 61-65.
Kirkendall, D. T. (1985). The applied sport science of soccer. The Physician Sportsmedicine, 13, 53-59.
39
Kraemer, W. J. (2000). Endocrine responses to resistance exercise. In: Essentials of strength training and conditioning. (edited by Thomas R. Baechle and Roger W. Earle), pp 91-114. Champaign, IL: Human Kinetics.
Kraemer, W. J., French, D. N., Paxton, N. J., Hakkinen, K., Volek, J. S., Sebastianelli, W. J., et al. (2004). Changes in exercise performance and hormonal concentrations over a big ten soccer season in starters and nonstarters. Journal of Strength and Conditioning Research, 18(1), 121-128.
Kraemer, W.J. & Ratamess, N.A. (2005). Hormonal responses and adaptations to resistance exercise and training. Sports Medicine, 35, 339-361.
Kraemer, W. J., Patton, J. F., Gordon, S. E., Harman, E. A., Deschenes, M. R., Reynolds, R. U. et al. (1995). Compatibility of high-intensity strength and endurance training on hormonal and skeletal muscle adaptations. Journal of Applied Physiology, 78, 976-989.
Nick, N. & Wolfson, S. (2003). Testosterone, territoriality, and the ‘home advantage’. Physiology & Behavior, 78, 269-275.
Passelergue, P. & Lac, G. (1999). Saliva cortisol, testosterone and T/C ratio variations during a wrestling competition and during the post-competitive recover period. International Journal of Sports, 20, 109-113.
Potteiger, J.A., Judge, L.W., Cerny, J.A., et al. (1995). Effects of altering training volume and intensity on body mass, performance, and hormonal concentrations in weight-event athletes. Journal of Strength and Conditioning Research, 9: 55-58.
Staron, R. S., Karapondo, D. L., Kraemer, W. J., Fry, A. C., Gordon, S. E., & Falkel, J. E. (1994). Skeletal muscle adaptations during early phase of heavy-resistance training in men and women. Journal of Applied Physiology, 76, 1247-1255.
Suay, F., Salvador, A., González-Bono, E., Sanchís, C., Martínez, M., Martinez-Sanchis, S., Simon, V.M. & Montoro, J.B. (1999). Effects of competition and its outcome on serum testosterone, cortisol and prolactin. Psychoneruoendocrinology, 24, 551-566.
40
SEGUNDO MANUSCRITO
SALIVARY CORTISOL LEVELS IN BASKETBALL ATHLETES
41
SALIVARY CORTISOL LEVELS IN BASKETBALL ATHLETES
Marcia Carvalho Garcia1, Glaucia Alynne Sgobi1, Marcelo Bandieira, Dora Maria
Grassi- Kassisse1, Regina Celia Spadari-Bratfisch*1,2
1 Laboratory of Stress Study, Department of Physiology and Biophysics, Institute of Biology,
University of Campinas (UNICAMP), Campinas, São Paulo, Brazil
2 Department of Biosciences, Federal University of São Paulo (UNIFESP), Santos, São Paulo,
Brazil
* Corresponding author
R.C. Spadari-Bratfisch, PhD
Depto. de Biociências
Campus Baixada Santista
Universidade Federal de São Paulo
Rua Ana Costa no. 95
11060-001 Santos SP Brasil
E-mail: [email protected]
Running title: salivary cortisol levels in basketball players
42
ABSTRACT Aim: To quantify the salivary cortisol levels in basketball athletes in the days of games during
a competitive season and to investigate if there is any correlation between salivary cortisol
levels before and after the games with the game result.
Method: 10 male basketball athletes, 19-27 year-old, of a local club volunteer to participate in
this study after approval of the head coaches and the Institutional Ethics Committee for
Research (UNICAMP). Saliva samples were collected immediately after wake up, 30 min
later, before lunch, before dinner and before going to sleep, in salivettes®, in games days. The
competitive season was composed by 18 games occurring on Wednesdays or Saturdays and
Sundays from March till May. Games 1 and 10 were played at 11 am, games 8, 12 and 16 at 4
pm, and the other occurred at 8 pm. Saliva samples were also collected before and after each
game. The samples were frozen until analysis using a commercial kit (Diagnostics System
Laboratories (DSL), USA). Data were compared by ANOVA plus Tukey test and Pearson’s
correlation test. Differences were considered significant when P<0.05.
Results: Basal salivary cortisol levels were higher in the days of the first and second games
compared to the other ones. In most of the game days, the cortisol circadian rhythm has been
preserved. There was an anticipatory increase in the salivary cortisol levels before each game
that were even higher at the end of the games. There was a positive correlation between the
values before and after the game (r = 0.85; P=0.0001). In the games played in the morning
there was a correlation between the intensity of cortisol levels increase and victory, and this is
not seen in the games played in the afternoon or at night. There was no correlation between
salivary cortisol levels and the game results or the game being played at home or not. The
awakening cortisol responses were lower than expected.
Conclusion: In the beginning of the competitive season athletes are exposed to higher levels
of cortisol. However, the cortisol circadian rhythm has been preserved during all the season. In
the morning games the increase of cortisol levels are related to the game result, with higher
increases correlated with victory. This does not happen for the afternoon and evening games.
There was not adherence to the protocol of samples collection mostly immediately waking up
and 30 min after.
Key words: cortisol, stress, sports, competition, basketball Introduction
43
Sports practice activates the stress system (Charmandari et al., 2005) causing the
increase of the stress hormones plasma levels, such as cortisol and catecholamines. This
contributes for the athlete’s performance because the catabolic actions of these hormones
supply energy for the active tissues. After the end of a training session or game these
hormones must return to basal levels, giving place to the anabolic hormones that will
orchestrate the recovery processes (Hackney, 1999; Kellman & Kallus, 1999; Kellmann,
2002). The consequence of the correct balance between the catabolic and anabolic hormones is
adaptation with improvement of the physical performance (Budgett, 1998) as well as high
feeling of compensation (Fry, 1992; Steinacker & Lehmann, 2002). Therefore, monitoring the
stress hormones levels during sports practice may contribute to define the best training
program in an individual physiological basis.
In order to address this issue, saliva rather than blood markers are better suitable. The
saliva sample collection is painless and the volunteer may easily collect several saliva samples
during the day. Moreover, saliva samples may be collected immediately before the athletes get
into or off the court, as well as during the game intervals. The salivary hormone concentration
is proportional to the concentration of its free fraction in the blood (Vinning & McGinley,
1987) and, in the case of cortisol it is independent of the salivary flow (Kirschbaum &
Hellhammer, 1994; Duclos et al., 1998).
The plasma and salivary cortisol levels follows a circadian rhythm that produces a high
peak during morning hours progressively declining as the day follows and reaching values
next to zero around midnight. This rhythm may be altered by normal daily situations or the
presence of stressor agents. Although there are no pre-existing established values of salivary
cortisol levels during the awakening hours, the reported values for healthy adults are of about
16.6 nmol/L (Clow et al., 2004). It is also accepted that the early morning hour’s peak is a
more conservative biological measure than daytime values, although measuring and
understanding these values as well the rhythm of cortisol still is an open question in the
literature (Wust et al., 2000; Edwards et al., 2001).
Variations of plasmatic or salivary cortisol levels have been used as biological
indicators of stress related to several sports. We have reported that football players show
cortisol serum concentrations near to the maximum of the normal range (467.4 ± 30.6 nmol.L-
1) during the competitive season, and that they increased even more by the end of the season
(692.4 ± 41.5 nmol.L-1), decreasing after the playoffs (565.5 ± 46.8 nmol.L-1). These results
44
indicate that during this period, the team experienced a predominant catabolic state, probably
caused by the high levels of cortisol as a consequence of the intensive training and sequence of
tournaments with no intervening resting periods.
The competitive basketball is an intermittent high-intensity physical activity that
requires a well-development physical. Specific basketball practice is purportedly the best
method of improving the fitness characteristics of basketball athletes (Trninic, Markovuc, &
Heimer, 2001). Other factors that can influence demands of basketball include game tempo,
quality of opposition, style of play, and recovery intervention used by the coach. Over the
competition season this combined factors elicit a variable patterns of response (positive,
neutral or negative) depending on the adaptability of individual (Montgomery et al., 2008).
The aim of this report is to investigate if the salivary cortisol levels are altered in the
days of games during a competitive basketball season as well as whether the salivary cortisol
levels immediately before and after the games are related to the athletes’ performance during
the game.
Methods
Subjects
Ten adult male athletes of a local basketball team volunteered to participate. The study
was approved by the Internal Review Board of the School of Medical Sciences, State
University of Campinas (UNICAMP), Campinas, São Paulo, Brazil, and it was conducted
according to the principles of the Helsinki Declaration. A formal permission to work with the
team was received from the team’s head coach. Prior to data collection athletes reported the
use of no medications, and signed the Informed Consent Term.
The athletes were 19 to 27 year-old (21.20 ± 0.79), 1.78 to 2.00 m height. The team use
to train during two hours a day from Monday to Saturday and participates in competitions all
over the year. We monitored this team during three months from March to May. During this
period, the team participates in a tournament of eighteen games occurring on Wednesdays and
on Saturdays or Sundays at 11:00, 16:00, or 20:00 o’clock. During this tournament the team
played with two other teams. If the first game took place in the team’s court, the next one took
place on the opponent’s court.
Physical performance testing
45
Physical performance was tested on a previously determined morning in the club
gymnasium at the end of the season. All the players were familiar with the environment and
the tests, which were conducted under the supervision of the team coaches and the
investigators.
Following instructions, the subjects performed four sprints by the way draft on the
court with cones. After the two sprinters without ball, the athletes rest by three minutes when
were analyzed lactate concentration. Then, the athletes were repetition this test with ball, by
two times following. Again, after three minutes of rest the lactate concentration were realized.
Experimental approach
The athletes were given written and verbal instructions on how to collect saliva
samples and received plastic bags containing four salivettes® each (Sarstedt, Numbrecht,
Germany). The athletes were requested to collect their saliva samples immediately upon
waking up, 30 min after that, and right before going to sleep. When the game was held in the
morning (11:00 o’clock) they should collect a saliva sample right before dinner too. When the
game was held in the afternoon or at night, they were asked to collect an additional saliva
sample right before lunch. Immediately before and after the games, the saliva samples were
collected in the court in the presence of the researchers. They were strongly recommended to
rigorously follow the instructions and not to brush their teeth or have anything in the mouth
but water for at least 30 min before taking any sample. After saliva sampling, the salivettes®
were put in the home freezer or refrigerated boxes and transported to the laboratory where
they were frozen (-20° C).
Salivary cortisol levels assay
At the time of analysis, the samples were thawed at room temperature and centrifuged
(4° C, 20 min, 2800 rpm). The cortisol levels were assayed in duplicate using a commercial
immunoassay kit (Diagnostic System Laboratories Inc., Webster, TX, USA). The intra- and
inter-assay variations for cortisol were 5 and 8%, respectively.
Statistical Analysis
Data are presented as means ± s.e.m. Student’s t test, one-way analysis of variance or
Kruskal Wallis test were used for comparison between games. When a significant F value was
obtained, the Tukey or Dunn tests were used to locate the differences between means. The
level of significance was set at p<0.05.
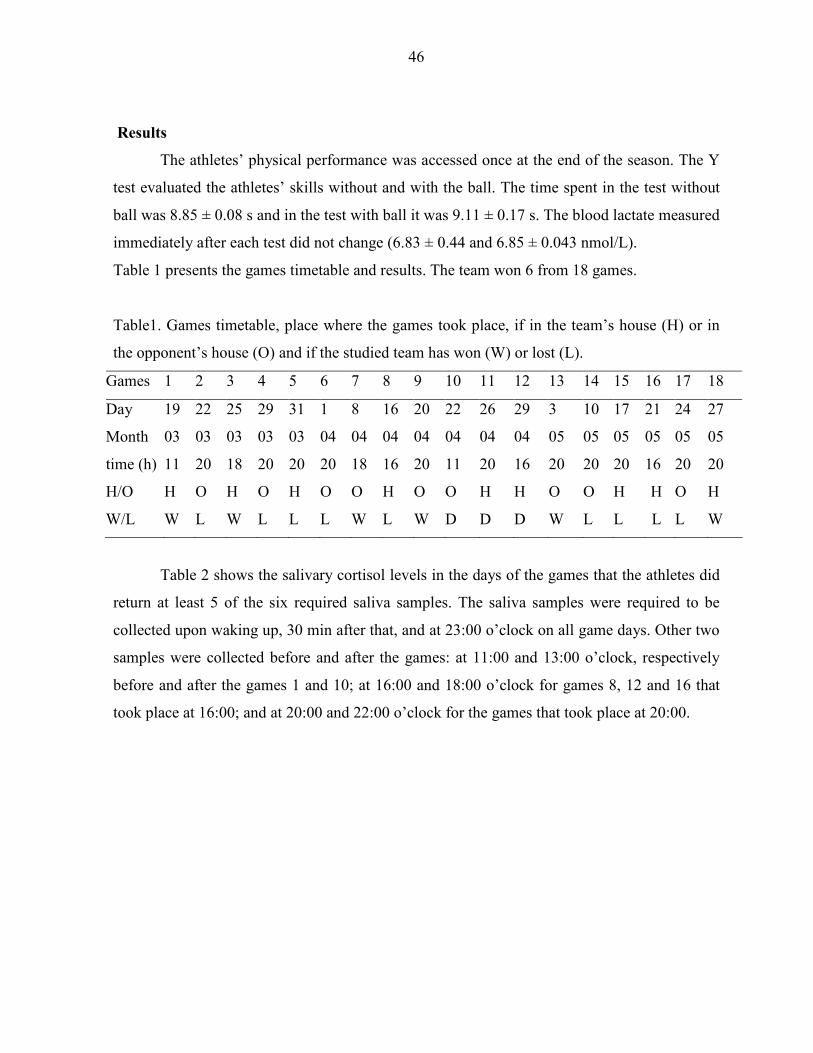
46
Results
The athletes’ physical performance was accessed once at the end of the season. The Y
test evaluated the athletes’ skills without and with the ball. The time spent in the test without
ball was 8.85 ± 0.08 s and in the test with ball it was 9.11 ± 0.17 s. The blood lactate measured
immediately after each test did not change (6.83 ± 0.44 and 6.85 ± 0.043 nmol/L).
Table 1 presents the games timetable and results. The team won 6 from 18 games.
Table1. Games timetable, place where the games took place, if in the team’s house (H) or in
the opponent’s house (O) and if the studied team has won (W) or lost (L).
Games 1 2 3 4 5 6 7 8 9 10 11 12 13 14 15 16 17 18
Day 19 22 25 29 31 1 8 16 20 22 26 29 3 10 17 21 24 27
Month 03 03 03 03 03 04 04 04 04 04 04 04 05 05 05 05 05 05
time (h) 11 20 18 20 20 20 18 16 20 11 20 16 20 20 20 16 20 20
H/O H O H O H O O H O O H H O O H H O H
W/L W L W L L L W L W D D D W L L L L W
Table 2 shows the salivary cortisol levels in the days of the games that the athletes did
return at least 5 of the six required saliva samples. The saliva samples were required to be
collected upon waking up, 30 min after that, and at 23:00 o’clock on all game days. Other two
samples were collected before and after the games: at 11:00 and 13:00 o’clock, respectively
before and after the games 1 and 10; at 16:00 and 18:00 o’clock for games 8, 12 and 16 that
took place at 16:00; and at 20:00 and 22:00 o’clock for the games that took place at 20:00.
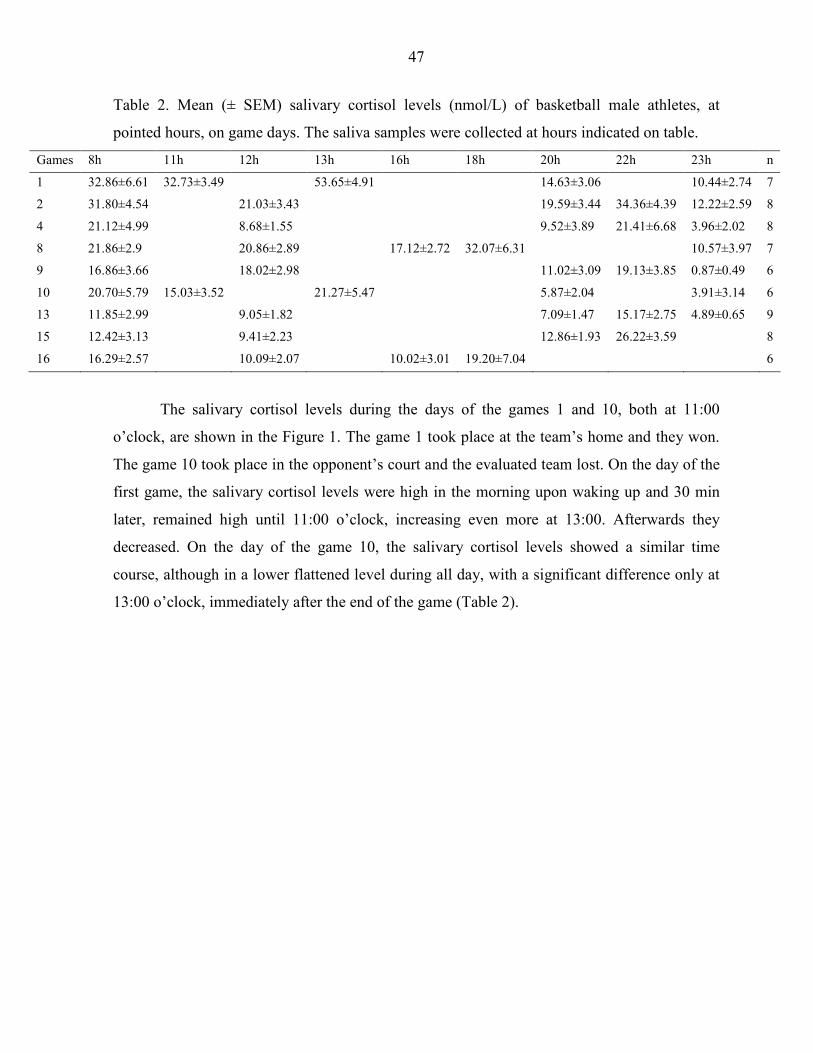
47
Table 2. Mean (± SEM) salivary cortisol levels (nmol/L) of basketball male athletes, at
pointed hours, on game days. The saliva samples were collected at hours indicated on table.
Games 8h 11h 12h 13h 16h 18h 20h 22h 23h n
1 32.86±6.61 32.73±3.49 53.65±4.91 14.63±3.06 10.44±2.74 7
2 31.80±4.54 21.03±3.43 19.59±3.44 34.36±4.39 12.22±2.59 8
4 21.12±4.99 8.68±1.55 9.52±3.89 21.41±6.68 3.96±2.02 8
8 21.86±2.9 20.86±2.89 17.12±2.72 32.07±6.31 10.57±3.97 7
9 16.86±3.66 18.02±2.98 11.02±3.09 19.13±3.85 0.87±0.49 6
10 20.70±5.79 15.03±3.52 21.27±5.47 5.87±2.04 3.91±3.14 6
13 11.85±2.99 9.05±1.82 7.09±1.47 15.17±2.75 4.89±0.65 9
15 12.42±3.13 9.41±2.23 12.86±1.93 26.22±3.59 8
16 16.29±2.57 10.09±2.07 10.02±3.01 19.20±7.04 6
The salivary cortisol levels during the days of the games 1 and 10, both at 11:00
o’clock, are shown in the Figure 1. The game 1 took place at the team’s home and they won.
The game 10 took place in the opponent’s court and the evaluated team lost. On the day of the
first game, the salivary cortisol levels were high in the morning upon waking up and 30 min
later, remained high until 11:00 o’clock, increasing even more at 13:00. Afterwards they
decreased. On the day of the game 10, the salivary cortisol levels showed a similar time
course, although in a lower flattened level during all day, with a significant difference only at
13:00 o’clock, immediately after the end of the game (Table 2).
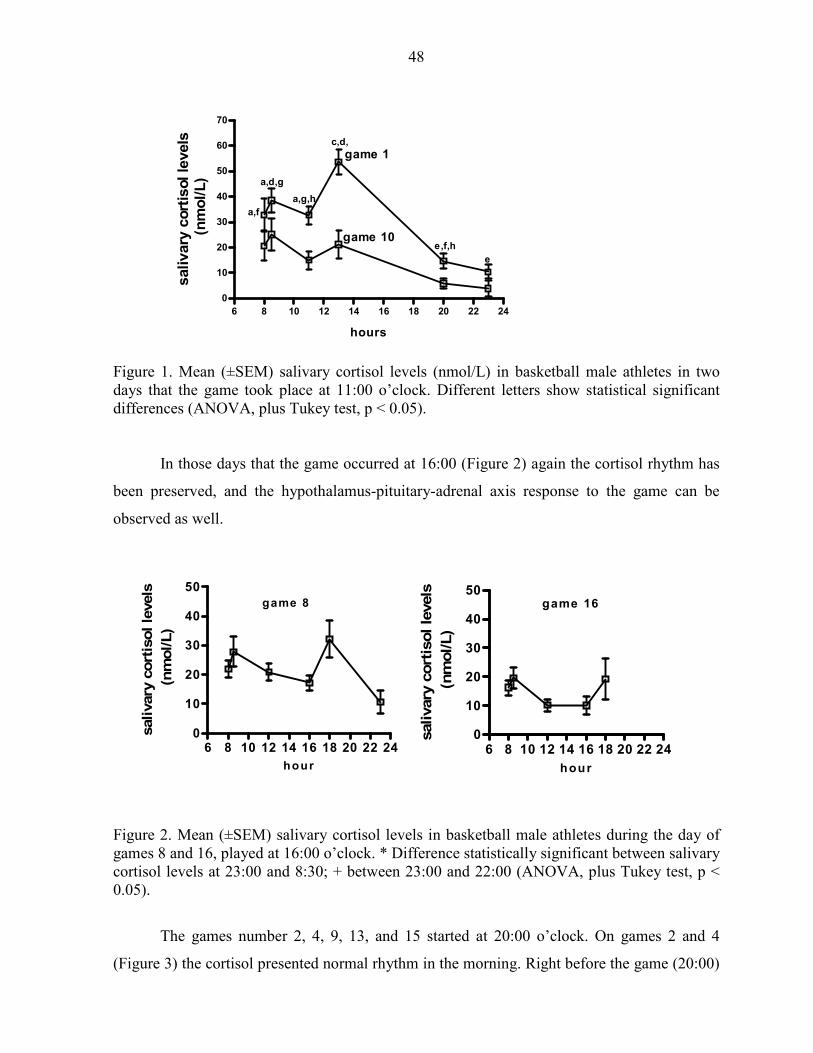
48
6 8 10 12 14 16 18 20 22 24
0
10
20
30
40
50
60
70
game 1
game 10
hours
salivary
cort
isol le
vels
(n
mo
l/L
)a,f
a,d,g
e
e,f,h
a,g,h
c,d,
Figure 1. Mean (±SEM) salivary cortisol levels (nmol/L) in basketball male athletes in two days that the game took place at 11:00 o’clock. Different letters show statistical significant differences (ANOVA, plus Tukey test, p < 0.05).
In those days that the game occurred at 16:00 (Figure 2) again the cortisol rhythm has
been preserved, and the hypothalamus-pituitary-adrenal axis response to the game can be
observed as well.
6 8 10 12 14 16 18 20 22 240
10
20
30
40
50game 16
hour
salivary
cort
isol le
vels
(nm
ol/L)
6 8 10 12 14 16 18 20 22 240
10
20
30
40
50game 8
hour
salivary
cort
isol le
vels
(nm
ol/L)
Figure 2. Mean (±SEM) salivary cortisol levels in basketball male athletes during the day of games 8 and 16, played at 16:00 o’clock. * Difference statistically significant between salivary cortisol levels at 23:00 and 8:30; + between 23:00 and 22:00 (ANOVA, plus Tukey test, p < 0.05).
The games number 2, 4, 9, 13, and 15 started at 20:00 o’clock. On games 2 and 4
(Figure 3) the cortisol presented normal rhythm in the morning. Right before the game (20:00)
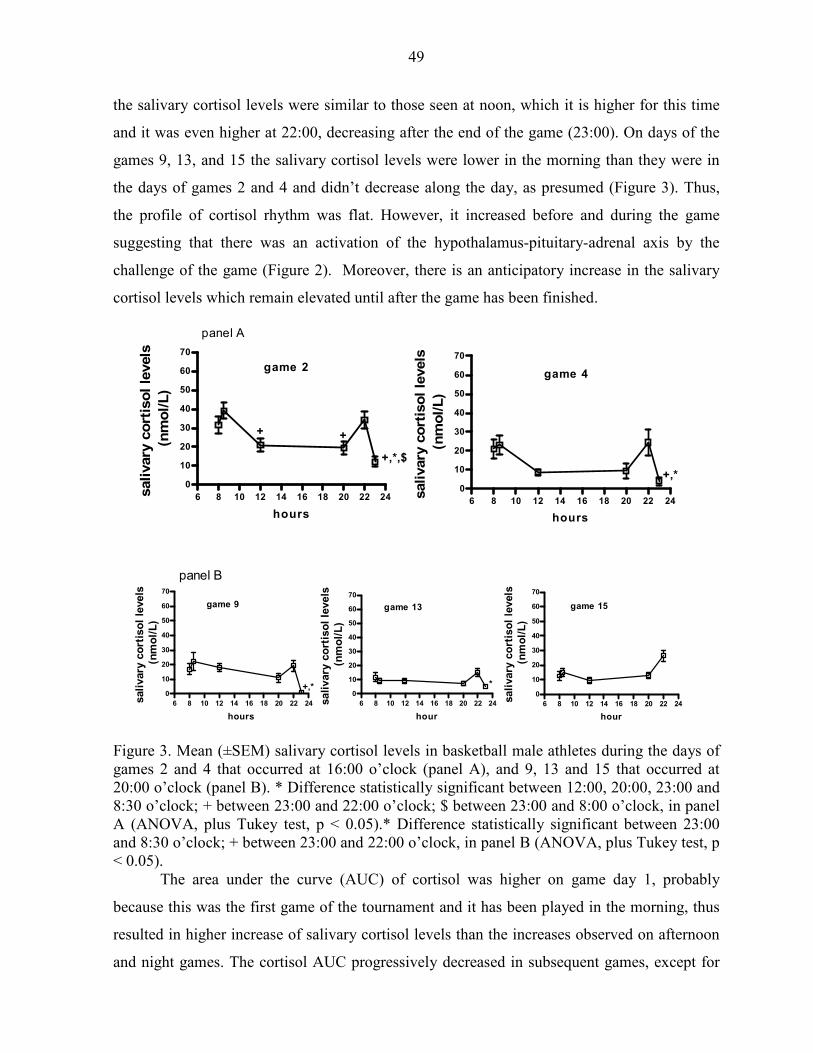
49
the salivary cortisol levels were similar to those seen at noon, which it is higher for this time
and it was even higher at 22:00, decreasing after the end of the game (23:00). On days of the
games 9, 13, and 15 the salivary cortisol levels were lower in the morning than they were in
the days of games 2 and 4 and didn’t decrease along the day, as presumed (Figure 3). Thus,
the profile of cortisol rhythm was flat. However, it increased before and during the game
suggesting that there was an activation of the hypothalamus-pituitary-adrenal axis by the
challenge of the game (Figure 2). Moreover, there is an anticipatory increase in the salivary
cortisol levels which remain elevated until after the game has been finished.
6 8 10 12 14 16 18 20 22 24
0
10
20
30
40
50
60
70
game 2
+ +
+,*,$
hours
sali
vary
co
rtis
ol
levels
(n
mo
l/L
)
6 8 10 12 14 16 18 20 22 24
0
10
20
30
40
50
60
70
game 4
+,*
hours
salivary
co
rtis
ol
levels
(n
mo
l/L
)
panel A
6 8 10 12 14 16 18 20 22 24
0
10
20
30
40
50
60
70
game 9
+,*
hours
sali
vary
co
rtis
ol
levels
(n
mo
l/L
)
6 8 10 12 14 16 18 20 22 24
0
10
20
30
40
50
60
70
game 13
*
hour
sali
vary
co
rtis
ol
levels
(n
mo
l/L
)
6 8 10 12 14 16 18 20 22 24
0
10
20
30
40
50
60
70
game 15
hour
sali
vary
co
rtis
ol
levels
(n
mo
l/L
)
panel B
Figure 3. Mean (±SEM) salivary cortisol levels in basketball male athletes during the days of games 2 and 4 that occurred at 16:00 o’clock (panel A), and 9, 13 and 15 that occurred at 20:00 o’clock (panel B). * Difference statistically significant between 12:00, 20:00, 23:00 and 8:30 o’clock; + between 23:00 and 22:00 o’clock; $ between 23:00 and 8:00 o’clock, in panel A (ANOVA, plus Tukey test, p < 0.05).* Difference statistically significant between 23:00 and 8:30 o’clock; + between 23:00 and 22:00 o’clock, in panel B (ANOVA, plus Tukey test, p < 0.05).
The area under the curve (AUC) of cortisol was higher on game day 1, probably
because this was the first game of the tournament and it has been played in the morning, thus
resulted in higher increase of salivary cortisol levels than the increases observed on afternoon
and night games. The cortisol AUC progressively decreased in subsequent games, except for
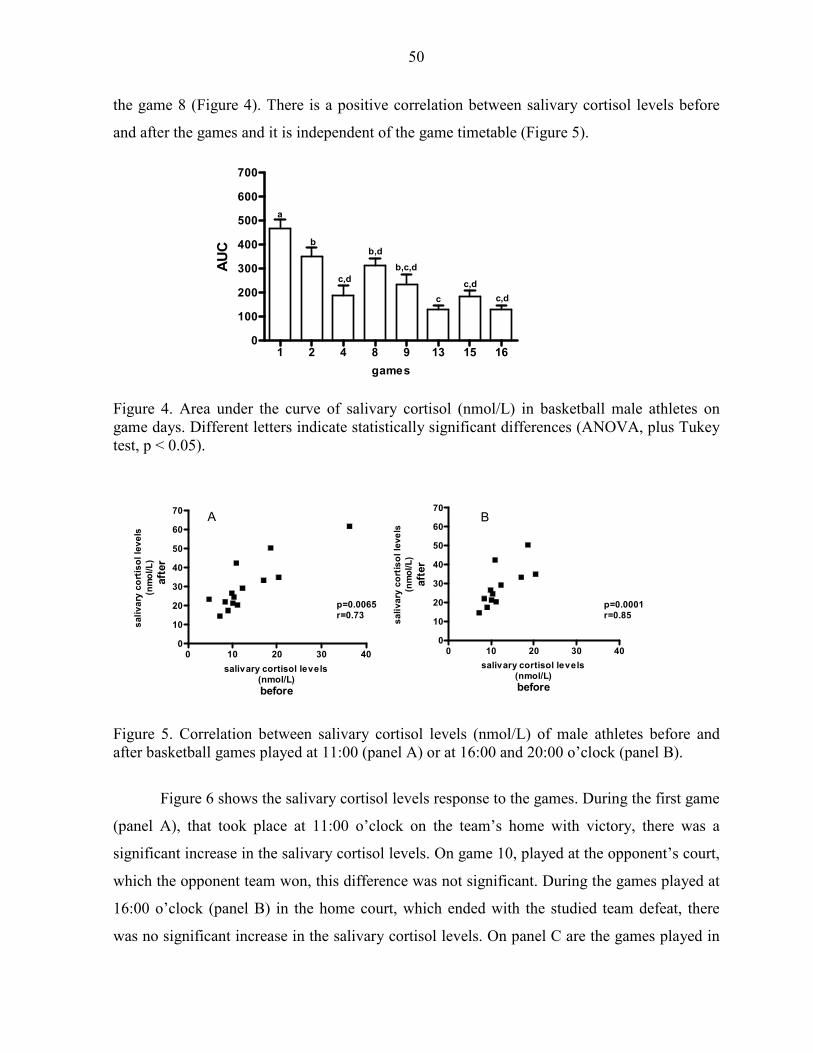
50
the game 8 (Figure 4). There is a positive correlation between salivary cortisol levels before
and after the games and it is independent of the game timetable (Figure 5).
1 2 4 8 9 13 15 160
100
200
300
400
500
600
700
a
b
c,d
b,d
b,c,d
c
c,d
c,d
games
AU
C
Figure 4. Area under the curve of salivary cortisol (nmol/L) in basketball male athletes on game days. Different letters indicate statistically significant differences (ANOVA, plus Tukey test, p < 0.05).
0 10 20 30 400
10
20
30
40
50
60
70
p=0.0065r=0.73
A
salivary cortisol levels(nmol/L)
before
sa
liv
ary
co
rtis
ol
lev
els
(nm
ol/L
)
a
fter
0 10 20 30 400
10
20
30
40
50
60
70
p=0.0001r=0.85
B
salivary cortisol levels(nmol/L)
before
sa
liv
ary
co
rtis
ol
lev
els
(nm
ol/L
)
aft
er
Figure 5. Correlation between salivary cortisol levels (nmol/L) of male athletes before and after basketball games played at 11:00 (panel A) or at 16:00 and 20:00 o’clock (panel B).
Figure 6 shows the salivary cortisol levels response to the games. During the first game
(panel A), that took place at 11:00 o’clock on the team’s home with victory, there was a
significant increase in the salivary cortisol levels. On game 10, played at the opponent’s court,
which the opponent team won, this difference was not significant. During the games played at
16:00 o’clock (panel B) in the home court, which ended with the studied team defeat, there
was no significant increase in the salivary cortisol levels. On panel C are the games played in
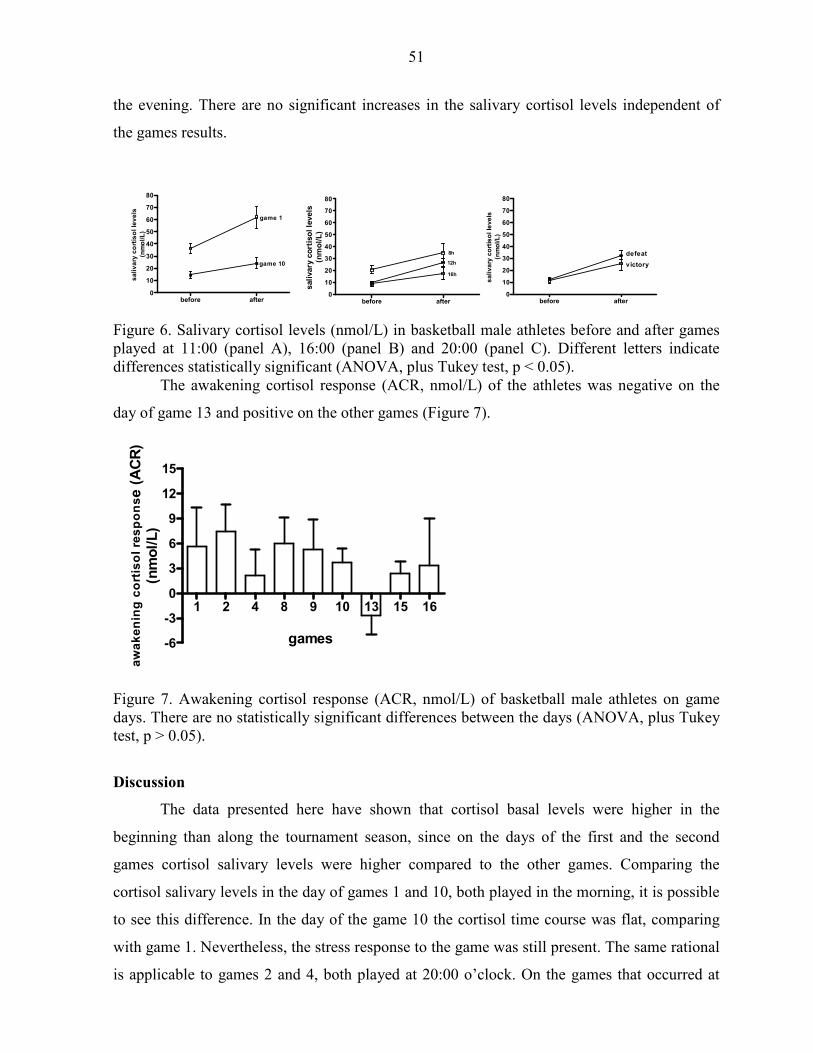
51
the evening. There are no significant increases in the salivary cortisol levels independent of
the games results.
before after0
10
20
30
40
50
60
70
80
game 1
game 10
sa
liv
ary
co
rtis
ol
lev
els
(nm
ol/
L)
before after0
10
20
30
40
50
60
70
80
8h
12h
16h
sali
vary
co
rtis
ol
levels
(nm
ol/
L)
before after0
10
20
30
40
50
60
70
80
victory
defeat
sa
liv
ary
co
rtis
ol
lev
els
(nm
ol/L
)
Figure 6. Salivary cortisol levels (nmol/L) in basketball male athletes before and after games played at 11:00 (panel A), 16:00 (panel B) and 20:00 (panel C). Different letters indicate differences statistically significant (ANOVA, plus Tukey test, p < 0.05).
The awakening cortisol response (ACR, nmol/L) of the athletes was negative on the
day of game 13 and positive on the other games (Figure 7).
1 2 4 8 9 10 13 15 16
-6
-3
0
3
6
9
12
15
games
aw
ak
en
ing
co
rtis
ol
res
po
nse
(A
CR
)(n
mo
l/L
)
Figure 7. Awakening cortisol response (ACR, nmol/L) of basketball male athletes on game days. There are no statistically significant differences between the days (ANOVA, plus Tukey test, p > 0.05).
Discussion
The data presented here have shown that cortisol basal levels were higher in the
beginning than along the tournament season, since on the days of the first and the second
games cortisol salivary levels were higher compared to the other games. Comparing the
cortisol salivary levels in the day of games 1 and 10, both played in the morning, it is possible
to see this difference. In the day of the game 10 the cortisol time course was flat, comparing
with game 1. Nevertheless, the stress response to the game was still present. The same rational
is applicable to games 2 and 4, both played at 20:00 o’clock. On the games that occurred at
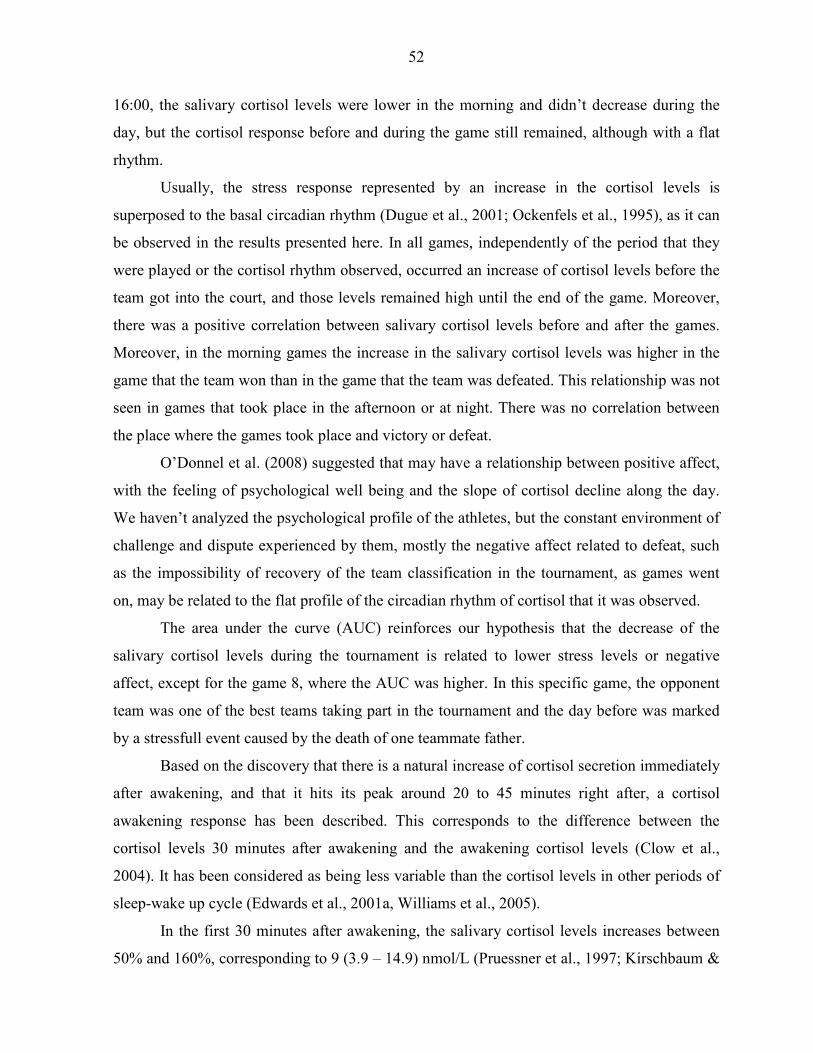
52
16:00, the salivary cortisol levels were lower in the morning and didn’t decrease during the
day, but the cortisol response before and during the game still remained, although with a flat
rhythm.
Usually, the stress response represented by an increase in the cortisol levels is
superposed to the basal circadian rhythm (Dugue et al., 2001; Ockenfels et al., 1995), as it can
be observed in the results presented here. In all games, independently of the period that they
were played or the cortisol rhythm observed, occurred an increase of cortisol levels before the
team got into the court, and those levels remained high until the end of the game. Moreover,
there was a positive correlation between salivary cortisol levels before and after the games.
Moreover, in the morning games the increase in the salivary cortisol levels was higher in the
game that the team won than in the game that the team was defeated. This relationship was not
seen in games that took place in the afternoon or at night. There was no correlation between
the place where the games took place and victory or defeat.
O’Donnel et al. (2008) suggested that may have a relationship between positive affect,
with the feeling of psychological well being and the slope of cortisol decline along the day.
We haven’t analyzed the psychological profile of the athletes, but the constant environment of
challenge and dispute experienced by them, mostly the negative affect related to defeat, such
as the impossibility of recovery of the team classification in the tournament, as games went
on, may be related to the flat profile of the circadian rhythm of cortisol that it was observed.
The area under the curve (AUC) reinforces our hypothesis that the decrease of the
salivary cortisol levels during the tournament is related to lower stress levels or negative
affect, except for the game 8, where the AUC was higher. In this specific game, the opponent
team was one of the best teams taking part in the tournament and the day before was marked
by a stressfull event caused by the death of one teammate father.
Based on the discovery that there is a natural increase of cortisol secretion immediately
after awakening, and that it hits its peak around 20 to 45 minutes right after, a cortisol
awakening response has been described. This corresponds to the difference between the
cortisol levels 30 minutes after awakening and the awakening cortisol levels (Clow et al.,
2004). It has been considered as being less variable than the cortisol levels in other periods of
sleep-wake up cycle (Edwards et al., 2001a, Williams et al., 2005).
In the first 30 minutes after awakening, the salivary cortisol levels increases between
50% and 160%, corresponding to 9 (3.9 – 14.9) nmol/L (Pruessner et al., 1997; Kirschbaum &

53
Helhammer, 2000; Clow et al., 2004). Some authors classify as “responders” the subjects that
present an increase higher or equal to 2.4 nmol/L and suggest that some people do not present
this response (Thorn, et al., 2006).
On the other hand, the use of an electronic device to measure the adherence to the
temporal sequence of sampling of saliva during the day, demonstrated that the lack of
adherence was of 26 – 29 % to participants that have not been informed that they were
monitored (Kudielka et al., 2003; Broderick et al., 2004). Not considering the strategy used to
control the adherence, the studies have demonstrated that non adherent participants present a
reduced CAR.
The athletes presented positive CAR in most of game days, and a negative value on
game 13. On game days in which it was positive, the CAR was higher than on resting days
(data not show). The higher CAR on week days (represented in our work on game days) in
relation to the ones during weekends was related to the higher stress experienced on week
days (Kunz-Ebrecht et al. 2004a; Scholtz et al. 2004). We also have detected higher CAR on
week days than on weekends on Brazilian executives (Garcia et al, 2006). The magnitude of
CAR was positively related to chronic stress (Schulz et al., 1998; Wust et al., 2000a), work
stress and depression (Williams et al., 2005). Waking up earlier on work days may be
associated to stress at work or changes in the sleeping pattern, causing changes in the circadian
rhythm of cortisol (Melamed et al., 1999; Akerstedt et al., 2002). Some authors suggest that
people who wake up earlier would have a higher CAR and experience more stress (Edwards et
al., 2001b; Kudielka & Kirschbaum, 2003; Federenko et al., 2004). Dettenborn et al. (2007)
suggested that sleeping disturbance alters the cortisol levels on the rest of the day, although
after an interrupted night of sleep the CAR does not present any changes.
On the other hand, most of the authors suggest that the absence of CAR it has no
relationship to awakening time (Steptoe et al, 2004), but in fact it seems related to the lack of
compliance to the protocol (Kudielka et al., 2003; Broderick et al., 2004; Kunz-Ebrecht et al.
2004; Wright & Steptoe, 2005; Kupper et al., 2005; Clow et al., 2004; Garcia et al., 2006;
Thorn et al., 2006), mainly after waking up. The CAR is very much affected, mainly by the
delay on making the first collect (Kunz-Ebrecht et al., 2004; Dockray et al., 2008), artificially
causing a drop on the morning peak (Dettenborn et al., 2007).
Nevertheless Pruessner et al. (1997) have admitted that around 10% of the subjects fail
to exhibit a normal CAR, independently from the compliance to the protocol of sample
54
collection. Although many different authors agree on this hypothesis, Lasikiewicz et al. (2008)
proposed that the blunt of CAR followed by the flattened of the diurnal rhythm of cortisol
corresponds to a physiological profile of cortisol secretion that may be found in some subjects,
and not as a result of a methodological error or related to non adherence to the protocol.
O’Donnell et al. (2008) worked with psychological coping styles and the cortisol over
the day in healthy older adults, and verified that CAR average was 0.31 µg/dL, equivalent to
the increase of 51%, which was similar with other works (Pruessner et al., 1997; Wust et al.,
2000a; Clow et al., 2004). The exaggerated CAR was related to a high perceived stress index
(Schultz et al., 1998; Wust et al., 2000a). We have found negative correlation between the
perceived stress index and the CAR, as compared to groups of subjects with low and high
socio-economical status (Garcia et al., 2008), considering that the first group also presented
higher indexes of perceived stress and basal levels of cortisol along the day. The low levels of
CAR and even a negative CAR value in the day of game 13 suggest that the athletes’
compliance to the protocol was poor or that in the athletes te CAR is lower than in sedentary
people.
Therefore, the results presented here pointed out those basketball male athletes
presented variations in the salivary cortisol levels during the competitive season. The games
that took place in the beginning of the season were followed by higher cortisol levels that
decreased progressively along the tournament. Independently of the basal level in the day of
the game there was an increase of the salivary cortisol level which enhanced even more until
the end of the game. It was not possible to establish a correlation between the salivary cortisol
level and the game results when the game was played in the afternoon or at night. The
intensity of the increase on the salivary cortisol levels was positively correlated to victory in
games played the morning.
References
Akerstedt, T. Knutsson, A. Westerholm, P., Theorell, T., Alfredsson, L. and Keclund, G. Sleep disturbances, work stress and work hours: a cross-sectional study. Journal of Psychosomatic Researh 53, 741-749, 2002.
Broderick, J. E. Arnold, D. Kudielka, B. M. and Kirschbaum, C. Salivary cortisol sampling compliance: comparison of patients and health volunteers. Psychoneuroendocrinology 29, 636-650, 2004.
Budgett, R. Fatigue and underperformance in athletes: the overtraining syndrome. British Journal Sports Medicine, v. 32, p. 107-110, 1998.
55
Charmandari, E.; Tsigos, C.; Chrousos, G. Endocrinology of the stress response. Annual Review of Physiology, v. 67, p. 259-84, 2005.
Clow, A., Thorn, L., Evans, P. and Hucklebridge, F. The awakening cortisol response: methodological issues and significance. Stress 7, 29-37, 2004.
Dettenborn, L., Rosenloecher, F. and Kirschbaum, C. No effects of repeated forced wakings during three consecutive nights on morning cortisol awakening responses (CAR): A preliminary study. Psychoneuroendocrinology 32, 915-921, 2007.
Duclos, M. Corcuff, J. B.; Arsac, L., Morreau-Gaudry, F.; Rashedi, M., Roger, P., Tabarin, A.; Manier, G. Corticotroph axis sensitivity after exercise in endurance- trained athletes. Clinical Endocrinology, v. 48, p. 493-501, 1998.
Dugue, B., Leppanem, E. and Grasbeck, R. The driving license examination as a stress model: effects on blood picture, serum cortisol and the production of interleukins in man. Life Science 68, 1641-47, 2001.
Dockray, S., Bhattacharyya, M. R., Molly, G. J. and Steptoe, A. The cortisol awakening response in relation to objective and subjective measures of waking in the morning. Psychoneuroendocrinology 33, 77-82, 2008.
Edwards, S., Clow, A., Evans, P. and Hucklebridge, F. Exploration of the awakening cortisol response in relation to diurnal cortisol secretory activity. Life Science 68, 2093-2103, 2001a.
Edwards, S., Evans, P., Hucklebridge, F. and Clow, A. Association between time of awakening and diurnal cortisol secretory activity. Psychoneuroendocrinology 26, 613-622, 2001b;
Federenko, I., Wust, S. Hellhammer, D. H. Dechoux, R., Kumsta, R. and Kirschbaum. C. Free cortisol awakening responses are influenced by awakening time. Psychoneuroendocrinology 29, 174-184, 2004.
Fry, R.W.; Morton, A.R.; Keast, D. Periodisation and the prevention of overtraining. Canadian Journal Sports Science, v. 17, p. 241-8, 1992.
Garcia, M.C.; Petrelluzzi, K. F.S.; Grassi-Kassisse, D.M.; Paranhos, A.; Spadari-Bratfisch, R. C. Work-related stress in Brazilian white-collar workers. 41st Congress of the Brazilian Physiological Society & Joint Meeting with The Physiological Society; Ribeirão Preto, 27-30 agosto, 2006.
Garcia, M. C.; Souza, A. G., Bella, G. P., Tacla, A. P.; Grassi-Kassisse, M .D. and Spadari-Bratfisch, R. C. Salivary cortisol levels in Brazilian citizens of distinct socioeconomic and cultural levels. Annals of the New York Academy of Science, 2008, in press.
Hackney, A C. Overload, fatigue, performance incompetence, and regeneration in sport. New York: Plenum, p. 173-86, 1999.
Kellmann, M &, Kallus, K W. Overload, fatigue, performance incompetence, and regeneration in sport. New York: Plenum: 101-17, 1999.
Kellmann, M. Enhancing recovery: prevent underperformance in athletes. Champaign (IL): Human Kinetics, p. 3-24, 2002.
Kirschbaum, C & Hellhammer, D H. Salivary cortisol in psychoneuroendocrine research: recent developments and applications Psychoneuroendocrinology, v. 194, p.13-33, 1994.
Kudielka, B. M. Broderick, J. E. and Kirschbaum, C. Compliance with saliva sampling protocols: electronic monitoring reveals invalid cortisol daytime profiles in noncompliance subjects. Psychosomatic Medicine. 65, 313-319, 2003;
Kudielka, B. M. and Kirschbaum, C. Awakening cortisol responses are influenced by health status and awakening time but not by menstrual cycle phase. Psychoneuroendocrinology 28, 35-47, 2003.
56
Kupper, N., Geus, E. J. C., Van Den Berg, M., Kirschbaum, C. Boomsma, D. I. and Willemsem, G. Familial influences on basal salivary cortisol in an adult population. Psychoneuroendocrinology 30, 857-868, 2005;
Kunz-Ebrecht, S. R., Kirschbaum, C. Marmot, M. and Steptoe, A. Differences in cortisol awakening response on work days and weekends in women and men from the Whitehall II COHORT. Psychoneuroendocrinology29, 516-528, 2004a.
Lasikiewicz, N., Hendrickx, H., Talbot, D. and Dye, L. Exploration of basal diurnal salivary profiles in middle-aged adults: Association with sleep quality and metabolic parameters. Psychoneuroendocrinology 33, 143-151, 2008.
Melamed, S., Ugartern, U., Shirom, A., Kahana, L., Lerman, Y. and Froom, P. Chronic burnout, somatic arousal and elevated salivary cortisol levels. Journal Psychosom. 46, 591-598, 1999.
Montgomery, P. G.; Pyne, D. B., Hopkins, W. G.& Minahan, C. L. Seasonal progression and variability of repeat-effort line-drill performance in elite junior basketball players. Journal of Sports Sciences 26, 543-550, 2008.
Ockenfeis, M. C., Porter, L., Smyth, J., Kirschbaum, C., Hellhammer, D. H. and Stone, A. A. Effect of chronic stress associated with unemployment on salivary cortisol:’overall cortisol levels, diurnal rhythm, and acute stress reactivity. Psychosomatic Medicine 57, 460-67, 1995.
O’Donnel, K., Badrick, E., Kumari, M. and Steptoe, A. Psychological coping styles and cortisol over the day in health older adults. Psychoneuroendocrinology 33, 601-611, 2008.
Pruessner, J. C., Wolf, O. T., Helhammer, D. H., Buske-Kirschbaum, A., von Auer, K., Jobst, S., Kaspers, F. and Kirschbaum, C. Free cortisol levels after awakening: a reliable biological marker for assessment of adrenocortical activity. Life Sciences 61, 2539-2549, 1997.
Schlotz, W., Hellhammer, J. Schultz, P. and Stone, A. A. Perceived work overload and chronic worrying predict weekend-weekday differences in the cortisol awakening response. Psychosomatic Medicine 66, 207-214, 2004.
Steptoe, A. and Willemsen, G. The influence of low job control on ambulatory blood pressue and perceived stress over the working day in men and women from the Whitehall ii COHORT. Journal of Hipertension 22, 915-920, 2004.
Schultz, J., Kirschbaum, C., Pruessner, J. and Hellhammer, D. Increased free cortisol secretion after awakening in chronic stressed individuals due to work overload. Stress Medicine 14, 91-97, 1998.
Steinacker, J M & Lehmann, M. Enhancing recovery: preventing underperformance in athletes. Champaign (IL): Human Kinetics, p. 103-18, 2002. Thorn, L., Hucklebridge, F., Evans, P. and Clow, A. Suspected non-adherence and weekend
versus week day differences in the awakening cortisol response. Psychoneuroendocrinology 31, 1009-1018, 2006.
Trninic, S.; Markovuc, G. & Heimer, S. Effects od development training of basketball cadets realized in the competitive period. Collegium Antropologicum, 25, 591-604, 2001.
Vinning, R. F.; McGinley, R. A. The measurement of hormones in saliva: possibilities and pitfalls. Journal Steroid Biochemistry, 27(1-3):81-94, 1987. Wright, C. E. and Steptoe, A. Subjective socioeconomic position, gender and cortisol response
to waking in an elderly population. Psychoneuroendocrinology 30, 582-590, 2005. Wright, C. E. and Steptoe, A. Subjective socioeconomic position, gender and cortisol response
to waking in an elderly population. Psychoneuroendocrinology 30, 582-590, 2005.
57
Wust, S., Federenko, I., Hellhammer, D. H.and Kirschbaum, C. Genetics factors, perceived chronic stress, and free cortisol response to awakening. Psychoneuroendocrinology 25, 707-720, 2000a.
Williams, E. Magid, K. and Steptoe, A. The impact of time of waking and concurrent subjective stress on the cortisol response to awakening. Psychoneuroendocrinology 30, 139-148, 2005.
58
TERCEIRO MANUSCRITO:
STRESS LEVELS IN STUDENTS PREPARING FOR UNIVERSITY ENTRANCE
EXAMS IN THE STATE OF SÃO PAULO, BRAZIL
59
STRESS LEVELS IN STUDENTS PREPARING FOR UNIVERSITY ENTRANCE
EXAMS IN THE STATE OF SÃO PAULO, BRAZIL
M. C. Garcia1, K. S. F. Petrelluzzi1, M. C. Rolim1, D. M. Grassi-Kassisse1, R. C. Spadari-
Bratfisch1*
1 Laboratory of Stress Study, Department of Physiology and Biophysics, Institute of Biology,
State University of Campinas (UNICAMP), Campinas, São Paulo, Brazil2 Department of
Biosciences, Federal University of São Paulo (UNIFESP), Santos, São Paulo, Brazil
* Corresponding author
R.C. Spadari-Bratfisch
Depto. de Biociências
Campus Baixada Santista
Universidade Federal de São Paulo
Rua Ana Costa no. 95
11060-001 Santos SP Brasil
E-mail: [email protected]
phone number: 55 (13) 32218058
fax number 55 (13) 32326348
Short title: Stress levels in Brazilian university students
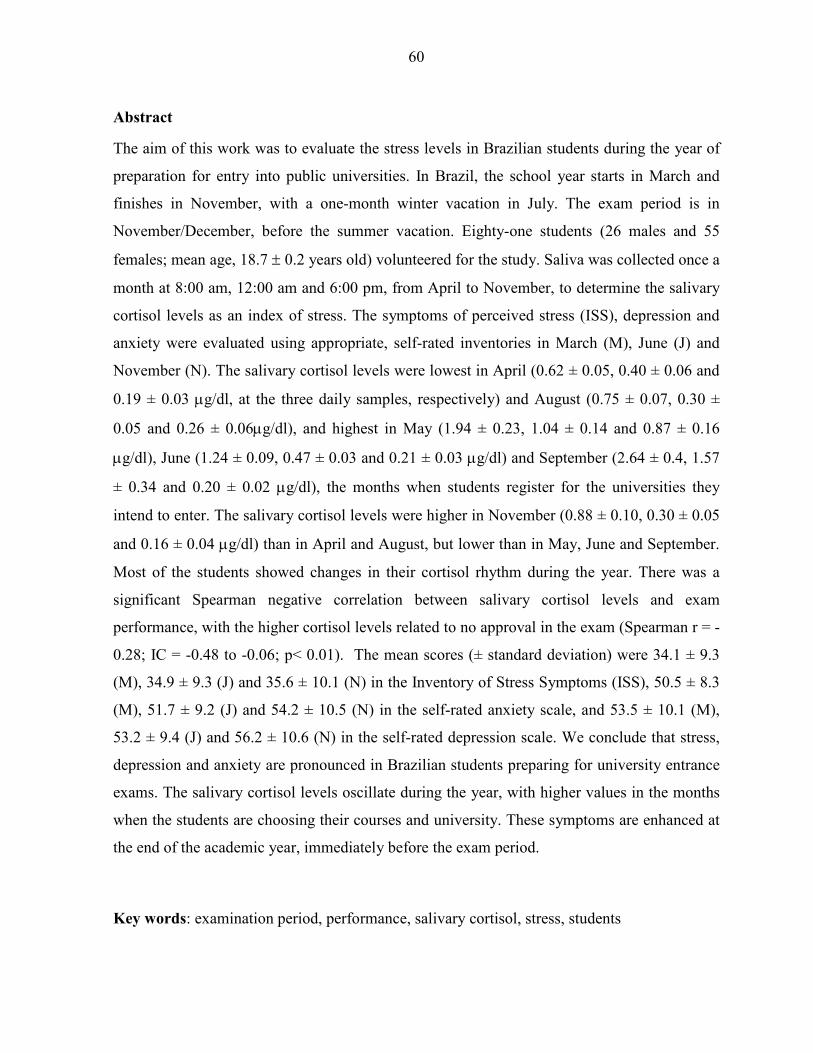
60
Abstract
The aim of this work was to evaluate the stress levels in Brazilian students during the year of
preparation for entry into public universities. In Brazil, the school year starts in March and
finishes in November, with a one-month winter vacation in July. The exam period is in
November/December, before the summer vacation. Eighty-one students (26 males and 55
females; mean age, 18.7 ± 0.2 years old) volunteered for the study. Saliva was collected once a
month at 8:00 am, 12:00 am and 6:00 pm, from April to November, to determine the salivary
cortisol levels as an index of stress. The symptoms of perceived stress (ISS), depression and
anxiety were evaluated using appropriate, self-rated inventories in March (M), June (J) and
November (N). The salivary cortisol levels were lowest in April (0.62 ± 0.05, 0.40 ± 0.06 and
0.19 ± 0.03 µg/dl, at the three daily samples, respectively) and August (0.75 ± 0.07, 0.30 ±
0.05 and 0.26 ± 0.06µg/dl), and highest in May (1.94 ± 0.23, 1.04 ± 0.14 and 0.87 ± 0.16
µg/dl), June (1.24 ± 0.09, 0.47 ± 0.03 and 0.21 ± 0.03 µg/dl) and September (2.64 ± 0.4, 1.57
± 0.34 and 0.20 ± 0.02 µg/dl), the months when students register for the universities they
intend to enter. The salivary cortisol levels were higher in November (0.88 ± 0.10, 0.30 ± 0.05
and 0.16 ± 0.04 µg/dl) than in April and August, but lower than in May, June and September.
Most of the students showed changes in their cortisol rhythm during the year. There was a
significant Spearman negative correlation between salivary cortisol levels and exam
performance, with the higher cortisol levels related to no approval in the exam (Spearman r = -
0.28; IC = -0.48 to -0.06; p< 0.01). The mean scores (± standard deviation) were 34.1 ± 9.3
(M), 34.9 ± 9.3 (J) and 35.6 ± 10.1 (N) in the Inventory of Stress Symptoms (ISS), 50.5 ± 8.3
(M), 51.7 ± 9.2 (J) and 54.2 ± 10.5 (N) in the self-rated anxiety scale, and 53.5 ± 10.1 (M),
53.2 ± 9.4 (J) and 56.2 ± 10.6 (N) in the self-rated depression scale. We conclude that stress,
depression and anxiety are pronounced in Brazilian students preparing for university entrance
exams. The salivary cortisol levels oscillate during the year, with higher values in the months
when the students are choosing their courses and university. These symptoms are enhanced at
the end of the academic year, immediately before the exam period.
Key words: examination period, performance, salivary cortisol, stress, students
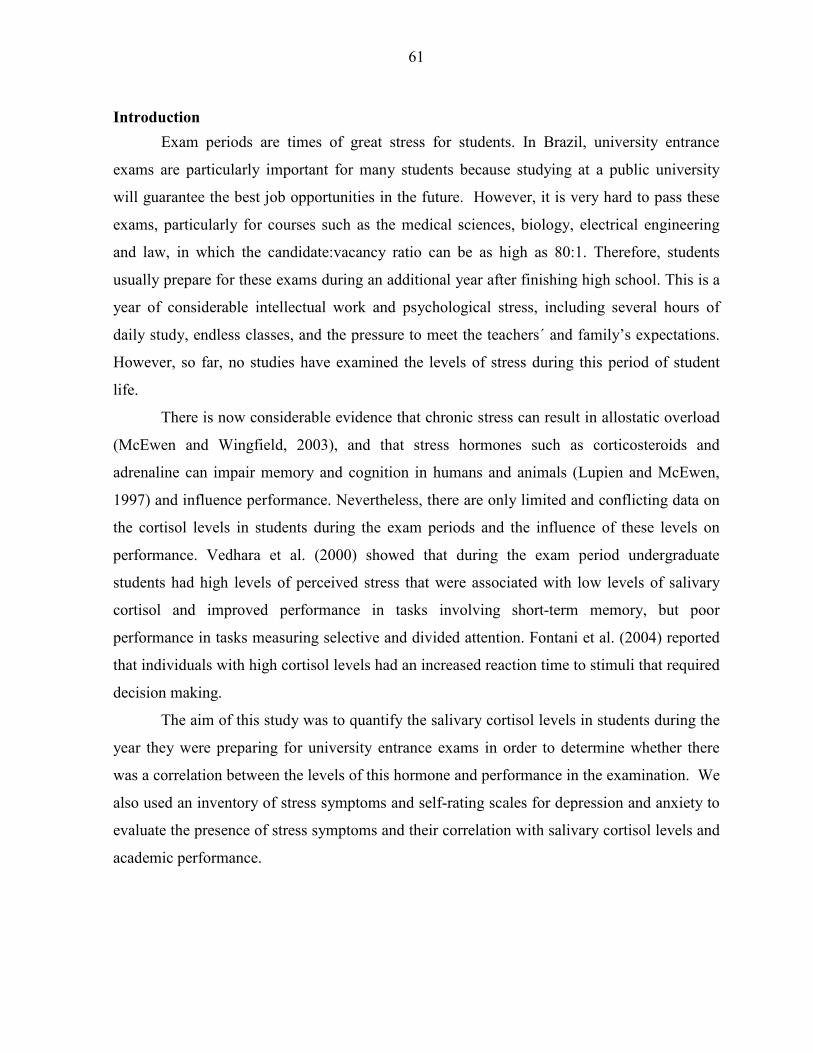
61
Introduction
Exam periods are times of great stress for students. In Brazil, university entrance
exams are particularly important for many students because studying at a public university
will guarantee the best job opportunities in the future. However, it is very hard to pass these
exams, particularly for courses such as the medical sciences, biology, electrical engineering
and law, in which the candidate:vacancy ratio can be as high as 80:1. Therefore, students
usually prepare for these exams during an additional year after finishing high school. This is a
year of considerable intellectual work and psychological stress, including several hours of
daily study, endless classes, and the pressure to meet the teachers´ and family’s expectations.
However, so far, no studies have examined the levels of stress during this period of student
life.
There is now considerable evidence that chronic stress can result in allostatic overload
(McEwen and Wingfield, 2003), and that stress hormones such as corticosteroids and
adrenaline can impair memory and cognition in humans and animals (Lupien and McEwen,
1997) and influence performance. Nevertheless, there are only limited and conflicting data on
the cortisol levels in students during the exam periods and the influence of these levels on
performance. Vedhara et al. (2000) showed that during the exam period undergraduate
students had high levels of perceived stress that were associated with low levels of salivary
cortisol and improved performance in tasks involving short-term memory, but poor
performance in tasks measuring selective and divided attention. Fontani et al. (2004) reported
that individuals with high cortisol levels had an increased reaction time to stimuli that required
decision making.
The aim of this study was to quantify the salivary cortisol levels in students during the
year they were preparing for university entrance exams in order to determine whether there
was a correlation between the levels of this hormone and performance in the examination. We
also used an inventory of stress symptoms and self-rating scales for depression and anxiety to
evaluate the presence of stress symptoms and their correlation with salivary cortisol levels and
academic performance.
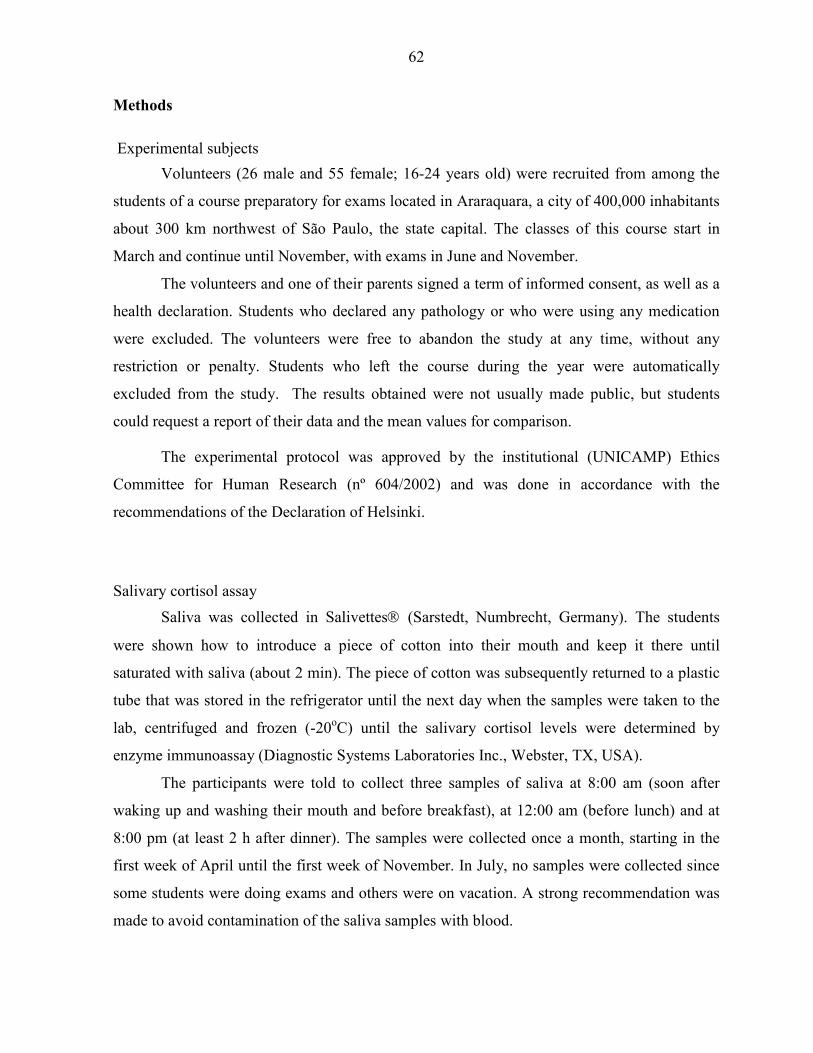
62
Methods
Experimental subjects
Volunteers (26 male and 55 female; 16-24 years old) were recruited from among the
students of a course preparatory for exams located in Araraquara, a city of 400,000 inhabitants
about 300 km northwest of São Paulo, the state capital. The classes of this course start in
March and continue until November, with exams in June and November.
The volunteers and one of their parents signed a term of informed consent, as well as a
health declaration. Students who declared any pathology or who were using any medication
were excluded. The volunteers were free to abandon the study at any time, without any
restriction or penalty. Students who left the course during the year were automatically
excluded from the study. The results obtained were not usually made public, but students
could request a report of their data and the mean values for comparison.
The experimental protocol was approved by the institutional (UNICAMP) Ethics
Committee for Human Research (nº 604/2002) and was done in accordance with the
recommendations of the Declaration of Helsinki.
Salivary cortisol assay
Saliva was collected in Salivettes (Sarstedt, Numbrecht, Germany). The students
were shown how to introduce a piece of cotton into their mouth and keep it there until
saturated with saliva (about 2 min). The piece of cotton was subsequently returned to a plastic
tube that was stored in the refrigerator until the next day when the samples were taken to the
lab, centrifuged and frozen (-20oC) until the salivary cortisol levels were determined by
enzyme immunoassay (Diagnostic Systems Laboratories Inc., Webster, TX, USA).
The participants were told to collect three samples of saliva at 8:00 am (soon after
waking up and washing their mouth and before breakfast), at 12:00 am (before lunch) and at
8:00 pm (at least 2 h after dinner). The samples were collected once a month, starting in the
first week of April until the first week of November. In July, no samples were collected since
some students were doing exams and others were on vacation. A strong recommendation was
made to avoid contamination of the saliva samples with blood.
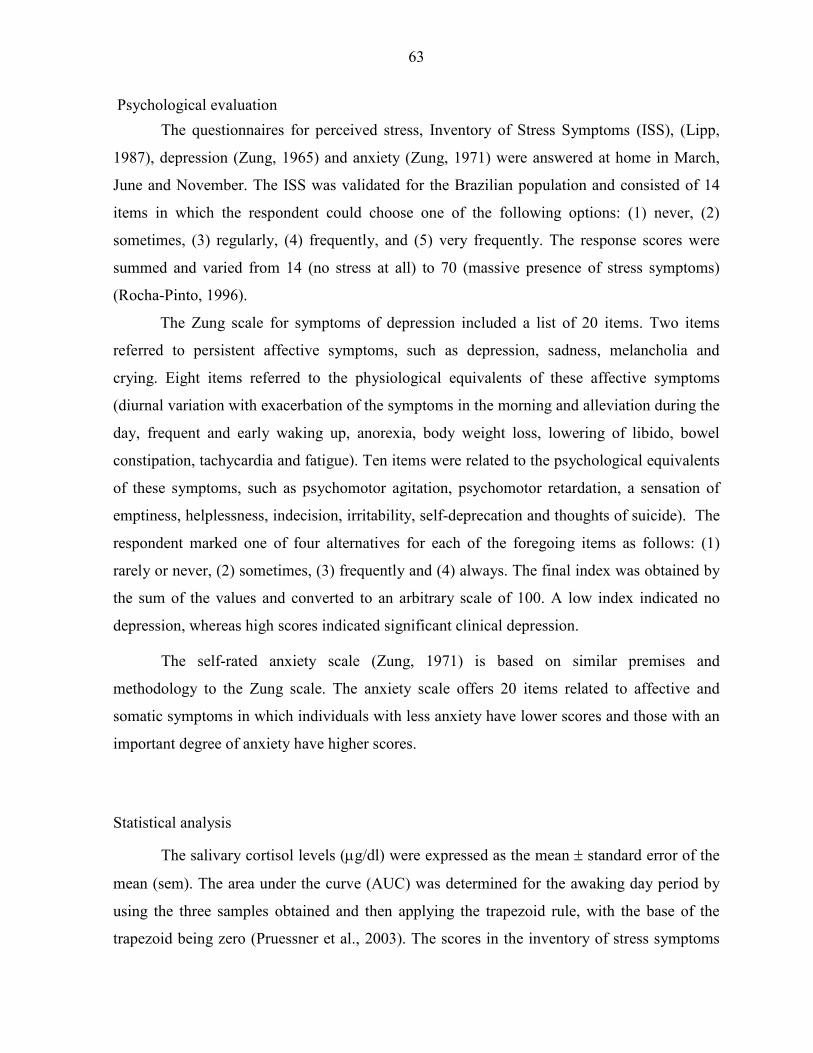
63
Psychological evaluation
The questionnaires for perceived stress, Inventory of Stress Symptoms (ISS), (Lipp,
1987), depression (Zung, 1965) and anxiety (Zung, 1971) were answered at home in March,
June and November. The ISS was validated for the Brazilian population and consisted of 14
items in which the respondent could choose one of the following options: (1) never, (2)
sometimes, (3) regularly, (4) frequently, and (5) very frequently. The response scores were
summed and varied from 14 (no stress at all) to 70 (massive presence of stress symptoms)
(Rocha-Pinto, 1996).
The Zung scale for symptoms of depression included a list of 20 items. Two items
referred to persistent affective symptoms, such as depression, sadness, melancholia and
crying. Eight items referred to the physiological equivalents of these affective symptoms
(diurnal variation with exacerbation of the symptoms in the morning and alleviation during the
day, frequent and early waking up, anorexia, body weight loss, lowering of libido, bowel
constipation, tachycardia and fatigue). Ten items were related to the psychological equivalents
of these symptoms, such as psychomotor agitation, psychomotor retardation, a sensation of
emptiness, helplessness, indecision, irritability, self-deprecation and thoughts of suicide). The
respondent marked one of four alternatives for each of the foregoing items as follows: (1)
rarely or never, (2) sometimes, (3) frequently and (4) always. The final index was obtained by
the sum of the values and converted to an arbitrary scale of 100. A low index indicated no
depression, whereas high scores indicated significant clinical depression.
The self-rated anxiety scale (Zung, 1971) is based on similar premises and
methodology to the Zung scale. The anxiety scale offers 20 items related to affective and
somatic symptoms in which individuals with less anxiety have lower scores and those with an
important degree of anxiety have higher scores.
Statistical analysis
The salivary cortisol levels (µg/dl) were expressed as the mean ± standard error of the
mean (sem). The area under the curve (AUC) was determined for the awaking day period by
using the three samples obtained and then applying the trapezoid rule, with the base of the
trapezoid being zero (Pruessner et al., 2003). The scores in the inventory of stress symptoms
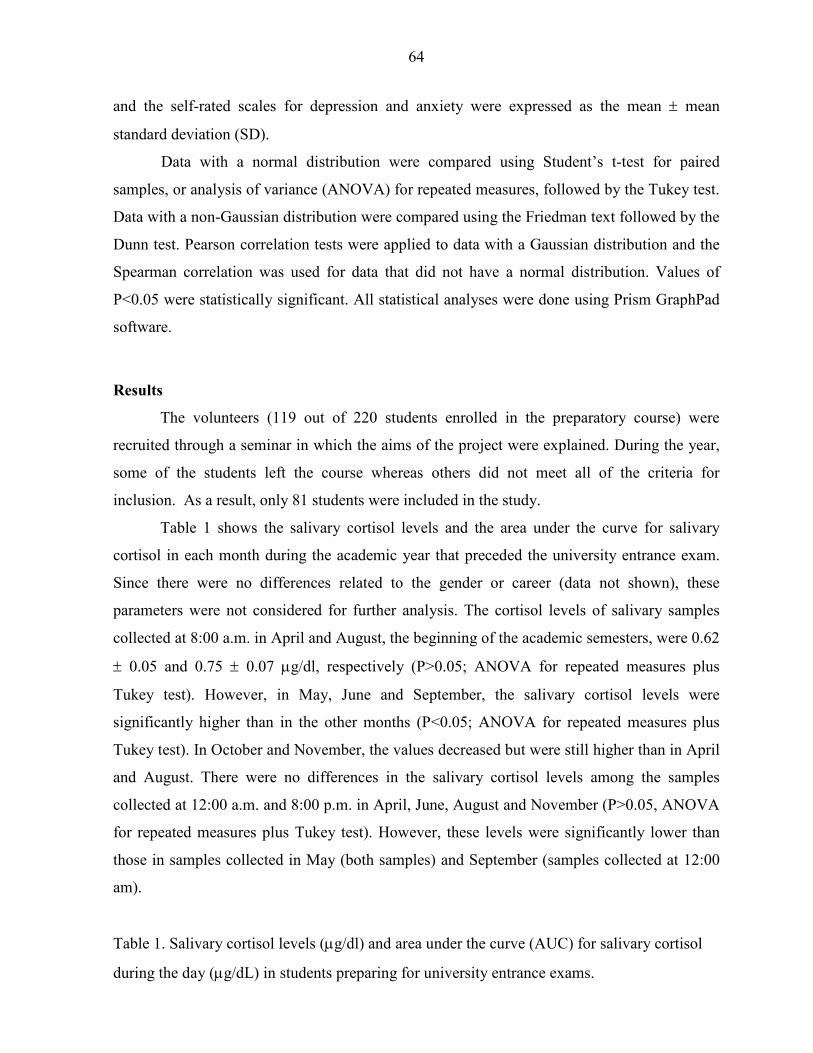
64
and the self-rated scales for depression and anxiety were expressed as the mean ± mean
standard deviation (SD).
Data with a normal distribution were compared using Student’s t-test for paired
samples, or analysis of variance (ANOVA) for repeated measures, followed by the Tukey test.
Data with a non-Gaussian distribution were compared using the Friedman text followed by the
Dunn test. Pearson correlation tests were applied to data with a Gaussian distribution and the
Spearman correlation was used for data that did not have a normal distribution. Values of
P<0.05 were statistically significant. All statistical analyses were done using Prism GraphPad
software.
Results
The volunteers (119 out of 220 students enrolled in the preparatory course) were
recruited through a seminar in which the aims of the project were explained. During the year,
some of the students left the course whereas others did not meet all of the criteria for
inclusion. As a result, only 81 students were included in the study.
Table 1 shows the salivary cortisol levels and the area under the curve for salivary
cortisol in each month during the academic year that preceded the university entrance exam.
Since there were no differences related to the gender or career (data not shown), these
parameters were not considered for further analysis. The cortisol levels of salivary samples
collected at 8:00 a.m. in April and August, the beginning of the academic semesters, were 0.62
± 0.05 and 0.75 ± 0.07 µg/dl, respectively (P>0.05; ANOVA for repeated measures plus
Tukey test). However, in May, June and September, the salivary cortisol levels were
significantly higher than in the other months (P<0.05; ANOVA for repeated measures plus
Tukey test). In October and November, the values decreased but were still higher than in April
and August. There were no differences in the salivary cortisol levels among the samples
collected at 12:00 a.m. and 8:00 p.m. in April, June, August and November (P>0.05, ANOVA
for repeated measures plus Tukey test). However, these levels were significantly lower than
those in samples collected in May (both samples) and September (samples collected at 12:00
am).
Table 1. Salivary cortisol levels (µg/dl) and area under the curve (AUC) for salivary cortisol
during the day (µg/dL) in students preparing for university entrance exams.
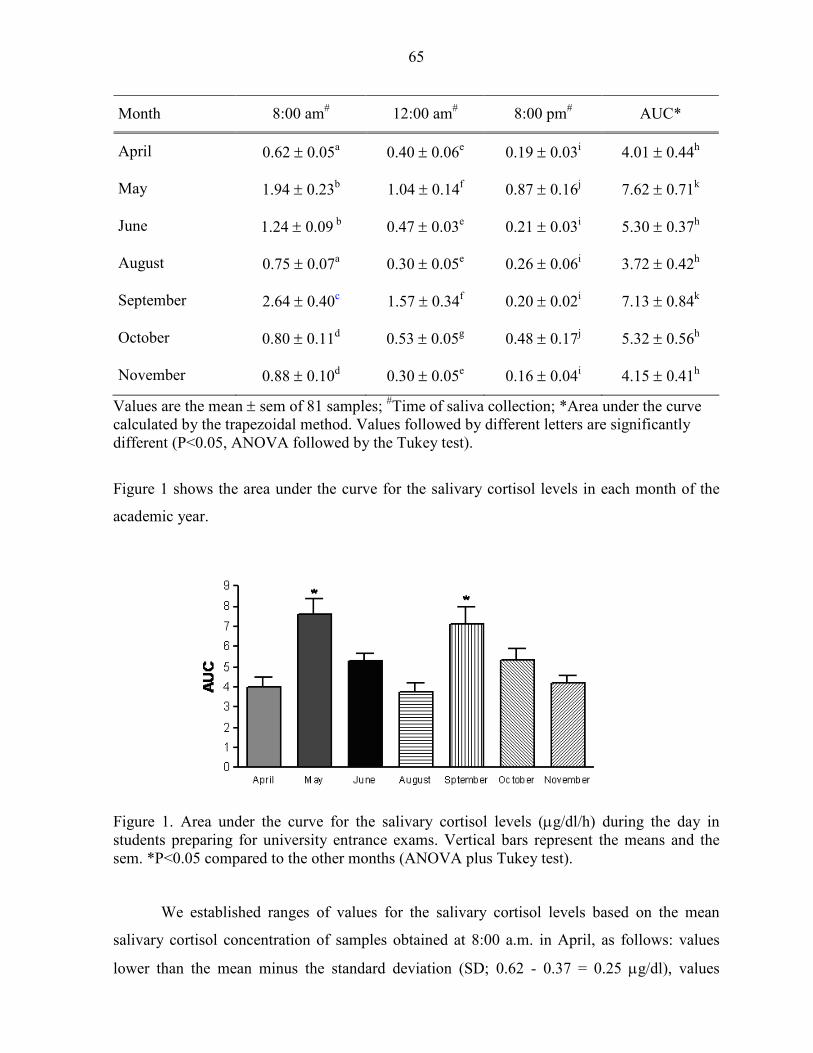
65
Month 8:00 am# 12:00 am# 8:00 pm# AUC*
April 0.62 ± 0.05a 0.40 ± 0.06e 0.19 ± 0.03i 4.01 ± 0.44h
May 1.94 ± 0.23b 1.04 ± 0.14f 0.87 ± 0.16j 7.62 ± 0.71k
June 1.24 ± 0.09 b 0.47 ± 0.03e 0.21 ± 0.03i 5.30 ± 0.37h
August 0.75 ± 0.07a 0.30 ± 0.05e 0.26 ± 0.06i 3.72 ± 0.42h
September 2.64 ± 0.40c 1.57 ± 0.34f 0.20 ± 0.02i 7.13 ± 0.84k
October 0.80 ± 0.11d 0.53 ± 0.05g 0.48 ± 0.17j 5.32 ± 0.56h
November 0.88 ± 0.10d 0.30 ± 0.05e 0.16 ± 0.04i 4.15 ± 0.41h
Values are the mean ± sem of 81 samples; #Time of saliva collection; *Area under the curve calculated by the trapezoidal method. Values followed by different letters are significantly different (P<0.05, ANOVA followed by the Tukey test).
Figure 1 shows the area under the curve for the salivary cortisol levels in each month of the
academic year.
Figure 1. Area under the curve for the salivary cortisol levels (µg/dl/h) during the day in students preparing for university entrance exams. Vertical bars represent the means and the sem. *P<0.05 compared to the other months (ANOVA plus Tukey test).
We established ranges of values for the salivary cortisol levels based on the mean
salivary cortisol concentration of samples obtained at 8:00 a.m. in April, as follows: values
lower than the mean minus the standard deviation (SD; 0.62 - 0.37 = 0.25 µg/dl), values
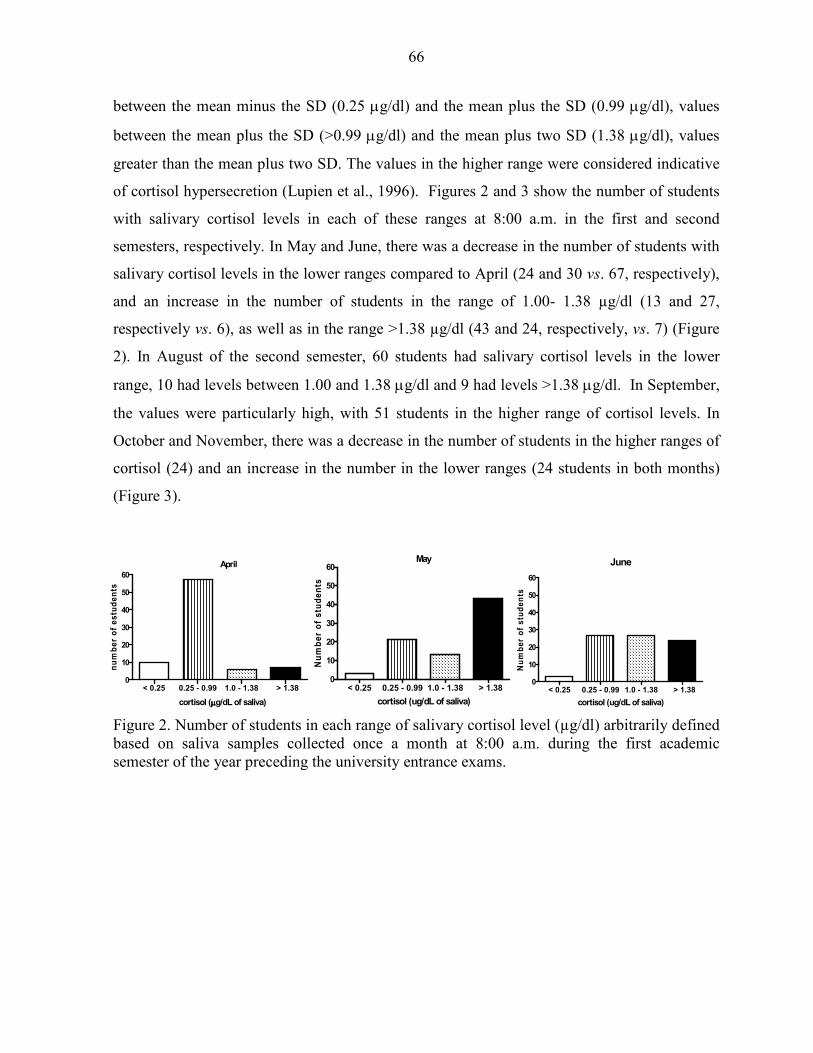
66
between the mean minus the SD (0.25 µg/dl) and the mean plus the SD (0.99 µg/dl), values
between the mean plus the SD (>0.99 µg/dl) and the mean plus two SD (1.38 µg/dl), values
greater than the mean plus two SD. The values in the higher range were considered indicative
of cortisol hypersecretion (Lupien et al., 1996). Figures 2 and 3 show the number of students
with salivary cortisol levels in each of these ranges at 8:00 a.m. in the first and second
semesters, respectively. In May and June, there was a decrease in the number of students with
salivary cortisol levels in the lower ranges compared to April (24 and 30 vs. 67, respectively),
and an increase in the number of students in the range of 1.00- 1.38 µg/dl (13 and 27,
respectively vs. 6), as well as in the range >1.38 µg/dl (43 and 24, respectively, vs. 7) (Figure
2). In August of the second semester, 60 students had salivary cortisol levels in the lower
range, 10 had levels between 1.00 and 1.38 µg/dl and 9 had levels >1.38 µg/dl. In September,
the values were particularly high, with 51 students in the higher range of cortisol levels. In
October and November, there was a decrease in the number of students in the higher ranges of
cortisol (24) and an increase in the number in the lower ranges (24 students in both months)
(Figure 3).
Figure 2. Number of students in each range of salivary cortisol level (µg/dl) arbitrarily defined based on saliva samples collected once a month at 8:00 a.m. during the first academic semester of the year preceding the university entrance exams.
June
< 0.25 0.25 - 0.99 1.0 - 1.38 > 1.380
10
20
30
40
50
60
cortisol (ug/dL of saliva)
Nu
mb
er
of
stu
de
nts
May
< 0.25 0.25 - 0.99 1.0 - 1.38 > 1.380
10
20
30
40
50
60
cortisol (ug/dL of saliva)
Nu
mb
er
of
stu
de
nts
< 0.25 0.25 - 0.99 1.0 - 1.38 > 1.380
10
20
30
40
50
60
April
cortisol (µµµµg/dL of saliva)
nu
mb
er
of
es
tud
en
ts
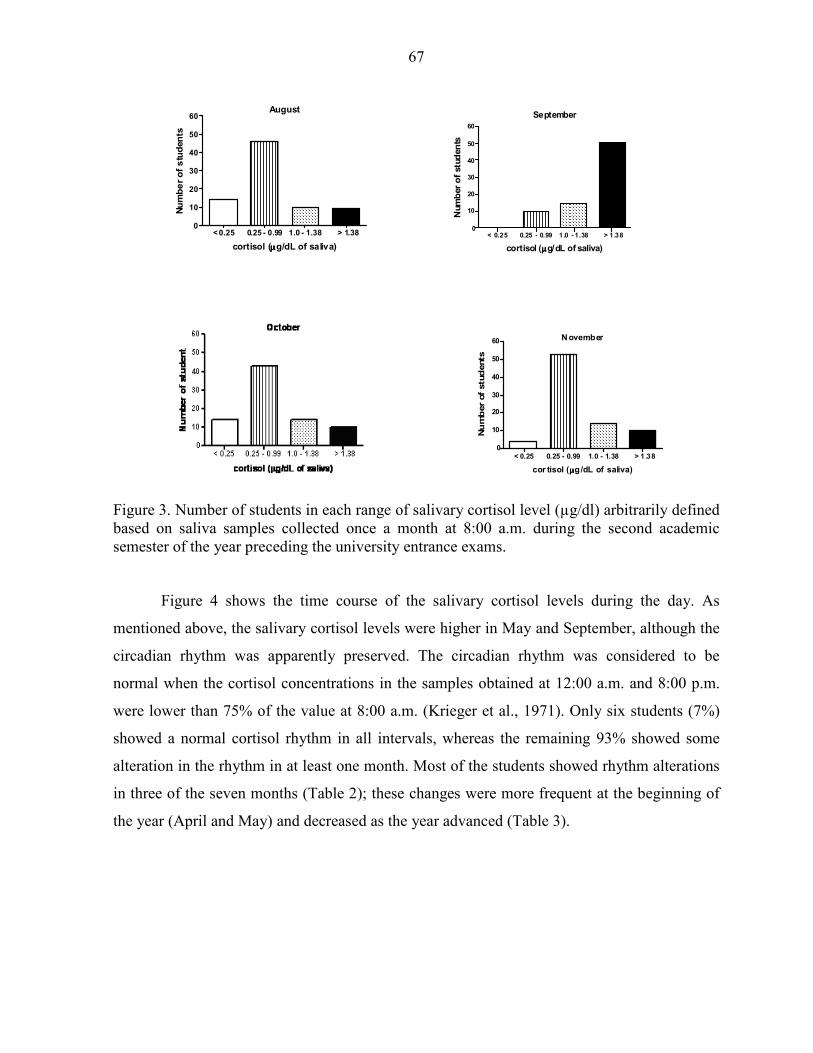
67
Figure 3. Number of students in each range of salivary cortisol level (µg/dl) arbitrarily defined based on saliva samples collected once a month at 8:00 a.m. during the second academic semester of the year preceding the university entrance exams.
Figure 4 shows the time course of the salivary cortisol levels during the day. As
mentioned above, the salivary cortisol levels were higher in May and September, although the
circadian rhythm was apparently preserved. The circadian rhythm was considered to be
normal when the cortisol concentrations in the samples obtained at 12:00 a.m. and 8:00 p.m.
were lower than 75% of the value at 8:00 a.m. (Krieger et al., 1971). Only six students (7%)
showed a normal cortisol rhythm in all intervals, whereas the remaining 93% showed some
alteration in the rhythm in at least one month. Most of the students showed rhythm alterations
in three of the seven months (Table 2); these changes were more frequent at the beginning of
the year (April and May) and decreased as the year advanced (Table 3).
November
< 0.25 0.25 - 0.99 1.0 - 1.38 > 1.380
10
20
30
40
50
60
cor tisol (µµµµg/dL of saliva)
Nu
mb
er
of
stu
dents
September
< 0.25 0.25 - 0.99 1.0 - 1.38 > 1 .380
10
20
30
40
50
60
cortisol (µµµµg/dL of saliva)
Num
ber
of
stu
den
ts
August
< 0.25 0.25 - 0.99 1.0 - 1.38 > 1.380
10
20
30
40
50
60
cortisol (µµµµg/dL of saliva)
Nu
mb
er
of
stu
den
ts

68
Table 2. Number of months in which the cortisol rhythm was normal or altered in students
preparing for university entrance exams.
Rhythm Number of students %
Normal 6 7
Altered 75 93
1 month 7 9
2 months 16 20
3 months 27 33
4 months 19 23
5 months 6 7
Table 3. Number of students with an altered rhythm of cortisol in each month of the year.
First semester Students Second semester Students
April 54 August 32
May 54 September 20
June 23 October 22
November 28
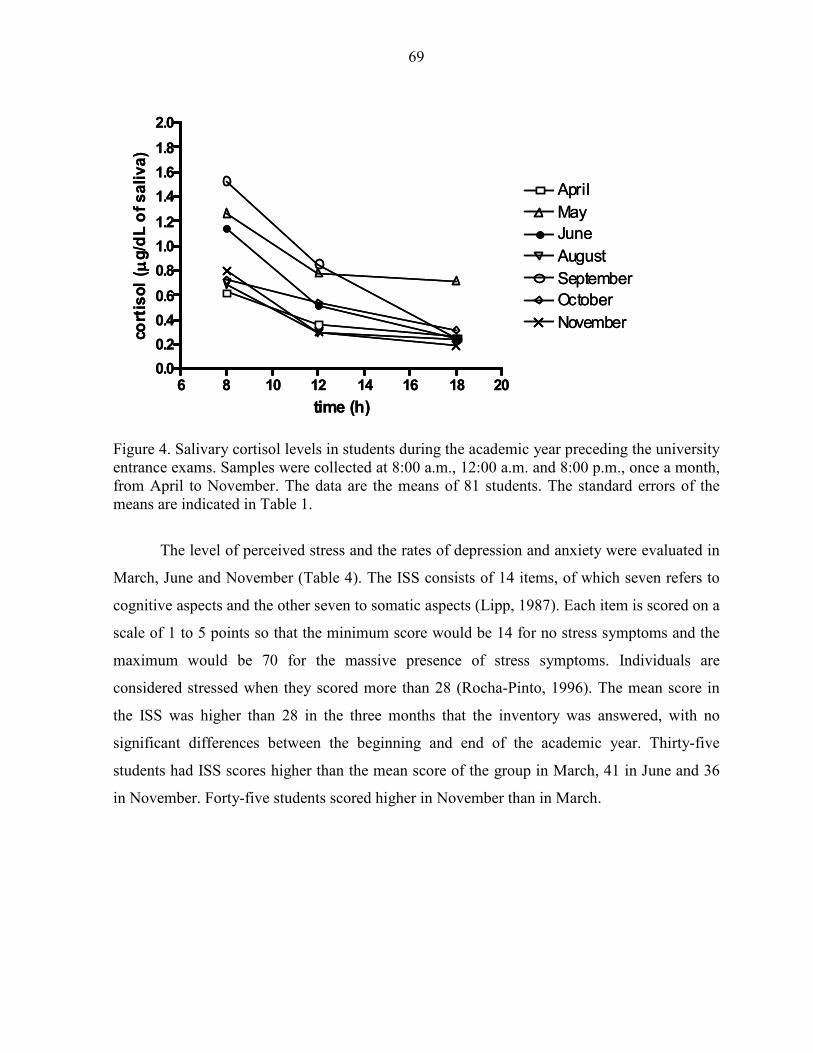
69
Figure 4. Salivary cortisol levels in students during the academic year preceding the university entrance exams. Samples were collected at 8:00 a.m., 12:00 a.m. and 8:00 p.m., once a month, from April to November. The data are the means of 81 students. The standard errors of the means are indicated in Table 1.
The level of perceived stress and the rates of depression and anxiety were evaluated in
March, June and November (Table 4). The ISS consists of 14 items, of which seven refers to
cognitive aspects and the other seven to somatic aspects (Lipp, 1987). Each item is scored on a
scale of 1 to 5 points so that the minimum score would be 14 for no stress symptoms and the
maximum would be 70 for the massive presence of stress symptoms. Individuals are
considered stressed when they scored more than 28 (Rocha-Pinto, 1996). The mean score in
the ISS was higher than 28 in the three months that the inventory was answered, with no
significant differences between the beginning and end of the academic year. Thirty-five
students had ISS scores higher than the mean score of the group in March, 41 in June and 36
in November. Forty-five students scored higher in November than in March.
6 8 10 12 14 16 18 200.0
0.2
0.4
0.6
0.8
1.0
1.2
1.4
1.6
1.8
2.0
April
May
June
August
September
October
November
time (h)
cort
iso
l( µµ µµ
g/d
L o
f s
ali
va
)
6 8 10 12 14 16 18 200.0
0.2
0.4
0.6
0.8
1.0
1.2
1.4
1.6
1.8
2.0
April
May
June
August
September
October
November
time (h)
cort
iso
l( µµ µµ
g/d
L o
f s
ali
va
)
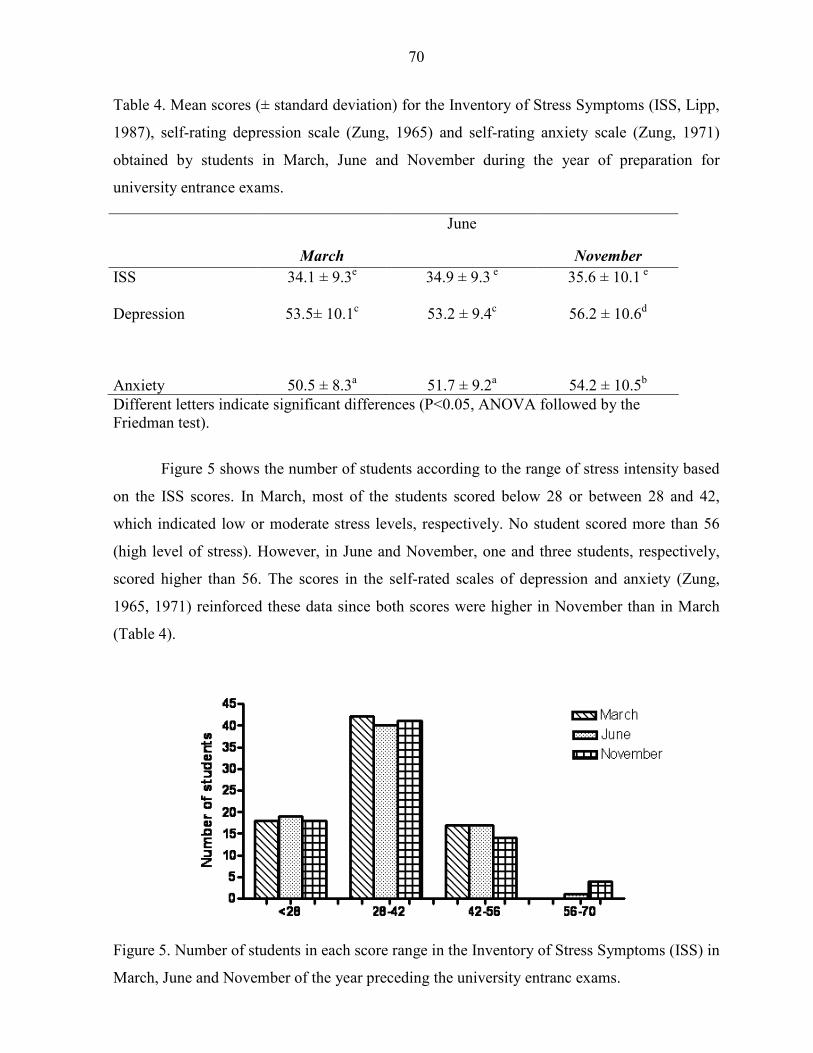
70
Table 4. Mean scores (± standard deviation) for the Inventory of Stress Symptoms (ISS, Lipp,
1987), self-rating depression scale (Zung, 1965) and self-rating anxiety scale (Zung, 1971)
obtained by students in March, June and November during the year of preparation for
university entrance exams.
March
June
November
ISS 34.1 ± 9.3e 34.9 ± 9.3 e 35.6 ± 10.1 e Depression 53.5± 10.1c 53.2 ± 9.4c 56.2 ± 10.6d
Anxiety 50.5 ± 8.3a 51.7 ± 9.2a 54.2 ± 10.5b Different letters indicate significant differences (P<0.05, ANOVA followed by the Friedman test).
Figure 5 shows the number of students according to the range of stress intensity based
on the ISS scores. In March, most of the students scored below 28 or between 28 and 42,
which indicated low or moderate stress levels, respectively. No student scored more than 56
(high level of stress). However, in June and November, one and three students, respectively,
scored higher than 56. The scores in the self-rated scales of depression and anxiety (Zung,
1965, 1971) reinforced these data since both scores were higher in November than in March
(Table 4).
Figure 5. Number of students in each score range in the Inventory of Stress Symptoms (ISS) in
March, June and November of the year preceding the university entranc exams.
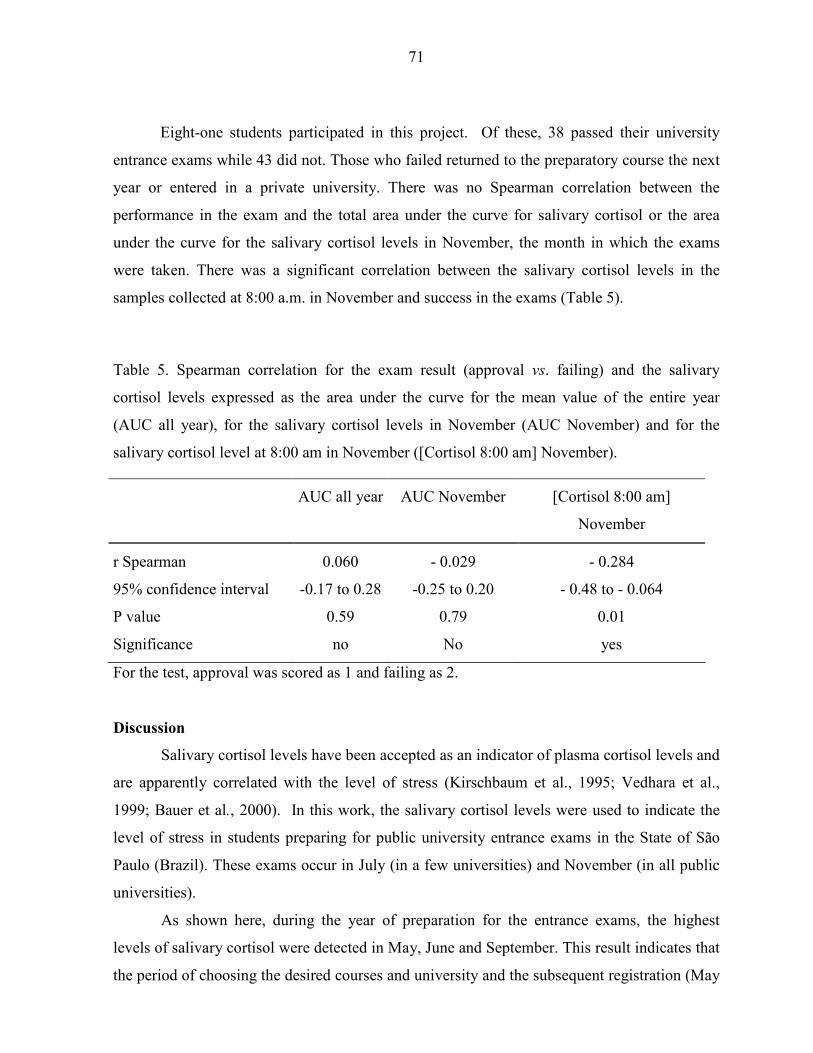
71
Eight-one students participated in this project. Of these, 38 passed their university
entrance exams while 43 did not. Those who failed returned to the preparatory course the next
year or entered in a private university. There was no Spearman correlation between the
performance in the exam and the total area under the curve for salivary cortisol or the area
under the curve for the salivary cortisol levels in November, the month in which the exams
were taken. There was a significant correlation between the salivary cortisol levels in the
samples collected at 8:00 a.m. in November and success in the exams (Table 5).
Table 5. Spearman correlation for the exam result (approval vs. failing) and the salivary
cortisol levels expressed as the area under the curve for the mean value of the entire year
(AUC all year), for the salivary cortisol levels in November (AUC November) and for the
salivary cortisol level at 8:00 am in November ([Cortisol 8:00 am] November).
AUC all year AUC November [Cortisol 8:00 am]
November
r Spearman 0.060 - 0.029 - 0.284
95% confidence interval -0.17 to 0.28 -0.25 to 0.20 - 0.48 to - 0.064
P value 0.59 0.79 0.01
Significance no No yes
For the test, approval was scored as 1 and failing as 2.
Discussion
Salivary cortisol levels have been accepted as an indicator of plasma cortisol levels and
are apparently correlated with the level of stress (Kirschbaum et al., 1995; Vedhara et al.,
1999; Bauer et al., 2000). In this work, the salivary cortisol levels were used to indicate the
level of stress in students preparing for public university entrance exams in the State of São
Paulo (Brazil). These exams occur in July (in a few universities) and November (in all public
universities).
As shown here, during the year of preparation for the entrance exams, the highest
levels of salivary cortisol were detected in May, June and September. This result indicates that
the period of choosing the desired courses and university and the subsequent registration (May
72
and September) were associated with higher levels of stress than in the period of the exams
(November). Nevertheless, the salivary cortisol levels were also higher in November than in
April or August, the beginning of the first and second semesters, respectively. A similar
finding was seen in June compared to April.
The ISS revealed that in all three months the students scored higher than 28, which
meant that they all had symptoms of low to moderate stress (Lipp, 1987). But, there weren’t
statistically significant differences in the ISS scores in March, June and November. However,
in March no students showed symptoms of intense stress or burnout, but this was detected in
one student in June and in three students in November.
There was a greater frequency of symptoms of depression and anxiety in November
compared to June and March. The scales used here (Zung, 1965, 1971) allowed the
identification of symptoms that are frequent in most emotional disorders of clinical relevance
and were easy and quick to apply. The correlation between stress and the states of mood or
disorders is more pronounced when there is no alternative, with the stress frequently involving
frustration (Sapolsky, 2001). When the stress is chronic or long-lasting, as in the case of the
students evaluated here, there is a need for constant monitoring so that the person is always
alert, thereby triggering anxiety. Alternatively, the stress may not be overcome and can lead to
helplessness, even in situations that are manageable, and this may trigger depression
(Sapolsky, 2001). In contrast to anxiety, depression is characterized by helplessness,
psychomotor slowing and anedonia. Stress causes depression through pathways associated
with mood and pleasure, and may reduce the individual´s capacity for attention and vigilance;
there may also be alterations to the rhythm and quality of sleep as well as mood.
The students were exposed to high levels of corticosteroids in May, June and
September and to moderately high levels of cortisol in October and November. Corticosteroids
exert an inverted-U shape influence on the processes of arousal and selective attention, with
similar modulatory effects on processes associated with memory, particularly those related to
the acquisition and consolidation of the memory trace (Lupien and McEwen, 1997).
Long-term exposure to stress or glucocorticoids impairs memory function in humans
(for a review, see Roozendaal, 2002). These impairments are restricted to memory retrieval for
spatial/contextual or declarative information. Declarative memory refers to the conscious or
voluntary recollection of previously learned information (Milner et al., 1998). Hence, a
glucocorticoid rush can impair consolidation of novel information, while simultaneously
73
impairing the retrieval of stored information. The high salivary cortisol levels seen in May,
June and September may have impaired the students´ memory consolidation and their ability
to learn new issues. In “normal” cognition, memory consolidation and retrieval processes
occur continuously and simultaneously, but independently (Lupien and McEwen, 1997; De
Kloet and Joëls, 1999; Roozendaal, 2000).
Although some authors have reported dose-dependent, glucocorticoid-induced memory
enhancement, the potentially disruptive effects of glucocorticoids on memory have received
much attention (reviewed by Roosendaal, 2002). Memory consolidation is enhanced by post-
training activation of glucocorticoid-sensitive pathways that are also activated by
catecholamines and requires stimulation of the amygdala (McCaugh, 1996; McCaugh et al.,
2000). However, once memories are consolidated, the efficacy or accuracy of the information
retrieved remains vulnerable to glucocorticoids at the time of recall. The oral administration of
stress-inducing doses of cortisone (a precursor of the endogenous human glucocorticoid
cortisol) 1 h before retention testing impaired hippocampal-dependent free recall of previously
learned words (De Quervain et al., 2000). Hence, memory retrieval may be temporarily
disrupted during a stressful experience such as an academic examination, regardless of
whether the corticosteroids levels are excessively high or not.
The two stress indexes used here, namely, the salivary cortisol level and the ISS score,
indicated a high incidence of stress in the students during certain months of the preparatory
year preceding the university entrance exams, although the salivary cortisol levels were only
moderately elevated in the month that the students sat their exams. Although the students did
not undergo memory tests, their performance in the exams may be used as an index of their
learning and ability to recall learned issues. Cognition is affected by the level of
corticosteroids in a selective and inverted U-shaped (Lupien and McEwen, 1997; Lupien et al.,
1999). The reduction in cortisol levels observed in November compared to September may not
have favours fast decision-making, as well as memory function and attention. Indeed, there
was a significant negative correlation between salivary cortisol levels and passing the exam,
although the experimental approach used here made it difficult to establish a cause-effect
relationship between these parameters. Fontani et al. (2004) reported that individuals with high
cortisol levels showed an increased response time to stimuli that required decision making.
As shown here, there was also a high incidence of alterations in the diurnal cortisol
rhythm. Although disturbance of the cortisol rhythm has been associated with clinical
74
depression and post-traumatic stress disorder (Yehuda et al., 1996), the pattern of findings
with respect to psychosocial influences such as employment status or workload in healthy
individuals is at best mixed (Ockenfelds et al., 1995; Adam and Gunnar, 2001; Grossi et al.,
2001). Hence, the alterations in the diurnal cortisol rhythm seen here were probably related to
the students’ workload throughout the academic year.
We conclude that stress, depression and anxiety are pronounced in Brazilian students
preparing for university entrance exams. The salivary cortisol levels oscillate during the year,
with higher values in the months when the students are choosing their courses and university.
These symptoms are enhanced at the end of the academic year, immediately before the exam
period.
Acknowledgement:
The authors are in debt to the “Maquifisica curso preparatório para vestibular”,
Araraquara, SP, Brazil. This work was supported by Fundação de Amparo à Pesquisa do
Estado de São Paulo (FAPESP), Conselho Nacional de Desenvolvimento Científico e
Tecnológico (CNPq) and Fundo de Amparo à Pesquisa e ao Ensino da UNICAMP
(FAEP/UNICAMP).
References
Bauer, M.E.; Vedhara, K.; Perks, P.; Wilcock, G.K.; Lightman, S.L.; Shanks, N., 2000. Chronic stress in caregivers of dementia patients is associated with reduced lymphocyte sensitivity to glucocorticoids. J. Neuroimmunol. 103, 84-92.
De Kloet, R.; Oitzl, M.S.; Joëls, M., 1999. Stress and cognition: are corticosteroids good or bad guys? Trends Neurosci. 22, 422-426.
De Quervain, D.J.F.; Roozendaal, B.; Nitsch, R.M.; McCaugh, J.L.; Hock, C., 2000. Acute cortisone administration impairs retrieval of long-term declarative memory in humans. Nat. Neurosci. 3, 313-314.
Fontani, G.; Lodi, L.; Felilci, A.; Corradeschi, F.; Lupo, C., 2004. Attentional, emotional and hormonal data in subjects of different ages. Eur. J. Appl. Physiol. 92, 452-461.
Krieger, D.T.; Allen, W.; Rizzo, F.; Krieger, H.P., 1971. Characterization of the normal temporal pattern of plasma corticosteroid levels. J. Clin. Endocrinol. 32, 266-284.
Lipp, M.N., 1987. Como enfrentar o estresse, 2nd ed.,. Ed. Ícone, São Paulo, pp 91. Lupien, S.J.; Gillin, C.; Hauger, R.L., 1999. Working memory is more sensitive than
declarative memory to the acute effects of corticosteroids: a dose-response study in humans. Behavi Neurosci. 113, 420-430.
75
Lupien, S.J.; McEwen, B.S., 1997. The acute effects of corticosteroids on cognition: integration of animal and human model studies. Brain Res. Rev. 254, 1-27.
McCaugh, J.L., 1996. Time-dependent processes in memory storage. Science 153, 1351-1358. McCaugh, J.L., 2000. Memory - a century of consolidation. Science 287, 248-251. McEwen, B.S.; Wingfield, J.C., 2003. The concept of allostasis in biology and biomedicine.
Horm. Behav. 43, 2-15. Milner, B.; Squire, L.R.; Kandel, E.R., 1998. Cognitive neuroscience and the study of
memory. Neuron 20, 445-468. Pruessner, J.C.; Hellhamer, D.H.; Kirschbaum, C., 2003. Two formulas for computation of the
area under the curve represent measures of total hormone concentration versus time-dependent change. Psychoneuroendocrinology 28, 916-931.
Rocha-Pinto, W.N., 1996. Stress e Qualidade de Vida de Pacientes com Vitiligo. Master´s dissertation, Pontifícia Universidade Católica de Campinas.
Roozendaal, B., 2000. Glucocorticoids and the regulation of the memory consolidation. Psychoneuroendocrinology 25, 213-238.
Roozendaal, B., 2002. Stress and memory: opposing effects of glucocorticoids on memory consolidation and memory retrieval. Neurobiol. Learn. Mem. 78, 578-595.
Sapolsky, R., 2001. Depression, antidepressants, and the shrinking hippocampus. Proc. N. Y. Acad. Sci. 98, 12320-12322.
Vedhara, K.; Hyde, J.; Gilchrist, I.D.; Tytherleigh, M.; Plummer, S., 2000. Acute stress, memory, attention and cortisol. Psychoneuroendocrinology 25, 535-549.
Zung, W.W.K., 1965. A self-rating depression scale. Arch. Gen. Psychiatry 12, 63-70. Zung, W.W.K., 1971. A rating instrument for anxiety disorders. Psychosomatics 12, 371-379.
76
QUARTO MANUSCRITO
SALIVARY CORTISOL LEVELS IN BRAZILIAN CITIZENS OF DISTINCT
SOCIOECONOMIC AND CULTURAL LEVELS
77
SALIVARY CORTISOL LEVELS IN BRAZILIAN CITIZENS OF DISTINCT
SOCIOECONOMIC AND CULTURAL LEVELS
Márcia C. Garcia1, Aglecio de Souza1, Geruza P. Bella1, Dora M. Grassi-Kassisse1, Artur
P. Tacla2 and Regina C. Spadari-Bratfisch1,3
1 Laboratory of Stress Study, Department of Physiology and Biophysics, Institute of Biology,
State University of Campinas (UNICAMP), Campinas, São Paulo, 2Atma Desenvolvimento
Humano, São Paulo, SP, 3Department of Biosciences, Federal University of São Paulo
(UNIFESP), Santos, São Paulo, Brazil
* Corresponding author
R.C. Spadari-Bratfisch
Depto. de Biociências
Campus da Baixada Santista
Universidade Federal de São Paulo
Rua Ana Costa no. 95
11060-001 Santos SP Brasil
E-mail: [email protected]
Running title – Salivary cortisol levels and socioeconomic status
78
Abstract
We have analyzed the perceived stress index (PSI), the basal salivary cortisol levels,
and the awakening cortisol response in 85 volunteers of low (LSES) and high socioeconomic
status (HSES). The LSES presented higher PSI and basal salivary cortisol levels, non-altered
awakening cortisol response or cortisol diurnal rhythm. We have concluded that the LSES is
associated with high PSI and salivary cortisol levels (SCL), which could impact negatively in
health and it is related to the daily life stress experienced by LSES group. Because about 30%
of the total Brazilian population is included in the LSES group it might have a great impact on
public health policies and costs.
Key words: stress, socioeconomic status, salivary cortisol levels
Introduction
The socioeconomic status (SES) is considered a well-established risk factor for poor
health, the poorer the SES the worse prospects for health outcomes (Taylor et al., 1997;
Marmot et al., 1997). SES gradients in disease risk are partially explained by bad health
related with behaviors, and partially by environmental conditions that people at lower SES are
exposed3. There are only a few reports on the relationship between low SES and stress
markers in people leaving in developing countries (Cannino et al., 1987; Almeida-Filho et al.,
1997; Araya et al., 2003), including the Brazilian population, where the social differences are
accentuated, the social support is deficient, and the public violence index is alarmingly high
(Andrade et al., 2002).
Stressors whether they were physical or psychological, activate several neural
pathways including the hypothamo-pituitary-adrenal (HPA) axis. One of the consequences is
the increase in the cortisol plasma levels that superimpose to the endogenous corticosteroids
circadian rhythm. The cortisol rhythm might be altered by the low SES (Steptoe et al., 2003)
79
psychosocial work or domestic environment (Adam et al., 2001), conditions that determine
chronic psychosocial stress, and contribute to the prevalence of severe illnesses.
Because there is a good correlation between stress and cortisol plasma levels and
between this last with the salivary cortisol levels the analysis of the salivary cortisol levels has
been considered a good physiological indicator of the stress response concerning to the
activation of the HPA axis (Clow et al., 2004).
In this paper we have analyzed the perceived stress index, the basal salivary cortisol
levels and rhythm, and the awakening cortisol response in two groups of different
socioeconomic status living in the state of Sao Paulo, southeast region of Brazil, in order to
determine whether these levels correlate with SES.
Method
Thirty-five men and 51 women, 20-45 year-old, volunteered to participate in
response to a public notification and signed the Informed Consent Term. They were
distributed in two groups: low and high socioeconomic status (LSES and HSES, respectively),
according to years of formal education, average wage income, occupational level, family
profile, and possessions of some items at home (Instituto Brasileiro de Geografia e Estatística,
IBGE). All participants reported use of no medication. This study was approved by the
Institutional Ethics Committee and it was conducted according to the principles of the
Helsinki Declaration.
To assess perceived stress index, the Perceived Stress Questionnaire (Levenstein et al.,
1993) was used. The questionnaires were fulfilled by the volunteers in the presence of the
researcher.
The participants were given written and verbal instructions on how to collect the saliva
samples and a plastic bag containing five collecting tubes (Sarstedt, Numbrecht, Germany).
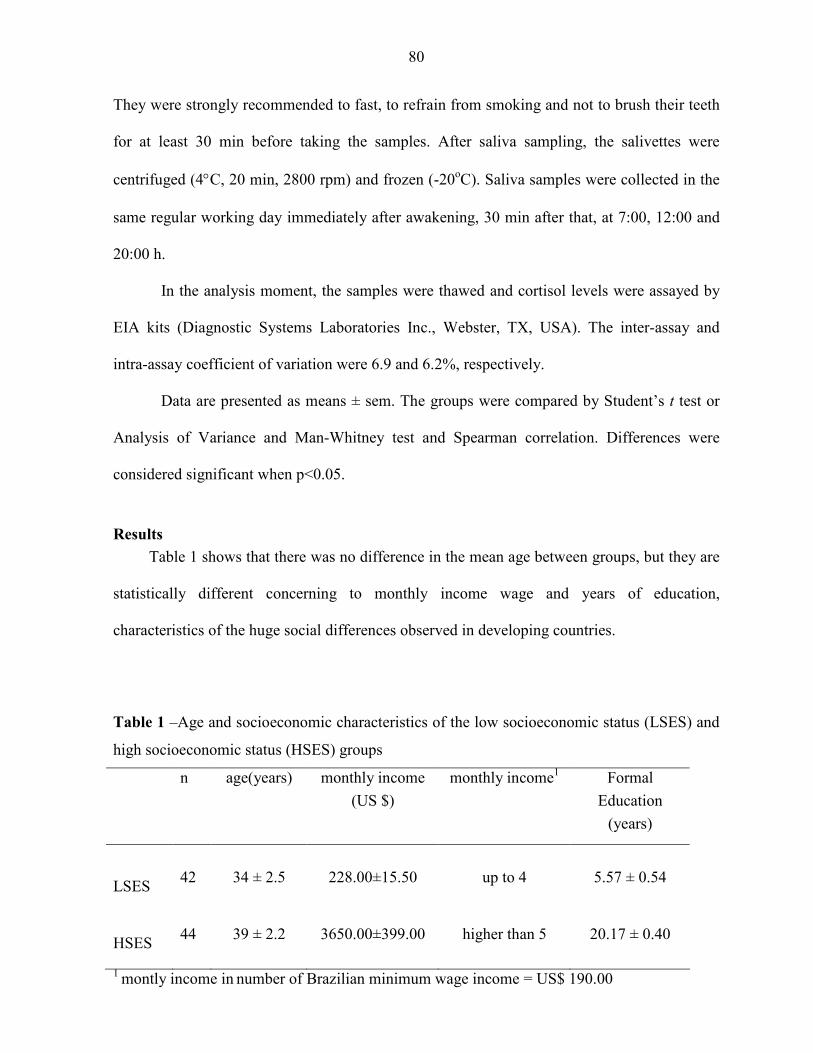
80
They were strongly recommended to fast, to refrain from smoking and not to brush their teeth
for at least 30 min before taking the samples. After saliva sampling, the salivettes were
centrifuged (4°C, 20 min, 2800 rpm) and frozen (-20oC). Saliva samples were collected in the
same regular working day immediately after awakening, 30 min after that, at 7:00, 12:00 and
20:00 h.
In the analysis moment, the samples were thawed and cortisol levels were assayed by
EIA kits (Diagnostic Systems Laboratories Inc., Webster, TX, USA). The inter-assay and
intra-assay coefficient of variation were 6.9 and 6.2%, respectively.
Data are presented as means ± sem. The groups were compared by Student’s t test or
Analysis of Variance and Man-Whitney test and Spearman correlation. Differences were
considered significant when p<0.05.
Results
Table 1 shows that there was no difference in the mean age between groups, but they are
statistically different concerning to monthly income wage and years of education,
characteristics of the huge social differences observed in developing countries.
Table 1 –Age and socioeconomic characteristics of the low socioeconomic status (LSES) and
high socioeconomic status (HSES) groups
n age(years) monthly income
(US $)
monthly income1
Formal
Education
(years)
LSES
42
34 ± 2.5
228.00±15.50
up to 4
5.57 ± 0.54
HSES
44
39 ± 2.2
3650.00±399.00
higher than 5
20.17 ± 0.40
1 montly income in number of Brazilian minimum wage income = US$ 190.00
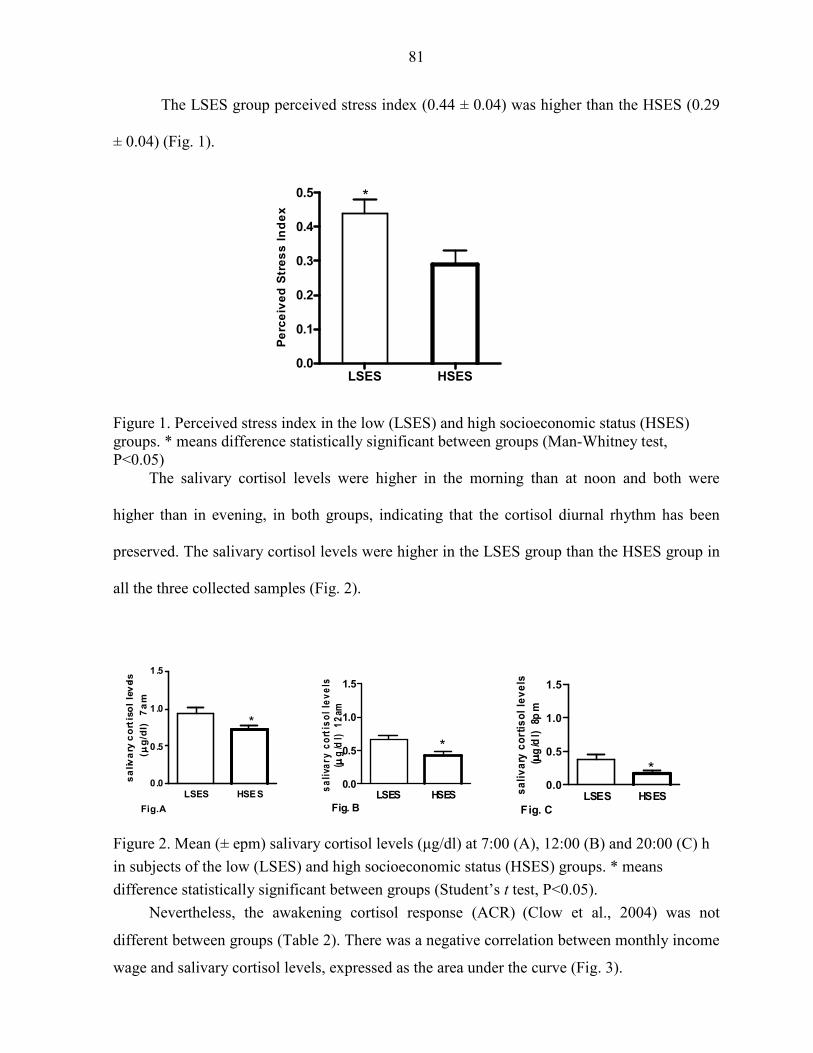
81
The LSES group perceived stress index (0.44 ± 0.04) was higher than the HSES (0.29
± 0.04) (Fig. 1).
LSES HSES
0.0
0.1
0.2
0.3
0.4
0.5 *
Pe
rce
ive
d S
tre
ss
In
de
x
Figure 1. Perceived stress index in the low (LSES) and high socioeconomic status (HSES) groups. * means difference statistically significant between groups (Man-Whitney test, P<0.05)
The salivary cortisol levels were higher in the morning than at noon and both were
higher than in evening, in both groups, indicating that the cortisol diurnal rhythm has been
preserved. The salivary cortisol levels were higher in the LSES group than the HSES group in
all the three collected samples (Fig. 2).
Figure 2. Mean (± epm) salivary cortisol levels (µg/dl) at 7:00 (A), 12:00 (B) and 20:00 (C) h
in subjects of the low (LSES) and high socioeconomic status (HSES) groups. * means
difference statistically significant between groups (Student’s t test, P<0.05).
Nevertheless, the awakening cortisol response (ACR) (Clow et al., 2004) was not
different between groups (Table 2). There was a negative correlation between monthly income
wage and salivary cortisol levels, expressed as the area under the curve (Fig. 3).
LSES HSES0.0
0.5
1.0
1.5
*
Fig. C
sa
liv
ary
co
rtis
ol
lev
els
(µµ µµ
g/d
l)
8pm
LSES HSES0.0
0.5
1.0
1.5
*
Fig. B
sa
liva
ry c
ort
iso
l le
ve
ls(µµ µµ
g/d
l)
12
am
LSES HSE S0.0
0.5
1.0
1.5
*
Fig.A
sa
liv
ary
co
rtis
ol
lev
els
(µµ µµ
g/d
l)
7a
m
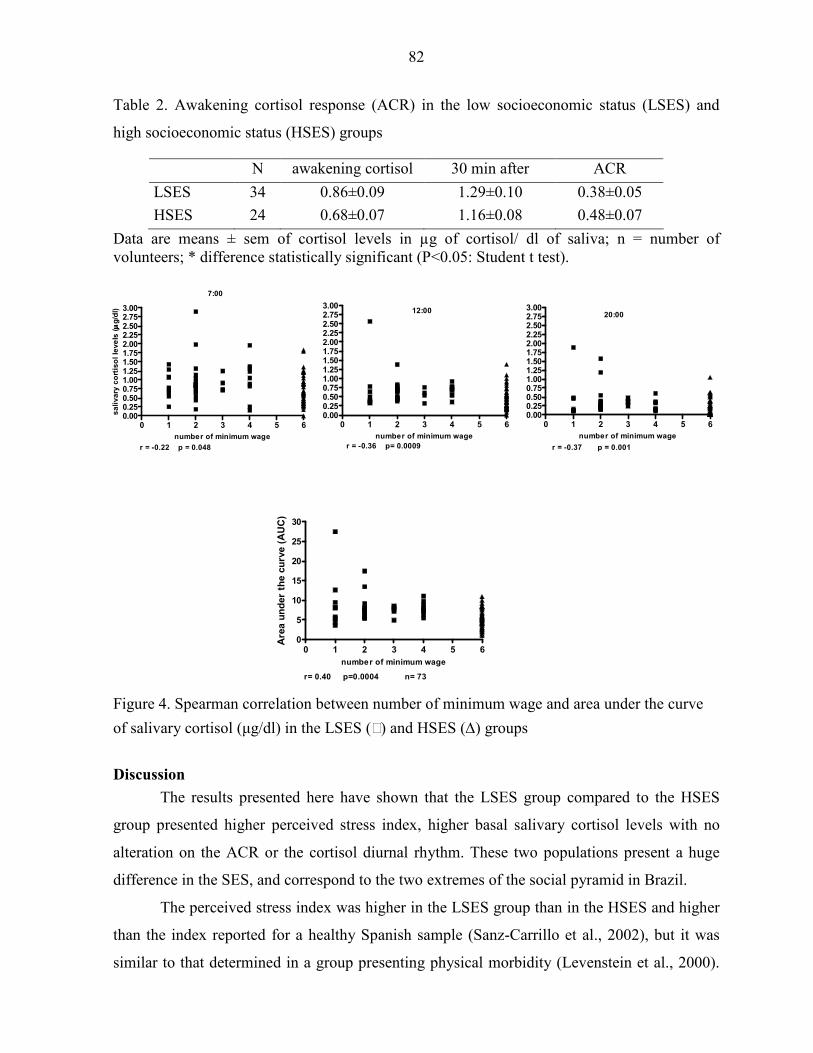
82
Table 2. Awakening cortisol response (ACR) in the low socioeconomic status (LSES) and
high socioeconomic status (HSES) groups
N awakening cortisol 30 min after ACR
LSES 34 0.86±0.09 1.29±0.10 0.38±0.05
HSES 24 0.68±0.07 1.16±0.08 0.48±0.07
Data are means ± sem of cortisol levels in µg of cortisol/ dl of saliva; n = number of volunteers; * difference statistically significant (P<0.05: Student t test).
Figure 3. Spearman correlation between monthly income and salivary cortisol levels at 7:00
(A), 12:00 (B) and 20:00 (C) h in the LSES () and HSES (∆) groups.
Figure 4. Spearman correlation between number of minimum wage and area under the curve
of salivary cortisol (µg/dl) in the LSES () and HSES (∆) groups
Discussion
The results presented here have shown that the LSES group compared to the HSES
group presented higher perceived stress index, higher basal salivary cortisol levels with no
alteration on the ACR or the cortisol diurnal rhythm. These two populations present a huge
difference in the SES, and correspond to the two extremes of the social pyramid in Brazil.
The perceived stress index was higher in the LSES group than in the HSES and higher
than the index reported for a healthy Spanish sample (Sanz-Carrillo et al., 2002), but it was
similar to that determined in a group presenting physical morbidity (Levenstein et al., 2000).
0 1 2 3 4 5 60.000.250.500.751.001.251.501.752.002.252.502.753.00
7:00
r = -0.22 p = 0.048
number of minimum wage
sa
liva
ry c
ort
iso
l le
ve
ls (µµ µµ
g/d
l)
0 1 2 3 4 5 60.000.250.500.751.001.251.501.752.002.252.502.753.00
12:00
r = -0.36 p= 0.0009
number of minimum wage
0 1 2 3 4 5 60.000.250.500.751.001.251.501.752.002.252.502.753.00
20:00
r = -0.37 p = 0.001
number of minimum wage
0 1 2 3 4 5 60
5
10
15
20
25
30
r= 0.40 p=0.0004 n= 73
number of minimum wage
Are
a u
nd
er
the c
urv
e (
AU
C)

83
The social conditions in which these LSES group lives is associated with several daily
stressors such as high levels of psychosocial and financial stress, high levels of violence and
lower levels of social support. Moreover, stress levels can be partially explained by bad health
related to behaviors such as smoking, food choice and alcohol consumption. They present
higher basal salivary cortisol levels compared to the HSES group. The differences between
these two groups were significant even though considering that the basal SCL present great
variability among individuals and from day to day in the same individual.
Different from the basal SCL, the ACR shows a high degree of intra-individual
stability (Pruessner et al., 1997) and it has been proposed to measure the level of
psychological stress in daily life. There were no differences in the ACR between the LSES and
the HSES groups analyzed here. However, it is important to mention that the adhesion to the
collecting protocol for ACR is very poor and this index has been questioned in the literature
(Levenstein et al., 1993). The salivary cortisol levels were higher in the LSES group than in
the HSES in all the three samples collected. The rise in the cortisol in the morning may reflect
anticipatory stress, which has been found to be important determinant of cortisol excretion in
relation to a stress test (Gaab et al., 2005). The maintenance of high cortisol levels during the
day, although declining according to the cortisol rhythm, might be related to the strains that
the individual encounters during the day (Smyth et al., 1998). These combined factors create
the allostatic load that might generate the conditions to morbidity.
Therefore, we have concluded that the LSES is associated with high levels of PSI and
SCL. Considering that the HSES group also includes working men and women living in the
same region and country, and exposed to similar general conditions, we might attribute these
differences to the SES. Because Brazilian LSES population corresponds 30% of the total
population (IBGE) this picture might have a great impact on public health polices and costs.
Such impact remains to be analyzed.
References Adam, E.K. & M.R. Gunnar. Relationship functioning and home and work demands
predict individual differences in diurnal cortisol patterns in women. Psychoneuroendocrinology 26: 189-208, 2001.
Almeida-Filho, N., J.J. Mari, E. Coutinho, et al.. Brazilian multicentric study of psychiatric morbidity. Methodological features and prevalence estimates. Br. J. Psychiatry 171: 524 – 529, 1997.
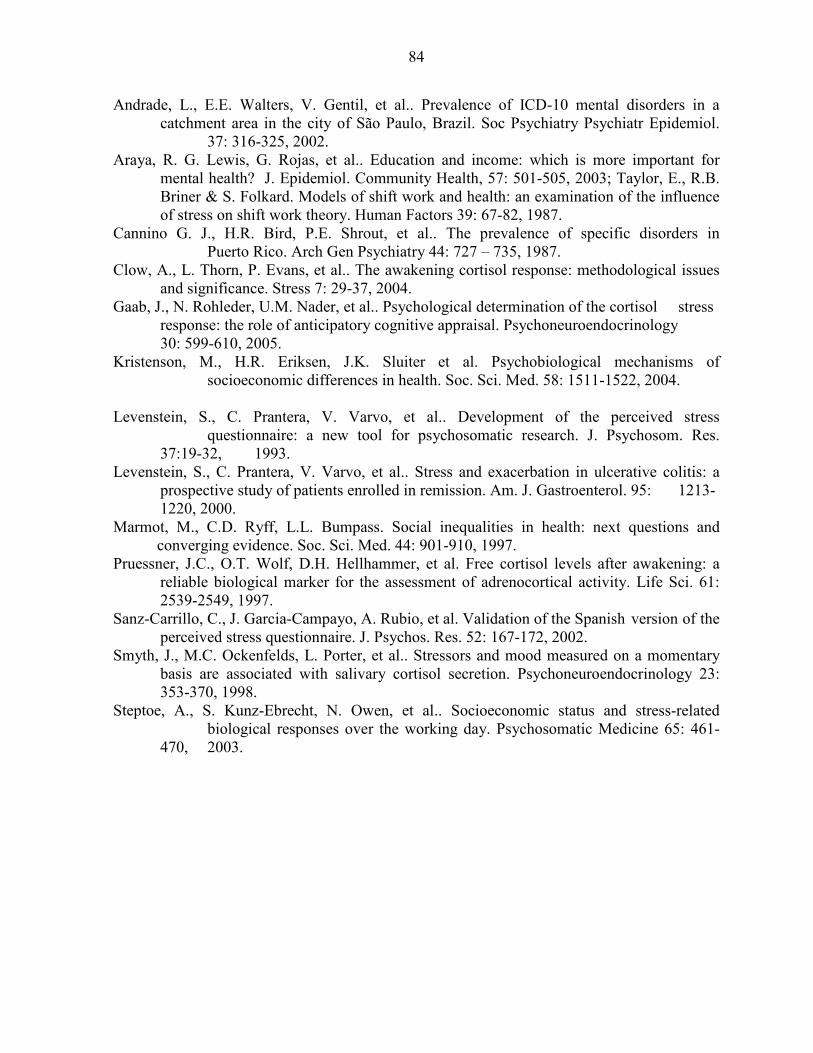
84
Andrade, L., E.E. Walters, V. Gentil, et al.. Prevalence of ICD-10 mental disorders in a catchment area in the city of São Paulo, Brazil. Soc Psychiatry Psychiatr Epidemiol. 37: 316-325, 2002.
Araya, R. G. Lewis, G. Rojas, et al.. Education and income: which is more important for mental health? J. Epidemiol. Community Health, 57: 501-505, 2003; Taylor, E., R.B. Briner & S. Folkard. Models of shift work and health: an examination of the influence of stress on shift work theory. Human Factors 39: 67-82, 1987.
Cannino G. J., H.R. Bird, P.E. Shrout, et al.. The prevalence of specific disorders in Puerto Rico. Arch Gen Psychiatry 44: 727 – 735, 1987.
Clow, A., L. Thorn, P. Evans, et al.. The awakening cortisol response: methodological issues and significance. Stress 7: 29-37, 2004.
Gaab, J., N. Rohleder, U.M. Nader, et al.. Psychological determination of the cortisol stress response: the role of anticipatory cognitive appraisal. Psychoneuroendocrinology
30: 599-610, 2005. Kristenson, M., H.R. Eriksen, J.K. Sluiter et al. Psychobiological mechanisms of
socioeconomic differences in health. Soc. Sci. Med. 58: 1511-1522, 2004. Levenstein, S., C. Prantera, V. Varvo, et al.. Development of the perceived stress
questionnaire: a new tool for psychosomatic research. J. Psychosom. Res. 37:19-32, 1993.
Levenstein, S., C. Prantera, V. Varvo, et al.. Stress and exacerbation in ulcerative colitis: a prospective study of patients enrolled in remission. Am. J. Gastroenterol. 95: 1213-1220, 2000.
Marmot, M., C.D. Ryff, L.L. Bumpass. Social inequalities in health: next questions and converging evidence. Soc. Sci. Med. 44: 901-910, 1997.
Pruessner, J.C., O.T. Wolf, D.H. Hellhammer, et al. Free cortisol levels after awakening: a reliable biological marker for the assessment of adrenocortical activity. Life Sci. 61: 2539-2549, 1997.
Sanz-Carrillo, C., J. Garcia-Campayo, A. Rubio, et al. Validation of the Spanish version of the perceived stress questionnaire. J. Psychos. Res. 52: 167-172, 2002.
Smyth, J., M.C. Ockenfelds, L. Porter, et al.. Stressors and mood measured on a momentary basis are associated with salivary cortisol secretion. Psychoneuroendocrinology 23: 353-370, 1998.
Steptoe, A., S. Kunz-Ebrecht, N. Owen, et al.. Socioeconomic status and stress-related biological responses over the working day. Psychosomatic Medicine 65: 461-470, 2003.
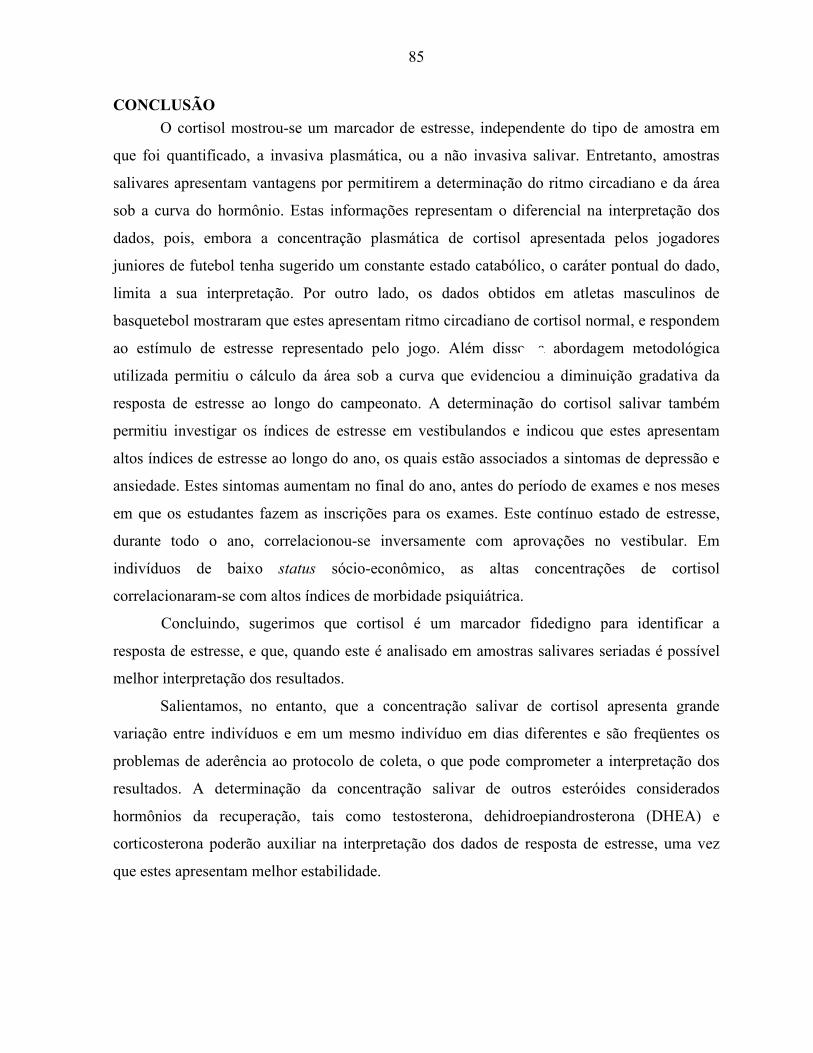
85
CONCLUSÃO
O cortisol mostrou-se um marcador de estresse, independente do tipo de amostra em
que foi quantificado, a invasiva plasmática, ou a não invasiva salivar. Entretanto, amostras
salivares apresentam vantagens por permitirem a determinação do ritmo circadiano e da área
sob a curva do hormônio. Estas informações representam o diferencial na interpretação dos
dados, pois, embora a concentração plasmática de cortisol apresentada pelos jogadores
juniores de futebol tenha sugerido um constante estado catabólico, o caráter pontual do dado,
limita a sua interpretação. Por outro lado, os dados obtidos em atletas masculinos de
basquetebol mostraram que estes apresentam ritmo circadiano de cortisol normal, e respondem
ao estímulo de estresse representado pelo jogo. Além disso, a abordagem metodológica
utilizada permitiu o cálculo da área sob a curva que evidenciou a diminuição gradativa da
resposta de estresse ao longo do campeonato. A determinação do cortisol salivar também
permitiu investigar os índices de estresse em vestibulandos e indicou que estes apresentam
altos índices de estresse ao longo do ano, os quais estão associados a sintomas de depressão e
ansiedade. Estes sintomas aumentam no final do ano, antes do período de exames e nos meses
em que os estudantes fazem as inscrições para os exames. Este contínuo estado de estresse,
durante todo o ano, correlacionou-se inversamente com aprovações no vestibular. Em
indivíduos de baixo status sócio-econômico, as altas concentrações de cortisol
correlacionaram-se com altos índices de morbidade psiquiátrica.
Concluindo, sugerimos que cortisol é um marcador fidedigno para identificar a
resposta de estresse, e que, quando este é analisado em amostras salivares seriadas é possível
melhor interpretação dos resultados.
Salientamos, no entanto, que a concentração salivar de cortisol apresenta grande
variação entre indivíduos e em um mesmo indivíduo em dias diferentes e são freqüentes os
problemas de aderência ao protocolo de coleta, o que pode comprometer a interpretação dos
resultados. A determinação da concentração salivar de outros esteróides considerados
hormônios da recuperação, tais como testosterona, dehidroepiandrosterona (DHEA) e
corticosterona poderão auxiliar na interpretação dos dados de resposta de estresse, uma vez
que estes apresentam melhor estabilidade.
86
REFERÊNCIAS BIBLIOGRÁFICAS Bella, G. P; Garcia, M. C., Vasconcelos, D. C; Grassi-Kassisse, D. M; Spadari-Bratfisch, R. C.
Influência da assistência requerida por crianças com paralisia cerebral nos índices de
estresse dos cuidadores. XXIII Reunião Anual da Federação de Sociedades de Biologia
Experimental (FeSBE), 20 a 23 de agosto de 2008, Águas de Lindóia, São Paulo.
Cannon, W. B. Stress and strains of homeostasis. Am. J. Med. Sci., 189, 1-12, 1935.
______, W. B. Evidence for adrenaline in adrenergic neurones. Am. J. Physiol., 125, 765-777,
1939.
Conrad, C. D., Grote, K. A., Hobbs, R. J., Ferayorni, A. Sex differences in spatial and non-
spatial Y-maze performance after chronic stress. Neurobiol. Learning Memory, 79, 32-
40, 2003.
Coover, G. D.; Ursin, H.; Levine, S. Plasma-corticosteronelevels during active-avoidance
learning in rats. J. Physiol. Psychol., 82, 170-174, 1973.
Day, T. A. Defining stress as a prelude to mapping its neurocircuitry: No help from allostasis.
Prog. NeuroPsychopharmacol Biol. Psychiatry, 20: 1195-1200, 2005.
Duclos, M. Corcuff, J. B.; Arsac, L., Morreau-Gaudry, F.; Rashedi, M., Roger, P., Tabarin, A.;
Manier, G. Corticotroph axis sensitivity after exercise in endurance-trained athletes.
Clinical Endocrinology, 48, 493-501, 1998.
Eriksen, H. R. & Ursin, H. Social inequalites in health: Biological, cognitive and learning
theory perceptives. Norsk. Epidemiologi, 12, 33-38, 2002.
Folkman, S. & Lazarus,R. S. Coping and emotion. IN: Stein, N. L., Leventhal, B., Trabasco,
T. (Eds.), Psychological and Biological Approaches to Emotion. Lawrence Erlbaum,
Hillsdale, NJ, pp.313-332, 1990.
Franks, B. D. What is stress? Quest, 46, 1-7, 1994.
Garcia, M. C.; Souza, A. G., Bella, G. P., Tacla, A. P.; Grassi-Kassisse, M .D. and Spadari-
Bratfisch, R. C. Salivary cortisol levels in Brazilian citizens of distinct socioeconomic
and cultural levels. Annals of the New York Academy of Science, 2008, in press.
Goldstein, D. S. Catecholamines and stress. Endocr. Regul., 37, 69-80, 2003.
Griffin, J. F. T. Stress and immunity: an unifying concept. Vet. Immunol. Immunopathol., 20,
263-312, 1989.

87
Kudielka, B. M. Broderick, J. E. and Kirschbaum, C. Compliance with saliva sampling
protocols: electronic monitoring reveals invalid cortisol daytime profiles in
noncompliance subjects. Psychosomatic Medicine. 65, 313-319, 2003.
Kirschbaum, C & Hellhammer, D H. Salivary cortisol in psychoneuroendocrine research:
recent developments and applications Psychoneuroendocrinology, 194, 313-33, 1994.
Lasikiewicz, N., Hendrickx, H., Talbot, D. and Dye, L. Exploration of basal diurnal salivary
profiles in middle-aged adults: Association with sleep quality and metabolic
parameters. Psychoneuroendocrinology 33, 143-151, 2008.
Levine, S. Developmental determinants of sensitivity and resistance to stress.
Psychoneuroendocrinology, 30, 939-946, 2005.
Liston, C., Miller, M. M.,Goldwater, D. S.,Radley, J. J.,Rocher, A. B., Hof, P. R., Morrison, J.
H., McEwen, B. S. Stress-induced alterations in prefrontal cortex dendritic morphology
predict select impairments in perceptual attentional set-shifting. Journal of
Neuroscience, 26, 7870-7874, 2006.
Mason , J. W. A historical view of the stress field. J. Hum. Stress, 1, (2) 22-36, 1975.
Meerson, F. Z. Adaptation, stress and prophylaxis. Springer-Verlag Berlim, Germany, 329 p.,
1984.
McCarty,R. Stress research: principles, problems and prospects. In Van Loon GR, Kvenansky
R, McCarty R, Axelrod J, eds. Stress: neurochemical and humoral mechanism. New
York: Gordon and Beach Science Publishers, 3-13, 1989.
McEwen, B. S. Physiology and Neurobiology os Stress and Adaptation: Central Role of The
Brain. Physiology Review, 87, 873-904, 2007.
______, B.; Stellar, E. Stress and the individual mechanism leading to disease. Arch. Int.
Med., 153, 2093-2101, 1993.
Milad, M. R. & Quirk,G. J. Nuerons in medial prefrontal cortex signal memory for fear
extinction. Nature, 420, 70-74, 2002.
Morgan, M. A. & LeDoux,J. E. Differencial contribuition of dorsal and ventral medial
prefrontal cortex to the acquisition and extinction of conditioned fear in rats. Behavior
Neuroscience, 109, 681-688, 1995.
Munck, A.; Guyre, P. M.; Holbrook, N. J. Physiological functions of glucocorticoids in stress
and their relation to pharmacological actions. Endocr. Rev., 5, 25-44, 1984.

88
Pacak,K. Baffi, J. S., Kvetnansky, R., Goldstein, D. S., Palkovits, M. Stressor-specific
activation of catecholaminergic systems: implications for stress-related hypothalamic-
pituitary-adrenocortical responses. Adv. Pharmacol, 42, 561-564, 1998.
Pacák, K.; Palkovits, M. Stressor specificity of central neuroendocrine response: implications
for stress-related disorders. Endocrinol. Rev., v. 22, 4, 502-548, 2001.
Petrelluzzi, K. F. ; Garcia, M. C. ; Petta, C. A. ; Grassi-Kassisse, D. M. ; Spadari-Bratfisch, R.
C. Salivary cortisol concentrations, stress and quality of life in women with
endometriosis and chronic pelvic pain. Stress (Luxembourg), xx, 1-8, 2008.
Sapolsky, R. M.; Romero, L. M.; Munck, A. U. How do glucocorticoids influence stress
response? Integrating permissive, supressive, stimulatory and preparative actions.
Endocr. Rev., 21, (1) 55-89, 2000.
Selye, H. A syndrome produced by diverse noccious agents. Nature, 138, (1)32, 1936.
______, H. The general adaptive syndrome and disease of adaptation. J. Clin. Endocrinol., 6,
117-230, 1946.
______, H. The stress of life. New York: McGraw-Hill Books Inc., 1956. 324 p.
______, H. Stress Without Stress. Philadelphia, J.B. Lippincott.
Sterling, P.; Eyer, J. Alostasis: a new paradigm to explain arousal pathology. In: Fischer, J.
Reason, J. Eds. Handbook of Life Stress, Cognition and Health. New York: John
Wiley & Sons Inc., p. 629-649, 1988.
Thorn, L., Hucklebridge, F., Evans, P. and Clow, A. Suspected non-adherence and weekend
versus week day differences in the awakening cortisol response.
Psychoneuroendocrinology 31, 1009-1018, 2006.
Ursin, H & Eriksen,H. R. The cognitive activation theory of stress.
Psychoneuroendocrinology, 29, 567-592, 2004.
Van de Kar, L. D.; Richardson-Morton, K. D.; Rittenhouse, P. A. Stress: Neuroendocrine and
Pharmacological Mechanisms. Meth. Arch. Exp. Pathol. Bas. Karger, 14, 133-173,
1991.
______, L. D. & Blair, M. L. Forebrain pathways mediating stress-induced hormone secretion.
Front Neuroendocrinol, 20, 1-48, 1999.
Vinning, R. F.; McGinley, R. A. The measurement of hormones in saliva: possibilities and
pitfalls. Journal Steroid Biochemistry, 27(1-3):81-94, 1987.
89
Wood, G. E., Young, L. T., Reagan, L. P., McEwen, B. S. Acute and chronic restraint stress
after the incidence of social conflict in male rats. Horm Behaviour, 43, 205-213, 2003.
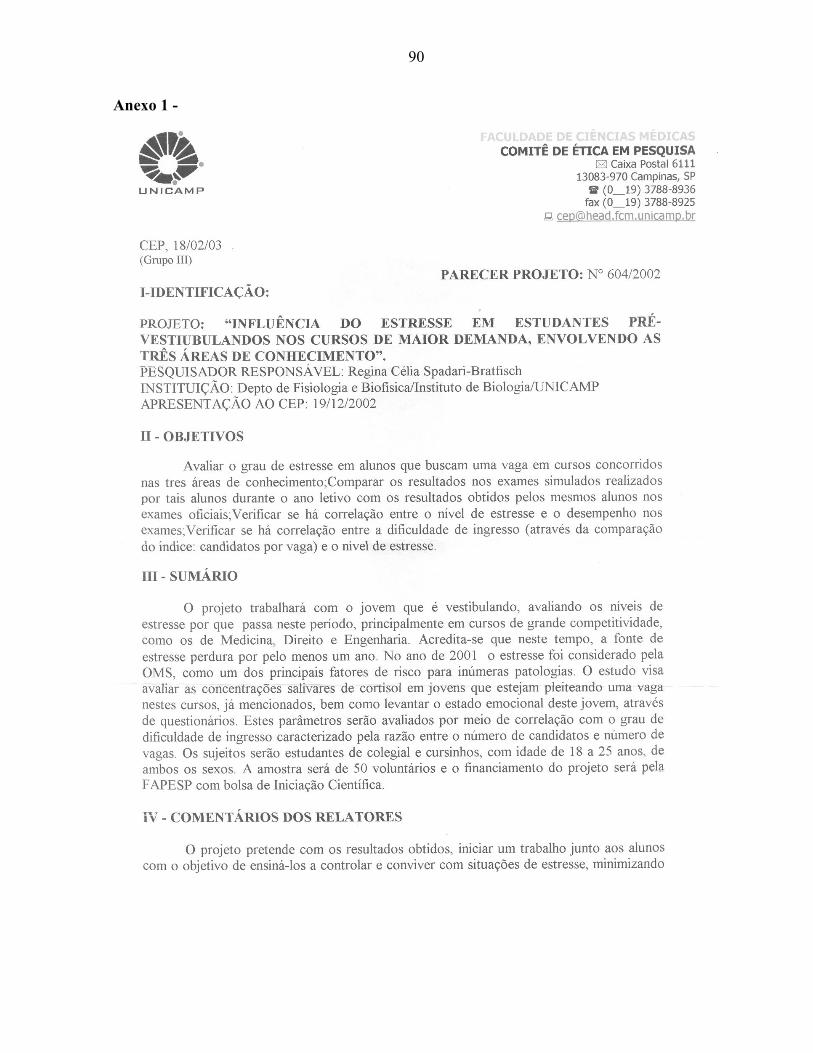
90
Anexo 1 -
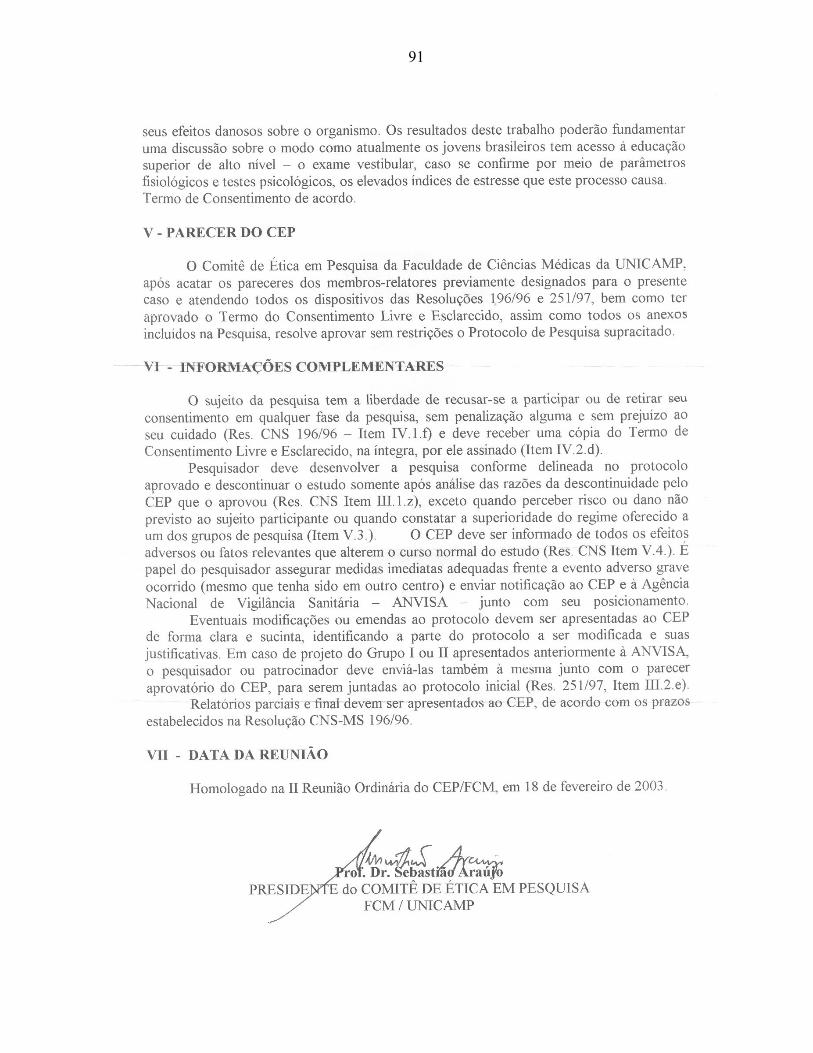
91
92
Anexo 2 -
93