Fiber-Optic Sensing: Turning the Lights on Downhole · Fiber-Optic Sensing: Turning the Lights on...
4
Fiber-Optic Sensing: Turning the Lights on Downhole O ver the past five years, the oil and gas industry has seen a rapid increase in the deployment of fiber-op- tic sensing for downhole monitoring. Significant im- provements in glass chemistry, interrogation technologies, and analysis applications have led the way to a robust down- hole sensing solution. As many as 20 fibers can be packed into a ¼-in. tube (cable), which can be installed as a life-of-well monitoring system. Each of the fibers can be turned into a fully distributed sensor for temperature (DTS), acoustics (DAS) and strain (DSS) measurements, or these can be used to interrogate multiple point sensors like pressure gauges and geophones. Fibers can also be used for downhole power transmission or data telemetry. Although conventional hardware has existed for decades to collect this same type of information, the question is: Why is the industry now seeing such excitement over fiber sensing? One major benefit is that an operator can now monitor the en- tire well simultaneously. Things can be seen and heard in a well- bore that were impossible with point sensors or even wireline By packing a wide variety of sensors into a single fiber cable, simple package, multiple conventional monitoring systems can be replaced while reducing complexity and cost. By Priyesh Ranjan and Glenn McColpin Halliburton FIBER OPTICS Figure 1: This shows how fiber-optics cable is installed in an openhole completion. (Images courtesy of Halliburton) NOVEMBER 2013 | THE DIGITAL OIL FIELD | EPMAG.COM
Transcript of Fiber-Optic Sensing: Turning the Lights on Downhole · Fiber-Optic Sensing: Turning the Lights on...

Fiber-Optic Sensing: Turning the Lights on Downhole
Over the past five years, the oil and gas industry hasseen a rapid increase in the deployment of fiber-op-tic sensing for downhole monitoring. Significant im-
provements in glass chemistry, interrogation technologies,and analysis applications have led the way to a robust down-hole sensing solution. As many as 20 fibers can be packed intoa ¼-in. tube (cable), which can be installed as a life-of-wellmonitoring system. Each of the fibers can be turned into a fully distributed
sensor for temperature (DTS), acoustics (DAS) and strain
(DSS) measurements, or these can be used to interrogatemultiple point sensors like pressure gauges and geophones.Fibers can also be used for downhole power transmission ordata telemetry. Although conventional hardware has existedfor decades to collect this same type of information, thequestion is: Why is the industry now seeing such excitementover fiber sensing? One major benefit is that an operator can now monitor the en-
tire well simultaneously. Things can be seen and heard in a well-bore that were impossible with point sensors or even wireline
By packing a wide variety of sensors into a single fiber cable, simple package, multiple conventionalmonitoring systems can be replaced while reducing complexity and cost.
By Priyesh Ranjan and Glenn McColpinHalliburton
FIBER OPTICS
Figure 1: This shows how fiber-optics cable is installed in an openhole completion. (Images courtesy of Halliburton)
NOVEMBER 2013 | THE DIGITAL OIL FIELD | EPMAG.COM

tools. Another is that glass fiber by its nature is im-mune to electromagnetic radiation, can transmitdata at high speeds, and can operate in extreme en-vironments. All of these attributes equal a very at-tractive package that can bring benefit in most wellmonitoring scenarios.
Value of information from fiber opticsThe value of information can be defined as theamount a decision-maker is willing to pay forinformation prior to making a critical decision.With the increased attention on unconventionalreservoirs, the need for rapid subsurface learn-ing has become increasingly important, withmuch of the decades of learning from conven-tional reservoirs not applicable. Unconventionalreservoirs are being rapidly drilled and devel-oped in both delineation and factory mode,with the windows of opportunity to make assetoptimization decisions very short. Operators are trying to optimize well spacing,
stage spacing, and clusters per stage in addition tofluid chemistry, proppant selection, and manyother variables. With such low recovery factorsand high completion and stimulation costs, it isimperative that the optimal combination of variables be iden-tified early in a project. No matter how many models are cre-ated to estimate what is going to happen, it is not until thosemodels are calibrated with field data that they become trulyvaluable. With fiber monitoring being able to answer a multi-tude of questions without re-entering the wellbore, it is emerg-ing as a very attractive option.If operators look at how fiber-optic installations are being
used in unconventional reservoirs today, they will see that theapplication is not limited to a single event or phase. In fact,most of the life cycle of a well is covered, from monitoring ce-ment to monitoring completion to controlling stimulation toevaluating production and finally for identifying and moni-toring restimulation candidates. The subsurface insight gath-ered by fiber optics during these different phases of a well is al-lowing operators to make quicker asset optimization decisionsin shale plays.
Phases in the life of the wellFiber-optics technology has an impact on each phase in a well’slife to see how the technology is currently being used.
Cementing phase: How long do we wait? Once the fiber-optics cable is strapped and run behind pro-duction casing, it immediately becomes a source of valuableinformation. The DTS is used to evaluate the cement curingtime so the operator knows when to pressure-test the well. Thesame analysis is used to identify the cement top.
Using a DAS, the operator is also able to track the downwardmovement of the wiper plug and verify that it has landed at thecorrect depth. Later, the cable can be used to look for cement in-tegrity issues.
Completion phase: Is everything working correctly? During completion, when balls are dropped to actuate slidingsleeves, an operator can acoustically track the balls as they traveldown the well and verify that they are seated in the correct sleevebefore running pumps up for the frac. If swellable packers are be-ing used in the annulus, the fiber-optic sensor can verify thefluid top during the swelling period to verify that there is full cov-erage (Figure 1). Similarly, in plug-and-perf completions an operator can see
the depths at which the perfs are shot via the noise recorded onthe DAS or the heat signature recorded on the fiber-optic tem-perature sensor. As pressure is applied to the completion equip-ment, information indicates the hardware is working as de-signed, and recommendations can be made to field personneltrying to verify hardware positions and fluid flow paths.
Real-time stimulation phase: Getting the best frac As fracturing is started on a stage, operators can verify thatplugs or packers are holding pressure and then identify whichperforation clusters are taking fluid/proppant using temper-ature or acoustic sensing. The single most important use offiber in stimulated wells is to track how many perforation clus-ters are taking fluid during the treatment (Figure 2).
EPMAG.COM | THE DIGITAL OIL FIELD | NOVEMBER 2013
Figure 2: Near-wellbore insight of DTS/DAS from fiber optics can be inte-grated with farfield insight from microseismic.
In the field data that have been recently gathered, poor clus-ter efficiency has directly correlated to sparse fracs but long half-lengths. High cluster efficiency results in more uniform fracspacing and half-lengths. Once the operator knows where fluid is moving, it can ac-
tively use diverters to close off clusters that initially take fluidand force dormant clusters to initiate fractures. This methodshould create stimulation uniformity. With stimulation uni-formity, stimulated reservoir volume (SRV) is optimized foreach stage and the proper well spacing is set to eliminatestranded reserves. This type of optimization can make a mar-ginal field into a solid producer.In addition to untreated clusters creating increased (nonopti-
mum) frac spacing, this same phenomena could be created due tovarious other issues such as poor cement, poor stage isolation, orpoor wellbore connectivity, to name a few. In field data that havebeen collected, as much as 10% of the treatment fluid for eachstage can be seen passing by leaking plugs. Reservoir temperatures that didn’t match the models used to
formulate the fluid chemistry also have been observed. Inher-ently, it is assumed that formations are heterogeneous. But inHalliburton’s stimulation modeling, it is assumed that 100% ofthe completion hardware and fluid chemistry acts as designed.Fiber-optic sensing is now showing there is a lot more going onthat doesn’t match the models than previously thought.
Post-stimulation phase: Models have no value until calibratedData from fiber optics is changing the definition of a cali-brated model. In the past, microseismic data was used to cali-brate the farfield frac growth of a model. The cluster efficiencydata from fiber optics allows the estimation of the amount offluid each cluster took dur-ing a stage. In certainbasins the frac geometriesand lengths drasticallychange with this ability tocalibrate the frac modelby modifying the near-wellbore fluid distribu-tion across the clusters. There are many other
analysis steps that can beperformed with fiber op-tics. For example, zonalisolation issues usingDTS/DAS data can beused to evaluate leakthrough a plug, which al-lows an operator to backout that fluid volumefrom what is going intoclusters in the frac model.
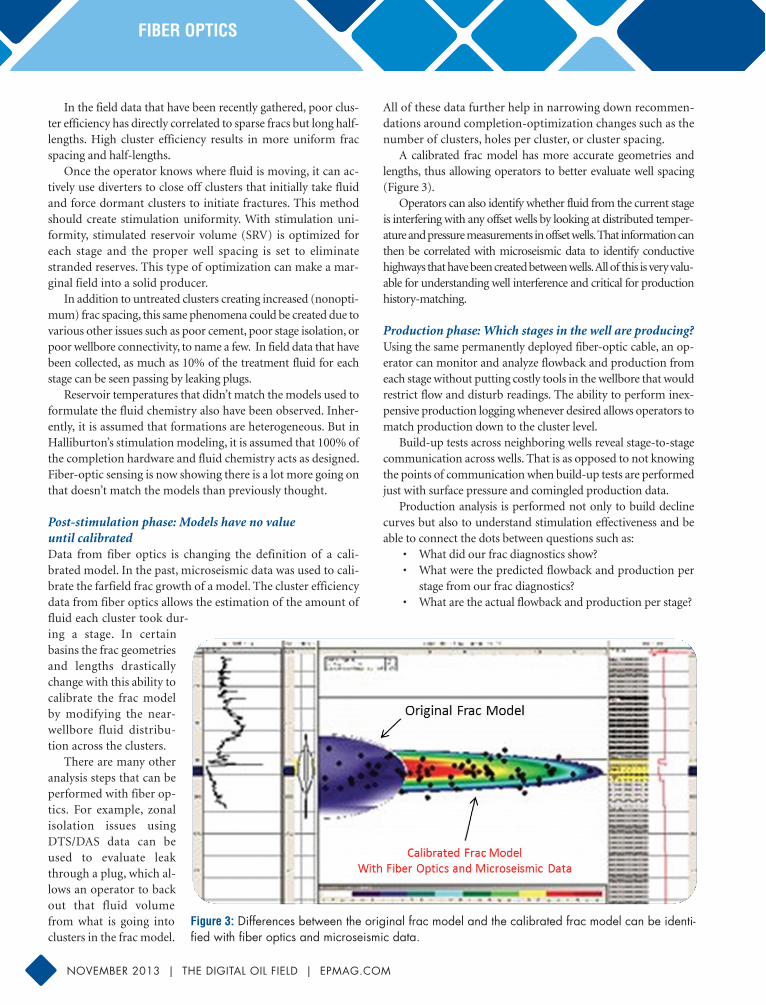
All of these data further help in narrowing down recommen-dations around completion-optimization changes such as thenumber of clusters, holes per cluster, or cluster spacing.A calibrated frac model has more accurate geometries and
lengths, thus allowing operators to better evaluate well spacing(Figure 3).Operators can also identify whether fluid from the current stage
is interfering with any offset wells by looking at distributed temper-ature and pressure measurements in offset wells. That information canthen be correlated with microseismic data to identify conductivehighways that have been created between wells. All of this is very valu-able for understanding well interference and critical for productionhistory-matching.
Production phase: Which stages in the well are producing? Using the same permanently deployed fiber-optic cable, an op-erator can monitor and analyze flowback and production fromeach stage without putting costly tools in the wellbore that wouldrestrict flow and disturb readings. The ability to perform inex-pensive production logging whenever desired allows operators tomatch production down to the cluster level. Build-up tests across neighboring wells reveal stage-to-stage
communication across wells. That is as opposed to not knowingthe points of communication when build-up tests are performedjust with surface pressure and comingled production data.Production analysis is performed not only to build decline
curves but also to understand stimulation effectiveness and beable to connect the dots between questions such as:
• What did our frac diagnostics show? • What were the predicted flowback and production perstage from our frac diagnostics?
• What are the actual flowback and production per stage?
FIBER OPTICS
NOVEMBER 2013 | THE DIGITAL OIL FIELD | EPMAG.COM
Figure 3: Differences between the original frac model and the calibrated frac model can be identi-fied with fiber optics and microseismic data.

• What is the production interference across wells and stages?
• How are frac and reservoir models furthercalibrated?
Production analysis at the stage level highlights what ar-eas of the well are candidates for re-frac operations. All thisvaluable information during the production phases drivesoptimization recommendations for future wells.
Planning for the next drilling pad A well-calibrated frac model leads to a more realistic reser-voir model. This allows analysis and modeling of the ef-fective SRV as well as forecast production. A noncalibratedfrac model fed into a reservoir model has major adverseimpacts on figuring out well spacing and other variables inunconventional reservoirs. A calibrated reservoir model allows performance of
numerical reservoir simulation to history-match wellperformance and interaction of all wells (Figure 4).This improves the sensitivity study on well spacing,fracture lengths, conductivity, and fracture spacingalong the wellbore, hence optimizing the evaluation ofoptimum completion and well-spacing strategy for thenext pad.
What’s next?Development of fiber-optic sensing systems is not stand-ing still. Step-changes in resolution and accuracy areoccurring not only with the existing sensor types but alsowith new sensing techniques that are emerging that willmake permanent installations even more valuable goingforward. The application suite in this area is not yet mature.The more the industry digs into the raw data, the more valueis being found. Where the industry was happy with just a noise log from a
DAS just a few years ago, it is now digging into the meaning of thefrequency content of the data stream to tease out fluid density andother parameters. The ability of the DAS to pick up and transmit data from
other sensors is just now being investigated. Imagine being ableto drop a sensor ball down a well that would take and acousti-cally transmit readings to a fiber line cemented behind casing.Fiber exposed to wellbore fluids can be used for spectroscopyor to identify the location and quantities of tracers in situ. Recent tests have shown that a simple piece of glass fiber can
pick up seismic energy and be used to create a vertical seismic pro-file (VSP) without the use of conventional geophones. The sig-nal-to-noise ratio is poor at this time, but the sensor count is or-ders of magnitude larger than most conventional geophonearrays deployed downhole. By packing such a wide variety of sensors into a single, sim-
ple package, the operator can replace multiple conventional sys-tems while reducing monitoring complexity and cost. If opera-
tors want a horizontal production log, they can rent a data col-lection computer for a day rather than mobilizing a coiled tub-ing (CT) unit. For a VSP, all that an operator needs is the vibe truck. For leak
detection, rent or turn on another type of box. If the operatorwants to upgrade its sensor to the latest technology, just changethe hardware at the surface and leave the downhole sensor alone.All of the complex and expensive equipment is at the surface,while only glass and metal are downhole. In some cases a completely new sensing technology
can be added to the system by simply adding a new type ofsurface interrogator. Over the life of a well, this monitoringmodel has significant economic appeal. Although costs are coming down, even today most installations would payfor themselves if two or three horizontal logs were to be run during a well’s life. Permanent installations are just one option. There are also requests for fiber-enabled wireline, slickline, and
CT. Pumpable systems allow the fiber to be easily changed out asglass chemistry improves. In short, there are now many ways to“turn the lights on” downhole and make the earth transparentthrough fiber-optic sensing. �
Figure 4: A noncalibrated reservoir model is compared to a calibrated reservoir model that used fiber-optics data to determine optimum completion and well-spacing strategy for the next drilling pad.
© Hart Energy | 1616 S. Voss, Ste. 1000, Houston, TX 77057 USA | +1.713.260.6400 | Fax +1.713.840.8585