Fiber Optic Raman Sensor to Monitor Concentration Ratio … · Fiber Optic Raman Sensor to Monitor...
21
1 Fiber Optic Raman Sensor to Monitor Concentration Ratio of Nitrogen and Oxygen in a Cryogenic Mixture Vidhu S.Tiwari 1 , Rajamohan R. Kalluru 2 , Fang-Yu Yueh 1 , and Jagdish P Singh 1* and William St. Cyr 3 1 Institute for Clean Energy Technology, Mississippi State University 205 Research Boulevard, Starkville, MS- 39759 2 Mississippi Ethanol LLC, Winona, MS- 38968 3 NASA/Stennis Space Center (SSC), SSC, MS-39529 * Corresponding Author: [email protected] A spontaneous Raman scattering optical fiber sensor is developed for a specific need of NASA/SSC for long-term detection and monitoring of the quality of liquid oxygen (LOX) in the delivery line during ground testing of rocket engines. The sensor performance was tested in the laboratory and with different excitation light sources. To evaluate the sensor performance with different excitation light sources for the LOX quality application, we have used the various mixtures of liquid oxygen and liquid nitrogen as samples. The study of the sensor performance shows that this sensor offers a great deal of flexibility and provides a cost effective solution for the application. However, an improved system response time is needed for the real-time, quantitative monitoring of the quality of cryogenic fluids in harsh envioronment. OCIS codes: 0300.6450, 300.6330, 300.0300, 140.3550, 170.5660, 120.0120, 60.2370 RELEASED - Printed documents may be obsolete; validate prior to use. RELEASED - Printed documents may be obsolete; validate prior to use. https://ntrs.nasa.gov/search.jsp?R=20070003556 2018-07-13T23:41:48+00:00Z
Transcript of Fiber Optic Raman Sensor to Monitor Concentration Ratio … · Fiber Optic Raman Sensor to Monitor...
1
Fiber Optic Raman Sensor to Monitor Concentration Ratio of Nitrogen and Oxygen in a Cryogenic Mixture
Vidhu S.Tiwari1, Rajamohan R. Kalluru2, Fang-Yu Yueh1, and Jagdish P Singh1* and William St. Cyr3
1Institute for Clean Energy Technology, Mississippi State University 205 Research Boulevard, Starkville, MS- 39759
2Mississippi Ethanol LLC, Winona, MS- 38968 3NASA/Stennis Space Center (SSC), SSC, MS-39529
*Corresponding Author: [email protected]
A spontaneous Raman scattering optical fiber sensor is developed for a specific need of
NASA/SSC for long-term detection and monitoring of the quality of liquid oxygen (LOX) in the
delivery line during ground testing of rocket engines. The sensor performance was tested in the
laboratory and with different excitation light sources. To evaluate the sensor performance with
different excitation light sources for the LOX quality application, we have used the various
mixtures of liquid oxygen and liquid nitrogen as samples. The study of the sensor performance
shows that this sensor offers a great deal of flexibility and provides a cost effective solution for
the application. However, an improved system response time is needed for the real-time,
quantitative monitoring of the quality of cryogenic fluids in harsh envioronment.
OCIS codes: 0300.6450, 300.6330, 300.0300, 140.3550, 170.5660, 120.0120, 60.2370
RELEASED - Printed documents may be obsolete; validate prior to use.RELEASED - Printed documents may be obsolete; validate prior to use.
https://ntrs.nasa.gov/search.jsp?R=20070003556 2018-07-13T23:41:48+00:00Z
2
1. Introduction
The environment within a rocket engine is particularly severe with very high temperatures and
pressures along with extremely rapid fluid and gas flows.1 The escalating use of liquid phase
compounds like oxygen, hydrogen, etc., as cryogenic fuels and their quality monitoring led to the
development of a variety of sensor systems. Apart from quality control, sensors are required for
quantitative determination of constituent species in a sample mixture, especially in aircraft fuel
tanks where a disproportionate concentration of one sample against another can lead to an
explosion.2 Fuel vapors mixed with air containing a high level of oxygen are extremely
flammable and raise serious questions on the survivability of aircraft. Implementation of sensors
is not only restricted to realizing ignition susceptibility but also in monitoring the health of
rocket engines, especially where an optimum level of cryogenic fuel purity is highly desirable.
Several types of sensors like electronic sensors, capacitance based, electrochemical sensors, etc.,
are commercially available but lose their relevance in the supercritical environment of rockets
and aircraft, where high temperature and pressure severely inhibit their optimal performance.3-5
In the past, researchers have developed computational-analytical techniques for quality
maintenance in cryogenic fuel like liquid methane at the entrance to the article tank.6 Though
interesting, this method requires sampling of fuel mixture and thus fails to provide real-time
measurement of impurities in fuel. Application of fiber optic technology to rocket engine health
monitoring offers an alternative approach towards realizing various parameters of interest and
addresses several measurement issues associated with extremely harsh environments. Today,
optical fiber sensing technology has evolved to the point where one can measure nearly all the
physical parameters of interest and a very large number of chemical species as well.7
RELEASED - Printed documents may be obsolete; validate prior to use.RELEASED - Printed documents may be obsolete; validate prior to use.
3
This paper reports an all-optical cryogenic fluid sensor based on Raman spectroscopy for
concentration ratio monitoring of liquid nitrogen (LN2) in liquid oxygen (LOX). The present
work is motivated by a specific need of NASA Stennis Space Center (SSC) for long-term
detection and monitoring of the quality of liquid oxygen in the delivery line during the testing of
rocket engines.8 An attractive design feature of a fiber optic sensor lies in real-time, in-situ
qualitative as well as quantitative determination of LOX and/or LN2 from their mixture sample
on the basis of spectrum analysis for various sample compositions. Prior to this study, efforts
have been made to develop a gas sensor for monitoring gaseous phase mixtures of nitrogen and
oxygen.9 Online characterization of cryogenic fluid mixtures like liquid nitrogen and liquid
oxygen by optical diagnostics is an area that has not yet been explored to the best of our
knowledge. Various issues involved in monitoring super critical fluid mixtures, like sample
vaporization/condensation, system optimization, signal/noise ratio and other safety parameters,
have been well addressed and provide a novel vision for encountering challenges involved in
processing/controlling cryogenic fuels.
Certain distinct advantages of optical fiber sensors over conventional sensors, like
remote sensing, multiplexing and distributed sensing, immunity towards EM signals, etc., make
them more advantageous in real field applications. On the other hand, laser Raman spectroscopy
(LRS) has been known for years as a relatively simple analytical method for identification of
molecules in gases, liquids and solids by scattering of laser light. Raman spectroscopy is based
on the Raman effect that results from energy exchange between incident photons and the
scattered molecules.10-21 The Raman scattered light occurs at frequencies that are shifted from
the incident laser light by the change in vibrational, rotational or electronic energies of a
molecule. By measuring the frequency and intensity of inelastically scattered light from the
RELEASED - Printed documents may be obsolete; validate prior to use.RELEASED - Printed documents may be obsolete; validate prior to use.
4
sample, the molecules in the sample can be qualitatively and quantitatively measured. In order
to explore various possibilities of employing a low cost, portable optical sensor based on LRS in
the harsh environment of a rocket engine, we evaluated three excitation light sources for the
sensor. Two frequency doubled 532-nm continuous wavelength (CW) Nd:YAG lasers (TEM00
and Multimode) were first used as excitation light source with a fiber optic state-of-the-art
miniaturized Raman probe. Then a diode laser operating at 670-nm was used as the excitation
source in an attempt towards configuring a cost effective optical sensor, which caters to the
needs of various national laboratories and cryogenic industries. The sensor performances with
different excitation sources in the measurements of liquid nitrogen in liquid oxygen are
compared and the results are reported in this paper.
2. Experimental Details
The main focus of this research effort was to develop a real-time optical fiber sensor that
employs a CW 532-nm laser as an excitation light source for monitoring the concentration of
LN2 in LOX/LN2 liquid mixture. In the process of developing a miniaturized and cost effective
optical fiber Raman sensor, we have also evaluated a diode laser as an excitation light source.
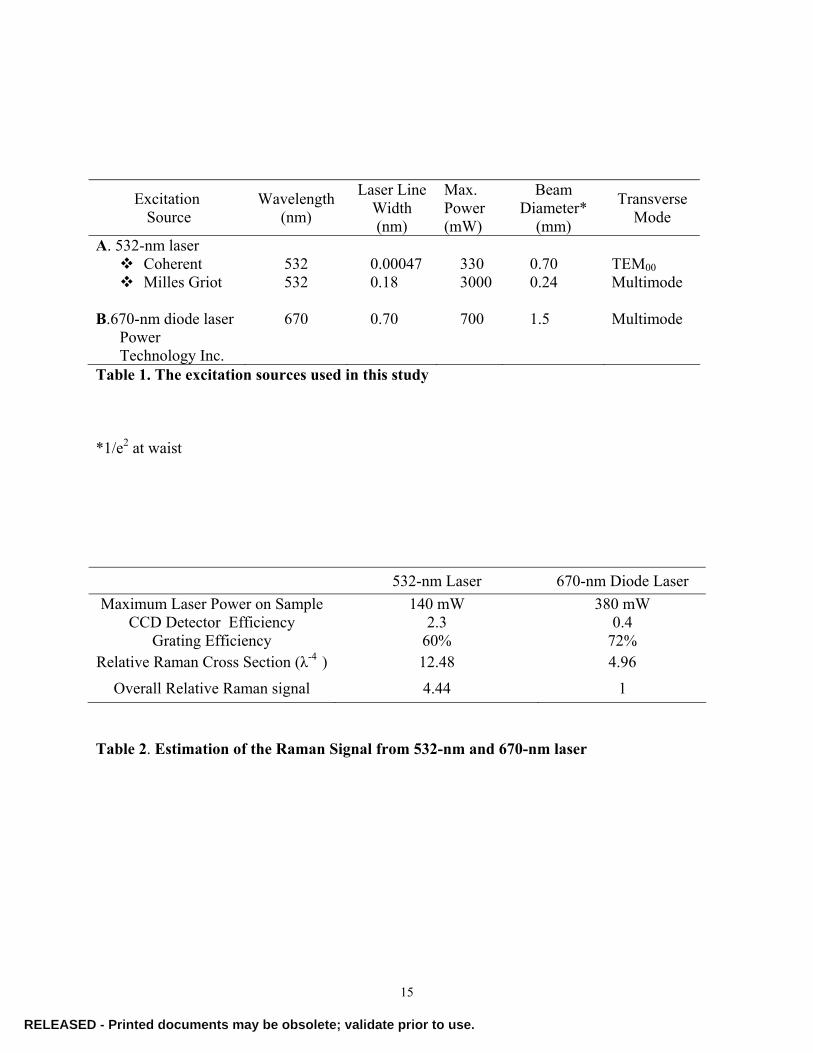
The details of the excitation sources used in this study are given in Table 1.
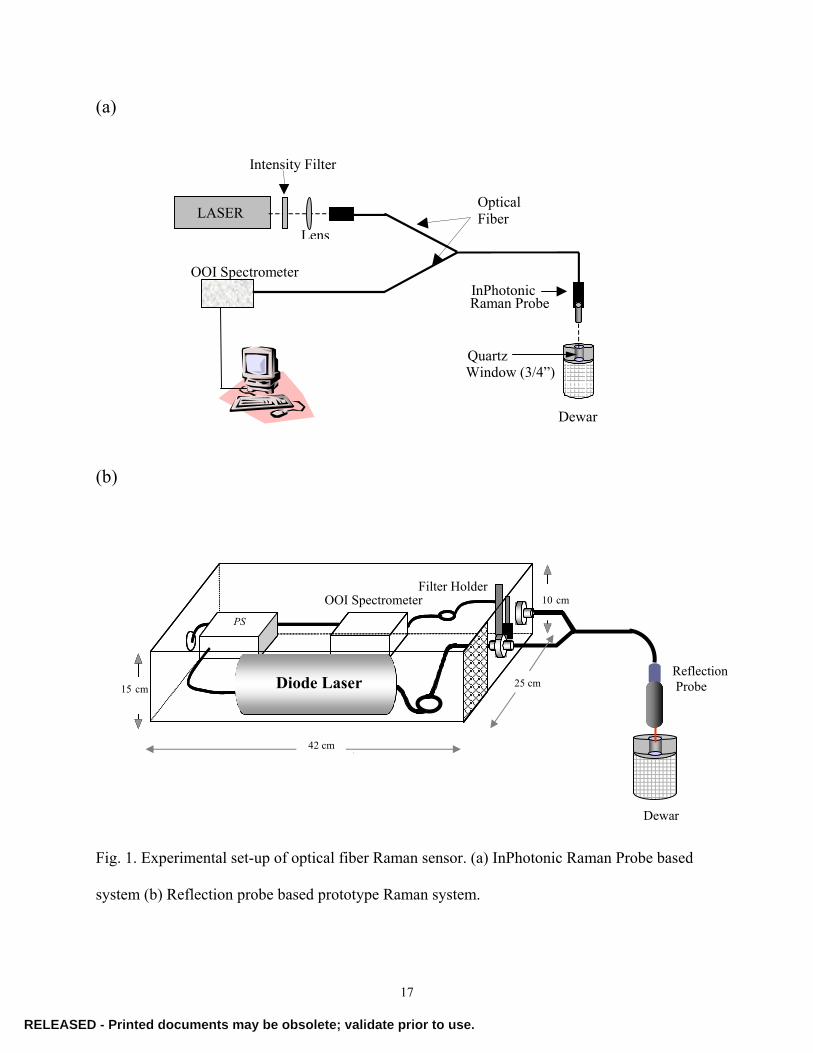
In the initial experiment, an optical fiber Raman sensor is set up using a frequency
doubled 532-nm continuous wavelength (CW) Nd:YAG laser (Coherent DPSS 532) as the
excitation light source, with maximum output power at 330 mW. The laser output energy was
attenuated through proper neutral density filters in order to protect the detector from potential
damage by the high intensity light. The experimental set-up is shown in Fig. 1(a). The sensor
configuration employed a modified In-Photonics fiber optic state-of-the-art miniaturized Raman
RELEASED - Printed documents may be obsolete; validate prior to use.RELEASED - Printed documents may be obsolete; validate prior to use.
5
probe. This probe consisted of just two parallel optical fibers; one (90-µm core diameter) was
guiding the launched light to the liquid sample mixture enclosed within the dewar, whereas the
other (200-µm core diameter) was collecting the emitted Raman signal and feeding it to a USB
spectrometer (USB 2000, Ocean Optics Inc.). This spectrometer had 1200 1/mm grating along
with a 2048-element charge-coupled device (CCD) attached to the exit of the spectrograph, and
was interfaced with a computer via a USB port. Probe performance in terms of Raman signal
response and background noise level was improved by incorporating a miniaturized lens at the
tip of the probe with a working distance of about 30-mm. Experiments were carried out for the
multiple concentration (weight) ratios of the liquid N2/O2 and mixed to ensure homogeneity
within the mixture. For each sample, a 3-s sampling time was used to minimize errors due to
rapid phase transforming, i.e., liquid to gaseous phase nature of the sample constituents. Owing
to the continuous vaporization of the supercritical liquid mixture, the greatest challenge of the
experiment was to minimize the vaporization loss, and also the accuracy with which the weight
ratio of the sample constituents were determined during the preparation of mixtures. In the
initial experiment, a cap with a hole was mounted on the dewar. Though it allowed a clear
passage for the laser light to be focused onto the liquid N2/O2 mixture from the probe, it could
not prevent the vapors from escaping and condensing onto the tip of the fiber probe. As a result,
attenuation in the laser power was observed that severely hampered the liquid N2/O2 spectrum,
thereby reducing the signal-to-noise ratio of the Raman signal. To overcome this problem, two
identical quartz windows (1/4”) were introduced into the dewar cap hole to provide optical
access as well as to prevent vapors from reaching the tip of the probe. A dryer was also installed
in the vicinity of the fiber probe to eliminate the remote possibility of vapor deposition onto the
tip of the probe and thus to achieve long-term stable operation of the Raman sensor.
RELEASED - Printed documents may be obsolete; validate prior to use.RELEASED - Printed documents may be obsolete; validate prior to use.
6
To study the effects of laser property to Raman signal, the Raman data from a narrow
band 532-nm laser (Coherent DPSS 532) and a high-power and inexpensive broadband 532-nm
laser (Milles Griot GHS 309) were compared. The experimental configuration was kept the
same as we recorded these data. A neutral density filter was applied to the broadband 532-nm
laser output to attenuate the laser power so that the laser energy on the sample mixture was about
~ 140 mW from both lasers.
Later we designed a prototype Raman sensor based on a 700 mW power, CW diode laser
(Power Technology Inc.), operating at 670-nm, as an excitation light source and a Y-shaped
reflection/backscattering probe (R200-REF, Ocean Optics Inc.). Figure 1(b) shows the
schematic diagram of this system. This Y-shaped probe consists of seven optical fibers, each
having 200 µm core diameters and 0.22 as numerical aperture with one launching fiber and six
surrounding collecting fibers. Uniqueness of the prototype sensor lies in its compact design
configuration that included carefully aligned optical components, viz., laser diode, filter holder,
cut-off filter (725-nm) and a compact OOI spectrometer (USB 2000). Raman Spectrums of
different concentration ratio mixtures of LOX and LN2 were recorded with the prototype Raman
sensor in the same manner as described earlier.
3. Results and Discussions
The present study was primarily focused on quantitative as well as qualitative analysis of
component ratio of liquid N2/O2 mixtures at varied levels of their weight ratio. The mixture
sample was prepared by adding liquid O2 in liquid N2, owing to the fact that the molecular weight
of oxygen is higher than nitrogen, and therefore suppressing the rate of vaporization of liquid
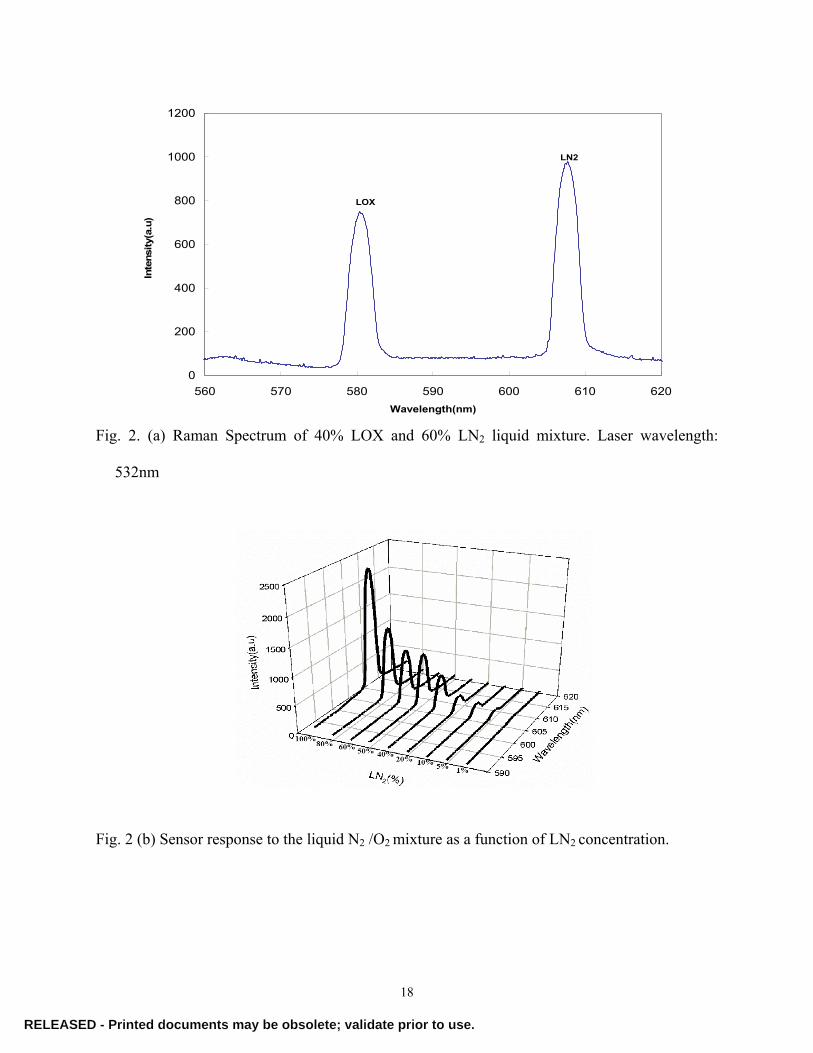
nitrogen.22 Raman Spectrum recorded for 40% of LOX and 60% of LN2 mixture is shown in the
Fig.2 (a). Raman bands of LOX (~ 580-nm) and LN2 (~ 607-nm), corresponding Raman shift for
RELEASED - Printed documents may be obsolete; validate prior to use.RELEASED - Printed documents may be obsolete; validate prior to use.
7
O2 at 1556.4 cm-1 and N2 at 2330.7cm-1, were marked on the spectrum.23 The concentration of
LN2 was varied from 1% to 100% against LOX at normal atmospheric pressure and temperature,
while maintaining a total mixture weight of 100 gram. The Raman band intensity corresponding
to LN2 was increasing as the concentration of LN2 was increased against the LOX in the sample
mixture as shown in Fig. 2(b). A narrow band Coherent CW laser, operating at 532-nm, was
used in this experiment.
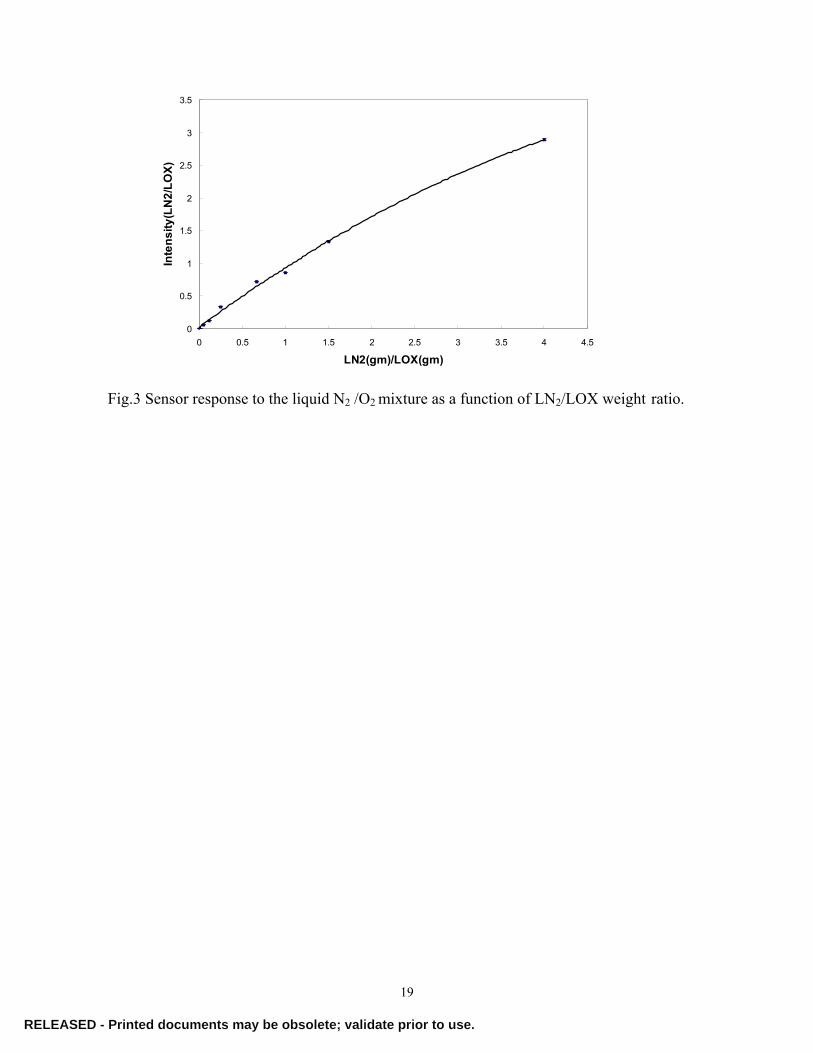
The observed Raman bands of LOX and LN2 were critically analyzed in terms of spectral
band shape, S/N ratio, peak intensity, etc. Peak intensity corresponding to LN2/LOX, at various
concentrations of their weight ratio, was estimated for obtaining a calibration curve as shown in
Fig. 3. Sensor response exhibits a linear trend within the concentration limit of 1 % to 60 % of
LN2 and observed to be saturating in the concentration range of 60% to 80% LN2 in a sample
mixture. Slower response of the sensor towards a higher concentration ratio of LN2 attributes to
the fact that the vaporization rate of liquid nitrogen increases manifolds resulting in the
formation of a cloud of semi-liquid gaseous phase mixture; and thereby affecting the sensor
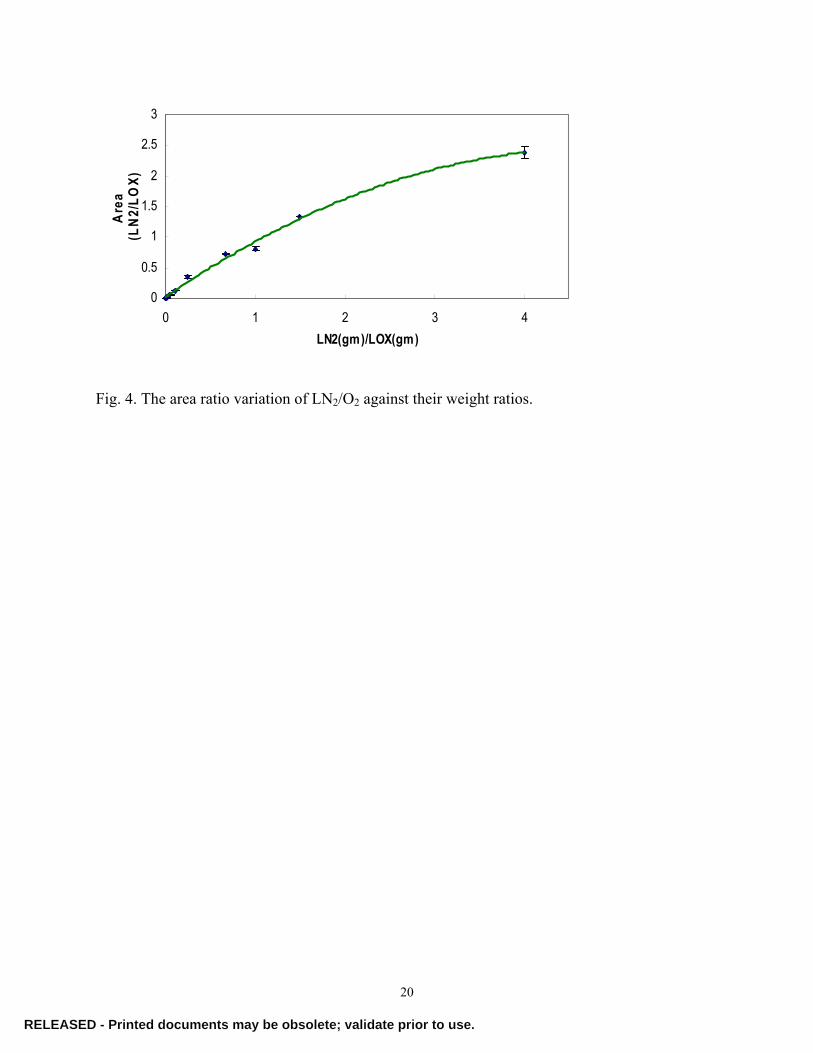
performance. We further calculated the spectral band area ratios of Raman LN2 and LOX peaks.
This calculation was performed for all the sets of spectra corresponding to a particular
concentration ratio of LOX/LN2, and averaged to obtain a single data point. As a result, error due
to the fluctuation in the peak intensity was minimized. Finally, a calibration curve was drawn
between the averaged spectral band area ratios of Raman LN2 and LOX peaks against the
corresponding weight ratios as shown in Fig. 4. The following conclusions have been drawn
from the experimental results obtained above.
First, the sensor system is capable of successfully monitoring the LN2/LOX level in a
LN2/LOX liquid mixture. Second, the Raman peak area follows the same characteristics as the
RELEASED - Printed documents may be obsolete; validate prior to use.RELEASED - Printed documents may be obsolete; validate prior to use.
8
intensity ratio curve. For example, both intensity and area ratio curves exhibit a linear trend
within a low concentration range of LN2 which tend to saturate above 60% LN2 concentration.
This implies that the sensor has high detection sensitivity in low concentration range and can
measure LN2 percentages as low as 1% in a sample mixture. For a typical sample mixture of
60% LN2 and 40% LOX, Limit of Detection (L.O.D.) of sensor was calculated as ~1%. Also,
intensity/area ratio data points are least fluctuating as reflected by the error bars on the
calibration curves which are barely visible in Fig. 3 and Fig. 4. This signifies not only the long-
term stable operation of the sensor but also the reproducibility in the sensor response towards
analyte concentration. Although the calibration curve obtained by the area ratio method
involved statistical averaging of multiple sets of spectra, it did not provide better sensor
response. The linear calibration data for LN2/LOX ratio indicates that the fiber optic Raman
sensor has a great potential for qualitative as well as quantitative monitoring of sample
constituent in supercritical LN2/LOX liquid mixtures.
To develop a less expensive sensor for this application, the feasibility of using an
inexpensive, high power, broadband laser (Milles Griot) operating at 532-nm as an excitation
light source was tested. Using the same laser energy as with Coherent laser (~140 mW), and
same experimental setup, spectra were recorded for various concentration ratios of LOX and LN2
and compared with the 532-nm Coherent laser used in the previous case. Comparative analysis
of spectra recorded with two lasers suggest that in both the cases, spectra share common features
and depending upon the requirement, either of these could be employed as excitation light
sources. The laser line-width of a Milles Griot laser(~0.18nm) is higher than that of a Coherent
laser(~0.00047nm) and showed a slightly higher spectral background in comparison with a
RELEASED - Printed documents may be obsolete; validate prior to use.RELEASED - Printed documents may be obsolete; validate prior to use.
9
Coherent laser. Also, a Milles Griot laser could be operated in the high range of power which is
suitable for trace LN2/LOX monitoring.
To develop a prototype sensor using a 670-nm diode laser, we first estimated the
performance of the sensor by considering the laser energy and detector response near 532 and
670 nm. Since the Raman cross-section depends inversely on the fourth power of the laser
wavelength (λ),21 the Raman signal is also affected by the excitation wavelength. The various
parameters that can affect Raman signal are summarized in Table 2. Estimation based on these
parameters (the effects of optical response from other optics at these two wavelengths are not
included in this calculation) shows that the prototype sensor should give about 4.4 times less
signal than with the system with more expensive 532-nm excitation source. This signal level
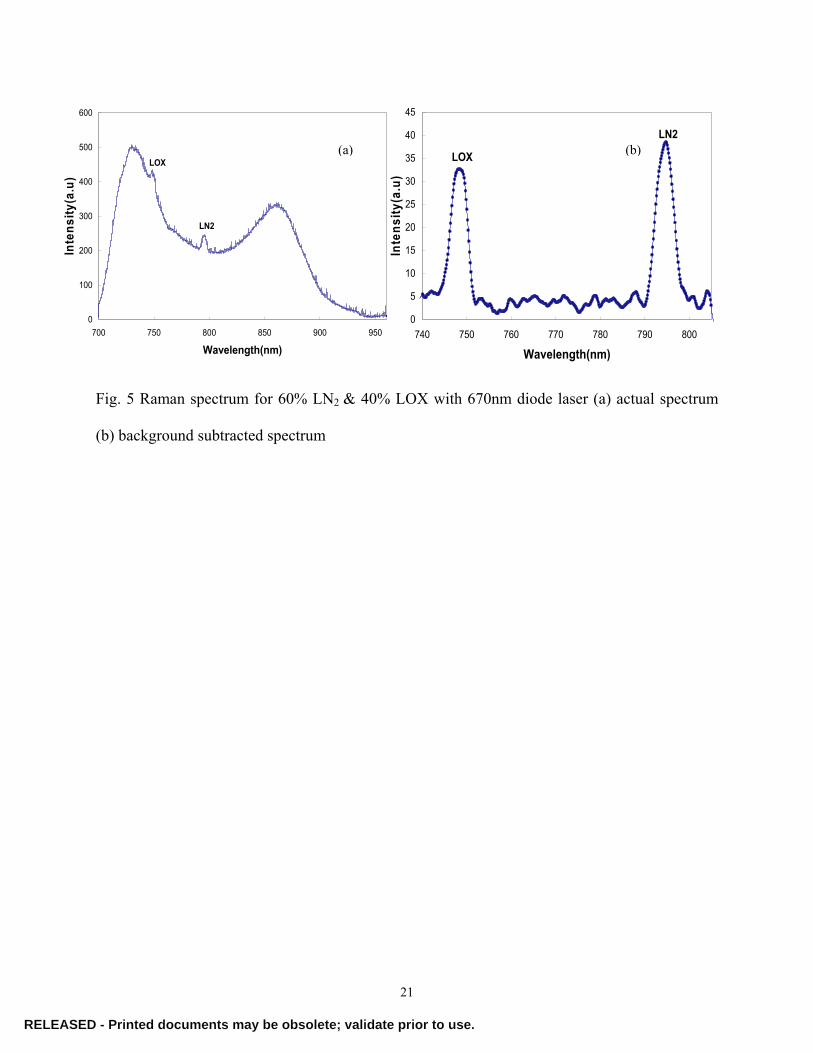
should be good enough for this type of application. A typical spectrum of a 60% LN2 and 40%
LOX sample mixture, recorded with the prototype sensor that included a 670nm laser as an
excitation light source, is shown in Fig. 5(a), where the LN2 Raman peak corresponds to ~ 795-
nm and the LOX peak corresponds to ~ 749-nm, respectively. The Limit of Detection (L.O.D.)
of the prototype sensor for 60%LN2 and 40% LOX was calculated as ~20% which is much
higher in comparison to the L.O.D. of the sensor with a 532-nm laser (~1%) for the same
concentration ratio mixture. The spectrum recorded with the 670-nm laser diode also shows a
strong background that severely affects the Raman signal of LOX/LN2. The overall spectral
quality (signal-to-noise) of the prototype sensor using a 670-nm diode laser is not as good as that
observed in the case of a 532-nm laser (see Fig. 2a). The performance of the sensor systems with
different lasers is actually determined by many factors such as the spectral characteristics of the
laser systems, the optics, and also the scattered light. Due to the broadband spectral line width of
the 670-nm laser diode, a cut-off filter, centered on 725-nm, is unable to suppress the scattered
RELEASED - Printed documents may be obsolete; validate prior to use.RELEASED - Printed documents may be obsolete; validate prior to use.
10
incident laser light. The scattered light has contributed to part of the strong background we
observed. The optical fiber can also give rise to its Raman spectral feature and fluorescence
background signal that will superimpose on the LOX and LN2 spectrum. Our current prototype
sensor is very compact, and we are unable to effectively remove these background features. To
suppress the background and to improve the signal/noise ratio of the Raman signal, appropriate
combinations of various filters will need to be tested and added to the collection optics of the
miniaturized prototype sensor. However, we can apply some data processing technique to
improve the quality of the data. Figure 5(b) shows the processed Raman LOX and LN2 spectrum
of the prototype sensor. This spectrum was obtained by subtracting the raw data from the
background spectrum (the background spectrum was obtained by fitting with some polynomial
functions). The spectral averaging can also be applied to further improve the signal-to-noise
ratio. Intensity ratios for a LN2 and LOX weight ratios of 1.5 were calculated to be ~1.4 from
background subtracted spectrum obtained from the prototype sensor. The Intensity ratios
obtained with a 532-nm laser for the same weight ratios of LN2/LOX is about 1.3.
4. Conclusions
This paper presents a consistent optical fiber Raman sensor for cryogenic applications
and the evaluation of sensor performance with different excitation light sources. The sensor
performance with two different 532-nm lasers and an Inphotonic probe was employed. Efficient
light collection optics and good signal-to-noise ratio of Raman LN2/LOX signal make these
laser-based sensor systems an effective tool for rapid as well as sensitive monitoring of
LN2/LOX during the testing of a rocket engine. To design a low-cost, reliable sensor for this
type of application, we have also tested with a compact and an inexpensive diode laser.
Although this miniaturized prototype sensor system yielded a low signal-to-noise ratio of Raman
RELEASED - Printed documents may be obsolete; validate prior to use.RELEASED - Printed documents may be obsolete; validate prior to use.
11
LN2/LOX signal, we have shown that with an appropriate data processing technique, the
extracted intensity ratio of Raman signal of LN2 and LOX are close to that obtained from the
more-expensive 532-nm excitation systems. The miniaturized sensor system offers a great deal
of flexibility and provides a cost effective solution for measuring the quality as well as quantity
of cryogenic fluids. However, due to the relatively poor signal-to-noise ratio and background
problem, the performance of the miniaturized sensor system is not suitable for real time
monitoring. On the other hand, the system with a high-power 532-nm laser can offer good
quality LOX/LN2 spectra with reasonable response time, and therefore it is more suitable for
real-time application. Future research will be focussed on improving the performance of the
sensor for high cryogenic liquids pressure.
Acknowledgments
The authors gratefully acknowledge Dr. William St. Cyr and Mr. Tracy Miller for their
support and Mr. R. Arun Kumar for advising on mixture measurement. This work is funded by
NASA/SSC –STTR Contract No. NNS04AA34C through Mississippi Ethanol LLC.
References
1. R.O Ballard, “Fiber optic sensors for rocket engine applications”; presented at the 28th Joint
Propulsion Conference and Exhibit , Nashville, TN,6-8 July 1992.
2. Shin-Juh Chen and Joel A. Silver, “Detection of explosive mixtures in the ullage of aircraft
fuel tanks”, presented at the 42nd Aerospace Meeting and Exhibit, Reno, Nevada, 5-8 Jan.
2004.
RELEASED - Printed documents may be obsolete; validate prior to use.RELEASED - Printed documents may be obsolete; validate prior to use.
12
3. R. Parry, G. Claborn, A. Haas, R. Landis, W. Page, J. Smith ,“A high reliability oxygen
deficiency monitoring system”; presented at the Particle Accelerator Conference, Washington
D.C., 17-20 May 1993.
4. M.A Nurge, R.Youngquist, D.Walters, “Capacitance based mass metering for cryogenic
fluids”, Cryogenics, 43, 501-506 (2003).
5. J.A. Akintunde, “Simple liquid nitrogen level monitor using copper wire as a sensor”,
Cryogenics, 27,266-268 (1987).
6. A.M.Domashenko and Y.A.Kondrashkov, “Technology of quality control of liquefied
methane-A fuel for space rocket systems", Chemical & Petroleum Eng., 39,656-661 (2003)
7. K.T.V Grattan and B.T. Meggitt, Optical fiber Sensor Technology, (Kluwer Academic
Publishers, Boston, 1999)
8. J.P. Singh and F.Y.Yueh, “Real time, non-intrusive detection of liquid nitrogen in liquid
oxygen at high pressure and high flow”, NASA/SSC Final Report, Contract No.
NNS04AA34C (2004).
9. Vidhu S. Tiwari, Sunil K. Khijwania, Fang-Yu Yueh, and Jagdish P. Singh, “Monitoring N2 &
O2 concentration ratios in a high-pressure gas mixture by fiber optic Raman Sensor”, in
Proceedings of Seventh International Conference on Optoelectronics, Fiber-optics and
Photonics. (Cochin, India, 2004), pp.132-137.
10. D. Lin-Vien, N. B. Colthup, W. G. Fateley, and J. G. Grasselli, The Handbook of Infrared
and Raman Characteristic Frequencies of Organic Molecules, (Academic Press, Boston,
1991.)
11. B. Schrader, Raman and Infrared Atlas of Organic Compounds, 2nd ed. (Wiley-VCH,
Weinheim, 1989).
RELEASED - Printed documents may be obsolete; validate prior to use.RELEASED - Printed documents may be obsolete; validate prior to use.
13
12. R. A. Nyquist, C. L. Putzig, M. A. Leugers, and R.O. Kagel, The Handbook of Infrared and
Raman Spectra of Inorganic Compounds and Organic Salts, vol. 1-4 (Academic Press, San
Diego, 1997).
13. R. A. Dluhy, S. M. Stephens, S. Widayati, and A.D. Williams, “Vibrational spectroscopy of
biophysical monolayers. Applications of IR and Raman spectroscopy to biomembrane
model systems at interfaces” Spectrochim. Acta. Part A: Molecular and Biomolecular
Spectrosc., 51, 1413-1447 (1995).
14. A.C. Eckbreth, Laser Diagnostics for Combustion Temperature and Species, 2nd ed.
(Gordon and Breach, Amsterdam, 1996), Chap.5 and references therein, pp.209-280.
15. K. K. Kuo and T. P. Parr, eds., Non-intrusive Combustion Diagnostics, (Begell House, New
York, 1994).
16. D. A. Long, Raman Spectroscopy ( McGraw-Hill, New York, 1977).
17. N. M. Laurendeau, “Temperature measurements by light-scattering methods”, Prog. Energy
Combust. Sci., 14, 147-170 ( 1998).
18. G. Zikratov, F.Y. Yueh, J. P. Singh, O. P. Norton, R.A. Kumar, and R.L. Cook,
“Spontaneous anti-stokes Raman probe for gas temperature measurements in industrial
furnaces”, Appl. Opt.38, 1467-1475 (1999).
19. K. Kamogawa and T. Kitagawa, “Evidence for direct intermolecular interactions as an origin
of the hydration shifts of the C-H stretching vibrations: 1, 4-dioxane/water system”, Chem.
Phys. Lett., 179, 271-276 (1991).
20. Tuan Vo-Dinh, Biomedical Photonics Handbook (CRC Press, Boca Raton, 2003).
21. Michael J. Pelletier, Analytical Applications of Raman Spectroscopy (Blackwell Science,
Malden, 1999).
RELEASED - Printed documents may be obsolete; validate prior to use.RELEASED - Printed documents may be obsolete; validate prior to use.
14
22. Peter Atkins and Julio de Paula, Physical Chemistry (W.H.Freeman and Company,
NewYork, 2003).
23. Herzberg, Spectra of Diatomic Molecules, 2nd ed (Van Nostrand Reinhold, New York,
1950).
RELEASED - Printed documents may be obsolete; validate prior to use.RELEASED - Printed documents may be obsolete; validate prior to use.
15
Table 1. The excitation sources used in this study
*1/e2 at waist
532-nm Laser 670-nm Diode Laser Maximum Laser Power on Sample 140 mW 380 mW
CCD Detector Efficiency 2.3 0.4 Grating Efficiency 60% 72%
Relative Raman Cross Section (λ-4 ) 12.48 4.96
Overall Relative Raman signal 4.44 1
Table 2. Estimation of the Raman Signal from 532-nm and 670-nm laser
Excitation Source
Wavelength (nm)
Laser Line Width (nm)
Max. Power (mW)
Beam Diameter*
(mm)
Transverse Mode
A. 532-nm laser Coherent Milles Griot
B.670-nm diode laser
Power Technology Inc.
532 532
670
0.00047 0.18 0.70
330 3000 700
0.70 0.24 1.5
TEM00 Multimode Multimode
RELEASED - Printed documents may be obsolete; validate prior to use.RELEASED - Printed documents may be obsolete; validate prior to use.
16
List of Figure Captions
Fig. 1. Experimental set-up of optical fiber Raman sensor. (a) InPhotonic Raman Probe based
system (b) Reflection probe based prototype Raman system.
Fig. 2. (a) Raman Spectrum of 40% LOX and 60% LN2 liquid mixture. Laser wavelength:
532nm
Fig. 2 (b) Sensor response to the liquid N2 /O2 mixture as a function of LN2 concentration.
Fig. 3 Sensor response to the liquid N2 /O2 mixture as a function of LN2/LOX weight ratio.
Fig. 4. The area ratio variation of LN2/O2 against their weight ratios.
Fig. 5 Raman spectrum for 60% LN2 & 40% LOX with 670nm diode laser (a) actual spectrum
(b) background subtracted spectrum
RELEASED - Printed documents may be obsolete; validate prior to use.RELEASED - Printed documents may be obsolete; validate prior to use.
17
(a)
(b)
Fig. 1. Experimental set-up of optical fiber Raman sensor. (a) InPhotonic Raman Probe based
system (b) Reflection probe based prototype Raman system.
15 cm
42 cm
4”OOI Spectrometer
PS
42 cm
25 cm
PS
42 cm
PS
Diode Laser
10 cm
Diode Laser
Filter Holder
Dewar
Reflection Probe
Intensity Filter
OOI Spectrometer
LASER Lens
Optical Fiber
Dewar
QuartzWindow (3/4”)
InPhotonic Raman Probe
RELEASED - Printed documents may be obsolete; validate prior to use.RELEASED - Printed documents may be obsolete; validate prior to use.
18
Fig. 2. (a) Raman Spectrum of 40% LOX and 60% LN2 liquid mixture. Laser wavelength:
532nm
Fig. 2 (b) Sensor response to the liquid N2 /O2 mixture as a function of LN2 concentration.
0
200
400
600
800
1000
1200
560 570 580 590 600 610 620Wavelength(nm)
Intensity(a.u)
LOX
LN2
RELEASED - Printed documents may be obsolete; validate prior to use.RELEASED - Printed documents may be obsolete; validate prior to use.
19
Fig.3 Sensor response to the liquid N2 /O2 mixture as a function of LN2/LOX weight ratio.
0
0.5
1
1.5
2
2.5
3
3.5
0 0.5 1 1.5 2 2.5 3 3.5 4 4.5
LN2(gm)/LOX(gm)
Intensity(LN2/LOX)
RELEASED - Printed documents may be obsolete; validate prior to use.RELEASED - Printed documents may be obsolete; validate prior to use.
20
Fig. 4. The area ratio variation of LN2/O2 against their weight ratios.
0
0.5
1
1.5
2
2.5
3
0 1 2 3 4LN2(gm)/LOX(gm)
Area
(LN2/LO
X)
RELEASED - Printed documents may be obsolete; validate prior to use.RELEASED - Printed documents may be obsolete; validate prior to use.
21
Fig. 5 Raman spectrum for 60% LN2 & 40% LOX with 670nm diode laser (a) actual spectrum
(b) background subtracted spectrum
0
5
10
15
20
25
30
35
40
45
740 750 760 770 780 790 800
Wavelength(nm)
Intensity(a.u)
LOX
LN2
0
100
200
300
400
500
600
700 750 800 850 900 950
Wavelength(nm)
Intensity(a.u)
LOX
LN2
(a) (b)
RELEASED - Printed documents may be obsolete; validate prior to use.RELEASED - Printed documents may be obsolete; validate prior to use.