F/G 1/2 ACTIVE BEACON COLLISION AVOIDANCE LOGIC … · aa02 163 federal aviation administration...
96
AA02 163 FEDERAL AVIATION ADMINISTRATION TECHNICAL CENTER AT-ETC F/G 1/2 ACTIVE BEACON COLLISION AVOIDANCE LOGIC EVALUATION. VOLUME I. M TC(U) JUN 81 A AOKINS, Q BILLMANN, J THOMAS UNCLASSIFIED FAA-CT-80-51-1 FAA-RD-DO-125-1 NL EEEIIIIIEEE I .EE EEEEEIIIIIIIEEI EEIhiEEEiiEEEE IIIEIIIEIIIIEE IIIIIEEEEEEII EIIIEIIIIEIIII
Transcript of F/G 1/2 ACTIVE BEACON COLLISION AVOIDANCE LOGIC … · aa02 163 federal aviation administration...

AA02 163 FEDERAL AVIATION ADMINISTRATION TECHNICAL CENTER AT-ETC F/G 1/2
ACTIVE BEACON COLLISION AVOIDANCE LOGIC EVALUATION. VOLUME I. M TC(U)JUN 81 A AOKINS, Q BILLMANN, J THOMAS
UNCLASSIFIED FAA-CT-80-51-1 FAA-RD-DO-125-1 NL
EEEIIIIIEEE I .EEEEEEEIIIIIIIEEIEEIhiEEEiiEEEEIIIEIIIEIIIIEEIIIIIEEEEEEIIEIIIEIIIIEIIII

_~ ~ii t -11... ;. .... L VEL SFAA-CT-80-51-1
ACTIVE BEACON §OLLISION AVOIDANCELOGIC EVALUATION; "S
VOLUME t MODE C EQUIPPED (ATCRBS)., THREATPHASE.
.)- A, lAdkins ELECTE
B. Billmann JUL 29 1981J. Thomas DJ./Windle,E
FEDERAL AVIATION ADMINISTRATION TECHNICAL CENTERAtlantic City Airport, N.J. 08405
T TR4 4
0.2 IF
FINAL REPUT.
j/JUNB1------81-
/ -
Document s avadatlI, to vie U.S iubhlc through
the National Te(hr,,(al Ii tmation Service,SpringfieM, Virgini-i 22161.
_Prepared for
U. S. DEPARTMENT OF TRANSPORTATIONFEDERAL AVIATION ADMINISTRATION //'
Systems Research & Development ServiceWashington, D. C. 20590
29 014

.77
M I
NOTICE
This document is disseminated under the sponsorship ofthe Department of Transportation in the interest of
information exchange. The United States Governmentassumes no liability for the contents or use thereof.
The United States Government does not endorse productsor manufacturers. Trade or manufacturer's names appearherein solely because they are considered essential tothe object of this report.
k ii I I I ,m

Technical keport Documentation Page
1. Report No. 2. Government Accesion NO. 3 Recipient' Catalog No
FAA-RD-80-125-14. Title and Subtitle S Report 0 t
CTIVE BEACON COLLISION AVOIDANCE LOGIC EVALUATION: May@-981VOLUME 1, MODE C EQUIPPED (ATCRBS) THREAT PHASE 6 Per orming Organ t.on Code
ACT-220________________________________________________________ Peioflrng Organ zaron Repo, t No
7. Aithor's A. Adkins, B. Billmann,
J. Thomas, and J. Windle FAA-C'1-80-51-I9. Performing Organization Name and Address 10 Work Unit No (TRAIS)
Federal Aviation Administration
Technical Center II Contract or Grant No
Atlantic City Airport, New Jersey 08405 052-241-32013. Type of Report and Pe,od Co-red
1 12. Sponsoring Agency Name and Address
U.S. Department of Transportation FinalFederal Aviation Administration April 1979 - July I!8h..Systems Research and Development Service 14 Sponsor.g AgencyCode
Washington, D.C. 2059015. Supplementary Notes
146. Absttact
The purpose of this project was to evaluate and refine the April 1979 version of theBeacon Collision Avoidance System (BCAS) logic prior to Active BCAS prototype flighttesting. The April 1979 version of the BCAS logic added changes to support multipleaircraft resolution, conflict indicator register interfacing, and new surveillancefunction interfacing. The first phase of the evaluation was conducted from April 1979to September 1979. This phase evaluated logic performance against mode C equipped(ATCRBS) threats. The evaluation identified modifications which could improv, logicperformance. Interim improvements have been made to the vertical tracker. Themodifications improve a command sense choice logic performance for ATCRBS threats(by using greater dependence on current relative vertical position) 4) resolutionperformance (by modifying ATCRBS-threat sense choice logic), and (d vertical speedlimit (VSL) alarm performance. Generally, good protection was provided by the BCASlogic against abrupt horizontal maneuvers by ATCRBS threats. VSL alarms generatedufficient vertical separation when the BCAS aircraft's vertical rate was above 1,000
feet per minute. Below 1,000 feet per minute, tracker noise often resulted in atransition from VSL alarms to positive or negative BCAS maneuver advisories. Beforeproceeding to subsequent phases of the evaluation, large portions of the logicmodifications that were identified in this report became permanent algorithm-hanges.
17. Key Words 18. Distrbution Statement
ollision Avoidance Document is available to the U.S. publicNTCRBS through the National Technical Information%ircraft Separation Assurance Service, Springfield, Virginia 22161Fast-Time Encounter Generator
19. security Class.f. (of this report) 20. Security Clas,,. (of this page) 121.N° N o Pages 2. .r .
U ca sfe O F 0 -2e Uctionocolassifed _ath91 rze
Form DOT F 1700.7 (8-72) Reproduction of completed page authorized

TABLE OF CONTENTS
Page
INTRODUCTION IAccession For-
Purpose and Scope NTI. A&f IBackground DTIC TAB IObjectives Dna 1Phased Evaluation Concept Justification 2
SUMMARY OF RESULTS 3By
EVALUATION PROCEDURES Distribution/ 5
Availability CodesGeneral 5BCAS Performance Standards Avail and/or 5Logic Test and Software Control 5Description of Active BCAS 6
EVALUATION RESULTS FOR ATCRBS THREATS 8
Prerun Algorithm Analysis 8
BCAS PERFORMANCE AGAINST ATCRBS THREATS 9
Tracker Performance For Unequipped Threats 9Unequipped Intruder Sense Choice Logic Performance 21Vertical Acceleration Performance 32Advantages of Partial Positional Data 34Vertical Speed Limit Performance 38General Performance 55
CONCLUSIONS 64
Vertical Tracker Performance 68Sense Choice Logic 68Vertical Speed Limit Performance 68General Performance 69Advantages of Partial Positional Data 69
RECOMMENDATIONS 69
REFERENCES 70
APPENDICES
A - Description of The Fast-Time Encounte, GeneratorB - Chronological Review of Mode C Equipped (ATCRBS) Threat
Performance DeficienciesC - Active Beacon Collision Avoidance System (BCAS) Logic Implementation
iii
" * . . . .. . .

LIST OF ILLUSTRATIONS
Figure Page
1 COORD Logic Modification - Threat Track Data Block 10Initialization
2 DRACT Modification - Proper Threat Volume Selection 11
3 Magnitude of Separation Loss Due to Incorrect Sense Choice 14
4 Encounter Which Exhibits Poor ECAS Performance Due to 23Lack of Acceleration Modeling
5 Modified Unequipped Intruder Sense Choice Logic 25
6 Encounter Which Results in Negative Value of TESC 27
7 DRACT Modification - Negative TESC Values 28
8 Encounter Which Results in Conservative Vertical Miss 30Distance Projection
9 Encounter That Would Have the Alarm Filtered By Range 31
Project ion
10 Tail Chase Encounter Causing Incorrect Sense Choice in the 32Case of Unequipped Intruders
11 Altitude Versus Time Plot for Tail Chase Encounter 33
12 Geometry for Unequipped Intruder Vertical Acceleration 34Eva luat ion
13 Effects of the Time of the Intruder Vertical Maneuver on 35the Timing and Sense of Positive Commands
14 Command and Achieved Vertical Separation for Vertically 36Accelerating Intruders
15 Basic Geometry for Partial Positional Data Evaluation 37
16 Basic Geometry for VSL Evaluation 41
17 Vertical Rate Effects on VSL Performance for Vertical Rates 42Between 500 and 1,500 Feet Per Minute
18 Vertical Rate Effects on VSL Performance for Vertical Rates 42Between 2,000 and 4,000 Feet Per Minute
19 Crossing Angle Effects on VSL Performance for Descent 43Rate of 2,000 Feet Per Minute
iv

LIST OF ILLUSTRATIONS (Continued)
Figure Page
20 Crossing Angle Effects on VSL Performance with a High 43Vertical Rate (4,000 Feet Per Minute)
21 Horizontal Miss Distance Effects on VSL Performance 45
22 Velocity Effects on VSL Performance with a Vertical Rate 47
of 2,000 Feet Per Minute
23 Velocity Effects on VSL Performance with a Vertical Rate 47of 1,000 Feet Per Minute
24 DRACT Modification - VSL Display Time 48
25 Encounter Conditions for VSL Magnitude Study 50
26 Vertical Separation at CPA Using Original VSL Magnitude Set 50(500, 1,000, 2,000 Feet Per Minute)
27 Vertical Separation at CPA Using New VSL Magnitude Set 51(1,000, 2,000, 4,000 Feet Per Minute)
28 Basic Geometry for Horizontal Maneuver Evaluation 56
29 Vertical Separation for the High Speed Unequipped Intruder 58
30 Alarm Timing for the High Speed Unequipped Intruder 58
31 Offset Turn Rate Interaction Effect on Vertical Miss Distance 60(High Speed Threat)
32 Vertical Separation for the Low Speed Intruder 61
33 Alarm Timing For The Low Speed Unequipped Intruder 61
34 Offset Turn Rate Interaction Effect on Vertical Miss 62Distance (Low Speed Threat)
35 Basic Geometry for Linear Encounter Evaluation 63
36 Vertical Separation For Linear Encounters (Low Vertical Rate 64
for Unequipped Intruder)
37 Vertical Separation for Linear Encounters (High Vertical Rate 65for Equipped Intruder)
38 Vertical Separation for Linear Encounters (Low Vertical Rate 65for Equipped Intruder)
39 Basic Geometry for Parallel Vertical Maneuver Evaluation 66
v

LIST OF ILLUSTRATIONS (Continued)
Figure Page
40 Basic Geometry for Opposing Vertical Maneuver Evaluation 66
41 Vertical Separation for Parallel Vertical Maneuvers by an 67
Unequipped Threat
42 Vertical Separation for opposing Vertical M4aneuvers by an 67
Unequipped Threat
vi

LIST OF TABLES
Table Page
I Active BCAS Commands 7
2 Probability and Magnitude of Loss in Separation Due to Wrong 15Sense Choice (BCAS Aircraft Level - Unequipped IntruderClimbing (Descending))
3 Probability and Magnitude of Loss in Separation Due to Wrong 17Sense Choice (BCAS Aircraft Climbing - Unequipped Intruder
Level)
4 Probability and Magnitude of Loss in Separation Due to Wrong 17Sense Choice (BCAS Aircraft Descending - Unequipped IntruderLevel)
5 Comparison of Tracker Errors (Low Descent Rates) 19
6 Comparison of Tracker Errors (High Descent Rates) 20
7 Probability of an Incorrect Sense Choice and Magnitude of Loss 22in Separation (BCAS Aircraft Level)
8 Sequential BCAS Data for Vertical Acceleration Maneuver 39by the Unequipped Intruder
9 VSL Command Duration Comparison (BCAS Aircraft Climbing 52at 2,000 ft/min)
10 VSL Command Duration Comparison (BCAS Aircraft Climbing 53at 3,000 ft/min)
11 VSL Command Duration Comparison (BCAS Aircraft Climbing 53at 4,000 ft/min)
12 VSL Command Duration Comparison (BCAS Aircraft Climbing 54at 5,000 ft/min)
13 VSL Command Duration Comparison (BCAS Aircraft Climbing 54
at 6,000 ft/mmn)
vii

LIST OF ABBREVIATIONS AND ACRONYMS
ACAS - Airborne Collision Avoidance System
Altimeter Correspondence Error - The error due to improper mode C altitude encoding
Alpha- The altitude tracking weighting constant in an Alpha-Beta tracking system
ASA - Aircraft separation assurance
ATARS - Automatic Traffic Advisory and Resolution Service
ATC - air traffic control
ATCRBS - Air Traffic Control Radar Beacon System
ATCSF - Air Traffic Control Simulation Facility
BCAS - Beacon Collision Avoidance System
Beta - The altitude rate tracking weighting constant in an Alpha-Beta trackingsystem
CIR - Conflict Indicator Register
CSC - Computer Sciences Corporation I
DR&A - Data reduction and analysis
FTEG - Fast-Time Encounter Generator
g - Acceleration due to gravity, 32.16 feet per sec2
ID - Aircraft identification
IFR - Instrument Flight Rules
ILS - Instrument Landing System
IPD - Intruder positional data (proximity warning indication)
Mode C - Aircraft encoding altimeter capability
PPD - Partial positional data (proximity warning indication containing only rangeand altitude of threat)
VFR - Visual flight rules
VSL - Vertical speed limit
viii
2P.. : '.

LIST OF BCAS ALGORITHM TERMS
A Absolute altitude separation
ADOT Relative tracked altitude rate
ALIM Altitude threshold for choice of positive or negative commands
(470 feet)
ALPC Threshold for high altitude threat declaration (18,000 feet)
ALUH Threshold for ultrahigh altitude threat declaration (29,000 feet)
ASEPH High altitude threshold for choice of positive or negativecommands (670 feet)
ASEPU Ultrahigh altitude threshold for choice of positive or negative
command (770 feet)
CLMRT Assumed BCAS climb escape rate (16.67 feet per second)
CMDSAV Previous command selected array
Command Sense The vertical direction of a BCAS command
COMP Function The function in the coordination logic that forms the complement
of a threat message
CPA Closest point of approach
D Field Own maneuver intent field in the CIR
DESRT Assumed BCAS descent escape rate (-25 feet per second)
DMOD Modification distance applied to tracked range (0.1, 0.3, or I
nautical mile
DRACT Detection and resolution module
DRPFLG Flag indicating need to drop the command
EQ Flag indicating intruder is BCAS equipped
INDEX Performance level for selection of threat logic parameters
KHIT Intruder detection counter
MTENT Intruder's indicated maneuver intent
OWNTENT Own aircraft maneuver intent for specified threat
R Tracked range to intruder
RD Tracked range rate 4V ~ix

RZ Tracked relative altitude
RZD Tracked relative altitude rate
SLEVEL Performance level value received from air traffic control
TI Estimated delay time for responding to vertical speed limit
command
TAU Ratio of distance to rate of change
TAUR Modified range tau
TAUV Vertical tau (time to coaltitude)
TCUR Current time for internal clock
TCMD Time latest command was selected
TDC Time to establish climb escape rate
TDD Time to establish descent escape rate
TDROP Time without reported data to drop an intruder
TESC Anticipated maneuver time before closest approach
TRIACT Intruder tracking module
TROACT Own aircraft tracking module
TRTRU True range tau (-range/range rate)
TSSC Length of time of maneuvering at climb escape rate
TSSD Length of time of maneuvering at descent escape rate
TVPCMD Look-ahead time for altitude detection (40 to 45 seconds)
TVPESC Look-ahead time for altitude resolution (30 to 35 seconds)
TVI Time delay provision for response to commands (8 seconds)
TZ3 Time required to achieve assumed escape rate
VACCEL Assumed escape acceleration (8 feet per sec 2 )
V1 Calculated vertical rate (feet per second) for own aircraft toachieve vertical separation of ALIM feet at closet point of
approach
VLIM Selected magnitude of VSL
VMD Projected vetical miss distance
x

VSL Vertical speed limit command
ZDCLM Achievable climb rate
ZDDES Achievable descent rate
ZDINTYDINT Tracked intruder's velocity coordinatesXDINT
ZDOWN Tracked own altitude rate
ZINT Intruder tracked altitude
ZMPCLM Predicted vertical miss distance after climb command
ZMPDES Predicted vertical miss distance after descent command
ZOWN Tracked own altitude
ZPINT Predicted altitude for unequipped intruder
ZPOWN Predicted own altitude at CPA when TRTRU < 8 seconds
ZTHR Immediate altitude threshold used in threat detection (750 feet)
ZTHRH Immediate altitude threshold used in threat detection inhigh altitude airspace (850 feet)
ZTHRU Immediate altitude threshold used in threat detection inultrahigh altitude airspace (950 feet)
xi

INTRODUCTION
PURPOSE AND SCOPE.
This document describes the results of research conducted to evaluate the resolu-tion performance of the Active Beacon Collision Avoidance System (BCAS) logic(reference I). A fast-time simulation program was developed to generate paired andmultiple aircraft encounter scenarios and measure Lhe performance of BCAS againstunequipped encounters. The test bed that resulted, the Fast-Time EncounterGenerator (FTEG), provides the means of rapidly evaluating BCAS conflict resolutionperformance across a wide variety of conflict geometries, speeds, crossing angles,and experimental conditions. A description of the FTEG is presented in appendix Aof this report. The research reported in this document is not intended to replacelive flight testing of the Active BCAS logic. The research is directed towarddeveloping and validating improvements to the logic prior to the more expensive andtime-consuming flight testing. These fast-time evaluations also augment liveflight tests by providing a baseline performance standard against which Active BCASflight results can be compared.
The evaluation measures the performance of the Active BCAS collision avoidancelogic. More than 15,000 aircraft conflicts were simulated during all phases ofthe evaluation. Only the BCAS air-to-air coordination procedures were simulated:the BCAS/Automatic Traffic Advisory and Resolution Service (ATARS) logic interfaceswere not coded for this evaluation. Throughout the report the phrase, BCAScommand, is synonomous to BCAS maneuver advisory, own aircraft refers to the BCASequipped aircraft, and intruder refers to the threat aircraft.
BACKGROUND.
On three separate occasions, real-time simulations of BCAS logic have beenconducted at the Federal Aviation Administration (FAA) Technical Center using theAir Traffic Control Simulation Facility (ATCSF). The first two evaluated theimpact of the Full BCAS logic on the air traffic controller in two differentterminal air traffic control (ATC) environments. The terminal environmentssimulated were the Chicago (O'Hare) and Knoxville (McGhee-Tyson) terminal areas.The results of these simulations were reported in references 2 and 3. Thethird simulation in the ATCSF assessed the impact of an interim version of theActive BCAS on the controller in the Knoxville terminal area. The results of thisprototype testing are reported in reference 4. The interim Active BCAS logic wasalso used in the air carrier simulations conducted by Aeronautical Radio,Incorporated (reference 5).
OBJECTIVES.
The primary objective of the research documented in this report is to test andevaluate the performance of the new Active BCAS collision avoidance algorithmsagainst mode C equipped (ATCRBS) threats. Some other objectives of the researchare:
1. To assess the ability of BCAS to generate adequate separation in a mu'tipleencounter environment.
2. To identify scenario conditions which result in inadequate BCAS-generated
separation.
1'

3. To identify scenario conditions which cause BCAS to issue oscillating commandsequences.
4. To assess the impatt ,t realistic Active BCAS measurement errors on BCAS per-
S evd ,at etAS-t ,-rtAS , .),)rdinat ton procedures and BCAS-generated separation
iii ,. t,: .t Ah ,q,, ipped intruders.
4, * . imprv- ,ode efficiency.
&A I V,. . N !Oucted in four sequential phases.
..; .ppr a, to the overall logic evaluation.T,., iipped intruders (ATCRBS threats) is
S. rfi nat .on protocol logic for equipped.,' ni pr,, edures have to be checked prior
. -it ion logic. The division of the...... rr the updating of the collision
* Imdltner. Logic deficiencies detected.. . ... ng to the next phase. This limits
...* . ,,bsequent phases. The results of
is presented in this report. The.-1 !(1 subsequent volumes.
",.~t th.- evaluation activities assesses
* ii,.,-r -,rmance for unequipped intruders.-.&inst unequipped intruders in simple
:.-iIgnt to become progressively more com-,: 1! ineqipped intruder performance includes
,A- .Lr. ratt and the intruder are maneuvering
A L s ter WrIR) is not required to coordinateI mmm, I " a .- atvI t the CIR to properly locate and correlateA1 X ,,., >. ti i t. % tih e,ted to a thorough review.
hqViPPED IhRLAI PHASE. lhe second stage of the research investigates Active BCASperformance for BCAS equipped threats. The coordination logic must functionproperly in this stage. As in the initial phase, equipped intruder performance isfirst measured against simple linear encounters. The complexity is then increasedto include scenarios in which both aircraft are maneuvering vertically and/orhorizontal ly.
MULTIPLE INTRUDER PHASE. The error-free data analysis activities culminate inthis phase. In the multiple intruder phase, performance is measured in a twointruder (three aircraft) environment. The equipped status of the intruders isvaried so that all possible intruder equipment combinations are analyzed. Thisphase stresses the threat correlation and multiple aircraft conflict resolutionlogic. The results from all the phases form the basis for comparison of the errordegraded logic performance in the final phase.
2

ERROR DEGRADED PERFORMANCE PHASE. The final phase calls for the evaluation ofthe Active BCAS collision avoidance algorithm performance in an error-degradedenvironment. The logic input measures of altitude and range are degraded throughthe auto-regressive modeling of range measurement and own and intruder altitudemeasurement errors (reference 6). Additionally, the impact of delayed intrudertrack establishment and missing intruder track reports is analyzed. A sensitivitystudy identifies how these error characteristics affect the BCAS logic.
SUMMARY OF RESULTS
The vertical tracker within the Active BCAS logic is an a - B vertical tracker.During steady-state climbs and descents, the cyclic rate errors in the rate track-ing cycle caused the occasional incorrect command sense choices. That is, on theseoccasions, the maneuver sense selected did not provide as much separation as theopposite sense would have. The probability of incorrect command sense choice wasmost significant for own aircraft or intruder aircraft vertical rates below 1,500feet per minute (ft/min). A reduction in the $ parameter from 0.15 to 0.10 andsubsequently to 0.05 reduced the rate error magnitudes. Additions to the un-equipped intruder sense choice logic which places more emphasis on current relativevertical position rather than vertical rate, further reduced the probability ofincorrect sense choice. However, incorrect sense choices may still occur,especially when sense selection occurs during vertical accelerations by in un-equipped threat. A more responsive nonlinear vertical tracker being developed byLincoln Laboratories should provide for better intruder sense choice performanceduring periods of vertical acceleration by the unequipped threat.
Altitude-based parameters which identify performance level thresholds (ALIM, ZDTHR,and the set ZTHR, ZTHRH, and ZTHRU) are not always set properly. Logic changesidentified in this report will ensure that the thresholds in BCAS-to-BCAS conflictsrepresenting the larger threat volumes will be selected when two BCAS aircraft arein conflict but operating at different performance levels.
Several flaws were detected in the unequipped intruder sense choice logic. Thelogic does not allow for acceleration delay for a BCAS aircraft's response toa BCAS alarm. In determining projected vertical separation, following responseto the BCAS alarm, the unequipped sense choice logic assumes the 1,000-ft/min climb(-1,500-ft/min descent) escape rate can be obtaineo 8 seconds after the BCAS alarmindependent of the vertical rate of the BCAS aircraft at time of the alarm.Extensive logic additions to model response acceleration have corrected thisdeficiency.
The sense choice decision was based on an assumed descent escape rate of -1,500ft/min and a climb escape rate of 1,000 ft/min. This difference caused an im-balance in the sense choice logic. Descents were favored even when both aircraftwere level with BCAS above the intruder. For slow range rate geometries (near tailchase encounter condition), the BCAS aircraft could be more than 400 feet above theintruder (both in level flight) and still receive a descent command. This con-dition has been corrected by balancing the sense choice logic (resumed descentescape rate = climb rate = 1,000 ft/min) and by limiting the look-ahead time toclosest point to approach (CPA) in low range rate conditions.
3

Although intruder detection may occur quite early, the intruder may not be declareda threat until both range and altitude criteria are met. This can lead to threat
declaration occurring within 5 seconds of CPA when nearly sufficient altitudeseparation exists. This late threat declaration occasionally causes wrong sensechoices to occur because the anticipated time to CPA following maneuver response(TESC) is negative. Logic changes have been added which permit sense selectionbased on relative vertical position when TESC is negative.
Unnecessary alarms resulted when either the own or intruder aircraft was estab-lished in a descent or climb and more than 2-mile horizontal separation existed atCPA.
Although Active BCAS cannot project horizontal separation at CPA due to the lack ofbearing information, a projected range at the time of predicted coaltitude can beobtained. This logic has been added to eliminate some of the unnecessary alarmsthat occurred during the evaluation.
During some encounters with a vertically accelerating unequipped threat, smallvertical separations at CPA were observed. The incorporation of the nonlinearvertical tracker and the display of partial positional data (intruder rangeand altitude information) should reduce the severity of this problem.
Analysis of the vertical speed limit (VSL) command performance indicated sufficientseparation was generated with VSL commands when the BCAS aircraft's rate wasabove 1,000 ft/mmn. Logic changes were made so that VSL command magnitude couldnot change every logic cycle. Once a VSL magnitude is selected, it will remaindisplayed for a minimum of 5 seconds, the same minimum time period as any ofthe other alarms. Unnecessary VSL alarms occurred in the presence of largehorizontal miss distances at CPA. The occurrence of such alarms will be reducedwith the addition of the determination of projected range at predicted timeof CPA.
The current VSL magnitude set is 500, 1,000, and 2,000 ft/mmn. An investigationof the VSL magnitude set 1,000, 2,000, and 4,000 ft/mmn indicated that the BCASaircraft deviated less from its vertical profile but only at the cost of an in-crease in the number of transitions in the magnitude of the VSL alarms. As aresult, a change in the magnitude of the VSL alarms is not recommended.
once the previously noted logic deficiencies were corrected, an extensive analysisof the logic performance was made. In general, Active BCAS provided sufficientseparation from ATCRBS threats in level flight. Encounter resolution performance,when either or both aircraft were in constant rate climbs or descent, was good.Active BCAS performance was good against ATCRBS threats which began with realisticinitial separations and then made abrupt horizontal maneuvers. Separation assur-ance systems in general, and Active BCAS in particular, can provide only limitedprotection when intruders abruptly maneuver in the vertical plane. This isespecially true with the small initial vertical separations that can occur intoday's air traffic control system.
A chronology of logic deficiencies and the logic modifications required to correctthe deficiencies is presented in appendix B. The appendix refers the reader tospecific page numbers in this report where each logic deficiency is described in
4

detail. Throughout the report, use is made of BCAS algorithm terms as they existin the documented logic. The definitions of these terms are included in the listof BCAS algorithm terms.
EVALUATION PROCEDURES
GENERAL.
The evaluation of Active BCAS requires the interface of two highly interrelatedalgorithms. The first is the FTEG or simulation algorithm which operates in fasttime and performs the data reduction and reporting tasks. The second is the BCASor technological algorithm which represents the Aircraft Separation Assurance (ASA)System under evaluation. The description of the BCAS algorithm and interfacesoftware is summarized in appendix C. The FTEG controls the execution of the BCASalgorithm and several subprograms which model the flight profiles and aircraft asthey interact with BCAS. The FTEG supports the reconstruction of all encountersidentifying pertinent BCAS variables, commands issued, and aircraft positions on alogic cycle basis. These data specify the performance characteristics of BCAS fordefined scenario conditions and allow an evaluation based on a required set ofperformance standards. Recommendations are made for logic changes based on theencounter conditions which cause substandard BCAS performance.
BCAS PERFORMANCE STANDARDS.
The basic BCAS performance standards used in this evaluation were:
1. BCAS advisories, when followed, should generate separation between conflictingaircraft in a timely fashion to ensure at least 300 feet of vertical separation atthe closest point of approach. For conflicts with a single intruder, BCAS shouldnot reduce the already existing separation between aircraft at CPA.
2. A particular aircraft should not receive a set of contradictory commands. Thecommands should not oscillate (e.g., alternating CLIMB and DESCEND commands).
3. All conflicting aircraft (including multiaircraft encounters) should receivemutually consistent command sets. Commands issued to any one aircraft should becompatible with commands issued to other aircraft in the same conflict.
4. BCAS commands should not generate unnecessary separation. Aircraft which areproperly separated using controlled VFR separation standards should not receivecommands which require pilot action to increase separation.
LOGIC TEST AND SOFTWARE CONTROL.
The FTEG/BCAS test system software is resident on two separate peripheral memorydevices to facilitate BCAS logic evaluation and BCAS logic modification validation.One FTEG/BCAS test system is designated as the debug system. The debug systempermits the output of desired intermediate results of BCAS calculations to facil-itate functional debugging of the algorithm. Proposed logic modificationsresulting from the FTEG/BCAS simulations are initially implemented in the debugsystem for validation of the modified logic. The other FTEG/BCAS system reflectsthe current stage of the BCAS logic and is considered the working system. All BCAS
5

analytical efforts are supported by the FTEG/BCAS working system. No modificationsare implemented to the BCAS working system until the modification has been testedon the debug system and coordinated with the Systems Research and DevelopmentService (SRDS) and MITRE personnel.
Logic stages of the BCAS working system are chronologically stored on a peripheralmemory device to create a "history" of the BCAS working system. The BCAS workingsystem history enables the user to (1) identify the logic stage used in previousFTEG/BCAS simulations and (2) reconstruct previous simulations.
A formalized procedure adopted by the FAA Technical Center for modifying the BCASlogic was followed during the BCAS algorithm evaluation:
I. Identify problem area by utilizing the BCAS working system.
2. Document the problem.
3. Recommend solution by utilizing the BCAS debug system to ensure solutionefficiency.
4. Inform SRDS and MITRE via memorandum or a formal briefing of the problem andthe proposed solution.
5. Coordinate logic changes with SRDS and MITRE.
6. If SRDS and MITRE agree that a solution is necessary, but do not concur withthe proposed solution and do not provide an alternative solution, step 3 isexercised again.
7. If SRDS or MITRE suggest an alternative solution, step 9 is performed usingtheir solution.
8. If SRDS and MITRE concur with the recommendation, step 9 is performed withproposed solution.
9. Modify debug system to reflect proposed solution and perform simulations toensure the efficiency of the solution.
10. If the proposed solution efficiency is verified in step 9, the previous BCASworking system is stored and dated on the BCAS chronology memory device. Thecurrent working system is updated to create a new working system.
DESCRIPTION OF ACTIVE BCAS.
The BCAS algorithm uses range and altitude track data to detect all potentialconflicts. (Threat criteria are defined in appendix C.) The BCAS algorithm thenresolves the conflicts through the issuance of vertical commands. The sense of thecommand (climb or descend) is originally selected when an intruder aircraft entersthe own aircraft's protected zone. The sense calculation is dependent upon theBCAS equipage of the intruder and other scenario conditions and remains constantthroughout the sequence of commands generated by the BCAS algorithm to resolve theconflict. Once the sense of command is chosen, the type of command (positive,negative, or vertical speed limit) is selected. The list of available active BCAScommands is shown in table 1. Additionally, the BCAS aircraft maneuver responseused in the simulation is shown.
6

Before selecting the type of command, the resolution algorithm considers the pro-jected vertical miss distance at the closest point of approach, the projectedtime to closest point of approach (TAU), and the own aircraft's and intruder'saltitude rates.
TABLE 1. ACTIVE BCAS COMMANDS
Command Response Sense
Don't Climb If climbing - stop climbing; Descendotherwise continue current verticalprofile or descend.
Don't Descend If descending - stop climbing; Climbotherwise continue current verticalprofile or climb.
Climb Initiate climb maneuver. If currently Climbclimbing, increase rate of climb, if
possible.
Descend Initiate descent maneuver. If currently Descenddescending, increase rate of descent,
if possible.
Limit climb to If climb rate is above display limit Descend(5,000, 1,000, climb rate, reduce rate to displayed2,000 ft/min) rate. Otherwise, continue current
vertical rate or descend.
Limit Descent to If magnitude of descent rate is Climb(500, 1,000, 2,000 above displayed rate, reduceft/min) magnitude to displayed rate. Other-
wise, continue current vertical rate orclimb.
The BCAS command selected is a combination of the sense and type of command.Coordination of the maneuver intent is done to ensure command compatability betweenconflicting BCAS equipped aircraft. In the active BCAS logic evaluated here,this procedure makes use of the CIR to exchange aircraft identity and maneuverintent information between the conflicting BCAS equipped aircraft. The CIR wasalso created to coordinate conflict resolution when BCAS and ATARS coexist.When it is determined that a command is required due to a particular threat, theBCAS coordination logic ensures:
1. The new command is compatible with the previous entries in the CIR. Hence, thenew command and the commands already present in the CIR can all be simultaneouslyobeyed. The BCAS multiple aircraft logic may reselect the commands if necessary.
7
IL

2. The new command is compatible with the intruder aircraft's intent. Coor-dination is necessary to prevent own and intruder aircraft from choosing incom-patible maneuvers.
The coordination procedure is repeated every logic cycle for the duration of theencounter. Once compatible senses are selected, they will not change during theencounter unless an intruder is dropped or a new one is added. Whenever more thanone threat exists for own aircraft, the multiple aircraft logic may reselect theBCAS command. The multiple aircraft logic will generate positive commands if theBCAS aircraft is the top or bottom aircraft in a multiple aircraft conflict. Ifthe BCAS aircraft is not the top or bottom aircraft, the multiple aircraft logicchanges any positive command to a negative command.
EVALUATION RESULTS FOR ATCRBS THREATS
The evaluation of Active BCAS performance for ATCRBS threats began in June 1979.This evaluation activity lasted 4 months. Deficiencies in logic detected in theearly stages were corrected before obtaining general measures of BCAS performancefor ATCRBS threats.
PRERUN ALGORITHM ANALYSIS.
A preliminary analysis of the baseline collision avoidance logic (reference 1) wasmade prior to beginning the evaluation phases. This analysis identified severalspecific problems in the documentation of the original logic. The problems weredescribed in several memoranda. All logic documentation problems were resolvedprior to beginning the first evaluation phase. The revisions of the documentationdescribing the collision avoidance logic permitted a more highly controlled base-line logic to exist.
At the end of this prerun analysis period, a list of the unresolved logic problemswas prepared. This list was used to identify where the test and evaluationcollision avoidance logic differed from the logic described in reference 1.
One difference in the evaluation logic was the coding of the COMP function. TheCOMP function is found in the coordination logic, COORD, and is used (1) to formthe CIR D Field (or DRACT OWNTENT) array complements and (2) to set the complementbit. The following coding was used in the evaluation logic to support the COMPfunct ion:
IF CMDTRT(i) = 10 bit complemented Threat message i = 1,2,...,10
then
CMDTRT(i) = Threat message bit i i = 1,2 .... 6,8,9
the sense bit,
8
Al _K.J Q

CMDTRT(7) =jThreat message bit (7) -11
and complement flag bit
CMDTRT(10) = 1.
This coding of CMDTRT (the complemented threat message) was consistent with threatmessage format requirements in other coordination logic modules such as RCV andCOMPATIBLE.
Another addition to the reference 1 logic that was made prior to the evaluationtests was the initial entry of the threat track block ATCRBS data into the CIR.Figure 1 presents the addition in the COORD module to initiate the threat block.
The last modification in the evaluation logic and the logic documented in referenceI was the location of the logic which set the high and ultrahigh altitude perform-ance level parameters. For a pair of aircraft which are both BCAS equipped, thethreat volume must be set to the larger of the two individual threat volumes ofthe aircraft in the pair. The baseline logic would not permit this since thespecial threat volume parameters would be set in the own aircraft tracking moduleTROACT. This module has no knowledge of intruder altitude. To offset thisproblem, the setting of the high altitude and ultrahigh altitude threat volumeparameters was moved to DRACT, the detection and resolution module. Since thethreat altitude ZINT is available in this module, the size of the threat volumecould properly be set to the larger of the two individual threat volumes. Thelogic to support this evaluation system change is shown in figure 2. All prerunalgorithm changes eventually became permanent modifications to the baseline logic.
BCAS PERFORMANCE AGAINST ATCRBS THREATS
The description of Active BCAS performance against ATCRBS threats is divided intosix major areas:
1. Tracker Performance for Unequipped Threats2. Unequipped Intruder Sense Choice Logic Performance3. Vertical Acceleration Performance
4. Advantages of Partial Positional Data5. Vertical Speed Limit Performance6. General Performance
Logic deficiencies discovered during testing in one area were corrected prior to
proceeding with subsequent testing.
TRACKER PERFORMANCE FOR UNEQUIPPED THREATS.
The vertical tracker algorithm outlined in MITRE's April 1979 version of the ActiveBCAS logic (reference 1) was evaluated in detail from May through July 1979.Errors associated with the vertical rate tracker had an adverse impact on conflictresolution involving unequipped aircraft. Problems resulting from poor trackerperformance were identified and briefed to SRDS (ARD-242) and MITRE Corporation.In August 1979, MITRE Corporation released a memorandum detailing modifications to
9

- 'IA I T',A I
FIGURE 1. COORD LOGIC MODIFICATION -THREAT TRACK DATA BLOCK INITIALIZATION
10
-4w

THREAT YESEQUIPPED
NO
I ADDITION
FIGRE .DACTH MOIIAIN LPOPER ZTHREA VOUESEETO
11HR

unequipped intruder logic and a change in the B parameter for the vertical tracker.
Tracker performance was reevaluated and the changes outlined by MITRE Corporationwere incorporated. The modification resulted in an improvement in BCAS conflictresolution performance. The residual tracking errors that were of sufficient
magnitudes to cause an incorrect sense choice did not cause a serious reduction in
separation.
VERTICAL TRACKER PERFORMANCE (APRIL 79 LOGIC). The vertical tracker (described inreference 1) provides good vertical position information for threat detection;however, it provides poor vertical rate estimates. The vertical position and ratetracker error magnitudes and the sequential characteristics of the a - B trackerwere obtained. Characteristics of the vertical tracker (a = 0.4 and 8 0.15) are:
I. The a - B vertical tracker had been optimized for a 4.7-second update rate.Active BCAS update rate is 1 second.
2. Vertical position and rate tracker error magnitudes are dependent on the rateof mode C change. Tracker performance generally improves as the rate increases.Improvements also occur with a consistent pattern of mode C changes.
3. Projected vertical positions are based on the vertical rate estimates.
4. The vertical rate estimate oscillates around 0 feet per-second (ft/sec) afterleve l-off.
Performance of the a - B vertical rate tracker used in TRIACT and TROACT wasanalyzed by inputting error-free mode C data. The pure mode C inputs representedreports from an aircraft established in a constant rate climb or descent. The datarate was one per second. The tracking procedure was initialized with the truealtitude. Vertical position and vertical rate estimates were obtained once thetracker had stabilized.
Generally, the BCAS logic uses a 30- or 35-second projection of vertical positionto determine sense of maneuver for unequipped intruders. The sequential error invertical position projection at time t, E(t), was calculated as follows:
E(t)=(A(t)-B(t))+35*(A(t) -B(t))
where
E(t) = error in the projected vertical position
A(t) = true altitude at time t
A(t) = true vertical rate at time t
B(t) = BCAS tracked altitude at time t
A(t) = BCAS tracked vertical rate at time t
For a contant vertical rate of -500 ft/min, the period of the error function is 12seconds. The period P, in seconds, is calculated as follows:
P = 60*(0O0/Rate)
12

where the rate is in ft/min. The period of the error function represents the timebetween changes in the mode C reports for constant rate climbs or descents. Thesequential errors in vertical position projection range from -421.7 to 485.6 feet.Fifty-eight percent of the time the error magnitude exceeds 300 feet.
For a constant rate of -1,000 ft/min, the period of the error function is reducedto 6 seconds. Errors as large as 539 ft/min are observed in the tracked rate.The magnitude of the projected altitude error exceeds 300 feet eighteen percent ofthe time. In general, rate tracker performance improves as the magnitude of thetrue rate increases; however, the consistency of the changes in the mode C altitudealso affects the rate estimate. A ve-ical rate of -3,000 ft/min results in aconsistent mode C altitude change every ,ther second and a maximum projectedaltitude error of only 118 feet. The perfor:rance for a -3,900-ft/min rate de-creases due to inconsistent changes in the mode . altitude. Although the magnitudeof the rate has increased, the loss in consistency of the changes in the mode Caltitude causes the maximal error in projected vertical position error to exceed300 feet (almost 3 times the maximal error for a -3,000 ft/min rate). An idealvertical tracker would provide for cases where the change in the mode C altitudeis not consistent even though the vertical rate is constant.
Once the dynamic characteristics of the current tracked altitude and altitude ratewere obtained, their impact on the resolution logic was analyzed. The major impactfound was that sense determination logic for unequipped intruders used trackervertical rate to determine the sense of maneuver. The errors in the vertical rateestimate can cause the incorrect sense to be chosen. The regions of incorrectsense choice and the loss in separation that result because of that incorrectchoice have been identified.
The effect thaL the error in projected vertical position has on BCAS resolutionperformance was analyzed in two phases. First, the probability of an incorrectsense choice due to the vertical tracker errors was calculated. The probabilitieswere calculated for various combinations of true vertical rate and planned verticalmiss distance. The vertical rates ranged from 500 to 2,000 ft/min. The plannedvertical miss distance ranged from -600 to +600 feet. The probabilities weredetermined from the portion of time that the magnitude of the rate errors in thetracking cycle caused the projected vertical position error to be large enough tocause the wrong sense to be selected. The sense choice logic used was the logicfound in reference I as shown in figure 2-3(d) of MTR 79W00110. The second phaseof the analysis identified the impact of an incorrect sense choice on the resultingseparation. For minimal planned vertical separation (200 feet), the probability ofincorrect sense choice is quite high (0.50). However, when planned verticalseparation at CPA is small, an incorrect sense choice does not reduce the resultingvertical separation at CPA. The largest impact caused by an incorrect sense choiceoccurs for higher values of planned vertical separation (400 to 600 feet).
In the first configuration analyzed, the BC.q aircraft was in level flight, andthe intruder's vertical rate ranged from -2,000 to -500 ft/min and from 500 to2,000 ft/min. A negative value of planned vertical miss distance implies the air-craft would be coaltitude before CPA occurred. The response to positive commandsby the BCAS aircraft was identical to the modeled responses in the sense choicelogic for unequipped intruders in reference 1. Figure 3 depicts the loss inseparation that occurs with incorrect- sense choice. The probability of wrong sensechoice and the resulting loss in separation for this case is shown in table 2. The
1 3
~- q

0
-z Lf
Zc- ) zcjn
C)
cj -ICL4
LZZZ
0. PR
L) -o
,4
14

TABLE 2. PROBABILITY AND MAGNITUDE OF LOSS IN SEPARATION DUE TO WRONG
SENSE CHOICE (BCAS AIRCRAFT LEVEL - UNEQUIPPED INTRUDERCLIMBING/DESCENDING)
Intruder Vertical Planned Vertical Separation (Magnitude of Loss)Rate (ft/min) - 500 ft (325 ft) - 400 ft (125 ft) + 300 ft (150 ft)
500 0.22 0.24 0.07
600 0.09 0.27 0.11
700 0 0.18 0.07
800 0 0.09 0.07
900 0 0.04 0.04
1,000 0 0 0.02
1,500 0 0 0
2,000 0 0 0
-500 0.16 0.31 0.16
-600 0.18 0.31 0.02
-700 0.04 0.16 0
-800 0.07 0.20 0
-900 0.09 0.11 0
1,000 0.02 0.18 0
1,500 0 0.02 0
1,700 0 , 0.18 0
2,000 0 0 0
NOTE: Vertical Rate Tracking Constant B = 0.15
15
4"

magnitude of the loss in separation for a fixed value of planned vertical separa-tion is shown in parentheses. Since the intruder is unequipped and the BCASaircraft is initially in the level flight, the magnitude of loss is independent ofthe inruers vertical rate.
The results in table 2 show that loss occurs with climb rates as high as 1,000ft/mmn. For the lower climb rates and negative planned vertical separation, theprobability of incorrect choice exceeds 0.20. Since the sense choice logic favoreddescent commands, the probability of incorrect sense choice extends over a widerrange in the presence of a descending intruder. With -400 feet of planned verticalseparation, an intruder descent rate as high as -1,700 ft/mmn results in a 0.18probability of incorrect sense choice.
For the second configuration analyzed, the BCAS aircraft was climbing toward thelevel-flight unequipped intruder. A negative planned vertical miss distanceimplies that the BCAS aircraft would have climbed through the intruder's altitudeand would have been above the intruder at CPA. The BCAS aircraft responded tocommands as indicated in the response model in the unequipped intruder sense choicelogic. Table 3 presents the results of the analysis.
Review of table 3 data shows that the impact of wrong choice in sense due to thetracker performance is restricted to low vertical rates (800 ft/mmn). In severalcases, the probability of wrong sense choice is significant. With a plannedvertical separation of -500 feet, and the equipped aircraft climbing at 500 ft/mmn,the wrong sense would be selected 25 percent of the time resulting in a loss of 325feet in vertical separation. The response model in the unequipped intruder sensechoice logic assumes that the commanded escape rate is obtained 8 seconds aftercommand display regardless of the BCAS aircraft' s vertical rate at time of commandpresentation. Therefore, the loss of vertical separation is independent of theBCAS aircraft's vertical rate.
In the last configuration analyzed, the BCAS aircraft was descending toward thelevel-flight unequipped intruder. The equipped aircraft response to commands wasthe same as that modeled in the unequipped intruder sense choice logic. The re-sults presented in table 4 are almost identical to the results for the climbing,equipped aircraft.
Another problem with the vertical tracker is that after an aircraft levels off, thetracked vertical rate continues to oscillate around zero ft/mmn. The magnitude ofthe oscillations is dependent on the previous rate. Although the magnitude of theoscillations are continually decreasing, nonzero measurements of the vertical ratewill continue. The oscillations frequently cause the selection of VSL alerts when,in fact, the own aircraft is in level flight.
The final problem with the vertical tracker is associated with high verticalrates (greater than 2,000 ft/mmn). Initially, the tracker performs quite well.The problem is that, once a BCAS aircraft responds to commands and reduces itsvertical rate, the tracker overshoots the reduction which causes the algorithm tosense a miss (KHIT not updated). As a result, the commands are terminated early,only to reoccur once the tracker approximates the new rate.
Cases with wrong sense choice generally result in a reduction in resulting separa-tion. The following discussion identifies the vertical rate regions in which thisoccurs. Tracker deficiencies on resolution logic are:
16

TABLE 3. PROBABILITY AND MAGNITUDE OF LOSS IN SEPARATION DUE TO
WRONG SENSE CHOICE (WAS AIRCRAFT CLIMBING - UNEQUIPPED
INTRUDER LEVEL)
Equipped AC Planned Vertical Separation (Magnitude of Loss)
Rate (ft/mmn) -500 ft (325 ft) -400 ft (125 ft) + 300 ft (150 ft)
500 0.25 0.31 0.18
600 0.11 0.23 0.09
700 0 0.22 0.09
800 0 0.13 0.04
900 0 0.07 0
1,000 0 0 0
1,500 0 0 0
NOTE: /3=0.15
TABLE 4. PROBABILITY AND MAGNITUDE OF LOSS IN SEPARATION DUE TOWRONG SENSE CHOICE WBAS AIRCRAFT DESCENDING - UNEQUIPPEDINTRUDER LEVEL)
Equipped AC Planned Vertical Separation (Magnitude of Loss)
Rate (ft min) -400 ft (350 ft) -300 ft (500 ft) + 400 ft (125 ft )+500 ft (325 ft)
-500 0.04 0.11 0.24 0.04
-600 0 0.09 0.20 0.06
-700 0 0 0.16 0.04
-800 0 0 0.18 00
-900 0 0 0.11 0.04
1,000 0 0 0.18 0
1,500 0 0 0 0
2,000 0 0 0 0
NOTE: /3-0.15
17

cases with wrong sense choice generally result in a reduction in resulting separa-tion. The following discussion identifies the vertical rate regions in which thisoccurs. Tracker deficiencies on resolution logic are:
1. Vertical position projections for unequipped intruders cause incorrect sense
choices which reduces resulting separation.
2. Probability of wrong sense choice is high at low vertical rates.
3. Incorrect sense choice has largest impact on higher values of planned verticalseparation (400 to 600 feet).
4. Oscillation in the rate estimate after level-off cause noneffective VSL alarms.
This analysis resulted in the recommendation that the performance of the verticaltracker be improved, especially at lower vertical rates. Parameter adjustment mayimprove tracker performance. If improvement does not occur, tradeoff in perform-ance between the position tracker and rate tracker could also be analyzed. How-ever, it may be necessary to develop a dynamic vertical rate tracker - one thatwould vary the tracking parameters based on the mode C altitude change history. Infact, a very simple improvement in sense choice logic might be to use the mode Caltitude change rate to approximate the vertical rate. This rate would be based onmore than a single second of data.
IMPROVED VERTICAL TRACKER PERFORMANCE (AUGUST 1979 MODIFICATION). In MITRE letterW46-0532 dated August 10, 1979 (reference 7), MITRE Corporation modified theunequipped intruder sense choice logic and reduced the 03 parameter from 0.15 to0.10 to tighten the tracker and reduce tracker noise-induced problems. The ver-tical tracker was reevaluated with the new logic and 03 parameter. The ai- Overticaltracker performance was again characterized in terms of the vertical position andrate tracker error magnitudes. The procedure that was used in the previousevaluation was repeated. The new tracker parameters are: a-=0.4; 0= 0.10. Table 5depicts tracker performance for constant vertical rates of -500 and -1,000 ft/mmnfor both j3 parameter values. For a 03 value of 0.15, the sequential errors invertical position projection ranged from -422 to 486 feet with the error magnitudegreater than 300 feet 58 percent of the time. A significant improvement isobserved when the new value of 03 = 0.10 is used. The sequential errors in verticalposition projection varied from -330 to 280 feet with the error magnitude greaterthan 300 feet only 8 percent of the time. For a constant vertical rate of -1,000ft/mmn and a 03 value of 0.15, the sequential errors in the position projectionrange from -345 to 203 feet with the error magnitude greater than 300 feet 17percent of the time. For a 03 value of 0.10, the sequential errors in the positionprojection ranged from -233 to 107 feet. The error magnitude never exceeded 300feet and only exceeded 110 feet 17 percent of the time.
Table 6 compares the tracker performance for vertical rates of -3,000 and -3,900ft/mmn. As in the previous analysis, tracker performance generally improves as themagnitude of the true rate increases. However, inconsaistency in the change rate ofthe reported mode C altitude decreases tracker performance. At a rate of -3,000ft/mmn, the mode C altitude changes every 2 seconds. At a rate of -3,900 ft/mmn,the mode C altitude changes in an inconsistent pattern averaging 1.54 seconds be-tween changes. The new 0 value cannot eliminate this phenomenon; however, themaximal error has been reduced. For a rate of -3,000 ft/mmn, the previous maximumprojected error of 118 feet is reduced to 87 feet. For a rate of -3,900 ft/mmn,the maximum projected error of 326 feet is reduced to 204 feet.
18

a~ co -7 Go 4 1- 0. co
N 04
41 CM
E- 3141 s.2 0 -107N C N - . 0
40
0
'D. 0 c N C 4 4
00 M0 0. w N .
0 1 r MC1 M MPO - .. ).
0 1
0419

0- 1 1 0 Ic
C6
-0 4)4
0
I-. Lw C . 1
91 C . - 0 0 N - C N
0 4 -0 0 C0 -0 0 0 0 N
)k CL
02

The impact of the new tracking parameter on conflict resolution performance wasreevaluated using the new unequipped intruder logic defined in reference 7.Results are compared to the results obtained with the previous unequipped intruderlogic (reference 1) and B value of 0.15. The probability of an incorrect sensechoice due to vertical tracker errors was calculated for various combinations oftrue vertical rate and planned vertical miss distance. The intruder vertical ratesranged from 500 to 2,000 ft/min. The planned vertical miss distance ranged from-800 to +800 feet. The probabilities were obtained by determining the percentageof time the projected vertical position error was large enough to cause the wrongsense to be selected. Since the unequipped sense choice logic was modified byreference 7 to include an acceleration model of the own aircraft's delay in achiev-ing the desired escape rate, a direct comparison for 0=0.1 versus B=0.15 is onlyavailable when the BCAS aircraft is level. This comparison is summarized in table7. A review of table 7 shows that the probability of incorrect sense choice hasbeen significantly reduced, but not eliminated. The probability of incorrect sensechoice is 0.27 when the intruder is climbing at 500 ft/min and the BCAS aircraft is300 feet above the threat at CPA. The high incidence of incorrect sense choiceoccurs because the sense choice logic assumes a minimum 1,500-ft/min descent escaperate, but only a 1,000-ft/min climb escape rate by the level-flight BCAS aircraft.
UNEQUIPPED INTRUDER SENSE CHOICE LOGIC PERFORMANCE.
The original sense choice logic for unequipped intruders models both a BCAS climbresponse and a BCAS descent response. The sense of maneuver selected is thatmaneuver which provides the larger separation. Although the concept of modelingboth a climb and descent maneuver seems promising, the unequipped intruder sensechoice logic (reference 1) contains several flaws which result in poor or marginalseparation performance. Each of the problem areas is discussed in detail. Ex-amples are included to show the impact of the deficiencies in the sense choicelogic. Logic improvements provided to SRDS and MITRE to address specific problemareas are reviewed.
The mathematical terms used in the discussion of the unequipped intruder sensechoice logic deficiencies conform to the variable names used in list of BCASalgorithm terms.
LACK OF ACCELERATION DELAY IN THE SENSE CHOICE MODEL. A difficulty arises in theselection of sense for unequipped intruders when the own aircraft's vertical rateis high, the intruder's vertical rate is near zero, and the planned verticalseparation is large in the negative sense (1planned vertical separationl>750 feet).As before, negative values of planned vertical miss distance imply the verticaltracks cross prior to CPA.
Figure 4 presents an encounter geometry that causes the original BCAS logic toselect the sense of maneuver which results in marginal performance. The BCASaircraft is initially above the unequipped level-flight intruder. Without BCASinteraction, the BCAS aircraft would pass 1,300 feet below the intruder at CPA.The proper sense choice is "descend"; however, the original BCAS logic causes a"climb" command to be issued resulting in a loss of existing separation.
The example geometry causes the sense of maneuver to be selected 37 seconds priorto CPA. At this time ZINT-ZOWN = 1,171.63 feet. The original sense choice logicpresames that the current tracked BCAS aircraft's vertical rate, ZDOWN, continuesfor an additional 8 seconds. At this time the vertical escape rate (16.67 ft/sec
21

TABLE 7. PROBABILITY OF AN INCORRECT SENSE CHOICE AND MAGNITUDE OF LOSS INSEPARAT ION
BCAS Aircraft Level
Planned Vertical Separation at CPA (Magnitude of Loss)Intruder -500 ft (325 ft) -400 ft (125 ft) + 300 ft (15Oft)Rate (ft/min) 0 = 0.15 0- 0.10 8 = 0.15 S= 0.10 8= 0.15 0 = 0.10
500 0.22 0.00 0.24 0.00 0.07 0.27
600 0.09 0.00 0.27 0.00 0.11 0.18
700 0.00 0.00 0.18 0.00 0.07 0.09
800 0.00 0.00 0.09 0.00 0.07 0.04
900 0.00 0.00 0.04 0.00 0.04 0.04
1,000 0.00 0.00 0.00 0.00 0.02 0.00
1,500 0.00 0.00 0.00 0.00 0.00 0.00
2,000 0.00 0.00 0.00 0.00 0.00 0.00
-500 0.16 0.00 0.31 0.07 0.16 0.00
-600 0.18 0.00 0.31 0.09 0.02 0.00
-700 0.04 0.00 0.16 0.04 0.00 0.00
-800 0.07 0.00 0.20 0.07 0.00 0.00
-900 0.09 0.00 0.11 0.00 0.00 0.00
-1,000 0.02 0.00 0.18 0.00 0.00 0.00
-1,500 0.00 0.00 0.02 0.00 0.00 0.00
-1,700 0.00 0.00 0.18 0.18 0.00 0.00
-2,000 0.00 0.00 0.00 0.18 0.00 0.00
22

360 KNOTSDESCEIDING AT -4000 FT/MIN
LNEQUIPPED INTRUDER N
\KYPLANNED VERTICAL SEPARATION-1300 FEET
FIGURE 4. ENCOUNTER WHICH EXHIBITS POOR BCAS PERFORMANCE DUE TO LACK OF
ACCELERATION MODELING
for climbs or -25 ft/sec for descents) is assumed to have been achieved. The timedelay to achieve the escape rate in response to commands is fixed at 8 seconds.The time delay is not dependent on the amount of change in rate that is required toachieve the modeled response. In the example cited, the descent rate is -66.67ft/sec (a nominal rate for high performance aircraft). The sense choice logicassumes that a 16.67-ft/sec climb can be established in 8 seconds. A nominal5-second pilot response delay requires that the average acceleration rate exceeds0.8 g to achieve the modeled response.
When command sense selection occurs, the BCAS variable values which result in theclimb choice are:
ZDOWN = -63.92 feet/second (tracking error of 2.75 feet/seconds)
ZDINT = 0 feet/second
TRTRU = 37.36 seconds
TVPESC = 35 seconds
TVI = 8 seconds
TESC = 35-8 = 27 seconds
The modeled climb separation using these values is:
ZMPCLM = ZINT - ZOWN - TV1*ZDOWN - TESC*ZDCLM
- -1,171.63 - 8*(-63.92) - 27*(16.67)
23

- -1,110.36 feet.
Similarly the modeled descent separation is:
ZMPDES = ZINT - ZOWN - TVI*ZDOWN - TESC*ZDDES
- -1,171.63 - 8*(-63.92) - 27(-63.92)
= 1,065.57 feet.
Because I ZMPCLMj >IZMPDESI the climb sense was selected.
To address the problem o a fixed response delay independent of the magnitude ofthe response, MITRE Corporation developed a new unequipped intruder sense choicelogic which includes an acceleration model. The logic modification is shown infigure 5. For the example shown in figure 4, the new logic will result in thefollowing calculations:
ZDCLM = 16.67 feet per second
ZDDES = -63.92 feet per second
TDC = Time to establish climb escape rate = 8+(16.67+63.92)/8= 18.07 seconds
TDD = Time to establish descent escape rate = 8+(63.92-63.92)/8= 8 seconds
TSSC = Time of maneuvering at climb escape iate = TRTRU-TDC= 19.29 seconds
TSSD = Time of maneuvering at descent escape rate = TRTRU-TDD= 29.36 seconds
Using these new values and the new model which includes acceleration delays, themodel climb separation becomes:
ZMPCLM = ZINT - ZOWN - TDC*ZDOWN - TSSC*ZDCLM - 4*(TDC - TVl) 2
= -1,171.63 - 18.07 (-63.92) - 19.29(16.67) - 4(10.07)2
= -743.78 feet
The modeled descent separation becomes:
ZMPDES - ZINT - ZOWN - TDD*ZDOWN - TSSD*ZDDES + 4*(TDD - 8)2
ZMPDES - -1,171.63 - 8*(-63.92) + (-29.36)*(-63.92)+4(0)2
- 1,216.42 feet
Since ZMPDESI >IZMPCLMI, the proper descent sense is selected.
PROJECTIONS OF VERTICAL POSITION WHEN TESC IS NEGATIVE. TESC is the anticipatedtime of maneuver prior to CPA. The original unequipped intruder sense choice logic
24

I ','I' IV
N. ~ ~ C F1 IXrT
J II 1 INNA
.12 IN~ [N"! 1N
"I VI I~N- II
1 [ 7 I -I%' SI NRI rV !N
."!''21 iN k
FIGURE 5. MODIFIED UNEQUIPPED INTRUDER SENSE CHOICE LOGIC
25

does not consider the impact of negative values of TESC. An intruder may not beinitially declared a threat until it is within 5 seconds of minimum range; i.e.,-R/RD is less than 5 seconds.
TESC is calculated as follows:
TESC = MIN (TRTRU, TVPESC) - TVI
where:TRTRU = -R/RD <5 seconds
TVPESC = 25 seconds
and the response delay parameter TVI = 5 seconds
As a result TESC = TRTRU - 5 seconds, which is negative. IThis discrepancy leads to the wrong choice of command sense. Initially, it wasthought that TESC<O could only occur for late intruder track initiation caused bypopup threats, own aircraft exiting performance level 2 areas, or by high horizon-tal accelerations by both aircraft. Further analysis, however, has identified awide range of highly likely encounter geometries in which intruder track initiationoccurs quite early but still results in negative values of TESC and incorrect sensechoice.
Sense choice logic is only exercised when KHIT is first updated, that is, when thefirst hit is declared. An intruder can penetrate threat volume (TAUR<25), butunless VMD <750 feet, a miss is declared and sense selection is delayed. Thelikely geometries which result in negative values of TESC include own aircraftlevel and intruder descending from above so as to pass above own aircraft with theplanned vertical miss distance near ZTHR (750 feet). Figure 6 presents an exampleof such an encounter.
Initially, the intruder penetrates the threat volume (TAUR<25) 11 seconds prior toCPA. However, since VMD remains greater than 750 feet, threat declaration does notoccur until 2 seconds prior to CPA. At this time, command sense is determined. Bynow TRTRU = 0.19/0.04 = 4.75 resulting in TESC = 4.75 - 8 = -3.25 seconds. On this
logic cycle, ZDINT = -70.99 feet/second and ZDOWN = 0 feet/second, ZOWN = 9,200feet and ZINT = 10,223 feet. This causes the modeled climb separation to be cal-culated as follows:
ZMPCLM = 1,023.73 feet + TRTRU*ZDINT - TVI*ZDOWN - TESC*CLMRT
= 1,023.73 feet + 4.75*(-70.99) - 8(0) - (-3.25)(16.67)
= 740.7 feet
The modeled descent separation is calculated as:
ZMPDES = 1,023.73 + TRTRU*ZDINT - TVI*ZDOWN - TESC*DESRT
= 1,023.73 + 4.75*(-70.99) - 8(0) - (-3.25)(-25)
= 605.3 feet
26

UNEQUIPPED INTRUDER360 KNOTS
DESCENDING AT 4000 FT/MIN (-66.67 FT/SEC)
" - -PLAN NED VERTICAL
SEPARATION AT CPA750 FT
HORIZONTAL MISS DISTANCE360 KNOTS 30 FTS.C
LEVEL FLIGHT
80-51-5
FIGURE 6. ENCOUNTER WHICH RESULTS IN NEGATIVE VALUE OF TESC
Since IZMPCLMJ > IZMPDESJ , the sense for own aircraft is set for a climb (don'tdescend) even though the intruder will remain above. The next logic cycle, VMD >750 feet and KHIT is not updated. On the following cycle, 470 feet < VMD < 750feet causes the incorrect negative command, don't descend, to be selected.
The ability to establish a response to a BCAS command with less than 8 seconds tominimum range is questionable. As a result, no response should be modeled by thelogic. Sense choice should be based on the projected vertical miss distance usingthe current own and intruder vertical rates. The logic shown in figure 7 has beenadded to prevent incorrect sense choice when TESC < 0. This logic (shown in figure
7) assumes that no response occurs because the aircraft are 8 seconds or less fromthe closest point of approach. As a result, sense choice is based strictly onprojected vertical position in TRTRU seconds.
Sense selection based on this method results in an increase in the vertical missdistance if the BCAS aircraft responds to the command. When the new logic change
shown in figure 7 is used to determine sense for the example cited in figure 6,
then:
ZPOWN = 9,200 feet + 4.75(0) = 9,200 feet
ZPINT = 10,223 feet + 4.75(-70.99 feet) = 9,885.8 feet
and since ZPOWN < ZPINT, the correct descent (no climb) sense is selected.
CONSERVATIVE PROJECTIONS (UNDERESTIMATION) OF VERTICAL MISS DISTANCE. A char-acteristic of good BCAS performance is the detection of conditions which require
27
-- JS, .. "I... ... . .. i [. ...... . iII...I .. .
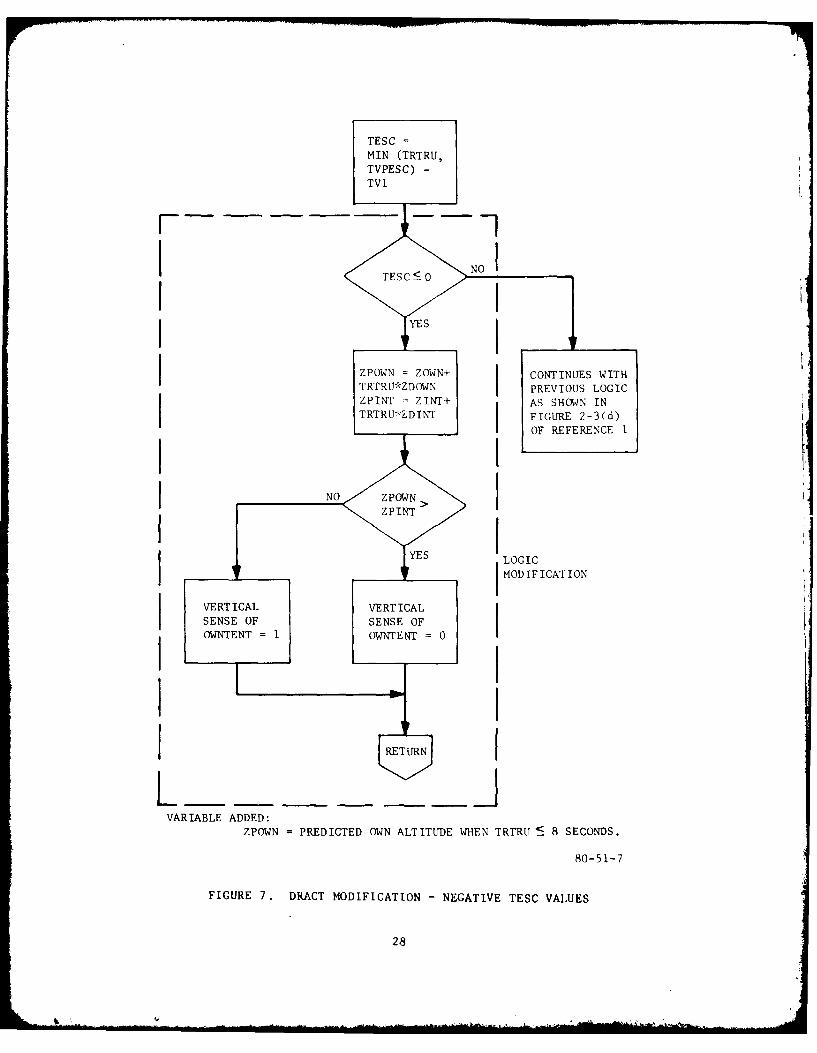
TESCMIN (TRTRU,TVPESC)-TV I
IZPOWN =ZOWN+ CONTINUES WITHTRTRU*ZDOWN PREVIOUS LOGIC
Y YESE SLOGICI IMODIFICATION
VARIABLE ADDED:ZPOWN =PREDICTED OWN ALTITUDE WHEN TRTRU! 8 SECONDS.
80-51-7
FIGURE 7. DRACT MODIFICATION - NEGATIVE TESC VALUES
28

no BCAS action because of large vertical separation although a high verticalclosure rate exists. When BCAS does generate alerts in these cases, the alertscertainly should not reduce separation. The method of projecting vertical rates toobtain VMD utilizes a conservative time estimate for the projection. While thismethod may be desired for unequipped intruder position projections, it presentsproblems for high vertical rates for own aircraft when the intruder is level and alarge planned negative vertical miss distance exists.
Negative vertical miss distances occur when vertical track crossings take placeprior to CPA. In the presence of high rates, large negative vertical missdistances can exist. The algorithm must be able to identify this condition and notissue an unnecessary alarm which reduces separation. This is especially true whenthe vertical closure is due to own aircraft. Figure 8 presents an example of acase where BCAS interaction causes the BCAS aircraft to climb which reduces thevertical separation from 1,900 feet to less than 800 feet. BCAS detects the
intruder and provides resolution 48 seconds prior to CPA. At that time, thecalculated values of the BCAS variables necessary to determine the projectedvertical miss distance, VMD, are:
A = 1,304.62 feet
TAUV = 20.05 seconds
ADOT = A/TAUV = -65.07 feet/second
TRTRU = -R/RD 2.49/0.05 49.8 seconds
TVPCMD = 25 s- :onds
so that:
VMD = A + ADOT*MIN(TVPCMD,TRTRU)
= 1,304.62 - 25*(65.07) = 322.13 feet
VMD underestimates the true vertical miss distance (1,900 feet) by more than1,500 feet.
The vertical miss distance estimate is conservative because the low crossing anglecauses a large difference between TVPCMD and TRTRU when the threat is initiallydetected and BCAS resolution is requested. Although 49.8 seconds remain until CPA,the algorithm only projects the vertical rate for 25 seconds, the original logicvalue of TVPCMD.
Since the resulting value of IVMDI is less than the threshold for positive BCAScommands (ALIM = 470 feet), a positive climb command is generated when no command
is required.
To reduce the impact of conservative projections (underestimates) of the verticalmiss distance when vertical track crossing occurs prior to CPA, MITRE Corporationhas made two revisions to the logic. The first revision increases the value ofTVPCMD (the look-ahead time for altitude detection) by 10 seconds. For the exampleencounter shown in figure 8, the new value of VMD is -972.83 feet. Since this isgreater than the threshold for threat detection (750 feet), no command results.
29

BCAS360 KNOTS
DE360NKNNO AT 4000 FT/MIN (-66.67 FT/SEC)
ATCPA -1900 F
-- -- " 80-51-7
FIGURE 8. ENCOUNTER WHICH RESULTS IN CONSERVATIVE VERTICAL MISSDI STANCE PROJECTION
A second, more sophisticated revision by MITRE compares the projected range at thetime of the predicted coaltitude condition with range tau distance modifying valueDMOD. The equation which calculates the projected range at coaltitude is
Range Projection =IR + RD * TAUVI
For the example encounter, range projection = 1.4875 nautical miles (nmi).
Since the projected range is greater then DMOD (I nmi), a command is not required.Figure 9 pictorially depicts this method of filtering threats based on projected
range.
INCORRECT UNEQUIPPED INTRUDER SENSE CHOICE DURING NEAR LEVEL-FLIGHT TAIL CHASE
ENCOUNTERS. In reviewing FTEG results, it is apparent that when the relativevertical closure rate (ADOT) between a BCAS aircraft and unequipped intruder islow, the current relative vertical position should be used to select the sense ofthe escape maneuver. This is not done in the original logic (reference 1). Aproblem exists for the cases in which the BCAS aircraft is above the intruder. Theproblem is most pronounced in tail chase encounters. These encounters are charac-terized by high true tau values (TRTRU = -R/RD) initially in the encounter whensense of maneuver is selected.
30

BCAS AIRCRAFTWITH HIGH DESCENT RATE
ONLY THREATS WITHPROJECTED RANGE <DMODREQUIRE COMMANDS
CURRENT,
~~~~I EVEL FLIGHT _-' 4 -
LARGE NEGATIVE
RANGE PROJECTION \ VERTICAL MISS
BASED ON TAUV I DISTANCE EXISTS
RANGE PROJECTION IS GREATER THAN DMOD
80-51-8
FIGURE 9. ENCOUNTER THAT WOULD HAVE THE ALARM FILTERED BY RANGE PROJECTION
The BCAS logic selects sense of maneuver for unequipped intruders by modeling both
a climb escape maneuver and a descent escape maneuver using TRTRU. The logic
selects the maneuver which generates the greater separation at the projected CPA.
The logic assumes a descent escape rate of -1,500 ft/min and a climb escape rate of1,000 ft/min. For most conditions, this realistically portrays the approximate
magnitudes of pilot response actions and results in the proper maneuver sense
choice. However, for near level-flight tail chase encounters where TRTRU is large,
the larger magnitude of the descent escape rate (1,500 versus 1,000 ft/min),projected over large TRTRU, can offset the BCAS aircraft's altitude above the
intruder. This results in an improper descend command.
The encounter conditions which led to an incorrect sense choice are shown in
figure 10. The sequential relative vertical positions following the generation of
the incorrect BCAS descend command are shown in figure 11. Although the range when
the coaltitude condition occurs is 0.48 nmi, a climb command would have been more
appropriate.
Two modifications to the sense choice logic were evaluated. The first modifica-
tion, provided by MITRE, limits the length of time of the modeled escape response
to a maximum of 35 seconds (instead of TRTRU seconds). For tail chase encounters,
31

BCAS AIRCRAFT IN LEVEL FLIGHT VERTICAL200 KNOTS SEPARATION
400 FT
\ UNEQUIPPED INTRUDER IN LEVEL FLIGHT240 KNOTS
CROSSING ANGLE = 00 HORIZONTAL MISS DISTANCE =0 FT
FIGURE 10. TAIL CHASE ENCOUNTER CAUSING INCORRECT SENSE CHOICE IN THECASE OF UNEQUIPPED INTRUDERS
the length of escape response is reduced significantly. This reduction preventsthe larger magnitude of the modeled descent escape rate from offsetting the BCASaircraft's altitude separation above the intruder. The second modification,suggested by Computer Science Corporation (CSC), checks the vertical rate of boththe intruder and the BCAS aircraft. When the magnitude of each rate is less than 5ft/sec (300 ft/mmn), the maneuver sense choice is based on the current relativevertical position (i.e., the BCAS aircraft will climb when above and descend whenbelow). Either one of the two logic modifications will prevent the generation of adescent command for the encounter shown in figure 10. Both modifications have beenadded to the BCAS logic.
VERTICAL ACCELERATION PERFORMANCE.
An evaluation was made of the BCAS algorithm's ability (1) to detect a change in anunequipped intruder's vertical rate and (2) to issue a command in time to ensureseparation. The new unequipped intruder sense choice logic and a 0 parametervalue of 0.10 (reference 7) were used to evaluate vertical accelerationperformance.
The basic geometry used to evaluate the vertical acceleration detection and resolu-tion logic is shown in figure 12. An unequipped intruder is initially descendingat -4,000 ft/mmn. The BCAS aircraft is in level flight. The intruder aircraftlevels off above the BCAS aircraft on a reciprocal heading. Neither aircraftmaneuvers horizontally. The duration of the intruder's level-flight segment priorto CPA varied from 60 to 5 seconds. Throughout the analysis, the vertical accel-eration rate was 0.5 g for both aircraft. The pilot response delay was fixed at 5seconds.
The performance results are illustrated in figure 13. Figure 13 shows that whenthe planned level-flight time is less than 15 seconds, the algorithm issues a climbcommand prior to the intruder leveling off. With 15 to 30 seconds of planned levelflight, a climb command is, issued 2 to 4 seconds after the intruder levels off.
32

I - - -I,
00
If z4+
oU
AL za
1-4
C4C
0 L)
33
II N .. . 2 . .. .. .. .. . . .... .. . .. . " ' "- ' .... . - " " -: " C - .' - - J
Si , _ . .

UNEQUIPPED INTRUDER
360 KNOTSDESCENT RATE -4,000 FT/MIN
CROSSING ANGLE = 180 0o.5 g v R ICAPLANNED MA NT L"i
VERTICAL SEPARATIONR
BCASAIRCAFTAT CPA VARIED
360 KNOTS -LEVEL FLIGHT kLEVEL FLIGHT
E O, EN'I A*
LEVEL FLIGHT TIME VARIES R,):.I 5 SECONDS PRIOR TO CPA
FIGURE 12. GEOMETRY FOR UNEQUIPPED INTRUDER VERTICAL ACCELERATION
EVALUAT ION
When the duration of the intruder level-flight segment exceeds j5 seconds, adescend command is issued 26 seconds prior to planned CPA time.
The climb command issued after the intruder levels off is due to vertical trackerlag and the high vertical deceleration by the intruder. The BCAS vertical ratetracker continues to project a descent for the intruder for several seconds afterthe intruder levels off. Since the intruder is projected to be below the BCASaircraft, the BCAS aircraft receives a climb command. If the true vertical rate(indicating level flight) had been available, the BCAS aircraft would have receiveda descend command.
Figure 14 depicts the observed separation following the BCAS commands when theintruder levels off at 100, 300, and 500 feet above the equipped aircraft. Allthree geometries result in small vertical separations at CPA. For the 300- and500-foot planned vertical separation encounters, the most critical situation occurs
when the intruder's planned level-flight time prior to CPA is less than 15 seconds.The BCAS algorithm detection and resolution logic generates a climb for the
equipped aircraft while the intruder is still in a descent. The intruder's subse-
quent level off results in a collision (23 feet of separation for the 500-footplanned CPA).
Vertical acceleration maneuvers by unequipped aircraft are a difficult problem forany collision avoidance algorithm. One method of minimizing the danger of thissituation is to provide the pilot with partial positional data on all threats.Alternatively, further improvements in the vertical tracker might improve BCASperformance in this area.
ADVANTAGES OF PARTIAL POSITIONAL DATA.
Active BCAS has the capability of providing range and altitude data on intruders.The altitude data on the intruder can be presented as either the BCAS trackedintruder altitude or as the intruder mode C altitude. Since these advisories may
not provide bearing information, they are called partial positional data (PPD's).
34
.+

//20
REGION E: COMMAND ISSUED WHILERL50 INTRUDER IS STILLm DESCENDING/
40 1
0
30
20CJe// DESCEND
10 ~REGION 2: COMMAND ISSUED AFTER
o INTRUDER IS IN LEVEL- / FL IGHT
oL , 1 1 -I I I I I I I I0I0 20 30 40 50 60
LEVEL FLIGHT TIME UNTIL CPA FOLLOWTNG VERTICAL MANEUVER IN SECONDS
(SEGMENT A) 80-51-1l3
FIGURE 13. EFFECTS OF THE TIME OF THE INTRUDER VERTICAL MANEUVER ON THE
TIMING AND SENSE OF POSITIVE COMMANDS
35

1000*=CLIMB
*=DESCEND
*NO CLIMB
PLANNED VERTICAL SEPARATION
H 500 FEETS800 -300 FEET
100 FEET
00
S600
S400
S 200
Or t0 20 30 40 50 60
LEVEL FLIGHT TIME UNTIL PLANNED CPA FOLLOWAING VERTICAL MANEUVER (SECONDS)
80-51-13
FIGURE 14. COMMAND AND ACHIEVED VERTICAL SEPARATION FOR VERTICALLYACCELERATING INTRUDERS
The previous analysis of vertically maneuvering intruders indicates that thereexists an entire class of encounter geometries in which PPD's displayed in thecockpit could provide critical information for a pilot to satisfactorily resolve
a conflict.
Consider the class of geometries where an unequipped intruder is initially on aconstant rate vertical trajectory toward a BCAS aircraft in level flight (seef igure 15). Without BCAS interaction or any change in the intruder's verticalrate, the intruder aircraft would pass through the BCAS aircraft's altitude wellprior to CPA. The current threat logic determines the sense of the escape maneuver(i.e., climb or descend) during the first "hit" in threat volume. The senseselected is then retained throughout the encounter. Vertical maneuvering by thethreat aircraft will not change the sense of BCAS commands. Only command severitywill be affected. Sometimes, when the intruder's vertical rate changes after BCAShas determined the sense of the coimmand, insufficient vertical separation occurs.
In figure 15 the unequipped intruder is initially descending at a constant rate.The most critical condition occurs when the BCAS vertical track of the intruderindicates that the intruder will pass through the BCAS aircraft's altitude wellprior to CPA. This results in a large projected negative vertical miss distanceat CPA and causes a climb/no descent sense to be selected. Furthermore, sincethe magnitude of the vertical miss distance is large, a negative BCAS command, donot descend, is initially generated.
36

cn 04
00
N>
I-4 1-z[11 Cc,-
En 3
w -4z04 a' W -44-
43 Z
W l 1- H ) -
0 0
P-1 4 4)H
C,) O37
.- )-'salt-

Once the intruder begins to reduce its vertical rate, the projected vertical missdistance decreases. This causes the negative command to transition to a positiveclimb command. In the final sequence (at the lower right corner of figure 15), theintruder has completed its level off maneuver above the BCAS aircraft. Withoutadditional information in the form of PPD's, the BCAS aircraft will continue toclimb toward the level-flight intruder creating a more serious conflict.
The FTEG was programed to simulate encounter conditions defined as follows:
BCAS INTRUDER (UNEQUIPPED)
Velocity 360 knots 360 knotsInitial Vertical Rate 0 ft/min -1,000 ft/minCrossing Angle 180 ° head-on encounterInitiation of Level-Off Maneuver 26 seconds prior to CPAPlanned VerLical Separation
Following Intruder Maneuver 300 feet
The BCAS aircraft responded to BCAS commands after a 5-second pilot response delay.The initial descent rate was 1,000 ft/min followed by a 0.25 g level-off maneuver.The example presented does not reflect an extreme vertical maneuver by theintruder.Table 8 presents the resulting BCAS sequential data along with the intruder's rangeand altitude information available to BCAS that would comprise the PPD's for theintruder. The data shown would have resulted if a 40-second modified tau were usedfor displaying PPD's. In table 8, the BCAS aircraft responded to the climbcommand; the resulting vertical separation at CPA was only 47 feet. The PPDinformation that would be displayed to the pilot would consist of some combinationof the three right-most columns of table 8. Within 10 to 15 seconds after theclimb command appeared, regardless of which type of intruder altitude informationwas displayed, the pilot could recognize that the intruder had leveled off at10,300 feet. As a result, approximately 200 feet of vertical separation couldexist at CPA.
VERTICAL SPEED LIMIT PERFORMANCE.
The vertical speed limit (VSL) performance was measured over a wide range ofencounter conditions. The primary objectives of the investigation were to:
1. Evaluate VSL performance.
2. Analyze the effect on VSL performance caused by variations in vertical rates,aircraft velocity, horizontal crossing angle, and horizontal miss distance.
3. Identify the regions (planned vertical separation versus vertical rate) wherethe VSL's alone will generate sufficient separation; i.e., a transition to apositive or negative command is not required.
The VSL advisories generate separation only in the vertical dimension. Thus,the measures of the vertical separation at CPA between the aircraft due to theVSL advisories are the performance measures of primary interest. In general, the
38
4-!
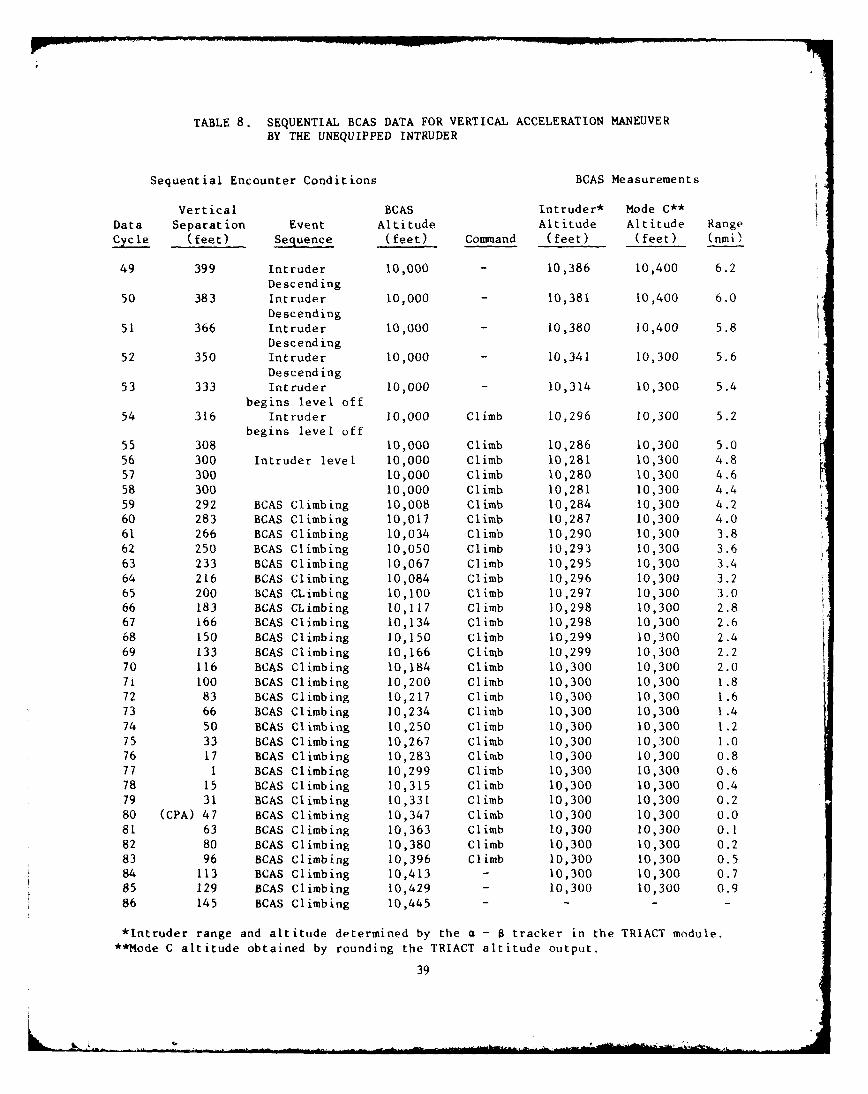
TABLE 8. SEQUENTIAL BCAS DATA FOR VERTICAL ACCELERATION MANEUVERBY THE UNEQUIPPED INTRUDER
Sequential Encounter Conditions BCAS Measurements
Vertical BCAS Intruder* Mode C**
Data Separation Event Altitude Altitude Altitude RangeCycle (feet) Sequence (feet) Command (feet) (feet) (nmi)
49 399 Intruder 10,000 - 10,386 10,400 6.2Descending
50 383 Intruder 10,000 - 10,381 10,400 6.0Descending
51 366 Intruder 10,000 - 10,380 10,400 5.8Descending
52 350 Intruder 10,000 - 10,341 10,300 5.6Descending
53 333 Intruder 10,000 - 10,314 10,300 5.4begins level off
54 316 Intruder 10,000 Climb 10,296 10,300 5.2begins level off
55 308 10,000 Climb 10,286 10,300 5.056 300 Intruder level 10,000 Climb 10,281 10,300 4.857 300 10,000 Climb 10,280 10,300 4.658 300 10,000 Climb 10,281 10,300 4.459 292 BCAS Climbing 10,008 Climb 10,284 10,300 4.260 283 BCAS Climbing 10,017 Climb 10,287 10,300 4.061 266 BCAS Climbing 10,034 Climb 10,290 10,300 3.862 250 BCAS Climbing 10,050 Climb 10,293 10,300 3.663 233 BCAS Climbing 10,067 Climb 10,295 10,300 3.464 216 BCAS Climbing 10,084 Climb 10,296 10,300 3.265 200 BCAS CLimbing 10,100 Climb 10,297 10,300 3.066 183 BCAS CLimbing 10,117 Climb 10,298 10,300 2.867 166 BCAS Climbing 10,134 Climb 10,298 10,300 2.668 150 BCAS Climbing 10,150 Climb 10,299 10,300 2.469 133 BCAS Climbing 10,166 Climb 10,299 10,300 2.270 116 BCAS Climbing 10,184 Climb 10,300 10,300 2.0
7i 100 BCAS Climbing 10,200 Climb 10,300 10,300 1.872 83 BCAS Climbing 10,217 Climb 10,300 10,300 1.673 66 BCAS Climbing 10,234 Climb 10,300 10,300 1.4
74 50 BCAS Climbing 10,250 Climb 10,300 10,300 1.275 33 BCAS Climbing 10,267 Climb 10,300 10,300 1.076 17 BCAS Climbing 10,283 Climb 10,300 10,300 0.8
77 1 BCAS Climbing 10,299 Climb 10,300 10,300 0.678 15 BCAS Climbing 10,315 Climb 10,300 10,300 0.479 31 BCAS Climbing 10,331 Climb 10,300 10,300 0.280 (CPA) 47 BCAS Climbing 10,347 Climb 10,300 10,300 0.081 63 BCAS Climbing 10,363 Climb 10,300 10,300 0.182 80 BCAS Climbing 10,380 Climb 10,300 10,300 0.283 96 BCAS Climbing 10,396 Climb 10,300 10,300 0.584 113 BCAS Climbing 10,413 - 10,300 10,300 0.785 129 BCAS Climbing 10,429 - 10,300 10,300 0.9
86 145 BCAS Climbing 10,445 - - - -
*Intruder range and altitude determined by the a - 8 tracker in the TRIACT module.**Mode C altitude obtained by rounding the TRIACT altitude output.
39

VSL performance is good when own vertical rate exceeds 1,000 ft/min. The majorproblems found with VSL resolution of encounters with unequipped threats are:
1. VSL logic permitted short duration cyclic changes in the VSL magnitude.
2. More than 1,000 feet of vertical separation or unnecessay alarms often re-sulted when (a) the vertical rate of the BCAS aircraft was >3,000 ft/min or(b) the planned horizontal separation at CPA exceeded 1 mile.
3. The vertical tracker noise resulted in a large number of transitions betweenVSL, positive, and/or negative commande.
General VSL Performance. The basic geometry used to generate the differentencounters is presented in figure 16. All encounters were simulated using sen-sitivity performance level 5 airspace, the highest BCAS protection level. Through-out the analysis the pilot response delay was fixed at 5 seconds to eliminateperformance variations due to BCAS response characteristics. The aircraft responsewas fixed at 500 ft/min; the maximum acceleration/deceleration allowed was 0.5 g.The analysis presented in this section was designed to measure the effectiveness ofActive BCAS vertical speed limit alarms.
The vertical separation generated at CPA due to BCAS alarms is plotted againstplanned vertical separation (or planned horizontal miss distance) for fixed cross-ing angle, aircraft velocities, and aircraft vertical rate. On each plot, a "VSLcommands only" region is identified. The solid portions of the curves on theplot identify this region. The increase in vertical separation generated in thisregion is due solely to VSL alarms. The dashed lines on the plots identify theregion where commands other than VSL's occur. The absolute value of the observedvertical separation at CPA is used in the plots. Two regions, region I and region2, are also identified in the plots. In region 1, the observed vertical separationis greater then the planned vertical separation. In region 2, the observedvertical separation is less than the planned vertical separation. Planned verticalseparation is the separation that would have resulted without BCAS interaction.Region 2 identifies encounter conditions that would cause BCAS to reduce theplanned vertical separation. Figure 17 presents the observed vertical separationcurves as a function of the planned vertical separation for low vertical rates(<2,000 ft/min). Similar curves for high vertical rates (>2,000 ft/min) arepresented in figure 18.
Fluctuations in vertical separation are observed for low values (<300 feet) ofplanned vertical separation. For low vertical rates, the fluctuations are morefrequent. Noneffective VSL alarms are generated for large planned vertical separa-tions and low vertical rates (figure 17). The minimum vertical separation is 425feet and occurs at point A in figure 18. The conditions associated with the min-imum separation had the BCAS descending at 2,000 ft/min so as to be 100 feet belowthe intruder at CPA. Since the minimum vertical separation is 425 feet, adequateperformance is observed throughout the simulation. The area of the "VSL commandsonly" region is larger for high vertical rates. At low rates, the vertical trackernoise due to quantization affects the measured relative vertical rate. This causesfrequent command transitions not only in the magnitude of VSL commands in the "VSLcommands only" region, but also early cyclic transitions to negative and/or pos-itive commands in the other region. The noneffective VSL's observed for lowvertical rates and high planned vertical separations result because the aircraftvertical rate is less than the magnitude of the VSL's. The size of "the VSL
40

BCAS INTRUDER
VERTICAL RATE: BCAS VARIED FROM 500 FT/MIN LEVELTO 1000 FT/MIN
CPA CONDITIONS: VERTICAL SEPARATION VARIED FROM-1000 FT TO +1000 FTHORIZONTAL SEPARATION VARIED FROM -3 NMI TO +3 NICROSSING ANGLE (CO) 00, 900, 1800
PLANNED VERTICAL SEPARATION
PLANNED IORIZONTAl-
UNEQUIPPED
IN I"R IfE R i
S,-51-15
FIGURE 16. BASIC GEOMETRY FOR VSL EVALUATION
commands only" region for high vertical rates increases because (1) the change in
the vertical rate caused by the VSL's generates sufficient separation and (2) the
thresholds for positive and negative commands are not penetrated.
An analysis was conducted for crossing angles of 00 (tail chase condition), 90,
and 180* (head-on encounter condition). Figure 19 presents the observed vertical
separation curves as a function of planned vertical separation. The descent rate
is -2,000 ft/min. Figure 20 presents the results associated with a -4,000-ft/min
descent. Since the planned horizontal separation is 0 feet, vertical track cross-
ing (negative planned vertical separation) cannot occur in the tail chase equal-
velocity encounter.
The vertical separation generated is almost the same for all vertical rates and
crossing angles. Ninety-degree crossing angle generates more separation during
high vertical rate and negative planned vertical separations (figure 20). Again,
the size of the "VSL commands only" region increased as the BCAS aircraft descent
rate increased. In figures 19 and 20, asterisks mark conditions which caused a
reduction in the planned vertical separation. The reductions were not significant.
The planned horizontal miss distance was varied from -3 to +3 nmi in 0.24-nmi
increments. The planned horizontal miss distance is negative if the BCAS aircraft
passes behind the intruder. An analysis was conducted for the encounters with 90°
crossing angle and 0 feet planned vertical separation.
41

IN' R 'D F REIQTPIppD: ES NO,FLI 11lY: 3IO KNOI 300 KNOIIS
C PA ('OND I'l IONS :PLANNTD VERTICAl SiPARATION: -1000 F'I TO I006 FTPLANNED HORIZON'TAL SEPARATrION: 0 FT
CROSS IN; ANGLE = 90")
0oo /
/,
/
H REGION I /
1040F01I0 /^1 X , 1\ NON EFFEC"l \T. :O t'IAN IY<
10 10 FT IIlN, -O0 FFt 'IIN
//
.RE,: I N 2 \ / f1lO 2
-600 -'.O0 -20) 20 400 "0 80o 1
11'INEI) VE] IIAl SI PA RNI ION (FEE
FIGURE 17. VERTICAL RATE EFFECTS ON VSL PERFORMANCE FOR VERTICAL RATESBETWEEN 500 AND 1,500 FEET PER MINUTE
1000 4000 FT/MIN
%, ./R~~ii[:R GIO 1. l';n
60800 /
NFNEFFECIFVE "IL CoMANT
400 A
NON VS1. CMDANI)S/ ---- 2000 FT/MIN
/ 3000 FTh1IN200- /--4000 FT/MIN
REGION 2 REGION 2
0, /
-600 -400 -200 0 200 400 600 800 1000PLENN1D VERTICAL SEPARATION (FEET)
80-51-18
FIGURE 18. VERTICAL RATE EFFECTS ON VSL PERFORMANCE FOR VERTICAL RATESBETWEEN 2,000 AND 4,000 FEET PER MINUTE
42

1000
REGION I
0/1 800 /
/O0 1800 /< 600 d/\ I%. / /
400 9900,
/ VSL ONLY COMMANDS/ NON VSL COMMANDS
0 ANGLE/0200 90/ 90 ° ANGLE
/ N% / 180' ANGLE
REGION 2 \ / REGION 2
0 1 1 \/ 1 1 1 1 1-600 -400 -200 0 200 400 600 800 1000
PLANNED VERTICAL SEPARATION (FEET)
80-51-19
FIGURE 19. CROSSING ANGLE EFFECTS ON VSL PERFORMANCE FOR DESCENT RATEOF 2,000 FEET PER MINUTE
REGION I J -
1000 /90° --
RESULTS INDEPENDENT800 OF CROSSING ANGLE
0 06 00
~ 600
U 400 180°
- VSL ONLY COMMANDS
¢ / ..--- NON \'SL COMMANDS200
\f /{/-
REGION 2 / REGION 2
0-600 -400 -200 0 200 400 600 800 1000
PLANNED VERTICAL SEPARATION (FEET) 80-51-20
FIGURE 20. CROSSING ANGLE EFFECTS ON VSL PERFORMANCE WITH A HIGH VERTICALRATE (4,000 FEET PER MINUTE)
43

Figure 21 presents observed vertical separation curves as a function of plannedhorizontal miss distance for -4,000- and -2,000-ft/min vertical rates. Theabscissa value of zero separated region I and region 2. In region 1, the BCASaircraft passes behind the intruder (planned negative horizontal miss distance); inregion 2, the BCAS aircraft crosses in front of the intruder (planned positivehorizontal miss distance).
Figure 21 shows that VSL alarms are generated when the BCAS aircraft crosses theintruder path as far as 1.3 nmi ahead of the intruder and 2.75 nmi behind theintruder. The range of the generated vertical separation in these regions variesbetween 225 to 700 feet. Unnecessary vertical separation is generated due to theBCAS alarms in regions where adequate horizontal separation exists. However, theActive BCAS logic cannot identify the existing safe condition due to its inabilityto measure horizontal miss distance.
For both vertical rates, the "VSL commands only" region is split into two regionsby an area of positive and negative commands. The splits are identified in figure21. Both splits occurred in region I (i.e., negative horizontal miss distance).For the -2,000-ft/min vertical rate case, the split appears at a larger horizontalmiss distance when compared to -4,000-ft/min vertical rate error.
The latest BCAS changes include an acceleration model in the logic which selectsthe VSL magnitude. Prior to this change, a VSL command occurred when VI > 8.33ft/sec and a negative and/or positive command occurred when
VI < 8.33 ft/sec.
For a level-flight intruder below the BCAS aircraft
Vl = (ALIM - A - TI*ZDOWN)/(TRTRU-Tl)
where TRTRU - R/RD - range/range rate.
Both range R and range rate RD are time dependent.
At time t,
R(t) = vX2 (t) + y2 (t) + Z2 (t)
where X(t), Y(t), and Z(t) are the relative X, Y, and Z separations of the in-truder and BCAS aircraft at time t.
For 90" crossing angle and equal aircraft velocities, the X and Y separationsat time t differ only by a constant K. Thus, for negative horizontal miss distance(-K) at time t,
X(t) = Y(t)-K
Rt 2= 2*Y(t) 2 + Z(t) 2 +K2 - 2*K*Y(t)
and,
TRTRU = - (2y2+K2-2Y*K+Z2)1/2
2Y*?-K?+2Z*Z
44

1000 CROSSING ANGLE 90"
VSL ONLY COMKANI)S PLANNED VERTICAL SEPARATION 0 FT
NON VSL COMMANDS VELOCITIES 360 KNOTS
900 INTRUDER UNEQUIPPED
SPLIT A
700 /
600 \
k5007 " #
o00/ \ orMINw J \
SPLIT
300 %~V\2000 FT/MIN
200 \
100
BCAS CROSSES BEHIND INTRUDER BCAS CROSSES IN FRONT OF INrRTDER
0 I I 1 1 1 1-3.12 -2.08 -1.04 0 1.04 2.08 3.12
HORIZONTAL SEPARATION AT TRACK CROSSING (NMI)
FIGURE 21. HORIZONTAL MISS DISTANCE EFFECTS ON VSL PERFORMANCE
where Y and Z are relative rates in Y and Z directions respectively. The numerator
can never be equal to zero, since R>0 if any horizontal miss distance exists.
Therefore VI - 0 as TRTRU-b .. This implies that non-VSL commands occur when K
is in a certain interval. For fixed R, TRTRU-----. when
K ---- 2*Y + Z*Z/Y.
Hence the split occurs in the "VSL command only" region as K approaches
2*Y + Z*./Y.
For high vertical rates, this interval shifts towards the right. The split of the-4,000-ft/min vertical rate occurs with smaller miss distances then with -2,000-
ft/min vertical rate.
For crossing angles, 0 ° and 1800, this phenomenon is not expected with the equal-velocity condition. In a zero crossing angle situation with equal aircraft
velocities, the crossing of the intruder track behind the intruder is not possible.
For all other crossing angles, one would expect a split in the "VSL commands only"
region. Additional analysis indicated the largest splits in the VSL-only areasoccurred for 90 ° crossing angles.
The effects of aircraft velocity variation are analyzed by comparing the observedvertical separation for encounters in which the aircraft velocity is varied.
45

For a given conflict, the BCAS aircraft velocity is equal to the threat aircraftvelocity. The results presented in figures 22 and 23 indicate no significantdifference in the vertical separation in the "VSL commands only" region.
SHORT DURATION OF VSL's. The current VSL logic only requires that the initialVSL be displayed for 5 seconds (see figures 2-3(d) of reference 1). After thisinitial 5-second display, the magnitude of the VSL can change every second causinga new display. Several cases of I-second secondary VSL's have been observed.
A second problem, caused by not requiring a minimum display period for secondaryVSL's, is the displaying of a cyclic pattern of 1-second VSL's. The cyclic pattern
is caused by vertical tracker noise and own aircraft vertical response to BCAS com-mands. The requirement of a minimum display period for secondary VSL's wouldeliminate this problem.
The detection and resolution logic, DRACT, was modified as shown in figure 24to analyze its effect on the short VSL displays. The change required the VSL alarmto retain the same displayed magnitude for 5 seconds once a magnitude transitionoccurred. The numerous encounters which had caused short cyclic secondary VSLalarms to occur were repeated. The modification to the VSL display time logic
eliminated all short cyclic alarm patterns.
IMPACT ON VSL MAGNITUDE SELECTION. The current Active BCAS logic provides forgeneration of three VSL command magnitudes. They are limit climb (descent) to 500,
1,000, and 2,000 ft/min. Air carrier aircraft often climb or descend at rates upto 4,000 ft/min. In these cases even the least stringent VSL command (2,000-ft/minlimit) can cause a 2,000-ft/min change in the vertical rate of the aircraft. Thelarge magnitude of this change can often result in the generation of excessivevertical separation at CPA. The excessive separation is generated at the expenseof larger than necessary deviations from the desired vertical flight profile forthe aircraft in question.
The analysis was conducted on BCAS equipped aircraft versus unequipped threats.The VSL performance for equipped threats would at least match the performancereviewed in this section. The analysis is based on an improved VSL function givenbelow.
VI =IZDOWNt- VACCEL * (TRTRU - TI) + VACCEL * (TZ3) 1/2
where TZ3 = (TRTRU - TI)2
- 2 * (ALIM-A-ADOT * TRTRU)
VACCEL
This new VSL performance function incorporates a vertical acceleration model intothe VSL magnitude selection logic.
Two concepts investigated were: (1) What do less stringent VSL commands (magni-tudes of 1,000, 2,000, or 4,000 ft/min do to reduce the excessive BCAS commandedseparation? and (2) Is adequate separation generated with the new magnitudes? Toperform this investigation, the only changes made to the BCAS logic were thechanging of the parametric VSL magnitude set (V500-8.33 ft/sec, VOOO16.67ft/sec, V2000-33.33 ft/sec) to a new magnitude set of (V100016.67 ft/sec, V2000-33.33 ft/sec, V4000-66.67 ft/sec). BCAS performance results with the originalVSL magnitude set were compared against the BCAS performance results with the newVSL magnitude set.
46

1000 /
/~REGION I
800/
z/
600 150 KNOTS
< \ ',,, \
F 400 360 KNOTS /
/ ___ VSL ONLY COMMANDS
2/-NON VSL COMMANI)S/ ---- 50 KNOTS200N- 360 KNOTS
= /o \ /
REGION 2 \ / REGION 2
0 %4/ I-600 -400 -200 0 200 400 600 800 1000
PLANNED VERTICAL SEPARATION (FEET) 80-51-22
FIGURE 22. VELOCITY EFFECTS ON VSL PERFORMANCE WITH A VERTICAL RATE OF2,000 FEET PER MINUTE
1000 150 KNOTS /\ /
RE;ION I /
800 --
360 KNOTS600 - T360 KNOTS
C.
150 KNOTS
400 -/
/ VSL ONLY COMMANDSNON VSI. COMMANDS
/ -150 KNOTS200 / 360 KNOTS
REGION 2 - / REGION 2
0 1 1 1 1-600 -400 -200 0 200 400 600 800 1000
PLANNED VERTICAL SEPARATION (FEET)
80-51-2
FIGURE 23. VELOCITY EFFECTS ON VSL PERFORMANCE WITH A VERTICAL RATE OF
1,000 FEET PER MINUTE
47o14. - -. , •

SET OWNTENTTO SET OWNTENff SET cIWNTENTNEGATIVE TO BIT 6VERTICAL POSITIVE VERT. TO VSL
CMDSAV NO NO CDAOWNTE NT ...... .... V S V V N S
YESS
TCMD =TCURII
CMSAV % IV
OW NTNTENT
*VhSAV IS THE NAGNITUDE OF THE VSL FOR THIS INTRUDER FOR THE LAST CYCLE.
FIGURE 24. DRACT MODIFICATION -VSL DISPLAY TIME
48

Several different combinations of unequipped intruder vertical rates and BCAS air-craft vertical rates were analyzed. The results for the various combinations arefairly consistent. Figure 25 graphically depicts the encounter conditions onwhich the results of this section are based.
The encounter conditions shown in figure 25 were simulated with the FTEG using theoriginal VSL magnitudes of 500, 1,000, and 2,000 ft/min. The same conditions wererepeated using the new magnitudes of 1,000 2,000, and 4,000 ft/min. The resultswere analyzed to identify differences in BCAS performance. In no case did thenew VSL magnitudes cause BCAS to generate insufficient separation. This couldbe expected since no logic changes were made that would reduce the occurrences ofpositive or negative BCAS commands.
Figure 26 depicts the BCAS performance for the original VSL magnitudes. Thedashed lines outline the area of increased vertical separation when the plannedvertical separation is compared to the separation that results with BCAS. Theresults are shown for the BCAS aircraft climb rates of 2,000 to 6,000 ft/min in1,000-ft/min increments. In all cases (for both VSL magnitude sets) adequatevertical separation occurs at CPA.
The solid portions of the plotted curves in figure 26 identify the encounterconditions which are resolved with VSL commands. The dotted portions of the curvesindicate regions in which positive and/or negative BCAS commands occur. Figure 27presents results obtained when the same encounter conditions are simulated usingthe new VSL magnitude set.
Ideally, BCAS would generate 600 to 800 feet of vertical separation at CPA. Thisamount of separation would be slightly greater than the visual flight rules (VFR)vertical separation standard. Figure 26 indicates that for the 2,000- and 3,000-ft/min BCAS aircraft climb conditions, BCAS generates a vertical separation (600 to800 feet) at CPA regardless of the planned vertical separation. For the same climbconditions, figure 27 indicates that for these BCAS climb conditions the new VSLmagnitude set causes nearly identical BCAS performance to result. The separationis consistently between 600 and 800 feet.
However, as the BCAS aircraft climb rate is increased beyond 3,000 ft/min, theoriginal VSL magnitude set causes increasingly excessive vertical separations tooccur at CPA. The separation at CPA exceeds 1,000 feet for several differentindividual encounters. With the 6,000-ft/min climb case, the resulting verticalseparation exceeds 900 feet (-900 feet) even when the planned vertical separationis as small as -200 feet. The problem with the original VSL magnitude set is thatthe least restrictive VSL command, limit climb to 2,000 ft/min, causes a largechange (4,000 ft/min) in the climb rate for cases where the BCAS aircraft is climb-ing 6,000 ft/min. Assuming nominal pilot response rates and aircraft accelerationrates, even short duration commands (15 seconds) would cause a 700-foot minimumincrease in vertical separation.
The new VSL magnitude set permits less restrictive VSL commands to be chosen forclimb rates in excess of 3,000 ft/min. Figure 27 shows that the resulting verticalseparation for climb rates in excess of 3,000 ft/min is concentrated between 700and 800 feet. The resulting separation is greater than 1,000 feet on only oneoccasion.
49

BCAS INTRUD)ERVELOC ITY: 250 KNOTS 150 KNOTSVERTICAL RATE; VARIED FROM 1,500 FT/MN -1500 FT/MIN
CPA CONDITIONS:
PLANNED VERTICAL SEPARATION: VARIED FROM -1000 Fl T:: +lU00 FlPLANNED HORIZONTAL SEPARATION: 0 FT
CROSSING ANGLE: (J900
RESPONSE CONDITIONS:5-SECOND PILOT RESPONSE DELAY0.25 g ACCELERATION IN RESPONSE TO BCAS C(*MINDS
S J)PLANNED VERTICAL SEPARATION
ITCAS
FIGURE 25. ENCOUNTER CONDITIONS FOR VSL MAGNITUDE STUDY
1000 -RGO
-N,* 5,6q.
.~.- -
-8 0
5 * * 3.~
600 /* e'0
400- VSL ONLY COMIMAND)S/ NON VSL COMMIANDS
200 ~ *VERTICAL RATE *1000 FT/MIN
REGION 2 \ /REGION 2
0 I \V I I 1 1-600 -400 -200 0 200 400 600 800 1000
PLANNED VERTICAL SEPARATION (FEET)80-51-26
FIGURE 26. VERTICAL SEPARATION AT CPA USING ORIGINAL VSL MAGNITUDE SET(500, 1,000, 2,000 FEET PER MINUTE
50

1000 -1REGION
I
" 4 *
. . ...I-%I -'
800 .. .-- -" 2,3,4
< - . .%. 2,4
600 // ----. / \ :
/400 /"
REGION 2 * / REGION 21, \ 4 1 1¢ 1-600 -400 -200 0 200 400 600 Ili0 1000
PLANNED VERTICAL SEPARATION (FEET)
1 -2
FIGURE 27. VERTICAL SEPARATION AT CPA USING NEW VSL MAGNITUDE SET
(1,000, 2,000 4,000 FEET PER MINUTE)
An analysis of the duration and number of VSL command transitions that occurred wasmade for both VSL magnitude sets. Tables 9 to 13 present the results of thisanalysis. Each table reviews the results for a single BCAS aircraft climb rate.Tables 9 and 10 show little difference in the number of command transitions anddurations between the VSL magnitude sets.
For climb rates greater than 3,000 ft/min, tables 11 to 13 indicate that the newVSL magnitudes cause longer overall command periods and a greater number of commandtransitions than does the original set of magnitudes. For 5,000- and 6,000-ft/minclimb cases, the original VSL magnitude set consistently causes only one VSLcommand to occur regardless of the planned vertical separation. For the same climbrates, the new VSL magnitude set causes two or three VSL command transitions tooccur when the magnitude of the planned vertical separation is less than 400 feet.
In general, the VSL performance is adequate irrespective of the vertical rate,aircraft velocities, planned vertical separation, and crossing angle. Betterperformance and larger "VSL commands only" regions are observed for higher verticalrates. However, excessive separation is generated for BCAS aircraft with highvertical rates (3,000 ft/min). A reduction in occurrence of excessive verticalseparation could be possible by changing the VSL magnitudes, but this reductioncould be obtained only at the cost of longer VSL durations and a higher number oftransitions in the VSL commands. The new VSL magnitude set (1,000, 2,000, or 4,000ft/min) is less restrictive. The benefit may be insignificant due to the increased
51

o -4.U 0)
M 0 1 nu n 4 %D go N- 00 UlIz 01'. - . 'J rj i
V bo
O1 0000 00%
x0 0 + +1-4
oI - - cnj C4 C14 C14 C'J C11. (
00
cc .41 ~ irj Q)- 0 r- 0> C14 ID 00 0
U0C U -a = - C-4 C4 C-4 C*.J M
o 0 b*ccc
- -4~ -4
0 0 + +
H --4
E-4
0 Aj jH -4 w -0- 0 0 D 0 C 0 0 CI
&j cc 44wcc1 Lcc
+ I
0.
-- 52

TABLE 10. VSL COMMAND DURATION COMPARISON (BCAS AIRCRAFT CLIMBING AT 3,000 FT/MIN)
Planned Original Magnitudes New MagnitudesVertical Average Total Average TotalSeparation Number of Duration Duration Number of Duration Duration
(ft) Transitions (sec) (sec) Transitions (sec) (sec)
-1,000 1 5.0 5 0 - -
-900 1 5.0 5 1 5.0 5
-800 1 5.0 5 1 5,0 5
-700 2 9.5 19 1 14.0 14
-600 2 10.5 21 3 -5.7 17
-500 1 18.0 18 2 10.0 20
-400 1 21.0 21 1 20.0 20
-300 4 6.3 25 3 5.7 17
-200 2 11.0 22 2 10.0 20
-100 5 5.6 28 3 (+) 5.7 17
0 3 (+) 6.0 18 3 (+) 6.7 20
(+) Positive BCAS command resulted
TABLE 11. VSL COMMAND DURATION COMPARISON (BCAS AIRCRAFT CLIMBING AT 4,000 FT/MIN)
Planned Original Magnitudes New MagnitudesVertical Average Total Average TotalSeparation Number of Duration Duration Number of Duration Duration
(ft) Transitions (sec) (sec) Transitions (sec) (sec)
-1,000 1 5.0 5 1 5.0 5
-900 1 5.0 5 1 5.0 5
-800 2 (-) 5.0 10 2 5.0 10
-700 1 10.0 10 1 19.0 19
-600 1 11.0 11 1 18.0 18
-500 1 20.0 20 3 7.3 22
-400 1 22.0 22 3 8.0 24
-300 1 26.0 26 2 11.0 22
-200 1 24.0 24 2 12.0 24
-100 1 24.0 24 2 13.0 26
0 4 (+) 5.0 20 4 ( ) 5.0 20
53
i+
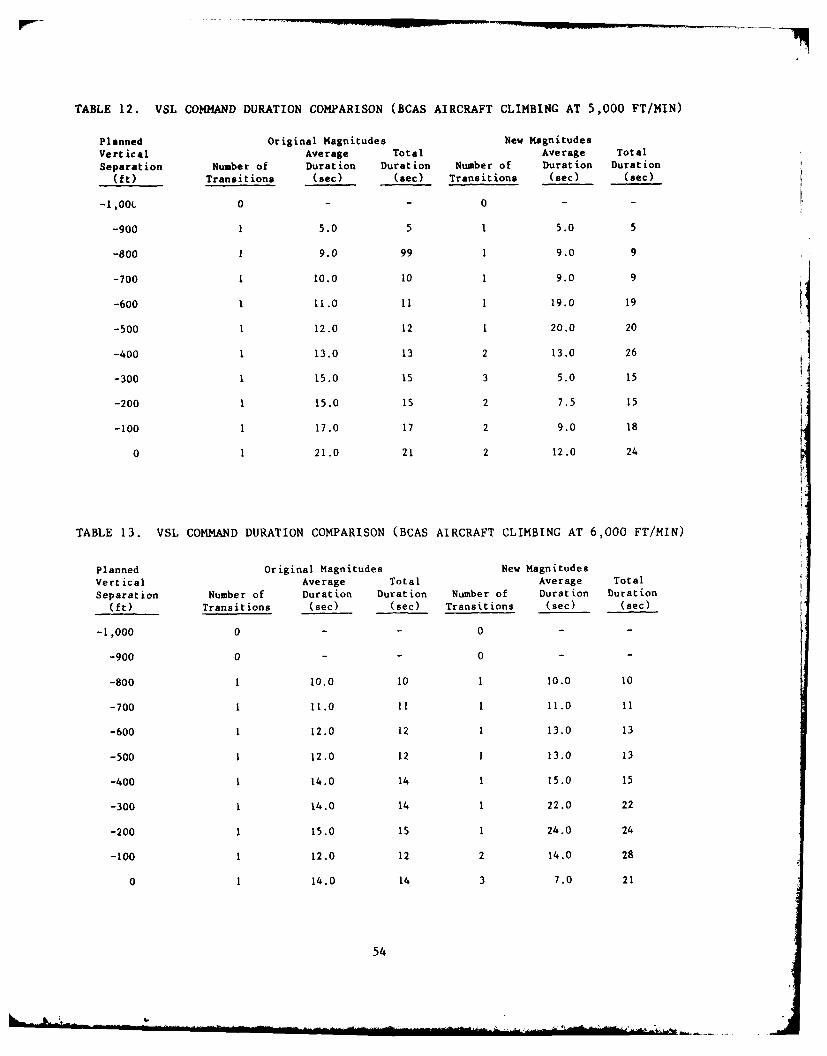
TABLE 12. VSL COMMAND DURATION COMPARISON (BCAS AIRCRAFT CLIMBING AT 5,000 FT/MIN)
Planned Original Magnitudes New MagnitudesVertical Average Total Average Total
Separation Number of Duration Duration Number of Duration Duration
(ft) Transitions (sec) (sec) Transitions (sec) (see)
-,00L 0 - - 0 - -
-900 1 5.0 5 1 5.0 5
-800 1 9.0 99 1 9.0 9
-700 1 10.0 10 1 9.0 9
-600 1 11.0 11 1 19.0 19
-500 1 12.0 12 1 20.0 20
-400 1 13.0 13 2 13.0 26
-300 1 15.0 15 3 5.0 15
-200 1 15.0 15 2 7.5 15
-100 1 17.0 17 2 9.0 18
0 1 21.0 21 2 12.0 24
TABLE 13. VSL COMMAND DURATION COMPARISON (BCAS AIRCRAFT CLIMBING AT 6,000 FT/MIN)
Planned Original Magnitudes New MagnitudesVertical Average Total Average Total
Separation Number of Duration Duration Number of Duration Duration
(ft) Transitions (sec) (sec) Transitions (sec) (sec)
-1,000 0 - 0 - -
-900 0 - - 0 - -
-800 1 10.0 10 1 10.0 10
-700 1 11.0 11 1 11.0 11
-600 1 12.0 12 1 13.0 13
-500 1 12.0 12 1 13.0 13
-400 1 14.0 14 1 15.0 15
-300 1 14.0 14 1 22.0 22
-200 1 15.0 15 1 24.0 24
-100 1 12.0 12 2 14.0 28
0 1 14.0 14 3 7.0 21
54

number of VSL command transitions. At lower BCAS aircraft vertical rates (<2,000ft/min), tracker noise affects the measured vertical rate. This results in manycommand transitions. Due to the lack of horizontal miss distance information, BCASinteraction is observed for horizontal separations of up to 3 nmi at CPA. VSLcommands generate excessive separation in this region. Current Active BCAS logiccannot identify the safe condition due to horizontal miss distance.
GENERAL PERFORMANCE.
In this section, three types of encounters are discussed: (1) abrupt horizontalmaneuvers by unequipped threats, (2) linear encounters with aircraft in levelflight, and (3) linear encounters with both aircraft climbing and/or descending.The BCAS response characteristics are fixed throughout the analysis in this sec-tion. The aircraft response rate to positive commands is 1,000 fr/min; the pilotresponse delay is 5 seconds; and the maximum acceleration/deceleration allowed is0.5 g.
ABRUPT HORIZONTAL MANEUVER. The Active BCAS logic uses a tau distance modifier"(DMOD) to provide increased protection against abrupt horizontal maneuvers of athreat aircraft. The current value of DMOD is 1 nmi for performance level 5(highest protection level). The adequacy of the DMOD value is analyzed in thissection. The threat is unequipped in this analysis.
The basic geometry analyzed is shown in figure 28. The intruder aircraft is par-alleling the course of the BCAS aircraft. A horizontal maneuver toward the BCASaircraft is begun by the intruder sometime prior to CPA. All geometricalvariations are designed so that when the intruder completes the maneuver, the pairwill be on a collision course with a 90° crossing angle. Without BCAS interaction,all tested encounters result in collision.
Several variations are made to the basic geometry. The first varies the amount oftime from the intruder's turn completion to CPA. This time is varied from 0seconds (i.e., turn completion and collision are simultaneous) to 50 seconds. Inthe latter case, the turn is completed well prior to BCAS detection. BCAS seesthis encounter as a purely linear encounter.
The second condition that was varied is the turn rate of the unequipped aircraft.The turn rate is either 6°/sec (twice standard rate), 3'/sec (standard rate), or1.5°/sec (half standard rate). The variation in the turn rate permits the analysisof (1) the effect of the turn rate on separation and (2) the effect of varying thehorizontal offset distance prior to turn on the resulting separation. To morefully exercise the new unequipped intruder sense choice logic, the climb rate ofthe BCAS aircraft is set to 300 ft/min throughout the encounter. Similarly, theunequipped intruder's climb rate is set at 500 ft/min. The BCAS aircraft climbs at300 ft/min until a BCAS command occurs. The BCAS aircraft then responds to theBCAS command.
Throughout the study, the BCAS response characteristics are constant; i.e., thepilot response delay is fixed at 5 seconds. After this initial 5-second delay, theBCAS aircraft accelerates in the commanded direction at 0.25 g (8 ft/sec 2 ) untila 1,000-ft/min climb or descent is established for positive commands. With BCASinteraction, both aircraft are climbing throughout the encounter. With the in-truder climbing at a higher rate, the proper choice should be a descent tor allencounter.i.
55

BCAS RES PONSE CHARACTER IS I ICSS SECOND PIL(YF DELAY0.25 g ACCELERATION
RCAS
2- KNO"T UNEL UIPPED INTRUDERCLIMB RATE 300 FT/MIN N 360 KNI'rS
CLIMB RATE 500 FT/MIN
HORIZONTAL O FFSETTVRN RATE VARIED
",o- 51-2'7
FIGURE 28. BASIC GEOMETRY FOR HORIZONTAL MANEUVER EVALUATION
Two separate cases are analyzed. In the first case, the intruder speed is higher
than the BCAS aircraft (360 knots versus 250 knots). For this case, the 6°/secturn rate represents a very strong horizontal maneuver. The load factor, G, in aturn is defined as the ratio of lift produced in banked flight to weight. The loadfactor in a constant rate turn can be expressed as a function of the rate of turnand velocity (reference 9) as follows:
G =J cos [arctan(r*v/1091)]V -
where: r = rate of turn in degrees per second
v = velocity in knots
The load factor, G, is 2.22 for the 6°/sec turn. Similarly, the standard rate turnyields G=1.41; the half standard rate turn yields G=1.ll. As can be seen, the 360-knot aircraft turning at 6°/sec represents an extreme maneuver.
For the second case analyzed, the intruder's speed is less than the BCAS aircraft'sspeed (150 knots versus 250 knots). The major difference in the two cases is thatin the first case, the high speed intruder has a positive range rate (no closure),relative to the BCAS aircraft prior to horizontal maneuvering, regardless of thehorizontal offset distance. As a result, detection cannot occur prior to horizon-tal maneuvering unless DMOD is penetrated. This is not true in the second case.For the low speed intruder, a negative range rate (closure) relative to the BCASaircraft exists prior to horizontal maneuvering. This permits earlier BCASdetect ion.
Two characteristics of BCAS protection are analyzed: (1) the vertical separationat CPA and (2) the timing of alarms prior to CPA.
56

The separation achieved with the various conditions and the high speed intruder isshown in f igure 29. The BCAS protection provided for the three turn rates iscompared. The resulting separation is plotted as a function of the time from turncompletion to CPA. When the time from turn completion to CPA equals or exceeds35 seconds, the performance is uniform for all turn rates (480-foot observedvertical CPA). This is expected since for all these encounters, the turn iscompleted prior to alarm generation. This results in the encounters being treatedas simple linear encounters. For these cases, the turn had no effect on BCASperformance.
An interesting point should be made while reviewing figure 28. Although BCASdetection follows turn completion and the encounters are purely linear at this time(30 seconds until CPA), the resulting separation is different for the various turnrates. Although the intruder is in linear flight when the initial alarm occurs,the alarm is delayed as the turn rate increases. This results because of rangetracker lag. With the higher turn rates, the range tracker yields lower rangeclosure rate estimates as the intruder rolls out of its turn. The lower trackedclosure rates result in alarm delays.
In general, when times from turn completion to CPA are less than 30 seconds, theseparation is reduced as the turn rate increases. In the cases of half standardrate turns, the separation always exceeds 300 feet. For standard rate turns whichrepresent fairly strong horizontal maneuvers for a 360 knot aircraft, the resultingseparation always exceeds 200 feet. For the twice standard rate turn, theseparation is insufficient when time from turn completion to CPA is 10 seconds orless.
The separation differences between the three curves on figure 29 are attributabledirectly to the timing of initial alarms. Figure 30 shows how the alarm timesdecrease significantly as the turn rate is increased. For the half standard rateturn, the minimal horizontal offset distance that can occur and still permit a 900turn to be completed is 2.88 nmi. These conditions result in an alarm 21 secondsprior to CPA. The minimum horizontal offset with a standard rate turn is 1.77nmi permitting an alarm to occur 17 seconds prior to CPA. For the highest turnrate, the minimum horizontal offset distance is 1.03 nmi, causing an alarm to occuronly 9 seconds prior to CPA. This late alarm results in only 69 feet verticalseparatiot. at CPA.
Interestingly, a 360-knot intruder turning at 6*/sec, so that turn completionand CPA are simultaneous, results from a horizontal offset distance of 1.03 nmi.If all the geometrical conditions are held constant except for the turn rate whichis increased, the horizontal offset distance is less than I nmi, the value of DMOD.This will cause an earlier alarm to occur and an increase in the resulting missdistance.
in figure 30 the three points marked with asterisks identify the initial alarmtimes and horizontal offsets associated with scenarios in which turn completionoccurs 10 seconds prior to CPA. For these three points, there is a significantdifference in the initial alarm times (15 seconds for the twice standard rate turn,19 seconds for the standard rate turn, and 22 seconds for the half standard rateturn). When the range is greater than DMOD, the initial alarm is controlled by therelative range rate. Initially, the range rate is positive, and no alarm occurs.To obtain a negative range rate (closure), some portion of the turn must be com-pleted by the intruder. In the three cases, approximately the same amount of turn
57

ARM RAT 0 A l AMI 50 i/
FIGRE 9. ERTCALSEPRATON OR HE IGH PEE UEQUPE ITUE
40t
I -
0
~ 20
-~ 1~--~ b0 SEC TURN
*TURN COM.PLETION OCCURS 10
10 SECONDS PRIOR TO CPA
0 1 2 3 4 5 6 7 9 9 10 1
HORIZONTAL OFfqFT DISTANCE PRIOR TO TURN (NMI)
80-5J-30
PIUGRE 30. ALARM TIMING FOR THE HIGH SPEED UNEQUIPPED INTRUDER
56
L.

is completed prior to the alarm (600 for the twice standard rate turn, 63* for thestandard rate turn, and 700 for the half standard rate turn). The difference ininitial alarm times results from the fact that the turn will be completed in 5seconds for the highest turn rate and in 12 seconds for the lowest turn rate. Theadditional 7 seconds of alarm time results in the significant increase inseparation.
The crossover of the curves on figure 30 can be explained as follows. For a fixedtime from turn completion to CPA, the horizontal offset distance must increase asthe turn rate is decreased. This causes thle curves to shift right as the turn ratedecreases.
The interaction between turn rate and horizontal offset distance prior to turn andits effect on the observed vertical CPA is shown in figure 31. The small verticalseparation, associated with the highest turn rate and the smallest offsetdistances, is due to the late alarm. The pattern of resulting observed verticalCPA's is attributable to the pattern of initial alarm times shown in figure 30.
The results of the low speed intruder encounters are presented in figure 32. Asbefore, the observed vertical CPA's are uniform when the time from turn completionto CPA equals or exceeds 35 seconds. For these cases, the separation is 418 feet(figure 32) versus 480 feet (figure 29) for the high speed scenario. The reductionin separation results because initially a negative command occurs for the low speedintruder, while the high speed intruder causes an immediate positive command forthese conditions. The negative command results because TRTRU (-R/RD) is higher for ji
the low speed intruder when threat volume is initially penetrated. The highervalue of TRTRU (more than the value of TVPCMD) causes an overestimation of theprojected vertical miss distance at CPA. For the low speed intruder, VMD isgreater than ALIM, the positive command threshold, which permits the negativecommand to occur. A transition to a positive command follows the initial negativecommand selection. The command sequence does not significantly reduce the achievedseparat ion.
As is the case for the high speed intruder, although BCAS detection occurs afterturn completion (30 seconds remain from turn completion to CPA), less separationresults for the higher turn rates. While the intruder is in linear flight whendetected for all three turn rates, range tracker lag causes a delay in alarmsfor the higher turn rates. When the time from turn completion to CPA is less than30 seconds, separation decreases with the decrease in time to CPA. Only oneencounter results in an observed vertical CPA of less than 200 feet. With only 5seconds between turn completion and CPA for the high turn rate, thle separation isonly 181 feet. One interesting fact presented in figure 32 is that when CPA andturn completion are simultaneous for the high turn, a significant increase occursin observed vertical CPA (378 feet). The increase occurs because the BCAS aircrafthas a negative range rate established for the low speed intruder (150 knots versus250 knots) well prior to horizontal maneuvering by the intruder. The horizontaloffset distance is only 0.4 nmi, which is much less than DMOD. The small offsetdistance and thle negative range rate permit the initial alarm to occur 28 secondsprior to CPA. This fact is verified in figure 33. Hence, the alarm occurs 13seconds before the intruder begins to turn.
59

(.R
OFFSEIP KI R 11 I UN, N')11
FIGURE 31. OFFSET TURN RATE INTERACTION EFFECT ON VERTICAL MISS DISTANCE(HIGH SPEED THREAT)
A review of figure 33 shows basically the same pattern of alarm times as seen inthe high speed intruder case. Several minor differences should be discussed. Forthe linear encounters, the initial alarms occur uniformly 30 seconds prior to CPA.This is 4 seconds earlier than in the high speed case. The difference is due tothe interaction between DMOD and a smaller value of -R/RD for the low speed in-truder. As reviewed before, the resulting separation for the linear encounters isslightly less in the low speed intruder cases because, initially, negative commandsare selected. Again an increase in the alarm length occurs when the horizontaloffset distance is significantly less than DMOD.
In figure 34 the interaction effect between horizontal offset distance and turnrate on observed vertical CPA is shown. As in the high speed case, the pattern isdirectly attributable to the pattern on initial alarm timing shown in figure 33.The smaller range of horizontal offset distances for the low speed intruderreflects the decrease in distance that can be covered by the low speed intruder.
With the performance level 5 range modification (offset) of 1 nmi, the review ofthe above results indicates good BCAS performance for a wide range of horizontallymaneuvering unequipped intruders. The vertical separation is significantly lessthan 200 feet for only one encounter. This occurred for a late, high ratehorizontal maneuver by a high speed intruder. Throughout the current analysis, theproper sense choice was always selected. Additional analysis for performance
60

ALARM 1\VR I I URN IAlARM' 0ICl RS AFI . ROL ANT. FI FROM
40v
1. 30:C WR
iIc .
00 .
lo 2.0 .. 0 3.
IORZ TA WFkF.T ItR' 1 INI IH DI H l N (,' I) PA fI] -"!
FIURE 33. ALRMTIMINGPAAT FOR THE LOW SPEUEUED INTRUDER
40

.00
'' H'P\
I IL
I 0AI W ' HI0 [~ I l (1 0.
FIGURE 34. OFFSET TURN RATE INTERACTION EFFECT ON VERTICAL MISS DISTANCE
(Low SPEED THREAT)
level 3 DMOD has shown adequate performance for encounters with velocitiesrepresenative of the terminal environment.
Studies have been made to determine the effect on observed vertical CPA caused byvariations in the crossing angle for horizontally maneuvering intruders. In
general, analysis indicates an increase in separation as the crossing angle is
increased. This is expected because an increase in the crossing angle results in
higher closure rates earlier in the scenario. As the crossing angle is decreased
below 90 °, separation again increases because the reduction in the horizontal
closure rate permits more time for BCAS action.
Linear Encounters With One Aircraft In Level Flight. The investigation of
the performance of Active BCAS logic during linear encounters is discussed in
this section. Previous analysis has shown that the performance of Active BCAS
logic during linear encounters in which BCAS aircraft have high vertical rates isexcellent (VSL Performance section). Therefore, the analysis focuses on encounters
in which BCAS aircraft have low vertical rates or are in level flight.
Two basic geometries are used for the analysis. In the first geometry(figure 35) a BCAS aircraft is flying level, while the unequipped threat aircraft
is descending from above at a known rate. Bot' ..rcraft have equal velocities, andthe horizontal crossing angle is 900. The ometry is modified by varying the
62
4-.4
1,1. .. . .

2 '',
N ' I P I I A I I :AR R H
1'1,% N N1I )~ V1 (A11 lSEIA" I 'N ' AR If 1)
)o
2(4) KNO fj_C II I ' .
FIGURE 35. BASIC GEOMETRY FOR LINEAR ENCOUNTER EVALUATION
vertical rate of the threat aircraft from -500 through -4,000 ft/min. The res-olution (observed vertical separation) is plotted as a function of the plannedvertical separation. The planned vertical separation was varied from -1,000 to+1000 feet in 100-foot increments.
Figure 36 presents the plots of observed vertical separation against plannedvertical separation for the linear encounter which has the BCAS aircraft in levelflight and the unequipped threat descending. The vertical rate of the unequippedaircraft is set at -500 and -1,000 ft/min. The data points labeled by the letter"I" indicate incorrect sense choice. The BCAS generated vertical separation islarger than the planned vertical separation in all cases. Marginal separationsare observed at two points: (1) -500 ft/min vertical rate and -200-foot plannedvertical separation and (2) -1,000 ft/min vertical rate and -100-foot plannedvertical separation. At both points, incorrect sense is chosen due to trackererror. This problem was discussed in the previous section on tracker performance.Figure 37 presents the observed vertical separation versus planned vertical separa-tion plots for vertical rates -2,000 and -4,000 ft/min. Adequate performance isobserved at all points.
Vertical rates greater than 1,500 ft/min for BCAS aircraft are not consideredin the analysis of level-flight unequipped threats versus maneuvering BCAS air-craft. The analysis of such encounters was presented in the VSL Performancesection. The performance was found to be adequate. Figure 38 presents theobserved vertical separation versus planned vertical separation plots for BCASaircraft vertical rates -500 ft/min and -1,500 ft/min. All plots show adequateseparation at all planned vertical separation points.
The performance of Active BCAS during linear encounters with an unequippedthreat is sufficient. Wrong sense choices, due to vertical tracker error, occurfor low vertical rates. W:ong sense choices need not necessarily result in in-sufficient separation.
63

0CLIMB SENSE COMMANDS ADEQUATE SEPARATION /
800 -z ..sD E S C E N D S E N S E C O ID IA N D )
hoo-"
U 400 / I - TNCORRECT SENSE CIOTF
N_ - - - UNEQUIPPED TNTRUDER DlSC .NI I l P.
-1000 FT/MIN
o 200
tMARGINAL SEPARATION -500 FT/MIN
0 IIII I I I I I-1000 -800 -600 -400 -200 0 200 400 600 800 looo
PLANNED VERTICAL SEPARArION (FEET)
FIGURE 36. VERTICAL SEPARATION FOR LINEAR ENCOUNTERS (LOW VERTICAL RATEFOR UNEQUIPPED INTRUDER)
Performance For Simultaneous Climbs/Descents by Both Aircraft. Two geometriesare analyzed. In both cases, the int er is unequipped. Figure 39 depicts thefirst geometry. For this case, both aircraft are maneuvering in the same verticaldirection. The planned vertical separation at CPA is varied from -1,000 through1,000 feet in 100-foot increments. In the second geometry (figure 40), theunequipped intruder descends at 1,000 ft/min, while the BCAS aircraft climbs at 600ft/min. The planned vertical separation at CPA is varied fom -1,000 through 1,000feet in 100-foot increments.
Figures 41 and 42 present the observed vertical separation versus planned ver-tical separation for each geometry. Adequate separation is observed in all cases.
The results of paired encounters in which both aircraft are climbing are veryconsistent with the results presented in figure 41. All results confirm that thealgorithm performance is excellent for encounters with unequipped threats when bothaircraft are maneuvering vertically.
CONCLUS IONS
The analyses of the Active Beacon Collision Avoidance System (BCAS) logic againstmode C equipped (ATCRBS) threats using the Fast-Time Encounter Generator (FTEG)yielded the following conclusions.
64

1000 /
ADEQUATE SEPARATION /
800 - \iC.. DESCENT SENSE MANDS
SENSE41 SENE OMA4~NDS
600 -
Q 'S
S 4 0 0 -\,
--- - ./ IrNEQtIIPPED TNTRUq)ER IESCENT RATE.
200-- -4000 FT/MIN200 -
MIARGINAL. SEPARATION -2000 FT/MIN
o0 1I I I I 1 I 1 1
-1000 -800 -600 -400 -200 0 200 400 600 800 1000
PLANNED VERTICAL SEPARATION (FEET)
FIGURE 37. VERTICAL SEPARATION FOR LINEAR ENCOUNTERS (HIGH VERTICAL RATE
FOR EQUIPPED INTRUDER)
1000 ADEQUATE SEPARATION& //DESCENT SENSE COMNNANDS
w Soo-
('00 - CLTIMB SE S ('tMMl/'-'N,':
400
" / BCAS A ICRA F TI VERT ICA LI A'Itl
¢n -- -500 FT /M IN200
-I.;RINAI, SEPARATION
o II I I I1-1000 -800 -600 -400 -200 0 200 400 600 800 100
PLANNED VERTICAL SEPARATION (FEIT)
FIGURE 38. VERTICAL SEPARATION FOR LINEAR ENCOUNTERS (LOW VERTICAL RATE
FOR EQUIPPED INTRUDER)
b5
4 - ,,, ll llI , -_

UN,4EQUIPPED INTRUDER .300 KNOTS
DE1.SCENT RATE -1 000 FT/lN
PLANNED VERTICAL.
SEPARAT1ION VARIE.)
DESCENT RATE - 000 FT/MIN
FIGURE 39. BASIC GEOMETRY FOR PARALLEL VERTICAL MANEUVER EVALUATION
DI-SCI.\i KAlE -1000 IINI
HlA NNEDA VI 1,1 CA 1
T OE P AROl I X A I l
ClI 1K RATEIL F VFT/T 'N-
FIUGRE 40. BASIC GEOMETRY FOR OPPOSING VERTICAL MANEUVER EVALUATION
66

1000ADEQUATE SEPARATION /
"x /
800 X X DESCENT SENSE COMMANDS /x /
600
400
S200-
MARGINAL SEPARATION
00 I I I I I I I
-1000 -800 -600 -400 -200 0 200 400 600 800 1000
PLANNED VERTICAL SEPARATION (FEET)80-51-41
FIGURE 41. VERTICAL SEPARATION FOR PARALLEL VERTICAL MANEUVERS BY AN
UNEQUIPPED THREAT
1000ADEQUATE SEPARATION
/
80 LCLIMB SENSE COMhANDS800 DESCENT SENSE COMMANDS
S400-
200
MARGINAL SEPARAT[ON
0-1000 -800 -600 -400 -200 0 200 400 600 800 1000
PLANNED VERTICAL SEPARATION (FEET)
FIGURE 42. VERTICAL SEPARATION FOR OPPOSING VERTICAL MANEUVERS BY AN
UNEQUIPPED THREAT
67
.. ...... ...... ....... ...... ... . .

VERTICAL TRACKER PERFORMANCE.
The vertical tracker performance based on the April 1979 logic was unacceptable.In August 1979, based on analysis of results of conflict simulation at the FederalAviation Administration (FAA) Technical Center, MITRE Corporation changed thevertical tracker algorithm and specified a new tracker 03 value. These changesresulted in improved vertical tracker performance. Even with improved trackerperformance, the tracked vertical rate still oscillates around 0 feet per minute(ft/mmn) after level off. The determination of command sense based on verticaltracker information can result in an incorrect sense choice due to vertical trackerlags and tracker oscillations. Since sense choice is made on one specific logiccycle, the periods of incorrect sense choice could be reduced by using other thanan a-3 vertical tracker.
Recent flight test results at the FAA Technical Center indicate that random mode Caltitude report quantization can result in vertical rate tracker errors. If theseerrors occur during the period of sense choice for unequipped threats, an incorrectsense choice can result. Further tracking parameter changes may eliminate the pro-blems associated with the tracked altitude excursions. However, it may be neces-sary to develop a dynamic vertical tracker. A dynamic tracker would make useof the mode C report history.
SENSE CHOICE LOGIC.
The original unequipped sense choice logic contained several flaws which resultedin poor or marginal separation performance. These flaws included a lack of accel-eration delay in the sense choice portion of the algorithm, a failure in the sensechoice logic to consider the impact of negative values of anticipated maneuver timebefore closest approach (TESC), a conservative time estimate for projected verticalmiss distance (VMD) projections causing positive commands when no commands arerequired, and poor unequipped intruder sense choice during tail chase encounters.These conditions have been corrected by logic changes. The revalidation of per-formance following these logic changes, in general, indicated adequate resolutionperformance.
Vertical rate tracker errors can dominate the measurement of the intruder truevertical rate. Tracked vertical rate errors can exceed 900 ft/mmn. As a result,sense choice logic modifications now make greater use of current relative verticalposition in sense choice for the ATCRBS intruder. These modifications havesignificantly improved resolution performance.
VERTICAL SPEED LIMIT PERFORMANCE.
In general, the vertical speed limit (VSL) performance is good, irrespective ofvertical rate, aircraft velocities, planned vertical separation, and crossingangle. The major problems found in the unequipped intruder logic pertaining toVSL's were (1) short duration VSL's, (2) generation of more than 1,000 feet ofvertical separation or unnecessary alarms for encounters involving high verticalrates or more than 1 nautical mile planned horizontal separation, and (3) commandtransitions due to tracker noise. The major changes to the VSL logic in previousBCAS algorithms corrected previous performance faults. The inclusion of an air-craft response acceleration model in the selection of the VSL magnitude has helpedto prevent VSL magnitude oscillat ions.
68

Vertical rate tracker errors cause unnecessary changes from 500 ft/mmn VSL alarmsto negative commands. This condition usually occurs when the BCAS aircraft'svertical rate is less than 1,000 ft/min and the ATCRBS threat is nearly level.Although a larger VSL alarm magnitude set caused less deviation in the verticalprofile of BCAS aircraft with vertical rates in excess of 2,500 ft/min, a change inthe magnitude of the VSL alarms is not recommended because the larger VSL magnitudeset doubled the number of alarm transitions.
GENERAL PERFORMANCE.
In general, BCAS performance for paired encounters involving an unequipped aircraftis excellent. The logic effectively handles abrupt horizontal maneuvers and alllinear encounters involving both high and low vertical rates. BCAS cannot alwaysprevent collisions in encounters that involve abrupt vertical acceleration.
ADVANTAGES OF PARTIAL POSITIONAL DATA.
Improvement in collision avoidance performance can be expected if partial posi-tional data augment the BCAS commands being displayed. This is especially truewhen an ATCRBS threat accelerates vertically during or immediately followingcommand sense selection.
RECOMMENDATIONS
Based on this analysis of Active Beacon Collision Avoidance System (BCAS) logicperformance evaluation for mode C equipped (ATCRBS) threats, the followingrecommendations are made:
1. The modifications of the Active BCAS Logic identified and validated in thisreport (chronologically listed in appendix B) should be implemented in the ActiveBCAS collision avoidance logic.
2. The error characteristics of a - 8 vertical tracking and the impact of theseerrors on the unequipped intruder sense choice logic suggest that a more responsivevertical tracker be developed.
69

REFERENCES
1. Zeitlin, A. D., Active Beacon Collision Avoidance System - Collision AvoidanceAlgorithms, MTR 79W00110, The MITRE Corporation, April 1979.
2. Billmann, B. R., Morgan, T., Strack, R., and Windle, J., Air Traffic Control/Full Beacon Collision Avoidance System Chicago Simulation, FAA-RD-79-16,April 1979.
3. Billmann, B. R., Morgan, T., Strack, R., and Windle, J., Air Traffic Control/Full Beacon Collision Avoidance System Knoxville Simulation, FAA-RD-79-54,August 1979.
4. Adkins, A., Billmann, B. R., Strack, R., and Windle, J., Air Traffic Control/Active Beacon Collision Avoidance System Knoxville Simulation, FAA-RD-80-3,March 1980.
5. Berry, T. and Morganstern, B., An Evaluation of Aircraft Separation AssuranceConcepts Using Airline Flight Simulators, ARINC Technical Report 1343-01-2058,December 1979.
6. Billmann, B. R., Morgan, T., Thomas, J., and Windle, J., Modeling of ActiveBCAS Measurement Errors: An Empirical Approach, FAA-RD-80-5, June 1980.
7. Broste, N. and Spencer, N., MITRE Letter to ARD-253, W46-0532, August 1979.
8. McFarland, A. and Spencer, N., MITRE Letter to ARD-242, W46-0613, January 1980.
9. Aerodynamics For Naval Aviators, NAVAIR 00-80T-80, Chief of Naval Operations,Aviation Training Division, March 1971.
70

APPENDIX A
DESCRIPTION OF THE FAST-TIME ENCOUNTER GENERATOR
FAST-TIME ENCOUNTER GENERATOR.
The Fast-Time Encounter Generator (FTEG) provides a dynamic representation ofaircraft flight profiles. This allows for (1) the analysis of the Beacon CollisionAvoidance System (BCAS) algorithm and (2) the evaluation of the BCAS algorithmlogic in both an error-free and error-degraded environment. The FTEG models thedynamic interaction between algorithm command generation and the aircraft response.The FTEG allows rapid replication of desired aircraft and algorithm conditionsacross a wide range of experimental conditions.
The FTEG generates up to 20 target reports to the BCAS surveillance function, eachlogic cycle, through establishment of user-defined aircraft encounter scenarios.The FTEG data set used to establish a scenario consists of:
1. Flight plans for all aircraft.
2. Closest point of approach miss distance ( AX, AY, AZ) between all aircraft.
3. BCAS equipage of all aircraft.
4. Aircraft vertical rate threshold parameters.
5. Error condition.
The FTEG allows the user to initially define the desired aircraft geometriesat the closest point of approach. Through the fast-time simulation of desiredscenarios, the FTEG provides the means to rapidly evaluate the BCAS conflictresolution performance. Selected conflict information is extracted from the BCASalgorithm to create line printer output and Cal-Comp'T plots to allow the analyst to"see" algorithm performance.
The FTEG's error modeling capability permits evaluation of error-degraded algorithmpertormance. Simulation in an error-degraded environment is performed throughmodeling the following surveillance, measurement, and tracking errors:
Transponder delay.
Alt itude correspondence error.
h, MAS) aircraft altitude error.
!.r lt ittide error.
m..r (acquisition) delay.
r.-rt s
A- I

To allow for simulation in an error-free or error-degraded environment, eachaircraft in the scenario has an error code which specifies the error mode (free ordegraded). The input errors, if present, are applied to the input measures in theBCAS surveillance function.
The FTEG provides for the simulation of the dynamic interaction between the air-craft response and BCAS algorithm command generation. All BCAS equipped aircraft
will follow the predefined flight plans until a BCAS command is generated.Unequipped aircraft will always fly the predefined flight paths. To facilitateaircraft response to the BCAS commands, the FTEG distinguishes between advisory andeffective commands. An advisory is an algorithm-generated alarm which does notconflict with the aircraft's current flight plan. An example is a "don't descend"command while the aircraft is in a climb. Effective commands are those which doconflict with the current flight plan. Processing is discontinued for alladvisories as no flight plan change is generated. The applicable flight planchange is generated for effective BCAS commands. Table A-1 lists the Active BCAScommands and the aircraft response.
All aircraft respond to the positive commands by maneuvering in the desired direc-tion (sense) until the command is dropped or changed, or until the aircraft reachesthe desired response rate. Two FTEG parameters, which may vary between simula-tions, are required to maneuver aircraft in response to the generated BCAScommands. The first is the positive command response rate which specifies thechange in vertical rate to be achieved when an aircraft receives a positive BCAScommand. The second is the acceleration parameter which specifies the change ofrate of the aircraft in attaining the desired vertica' rate. Given a BCAS positivecommand, the aircraft will accelerate at the rate specified by the parameter valueuntil the desired vertical rate is attained or the command is dropped or changed.The BCAS advisories (negative and vertical speed limit commands) intrinsicallydetermine the desired vertical rate (see table A-I). In attaining this verticalrate, the aircraft will accelerate (or decelerate) at the specified accelerationparameter value. Given an effective BCAS advisory the aircraft will accelerate (ordecelerate) until the desired vertical rate is achieved or the command is droppedor changed. To simulate pilot response delay, the FTEG allows for a variableresponse delay selected from a I- to 14-second truncated gamma distribution or auser-chosen pilot-response delay which will remain constant throughout the simula-tion. Generally, in the analysis of the BCAS algorithm, pilot response was heldfixed at 5 seconds to reduce additional performance variation.
The FTEG has the capability to simulate an individual scenario up to 1,000 timesper computer run. This capability was developed to aid in the analytical effortsof algorithm performance in an error-degraded environment. It is in this environ-ment that algorithm performance may vary given identical scenarios. A morepowerful feature of the FTEG is the ability (1) to modify certain parameters of theFTEG scenario data set and (2) to perform a simulation with the updated scenario.The FTEG can simulate up to 256 related scenarios per computer program. Thisprocess aids in the analytical effort through identification of specific flightdata corresponding to a breakdown in BCAS algorithm performance. This provides asensitivity analysis capability.
A-2

TABLE A-1. BCAS COMMANDS AND AIRCRAFT RESPONSE
COMMAND SENSE OF AIRCRAFT AIRCRAFT AIRCRAFTMEANING COMMAND CLIMBING DESCENDING LEVEL
0 - No Command NE* NE NE
I - No Climb Descend Level Off NE NE
2 - No Descent Climb NE Level Off NE
3 - Not Used N/A N/A N/A N/A
4 - Climb Climb Increase Climb at Climb at
Climb to Response Response
Present Rate Rate
Rate + Re-
sponse Rate***
5 - Descend Descend Descend at Increase Descend
Response Descent to at Response
Rate Present Rate
Rate +
Response
Rate
6**- Limit climb Descend Climb S NE NE
to 2,000 ft/min +2,000
ft/min
7**- Limit climb
to 1,000 ft/min Descend Climb S NE NE
+1,000
ft/min
8** - Limit climb Descend Climb S NE NEto 500 ft/min +500
ft/min
9** - Limit descent Climb NE Descend S NE
to 500 ft/min -500
ft/min
10* - Limit descent Climb NE Descend s NE
to 1,000 ft/min -1,000ft/min
ll** - Limit descent Climb NE Descend S NE
to 2,000 ft/min -2,000
ft/min
* No effect (NE) on aircraft vertical rate.
** These are vertical speed limit commands (VSL's). Response to these commands
is effected only if the aircraft exceeds the VSL rate.
* Response rate is defined 5y the user. No vertical rate exceeds aircraft typelimiting values defined in the FTEG input.
A- 3

APPENDIX B
CHRONOLOGICAL REVIEW OF MODE C EQUIPPED (ATCRBS) THREAT PERFORMANCE DEFICIENCIES
This appendix presents the chronological review of logic deficiencies for mode C
equipped (ATCRBS) threats. Each deficiency is briefly identified. Page numbers
refer the reader to portions of the report which describe the deficiency and tested
solutions in fuller detail.
LOGIC DEFICIENCIES
PROBLEM DESCRIPTION MODIFICATION PAGE
1. The larger of two threat volumes 1. Sensitivity performance 9
was not always selected properly. level selection has becomea function of the detectionand resolution logic modelDRACT (May 1979).
2. The coordination logic did not 2. The coordination module 8
initiate the storage of threat COORD was modified to
track block data. initiate the storage oftrack block data (May 1979).
3. Poor performance of the 3. The B parameter has been 9tracker caused incorrect changed twice. Othersense choices, inconsistent logic changes have alsocommand patterns, and been added to control
unacceptable separation the problem of incorrectfor ATCRBS threats, sense choice. These
modifications have nottotally resolved the problems(July, August 1979; June 1980).
4. The ATCRBS sense choice 4. Logic modifications were 24
logic did not consider the made to base selection ofimpact of negative values command sense on relative
of TESC, the anticipated positive when TESC ismaneuver time before closest negative (July 1979).point of approach (CPA).
5. Sense choice logic for ATCRBS 5. An acceleration model 21threats failed to allow for the was added to the ATCRBStime delay to achieve the vertical sense choice logicrate change in the modeled re- (August 1979).sponse.
B-
B-i

LOGIC DEFICIENCIES
PROBLEM DESCRIPTION MODIFICATION PAGE
6. The projected vertical miss 6. The absolute value of VMD 27distance (VMD) estimate is a is checked to determine ifsigned value; positive com- positive commands aremands can result when none necessary (August 1979).are required.
7. The logic used a conservative 7. The projection time for 27projection of vertical miss threat detection TVPCMDdistance which generated un- increased from 25 to 35necessary positive commands seconds. (August 1979). Awhen large negative values of new alarm filter using VMDvertical miss distance actually imformation was added. Thisexisted. filter compares the projected
range at time of coaltitude(January 1980). Very recently,major modifications of the VMDlogic have been made to controlpositive alarms (July 1980).
8. Vertical tracker noise and 8. Modification of the logic 38aircraft response caused secondary requires VSL commands to bevertical speed limit (VSL) displayed for a minimum ofcommands of I-second duration five seconds (July 1979).to occur. In some encountersa cyclic pattern of 1-second VSLcommands are observed.
9. For near level-flight tail 9. Sense choice logic for 30chase encounters with an ATCRBS threats was modifiedATCRBS threat, incorrect so that when vertical ratessense choice may result, are low (<300 ft/min) sense
choice is based on relativeposition (November 1979).
10. If ATCRBS threats with high 10. The logic now provides partial 32vertical rates decelerate just positional data (PPD) on threatprior to sense choice selection, aircraft (January 1980). Addi-Beacon Collision Avoidance System tional vertical tracker improve-(BCAS) commands which reduce ments are under study to limitseparation may often result, incorrect sense choice selection.
B-2
.4

APPENDIX C
ACTIVE BEACON COLLISION AVOIDANCE SYSTEM (BCAS) LOGIC IMPLEMENTATION
BCAS ALGORITHM.
The Fast-Time Encounter Generator (FTEG) provides aircraft flight data to theActive Beacon Collision Avoidance System (BCAS) collision avoidance algorithmmodules. An interface between the FTEG and BCAS modules simulates the functions ofan Active BCAS surveillance tracker. This surveillance routine, SURVEL, providesthe means for converting the true FTEG positional measures into the necessary datainputs to the BCAS modules. Several other interface functions are also accom-plished in the surveillance routine.
FTEG data is provided to the BCAS surveillance routine every second for each air-craft that is active in the simulation. This data includes:
1. Equipage status of each aircraft in the simulation.
2. True grid position (X,Y,Z) of each active aircraft in the simulation.
3. Current simulation time TCUR.
4. Discrete Address Beacon System (DABS) ID if the aircraft was not mode Cequipped (ATCRBS).
The true range rate and relative altitude rate for aircraft in a pair are notdirectly provided to the BCAS algorithm. For each possible pair combination,SURVEL calculates the range and relative altitude between aircraft in the pair. IfBCAS performance in the presence of Active BCAS measurement errors is evaluated,the errors are applied to the input measures before any further processing.
For each pair, estimates of the range rate and the relative altitude rate betweenaircraft are calculated by the surveillance function. Track files for all possible
pairs are then obtained. Using the range rate and altitude rate estimates, coarsetrack filtering of all possible conflict pairs is then accomplished. The coarsetrack procedure is not described in the baseline logic document, but is the sameone that was used for previous real-time Active BCAS experimentation (reference 4).The coarse track procedure is presented in table C-i.
The Active BCAS evaluation requires the modeling of delayed coarse track establish-ment and missing track reports. The modeling of track establishment interruptionsoccurs in SURVEL prior to coarse track filtering. Missing track reports aremodeled by interrupting the data flow for a specific equipped aircraft threat pair.Missing track reports are modeled after the pair has passed coarse track. Thispermits the evaluation of the internal track coasting procedures in the collisionavoidance algorithms.
SURVEL performs several data conversions for BCAS. Prior to making any relativealtitude calculations, the true aircraft altitudes are converted to mode C altitudereports. The mode C altitude reports form the basis for all aircraft altitude datamanipulations. The slant range from the reference point (0,0,0) is calculated foreach aircraft. This permits TROACT to determine the proper threat thresholdsensitivity performance level for each equipped aircraft.
C-I

The BCAS logic requires a desensitization method for its threshold parameters. The
threat thresholds which identify the BCAS protection volume must be reduced at some
point along the arrival path of an aircraft to a terminal which would permit
adequate collision avoidance protection without generating an unacceptably high
number of alarms. This is accomplished by defining five levels of BCAS threatdetection and resolution logic with different threshold parameters for each per-
formance level. As the performance levels increase from I to 5, the threshold
parameters become more sensitive, thereby increasing the protection volume around
each BCAS equipped aircraft. At the time of the evaluation, the following BCAS
desensitization scheme was in use: BCAS is shut off in performance level 1. At
performance level 2, BCAS tracks the intruder, but all resolution logic is blocked.
BCAS protection is available only at levels 3, 4, and 5. The performance level
that applies to a particular aircraft is based on the aircraft's altitude and range
from a radar beacon transponder (RBX) or sensitivity control unit (SCU). Figure
C-1 depicts the performance level boundaries used in the analysis. A later change
to this desensitization scheme permitted the identification of two additional
altitude strata, AOUTER and AINNER, to further desensitize BCAS performance in the
terminal area. Due to the late addition of this desensitzing altitude strata, an
evaluation of this new desensitization scheme was not performed. The values of the
significant BCAS parameters for each performance level are shown in table C-2.
In order to evaluate BCAS performance, the resulting BCAS commands had to be inter-
faced into the FTEG flight simulation modules. The BCAS commands are returned to
the FTEG in a numerical code form. The codes appear throughout this report in the
documentation of the results. The possible BCAS commands and their numerical codes
are shown in appendix A, table A-l.
An FTEG executive routine, BCASCNT, controls the logic flow between the various
BCAS logic modules. Since the FTEG can simultaneously model the flight of up to 20
different equipped aircraft, this requires that the BCAS logic be executed each
second for each equipped aircraft. To support this multiple aircraft simulation
process, the high level BCAS logic flow chart (as shown in the baseline logic
document) was modified slightly. To ensure proper coordination, all tracking and
resolution logic is first executed for all equipped aircraft. This provides the
necessary data that is needed prior to exercising the coordination logic, multiple
aircraft resolution logic, and the display logic. This double loop process is
exercised once a second. Since the FTEG is a discrete time simulation system, thishigh level flow modification does not influence the performance of BCAS. The highlevel logic flow used in this evaluation is presented in figures C-2 and ('-3.
The BCAS air-to-air coordination procedures are the same as those shown in
reference I. Coordination with equipped threats requires the simulation of in
terrogation messages in the COORD module. These messages ale received and
manipulated by the RCV module for the equipped threat. Coordination requires the
manipulation of the CIR "D" field arrays as shown in the baseline document.

r-
TABLE C-I. BCAS COARSE TRACK PROCEDURE
TALUV<75 sec TAUV<75 sec TAUV>75 sec TAUV>75 secRZ<4,000 feet RZ>47,000 feet RZ<4,000 feet RZ>4,000 feet
R<3 nmi P P P FTAUR<75 sec
R<3 nmi P P P FTAUR>75 sec
R>3 nmi P P P FTAUR<75 sec
R>3 nmi F F F FTAUR<75 sec
R = Range RZ = Relative AltitudeRD Range Rate RZD = Relative Altitude RateTAUR = -R/RD TAUV = -RZ/RZDTAUR = 76 if RD > 0 TAUV = 76 if RZD > 0P = Pass this pair to algorithm processing if either aircraft is equipped.
F = No potential conflict. Do not pass this pair.
LEVEL 4 LEVEL 3 L.VFl 2 I. I I "
K- I It.R R -INNT R - N IR - '
FIGURE C-I. ACTIVE BCAS I)ESENSITIZATION ZONE
C-3
0g

TABLE C-2. ACTIVE BCAS PARAMETER SETTINGS
Symbol Definition Level Value
ACCEPT Vertical threshold for credibility test ALL 400 ft
when intruder selects imcompatable
maneuver.
ALFAR Tracking constant for range ALL 0.4
ALFAZ Tracking constant for altitude ALL 0.4
ALIM Altitude threshold for choice of 5 440 ft
positive or negative command 4 340 ft3 340 ft
ALPC Lower boundary for high altitude 5 18,000 ft
airspace
ALUH Lower boundary for ultrahigh 5 29,000 ft
altitude airspace
ASEPH High altitude positive command 5 640 ft
threshold
ASEPU Ultrahigh altitude positive command 740 ft
threshold
ATERN Altitude threshold below which descent 3, 4 500 ft
commands are not used when radar altimeterinput is available
BETAR Tracking constant for range rate ALL 0.15
BETAZ Tracking constant for altitude rate ALL 0.10
BUSMAX Limit to number of busy replies to ALL 20
coordination attempts
CLMRT Assumed climb escape rate ALL 16.67 ft/sec
CORR Threshold for positional correlation ALL 6.00of ATCRBS
DESRT Assumed descent escape rate ALL -25 ft/sec
DMOD Modification distance applied 3 0.1 nmito tracked range 4 0.3 nmi
5 1.0 nmi
EITHER Threshold for accepting either ALL 150 ftclimb or descent
HI Divergence threshold at which ALL 0.00278commands are inhibited nmi2
/,sec
INTHAX Limit of coordination interrogation ALl 8attempts
RDTHR Range rate threshold used to compute ALL 0.00167
range tau during parallel flight nmi/sec
TDROP Time required without reported data ALL 10 secto drop a track
TLARGE Large positive number ALL 1,000
TMIN Minimum time for display of command ALL 5 sec
TRTHR Threshold applied to range tau 1 30 secfor threat detection 4 25 sec
5 30 sec
TVPCMD Look-ahead time for altitude 3 45 secdetection 4 40 sec
3 40 sec
TVPESC Look-ahead time for altitude 3 30 secresolution

W... . .. . .W. . T - --cDMOD Modification distance applied 3 0.1 nmi
to tracked range 4 0.3 nmi5 1.0 nmi
EITHER Threshold for accepting either ALL 150 ftclimb or descent
HI Divergence threshold at which ALL 0.00278commands are inhibited nmi
2/sec
INTMAX Limit of coordination interrogation ALL 8attempts
RDTHR Range rate threshold used to compute ALL 0.00167range tau during parallel flight nmi/sec
TDROP Time required without reported data ALL 10 sec
to drop a track
TLARGE Large positive number ALL 1,000
TMIN Minimum time for display of command ALL 5 sec
TRTHR Threshold applied to range tau 3 30 sec
for threat detection 4 25 sec5 30 sec
TVPCMD Look-ahead time for altitude 3 45 secdetection 4 40 sec
5 40 sec
TVPESC Look-ahead time for altitude 3 30 sec
resolution 4 30 sec5 35 sec
TVTHR Threshold applied to vertical tau 3 30 sec
for threat detection 4 25 sec5 30 sec
TV1 Time delay provision for log in ALL 5 secresponse to commands
VACCEL Assumed escape vertical acceleration ALL 8 ft/sec2
V2000 Threshold for 2,000 ft/min vertical speed ALL 33.33 ft/seclimit (VSL)
VIO00 Threshold for 1,000 ft/min VSL ALL 16.67 ft/sec
V500 Threshold for 500 ft/mmn VSL ALL 8.33 ft/sec
ZDTHR Altitude rate threshold used in 3 -30 ft/secthreat detection 4 -30 ft/sec
5 -25 ft/sec
ZTHR Immediate altitude threshold ALL 750 ftused in threat detection
ZTHRH High altitude threshold for 5 850 ft
threat detection
ZTHRU Ultrahigh altitude threshold 5 950 ft
for threat detection
ZDLVL Vertical rate limit below which ALL 5 ft/seccurrent altitudes are used formaneuver sense determination

T IVF. Rotl INE)
StORVEL
'EDAA (SUrRVEILLANCE NCOARSE FILTER &
AIRCRAI I RACKP IlNO1-P1 FOR All., A IRCRAF I
TRACKINU (LOOP FOR ALL COARSE THREATSMJ FOR EULIFPPED A IRCRAFI (1)
TRIACT
(DISABLE IlCAS) NE(>2EROMI
FIGURE C-2. HIGHBLE VE BC S T A
KI G A D RE O U I N L W H R
C- 5

C-6-