fFRAMATOME AN P FANP-01-988 Project Number … same CFT line break scenario exceeded the 2200 TF...
84
fFRAMATOME AN P April 2, 2001 FANP-01-988 Project Number 693 Document Control Desk U.S. Nuclear Regulatory Commission Washington, DC 20555-0001 Attn: Mr. Stewart N. Bailey Subject: Transmittal of Final Report on the Evaluation of PSC 2-00 Relating to Core Flood Line Break with 2-Minute Operator Action Time Reference: 1. PSC 2-00, "Core Flood Tank Line Break with 2 Minute Operator Action Time", filed 205 T4.4, July 28, 2000. 2. Letter to USNRC, "Report of Preliminary Safety Concern Related to Core Flood Line Break with 2-Minute Operator Action Time", FTI-00 2433, dated September 26, 2000. 3. Interim Report on the Preliminary Safety Concern (PSC2-00) Related to Core Flood Line Break with 2-Minute Operator Action Time", FTI 00-3085, December 20, 2000. Attachment: 1. FRA Document, "Summary of PSC 2-00 Analyses", March 30, 2001, FRA Document Number 51-5009856-00. Gentlemen: The purpose of this letter is to advise you of the results of the evaluation of a potential safety concern (PSC2-00) documented in Reference 1 and reported in Reference 2. The concern relates to the consequences of a potential core flood tank (CFT) line break with offsite power available. Historically, the CFT line break has been analyzed for the B&W designed plant with a loss-of-offsite power (LOOP) at the time of reactor trip. However, with offsite power available, the operators are required (per the emergency operating procedures) to trip the reactor coolant pumps (RCP's) immediately following the loss of subcooling margin (LSCM). The RCP trips have been credited within two minutes following loss of subcooling margin in previously approved analyses. Analyses performed with the approved ECCS Evaluation Model predicted peak cladding temperature increases for several of the B&W designed plants when the RC pumps are powered for the first two minutes following the loss of subcooling margin. FRA-ANP evaluated the SBLOCA Evaluation Model pump degradation model and concluded that it cannot be considered conservative for this two minute RCP trip analysis. Use of a lower 3315 Old Forest Road P.O. Box 10935 Lynchburg, VA 24506-0935 Tel: 804-832-3000 www.framatech.com
Transcript of fFRAMATOME AN P FANP-01-988 Project Number … same CFT line break scenario exceeded the 2200 TF...

fFRAMATOME AN P April 2, 2001 FANP-01-988
Project Number 693
Document Control Desk U.S. Nuclear Regulatory Commission Washington, DC 20555-0001
Attn: Mr. Stewart N. Bailey
Subject: Transmittal of Final Report on the Evaluation of PSC 2-00 Relating to Core Flood Line Break with 2-Minute Operator Action Time
Reference: 1. PSC 2-00, "Core Flood Tank Line Break with 2 Minute Operator Action Time", filed 205 T4.4, July 28, 2000.
2. Letter to USNRC, "Report of Preliminary Safety Concern Related to Core Flood Line Break with 2-Minute Operator Action Time", FTI-002433, dated September 26, 2000.
3. Interim Report on the Preliminary Safety Concern (PSC2-00) Related to Core Flood Line Break with 2-Minute Operator Action Time", FTI00-3085, December 20, 2000.
Attachment: 1. FRA Document, "Summary of PSC 2-00 Analyses", March 30, 2001, FRA Document Number 51-5009856-00.
Gentlemen:
The purpose of this letter is to advise you of the results of the evaluation of a potential safety concern (PSC2-00) documented in Reference 1 and reported in Reference 2. The concern relates to the consequences of a potential core flood tank (CFT) line break with offsite power available. Historically, the CFT line break has been analyzed for the B&Wdesigned plant with a loss-of-offsite power (LOOP) at the time of reactor trip. However, with offsite power available, the operators are required (per the emergency operating procedures) to trip the reactor coolant pumps (RCP's) immediately following the loss of subcooling margin (LSCM). The RCP trips have been credited within two minutes following loss of subcooling margin in previously approved analyses.
Analyses performed with the approved ECCS Evaluation Model predicted peak cladding temperature increases for several of the B&W designed plants when the RC pumps are powered for the first two minutes following the loss of subcooling margin. FRA-ANP evaluated the SBLOCA Evaluation Model pump degradation model and concluded that it cannot be considered conservative for this two minute RCP trip analysis. Use of a lower
3315 Old Forest Road P.O. Box 10935 Lynchburg, VA 24506-0935 Tel: 804-832-3000 www.framatech.com

Page 2
bound "MB" LBLOCA degradation curve is conservative. When this degradation curve is used, the peak clad temperature (PCT) for CFT line break with a two minute RCP trip at TMI-1 and CR-3 exceeded the acceptance criteria. When this lower bound curve is used with a one-minute RCP trip, the PCT acceptance criteria is met and there is little or no uncovering of the core.
The analyses supporting the evaluation of PSC 2-00, reported as preliminary results in Reference 3, are provided in detail in the attachment to this letter. The analyses performed to evaluate the reportability of PSC 2-00 consequences relative to delayed RCP trip for the CFT and large CLPD SBLOCA analyses for all of the B&W-designed plants are summarized herein.
A two-phase pump degradation sensitivity study was performed to define the appropriate, yet conservative, two-phase RCP head degradation curve model that should be used in the PSC 2-00 analyses. This study was completed prior to plant-specific reanalysis of those break types and sizes that could result in a PCT consequence more severe than the corresponding results for an analysis with LOOP near the time of reactor trip. For several plants, an earlier RCP trip time criterion was required to produce acceptable PCT consequences.
The RCP two-phase degradation studies followed the classical EM approach of analyzing two-phase RCP performance curves that were derived from the Semiscale pump tests. The study involved running a general use curve, minimum bound curve, and maximum bound curve to determine which pump performance curve produces the most limiting core cooling consequences. Although this approach has typically only been applied to LBLOCA scenarios, it is also appropriate to use it for the SBLOCA and CFT line break applications with continued RCP operation. The degradation study, which was shown to be generically applicable to all the B&W-plants, was completed with a two-minute RCP trip time. Use of the upper bound, or maximum two-phase head degradation model known as the MI curve, and the general use "RELAP5-Default" head degradation curve produced similar results with non-limiting overall PCTs. Use of the lower bound, or minimum two-phase head degradation curve known as the M3-modified curve, minimized the residual core liquid inventory and produced significantly worse results. The calculated PCT for the M3-modified curve exceeded the 10 CFR 50.46 acceptance criterion. Based on the calculated thermal-hydraulic results for the CFT line breaks, it was clear that the M3-modified curve would also be limiting for the larger CLPD breaks. Therefore, all revised PSC 2-00 plant cases with delayed RCP trip used this limiting head degradation curve.
With offsite power available, the operators are instructed by the latest revision of the generic EOPs to trip the RCPs immediately following the LSCM. This action has been credited in ECCS analyses at exactly two minutes after LSCM. This operator action time for the CFT line breaks from full power operation at ONS-1, ONS-2, ONS-3, ANO-1 (with LPI cross-tie flow credit), and DB-1 plants produced increases in the PCT consequences. However, this maximum PCT was well below the acceptance criteria when

Page 3
the limiting M3-modified degradation curve is used with a single failure that takes a complete ECCS train (one LPI and one HPI pump) out of service. In fact, the PCTs remained below the limiting PCT produced for the entire SBLOCA spectrum performed with LOOP. The same CFT line break scenario exceeded the 2200 TF acceptance criteria for TMI- 1 and CR-3. Acceptable PCT consequences (with no core uncovering) were only predicted with a one-minute RCP trip at TMI-1 and CR-3 for a power level of 2568 MWt.
There is also a CFT line break scenario that exceeded the 2200 OF acceptance criteria for the Oconee units when operating at a reduced power level because an HPI pump is out of service. Analyses with LOOP at reactor trip have been completed for Oconee justifying operation at 75 percent full power under this condition. With only two HPI pumps available at the plant, a single failure that takes another one out of service significantly reduces the ECCS flow to the core thereby requiring a lower initial core power. If a CFT line break is analyzed with offsite power available and a single failure that takes a complete ECCS train (one LPI and one HPI pump) out of service, then only a single HPI pump is providing the core pumped injection cooling. With a two-minute RCP trip, unacceptable PCTs are obtained at a power level of 75 percent of 2568 MWt. However, acceptable PCT consequences were predicted when the core power level was reduced to 50 percent of 2568 MWt. (Note: Acceptable PCTs can also be obtained with a oneminute RCP trip at 75 percent full power, although Duke Power also requested the reduced power level case.)
New larger CLPD analyses were also performed for all the B&W-designed plants with offsite power available. These plant-specific analyses used a two-minute RCP trip with the M3-modified curve to analyze the 0.3-, 0.5-, and 0.75-ft2 CLPD break sizes. Although there were significant PCT increases for the 0.5-ft2 cases for all plants, the limiting SBLOCA PCT remained below the most limiting break size or type calculated with LOOP near the time of reactor trip.
The attachment to this letter report summarizes 51 specific EM cases needed to characterize the scope of analyses necessary to assure that the issues expressed by the FRA-ANP preliminary safety concern, PSC 2-00, were adequately addressed and resolved. The cases performed in resolution of this PSC were confirmed that they were performed in compliance to the RELAP5/MOD2 EM, with two exceptions noted. The two exceptions included 1) use of a more conservative M3-modified two-phase head degradation curve and 2) use of the RELAP5/MOD2 void-dependent cross-flow model that is currently under NRC review. This model automates usage of the current crossflow model. The new delayed RCP trip SBLOCA analyses for all of the B&W-designed plants included CFT initial condition sensitivity studies to ensure the limiting consequences were not under-predicted for the breaks analyzed. It was concluded from these analyses that the CFT line break is the only transient scenario for which a potential safety concern existed, and was only a problem for TMI-1 and CR-3 for a manual RCP trip time greater than one minute. There is no safety concern for the DB-1, ONS-1, ONS-2, ONS-3, and ANO-1 (with credit for LPI cross-tie flow) at full power conditions. A potential safety concern also existed for the 75 percent full-power CFT line break analyses (with one HPI

Page 4
pump) for the three Oconee units with a two-minute RCP trip, but it was not a safety concern with the one-minute trip. Duke Power also opted to reduce the allowed power level to 50 percent full power to allow the full two minutes for the operator action. With the amplification of existing guidance and the demonstrated ability to immediately trip the RCPs (i.e. within one-minute), including selected core power limit reductions in some cases, there is no safety concern.
As a result of the evaluations summarized above, and provided in detail in the attachment to this letter, the concerns of PSC 2-00 do not constitute a defect or substantial safety hazard as defined in 1OCFR 50 Part 21. An adequate margin of safety is maintained. This concern is not reportable under Part 21.
If there are questions on the evaluation results please contact Robert Schomaker at 804832-2917 or the undersigned at 804-832-3635.
Sincerely,
Davi .IFirth Manager B&W Owners Group Services

20440-8 (1/2001)
RAMATOME ANENGINEERING INFORMATION RECORD FRAMTOMEAN P
Document Identifier 51 - 5009856 - 00
Title SUMMARY OF PSC 2-00 ANALYSES
PREPARED BY: REVIEWED BY:
Name J.A. KLINGENFU,% Name D. R. PAGE BLAIR
Signature .1. Date 31,3/0/ SignaJ J4Date ''I
Technical ManaStatepndnt.nitials
Reviewer is Independent.
Remarks:
This report summarized 51 specific EM cases needed to characterize the scope of analyses necessary to assure that the issues expressed by the FRA-ANP preliminary safety concern, PSC 2-00, were adequately addressed and resolved. The cases performed in resolution of this PSC used Reference 7 to confirm that they were performed in compliance to the RELAP5/MOD2 EM (Reference 3), with two exceptions noted. The two exceptions included 1) use of a more conservative M3-modified two-phase head degradation curve and 2) use of the RELAP5/MOD2 void-dependent cross-flow model that is currently under NRC review. The new delayed RCP trip SBLOCA analyses for all of the B&W-designed plants included CFT initial condition sensitivity studies to ensure the limiting consequences were not under-predicted for the breaks analyzed. It was concluded from these analyses that the CFT line break is the only transient scenario for which a safety concern existed, and was only a problem for TMI-1 and CR-3 for a manual RCP trip time greater than one minute. There is no safety concern for the DB-1, ONS-1, ONS-2, ONS-3, and ANO-1 (with credit for LPI cross-tie flow) at full power conditions. A potential safety concern also existed for the 75 percent full-power CFT line break analyses (with one HPI pump) for the three Oconee units with a two-minute RCP trip, but it was not a safety concern with the one-minute trip. Duke Power also opted to reduce the allowed power level to 50 percent full power to allow the full two minutes for the operator action.' With the amplification of existing guidance and the demonstrated ability to immediately trip the RCPs (i.e. within one-minute), including selected core power limit reductions in some cases, there is no safety concern and PSC 2-00 can be closed.
Page 1 of 82

2
51-5009856-00
Record of Revision
Revision Date Description Change Pages.
0 March Original Release All 2001

51-5009856-00
3
P .... L----• A klr"l I•
rramaiome.A1-r" IncU.
Table of Contents
Record of Revision ............................................................................................. 2
Table of Contents ..................................................................................................... 3
List of Tables ...................................................... ................................................... 4
List of Figures ........................................................................................................... 4
List of References ................................................................................................ 5
List of Common Acronyms .................................................................................. 7
1. Background .............................................................................................................. 9
2. Issuance of the Preliminary Safety Concern .................................................... 11
3. Historical SBLOCAs Pump-On Analyses and Guidance ................................... 13
4. PSC Resolution Overview ................................................................................. 16
5. RCP Degradation and Other Generic Sensitivity Studies .................................. 20
5.1 RCP Two-Phase Degradation Sensitivity Study ........................................... 20
5.2 RCP Trip Time Sensitivity Study .................................................................... 23
5.3 Expanded Large SBLOCA CLPD Break Spectrum ....................................... 23
5.4 Continuous RCP Operation for Limiting CLPD Break .................................... 24
5.5 Generic Observations on Selection of the CFT Initial Conditions ................. 24
6. PSC 2-00 Plant-Specific Analyses without LOOP ................................................. 28
6.1 PSC 2-00 Analyses for TMI- .......................................I................................. 32 6.1.1 TMI-1 CFT Line Break Cases with Offsite Power Available .................... 34 6.1.2 TMI-1 0.75-, 0.5-, and 0.3 ft2 CLPD Break Cases without LOOP .......... 35
6.2 PSC 2-00 Analyses for CR-3 ........................................................................ 40 6.2.1 CR-3 CFT Line Break Cases with Offsite Power Available .................... 42 6.2.2 CR-3 0.75-, 0.5-, and 0.3 ft2 CLPD Break Cases with Offsite Power
Available ............................................................................................... 48
6.3 PSC 2-00 Analyses for the Three Oconee Units .......................................... 53 6.3.1 Oconee CFT Line Break from Full Power with Offsite Power Available ..... 56 6.32 Oconee CFT Line Break with one HPI Pump at Reduced Power Levels with
Offsite Power Available ........................................................................... 57 6.3.3 Oconee 0.75-, 0.5-, and 0.3 ft2 CLPD Break Cases at 100% FP with Offsite
Power Available .................................................................................... 58 6.3.4 Oconee CLPD Break Cases at 75% FP with Offsite Power Available ........ 60
6.4 PSC 2-00 Analyses for ANO-1 ...................................................................... 65 6.4.1 ANO-1 CFT Line Break Cases with Offsite Power Available .................. 67 6.4.2 ANO-1 0.75-, 0.5-, and 0.3 e CLPD Break Cases with Offsite Power
Available ............................................................................................... 67

�r-Mi�4f�m� AKIP mr. 51-5009856-00I laui ULUIJIl /I I I~ u~ iit.,.
6.5 PSC 2-00 Analyses for DB-1 ........................................................................ 70
6.5.1 DB-1 CFT Line Break Cases with Offsite Power Available ..................... 72
6.5-2 DB-1 0.75-, 0.5-, and 0.3 ft2 CLPD Break Cases with Offsite Power
Available ................................................................................................... 72
7. Reevaluation of the Manual Pump Trip Guidance ............................................. 75
8. Summary and Conclusions ............................................................................... 81
List of Tables
Table 6-1. TMI-1 Key Inputs Table ...................................................................................................... 33
Table 6-2 PSC 2-00 Analyses Performed for TM I-1 ........................................................................ 38
Table 6-3. TMI-1 LOOP and No-LOOP SBLOCA PCT Comparisons .................................................. 39
Table 6-4 CR-3 Key Inputs Table ........................................................................................................ 41
Table 6-5. CR-3 CFT Line Break RCS Mass Versus Time and Head Difference Curve ..................... 45
Table 6-6. CR-3 CFT Line Break RCS Mass Versus Time and RCP Trip Time ................................. 45
Table 6-7. PSC 2-00 Analyses Performed with the Byron Jackson Pumps for CR-3 .......................... 51
Table 6-8. CR-3 SBLOCA PCTs Versus Break Size ........................................................................... 52
Table 6-9. Oconee Key Inputs Table for 100 Percent Full Power Cases ............................................. 54 Table 6-10. Oconee Key Inputs Table for 50 or 75 Percent Full Power Cases ...................................... 55
Table 6-11. PSC 2-00 Analyses Performed for the Oconee 1, 2, and 3 ................................................ 61
Table 6-12. Oconee SBLOCA PCTs Versus Break Size at 100% FP .................................................. 63 Table 6-13. Oconee SBLOCA PCTs versus Break Size with One-HPI Pump ..................................... 64
Table 6-14. ANO-1 Key Inputs Table .................................................................................................... 66
Table 6-15. PSC 2-00 Analyses Performed with Byron Jackson Pumps for ANO-1 ............................ 68 Table 6-16. ANO-1 SBLOCA PCTs Versus Break Size ...................................................................... 69 Table 6-17. DB-1 Key Inputs Table ...................................................................................................... 71 Table 6-18 PSC 2-00 Analyses Performed with Byron Jackson Pumps for DB-1 .............................. 73
Table 6-19. DB-1 SBLOCA PCTs Versus Break Size ........................................................................... 74 Table 7-1. Analytical Points Used to Define the Restricted RCP Trip Region ................................... 78
List of Figures
Figure 3-1. CRAFT2 Historical Region Where RCP Trip Is Unacceptable ........................................... 15 Figure 4-1. PSC 2-00 CFT Line Break, 1-HPI Pump, 2-Min RCP Trip - DC and Core Collapsed
Liquid Levels ........................................................................................................................... 19
Figure 4-2. PSC 2-00 CFT Line Break, 1-HPI Pump, 2-Min RCP Trip - Hot Channel Clad Tem peratures .......................................................................................................................... 19
Figure 5-1. PSC 2-00 PUMP Degradation Study - 2-Min RCP Trip DC Collapsed Liquid Levels ......... 25
Figure 5-2. PSC 2-00 PUMP Degradation Study - 2-Min RCP Trip Core Collapsed Liquid Levels ..... 25
Figure 5-3. PSC 2-00 PUMP Degradation Study - 2-Min RCP Trip PCT .............................................. 26
Figure 5-4. PSC 2-00 PUMP Degradation Study - 2-Min RCP Trip HEAD .......................................... 26
Figure 5-5. Two-Phase Head Degradation Multiplier Curves ................................................................. 27 Foigure 6-1. PSC 2-00 RCP Trip Timing Study--DC Collapsed Liquid Levels ......................................... 46
Figure 6-2. PSC 2-00 RCP Trip Timing Study -Core Collapsed Liquid Levels ..................................... 46
Figure 6-3. PSC 2-00 RCP Trip Timing Study- Node 19 Hot Channel Clad Temperatures ................ 47 Figure 6-4. PSC 2-00 PUMP Degradation Study - Break Mass Flows .................................................. 47
Figure 6-5. PCT Comparisons for LOOP and no-LOOP SBLOCA Break Spectrum Cases for Oconee .... 62
Figure 7-1. PSC 2-00 Restricted Region for CLPD Breaks (also CFT Line Breaks with LPI Crosstie or 2 HPIs) .................................................................................................................. 79
Figure 7-2. PSC 2-00 Restricted Region for CLPD Breaks (also CFT Line Breaks with No LPI Crosstie and I HPI) ........................................................................................................... 80
4
r lU2 I Ia I f-I~I * II1'..
List of References
1. B&W's Small-Break LOCA ECCS Evaluation Model", BAW-10154A, July, 1985. 2. FTI Document 74-1152414-09, "Emergency Operating Procedures Technical
Bases Document", 3/31/00. 3. FTI Topical Report BAW-1 01 92PA-Rev 0, "BWNT LOCA - BWNT Loss-of-Coolant
Accident Evaluation Model for Once-Through Steam Generator Plants", 6/98. 4. FTI Topical Report BAW-10164PA-Rev 3, "RELAP5/MOD2-B&W - An Advanced
Computer Program for Light Water Reactor LOCA and Non-LOCA Transient -Analysis", 10/96.
5. FTI Document 32-5009856-00, "PSC 2-00 TMI-1 SBLOCA Analyses", 3/2001. 6. FTI Topical Report BAW-10164PA-Rev 4, "RELAP5/MOD2-B&W - An Advanced
Computer Program for Light Water Reactor LOCA and Non-LOCA Transient Analysis", 9/99.
7. FTI Document 51-5001731-01, "BWNT LOCA EM Limitations & Restrictions", 4/24/00.
8. FRA-ANP Document 32-5004328-00, "DB Mk-B10k SBLOCA Spectrum", April 2000.
9. FRA-ANP Document 32-1234842-04, "Oconee Mk-BI 1 75% FP SBLOCA", 3/2001.
10. Unused. 11. FTI Document 51-5006132-00, "PSC 1-99 Resolution", 1/18/00.-, 12. FTI Document 32-1232670-06, "Oconee Mk-B1 1 SBLOCA Spectrum", 3/01. 13. FRA-ANP Document 32-5011173-00, "PSC 2-00 ONS 50% SBLOCA Analysis,
3/2001. 14. FRA-ANP Document 32-5009697-00, "PSC 2-00 CR3 SBLOCA Analyses",
3/2001. 15. FTI Document 51-1266323-01, "CR-3 SBLOCA RELAP5/MOD2 AIS", 9/9/98. 16. FTI Document 32-1266348-01, "CR-3 Mk-B9 20% SGTP R5/M2 SBLOCA
Spectrum", 2/18/99. 17. B&W Document 32-1102665-00, "LPI Flow Split for CF Line Break (NSS 8),
5/28/79. 18. FRA-ANP Document 51-5008802-00, "TMI-1 Mk-B1 2 LOCA AIS", 8/15/00. 19. FRA-ANP Document 32-5004328-01, "DB Mk-B10k SBLOCA Spectrum",
December 2001. 20. FTI Document 32-1234842-02, "Oconee Mk-B11 75% FP SBLOCA", 11112/97. 21. FTI Document 32-1232644-00, "177 FA Plant Long-Term Cooling", 10/19/94. 22. FTI Document 32-1266343-00, "177 LL 20% Tube Plugging SBLOCA Spectrum",
12/3/98. 23. FTI Document 51-1266254-01, "177 LL 20% Tube Plugging LOCA AIS", 3/2/99. 24. FTI Document 32-5002708-00, "ANO SBLOCA Mini-Spectrum", 5/27/99. 25. Unused. 26. FRA-ANP Document 32-5010841-00, "PSC 2-00 ANO-1 SBLOCA Analysis,
3/2001.-
5
r51-5009856-00C,-,-Jm,•t•rrs• &kid [n•',

Framatome ANP Inc5100560
27. FRA-ANP Document 32-5004328-02, "DB Mk-B10k SBLOCA for PSC 2-00", 312001.
28. FTI Document 51-1266321-01, "AIS for LOCA", March 1999. 29. FRA-ANP 32-5009466-00, "SBLOCA Mk-B12 EFW Temp Anal", 3/2001. 30. B&W Document 32-1103324-00, "Small Break LOCA Analysis with RCP Operative
for 177 FA-LL Plants", 9/27/79. 31. FTI Document 32-1258154-01, "15-Node Model SBLOCA Studies", 12/18/97. 32. FTI Document 32-1258154-00, "1 5-Node Model SBLOCA Studies", 4/14197. 33. Unused. 34. Unused. 35. FTI Document 86-1266216-04, "Oconee R5/M2 Mk-B9/B10F LOCA Summary",
2/24/00. 36. B&W Document 77-1149091-00, "Analytical Justification for the Treatment of
Reactor Coolant Pumps during Accident Conditions", 3/12/84.
6
51-5009856-00

14;1,t~m 1M r 51-5009856-00 C at rrv-L.frirni A P* 'I nt-
List of Common Acronyms
AIS
ANO-1
BWST
CFT
CLPD
CLPS
CR-3
C2-EM
DB-1
ECC
ECCS
EOP
EFW`
EM
ESAS
FA
FRA-ANP
HPI
LL
LOCA
LBLOCA
LOOP
LPI
LSCM
MFW
NSSS
ONS-1
ONS-2
ONS-3
Analytical Input Summary
Arkansas Nuclear One Unit I
Borated Water Storage Tank
Core Flood Tank
Cold Leg Pump Discharge
Cold Leg Pump Suction
Crystal River-3
CRAFT2-Based Evaluation Model (BAW-1 0154)
Davis Besse Unit I
Emergency Core Cooling
Emergency Core Cooling System
Emergency Operating Procedures
Emergency Feedwater
Evaluation Model
Engineered Safeguards Actuation System
Fuel Assemblies
Framatome ANP Inc.
High Pressure Injection
Lowered Loop (plant)
Loss of Coolant Accident
Large Break Loss of Coolant Accident
Loss of Offsite Power
Low Pressure Injection
Loss of Subcooling Margin
Main Feedwater
Nuclear Steam Supply System
Oconee Nuclear Station Unit 1
Oconee Nuclear Station Unit 2
Oconee Nuclear Station Unit 3
7

List of Common Acronyms cont'd
OTSG Once-Through Steam Generator
PCT Peak Cladding Temperature
PSC Preliminary Safety Concern
PZR Pressurizer
RCP Reactor Coolant Pump
RCS Reactor Coolant System
RL Raised Loop (plant)
RV Reactor Vessel
RVVVs Reactor Vessel Vent Valves
R5-EM RELAP5/MOD2-Based EM (BAW-10192)
SBLOCA Small Break Loss of Coolant Accident
SCM Subcooling Margin
SER Safety Evaluation Report
SG Steam Generator
TBD Emergency Operating Procedures Technical Bases Document
TMI-1 Three Mile Island Unit 1
8

PrnamnfrnmaAMP Ine-5-00860
Summary of PSC 2-00 Analyses
1. Background
In December 1999, a Framatome ANP, Incorporated (FRA-ANP) safety analyst
reviewing Revision 9 of the Emergency Operating Procedures (EOPs) Technical Bases
Document (TBD), contained in Reference 2, raised a general question on reactor coolant pump (RCP) operation following a loss of coolant accident (LOCA) with offsite power available. The reviewer was inquiring if there was any improved guidance that could be given in the event the operator did not complete the manual pump trip within the required two-minute period following the loss of subcooling margin (LSCM). Those discussions ultimately led several informal scoping analyses during the first quarter of 2000, with the RELAP5/MOD2 evaluation model (EM) (Reference 3) for a large break LOCA (LBLOCA) and a couple of the bigger small break LOCAs (SBLOCAs) in the cold leg pump discharge (CLPD) piping. These cases supported the previous historical pump operation guidance to trip RCPs immediately on LSCM, and if not, leave them running until significant low pressure injection (LPI) flow is established.
There was one scenario, the core flood tank (CFT) line break with one high pressure injection (HPI) pump and one LPI pump without any LPI line cross-tie, for which this guidance was not clear. For this case, there is significant LPI flow, but it could be flowing to the broken CFT nozzle. In this case, LPI flow would not reach the core. A CFT line break scoping case was run with the RCPs operating for the first two minutes of the transient. The pump operation for the first two minutes slightly reduced the reactor vessel liquid inventory, and uncovered some of the core with a peak cladding temperature (PCT) of roughly 1000 F. By comparison, the typical CFT line break with a loss of offsite power (LOOP) near the time of reactor trip (i.e. loss of the RCPs as a consequence of the LOOP) had no core uncovering with a PCT of 715 F.
These informal cases supported the conclusion that prompt RCP trip is acceptable for SBLOCA, but they also brought into question the appropriateness of conservatively crediting LOOP near the time of turbine trip for CFT line break analyses. The cladding temperature produced for this scoping case indicated that, unlike the historical CLPD break analyses (Reference 30 and 36), the CFT line break results could be more severe when the RCPs were tripped at (or after) two minutes. However, the PCT for a two-minute RCP trip was considerably less limiting than the bounding PCT for the SBLOCA CLPD spectrum. With this conclusion, no further delayed pump trip work was considered until July of 2000.
In July 2000, FRA-ANP was working with Exelon to establish an analytical input summary (AIS) for LOCA analyses to support Three Mile Island Unit 1 (TMI-1) operation with Mark B12 fuel. The LOCA scope included a reanalysis of the limiting CLPD break size to demonstrate that the Mark-B9 SBLOCA results are applicable to the Mark-B12 with M5TM cladding. Exelon asked what additional analysis might be
9
51-5009856-00

needed if they specified an increased uncertainty in the CFT level of up to 50 ft3. Consideration of the CFT level variation for TMI-1 uprated power analyses meant that those analyses that produced a PCT after the CFT began flowing would have to be reevaluated. This included the CFT line break with LOOP as well as a scenario with
offsite power available and its potential PCT increase due to the delayed RCP trip.
FRA-ANP reviewed the HPI flows and decay heat match-up times for .the 2772 MWt
uprated power SBLOCA cases for TMI-1 (Reference 22) and concluded that there
could be additional core uncovering and higher cladding temperature excursions for the
CFT line break with reductions in the CFT liquid inventory. This fact, combined with the
potential increased consequences from a two-minute RCP trip, led to renewed CFT line
break investigations. A preliminary TMI-specific scoping case was run using emergency core cooling system (ECCS) flow from one CFT and one HPI pump. The
PCT for that case exceeded the 10 CFR 50.46 cladding temperature criterion when
analyzed at 2772 MWt. A subsequent undocumented scoping analysis at the licensed power level of 2568 MWt produced a PCT of 1415 F, which was within the acceptance criteria.
10
51-5009856-00

2. Issuance of the Preliminary Safety Concern
Based upon the observations from the scoping studies, plus the fact that the TMI-1 CFT line break at the uprated power level exceeded the acceptance criteria, FRA-ANP prepared and issued a preliminary safety concern (PSC) 2-00 on July 28, 2000. The PSC identified the following four considerations for the CFT line break with offsite power available.
1. Delaying the RCP trip time assumed in the analysis up to the allowed two-minute EOP time could produce results with higher PCTs than those in the analyses of record.
2. Scoping analyses to bound the operating conditions for the 177-FA plants produce acceptable PCTs for the currently licensed power levels using the RELAP5-based evaluation model.
3. Scoping analyses performed at the uprated power level (2772 MWt) may not produce acceptable results for the lowered-loop design (without functional LPI cross-tie).
4. RCP performance during two-phase flow is a significant factor in the analysis. The RELAP5 default parameters, which are based upon the Semiscale Mod-1 pump performance, in the approved evaluation model need to be validated for this application.
At all of the units, operators receive EOP (Reference 2) training that directs them to trip the RCPs immediately following a loss of subcooling margin. This training tends to alleviate the concern that a full two minutes will elapse before the RCPs are tripped, although two-minutes is the time interval discussed in the TBD, and reflected in the procedures of some of the units. This time must be preserved unless the procedures are changed, along with any other affected calculations or assumptions, some of which may be referenced in NRC documentation.
From an ECCS qualification perspective, the preliminary investigations initially focused upon TMI-1 uprated power (2772 MWt) analyses, but it quickly evolved to include the currently licensed power level (2568 MWt) for the TMI-1 plant. The investigation of the severity of the CFT line break results was also recognized to be more limiting for each of the remaining B&W-designed plants.
The CFT line break presents unique challenges to the ECCS system, in that it is typically mitigated with one CFT and one HPI pump for TMI-1, CR-3, ANO-1, and DB-I. The CR-3 plant ECCS pump system configuration and flow rates are similar to those of TMI-1 so this plant could have similar PCT increases. The ANO-1 plant has continuous cross-tie of the LPI lines with passive balancing, therefore, a significant fraction of the LPI flow is delivered to the core for the CFT line break (even though licensing analyses have not historically credited the LPI cross-tie flow). The DB-1 HPI pumps are lower head pumps that deliver nearly twice the flow of the other 177-FA LL plant HPI pumps. "The 102 percent full power analyses for the Oconee units (ONS-1, 2, and 3) credit flow
11
Framatome ANP. Inc. 51-5009856-00

rrnmnafr~mg, ANMP Inn~ 51-5009856-00
from a second HPI pump at 10 minutes following engineered safeguards actuation
signal (ESAS). These unique plant alignments or features for ONS-1, ONS-2, ONS-3,
ANO-1, and DB-1 make the consequences of this PSC slightly less severe for the CFT line break at full power.
The PSC text noted that the larger CLPD breaks were not subjected to the same
considerations as the CFT line break because there is additional ECCS flow (2 CFTs, 1
LPI pump, and 1 HPI pump) delivered to the core for this break location. However, the
initial CFT line break sensitivity studies revealed that the RCS inventory redistribution
from the longer period of RCP operation could affect the core cooling consequences for
the larger CLPD breaks. It was recognized that the CLPD PCTs are affected to a lesser
degree than the CFT line breaks because of the additional ECCS flow to the core.
"Therefore, these breaks were reviewed and analyzed as necessary to ensure that the
most severe calculated consequences are not under-predicted.
During the course of the PSC resolution, the NRC granted approval for the Oconee
units to operate for a limited time at 75 percent full power when one of the three HPI
pumps was inoperable. FRA-ANP had completed the required spectrum of SBLOCA
analyses crediting flow from only one HPI to support plant operation under this
condition. These analyses were not specifically called out in the PSC 2-00 discussion,
but they were subsequently included in the final resolution. As a consequence of the
PSC 2-00 analyses described in Section 6.3.2 the maximum power level of 75 percent
was reduced to 50 percent full power to maintain the two-minute RCP trip time.
12
I
|I•|III•IIJ1•/III%,t nl II I iIIV,

51-5009856-00C ua uKaur iI f
3. Historical SBLOCAs Pump-On Analyses and Guidance
SBLOCA analyses were originally performed for the B&W-designed plants based on
the CRAFT2-based evaluation model (C2-EM) as described in the latest approved topical (Reference 1). Limiting CLPD SBLOCA analyses with this C2-EM have been generated based on transients with LOOP at reactor trip. CRAFT2 CLPD sensitivity
studies were performed in Reference 30 with Appendix K assumptions to show that
acceptable core cooling was achieved if the RCPs were manually tripped by two
minutes following ESAS initiation. Those analyses identified that there was a critical
time period for RCP trip during which acceptable core cooling was not assured. This
time period is break size dependent, although RCS conditions and pressures can also
be used to define it. The restricted RCP trip region is defined by the time after the
RCS system void fraction reaches roughly 70 percent but before significant LPI flow is
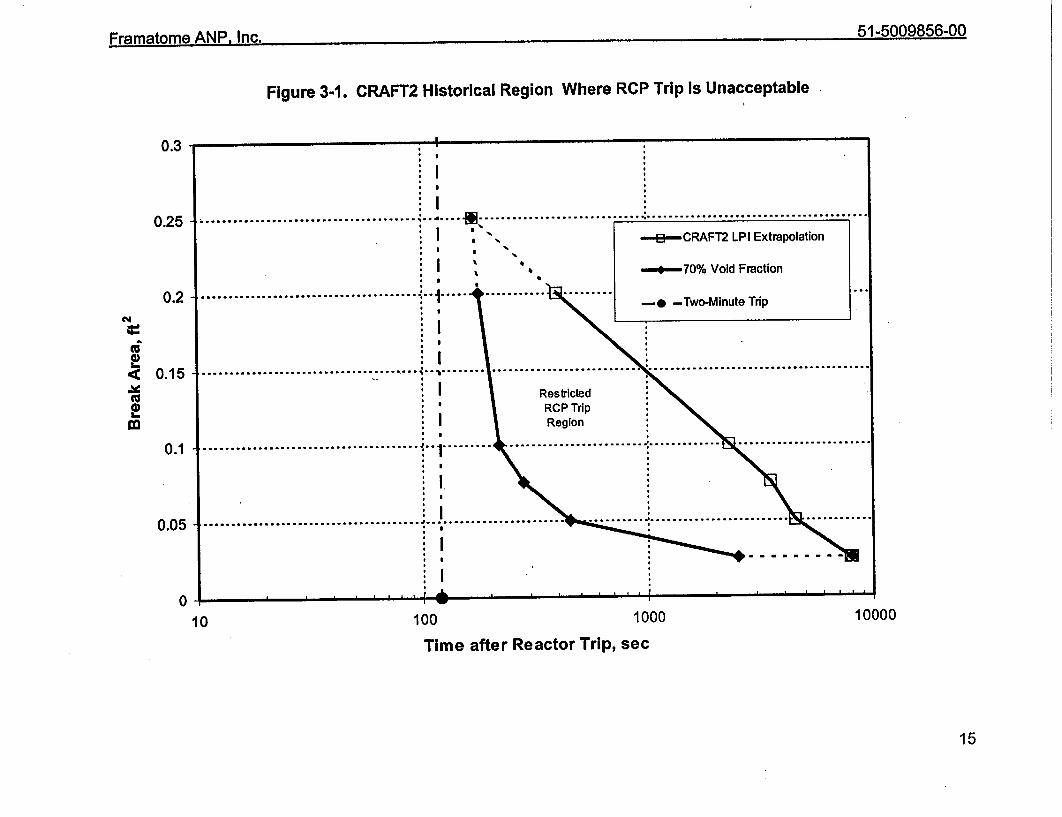
assured. This critical or restricted region, which has sometimes been referred to as the "pig's liver curve", was described in Reference 30 and summarized in Reference 36 and shown in Figure 3-1 of this document.
The conclusions drawn from those CRAFT2 analyses showed that a RCP trip at or before within two-minutes following ESAS initiation (ESAS initiation has been subsequently changed in the EOPs to the loss of subcooling margin) would be acceptable from a 10 CFR 50.46 perspective for the spectrum of CLPD SBLOCAs analyzed or considered in the evaluations. This time-critical operator action, which is appropriately prioritized as the first action given in the LSCM section of the generic EOPs, instructs the operators to immediately trip the RCPs on LSCM. If the RCPs are not tripped in the first two minutes, then the EOPs instruct the operators to leave at least two running (one in each loop) until LPI flow is achieved. The CRAFT2 SBLOCA analyses credited the early RCP trip at two-minutes. By crediting this early trip in the analyses and sensitivity studies from Reference 30, the analyzed CRAFT2 SBLOCA spectrum was simplified to only cases with the LOOP assumption.
Since the time of the CRAFT2 no-LOOP sensitivity studies, FRA-ANP developed, submitted, and received NRC approval "for use of a new RELAP5/MOD2-based evaluation model (R5-EM) for the B&W-designed plants (Reference 3). This new R5EM has been used in recent SBLOCA analyses for all of the B&W-designed plants. No reanalysis was performed of historical studies that were judged to be independent of the EM, such as the RCP manual trip before the RCS reaches 70 percent void fraction (i.e. within two-minutes following LSCM). The new R5-EM incorporated these historical design basis analyses and evaluations into the overall method of assuring compliance to 10 CFR 50.46 without reanalyzing SBLOCAs with RCPs running. Therefore, all
RELAP5-based SBLOCA EM licensing applications prior to this PSC have been performed with LOOP assumed at the time of reactor trip.
If the RCPs operate during a SBLOCA transient, they circulate the remaining RCS liquid and steam that is produced by the core boiling or flashing of this RCS liquid and ECCS liquid that is injected. This extended circulation redistributes the RCS liquid
13
F|•'I|III•ILUIIII•
l-•l•ll I IIIV.

51-5009856-00I IGIEIC I'1III -W III1.
inventory and it alters the fluid conditions at the break location from the cases with LOOP. if the break is in the upper downcomer or CLPD pipe, then the circulation can discharge more RCS liquid than a case in which the RCPs were tripped.
The historical CRAFT2 pumps on applications (Reference 30) that were used to define the leading edge (earlier time) of the restricted pump trip region predicted uniform void factions throughout the RCS. When the pumps tripped and coasted down, those analyses allowed any liquid in the CLPD pipe, RV and hot leg upside to drain down into the vessel and be available for core cooling. Simple calculations showed that if the RCS void fraction was less than 70 percent when the pumps were tripped, the core would be completely covered by a two-phase mixture after the flow coastdown. Adequate ECCS flow at that time would keep the core continuously covered and cooled.
The trailing edge (later time) of the restricted region was defined as the time that it would be acceptable to trip any operating RCPs because the break size in question would have depressurized sufficiently to cause the CFT to empty and establish LPI flow. Effective core cooling would be maintained by the RCP circulation of the RCS fluid at void fractions well above 70 percent. If the RCPs were tripped above 70 percent void fraction, the core would initially uncover, but the rapid core refill by the CFT and LPI would provide effective core cooling after pump operation stopped. The time between the 70 percent void fraction leading edge and the time that significant LPI flow was obtained was a region that could have core uncovering with highly degraded or unacceptable core cooling consequences if the RCP operation stopped. Requiring manual RCP trip before the RCS evolved beyond the 70 percent void fraction criteria was instituted to assure the pumps were tripped before the RCS conditions evolved into this unacceptable region.
Extrapolation of both the leading and trailing edges of the curve created a closed region, that showed break sizes larger than 0.3 ft would not have a prohibited region (page 628 of Reference 30), although a brief period of core uncovering could occur. This consideration, plus the belief that the analysts defining the prohibited region assumed the HPI flows would be balanced, as would LPI flows to both CFT nozzles (page 607 of Reference 30), likely lead to the conclusion that a CFT line break (0.44 ft2) and CLPD breaks larger than 0.3 ft2 would not have a prohibited pump trip region.
New analyses do not support the historical bounds of the original restricted region defined for the CLPD breaks. In fact, new analyses of a 0.5-ft2 CLPD case resulted in a significant PCT increase because the LPI flow did not initiate until roughly one minute after the pump trip. Also, the CLPD break is not the limiting break location in terms of lost ECCS liquid. That is, providing effective core cooling for the CFT line break is more challenging than the CLPD break because there is less ECCS liquid reaching the core (loss of flow from one CFT and potentially all of the LPI flow if there is no LPI balancing - half of it if the LPI flow is balanced 50-50).
14
51-5009856-00
Figure 3-1. CRAFT2 Historical Region Where RCP Trip Is Unacceptable
10000100 1000
Time after Reactor Trip, sec
15
0.3
0.25
0.2
0
In
0.15
* I
* 0
........................ ......................................................... j I.-B-e-CRAFT2 LPI Extrapolation
I -0-70% Void Fraction
* I0
IiI
. ................................... ....... -*-Two-Minute Trip
, eo.~ ... ... .. .. .. .. . .. .. .. .. ...... ........ ............... = ................. •..... .... e... . . . . . . . . . . . . . SI
, CRestricted RCP Trip
I Region
S...~~~~~~~...................................... '!..... '......... •.......... -0-ToMnt d '
......................................... • " ,......... . ......................... . ............. .........................
........................................ ............. ............ ...................... ........................ °, S . .. . . .
0.1
0.05
010
KID I rramatome A . "%.*.
I
I-rSIIIi:llLUIilI:II /"•1•11-"I il iti,

FrmmatomeA AP Inc5-005-0
4. PSC Resolution Overview
The preceding sections have described the historical CFT line and CLPD break analyses for the B&W-designed plants with a LOOP assumed at the time of reactor trip. Generally the limiting single failure following LOOP is a loss of an emergency diesel generator or vital ECCS buss, such that a single HPI and LPI pump are initially unpowered. If a single LPI pump is operating and LPI piping and valve arrangements allow all the LPI to flow to only one CFT line, then this line must be assumed to be
broken to ensure that the limiting consequences are not under-predicted. With this configuration, the consequences of the transient are mitigated in the short term by the flow from one HPI pump and one intact CFT. The ECCS flow is generally sufficient, with early RCP trip to preserve enough residual reactor vessel inventory, to adequately cool the core. The minimum core mixture level generally remains near or above the top of the core with typical PCTs less than 800 F for this break with an immediate loss-ofoffsite power.
If offsRe power is available, the operators will manually trip the RCPs immediately following LSCM, but the EOP contingency actions allow up to two minutes for the trip to be completed. If the RCP trip is delayed the full two minutes, the continued forced circulation in the RCS keeps the reactor vessel vent valves (RVVVs) closed and allows more liquid to flow out the break, thereby decreasing the liquid inventory that remains in the system. The RCP head degrades significantly as the pump inlet void fraction increases. The small head (a few psi just before RCP trip) that is produced tends to displace water from the reactor vessel downcomer into the core region as shown in Figure 4-1. This displaced liquid helps keep the core covered by a two-phase mixture level while the RCPs are operating.
After the RCPs are tripped at two minutes, the loss of RCP head allows the RVVVs to open and the core liquid to flow back into the downcomer though the lower plenum to balance the reactor vessel manometer. The core levels decrease rapidly while the downcomer level refills. In certain cases the remaining core inventory is insufficient to keep the core covered and cooled with a two-phase mixture level. When this occurs, a cladding heatup will occur before the CFT fill pressure is reached as shown in Figure 4-2.
This initiar core uncovering is quickly halted by the rapid refill of the core and downcomer levels refill via discharge of the intact CFT. The cladding is quenched because it is once again covered and cooled by a two-phase mixture. After the CFT empties, however, the flow from the single HPI pump may be insufficient to match the core boiloff from the core decay heat rate and passive metal heat addition plus flashing. The core inventory decreases until the HPI flow rate is able to match the liquid mass decrease from boiloff and flashing. For the lowered-loop plants with ECCS flow from only one HPI pump, the liquid mass loss will uncover the core and a second, potentially more severe cladding heatup can occur. In some power uprates cases, the core level
16
51-5009856-00V
J•lBe•bV#aSV f sw 1• • @w w•@

may be insufficient to provide acceptable core cooling consequences, as seen in Figure 4-2 around 1200 seconds.
The principal means of limiting the impact of RCP operation on the CFT line break is to ensure immediate trip of the RCPs. Another means is to supply additional ECCS flow from a second HPI pump or some appreciable flow from LPI within the first ten minutes of the transient. The additional ECCS flow matches the core decay heat boiloff and flashing mass loss sooner, with higher core mixture levels and reduced PCT consequences if uncovering is predicted. The same conclusion holds for the DB-1 raised-loop plant with flow from a single low-head HPI pump, because its flow (at the low pressures reached rapidly following a CFT line break) is similar to the ECCS flow from two lowered-loop plant HPI pumps.
CFT line break analyses performed with RELAP5/MOD2 using the NRC-approved R5EM reported in BAW-10192PA (Reference 3) predicted significant PCT increases for several of the 177-FA lowered-loop plants when the RCPs are powered for the first two minutes following the LSCM. Also, sensitivity studies showed that the calculated PCT consequences are highly dependent upon the modeling of RCP performance under two-phase flow conditions. The severity of the predicted cladding temperature excursions is directly tied to the extent of pump head degradation during two-phase flow. Increased head degradation acts much like an early RCP trip in reducing the amount of liquid inventory lost through the break. Conversely, less head degradation increases RCS inventory loss with a significant adverse impact upon predicted PCT.
A two-phase head degradation sensitivity study was performed to assure the most limiting PCT consequences for a CFT line break were not under-predicted. This is discussed in Section 5 along with several other generically applicable plant sensitivity studies that were completed for CFT line breaks and larger CLPD breaks that were analyzed without LOOP.
At the time the PSC was written, the NRC was scheduled to complete review of the new void-dependent core cross-flow model in Revision 4 of RELAP5/MOD2-B&W (BAW10164P, Reference 6) within several months. The CFT line breaks with delayed RCP trips have a very dynamic core liquid level response that is difficult to model with the fixed core cross-flow resistance model capabilities available in previous versions of the NRC-approved code. The SBLOCA EM (Reference 3) defines how a segregated, axial level-dependent model with low cross-flow resistance in the steam region and higher cross-flow resistance in the pool region are used. The low resistance in the steam region maximizes the steam flow diversion out of the hot channel into the average channel, while the higher pool region resistance increases the void fraction in the hot bundle. The location of the step change between the two resistance values was to be set near the minimum mixture level to produce conservative PCT consequences.
In a LOOP analysis for the B&W-designed plant, the minimum mixture level is relatively easy to define. For the offsite power cases with delayed RCP trip, the minimum mixture level varies rapidly with potentially multiple core uncovering periods. Use of the fixed-
17
51-5009856-00

Prmf.tnma AMP 1n1 51-5009... -0.
resistance model for the CFT line breaks (or larger CLPD breaks) can also lead to variation in modeling conservatisms, which can create PCT variations by virtue of the .model selection.
The void-dependent cross-flow model is simply an automation of the core cross-flow method discussed in the approved SBLOCA EM. Because it is generally consistent with the approved EM, and because it is a model that responds dynamically to the mixture level undulations observed in these larger SBLOCA pumps-on applications, it is the most logical choice for use in these new analyses. Therefore, the NRC was informed verbally and in writing that the void-dependent model would be used for these analyses during PSC 2-00 telecons and in the PSC 2-00 summary and status letters. The difficulty is that the NRC review and approval, which was originally scheduled for completion well before the PSC 2-00 completion, is still in progress. It does not change the technical conclusions that the void-dependent model is most appropriate, however, it does put all of the new analyses (except for an Oconee sensitivity-study case) that were completed with it in a potentially untenable licensing position until the NRC Safety Evaluation Report is received.
18
51-5009856-00

Framatome ANP. Inc
FIGURE 4-1. PSC 2-00 CFT Line Break, 1-HPI Pump, 2 Min RCP Trip DC AND CORE COLLAPSED LIQUID LEVELS.
t
cil ,C% .. I
uJ
a 5
TIME, SECONDS
FIGURE 4-2.
2500
2000
U.
Ur 1500
2 1000 S-
500,
PSC 2-00 CFT Line Break, 1-HPI Pump, 2 Min RCP Trip HOT CHANNEL CLAD TEMPERATURES.
1600
1200
1500
TIME, SECONDS
19
Lff
1
4OO
M.
400
51-5009856-00

Framat•m• ANP Inc. 1.0.. 0
5. RCP Degradation and Generic Sensitivity Studies
This PSC has raised questions regarding the validity of the RCP two-phase degradation models when the RCPs remain in operation for several minutes following a SBLOCA. Sensitivity studies will be used to determine which degradation model is limiting for these applications. The described sensitivity study was performed based on the CR-3 plant application, and is further supported by a TMI-1 study. Therefore, it is generically applicable to all 177-FA B&W-designed plants. The results of this study along with other plant-specific sensitivity studies that have generic applicability are briefly summarized in this section. The generic studies discussed include the RCP degradation, RCP trip time (CR-3 study), expanded CLPD break size spectrum (ONS study), and continuous RCP operation for the limiting CLPD break (CR-3 study). Generic observations on conservative selection of the CFT initial pressure and level conditions are also provided based on the analyses completed for PSC 2-00.
5.1 RCP Two-Phase Degradation Sensitivity Study
Table 9-2 of the SBLOCA Volume of BAW-10192PA states that the "default curve" for two-phase head degradation is used for SBLOCA applications. The "default curve" refers to the Semiscale two-phase head degradation curve given in the RELAP5/MOD2-B&W code topical BAW-10164-PA Rev. 3 (Reference 4). This selection was made because the RCP head degradation is of little consequence for SBLOCA transients with RCP trip on LOOP, since they are not flow dominated like the LBLOCA cases. Moreover, all SBLOCA R5-EM demonstration studies credited LOOP near the time of reactor trip, and all licensing applications performed prior to the fall of 2000 implicitly used CRAFT2 studies to support that LOOP (and consequent RCP trip) is bounding for these SBLOCA analyses.
FRA-ANP performed confirmatory RCP two-phase head degradation sensitivity studies for SBLOCAs with LOOP using the R5-EM as a part of the PSC 1-99 resolution. Those studies, summarized in Reference 11, showed little variation in the calculated PCT results that were performed as part of the LBLOCA PSC 1-99 pump-type and degradation studies. Therefore, based on these studies it was concluded that any of the following three head-degradation models could be used for SBLOCA analyses with LOOP and nearly identical transient results would be obtained.
1. M1- Upper bound or maximum two-phase head degradation curve, 2. RELAP5/MOD2 "R5-Default" head degradation curve, and 3. M3-modified - Lower bound or minimum two-phase head degradation curve.
The approved SBLOCA R5-EM calculates two-phase RCP performance curves using the RELAP5 "R5-default" head difference and degradation multipliers that were derived from the Semiscale pump tests. This degradation multiplier, shown as the first curve on
20
51-5009856-00
C I fIII mI AKIr Intr 11%0098.. -00
Figure A-30 of Volume I of BAW-10192PA, is a general use curve that typically falls between the upper bound M1 and lower bound M3-modified curves shown on that same figure and they are shown in Figure 5-5 of this document. All RELAP5/MOD2 SBLOCA EM pump degradation studies performed prior to the issuance of PSC 2-00 were performed with LOOP on reactor trip. If an immediate RCP trip occurred for a SBLOCA, the pump degradation curve selected was of little consequence. Therefore, the general use degradation curve was selected, although the calculated PCT consequences would have been similar if either the upper or lower bound curves were used. The same conclusion does not apply with delayed RCP trip when offsite power is available
With offsite power available, operator actions to trip the RCPs within two-minutes has historically been credited at exactly two-minutes after LSCM. With this scenario, the selection of the RCP two-phase head degradation model becomes important to the PCT consequences. The traditional LBLOCA pump degradation sensitivity study calculates the consequences with the minimum, general use, and maximum head degradation curves. This approach was used for the SBLOCA analyses performed for PSC 2-00 closure.
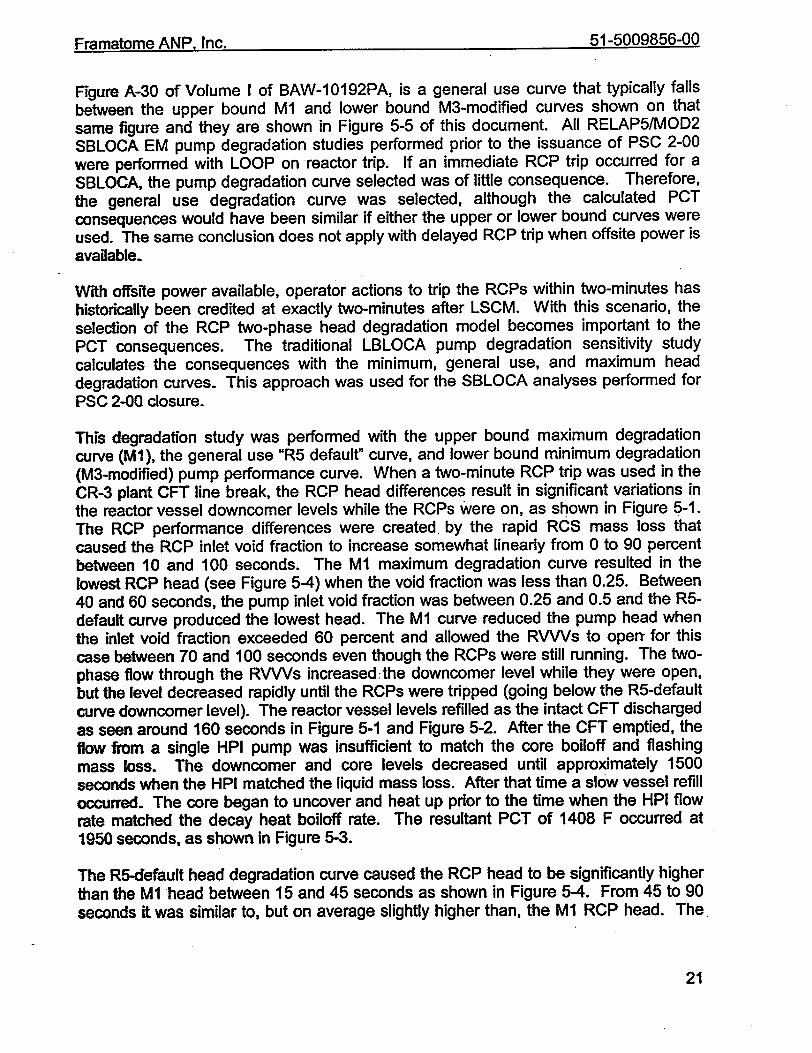
This degradation study was performed with the upper bound maximum degradation curve (M1), the general use "R5 default" curve, and lower bound minimum degradation (M3-modified) pump performance curve. When a two-minute RCP trip was used in the CR-3 plant CFT line break, the RCP head differences result in significant variations in the reactor vessel downcomer levels while the RCPs were on, as shown in Figure 5-1. The RCP performance differences were created by the rapid RCS mass loss that caused the RCP inlet void fraction to increase somewhat linearly from 0 to 90 percent between 10 and 100 seconds. The M1 maximum degradation curve resulted in the lowest RCP head (see Figure 5-4) when the void fraction was less than 0.25. Between 40 and 60 seconds, the pump inlet void fraction was between 0.25 and 0.5 and the R5default curve produced the lowest head. The M1 curve reduced the pump head when the inlet void fraction exceeded 60 percent and allowed the RVVVs to open- for this case between 70 and 100 seconds even though the RCPs were still running. The twophase flow through the RVVVs increased;the downcomer level while they were open, but the level decreased rapidly until the RCPs were tripped (going below the R5-default curve downcomer level). The reactor vessel levels refilled as the intact CFT discharged as seen around 160 seconds in Figure 5-1 and Figure 5-2. After the CFT emptied, the flow from a single HPI pump was insufficient to match the core boiloff and flashing mass loss. The downcomer and core levels decreased until approximately 1500 seconds when the HPI matched the liquid mass loss. After that time a slow vessel refill occurred. The core began to uncover and heat up prior to the time when the HPI flow rate matched the decay heat boiloff rate. The resultant PCT of 1408 F occurred at 1950 seconds, as shown in Figure 5-3.
The R5-default head degradation curve caused the RCP head to be significantly higher than the M1 head between 15 and 45 seconds as shown in Figure 5-4. From 45 to 90 seconds it was similar to, but on average slightly higher than, the M1 RCP head. The
21
5 j1-5009856-00

�1 -�OO9856-00
increased RCP head kept the RVVVs closed until after RCP trip. Around 100 seconds, the RCP inlet void fraction exceeded 90 percent. At void fractions between 90 and 100 percent, the M1 head degradation multiplier is less than that of the R5-default curve, therefore the RCP head was slightly higher with the M1 curve after 100 seconds. The downcomer level for this case was initially lower but then remained above the M1 case as a result of the RCP head and RVVVs circulation differences. The intact CFT discharge refilled the downcomer and core to levels similar to the M 1 head degradation case, as shown in Figure 5-1 and Figure 5-2. These levels remained similar with some minor variations after the CFT emptied. Core uncovering also occurred for this case, as
shown in Figure 5-3, with a PCT of 1391 F at 2146 seconds.
The M3-modified head multiplier is the minimum degradation curve and it results in the highest RCP head for all of the models studied, as shown in Figure 5-4. The increased RCP head maintains the RCS circulation longer than the other two head-degradation curves and results in the highest RCS mass loss from the break. This mass loss reduces the remaining reactor vessel liquid inventory well below values calculated with the M1 or R5-default degradation curves. The downcomer level was displaced down to the spillunder elevation (i.e. the uppermost hole in the core flow distribution plate) in the lower plenum by the time that the RCPs were tripped. Shortly after RCP trip, the core uncovered briefly with a short cladding heatup as seen in Figure 5-3. The intact CFT discharge refilled the vessel levels and quenched the initial cladding heatup, however, the downcomer level remained low after the CFT emptied. The lower vessel inventory, seen in Figure 5-1 and Figure 5-2, was insufficient to buffer the deficit between the HPI injection and core boiloff as seen in the other cases. The cladding heatup for this M3modified case exceeded the acceptance criteria at roughly 1150 seconds.
The results of this study show that the lower bound M3-modifled curve will produce more severe calculated PCT consequences for the CFT line break as well as larger CLPD breaks with a delayed RCP trip. These larger SBLOCA transients will have lower minimum core liquid inventories when the RCP head remains high. Higher RCP heads for any B&W-designed plant will transport the largest fraction of ECCS liquid that enters the RCS. as well as liquid remaining within the reactor vessel and RCS, to the break location- The liquid lost out of the break increases the overall severity for these transients. In the lowered-loop plant CFT line break cases with ECCS inflow from only one HPI pump and one intact CFT, the predicted PCTs did not meet the 10 CFR 50.46 acceptance criteria. New CFT line break analyses for the cases that produced unacceptable PCT consequences were shown to be acceptable with credit for earlier RCP trip as discussed in the next section. Lowered loop plants with additional ECCS flow prior to ten minutes, from either the initiation of a second HPI pump or credit for some LPI flow via use of the LPI cross-tie line, will produce PCTs within the 10 CFR 50.46 acceptance criteria. The Davis Besse-1 raised-loop plant has low head HPI pumps that produce flows similar to two of the lowered-loop plant HPI pumps. Additional ECCS inflow limits the overall PCT consequences, however they will still be higher when the M3-modified curve is used with a delayed RCP trip. Therefore, all delayed RCP trip SBLOCA cases will use this minimum head degradation curve.
22
r~darlidLUlrlu A-Nli- III. 51-5009856-00

5.2 RCP Trip Time Sensitivity Study
In the previous section, the most severe PCT consequences for a CFT line break or large SBLOCA CLPD breaks were produced with the M3-modified RCP head degradation curve. The CFT line break with pumped ECCS injection from only a single high head HPI pump exceeded the acceptance criteria. If the RCP trip occurs before the RCS and reactor vessel inventory is severely depleted, then acceptable consequences can be predicted, similar to that for a case with LOOP near the time of reactor trip. Since a RCP trip at reactor trip is acceptable, while a two-minute trip is not, it may be possible to find a trip time between the two that is also acceptable.
Rather than iterate to find the maximum acceptable trip time, the BWOG operator support committee was asked to provide a reasonable time to credit RCP trip. The utility representatives reviewed operator-training exercises and concluded that oneminute after LSCM is a reasonable time for credit of RCP trip. Therefore, a CFT line break with credit for a one-minute RCP trip was performed using the CR-3 plant, as discussed in Section 6.2.1. The results for this RCP trip time was compared to the cases with LOOP and a two-minute RCP trip in Table 6-6 and in Figure 6-1 through Figure 6-4. A one-minute RCP trip is sufficiently early that the RCS mass inventory is preserved, such that no core uncovering is predicted. Similar RCS inventory responses would be expected for each of the B&W-designed plants making the conclusions drawn with the CR-3 study (and supported by an independent TMI-1 study) generically applicable to all.
5.3 Expanded Large SBLOCA CLPD Break Spectrum
The typical CLPD SBLOCA spectrum includes calculations with break sizes of 0.3, 0.5 and 0.75 ft2. Initial reanalysis of these break sizes with a two-minute RCP trip revealed little or no core uncovering for the 0.3-ft2 break, significant core uncovering with PCT increases of several hundreds of degrees for the 0.5-ftF case, and results similar to the LOOP case for the 0.75-ft2 case. The discussions in Sections 6 and 7 show that the RCP trip for the 0.5-ft2 case occurs after the RCS void fraction is above 70 percent, but prior to when LPI flow is obtained. Based on Figure 7-1, the two-minute RCP trip occurs nears the middle of the restricted RCP trip region, while the 0.3-ft2 case with two minute RCP trip occurs just prior to when the RCS void fraction reached 70 percent. The 0.75-ft2 case with a two-minute RCP trip is near the time that the LPI flow begins. Therefore, the PCT variations calculated are consistent with locations within the restricted RCP trip region. Given these results, it is prudent to ensure that there is not a break size near 0.5 ft1 that has significantly higher PCTs. Two additional CLPD break sizes of 0.44 and 0.55 ft2 were analyzed with a two-minute RCP trip using the Oconee plant model.
These two additional CLPD mini-spectrum cases, discussed in Section 6.3.3, produced PCTs of 1105 F and 1141 F for the 0.44 ft2 and 0.55 ft2 cases, respectively. These two
23
51-5009856-00

I IG l' .. lllI I-11 | .1. a. .
PCTs are similar to, but slightly less than, the PCT of 1147 F predicted for the 0.5-ft2
break. The similarity in the PCTs for these cases confirm that there is .not a significantly higher PCT for CLPD break sizes slightly smaller or larger than 0.5 ft2. This study, which is considered to be generically applicable for all the B&W-designed plants, confirms that the traditional CLPD break sizes are sufficient to validate that the limiting PCT consequences are not under-predicted with the two-minute RCP trip.
5.4 Continuous RCP Operation for Limiting CLPD Break
A continuous pumps-on case was performed for the CR-3 plant based on a 0.50-ft2
CLPD break. This case had slightly lower minimum RCS inventory levels, however, the core uncovering period was limited and the overall PCT for this case was 1000 F. For the CLPD break, the core has the potential to get ECCS flow from two CFTs and at least one LPI pump and one HPI pump. This ECCS flow is significant and it keeps the core covered even though the RCPs were not tripped. This high ECCS flow caused the operation of the RCPs to become ineffective after roughly three minutes because the ECCS condensation reduced the steam velocities required to carry liquid droplets around the RCS. As a result, the reactor vessel flows stagnated as they would if the RCPs were tripped. With the RCS circulation stopped, all the LPI flow and the HPI flow in the intact legs is available for core cooling, because the RCP circulation cannot carry the ECCS to the RCS break location. The result of this case can be used in part to assess the Generic Letter 83-10 commitment to show acceptable results with a RCP trip at 10-minutes after LSCM for the CLPD breaks. The same conclusion could not be reached for a CFT line break unless substantial LPI flow was injected into the downcomer (i.e. flow from both LPI pumps or one pump with cross-tied LPI lines).
5.5 Generic Observations on Selection of the CFT Initial Conditions
The PSC 2-00 analyses used uncertainty, adjusted CFT initial parameters for the new plant applications. There are some generic conclusions that merit summarizing for future applications.
1. The LOCA analyses that have core uncovering prior to CFT injection will typically have higher PCTs if the minimum CFT pressure is used. The lower pressure delays the CFT injection and the core refill time.
2. If the core is uncovered when the CFT injection begins, the CFT injection rate will be minimized when the maximum liquid inventory and minimum pressure are used. Lower CFT injection rates typically maximize the PCT.
3. If the core uncovering occurs after the CFT empties (because pumped ECCS injection cannot match the core decay heat), then the minimum liquid level may produce the maximum PCT. The CFT pressure for this case is less important, but the minimum pressure will likely lead to higher PCTs.
24
5t-5009856-00I-rai atlmlL Alll - "%II , I1•. . .. . .
FIGURE 5-1. PSC 2-00 Pump Degradation Study - 2 Min RCP Trip DC COLLAPSED LIQUID LEVELS.
-r
a ci C)
TIME, SECONDS
FIGURE 5-2. PSC 2-00 Pump Degradation Study - 2 Min Trip CORE COLLAPSED LIQUID LEVELS.
cc
In
0 J 0
TIME, SECONDS
25
.;:
IJ
Di
a 5 a In C 0 U

Frnm~tnmA ANP Inn 51-5009856-00
FIGURE 5-3. PSC 2-00 Pump Degradation Study - 2 Min Trip NODE 19 HOT CHANNEL CLAD TEMPERATURES.
.1600
-1200
D.
.800w I
,400
U,
U;
-, -
CL I:
FIGURE 5-4. PSC 2-00 Pump Degradation Study - 2 Min Trip Reactor Coolant Pump Head
0 50 100 150 200 250
TIME, SECONDS
-10
8
6 C 4)
E 4 z
2
-I0 300
TIME, SECONDS
26

uoIPoeJl PIOA doH
00' 0o6O 08"0 o0'o 09"0 09o0 OV,'o OVO O'O oo 00,0
I 000*0
I 0I00
- ------------------------------------------ -------------------------------------------------------------- ------------- --------- O~' F01~
5k.
----------.- -.- -----.- ---.- ------------.- -------.- -- ----- ..- ----- 0 0 9 "0 C
---- ----.--- ------------------------------- 0090 S II I II *II S S " -I
-- - -- - ----- -- -- -- -.-- - -
ooz
aso I I *o * Sm
I ISI
'-- OOO IL
'soAJfl J~l~dnlnlNl uoilepeJfiea peoH 099ejd-oMj '9-S ejnB!.j
"OUl dNV uJuIBLUOjd00-9996009-19

6. PSC 2-00 Plant-Specific Analyses without LOOP
The resolution of this PSC included new plant-specific RELAP5/MOD2 analyses performed for the CFT line breaks with delayed RCP trip. These CFT line break analyses were performed initially with a two-minute RCP trip using the current plant ECCS configurations and operator guidance contained in the emergency operating procedures (Reference 2). In some cases where the 10 CFR 50.46 acceptance criteria were not met, new plant-specific manual RCP trip times less than two minutes were defined. In one of the partial power Oconee cases, the allowed core power was reduced to produce acceptable PCTs based on preserving the two-minute RCP trip.
Because the CFT line break consequences with offsite power available are not bounded by the LOOP analyses, it is imperative that the limiting scenario be thoroughly addressed by this PSC. The appropriateness of the original results were qualitatively reviewed considering the improvements or changes in the SBLOCA EMs including the current operator guidance, limiting single failure assumptions, and key boundary conditions used in the current LOCA licensing analyses of record. The generic method of review is based on the material provided in this section with the plant-specific variations addressed in the following subsections.
In general, the RCS pipe break locations that produce the most severe consequences are those that directly remove the highest percentage of ECCS liquid through the break, bypassing the core region and not providing any core cooling. For the B&W-designed plants, the CFT line break and HPI line break are obvious candidates for the limiting break locations due to the high ECCS injection fraction lost. A break in the CLPD piping also has potential for diverting HPI that is injected into the RCS before it can provide core cooling. These break locations are the only ones that can directly bypass the ECCS flows before the liquid can reach the core region.
ECCS injection to the intact cold legs or CFT nozzles is not as easily bypassed unless it is through steam carryout of the liquid, such as with a LBLOCA in a CLPD pipe. This indirect bypass is only temporary, however, because the velocities that carry the liquid subside as the blowdown phase ends. After that time, only the ECCS injected into the broken leg is lost. RCP operation has a smaller effect on the larger break sizes. This is because the significant ECCS flow near the end of blowdown effectively negates the generated RCP head by condensing the steam flowing into the downcomer, thereby ending any significant RCS circulation that could cause continued ECCS bypass.
The effect of the RCP operation on ECCS bypass during a smaller break transient is not inconsequential. For a SBLOCA with RCPs tripped, ECCS entering intact legs or pipes will not be carried out the break by break steam flow because the velocities are too small. If the RCPs remain in operation, however, the RCS circulation can carry the intact leg ECCS flow through the reactor vessel, around the RCS loop piping, and out of the break. This additional ECCS bypass can only occur as long as the RCPs remain in
28
51-5009856-00

Frm•m-qnme ANP Inc 51-500....-..
operation. This bypass is prevented by prompt manual RCP trip following LSCM when offsite power is available.
For the B&W-desfgned plants, the CFT line break has the most potential of any SBLOCA to bypass the largest faction of ECCS (i.e. flow from one of the CFTs and potentially all the flow from one LPI pump). When LOOP is assumed at the time of reactor trip, a guillotine break in the CFT line produces little to no core uncovering. Without LOOP the results can be more severe if the manual RCP trip occurs after the RCS reaches an average void fraction of roughly 70 percent (which occurs at roughly 85 seconds into the transient). When the pump trip is delayed beyond this time, the ECCS carryout is accentuated and the PCT consequences are more severe. New plant-specific CFT line break analyses with the delayed RCP trip were performed for all the B&W-designed plants and are reported in Sections 6.1 through 6.5.
Aside from the CFT line break, the next limiting SBLOCA break location in terms of the ECCS bypass is a break in the CLPD piping. This location has the potential to directly bypass a significant fraction of HPI flow, depending upon the break location (HPI line versus bottom of the CLPD pipe) and plant HPI arrangement. The HPI line break is limited in size, but it has the highest bypass fraction. The CLPD break HPI bypass is most critical after the pumps are tripped, because any HPI injected into the leg with a break on the bottom of the pipe between the RV and HPI location is lost for core cooling. While the pumps are operating, a significant fraction of the HPI fluid can be entrained in the RCS flow and not lost for core cooling. However, after loop flow coastdown this liquid can flow out of the break and be unavailable for core cooling.
Continuous RCP operation during a SBLOCA circulates the liquid (and steam after RCS saturation) through the RCS piping and components. This circulation continues until the RCPs are tripped or until the ECCS condensation of the steam flowing through the pumps effectively negates the pump head and interrupts the continuous RCS liquid circulation. The high break flow causes the pressure to drop and the liquid loss, plus core boiling and liquid flashing, initiates RCS voiding. At low void fractions, the pump operation effectively circulates the fluid because the generated pump head is high. This effective circulation keeps the RCS well mixed such that it evolves with a near uniform system void distribution.
As the pump inlet void fraction increases above roughly 20 percent, the pump head begins to degrade substantially. This head degradation continues with increasing void fraction until it maximizes at void fractions between 50 and 75 percent. The maximum degradation reduces the driving force for the RCS fluid circulation, however, the decreasing fluid density allows the RCS to remain in effective forced circulation. At the higher void fractions, the pump head can be effectively decreased by the steam condensation in the cold legs from HPI injection or in the downcomer from CFT or LPI injection. The steam condensation from high ECCS flow rates decreases the steam velocities, such that there is insufficient driving force to keep the liquid entrained in the core and vessel upper plenum. If the liquid de-entrains, it will not be circulated through
29
51-5009856-00

the loops back to the pump inlet. When this occurs, the pump head is reduced to a few psi, and RCS circulation ceases even though the pump remains in operation.
The potentiar for the ECCS to negate the RCP circulation is dependent upon ECCS flow rate and RCS void fraction as calculated in Reference 12. If the RCS pressure is above the CFT fill pressure, then only HPI is injecting and the ECCS condensation rate is small. At 600 psia, a typical HPI flow of 500 gpm at 120 F can condense 36 Ibm/s of steam. If this steam is condensed, the steam velocity in the core is decreased by roughly 0.55 ft/s. At higher void fractions, the liquid is carried around the loop by the steam velocities. If the steam velocity is significantly reduced, it allows the liquid to deentrain in the vessel because the larger flow areas reduce the average steam velocities. A reduction in the steam velocity of less than I ft/s is not a significant decrease, therefore it should not cause de-entrainment of the liquid droplets.
At 150 psia for a CLPD break, there is additional ECCS flow from LPI and CFT. Calculations in Reference 12 used a CFT flow of 2000 gpm (note that this flow is depressurization rate dependent and this value is expected to be the minimum value for break sizes of 0.3 ft2 and larger) at 120 F and 2000 gpm of pumped ECCS. This ECCS flow rate can condense 154 Ibm/s of steam. If this steam is condensed, the steam velocity in the core is decreased by roughly 9.2 ft/s. This velocity decrease is much more significant and it may allow the liquid to de-entrain in the vessel. Large CLPD breaks would have more CFT and LPI flow (up to a maximum of roughly 10 times more than this calculation), so the likelihood of liquid de-entrainment in the vessel is even greater for those break sizes at the low RCS pressures. What this means is that the RCPs are effectively tripped as soon as significant ECCS flow rates'from the CFT and LPI are achieved, which can occur prior to two minutes for break sizes larger than 0.5 fe. in this case the manual operator trip of the RCPs is inconsequential for core cooling, but it does protect them from any mechanical problems (i.e. vibrations, seal cooling, etc.) that could arise from continued operation.
Consideration of the core cooling consequences for CLPD break sizes larger than those analyzed in the late 1970's with two-minute RCP trip (Reference 30) were completed. This was necessary given the fact that the ,new CFT line break analyses show that high ECCS injection rates (without LPI injection) can negate the pump head and stop RCS liquid circulation by means of phase separation in the reactor vessel. In general, the overall core cooling potential for CLPD break sizes of 0.3 ft2 and larger is good (much better than the CFT line break), because the flow from the LPI pump and the second CFT is available early in the event. Because of this abundant ECCS flow, it is expected that acceptable core cooling will be obtained independent of the pump operational status (i.e. either in operation for several minutes or tripped via LOOP at turbine trip). There may be some PCT differences, but they are both expected to produce acceptable core cooling results.
The sensitivity studies for the SBLOCA break sizes previously completed with the CRAFT2 code would likely be confirmed if new analyses were performed with the RELAP5/MOD2 code. For break sizes larger than those evaluated in the 1970's with
30

the C2-EM, there are some potential changes that may be observed due to the code formulation differences. For instance, the phase separation models in the CRAFT2 code were very limited for pumps-on simulations. They were acceptable for stagnant flow conditions but were not well suited for pumps-on applications. Other sources of differences may be related to the plant-specific ECCS piping networks that may have reduced the ECCS inflow rates (i.e. lower HPI flow rates and no credit for LPI manual cross-connect) and consideration of uncertainty adjusted CFT parameters in the new analyses. Another potential difference is that the SBLOCA EMs consider different break ranges (CRAFT2 <0.5 ft2, RELAP5 < 0.75 ft2). The larger SBLOCAs (0.3 ft2 and larger) generally did not have any core uncovering in the late 1970's, but the reduced ECCS flows and uncertainty adjusted CFT parameters do allow some limited core uncovering in the recent analyses. Therefore, the larger CLPD SBLOCAs must be reanalyzed with a delayed RCP trip to calculate the PCTs and ensure they are not limiting.
Smaller CLPD break sizes (0.3 to 0.04 fe) depressurize slower and produce minimum core levels at later times in the transient. Pump operation for two minutes will have less impact on these analyses that experience core uncovering later in the transient. Therefore, the effect of RCP operation for two minutes should be inconsequential to these break sizes. For the smallest break sizes (< 0.04 ft2), the extended RCP operation should improve primary-to-secondary heat removal and result in earlier ESAS, which could be of some benefit for these smaller break sizes. If there is a change in the predicted PCT, it should be a reduction from the immediate RCP trip results versus those for a two-minute RCP trip.
Based on these considerations, it was concluded that only the larger CLPD break sizes must be reanalyzed with the delayed RCP trip using the RELAP5/MOD2-based EM. Break sizes that are 0.3 ft2 or greater were analyzed or favorably compared to an, analysis of this break size for a another plant that has similar power levels, ECCS inflow rates, and RCP performance parameters. The new CLPD breaks along with the revised CFT line breaks that were reanalyzed for all of the B&W-designed plants are given in the following subsections, along with the key inputs and sensitivity studies included to demonstrate that the limiting consequences were not under-predicted.
31
Framatome ANP. Inc-

F............... tnc... 5-50 9 560
6.1 PSC 2-00 Analyses for TMI-1
While FRA-ANP was evaluating the cases that would need to be reanalyzed if TMI-1 increased the uncertainty on the initial CFT liquid volume, questions regarding the CFT line break with offsite power available and two-minute RCP trip were raised. The questions lead to the completion of several preliminary scoping studies with delayed RCP trip. One of the CFT line break analyses was documented and it is listed as Case T-1 in Table 6-2. It modeled a two-minute RCP trip and the R5-default two-phase head degradation model. This case was performed from the TMI-1 uprated power level of 2772 MWt using the ECCS flow from a single HPI pump and CFT. This case had significant core uncovering and the PCT exceeded the 10 CFR 50.46 acceptance criteria, prompting the writing of PSC 2-00. A second CFT line break case, labeled T-2, was subsequently performed at the current licensed power level of 2568 MWt for TMI-1 with the same inputs as the previous case. The calculated PCT was 1874 F, but it also used the R5-default RCP head degradation model, which was subsequently found not to be conservative for this CFT line break application. When the minimum two-phase RCP head degradation curve was used in Case T-3, the calculated PCT consequences were greater than the 2200 F acceptance criteria, and the NRC was notified of these results by Framatome Technologies letter (FTI-00-2433) on September 26, 2000. Because of these findings, additional CFT line break analyses for TMI-1 were completed with credit for a second HPI pump at ten minutes and also early RCP trip as discussed in Section 6.1.1. After completing the CFT line break cases, the large CLPD breaks were reanalyzed and the results are discussed in Section 6.1.2. The TMI-1specific analyses used the key inputs summarized in Table 6-1.
32
51-5009856-00

51-5009856-00
Table 6-1. TMI-1 Key Inputs Table
A complete Analytical Input Summary for TMI-1 is contained in Reference 18. This table provides related and additional information related to the key parameters for the
nnnlv•;is of PSC 2-00.
Parameter Value Parameter Value RCS Conditions Core Flood Tank (CFT) Parameters
Core Power 2568 MWt - CFT line break Max CFT Pressure 650 At 102% of 2772 MWt - CLPD breaks (psia) RCP Type Westinghouse Min CFT Pressure 580
(psia) RCP Two-Phase RELAP5 Max CFT Volume 985
Degradation Head (ft3/tank) Difference
RCP Two-Phase M3-Modified Min OFT Volume 895 Degradation Head (also referred to as M3) (ft/tank)
Multiplier RCP Trip 2 Min after LSCM - CLPD
1 Min after LSCM - CFT Fuel Type Emergency Core Cooling System (ECCS)
Parameters Fuel Type: HPI Flow from one CLPD - Reference 18
SBLOCA results Mark-B9 pump CFT - Variety given in have been shown to Reference 5 be fairly independent
of fuel design. Cladding Material Zircaloy
Offsite Power Available ? Operator Actions
RCP Trip Offsite power is assumed RCP Trip RCPs are to be tripped available for operation of immediately following
the RCPs. LSCM.
Delays All equipment delays, etc, The analyses with are maintained consistent delayed RCP trip
with the LOOP assumption credited trip of all RCPs for conservatism, at the stated time after
Sin le Failure LSCM.
CFT Line Break Vital electrical buss that disables one HPI pump, BWST- to- Sump Transfer suction from
one LPI pump, plus other Switchover BWST to RB sump and key instrumentation preserve indefinite
CLPD Break EDG or vital buss that operation of the HPI
disables one HPI pump, pumps until the LPI lines
one LPI pump, plus other can be cross-tied and key instrumentation the required minimum
flow balance achieved or operation of the second
I LPI pump restored
33
101111a U111V . "%.,. 51-5009856-00 Er 4 A D IE,-.-,,•,-•.,-.,.•, AI•ID In.

Framatome A. . . Inc. 51 -5009856-00
6.1.1 TMI-1 CFT Line Break Cases with Offsite Power Available
Three types of sensitivity studies were performed with the CFT line break transient for the TMI-1 plant, which has Westinghouse pumps. The first study evaluated the effects of the two-phase head degradation of the RCPs with the RELAP5-default and M3modified models. The second study investigated the CFT line break with a one-minute RCP trip. The third study evaluated the CFT line break with credit for additional HPI flow at 10 minutes after ESAS. This study evaluated all four bounding combinations of CFT initial conditions to determine the limiting case.
In the TMI-I RCP head degradation study, the general use RELAP5-default multipliers (Case T-2) and the minimum M3-modified multipliers (Case T-3) were examined. The minimum degradation model (M3-modified) maintained a higher RCP head, which decreased the downcomer level while the pumps remained in operation. The increased effectiveness of the RCPs allowed more RCS circulation and additional carryout of both the ECCS liquid and vessel liquid inventories via flow around the loop to the broken CFT line. Once the RCPs were tripped, the RCP head subsided, the reactor vessel vent valves (RVVVs) opened, and the downcomer level increased by drawing liquid from the core region. This reduced vessel liquid inventory, with the ECCS flow from a single CFT and one HPI pump, was insufficient to keep the core from uncovering and heating up. The most significant difference was that the M3-modified case predicted a cladding temperature greater than 2200 F when a two-minute RCP trip was included in the model at the current licensed power level. The NRC was, notified of these preliminary results by Framatome Technologies letter (FTI-00-2433) on September 26, 2000.
The reduction in core inventory, with a the two-minute RCP trip for Case T-3 with the M3-modified two-phase degradation, resulted in significant core uncovering after the intact CFT emptied. More than half of the core region was uncovered, and the case exceeded the 10 CFR 50.46 peak cladding temperature limit at 840 seconds. By contrast, the RELAP5-default multiplier resulted in roughly five feet of core uncovering with a PCT of 1874 F. Therefore, it was obvious that use of the M3-modified multiplier provided bounding results for the CFT line break transient with delayed RCP trip. Having obtained these results, several additional contingency cases were initiated: 1) with a one-minute RCP trip, and 2) with flow from a second HPI pump credited within ten minutes after LSCM.
The second CFT line break sensitivity study was performed with a one-minute RCP trip using the conservative M3-modified minimum head degradation model to provide improved PCT consequences. Since the operators are instructed by the emergency operating procedures (EOPs) to manually trip the RCPs immediately following LSCM, credit for a one-minute RCP trip is well supported. The CFT line break transient with credit for a one-minute RCP trip, Case T-8, predicted a PCT of 717 F. With the oneminute RCP trip, the minimum downcomer level remained high such that no core uncovering was predicted after RCP trip and the PCT was set by the maximum steady-
34

ýrnmn*nmea AMP Int-5-00860
state cladding temperature. The minimum inventory and minimum pressure CFT initial conditions used in the case were determined to be conservative based on the third CFT line break sensitivity study.
The third sensitivity study evaluated the consequences of the CFT line break with a two-minute RCP trip using the M3-modified curve with credit for additional HPI at 10 minutes after ESAS. Each combination of bounding CFT pressure or level initial conditions was evaluated by Cases T-4 through T-7. The T- 4 case that modeled the minimum pressure and minimum level produced the limiting PCT of 1582 F, which occurred after the CFT emptied and near the time that the HPI injection rate matched the liquid loss from flashing plus the core decay heat and residual metal boiloff rates. The studies showed that the CFT pressure variations resulted in only small changes in the calculated PCT, with the minimum pressure being limiting for both minimum or maximum level cases.
6.1.2 TMI-1 0.75-, 0.5-, and 0.3 ft2 CLPD Break Cases without LOOP
The larger CLPD breaks were also reconsidered for TMI-1 with offsite power available. In these cases performed at the uprated power of 2772 MWt, credit for operators manually tripping the RCPs was taken at two minutes after reaching the LSCM indication. (Note: The two minute RCP trip was retained with the higher core power because there is additional ECCS flow that can be credited for a CLPD.) Typically, these breaks are analyzed with LOOP assumed at the time of turbine trip based on the ties to previous CRAFT2 pump trip studies. The historical CRAFT2 analyses that defined the restricted RCP trip region indicated that there would be acceptable core cooling if the RCPs were tripped before the RCS void fraction reached 70 percent (roughly 30% mass inventory) or after significant LPI flow to the core was obtained. Break sizes greater than 0.3 ft2 were initially extrapolated in Figure 3-1 to reach the 70 percent void fraction at roughly three minutes. It was also shown that significant LPI flow was obtained at this same time, such that there would not be a restricted region for these break sizes. The rationalization of a restricted region for RCP trip seems sound with the criteria used previously, however, the actual time to reach these conditions for these larger breaks is less assured when using the RELAP5/MOD2 EM. Therefore, it was prudent to reanalyze the larger CLPD cases (0.3, 0.5 and 0.75 ft2) with a twominute RCP trip for comparison to an immediate RCP trip because of LOOP.
The first case, labeled T-9, was an analysis of a 0.3-ft2 CLPD break. This analysis used the limiting M3-modified head degradation curve determined to be the most conservative in the CFT line break studies, and modeled a two-minute RCP trip following LSCM. The initial CFT minimum pressure and maximum inventory were shown in CLPD break sensitivity studies to be limiting (Reference 22), so they were used for this analysis. The minimum pressure delays the CFT injection time and the maximum level reduces the early CFT injection rate (not the integrated total) such that a maximum PCT is produced. For this analysis performed at the uprated core power
35
51-5009856-00
F~rnm~qtnMP ANP Ing.1509560
level of 2772 MWt, the RCS void was found to be roughly 66 percent at 2 minutes when the RCPs were tripped. After trip, the pumps coasted down and the RVVVs opened. The results were improved over the LOOP case PCT of 790 F, because the PCT remained at the initial steady-state cladding temperature of 719 F. This analysis confirmed that based on the seventy percent RCS void criteria, this case should not have been more limiting with a two-minute RCP trip. This case also revealed that significant LPI flow was obtained by roughly 350 seconds.
The next case analyzed was the 0.5-ft2 CLPD break that is similar in size to the CFT line break area. This break location does reduce the total HPI flow that reaches the core by roughly 30 percent, however, this deficit is offset by the flow from two intact CFTs and at least one LPI pump. The ECCS flow assured to reach the core for this break location is well in excess of the marginal flow available for the CFT line break. This additional ECCS flow allows the RCP trip time to be analyzed at two-minutes after LSCM with acceptable PCT consequences even with the M3-modified head degradation curve. The PCT with the two-minute RCP trip was 1017 F, as shown for Case T-10 in Table 6-3. The core uncovering for this case occurred prior to the CFT injection phase and it was created because the RCP was tripped when the RCS void fraction was 88 percent. This PCT was 172 F greater than the PCT for this break size with LOOP. This case obtained significant LPI flow by roughly 190 seconds. Based on this RELAP5 analysis, RCP trip was completed after the RCS void fraction was above 70 percent, but before significant LPI flow was initiated. Based on the historical RCP trip criteria, this RELAP5 case had a RCP trip in the restricted region (see Figure 3-1) and therefore the results should be more limiting than the case with LOOP. The original CRAFT2 restricted region would not have this break size in the restricted region because the extrapolated time for obtaining LPI flow was at or before the time that the RCS void fraction reached 70 percent.
The final CLPD case, which was labeled T-1 1, was of a 0.75 ft2 CLPD break analysis. This analysis also used the same assumptions as Cases T-9 and T-10, with the break size changed. For this analysis, the RCS void was even higher, at roughly 94 percent, at two minutes when the RCP was tripped. The PCT increased to 866 F, which was only marginally higher than the LOOP case PCT of 860 F. This case obtained significant LPI flow by roughly 130 seconds. Based on this RELAP5 analysis, RCP trip was completed after the RCS void fraction was above 70 percent, but before significant LPI flow was initiated. Based on the historical RCP trip criteria, this case had a RCP trip in the restricted region and therefore the results should be more limiting than the case with LOOP. This break size was also not in the CRAFT2 restricted region based on the extrapolation of 70 percent void fraction and LPI flow initiation times and also because this break was a LBLOCA for the C2-EM.
Each of these RELAP5 CLPD analyses support the historical parameters that were used to define when offsite power core cooling consequences with delayed RCP trip could be more limiting than the same break size with LOOP. It does appear that the extrapolation of the restricted region enveloping curves is somewhat different based on the new RELAP5 analyses. The new RELAP5 0.75-ft2 case also showed that the
36
51-5009856-00

rn•amlf•ml A•IIJ Int- 51-5009856-00
steam condensation by the high ECCS flow rates from CFT and LPI effectively halt the
RCS circulation even though the RCPs may still be in operation. This result suggests
that RCP operation is rather inconsequential to the severity of the results for the larger SBLOCAs or smaller LBLOCAs.
The PCTs increased significantly for some of the SBLOCA break sizes with offsite
power available, however, the limiting SBLOCA PCT for TMI-1 remains at 1454 F for
the 0.05-ft2 CLPD Line break with the increased EFW temperature (Reference 29). The
acceptable PCT increase for the CFT line break is supported by two key changes in the
SBLOCA analyzes of record for TMI-1. One is the one-minute RCP trip operator action
time used in the CFT line break and the other is the core power level of 2568 MWt. This is the current rated power level for this plant, although the remaining LOCA analyses were performed at 2772 MWt to support a future power uprate.
37

FlrnmzatnmP AMP Inn ll-O.. ......
Table 6-2 PSC 2-00 Analyses Performed with the Westinghouse Pumps for TMI-1
HPI Flow fraction from RCP Analyzed
RCP 1 HPI pump LPI flow Two-Phase Power Peak New Trip Break Area into the RCS fraction Pump Level Clad
PSC 2-00 Time (if) From 1 LPI Degradation Was Temp. Cases after I If two pump into Model 102% of (F) Notes
LSCM Break Type entries: the RCS Used in the (MWt) (min) < 10 min/ Analysis
>10 min T-1 2.0 0.44/CFT 1.0 0.0 R5 2772 >2200 Non-limiting 24 head mult-source of PSC T-2 2.0 0.44/CFT 1.0 0.0 R5 2568 1874 Non-limiting 2€ head mult T-3 2.0 0.44/CFT 1.0 0.0 M3 2568 >2200 Initial Source of NRC letter (FTI-00-2433) T-4 2.0 0.44/CFT 1.0/1.5 0.0 M3 2568 1582 CFT Min P, Min V, 2n0 HPI at 10min T-5 2.0 0.44/CFT 1.0/1.5 0.0 M3 2568 1576 CFT Max P, Min V, 2nd HPI at 10min T-6 2.0 0.44/CFT 1.01 1.5 0.0 M3 2568 1454 CFT Min P, Max V, 2nw HPI at 10min T-7 2.0 0.44/CFT 1.0/1.5 0.0 M3 2568 1424 CFT Max P, MaxV, 21 HPI at 10min T-8 1.0 0.44/CFT 1.0 0.0 M3 2568 717 CFT Min P, Min V T-9 2.0 0.3/CLPD 0.7 1.0 M3 2772 719 No heatup, LOOP is limiting T-10 2.0 0.5/CLPD 0.7 1.0 M3 2772 1017 +172 F PCT over LOOP case "T-11 2.0 0.75/CLPD 0.7 1.0 M3 2772 866 +6 F PCT over LOOP case
Note: The results of these cases were taken from Reference 5.
38
S.11-500AS 56-00

~I"FiIId UI II I'4lr~t iM I .
Table 6-3. TMI-1 LOOP and No-LOOP SBLOCA PCT Comparisons.
Break Size ft2
0.75flF
0_3
SBLOCA LOOP PCT F
SBLOCA 2-Min RCP TriD PCT, F
l- - _.___.PCT_____ F _
bbUV4i ... .
845 1U17 -r_ -P n JsI;
SBLOCA 1-Min RCP Trip PCT, F
N/A N/A
ri +n 790n 1 R%
J,,LP 0,0 13. 1 N/A
CLPD 0.10 1334 <1334 N/A
CLPD 0.09 1354 <1354 N/A C•LPD 0.08 1375 <1375N/
CLPD 0.07 1331 <1331 N/A
CLPD 0.06 1357 <1357 N/A
CLPD 0.05 1454 1 <1454 N/A
CLPD 0.04 1361 <1361 N/A
CLPD 0.03 1287 <1287 N/A
CLPD 0.01 715 715 N/A
HPI Line 0.02463 1299 z <1299 N/A
HPI Line 0.02463 1297 • <1297 N/A
CFT Line 0.44 715 >2200 4 717
The PCTs without notes were included in Reference 22 based on a core power of
2772 MWt. The two-minute RCP trip PCTs were listed as less than the LOOP case
value based on the discussions given in Section 6.
Notes:
1. This PCT was calculated in Reference 29. 2. Without manual HPI actuation 3. With manual HPI initiation and letdown isolation at 10 min after LSCM
4. These CFT line breaks with a one- and two-minute RCP trip were performed at a
core power of 2568 MWt. 5. These cases were analyzed in Reference 5.
39
Break
f•l I'n(N•l P
r1 P1rI Dnl
790<tlz09")
II
51-5009856-00I'-•• A Ikll::) I.•,,•
•000
I'm1
I•11/Af1v

Frnm�atAm0 AMP rn� E�1 -!i009856-OO , .� . -.
6.2 PSC 2-00 Analyses for CR-3
The CR-3 plant ECCS configuration and flow rates are similar to the TMI-1 plant, therefore the CFT line break consequences should be similar. There are two key differences in the TMI-1 and CR-3 SBLOCA applications: 1) the CR-3 analyses were initially performed at a core power of 2568 MWt and 2) the CR-3 plant has Byron Jackson pumps. The initial CR-3 CFT line break with a two-minute RCP trip produced a PCT of 1391 F with the default-RELAP5 two-phase degradation model as shown in Case C-1 of Table 6-7. However, when the limiting M3-degration model was used in Case C-3, the results exceeded the acceptance criteria temperature of 2200 F, and the NRC was notified of these results by Framatome Technologies letter (FTI-00-2433) on September 26, 2000. Because of these findings, additional CFT line break analyses for CR-3 were completed with a one-minute RCP trip as discussed in Section 6.2.1. After completing the CFT line break cases, the large CLPD breaks were reanalyzed and the results discussed in Section 6.2.2. The analyses used the key inputs given in Table 6-4.
40
Prnmf e-lf•lJl•ima AKIlP |nt 51-.5009856-....
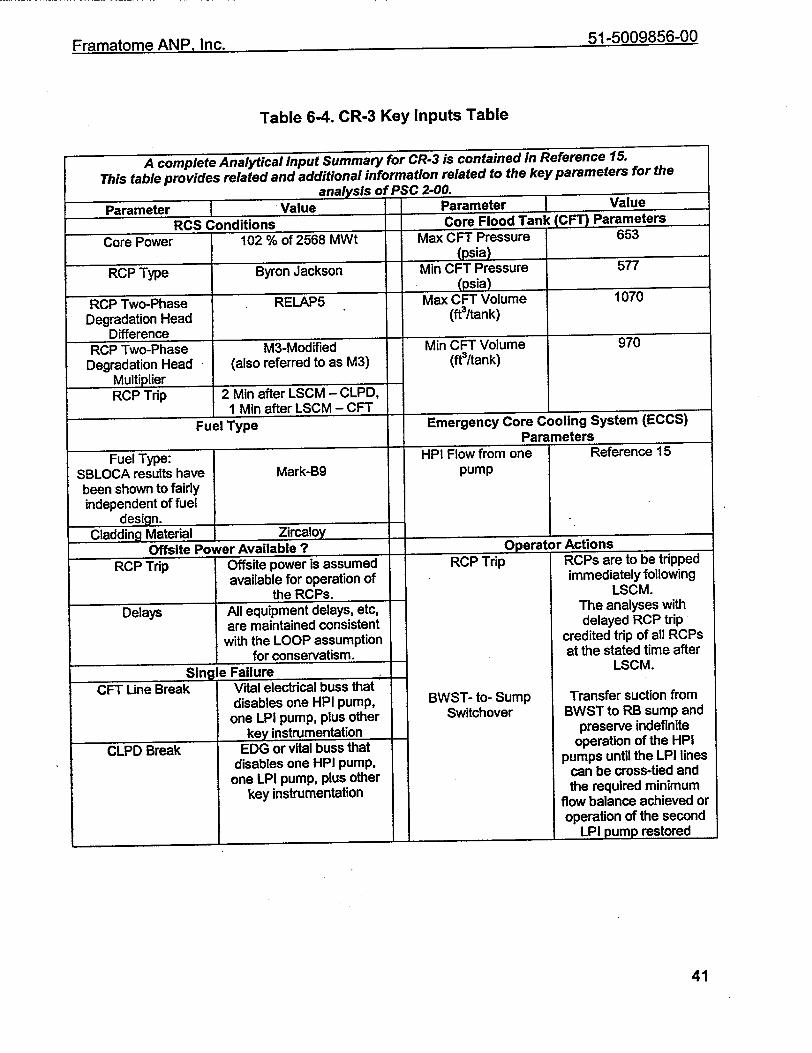
51-5009856-00
Table 6-4. CR-3 Key Inputs Table
A complete Analytical Input Summary for CR-3 is contained in Reference 15.
This table provides related and additional information related to the key parameters for the
analysis of PSC 2-00.fl..rnn4nr Vnhiti
102 % of 2568 MWtRrA Codition
4 0 - I tByron Jackson
Parameter I Value Core Flood Tank (CFT) Parameters
x CFT Pressure 653(psia)
Min CFT Pressure (psia)
4 i-I .. n%,,...... I Max �,r I VUIU[II�RELAP5
M3-Modifled (also referred to as M3)
2 Min after LSCM - CLPD, 4 !RA-n ý,ffr I -QCMK - eCFT
I ~-t-I-
1-
fax t VltUk e (ftO/tank)
Min CFT Volume (ft3/tank)
577
1070
970
Core Power
RCP Type
RCP Two-Phase Degradation Head
DifferenceRCP Two-Phase
Degradation Head MultiplierRCP Trip
I *I¥1111 aln G bULa, va n
Fuel Type Emergency Core Cooling System (ECCS) Parameters
Fuel Type: HPI Flow from one Reference 15
SBLOCA results have Mark-B9 pump been shown to fairly independent of fuel
design. Cladding Material Zircaloy
Offsite Power Available ? Operator Actions
RCP Trip Offsite power is assumed RCP Trip RCPs are to be tripped
available for operation of immediately following the RCPs. LSCM.
Delays All equipment delays, etc, The analyses with
are maintained consistent delayed RCP trip
with the LOOP assumption credited trip of all RCPs
for conservatism, at the stated time after
Single Failure LSCM.
CFT Line Break Vital electrical buss that disables one HPI pump, BWST- to- Sump Transfer suction from
one LPI pump, plus other Switchover BWST to RB sump and
key instrumentation preserve indefinite
CLPD Break EDG or vital buss that operation of the HPi
disables one HPI pump, pumps until the LPI lines
one LPI pump, plus other can be cross-tied and
key instrumentation the required minimum flow balance achieved or operation of the second
LPI pump restored
41
RCS Conditionls
A M I Framatunie . "to.
n_ #_ Value a us ljý a i tMm
BI m
I
I
I
•" .... .1.^•,.,, AISLE) In,,-

51-5009856-00i I ILIk I II Ca.
6.2.1 CR-3 CFT Line Break Cases with Offsite Power Available
Three sets of sensitivity studies were performed with the CFT line break transient for the CR-3 plant, which has Byron Jackson pumps. The first study evaluated the effects of the RCP two-phase head degradation with the general use RELAP5-default curve (Case C-1), the minimum degradation M3-modified curve (Case C-3), and the maximum degradation MI curve (C-2). The second study investigated the differences in the CFT line break with variations in the RCP trip time (at one minute and two minutes after LSCM) and contrasted these results against the CFT line break with LOOP at reactor trip. The third CFT line break study used the one-minute RCP trip and evaluated the four bounding combinations of CFT initial pressure and liquid inventory in Cases C-4 through C-7.
rn the CR-3 RCP head degradation study with a two-minute RCP trip, all three twophase pump head degradation models were analyzed to confirm which degradation model was most conservative for this application. The difference in the transient results with the individual RCP head degradation curves was discussed in Section 5.1. The R5-default curve and the MI maximum degradation curve produce similar results with PCTs of 1391 and 1408 F, respectively. The difference in these two cases developed between 20 and 130 seconds after break opening. The small but noticeable difference could be observed in a primary system mass fraction difference of one percent of the initial RCS mass between these cases (20.4 versus 19.5 percent) shortly after RCP trip (130 seconds) as shown in Table 6-5. By contrast, the M3-modified head multiplier case had a 12.1 percent initial mass inventory at this time. For these head degradation cases, the majority of the liquid mass remaining in the RCS was located in the reactor vesseL This reactor vessel inventory difference after the RCPs tripped and coasted down was the key factor leading to the severity of the second core uncovering period and the overall PCT response (as shown in Figure 5-1).
In the second CFT line break sensitivity study, the core cooling variations for different RCP trip times were compared. Variations in the historical two-minute RCP trip time is supported by EOP operator training to manually trip the RCPs immediately following LSCM. Therefore, credit for a one-minute RCP trip is supported by observed times for operator training on the plant simulator.
The cases studied were the LOOP case from Reference 16, the two-minute RCP trip Case C-3, and the one-minute RCP trip Case C-4. Each of these transients used the minimum CFT initial pressure and liquid inventory and the delayed RCP trip cases used the limiting M3-modified two-phase head degradation curve. The LOOP case did not use the M3-modified curve but this variation was immaterial because the RCPs were tripped within one second after break opening.
The LOOP CFT line break case maximizes the reactor vessel liquid retention as observed in the vessel collapsed levels in Figure 6-1 and Figure 6-2. The immediate loss of RCPs from LOOP causes the RCS flows to coastdown, thereby allowing the
42

mi |IIIf]LAI i, 51-5009856-00
RVVVs to open early in the event. The fluid flowing through the RVVVs rapidly transitions to predominately steam, and this flow rate causes the break quality to rapidly increase. This phase change reduces the break mass loss as shown in Figure 6-4. Table 6-6 gives the RCS mass for this LOOP case as 29.4 percent of the initial RCS mass at 130 seconds. For this case, the ECCS flow from the intact CFT and a single HPI pump match the core decay heat and keep the core continuously covered with a two-phase mixture throughout the transient. The cladding temperatures remain near the saturation temperatures as shown in Figure 6-3.
The one-minute RCP trip case evolved similarly to the LOOP case. RCP trip at one minute after LSCM slightly reduced the core collapsed level between 100 and 200 seconds, as shown in Figure 6-2. The initial mass deficit remained after the intact CFT emptied and the difference can be seen in the long-term downcomer level in Figure 6-1. There was only a slight difference in the break mass flow rates from the LOOP case (Figure 6-4) and there was no core uncovering (Figure 6-3). The one-minute pump trip had an RCS mass fraction of 20.8 percent at 130 seconds, which was considerably lower that the LOOP case as shown in Table 6-6.
The two-minute trip case had much lower vessel liquid levels than the other two cases as shown in Figure 6-1 and Figure 6-2. While the RCPs were operating, the break mass flow was higher (Figure 6-4) resulting in a 12.1 percent initial mass fraction at 130 seconds. The lower reactor vessel inventory with a single HPI pump resulted in core uncovering both prior to when the intact CFT discharged and after it emptied, as shown in Figure 6-3. During the second period of uncovering, the cladding temperature exceeded 2200 F.
Table 6-6 gives a quick comparison of the RCS inventory percentages at 20 seconds, which is near the time of the onset of break voiding, and then at 130 seconds, or the time shortly after all RCPs were tripped. At 20 seconds, there was no noticeable difference in the RCS mass fractions between the cases, but there was a substantial difference observed at 130 seconds, and this inventory controls the severity of the cladding response during the transient. This inventory comparison emphasizes how timely operator actions to trip the RCPs during a LOCA with offsite power available is the difference in acceptable versus unacceptable core cooling. Early RCP trip minimizes the RCS liquid inventory lost out of the break, preserving it to augment the ECCS injection flows in providing effective core cooling.
The third sensitivity study evaluated the influence of the CFT initial conditions on the consequences of the CFT line break with a one-minute RCP trip using the M3-modified curve. Each combination of bounding initial CFT pressure and level conditions was evaluated by Cases C-4 through C-7 to confirm that there was no core uncovering for any of these CFT line break scenarios.
Based on these three studies, it was concluded that the M3-modified two-phase head degradation curve was limiting for CR-3 CFT line breaks. This conclusion was similar to TMI-1 with the Westinghouse RCPs and confirms that the M3-modified curve is limiting
43

51-5009856-00SI= nLAS r ~g SL I lneJ 55,Ft 5 . I1
regardless of RCP type. When the limiting CFT line break transient scenario is analyzed with credit of a one-minute RCP trip, there is no core uncovering and the PCT of 718 F is set by the initial cladding temperature at the time of break opening.
44
|
|E"z||I4•IL'JI||• Jr--•l•l| •1 |liq•'l

51-5009856-000I I•liEI LJII I• r"lu I . ......
Table 6-5. CR-3 CFT Line Break RCS Mass Versus Time and Head Difference Curve
Case -- RELAP5 Head M1 Head M3-Modified Head Degradation Curve Degradation Curve Degradation Curve
Case C-1 Case C-2 Case C-3 Transient RCS Liq Mass, Ibm - RCS Liq Mass, Ibm - RCS Liq Mass, Ibm Time, sec (mass percentage, % ) (mass percentage, %) (mass percentage, %)
0.0 492433 - (100 %) 492433 - (100%) 492433 - (100 %)
20.0 374944 -- (76.1%) 375223 - (76.2%) 374964 - (76.1%)
120.8 RCP trip time assumed for all cases
130.0 100536-- (20.4%) 96003 -- (19.5%) T 59647 -- (121
Note: The RCS mass was calculated by taking the primary system mass less the intact CFT mass from the major edit at the time given.
Table 6-6. CR-3 CFT Line Break RCS Mass Versus Time and RCP Trip Time
Case -4 LOOP at Reactor Trip 1 Minute RCP Trip 2 Minute RCP Trip Reference 16 Case C-4 Case C-3
Transient RCS Liq Mass, Ibm - RCS Liq Mass, Ibm - RCS Liq Mass, Ibm -
Time, sec (mass percentage, %) (mass percentage, %) (mass percentage, %)
0.0 492427 - (100 %) 492433 - (100%) 492433 -- (100 %)
0.3 RCP trip on reactor trip N/A N/A
20.0 362019 - (73.5%) 374714 - (76.1%) 374964 - (76.1%)
60.8 N/A Manual RCP Trip N/A
120.8 N/A N/A Manual RCP Trip
130.0 144748 - (29.4%) 102252 - (20.8%) 59647 - (12.1%)
Note: The RCS mass was calculated by taking the primary system mass less the intact
CFT mass from the major edit at the time given.
45

•rm ~frnm, AM•ID IntI I I I ICLA IIIt Ir1 I Ioil . ...D
FIGURE 6-1. PSC 2-00 RCP Trip Timing Study DC COLLAPSED LIQUID LEVELS.
-1:
I
2Z C
5 C
uJ
28
-r uJ Lu -J C
0
C, 0
TIME, SECONDS
FIGURE 6-2. PSC 2-00 RCP Trip Timing Study CORE COLLAPSED LIQUID LEVELS.
1500
TIME, SECONDS
51-5009856-00
a Lu 'U
0 C.
46

C'^.nmn.•,,n..n,.. A kid Inn,I-I lid IUI I nI 'l r lilt, " 4.
FIGURE 6-3. PSC 2-00 RCP Trip Timing Study NODE 19 HOT CHANNEL CLAD TEMPERATURES.
I
LU
0.
0 500 1000 1500 2000 2500
51-5009856-00
1600
.1200
5u I
800 2
400
3000
TIME, SECONDS
FIGURE 6-4. PSC 2-00 RCP Trip Timing Study BREAK MASS FLOWS.
4800
4000
U
3200 -J
uS
• 2400,
u}1600,
0
0
uS
IL. Ul) U)}
200 400 600 800 1000 1200
TIME, SECONDS
47

�r�',m�,frirncs AMID ln, 51-5009856-00
6.2.2 CR-3 0.75-, 0.5-, and 0.3 ft2 CLPD Break Cases with Offsite Power Available
Based on the discussion in Section 6, it was concluded that the larger CLPD breaks
needed to be reconsidered for CR-3 with offsite power available. In these cases, credit
for operators manually tripping the RCPs was taken at two-minutes after reaching the
LSCM. Typically, these breaks are analyzed with LOOP assumed at the time of turbine
trip based on the ties to previous CRAFT2 pump trip studies. The RCP restricted
region was reviewed for the TMI-1 offsite power available analyses in Section 6.1.2.
The outline of this region is defined by two curves. The first is the time that the RCS
void fraction reaches 70 percent (roughly 30% mass inventory) and the second is after
significant LPI flow to the core is obtained. These derived criteria will be evaluated for
the larger CLPD cases (0.3, 0.5 and 0.75 ft2) that were reanalyzed for the CR-3 plant to
determine if the PCTs with a two-minute RCP trip are higher than those obtained with
LOOP on reactor trip.
The CLPD break location does reduce the total HPI flow that reaches the core by the
broken leg spill fraction, however, this deficit is offset by the flow from two intact CFTs
and full flow from at least one LPI pump. The ECCS flow assured to reach the core for
this break location is well in excess of the marginal flow available for the CFT line
break. This additional ECCS allows the RCP trip time to be analyzed at two-minutes after LSCM with acceptable PCT consequences even with the M3-modified head
degradation curve. There will be core uncovering for the bigger breaks, but the duration of the uncovering is insufficient to seriously challenge the 10 CFR.50.46 acceptance criteria
The first case, labeled C-8, was an analysis of an 0.3-ft2 CLPD break with a core power
of 2568 MWt. This analysis used the limiting M3-modified head degradation curve with
a two-minute RCP trip following LSCM. The CFT minimum initial pressure and
maximum inventory were shown in CLPD break sensitivity studies to be limiting, so they
were used for this analysis. The minimum pressure delays the CFT injection time and the maximum level reduces the initial CFT injection rate such that a maximum PCT is
produced. For this analysis, the RCS void was found to be roughly 66 percent at 2
minutes when the RCP was tripped. After trip, the pumps coasted down and the
RVVVs opened. The results were similar to the LOOP case, because both PCTs
remained at the initial steady-state cladding temperature. This analysis confirmed that
based on the seventy percent RCS void criteria, this case should not have been more
limiting with a two-minute RCP trip. This case also revealed that significant LPI flow was obtained by roughly 340 seconds.
The 0.5-ft2 CLPD break was also analyzed with a two-minute RCP trip and the M3
modified head degradation curve. This break size is similar to the CFT line break, however the additional ECCS liquid reaching the core for this break location allows the
RCP trip time to be analyzed at two-minutes after LSCM with acceptable PCT
consequences even with the M3-modified head degradation curve. The PCT with the
two-minute RCP trip was 1038 F, as shown for Case C-9 in Table 6-7. The core
48
r #CIIIL II r'Kll !illn l. -

Framatome ANP, Inc. 51-5009856-00
uncovering for this case was prior to the CFT injection phase and it was created
because the RCP was tripped when the RCS void fraction was roughly 90 percent. This
PCT was 236 F larger than the PCT for this break size with LOOP. Significant LPI flow
was obtained by roughly 190 seconds and this flow supplied abundant core cooling for
the remainder of the transient.
The largest analyzed CLPD case, labeled C-10, was of an 0.75-ft2 CLPD break. This
analysis also used the same assumptions as Cases C-8 and C-9, with the break size
changed. For this analysis, the RCS void was even higher at roughly 93 percent at two
minutes when the RCP was tripped. The PCT was 965 F with the two-minute RCP trip.
This PCT was 104 F higher than the LOOP case PCT of 861 F. This case obtained
significant LPI flow by 140 seconds. Based on this analysis, RCP trip was completed
within the restricted region defined by the historical criteria, therefore these results
would have been expected to be more limiting with the two-minute RCP trip. This break
size was also not in the CRAFT2 restricted region based on the extrapolation of 70
percent void fraction and LPI flow initiation times and also because this break was a
LBLOCA for the C2-EM.
A final CLPD sensitivity study case was performed without RCP trip based on the CR-3
0.50-ft2 Case C-9. The results of the analysis showed slightly lower RCS inventory
levels, however, the core flows remained higher between 140 and 170 seconds when
the core uncovering occurs. The higher flows resulted in a slightly lower PCT of 1000 F
at roughly 200 seconds. After LPI flow begins at 190 seconds, the operation of the
RCPs became ineffective in continuing the RCS circulation because the ECCS
condensation reduced the steam velocities required to carry liquid droplets around the
RCS.
Each of these RELAP5 CLPD analyses support the historical parameters that were
used to define when core cooling consequences with offsite power available and
delayed RCP trip could be more limiting than the same break size with LOOP. It does
appear that the extrapolation of the restricted region enveloping curves is somewhat
different based on the new RELAP5 analyses. The 0.75- and 0.5-fte cases also showed
that the steam condensation by the high ECCS flow rates, from CFT and LPI,
effectively halts the RCS circulation even though the RCPs may still be in operation.
This result suggests that RCP trip time is far less important to the results of the larger
SBLOCAs or smaller LBLOCAs, versus that of the CFT line break. The difference is
the abundance of the ECCS flow from two CFTs and full flow from at least one LPI
pump. As the break sizes decrease, however, the RCS pressure will not drop as fast
and the CFT discharge will be at a slower rate. If the RCPs trip at a time that the core
has substantial uncovering, a rapid refill is crucial to acceptable core cooling. The refill
rate is limited for the smaller break sizes so the significance of a timely RCP trip (i.e.
before the RCS exceeds 70 percent void fraction) becomes most critical for these break
sizes.
The CLPD breaks analyzed for CR-3 with a two-minute RCP trip and the M3-modified
degradation curve had some significant PCT increases over the same break size
49

analyzed with LOOP as shown in Table 6-8. However, the delayed RCP trip PCTs did not seriously challenge the acceptance criteria as the limiting SBLOCA PCT for CR-3 remains at 1415 F for the 0.07-ft CLPD break. The only key change in the CR-3 plant analyses of record is the requirement for the operators to complete the RCP trip within one-minute in order to produce acceptable results for the CFT line break.
50
51-5009856-00

- . - - A &it� 8..... 51-5009856-00l-ramatome ANr', inc-.
Table 6-7. PSC 2-00 Analyses Performed with the Byron Jackson Pumps for CR-3.
HPI Flow fraction from RCP Analyzed
RCP I HPI pump LPI flow Two-Phase Power Peak
New Trip Break Area into the RCS fraction Pump Level Clad
PSC 2-00 Time (ft2) From 1 LPI Degradation Was Temp.
Cases after I If two pump into Model 102% of (F) Notes
LSCM Break Type entries: the RCS Used in the (MWt)
(min) < 10 min/ Analysis >10 min
C-1 2.0 0.44/CFT 1.0 0.0 R5 2568 1391 Non-limiting 2÷ head mult
C-2 2.0 0.44/CFT 1.0 0.0 MI 2568 1408 Non-limiting 2ý head mult
C-3 2.0 0.44/CFT 1.0 0.0 M3 2568 >2200 Initial Source of NRC letter (FTI-00-2433)
C-4 1.0 0.44/CFT 1.0 0.0 M3 2568 718 CFT Min P, Min V, no heatup
C-5 1.0 0.44/CFT 1.0 0.0 M3 2568 718 CFT Max P, Min V, no heatup
C-6 1.0 0.44/CFT 1.0. 0.0 M3 2568 718 CFT Min P, Max V, no heatup
C-7 1.0 0.44/CFT 1.0 0.0 M3 2568 718 CFT Max P, Max V, no heatup
C-8 2.0 0.3/CLPD 0.7 1.0 M3 2568 719 No heatup, LOOP is limiting
C-9 2.0 0.5/CLPD 0.7 1.0 M3 2568 1038 +236 F PCT over LOOP case
C-10 2.0 0.75/CLPD 0.7 1.0 M3 2568 965 +104 F PCT over LOOP case
.-Il Never 0.5/CLPD 0.7 1.0 M3 2568 1000 Pump ineffective after 3 minutes
Note: The results of these cases were taken from Reference 14.
51

| I C I I ICI A I /"l l I iII *.0..
Table 6-8. CR-3 SBLOCA PCTs Versus Break Size.
CLPD Break Size SBLOCA LOOP PCT, SBLOCA 2-Min RCP ft2 F Trip PCT, F
0.75 862 965 1
0.5 802 1038 '
0.3 720 719 1
0.2 1096 <1096 0.15 1214 <1214
0.125 1127 <1127 0.1 1376 <1376
0.075 1403 <1403 0.07 1415 <1415 0.04 1392 <1392 0.01 720 720
HPI Line 0.022 1188 < 1188 CFT Line 0.44 715 >2200 4
The PCTs for the LOOP cases without notes were completed in Reference 16. The delayed RCP trip cases are listed as less than the LOOP value for those cases that were not analyzed based on the discussions in Section 6.
Notes:
1. The two-minute RCP trip cases were analyzed in Reference 14. 2. The CFT line break with a two-minute RCP trip exceeded the acceptance criteria. A
one-minute RCP trip had no core uncovering and a PCT of 720 F.
52
.51-5009856-00

I ICalIIm I -Ill IC -51-5009856-00
6.3 PSC 2-00 Analyses for the Three Oconee Units
FRA-ANP traditionally performs one set of LOCA analyses that bound the three Oconee units. The plants are very similar except for the RCP types. The ONS-2 and ONS-3 units have Bingham pumps and ONS-1 unit has Westinghouse pumps. This difference must be considered in the revised analyses with offsite power available because RCP operation is critical to the calculated consequences.
Duke Power requested that FRA-ANP perform the revised CFT line break transients for the Oconee units with a two-minute RCP trip time. The 2568 MWt SBLOCA analyses for these units can tolerate the delayed RCP trip because they have higher assured ECCS flows than those used in the TMI-1 or CR-3 analyses. The additional ECCS flow comes in the form of credit for operator actions to initiate flow from a second HPI pump at 10 minutes after ESAS in the 2568 MWt full power analyses. This additional ECCS flow refills the core sooner, thereby restricting the amount of core uncovering and limiting the overall PCT. The new full power CFT line break analyses for Oconee are discussed in Section 6.3.1, while revised large CLPD breaks are discussed in Section 6.3.3. The analyses used the key inputs given in Table 6-9.
FRA-ANP has also performed SBLOCA analyses for the Oconee units that support operation of the plant when one of the three required HPI pumps is out of service (Reference 20). The analyses determined that 77 percent (75% plus 2% heat balance error) of 2568 MWt is the maximum plant power level that can be licensed with an HPI pump unavailable. The partial power analyses, like the full power analyses, were completed with LOOP assumed on reactor trip. The CFT line break at 77 percent full power can credit ECCS flow from a single CFT and one HPI pump, similar to the TMI-1 and CR-3 analyses. Even though the core power was considerably lower than that used for these other two plants, reduction in the reactor vessel inventory from the twominute RCP operation lead to significant core uncovering with a PCT that exceeded the 2200 F acceptance criteria. Acceptable PCTs for the CFT line break with the M3modified head degradation multiplier and a one-minute RCP trip were obtained at 77 percent power. Nonetheless, Duke Power requested that new CFT analyses be performed to determine what core power level would produce acceptable PCTs with a two minute RCP trip. The new CFT line break analyses determined that 52 percent (50% plus 2% heat balance error) full power was acceptable as discussed in Section 6.3.2. Revised large CLPD SBLOCAs were reanalyzed at 77 percent full power with offsite power available discussed in Section 6.3.4. The analyses used the key inputs given in Table 6-10.
53
I:'r•mQf•m-- /"kid rnr.

A PdD I.,�. 51-5009856-00FIr IldLUilum ^Ir-, "L. 51........
Table 6-9. Oconee Key Inputs Table for 100 Percent Full Power Cases
A complete Analytical Input Summary for Oconee Units 1, 2, & 3 are contained in Reference 35. This table provides related and additional information related to the key parameters for the
nnn~lv•is of PSC 2-00.
Parameter Value Parameter Value RCS Conditions Core Flood Tank (CFT) Parameters
Core Power 102 % of 2568 MWt Max CFT Pressure 665 (psia)
RCP Type Westinghouse and Min CFT Pressure 565 Bingham Sensitivity Study (psia)
RCP Two-Phase RELAP5 Max CFT Volume 1085 Degradation Head (ft3 ltank)
Difference I RCP Two-Phase M3-Modified Min CFT Volume 975
Degradation Head (also referred to as M3) (ft3/tank) Multiplier RCP Trip 2 Min after LSCM
Fuel Type Emergency Core Cooling System (ECCS) Parameters
Fuel Type: HPI Flow from one Taken from Tables 3-8 SBLOCA results have Mark-BI I (Zr) pump from ESAS to through 3- 12 from been shown to fairly From original SBLOCA ESAS + 10 min. Reference 35
- independent of fuel analyses for Oconee 2 HPI pumps after design. ESAS + 10 min
Cladding Material Zircaloy Offsite Power Available ? Operator Actions
RCP Trip Offsite power is assumed RCP Trip RCPs are to be tripped available for operation of immediately following
the RCPs. LSCM. The analyses
Delays All equipment delays, etc, assumed the operators are maintained consistent tripped all RCPs at two
with the LOOP assumption minutes after LSCM. for conservatism.
Single Failure HPI Flow from 2nd The operators initiate pump second HPI pump by 10
CFT Line Break Vital electrical buss that minutes after ESAS disables one HPI pump, one LPI pump, plus other BWST- to- Sump Transfer suction from
key instrumentation Switchover BWST to RB sump and preserve indefinite
operation of the HPI
CLPD Break Vital electrical buss that pumps until the LPI lines
disables one HPI pump, can be cross-tied and
one LPI pump, plus other the required minimum
key instrumentation flow balance achieved or flow restored from a
I second LPI pump
54
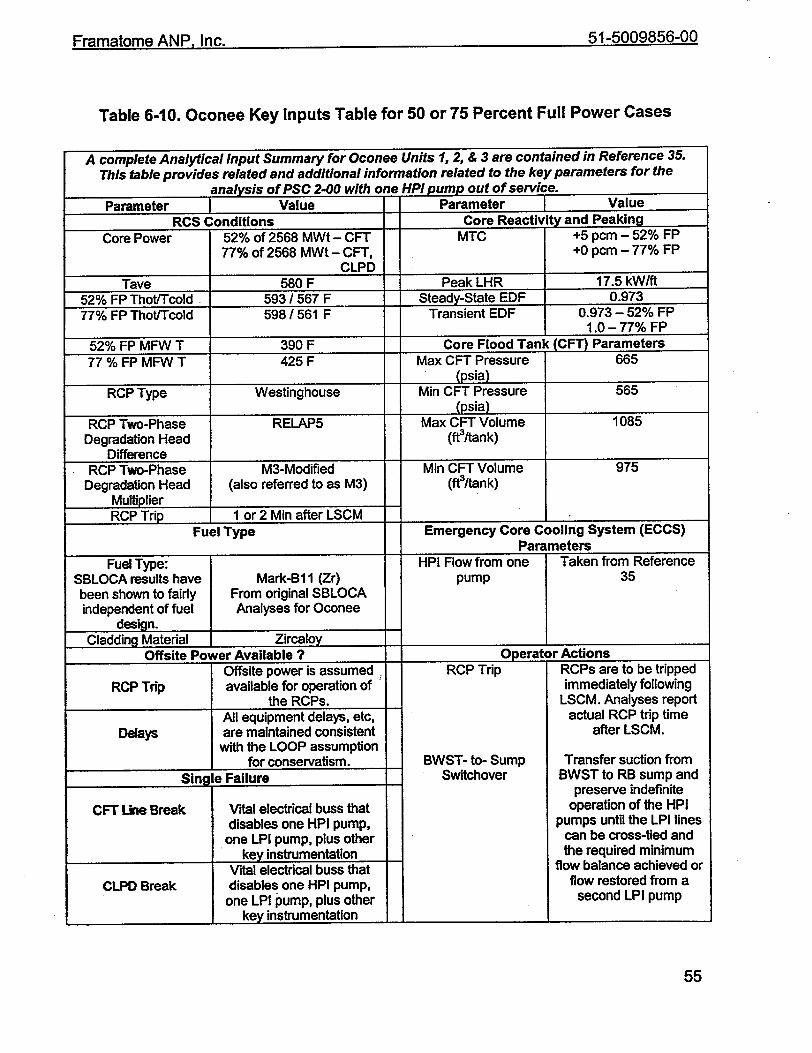
I =1 I lnr• I -tI 51-5009856-00
Table 6-10. Oconee Key Inputs Table for 50 or 75 Percent Full Power Cases
A complete Analytical Input Summary for Oconee Units 1, 2, & 3 are contained in Reference 35. This table provides related and additional information related to the key parameters for the
analvsis of PSC 2-00 with one HPI DumD out of service.
Parameter Value Parameter Value RCS Conditions Core Reactivity and Peaking
Core Power 52% of 2568 MWt - CFT MTC +5 pcm - 52% FP 77% of 2568 MWt - CFT, +0 pcm - 77% FP
CLPD Tave 580 F Peak LHR 17.5 kW/ft
52% FP Thot/Tcold 593 / 567 F Steady-State EDF 0.973 77% FP Thot/Tcold 598 /561 F Transient EDF 0.973 - 52% FP
1_ 1.0 - 77% FP 52% FP MFW T 390 F Core Flood Tank (CFT) Parameters 77 % FP MFW T 425 F Max CFT Pressure 665
(psia) RCP Type Westinghouse Min CFT Pressure 565
(psia) RCP Two-Phase RELAP5 Max CFT Volume 1085
Degradation Head (ft3/tank) Difference
RCP Two-Phase M3-Modified Min CFT Volume 975 Degradation Head (also referred to as M3) (ftP/tank)
Multiplier RCP Trip I or 2 Min after LSCM I
Fuel Type Emergency Core Cooling System (ECCS) Parameters
Fuel Type: HPI Flow from one Taken from Reference SBLOCA results have Mark-B1 1 (Zr) pump 35 been shown to fairly From original SBLOCA independent of fuel Analyses for Oconee
design. Cladding Material Zircaloy
Offsite Power Available ? Operator Actions Offsite power is assumed RCP Trip RCPs are to be tripped
RCP Trip available for operation of immediately following the RCPs. LSCM. Analyses report
All equipment delays, etc, actual RCP trip time Delays are maintained consistent after LSCM.
with the LOOP assumption for conservatism. BWST- to- Sump Transfer suction from
Single Failure Switchover BWST to RB sump and preserve indefinite
CFT Line Break Vital electrical buss that operation of the HPI disables one HPI pump, pumps until the LPI lines
one LPI pump, plus other can be cross-tied and key instrumentation the required minimum
Vital electrical buss that flow balance achieved or
CLPD Break disables one HPI pump, flow restored from a one LPI pump, plus other second LPI pump
key instrumentation
55

6.3.1 Oconee CFT Line Break from Full Power with Offsite Power Available
Two sensitivity studies were performed for the Oconee CFT line break transient with two-minute RCP trip and the M3-modified two-phase pump head degradation model. The first study investigated the variation in results with Bingham or Westinghouse RCP types. The second study evaluated the consequences using the limiting pump type with the four bounding combinations of CFT initial pressures and liquid inventories. All analyses used the void-dependent cross flow model in the core.
The first CFT line break pump-type study was performed with the minimum initial CFT pressure and maximum CFT liquid volume. Case 0-1, listed in Table 6-11, used Bingham pumps with a two-minute RCP trip and produced a PCT of 1105 F at 204 seconds. The Westinghouse pump curves, which were included in Case 0-5, produced a PCT of 1093 F at 213 seconds. The core uncovering in both cases began prior to the time that the intact CFT injection began and ended as the CFT flow refilled the core. The core remained covered and cooled for the duration of the transient because of the maximum CFT liquid inventory and the flow from a second HPI pump at ten minutes. This pump study was somewhat inconclusive because the Bingham pump case was only 12 F greater than the Westinghouse pumps result. Also, the minimum core mixture level after the intact CFT emptied was only marginally above the top of the core. Use of a lower CFT liquid volume could allow the core to uncover before the second HPI is initiated.
To confirm that the minimum CFT liquid inventory was not more limiting, Cases 0-2 and 0-3 were run with the Bingham and Westinghouse pump types, respectively. The Westinghouse pump Case 0-3 produced a higher PCT of 1346 F versus 1127 F for the Bingham pump Case 0-2. These cases had two separate and distinct periods of core uncovering, one prior to CFT discharge (150 to 210 seconds) and one that began at roughly 460 seconds. The overall PCT for these cases occurred after the flow from the second HPI pump was activated, since it was higher than the maximum local cladding temperature during the brief first heatup period. The study revealed that the Westinghouse pump produced a 219 F higher PCT. It was noted that the Bingham pump had the highest local maximum yalue during the first uncovering interval, although is was higher by less than 5 F.
Use of the maximum initial CFT volume precluded core uncovering after five minutes into the transient. The studies showed that the maximum CFT volume does maximize the cladding temperatures during the first uncovering period because it decreases the rate of CFT discharge that initially refills and quenches the core. Use of the minimum CFT pressure reduces the rate of core refill with CFT versus a case with the maximum pressure. Based on these considerations, the CFT parameters that maximize the temperatures during the first uncovering period are the maximum level and minumum pressure. The same conclusion does not apply for the cladding temperatures during the second core uncovering period. Therefore, another CFT line break sensitivity study was completed based on the Westinghouse pump Case 0-3. This case was added to ensure that the most limiting PCT was not underpredicted. The second period of core
56

Fram~atome ANP Inc~5-00860
uncovering is accentuated when the minimum CFT initial volume is used. This is supported by the results from Cases 0-5 and 0-3. It is not clear which CFT pressure will produce the highest cladding temperatures during the second core uncovering period. Therefore, Case 0-4 was analyzed with the maximum initial CFT pressure and minimum liquid volume. The PCT for this case was 1280 F, which was 66 F less than the case with the minimum initial pressure. With the completion of this case, it is clear that the highest PCT of 1346 F was produced with the two-minute Westinghouse RCP trip with the minimum CFT initial pressure and liquid volume.
These studies have shown that the pump type has little effect on the cladding temperature during the first uncovering period, although the Bingham pump was slightly higher (by a maximum of 12 F) for this non-limiting local maximum cladding temperature for Cases 0-1 and 0-5. Use of the Westinghouse pump parameters produced significantly higher cladding temperatures during the second core uncovering period, which also happens to produce the limiting PCT for this transient. Therefore, the Westinghouse pump should be used for future SBLOCA analyses with offsite power available. This conclusion is also supported by the fact that it produces the highest PCT result for all cases with a two-minute RCP trip and because there is little difference between the pump types during the uncovering period that occurs before the CFT(s) start to discharge.
6.3.2 Oconee CFT Line Break with one HPI Pump at Reduced Power Levels with Offsite Power Available
A CFT line break with a reduced power of 75 percent (plus 2 percent for a heat balance error) of 2568 MWt has been evaluated in Reference 20 with the consideration that offsite power is available with the minimum ECCS flow from one HPI pump. In a LOCA event without LOOP, the operators are instructed to manually trip the RCPs immediately after reaching the LSCM. Typically, this manual action is credited at 2 minutes after LSCM. Analyses of the CFT line break at 77 percent of 2568 MWt predicted unacceptable PCT consequences with the two-minute RCP trip (Case 0-9 in Table 6-11). A case with a one-minute RCP trip produced acceptable results at this power level, as shown in Case 0-10, and it had a maximum PCT of 715 F. This conclusion is similar to the results for TMI-1 and CR-3 that have a single HPI pump providing the only pumped injection core cooling flows.
Nonetheless, Duke Power requested that new CFT analyses be performed to determine what core power level would produce acceptable PCTs with a two minute RCP trip. A new initialization was performed at the reduced power level of 50 percent (plus 2 percent for a heat balance error) of 2568 MWt to ensure acceptable consequences were obtained with a two-minute RCP trip. The analyses used the void-dependent cross-flow model in the core and the M3-modified two-phase pump head degradation multiplier curve. The Westinghouse RCP type was modeled since Reference 12 determined this to be the limiting RCP type for the Oconee CFT line break transient with
57
51-5009856-00•
,•.,°•v,,.v • !.!, ! ... v.

51-5009856-00
delayed RCP trip. Analyses were performed with two sets of CFT initial conditions to be certain that the limiting PCT was obtained. The first case used the minimum initial
CFT pressure and maximum liquid volume to obtain the highest PCT prior to the intact CFT discharge. The PCT for this case, which was labeled 0-11, was 902 F at 186 seconds. Use of the maximum CFT initial volume precluded a second uncovering period for the full power CFT line break analyses. Another case was run with the
minimum initial CFT pressure and liquid volume to determine if there was a second core uncovering period at 52 percent full power. This combination of CFT parameters was responsible for maximizing the consequences after the intact CFT had discharged in the full power analyses. Case 0-13 showed that the PCT with minimum initial CFT volume and minimum CFT pressure was 767 F at 168 seconds. This PCT is lower than the PCT for Case 0-11 with the maximum level and minimum pressure.
Duke Power requested that this limiting CFT line break case at 52 percent power be reanalyzed with the fixed cross-flow methodology as specified in the EM (Reference 3), because written NRC concurrence on the void-dependent crossflow model has not yet been received. Technically, the new void-dependent cross-flow method is superior to the fixed cross-flow method, as it has the capability to follow the mixture level. Additionally, the new method maintains the EM-specified cross-flow resistance values in the pool and steam region, with the addition of a transition between a void fraction of 60 and 90 percent. The ability to follow the mixture level is especially important for the PSC 2-00 CFT line break transients, since they uncover a significant (3/4 or more) portion of the core region with very rapid changes in the core mixture level. This amount of core uncovering for a SBLOCA is significantly more than what was used in the demonstration cases for the fixed cross-flow method. Nonetheless, the low steam resistance model was used for the upper 16 control volumes with the fixed cross-flow case. This analysis, designated as Case 0-12 in Table 6-11, produced an overall PCT of 946 F at 190 seconds.
6.3.3 Oconee 0.75-, 0.5-, and 0.3 f 2 CLPD Break Cases at 100% FP with Offsite Power Available
Based on the results of the CFT line break sensitivity studies, the Westinghouse pump type was selected for use in the large CLPD SBLOCA delayed pump trip cases. These cases used the M3-modified two-phase pump head degradation model and the voiddependent core cross flow model to analyze the 0.3-, 0.5-, and 0.75-ft2 CLPD breaks with a two-minute RCP trip time.
The 0.3-f CLPD Case 0-6 in Table 6-11 was limiting when LOOP is postulated, but the other two cases were more limiting when manual RCP trip is postulated at two minutes. The 0.5-ft2 CLPD Case 0-7, with a two-minute RCP trip, had a PCT of 1147 F (216 F increase from the LOOP case) while the 0.75-ft2 CLPD Case 0-8 had a PCT of 994 F (9 F increase from the LOOP case). The conclusions from these studies are consistent with, and support, the historical perspective that the LOOP PCT will bound
58
i Ginl•# all- 51-5009856-00
cases that have RCP trip before the system void fraction exceeds 70 percent. The 0.3ft2 case had RCP trip when the system void fraction was roughly 66 percent. The 0.5and 0.75-ft2 cases had void fractions of 88 and 94 percent, respectively, when the pumps were tripped. These two cases would therefore be expected to be more severe than the LOOP case based on the system void fraction criteria. The original development of the restricted pump trip region (Reference 36) did not show these breaks to be limiting because the time to reach LPI was extrapolated to be at or before the system reached the 70 percent void fraction. This conclusion is not supported by the PSC 2-00 analyses. In fact, the 0.75-ft2 case had LPI initiation roughly 10 seconds after RCP trip. This small time delay before LPI flow was obtained was instrumental in limiting the magnitude of the PCT increase. The 0.5-ft2 case PCT increase was much larger because the LPI flow did not initiate until roughly one minute after the pump trip.
The three delayed RCP trip CLPD cases analyzed produce a local maximum PCT at 0.5 ft2. This local maximum is over 400 F hotter than the 0.3-ft2 CLPD break and 153 F higher than the 0.75-ft2 case. The magnitude of the PCT variations over this relatively large break area change suggest that additional investigation may be necessary to ensure that there is not a local maximum that is potentially higher than the 0.5-ft2 case. It is also important to recognize that the 0.5-ft2 two-minute RCP trip case reaches the 70 percent RCS void fraction at roughly 75 seconds, while the LPI flow begins at 180 seconds. For this break size, the RCP trip at 2-minutes falls near the middle of the region where the RCPs should not be tripped ( Figure 7-1). Perhaps this is the reason why the results are the most severe for this break size. By contrast, the 0.3-ft2 case had not yet reached the 70 percent void fraction when the RCPs were tripped. Therefore, this case should not have had core uncovering as verified by this analysis. The 0.75-ft2 case reached the 70 percent void fraction by 55 seconds, but LPI flow began by 130 seconds for this large SBLOCA. The timing of the two-minute RCP trip was very close to the time that the RCPs could be tripped with acceptable core cooling consequences. With this consideration, it is not totally clear that a break size closer to 0.5 fte would not predict an even higher PCT.
Additional insight was obtained by running two additional scoping studies in Reference 12 with CLPD break areas of 0.44 ftW and 0.55 ft2, for Cases 0-17 and 0-18, respectively. The PCT for the 0.44-ft2 CLPD break was 1105 F, which was slightly less than the PCT of 1147 F for the 0.5-ft2 break. The PCT for the 0.55-fte CLPD break was 1141 F, which was also slightly less than the PCT for the 0.5-ft2 break. These two cases confirm that there is not a CLPD break size with a two-minute RCP trip that will produce a significantly higher PCT than that analyzed for the 0.5-ft2 CLPD break. This may be true because this break size falls near the middle of the two criteria that describe the restricted RCP trip period (i.e. after the RCS reaches a 70% void fraction or before LPI flow to the core is assured).
The exitng PCTs for the full power two-HPI pump CLPD SBLOCA spectrum with LOOP are given in Reference 12 along with the PCTs that were formally calculated or estimated with the two-minute RCP trip cases. (Note: The offsite power available estimated PCTs have not been analyzed. The no-LOOP PCTs that were not analyzed
59

i--lOIlIl LIJIIl• r'll~i * III'.,•.. . .
are listed as less than the LOOP PCTs in Table 6-11. For illustrative purposes in
Figure 6-5, a constant reduction of 100 F from any LOOP case that had PCTs above
the initial cladding temperature was used. Although the validity of these engineering estimates is subjective, the direction of the change from the LOOP cases is based on
discussions in Section 6, and they are reasonable for the illustrations given in that figure.)
When the Oconee plants are operating at full power, all three HPI pumps are available. The 2568 MWt SBLOCA analyses model flow from one HPI pump initially, with credit
for operator actions to assure flow from a second HPI pump at 10 minutes after ESAS.
The limiting PCT for the CFT line break for these three units was 1346 F during the second core uncovering period with a two-minute RCP trip. The CLPD break spectrum PCTS for LOOP and offsite power available scenarios is shown in Table 6-12 and also on Figure 6-5. Although the PCTs increase significantly for some of these delayed RCP trip cases for Oconee, the limiting SBLOCA PCT remains at 1369 F for the 0.15 ft2
CLPD break with LOOP from the 100 percent power with two-HPI pumps operating.
6.3.4 Oconee CLPD Break Cases at 75% FP with Offsite Power Available
If Oconee has an HPI pump out of service, the core power was limited to 75 percent full power prior to PSC 2-00. In this condition, the CLPD breaks with LOOP were evaluated in Reference 20 with the consideration that the limiting single failure reduces the minimum ECCS flow to that from one HPI and one LPI pump and both CFTs. As a result of PSC 2-00, new CLPD breaks were analyzed in this condition with offsite power available. The 0.3-ft2 CLPD Case 0-14 in Table 6-11 was analyzed with the limiting assumption of LOOP. It confirmed that there was no core uncovering with a PCT of 715 F. The other two cases were analyed without LOOP, crediting a manual RCP trip at two minutes after LSCM. The 0.5-W CLPD Case 0-15, had a PCT of 1114 F, while the 0.75-fte CLPD Case 0-16 had a PCT of 846 F.
Although the two-minute RCP trip analyses were performed at 75 percent full power, the CFT line break maximum power level is 50 percent full power. These CLPD break PCTs are appropriate for 75 percent full power, but they are also bounding at 50 percent power because the ECCS flows are similar and the reduced core power level has a lower core boiloff rate. The LOOP and offsite power cases analyzed for one HPI pump out of service as a result of PSC 2-00 are shown in Table 6-13.
60
51-5009856-00C,-,.,,,,,*,t•,m*• A•ID f•,'-

I I n,•I�I l . .. "• .......-5009856-00 S*romnLA* S At~ P *II * S
Table 6-11. PSC 2-00 Analyses Performed for the Oconee 1, 2, and 3
(Westinghouse and Bin ham Pum s) RCP HPI Flow RCP
Type I fraction from LPI flow Two-Phase New RCP Break Area 1 HPI pump fraction Pump Analyzed Peak
PSC 2-00 Trip (ft2) into the RCS From 1 Degradation Power Clad Cases Time I If two LPI pump Model Level Temp.
after Break Type entries: into the Used in the (MWt) (F) Notes LSCM < 10 mini RCS Analysis
I (min) >10 min 0-1 B / 2.0 0.44/CFT 1.0/ 1.9 0.0 M3 1.02*2568 1105 CFT Min P, Max V 0-2 B /2.0 0.44/CFT 1.0/ 1.9 0.0 M3 1.02*2568 1127 CFT Min P, Min V 0-3 W / 2.0 0.44/CFT 1.0/ 1.9 0.0 M3 1.02*2568 1346 CFT Min P, Min V 0-4 W / 2.0 0.44/CFT 1.0/1.9 0.0 M3 1.02*2568 1280 CFT Max P, Min V 0-5 W / 2.0 0.44/CFT 1.0/ 1.9 0.0 M3 1.02*2568 1093 CFT Min P, Max V 0-6 W / 2.0 0.3/CLPD 0.4/1.3 1.0 M3 1.02*2568 715 No heatup, LOOP is limiting 0-7 W / 2.0 0.5/CLPD 0.4/1.3 1.0 M3 1.02*2568 1147 +216 F PCT over LOOP case 0-8 W / 2.0 0.75/CLPD 0.4 / 1.3 1.0 M3 1.02*2568 994 +9 F PCT over LOOP case 0-9 W / 2.0 0.44/CFT 1.0/1.0 0.0 M3 0.77*2568 >2200 CFT Min P, Min V 0-10 W / 1.0 0.44/CFT 1.0/1.0 0.0 M3 0.77*2568 715 CFT Min P, Min V 0-11 W / 2.0 0.44/CFT 1.0/ 1.0 0.0 M3 0.52*2568 902 CFT Min P, Max V 0-12 W / 2.0 0.44/CFT 1.0/ 1.0 0.0 M3 0.52*2568 946 CFT Min P, Max V (Fixed Crossflow) 0-13 W / 2.0 0.44/CFT 1.0/ 1.0 0.0 M3 0.52*2568 767 CFT Min P, Min V 0-14 W / 0.0 0.3/CLPD 0.4 / 0.4 1.0 M3 0.77*2568 715 No heatup for this LOOP case 0-15 W / 2.0 0.5/CLPD 0.4 / 0.4 1.0 M3 0.77*2568 1114 +183 F PCT over LOOP case 0-16 W / 2.0 0.75/CLPD 0.4 / 0.4 1.0 M3 0.77*2568 846 LOOP estimate is limiting 0-17 W / 2.0 0.44/CLPD 0.4 / 1.3 1.0 M3 1.02*2568 1105 Mini-CLPD spectrum case 0-18 W / 2.0 0.55/CLPD 0.4 / 1.3 1.0 M3 1.02*2568 1141 Mini-CLPD spectrum case
Note: The results of these cases were taken from Reference 12 for the 100 Percent FP cases, Reference 9 for the 75 % FP cases, and Reference 13 for the 50% FP cases. All cases used the void-dependent cross flow model except for case 0-12.
61

�r�m�*nma AMP Inr�= ,lA* * lU AKIIOl Ir.•n19i5 * | l* l0 *
Figure 6-5. PCT Comparisons for LOOP and no-LOOP SBLOCA Break Spectrum Cases for Oconee
0.2 0.4 0.6 0.8
Break Area, ft2
1 1.2 1.4 1.6
62
1500
1300
1100
IL
900
700
500
-------------------- ------------------ ýe------0 IP 0
I00
0000 : 0
0
I I- - of
I-. . .. - - --.- -
-8 CLPD PCTs with LOOP
"---CLPD PCTs for 2-Mm RCP Trip 0 OFT Line Break with LOOP
------ ~~~~~~ ~ ~ ~ ~ ~ O-- -- - - - - - -- - - - - - - - _ _ FT Line Break 2-Mmn Trip
--- Est. CLPD PCTs with LOOP -Est. CLPD PCTs for 2-min RCP Trip
0 E CLPD Mini-Spectrum
*II I I
I I I I
0
R1-RRR•RRR-•O

51-5009856-00
Table 6-12. Oconee SBLOCA PCTs Versus Break Size at 100% FP.
CLPD Break Size SBLOCA LOOP SBLOCA 2-Min RCP Ft2 PCT, Trip PCT,
F F 1.5 1400 (est)' <1400L
0.75 985 994 6
0.5 931 11473 0.3 1141 7156 0.2 1275 <1275
0.175 1322 <1322L 0.15 1369 <1369
0.125 1362 <13627 0.1 1339 <1339L 0.07 715 715' 0.04 715 715 2
0.01 715 7157
HPI Line 0.024 715 715 CFT Line 0.44 715 1346 6
Notes: 1. The PCT for this transition size LBLOCA case was estimated using the BWNT
LOCA EM (Reference 3) Figure A-185 in Volume 1. 2. These temperatures were not calculated explicitly. They are listed as less than the
LOOP PCT for the cases with core uncovering. For illustrative purposes in Figure
6-5 the two-minute RCP trip PCTs were estimated as 100 F less than the
corresponding LOOP PCT (Reference 12) for those cases with core uncovering and PCTs more than 100 F above the steady state cladding temperature.
3. These cases used the void-dependent core cross-flow model.
63
F 1 C11 I ICILUI I IV P% , i It'. 51-5009856-00 in I•',-^.•^•-^,-•,^ ^ kid I,-•^

Framatome ANP Inc 51-500856-0
Table 6-13. Oconee SBLOCA PCTs versus Break Size with One-HPI Pump
CLPD Break Size SBLOCA LOOP PCT, SBLOCA 2-Min RCP Power Ft2 F Trip PCT, F %FP
0.75 <985 ' 846 Z,4 77% 0.5 <931 1 1114 Z, 4 77% 0.3 715 Z,4 715 77% 0.2 1224 ' <1224 77% 0.1 1619 ' <1619 77% 0.08 1696 ' <1696 77%
0.075 1761 ' <1761 77% 0.07 1862 ' <1862 77%
0.065 1669 ' <1669 77% 0.04 715 ' 715 77% 0.01 715 ' 715 77%
HPI Line 0.2463 715 ' 715 77% CFT Line 0.44 715 ' 902 4 52% CFT Line 0.44 715 ' 946 52% CFT Line 0.44 715 ' >2200 = 77%
Notes:
1. These PCTs were listed as less than the 100% power LOOP PCTs listed in Table 6-12.
2. These two-minute RCP trip PCTs were calculated in Reference 9 3. These LOOP PCTs were calculated or evaluated in Reference 20. 4. This PCT was calculated with the void-dependent core cross-flow model in
Reference 13. 5. The two-minute RCP trip case in Reference 9 exceeded the acceptance criteria, but
a one-minute RCP trip had no core uncovering.
64
5 1 -5009856-00
A MD ir�r. 51-5009856-00
6.4 PSC 2-00 Analyses for ANO-1
The ANO-1 plant SBLOCA analyses with RELAP5/MOD2 were initially performed as a part of the BWOG 20 percent steam generator tube plugging project at an uprated core power of 2772 MWt, even though the licensed core power is 2568 MWt. The ANO-1 LPI system is different from that of the other B&W plants in that it has the LPI crossconnect line open, and the cavitiating venturis in the individual LPI lines passively balance LPI flow to both CFT nozzles. This configuration assures that some LPI flow is obtained even for a CFT line break with only one LPI pump in operation as given in
Reference 17. The assurance of some LPI flow reaching the core for the CFT line break transient allows this plant to produce an acceptable PCT with the two-minute RCP trip time when offsite power is available. This LPI flow is in addition to the HPI flow. When these two pumped injection flows are combined, they ensure that there is continuous abundant ECCS flow to the core after the RCS depressurizes below the pressure where some LPI enters the reactor vessel.
Even though ANO-1 can credit some significant fraction of LPI flow reaching the core during the CFT line break, the consequences of this break with a two-minute RCP trip will be more severe than the analyzed event with LOOP at reactor trip. Therefore, a new CFT line break was analyzed and discussed in Section 6.4.1. The larger CLPD breaks are discussed in Section 6.4.2. These new analyses with offsite power available were completed with the key inputs given in Table 6-14.
65
F 1 C11 I ICILUI I JU , 11%0. 51-5009856-00 A KIM F

FramatomeA AP Inc~5-00860
Table 6-14. ANO-1 Key Inputs Table
A complete Analytical Input Summary forANO-1 is contained in Reference 23 and 24. This table provides related and additional information related to the key parameters for the
analysis of PSC 2-00. Parameter Value Parameter Value
RCS Conditions Core Flood Tank (CFT) Parameters Core Power 102% of 2772 MWt Max CFT Pressure 655
(psia) RCP Type Byron-Jackson Min CFT Pressure 575
(psia) RCP Two-Phase RELAP5 Max CFT Volume 1110
Degradation Head (ft3/tank) Difference
RCP Two-Phase M3-Modified Min CFT Volume 970 Degradation Head (also referred to as M3) (ft3/tank)
Multiplier RCP Trip 2 Min after LSCM,
estimated at the time of turbine stop valve closure
Fuel Type Emergency Core Cooling System (ECCS) Parameters
Fuel Type: HPi Flow from one Taken from Reference SBLOCA results have Mark-B9 pump plus LPI flow 26 been shown to fairly independent of fuel
design. Cladding Material Zircaloy Operator Actions
Offsite Power Available ? RCP Trip RCPs are to be tripped RCP Trip Offsite power is assumed immediately following
available for operation of LSCM. the RCPs. The analyses with
Delays All equipment delays, etc, delayed RCP trip are maintained consistent assumed the operators
with the LOOP assumption tripped all RCPs at twofor conservatism. minutes after LSCM.
Single Failure CFT Line Break Vital electrical buss that BWST- to- Sump Transfer suction from
disables one HPI pump, Switchover BWST to RB sump and one LPI pump, plus other preserve indefinite
key instrumentation * operation of the HPI
CLPD Break EDG or vital buss that pumps until the required disables one HPI pump, minimum flow balance
one LPI pump, plus other per line is achieved or key instrumentation * flow restored from a
second LPI pump • When offsite power is available, a passive failure of a vital emergency buss has to occur to disable one
HPI and one LPI pump. Entergy has determined that this passive failure need not be assumed for LOCA applications. FRA-ANP analyzed the CFT line break with this passive buss failure to assure that ANO-1 is in compliance With 10 CFR 50.46. The PSC 2-00 PCTs calculated for ANO-1 with the buss failure (and cross-tied LPI) are identical to those for the CFT line or CLPD pipe SBLOCAs for a single failure that disables flow from one HPI pump. Therefore, the CLPD and CFT line break PCT results are appropriate independent of whether or not a passive buss failure is assumed.
66
51-5009856-00

6-4-1 ANO-1 COFT Line Break Cases with Offsite Power Available
The PSC 2-00 ANO-1 plant analyses were performed in Reference 26 using the ByronJackson pump performance curves with the limiting M3-modified head degradation curve. Because this unit can credit LPI flow after the intact CFT empties, there will not be any core uncovering in the long term. The only core uncovering will be prior to the intact CFT refilling the core. The maximum PCT will be realized for this uncovering peiod when the maximum initial CFT liquid level and minimum pressure are used. This combination of inputs will delay the refill the longest and minimize the injection rate after low begins. When the CFT line break was performed with these boundary conditions from an initial core power of 2772 MWt, the PCT of 1051 F was obtained at 210 seconds. This PCT for this case, Case A-I in Table 6-15, is 336 F higher than the CFT line break break with LOOP from Reference 22.
6.4.2 ANO-I 0.75-, 0.5-, and 0.3 ft2 CLPD Break Cases with Offsite Power Available
The larger CLPD breaks were also analyzed at an uprated core power of 2772 MWt using the Byron Jackson pumps and the M3-modified head degradation curve. The inifial CFT parameters modeled in the CFT line break are limiting for these breaks as well. Case A-2, an 0.3-ft2 CLPD break listed in Table 6-15, had no core uncovering. The PCT of 720 F was the steady-state cladding temperature for this case with a twominute RCP trip. The 0.5- and 0.75-ft2 CLPD breaks had PCTs of 1068 F and 888 F for Cases A-3 and A-4, respectively. These PCTs were 223 and 28 F higher, respectively, than the PCTs produced by the same break size with LOOP.
Although the PCTs increase significantly for some of these offsite power available cases, the limiting SBLOCA PCT for ANO-1 remains at 1311 F for the 0.15 ft2 CLPD break at 2568 MWt from Reference 24. This case was from a mini-spectrum of SBLOCAs that were analyzed at the current licensed core power level and current CFT technical specification ULmits to preclude ;the possibility of cladding rupture for any SBLOCA at ANO-1.
The PCTs for the spectrum of SBLOCAs is shown in Table 6-16 for ANO-1. The major change in the analyses of record for the RELAP5/MOD2 ANO-1 analyses is credit for use of the LPI cross-tie line to assure that some LPI flow reaches the core during the CFT line break.
67
.91-5009856-00

51-5009856-00
Note: The results of these cases were taken from Reference 26.
68
Framatome AN-, Inc. .
Table 6-15. PSC 2-00 Analyses Performed with Byron Jackson Pumps for ANO-1.
HPI Flow fraction from RCP Analyzed
RCP Break Area 1 HPI pump LPI flow Two-Phase Power Peak
New Trip (ft2) into the RCS fraction Pump Level Clad
PSC 2-00 Time I From 1 LPI Degradation Was Temp.
Cases after Break Type If two pump into Model 102% of (F) Notes
LSCM entries: the RCS Used in the (MWt)
(min) < 10 min/ Analysis >10 min
Pressure
A-1 2 0.44 CFT I Dependent: M3 2772 1051 CFT Min V, Min P 0.0 to 0.5
A-2 2 0.30 CLPD 0.7 1 M3 2772 720 No heatup, LOOP is limiting
A-3 2 0.50 CLPD 0.7 1 M3 2772 1068 +223 F PCT over LOOP case
A-4 2 0.75 CLPD 0.7 1 M3 2772 888 +28 F PCT over LOOP case

Prnmi~tnma A P Inn~5 5Q95-O
Table 6-16. ANO-1 SBLOCA PCTs Versus Break Size.
CLPD Break Size SBLOCA LOOP PCT, SBLOCA 2-Min RCP ft2 F Trip PCT, F
0.75 860 * 888* 0.5 845 * 1068* 0.3 790 720* 0.2 935 <935 0.18 1301 <1301 0.15 1311 <1311 0.12 1092 <1092 0.1 1087 <1087 0.08 719 719 0.04 719 1 719 0.01 719 * 719*
HPI Line 0.02463 1299 * z <1299 *
CFT Line 0.44 715 * 1051 *
Notes: Analyses marked with an * were performed or evaluated at 2772 MWt, the others were performed at 2568 MWt.
1. These cases were not explicitly run at a core power level of 2568 MWt because no core heat up was expeceted. Heat up would occur at 2772 MWt for this break size.
2. This is the PCT for no manual ESAS.
69
51-5009856-00

I IfmIICAt, --1 n 51-5009... -0.
6.5 PSC 2-00 Analyses for DB-1
The DB-1 plant SBLOCA analyses with RELAP5/MOD2 were performed at an uprated core power of 2966 MWt even though the current licensed core power is 2772 MWt. The DB-1 plant is a raised-loop plant with two high-volume, low-head, HPI pumps that each have an equivalent flow capacity of two of the lowered-loop HPI pumps at lower RCS pressures. The flow from one HPI pump limits the core uncovering to only the first period, which allows this unit to produce acceptable PCTs with a two-minute RCP trip time when offsite power is available.
Even though DB-1 has higher HPI flows than the other units, PSC 2-00 will still affect the core cooling consequences for the CFT line break with two-minute RCP trip. These PCT consequences for the CFT line break are analyzed and discussed in Section 6.5.1. The larger CLPD breaks are discussed in Section 6.5.2. These new analyses with offsite power available will be completed with the key inputs given in Table 6-17.
70
51-5009856-00

rs. AI.ID I..... 51-5009856-00
Table 6-17. DB-1 Key Inputs Table
A complete Analytical Input Summary for Davis Besse Unit I are contained in Reference 28.
This table provides related and additional information related to the key parameters for the analysis of PSC 2-00.
.I [ .IIýI d
RCS Conditions Core Flood Tank (CFT) Parameters
Core Power 102 % of 2966 MWt Max CFT Pressure 648 (psia)
RCP Type Byron Jackson Min CFT Pressure 582 (psia)
RCP Two-Phase RELAP5 Max CFT Volume 1080
Degradation Head (ft3/tank)
Difference RCP Two-Phase M3-Modified Min CFT Volume 1000
Degradation Head (also referred to as M3) (ft3/tank)
Multiplier RCP Trip 2 Min after LSCM,
estimated at the time of turbine stop valve closure
Fuel Type Emergency Core Cooling System (ECCS) Parameters
Fuel Type: HPI Flow from one Reference 27
SBLOCA results have Mark-B10K pump The head flow pressure
been shown to fairly was reduced by 3.5%
independent of fuel from the Reference 8
design. values.
Cladding Material M5 Offsite Power Available ? Operator Actions
RCP Trip Offsite power is assumed RCP Trip RCPs are to be tripped
available for operation of immediately following
the RCPs. LSCM.
Delays All equipment delays, etc, The analyses with
are maintained consistent delayed RCP trip
with the LOOP assumption assumed the operators
for conservatism, tripped all RCPs at two
Single Failure minutes after LSCM.
CFT Line Break Vital electrical buss that disables one HPI pump, BWST- to- Sump Transfer suction from
one LPI pump, plus other Switchover BWST to RB sump and
key instrumentation preserve indefinite
CLPD Break EDG or vital buss that operation of the HPI
disables one HPI pump, pumps until the LPI lines
one LPI pump, plus other can be cross-tied and
key instrumentation the required minimum flow balance achieved or
flow restored from a second LPI pump
71
P-arameterW-1"&
Frrna~d Tume•)l •II~ A I r-1" . -. .
51-5009856-00
6.5.1 DB-1 CFT Line Break Cases with Offsite Power Available
The PSC 2-00 DB-1 plant analyses were performed in Reference 27 using the ByronJackson pump performance curves with the limiting M3-modified head degradation curve. Because of the high flow rates from low head HPI at low RCS pressures, there will not be any core uncovering in the long term. The only core uncovering will be prior
to the time that the intact CFT refills the core. The maximum PCT will be realized for
this uncovering period when the maximum initial CFT liquid level and minimum
pressure are used. This combination of inputs delays the refill by minimizing the
injection rate. When the CFT line break was performed with these boundary conditions from an initial core power of 2966 MWt, the PCT of 962 F was obtained at 195 seconds. This PCT for this analysis, which is listed as Case D-3 in Table 6-18, is 247 F higher than the CFT line break with LOOP from Reference 8.
As additional confirmation that these results were limiting and there was no uncovering during the long term because of uprated power, the other three potentially limiting initial CFT pressure and volume conditions were analyzed by Cases D-1, D-2, and D-3. The PCTs were all lower than 962 F value produced when the minimum initial CFT pressure and maximum volume was used, confirming that the limiting combination of inputs had been evaluated.
6.5.2 DB-1 0.75-, 0.5-, and 0.3 ft2 CLPD Break Cases with Offsite Power Available
The larger CLPD breaks were also analyzed at an uprated core power of 2966 MWt using the Byron Jackson pumps and the M3-modified head degradation curve. The initial CFT parameters used for the CFT line break are limiting for these breaks as well. Case D-5 was an 0.30-ft2 CLPD case listed in Table 6-18 that had no core uncovering with a two-minute RCP trip. The PCT of 715 F was set by the steady-state initial cladding temperature for this case. The 0.5- and 0.75-ft2 CLPD breaks had PCTs of 1039 F and 945 F for Cases D-6 and D-7, respectively. These PCTs were 324 and 230 F higher, respectively, than the PCTs produced by the same break size with LOOP. Although the PCTs increase significantly for some of these offsite power available cases, the limiting SBLOCA PCT for DB-1 remains at 1428 F for the 0.02463 ft2 HPI line break with the 1.5 percent reduction in the pressure of the HPI pump head-flow curve from Reference 19. The PCTs for the SBLOCA spectrum are given in Table 6-19 for both the LOOP and two-minute RCP trip cases.
72
C-l ll'~Llli -4- l AKIO Illb -. . .

_ran1 nIII AIJPln Inn-500.. .....
Table 6-18 PSC 2-00 Analyses Performed with Byron Jackson Pumps for DB-1,
HPI Flow fraction from RCP Analyzed
RCP Break Area 1 HPI pump LPI flow Two-Phase Power Peak New Trip (ft2) into the RCS fraction Pump Level Clad
PSC 2-00 Time I From 1 LPI Degradation Was Temp. Cases after Break Type If two pump into Model 102% of (F) Notes
LSCM entries: the RCS Used in the (MWt) (min) < 10 min/ Analysis
>10 min D-1 2 0.44 CFT 1 0 M3 2966 864 CFT Min V/Min P D-2 2 0.44 CFT 1 0 M3 2966 811 CFT Min V/Max P D-3 2 0.44 CFT 1 0 M3 2966 962 CFT Max V/Min P D-4 2 0.44 CFT 1 0 M3 2966 913 CFT Max V/Max P D-5 2 0.30 CLPD 0.49 1 M3 2966 715 • Similar to LOOP case, has little heatup D-6 2 0.50 CLPD 0.49 1 M3 2966 1039 +324 F PCT over LOOP case D-7 2 0.75 CLPD 0.49 1 M3 12966 945 +230 F PCT over LOOP case
Note: The results of these cases were taken from Reference 27.
73
oil-50098.58-00

- - *_ aII gIP I_ !�1 -�OO9856-00F-ramatome A P, Inc. -5009856-00
Table 6-19. DB-1 SBLOCA PCTs Versus Break Size.
CLPD Break Size SBLOCA LOOP PCT, SBLOCA 2-Min RCP ft2 F Trip PCT, F
0.75 715 945 0.5 715 1039
0.3 715 715j 0.1 715 715
0.09 715 715 0.07 715 715 0.05 1140 '<1140
0.04 1173 1<1173 0.03 1365 1 <1365
0.025 1302 1 <1302 0.01 715 715
HPI LINE 0.02463 1428 ' <1428
HPI LINE 0.02 1151 1 <1151
CFT Line 0.44 715 962 •
Notes: The PCTs for the LOOP analyses were contained in Reference 8. The
smaller two-minute RCP trip cases that were not analyzed were listed as less than the
LOOP PCT for cases with uncovering based on the discussion in Section 6.
t. These temperatures were the PCTs from Reference 8 with 20 F added to account
for the 1.5 percent HPI head reduction in Reference 19.
2. This PCT was calculated in Reference 19.
3. The two-minute RCP trip cases with core uncovering were analyzed in Reference
27 with the void-dependent cross-flow model.
74
7. Reevaluation of the Manual Pump Trip Guidance
PSC 2-00 was initiated by FRA-ANP on July 28, 2000. It identified that the calculated consequences for a postulated CFT line break for the B&W-designed plants could be more severe if offsite power were available, and the operators tripped the RCPs at two minutes after the LSCM. Based on the analyses and sensitivity studies performed, it is prudent to review and redefine, if necessary, the criteria that set the restricted pump trip region.
The leading edge of the restricted RCP trip region was based previously on when the RCS system void fraction reached roughly 70 percent. Based on the new RELAP5/MOD2 analyses this original criteria value appears to be when the core would uncover versus when unacceptable core cooling consequences will be predicted. Every B&W-designed plant now has some degree of core uncovering for some portion of the SBLOCA spectrum. Therefore core uncovering is not necessarily restricted, although the consequences can change rapidly for the larger SBLOCAs (as noted in the CFT line break case with a one-minute versus a two-minute RCP trip). It may be prudent to retain some margin to the unacceptable results. The operator guidance to trip the RCPs immediately upon LSCM was and still is the best guidance, however, the maximum trip time (which has historically been two minutes) needs to be revised for some plants to one minute considering current ECCS configurations and flow capacities.
The new CLPD PSC 2-00 analyses performed with RELAP5/MOD2 have given additional information to help define the leading edge as the points in time when the RCS reaches 70 percent void fraction as a function of break size. The new data is listed in Table 7-1 and shown graphically in Figure 7-1 for break sizes greater than or equal to 0.3 ft2 . The smaller break sizes were taken from some of the original CRAFT2 studies to complete the figure.
The trailing edge of the restricted region has been defined as the time that the RCS pressure decreases to the LPI injection pressures. The new RELAP5/MOD2 analyses have given some additional information to help define the time that significant LPI flow is obtained. This new data is also listed in Table 7-1 and shown graphically in Figure 7-1 for break sizes greater than or equal to 0.3 ft2 . The data for smaller break sizes were taken from analyses used to define the long-term RCS pressure for BWOG boron precipitation analyses (References 31 and 32) rather than the original CRAFT2 values (Reference 30). The original estimates were in some cases extrapolated from short analyses that may have used full ECCS and EFW flow rates. Higher ECCS and EFW flow rates maximize the RCS cooling and shorten the time to obtain LPI flow. One thing that must be emphasized, however, is that if the operators missed the initial trip at one or two minutes after LSCM, the next opportunity to trip the RCPs must be associated with assured high ECCS flow to the core. The high flow rates are obtained via some significant LPI flow to the core. Having assured LPI flow to the core necessitates LPI flowing to both CFT nozzles. If only one LPI pump is available, then
75

A MD f,�. R1-5009856-00
the LPI cross-tie line, if available, should be opened with flows balanced between the two lines before the RCPs are tripped following unsuccessful RCP trip in the LSCM trip window. If the LPI is not flowing to both lines for the CFT line break, and there is only one HPI pump available (for the LL plants), then unacceptable PCTs may occur if the RCPs are not tripped before the 70 percent trip time. Figure 7-2 reflects the unacceptable trip region for the CFT line break with one HPI pump and no LPI cross
tie. (Note: The time to obtain significant LPI flow is significantly longer than the times given from the CRAFT2 studies. If any units are using a time-based criterion to envelop the original CRAFT2-based time, it is prudent to revise this guidance to tie it to the available ECCS flow assured to reach the core and not an analytically determined value.)
New insight has also been gained for the larger break sizes that depressurize rapidly, initiating CFT discharge and achieving LPI flow. The high ECCS flows have sufficient condensation potential to actually negate the pump head and defeat its potential to circulate two-phase fluid throughout the RCS. The condensation significantly decreases the steam velocities in the downcomer and core that are vital to maintaining homogenous two-phase circulation within the RCS. At low RCS void fractions, the pump head degradation is minimal and the two-phase circulation is assured. However, at high void fractions it is likely that the liquid and steam phases will separate in the vessel and effectively cause the RCS circulation to stagnate. Therefore, RCP operation for the larger break sizes will be effectively negated even though the RCPs are in operation. If this occurs when the RCS conditions are within the restricted RCP trip window, then core uncovering can occur, with PCTs higher than those predicted with LOOP on reactor trip.
There is little new information for guidance on RCP operation within the restricted region due to an unsuccessful manual RCP trip immediately after LSCM. There was no need to evaluate this guidance because the operators appropriately complete their assignment on a timely basis and this is reflected in the SBLOCA applications assumptions. It does appear that if the trip is unsuccessful, the contingency actions could be refined to allow additional time after LSCM to complete the trip. Two possibilities that would allow additional time is if 1) both ECCS trains are in service and operating properly or 2) the RCS remained high in pressure, indicating a smaller size break. This added detail during the first minute of a transient could complicate the time-critical trip guidance for the larger break sizes and actually increase the "likelihood that the operator would miss the RCP trip window.
If the RCP trip immediately after LSCM is unsuccessful, it is prudent to maximize the rate of RCS cooldown via steam generator cooling. This is especially true as the RCS pressure approaches the OFT injection pressure, because a rapid CFT dump will refill the core more rapidly if RCS circulation is lost. Under these conditions it is very important that the cooldown be continued to the extent possible below the LPI injection pressure. Once on LPI flow, the emphasis should be placed on initiating LPI flow to both CFT nozzles to assure that some LPI flow is available for core cooling if the break is in the CFT line. The HPI flow is generally close to matching the core
76
rlililillUI~tl /•l~lrIiiil5.09........

Framatome ANP, Inc. 51-5009856-00
decay heat, so any LPI flow achieved will rapidly refill the core and assure meeting the abundant core-cooling criterion.
77

51-5009856-00
Table 7-1. Analytical Points Used to Define the Restricted RCP Trip Region
Break Leading Edge- Trailing Edge- References
Area Approximate Time for Approximate Time for the 70% 1 LPI
ft2 the RCS Void Fraction RCS to Depressurize and to Reach 70% Allow Significant LPI Flow
(Seconds) (Seconds)
1 40 (approx) 72 21/21
0.75 52 130 5_/_5
0.5 75 190 5_/_5
0.45 63(est) 210 (est) Estimated
0.44 85 220 5/5
0.43 87(est) 230 (est) Estimated 0.3 135 350 5/5
0.2 180 • 1500 (est) 30 / 31,32
0.1 350 10000 (est) 30 /31,32
0.075 450Q 21600 (est)4 30/31,32
0.05 875 ' 100000 (est) z 30/31,32
0.02463 2200 • >100000 (est) z 30/31,32
<0.02462 100000 (est >100000 (est) z Estimated
Notes: 1. The time listed is for CLPD breaks or CFT line breaks with balanced LPI flows to both CFT nozzles.
If the LPI is not flowing to both lines for the CFT line break, and there is only one HPI pump available (for lowered-loop plants), then unacceptable PCTs may occur if the RCPs are not tripped before the 70 percent trip time. If the plant LPI flow cannot be provided to both CFT nozzles for a CFT line break then the only acceptable core cooling alternative is immediate RCP trip. Figure 7-2 shows the unacceptable trip region for the CFT line break with one HPI pump and no LPI cross-tie.
2. The time to reach significant LPI flow for the smaller break sizes is based on subjective comparisons to long-term pressure-temperature simulations with simple thermal-hydraulic models that use Appendix K assumptions. Variations in core power decay heat levels, EFW flow rates, HPI flow rates, system heat losses, operator actions to depressurize the OTSGs, break locations, etc. can considerably reduce these times. The exactness of the figure for these break sizes is not the critical element. What is critical is an understanding that the RCPs should be tripped immediately following LSCM. If for some unknown reason the trip is missed, at least two RCPs (one in each loop) should be kept in operation until substantial LPI flow to both lines is achieved.
3. The 70 percent void fraction was reached at 875 seconds for the 0.05-ft2 case with I HPI pump and at 1100 seconds with 2 HPI pumps (Ref. 30 pg 160). The other break sizes did not have I HPI pump analyses so estimated times were needed. The 0.1-ft2 case with 2 HPI pumps reached 70 percent at 400 seconds (Ref. 30 pg 157) and it was estimated that if one HPI pump was available, the time would decrease to 350 seconds. The 0.075 ft2 case with one HPI pump was estimated by subtracting 175 seconds from the 2 HPI pump time of 625 seconds to obtain a value of 450 seconds. The 0.02463-fte case was estimated as roughly double the 0.05 ft2 case with 1 HPI pump or 2200 seconds. No time shift was applied to the 0.2-fte case.
78
i-ramaitol merll~ /-NV, IMI1.---'r-_____l,___^ ^ l•lI:• I,-.^

Framatome ANP. Inc. 51-5009856-00
Figure 7-1. PSC 2-00 Restricted Region for CLPD Breaks (also CFT Line Breaks with LPI Crosstie or 2 HPIs)
T* T U S
0.9o.............. .. ......... -. .....--.
---- RELAP5/Estimated LPI 0.8 ........... j... ............. ---- '-70% RELAP5/Estimate
�-- - 'Two-Minute Trip 0.7 ......... . ..... ...........
I -- A- 'One-Minute Trip 0. ................ ..-- -------------- ..................... -------.... ......... 0.4 . . ..... .. ... ...... ..... .... ------ '-.''''". .
I.. a. ................ . ..." ".;. ,
" .... .... .... .... .... ..... ................... o,.--------------
e I S• S
U , U , 0.1 Re..... ... ...... 0. -- - - - - I . 4- -- - Restiote ,
I * I
0e
10 100 1000 10000 100000
Time after LSCM, sec
79

M AoflQR�R-OOFI CalI Ir 2•-11 RsctRgofrL B ( F
Figure 7-2. PSC 2-00 Restricted Region for CLPD Breaks (also CFT Line Breaks with No LPI Crosstle and 1 HPI)
II
1
0.9
0.8
0.7
0.6
0.5
0.4
0.3
0.2
0.1
0-
. .
t I I
-- n,-RELAP5/Estimated LPI ........... ---- 70% RELAP5/Estimate
-,-11- ,Two-Minute Trip
-- -A- - One-Minute Trip ..... ..........................................
. .
- - - - - -
£ *I ... .. .. .. .. ... .. .i
- Ue -~I e
I *|
.. .. .. .. .. .. . .. ."
S.............. I . .i
S...............l " | .. -|
I * I '. I oe
100
S..I
. . e I
* I
* I
* I
. . e e
RCP Trip ;• ,=.
Region ' .l.. .............. ............ ......... ......
' I -.. . . .d'i I , I I
1000
Time after LSCM, sec
10000
U
100000
U
I
I
II
I
_I
II
10
80
I
rA -5009A56-00