ffh-^on sip' PK K -^^^ IIT RESEARCH INSTITUTE · ffh-^on sip' PK K -^^^ IIT RESEARCH INSTITUTE 10...
164
ffh-^on sip' PK K -^^^ IIT RESEARCH INSTITUTE 10 West 35th Street Chicago, Illinois 60616 > FIRE HAZARDS FROM COMBUSTIBLE AMMUNITION. METHODOLOGY DEVELOPMENT (PHASE I) Final Report — Project J6480 Contract MDA903-79-C-0327 Contract Expiration Date: 5/31/80 by R. Pape Project Coordinator IIT Research Institute (312) 567-4786 T. E. Waterman A. N. Takata for Department of Defense Explosives Safety Board DDESB-KT Alexandria, Virginia 22331 June 1980
Transcript of ffh-^on sip' PK K -^^^ IIT RESEARCH INSTITUTE · ffh-^on sip' PK K -^^^ IIT RESEARCH INSTITUTE 10...

ffh-^on sip' PK K -^^^
IIT RESEARCH INSTITUTE 10 West 35th Street
Chicago, Illinois 60616
>■■
FIRE HAZARDS FROM COMBUSTIBLE AMMUNITION. METHODOLOGY DEVELOPMENT (PHASE I)
Final Report — Project J6480 Contract MDA903-79-C-0327
Contract Expiration Date: 5/31/80
by
R. Pape Project Coordinator
IIT Research Institute (312) 567-4786
T. E. Waterman A. N. Takata
for
Department of Defense Explosives Safety Board DDESB-KT
Alexandria, Virginia 22331
June 1980

UNCLASSIFIED SECURITY CLASSIFICATION Of THIS PAGE 'When Dala Enlerrd)
REPORT DOCUMENTATION PAGE KF.AD INSTRUCTIONS BEFORE COMPLETING FORM
1. REPORT NUMBER 2. GOVT ACCESSION NO- 3 RECIPIENT'S CAT ALOG NUMBER
4. TITLE (and Subtitle)
FIRE HAZARDS FROM COMBUSTIBLE AMMUNITION, METHODOLOGY DEVELOPMENT (PHASE I)
5. TYPE OF REPORT a PERIOD COVERED
Final Report
6. PERFORMING ORG. REPORT NUMBER
J6480 7. AUTHORfs;
R. Pape T. E. Waterman A. N. Takata
8. CONTRACT OR GRANT NUMBERfs)
MDA903-79-C-0327
9. PERFORMING ORGANIZATION NAME AND ADDRESS
IIT Research Institute 10 West 35th Street Chicago, Illinois 60616
10. PROGRAM ELEMENT, PROJECT. TASK AREA & WORK UNIT NUMBERS
4A765805M857
It. CONTROLLING OFFICE NAME AND ADDRESS
Department of Defense Explosives Safety Board, DDESB-KT Alexandria, VA 22331
12. REPORT DATE
June 1980 13. NUMBER OF PAGES
154 14 MONITORING AGENCY NAME A ADDRESSfif diHerenl from ConlrolUnl Olttco) '5. SECURITY CLASS, (ol this report)
Unclassified 15«. DECLASSIFICATION DOWNGRADING
SCHEDULE
16. DISTRIBUTION STATEMENT (o( this Report)
IT. DISTRIBUTION STATEMENT (al the abstract entered in Block 20. II dlllerent Irow Report)
Approved for public release; distribution unlimited.
IB SUPPLEMENTARY NOTES
19. KEY WORDS (Continue on reverse side 11 necessary and identity by block number)
20. ABSTRACT (Continue on reverse side it necessary and identity by bloch number)
The initial phase of a program related to hazard classification of combustible munitions has been completed. This program has two overall objectives. The first objective was to develop quantity- distance standards and criteria for combustible compositions assigned to classes 1.3 and 1.4. The second objective of the overall program is to develop standard test procedures to classify the materials with
(continued)
OD I JAN 73 1473 EDITION OF 1 NOV 65 IS OBSOLETE UNCLASSIFIED
SECURITY CLASSIFICATION OF THIS PAGE r»>icn Dola Bnlrrrd)

UNCLASSIFED SECURITY CLASSIFICATION OF THIS P AGE(Whmn Data Enlmred)
20. ABSTRACT (concl)
respect to the hazards that they present to exposed materials, struc- tures, and persons during storage and transport. The initial phase of the program was to identify or develop the required methodologies. A range of potential hazards are imposed by class 1.3 and 1.4 materi- als. By the basic nature of these materials, the hazards are all fire related, but the fires can be sustained burns or quick bursts (fire- balls). Potential for harm from these materials is due to radiant heat and firebrands. This test methodology development program was divided into three parts. The initial step was to identify (from the literature) or develop scaling models for evaluating experimental results for free standing flames and fireballs, enclosure fires (i.e., storage facilities), and firebrand lofting. Flame characteristics of interest included the heat flux emitted from the flame and the flame geometry.
Second, the pertinent instrumentation techniques were surveyed and summarized. Instrumentation of interest included devices for measuring radiated heat flux, flame temperature, gas velocity, fire- brand trajectories, and firebrand ignition potential.
The third segment of work involved seven series of experiments. For these experiments, four sample materials were selected. These were Ml propellant. Western Cartridge 844 (a ball powder), 2.75 inch rocket motors, and ALA17 candles (an incendiary). These materials were tested both in their shipping containers and removed from the containers.
The first test series was to screen the different instrumentation options so that the most promising could be selected for later tests. The second series was to determine how to safely test the 2.75 inch rocket motors. It was determined that the rocket motors would not self-propel themselves very far and outdoor testing was found to be suitable. The third test series involved single packages (boxes) of each of the sample munitions items. Test series 4 involved stacks of several boxes to simulated realistic storage or transport configura- tions. Test series 5 consisted of burning piles of bare propellant in the open, and test series 6 consisted of burning these materials in- side of a small enclosure, simulating a storage structure. Series 5 and 6 were idealized tests to evaluate scaling relations. Test series 7 involved burning propellant inside of its storage container with the top removed. These seven sets of experiments provided a good overview of the different ways that the four sample materials can burn.
Based on this program, much was learned that can be applied to the development of a standardized classification test for character- izing the fire hazards of combustible munitions. The burning behavior of the materials is better understood, therefore more realistic quantity-distance standards can be developed.
UNCLASSIFIED
SECURITY CL ASStriC ATION OF THIS PAGE'Wten Data Entered)
IX
FOREWORD
This report describes the work conducted under Contract MDA903- 79-C-0327 entitled "Fire Hazards From Combustible Ammunition, Meth- odology Development" accomplished by IIT Research Institute for the Department of Defense, Explosives Safety Board (DDESB-KT), Washington, D.C. Mr. W. G. Queen and Dr. T. Zaker were the DDESB technical representatives on the program.
Respectfully submitted,
IIT RESEARCH INSTITUTE
^~^x< Ronald Pape Senior Research Engineer Manager, Fire and Safety Research
APPROVED:
Dr. K. E. McKee Director Engineering Division
XII

CONTENTS
Page
1. BACKGROUND 1
2. INSTRUMENTATION SCREENING AND INITIAL SAMPLE CHARACTERIZATION (Test Series 1) 6
3. ROCKET MOTOR TESTS 10
4. SINGLE AND MULTIPLE BOX TESTS (Test Series 3 and 4) 15
5. SCALING FREE BURNING FIRE PLUMES (Test Series 5) 31
5.1 Atmospheric Transmissivity, T 34 5.2 Geometric View Factor, F(L, D, X, 0) 37 5.3 Flame Length, Flame Diameter and Mass Burning Rate 37 5.4 Flame Emissive Power 41 5.5 Fire Plume Axial Gas Velocity 41 5.6 Flame Temperature Profile Along Centerline 46
6. ENCLOSURE FIRE SCALING (Test Series 6) 49
7. OPEN TOPPED BOX FIRES (Test Series 7) 61
8. SUMMARY OF PHASE I RESULTS 67
9. REVIEW OF PHASE I AND RECOMMENDATIONS FOR PHASE 2 70
APPENDIX A: SCALING RADIATED HEAT FROM FREE BURNING FIRES 73 A.1 Pertinent Literature 73 A.2 Point Source Model 78 A.3 Emitting Surface Model 79 A.4 Summary 85
APPENDIX B: SCALING MUNITIONS FIRES IN ENCLOSURES 86 B.l Vent Mass Flow 93 B.2 Exit Velocity 93 B.3 Rate of Energy Flow 93 B.4 Chamber Characteristics 94 B.5 Flame Length 95 B.6 Flame Lift Angle 95 B.7 Summary 97
APPENDIX C: FIREBRANDS IQQ C.l Optimum Altitudes Achieved by Firebrands
Within Convection Column ^02 C.2 Velocities of Firebrands Leaving Column ^03 C.3 Flight Times and Travel Distances 103 C.4 Travel Distances ^06 C.5 Maximum Travel Distances 107

CONTENTS (CONCL)
Page
APPENDIX D: INSTRUMENTATION FOR FIRE CHARACTERISTICS 108 D.I Heat Transfer Measurements 108 D.2 Temperature Measurements 122 D.3 Velocity Measurements 129 D.4 Flow Visualization "6
APPENDIX E: FIREBRAND CHARACTERISTICS, PRELIMINARY INVESTIGATION 139
REFERENCES 152
VI

LIST OF FIGURES
Page
13
16
18
19
20
21
22
1. Lever Arm Arrangement with a Force Transducer 9
2. Test Configuration for Single Box Rocket Motor Test H
3. Multiple Box Rocket Motor Test Arrangement 12
4. Multiple Box Rocket Test
5. Single Box Test Arrangement
6. Typical Multiple Box Test Arrangement
7. Multiple Box Test
8. Test Configuration for ALA17 Candles Multiple Box Tests
9. Typical Fireballs Produced by Ml and WC844 Single and Multiple Box Tests
10. ALA17 Single Box Tests Typical Event
11. ALA17 Candle Multiple Box Tests Typical Events 2j
12. Typical Multiple Box Test Heat Flux Record (WC844) 30
13. Propellant on Scale for Test Series 5 Experiments 32
14. Transmission of the Atmosphere Between 0.7 and 12.0 microns for Blackbody Source at Temperature of 1000 K
15. Transmission of the Atmosphere Between 0.7 and 12.0 microns for Blackbody Source at Temperature of 2000 K
16. Configuration for Radiometer Viewing Flame in Test Series 5
17. Flame Length Scaling
18. Scaling Trends for Mass Burning Rate
19. Effective Flame Emissive Power versus Flame Diameter ^3
20. Free Burning Fire Axial Velocity Profiles 45
21. Flame Centerline Temperature Profiles Zt7
22. Flame Temperature versus Scaled Distance Above Floor ^8
23. Enclosure Fire Test Arrangement
24. Chamber Temperature
25. Flame Temperature at 0.61 m in Front of Enclosure Opening
26. Point Source Model Constant for Ml
27. Point Source Model Constant for WC844
28. Flame Length Correlation for Enclosure Tests
29. Flame Lift Angle versus Parameter ^
36
38
40
42
53
54
58
60
vn

LIST OF FIGURES (CONCL)
Page
30. Test Series 7 Test Arrangement 62
31. Typical Open Top Box Test 63
32. Comparison of Heat Fluxes 68
33. Comparison of Firebrand Distances 69
34. Emitting Surface Model 80
35. Simplified Emitting Surface Configurations 84
36. Munitions Fire in an Enclosure 88
37. Illustration of Firebrand Problem 102
38. Asymptotic Calorimeter 110
39. Slug Calorimeter 112
40. Equilibrium Calorimeter 114
41. Common Thermocouple Circuit 124
42. Thermocouple Configuration for Field Use 124
43. The Effect of Thermocouple Wire Diameter on Temperature Measurements 126
44. Shielded Thermocouple Assembly 128
45. Self-Compensating Chromel-Alumel Thermocouples 130
46. Hot Tube Anemometer 133
47. Diagram of Bidirectional, Pressure Differential Flow Probe 135
48. Angular Sensitivity of Prototype in Plane Normal to Axes of Support Tubes (Re=3400) 137
Vlll

TABLES
Page
1. Typical Class 1.3 and 1.4 Munitions Items and Packaging Materials 2
2. Multiple Box Rocket Motor Test, Sequence of Events 14
3. Single Box Test Results (Test Series 3) 17
4. Test Series 4, Ml Test 1 (eight boxes of Ml propellant) 24
5. Test Series 5, Ml Test 2 (eight boxes of Ml propellant) 25
6. Test Series 4, WC844 Test 1 (eight boxes of WC844) 26
7. Test Series 4, WC844 Test 2 (eight boxes of WC844) 27
8. Test Series 4, ALA17 Candle Test (12 boxes of ALA17 candles) 28
9. Projected Flame Areas for Test Series 3 and 4 29
10. Test Series 5 Results 33
11. Flame Length Scaling 39
12. Data for Effective Flame Emissive Power versus Flame Diameter 44
13. Summary of Enclosure Test Results 51
14. Enclosure Test Exit Velocities 55
15. Single Open-Topped Box of Ml (test 1) 64
16. Single Open-Topped Box of Ml (test 2) 64
17. Single Box of WC844 (test 1) 65
18. Single Box of WC844 (test 2) 65
19. Prediction of Open-Topped Test Results Based on Emitting Surface Model 66
20. Terms for Dimensional Analysis 74
21. Emmons and Faure Papers on Fire Scaling 76
22. Summary of Existing Enclosure Fire Scaling Methods 87
23. Summary of Scaling Relations for Munition Fires in Vented Enclosures 98
24. Experiment Format for Munitions Enclosure Fires 99
25. Nomenclature for Firebrand Discussion 101
26. Thermocouple Response to Immersion in 4270C Environment 125
27. Summary of Firebrand Ignition Tests 141
28. Equivalency of Firebrand Ignition Potential 145
29. Summary of Experimental Evaluation of Candidate Catcher Materials (Tests Completed) 147
IX

TABLES (CONCL)
Page
30. Unpainted Polyethylene Catcher 148
31. Unpainted Polyurethane Foam 149
32. Painted Polyurethane Foam 150

1. BACKGROUND
The work described in this report constitutes the first phase of a program to improve safety distance standards and classification test pro- cedures related to munition items in storage and transport which present mainly a fire hazard, specifically those items which are assigned to haz- ard class 1 - divisions 3 and 4.* The total program is to consist of five phases. The objective of the initial phase (methodology develop- ment) was to develop an understanding of the phenomena that make up the overall fire hazard, determine the appropriate scaling relations for these phenomena, and evaluate instrumentation techniques required to characterize the hazards. Phase 1 was to identify the most promising scaling and measuring techniques, i.e., to determine how to make the measurements and scale the results, and to verify that the required measurements can be made, but not necessarily to obtain definitive data for the sample materials being tested. Phase 2 is to further investigate size and geometry effect on the parameters that characterize the radiant intensity and firebrand hazards. Phase 3 is to investigate the effects of the fire hazards on exposed targets. Phase 4 is preparation of safety distance standards as functions of the relevant parameters. Finally, phase 5 is the design of a classification test and procedures.
Items which fall into classes 1.3 and 1.4 represent a wide variety of chemicals, individual item geometries and container types, and overall packing or stacking arrangements. The types of items and packaging material in these classes are summarized in Table 1. In the discussions which follow, we will refer to the overall grouping of items in their storage or transportation arrangement as the "fuel package". In order for the fuel package to become involved in a fire, an ignition source must be provided. In transportation situations ignition will most likely occur from a vehicle accident or faulty equipment. For example, a liquid pool fire from a fuel spill is a potential ignition source in a truck accident. Faulty brake shoes or a hot journal bearing could cause a box- car fire during railroad transportation.
Somewhat less probable ignition modes in transportation include mechanical stimuli such as impacts and friction from the stacks shuffling around during transport or cooking of the items in an unventilated com- partment on a hot day. In storage situations, the most likely ignition modes relate to human interaction while filling or unloading the storage area. These stimuli include impact or penetration of items from a fork- lift or by dropping the items, or an external fire. In addition, many times different types of items are stored or transported together and one stack could be ignited by a fire in another stack. These are only a few of the possible ignition types and are mentioned here to point out the variety in the types of ignition sources which are possible. This must be kept in mind when designing standard classification tests, because the
*Also denoted classes 1.3 and 1.4.

TABLE 1. TYPICAL CLASS 1.3 AND 1.4 MUNITIONS ITEMS AND PACKAGING MATERIALS
Munitions Items*
Propellants (solid, powder, grains/pellets) Incendiaries Fireworks Cartridges
Blasting Caps Primers Bombs Cord/Cable
Fuses Flares Grenades Rockets/Rocket Motors
Squibs Tracers Contrivances Some Explosive Devices
Packaging Materials
Paper Bags Kraft Paper Plastic Bags Fiberboard Boxes
Natural Wood Rubberized Textile Rubber Sawdust
Wood Vool Textile Aluminum Steel Glass
* Some of the types of items listed may also be in other classes.

type and Intensity of the ignition could have a significant influence on the manner in which the fire develops and thus on the conclusions which are derived from the test.
The stacking arrangement and types of items present will also in- fluence the burning behavior and types of hazardous effects which result. The fire will spread within a fuel package due to radiative and convec- tive heat transfer from the existing fire to as yet uninvolved items. The presence of combustible packaging materials can help sustain and spread a relatively slow fire. Individual items can burst and/or rocket spreading hot or burning debris through the overall fuel package. If the overall package is contained, pressure can build within the container ultimately resulting in a larger scale pressure vessel explosion.
When items of classes 1.3 and 1.4 become involved in a fire, three categories of hazardous effects can result. The first hazardous effect is the radiative heat field produced by the fire. If the fire spreads very quickly with a pressure buildup within the bulk of the material throwing the material out, a "fireball" will result. A fireball will generate a quick pulse of thermal energy. The target experiences a "packet" of energy impinging on it at some intensity for a short dura- tion. If the fire spreads relatively slowly through the fuel package, the radiation field will be produced by more typical flames. The flames will radiate more of a steady state heat flux over a much longer period of time. Some real fires will involve a relatively steady background flame with periodic surges of energy being released ~ essentially a com- bination of the two effects, a slow fire with periodic flashes of energy being released.
The second hazardous effect is the rocketing of projectiles out of the fire either self-propelled or thrown out by local or large-scale pressure explosions. Such propelled projectiles could reach and ignite or damage targets far from the source. The farther a target is from the source, the lower the probability that a projectile will hit the target and this should also be considered when defining a safe separation distance.
The third hazardous effect is lofting of items and debris picked up by the convective column. In small fires, the gas flow in the convective column will be relatively weak and only light debris such as hot cinders and some packaging materials will become lofted. In these cases it is not likely that the light debris can be carried very far while still hot or burning. In very large fires, the convective column becomes quite strong. Much heavier combustible debris and individual munitions items can be carried high in the plume before leaving the plume and falling back to the ground. The lofted items can be either inert or flaming when they come into contact with the target.
To specify safe separation distances, the response of the targets must be considered for each type of hazardous effect. First, realistic

targets must be defined for the storage and transportation situations. Some relevant targets include buildings, vehicles, magazines, natural fuels (e.g., grasses and trees), aircraft, fuel tanks and personnel.
The initial segment of work under phase 1 - methodology development (this program), was concerned with identification of applicable tech- niques for characterizing the fire hazards of combustible ammunition. This work has been reported in an interim report (Ref 1) which is largely repeated in the appendix to this report. These techniques fell under two categories: scaling models and instrumentation. The literature was surveyed for existing applicable techniques, and where voids existed, new techniques were developed.
Suitable techniques for scaling radiated heat from freestanding flames and fireballs were found to exist (Appendix A). These techniques have been used extensively in interpreting test data compiled during this project.
A model was developed for scaling enclosure fires, i.e., munitions fires inside of storage stuctures (Appendix B). The model was based on an analogy with solid propellant rocket motors. During later testing it was found that this analogy was not realistic because the pressure rise inside the enclosure was quite low. The existing scaling models for con- ventional fire in enclosures (see Table Bl - Appendix B) may be more appropriate than rocket scaling for this reason.
A model was developed for lofting of firebrands in a fire's convec- tive column (Appendix C). During testing it was discovered that a pres- sure burst producing a fireball is probably a more significant mechanism for propelling firebrands to great distances. The initial lofting process by a pressure burst was not modeled in the initial work, although the pre- diction of the firebrand's trajectory once it leaves the convective column (or fireball) is still relevant.
Instrumentation techniques for characterizing fires were reviewed (Appendix D). These techniques include devices used to measure heat transfer (radiative and convective), temperatures in the flame, gas velocities, and flow patterns.
Finally, the ignition potentials of a variety of firebrands (e.g., smoldering cardboard and wood, burning propellant grains, and hot metal fragments) were evaluated by dropping the test firebrands onto a variety of "real world" host (target) materials such as a propellant bed, wood and asphalt shingles, corrugated cardboard, tarpaulin, dry grass, and a seat cushion. In addition, devices/materials for characterizing the
Berl, W. G., editor. International Symposium on the Use of Models in Fire Research, National Academy of Sciences - National Research Council, Publication 786, Washington, DC, 1961.

firebrands during field tests were evaluated. This study is presented in Appendix E.
The initial work on this program is reported in Appendixes A through E. Emphasis in this report is on the seven series of experiments that followed the initial investigations. These seven test series are out- lined :
Test Series 1; Instrumentation Screening and Initial Sample Characterization
Test Series 2; Preliminary Tests with Rocket Motors
Test Series 3; Tests with Single Shipping/Storage Boxes of Material
Test Series 4; Tests with Stacks of Boxes of material
Test Series 5; Investigation of Free Burning Fires
Test Series 6; Investigation of Enclosure Fires
Test S'eries 7; Tests with Single Open-Topped Boxes of Propellant.
Four sample materials were selected for these experiments:
Ml Propellant
Western Cartridge 844 (WC844 - a ball powder)
2.75 inch Rocket Motors
ALA17 Candles (an incendiary)
These materials were selected to represent the range of items and packag- ing materials that fall in classes 1.3 and 1.4; unfortunately numerous other types of items and packaging materials could not be represented due to practical limitations on the number of samples that could be tested in a meaningful way within the program's funding.
The sections of this report that follow describe the tests that were completed and the test results. Conclusions based on the phase 2 results are presented with recommendations for work to be completed under phase 2.

2. INSTRUMENTATION SCREENING AND INITIAL SAMPLE CHARACTERIZATION (TEST SERIES 1)
The objective of test series 1 was to gain experience in burning the sample materials and to evaluate the instrumentation options available for subsequent testing. Experience in safely handling the propellant samples (Ml and WC844) was gained by burning small quantities of material in the open, initially with very little instrumentation. Several ALA17 flares were also ignited individually at first before attempting tests involving larger quantities of the material. With the rocket motors, there was concern that the rockets might be propelled long distances making outdoor testing hazardous, or that the rockets might detonate if "cooked" in a fire, making indoor testing impractical. Therefore, a special series of experiments (leading to a safe procedure for testing the rockets) was required. This special series of tests is described under test series 2, in Section 3.
The initial tests with Ml and WC844 involved burning the propellants in small open-topped containers outdoors. The wind was found to have a strong effect on the flame shape. The wind caused random movements of the flame in addition to shortening and thickening of the fire column relative to the no-wind condition. Thus, testing of bare propellant was moved indoors to gain better control and more consistent results.
By burning bare propellant in open-topped containers indoors, the following types of instrumentation and experimental techniques were evaluated:
Radiated Heat
Radiometers Slug Calorimeters
Flame Temperature
Tempil Pellets Chromel-Alumel Thermocouples (type K) Platinum-Rhodium Thermocouples (type B) Narrow View Radiometers
Flow Velocity
Bidirectional Flow Probes
Burning Rate
Lever Arm with Force Transducer

Flame Envelope/Evemt Times
Video Movie
Controlled Firebrand Lofting and Tracking
Firebrand Injection Techniques Still Photography
To measure radiated heat from a flame, both radiometers and slug calorimeters were found to be useful. Radiometers provide heat flux give (i.e., (cal/cm^sec) at each instant of time, whereas slug calorimeters the integrated energy that impinges on the instrument (i.e., (cal/cm2). Unless the event duration is quite short, as with a quick fireball, the thermal losses from the device start to dominate the record obtained from a slug calorimeter. This makes interpretation of the data difficult and reduces accuracy. Thus, particularly for sustained fires, radiometers were found to be more versatile, easier to use, and more accurate than slug calorimeters.
For measuring flame temperatures, four techniques were tried: tempil pellets, chromel-alumel thermocouples, platinum-rhodium thermocouples, and narrow view radiometers. Tempil pellets are simply beads made of ma- terials of known melting points. They were used to bracket the flame temperatures so that the proper type of thermocouple could be selected for subsequent testing. Even for this purpose, the tempil pellets were found to be somewhat inaccurate. Due to their size, they were slow to respond and lost considerable heat by thermal radiation. This is the same problem encountered when using large wire thermocouples for measuring flame temperatures. The edges on the beads were observed to be rounded off by melting and the indicated temperatures were always lower than was indicated by thermocouples. Fine wire (36 gauge 0.0050 inch diameter) chromel-alumel thermocouples were adequate for measuring flame temperatures up to about 2500 K, and platinum-rhodium* thermocouples were adequate up to about 3300 K. Above 3300 K, narrow view radiometers could be used to roughly estimate the flame temperature although a number of uncertainties exist, such as the flame thickness at the location that the radiometer is viewing and the appropriate attenuation coefficient to use for the flame gases.
Bidirectional flow probes (see Appendix D) were used to measure gas velocities in the flame. This technique appears to be adequate although the results obtained during this program were somewhat unsatisfying. This was due primarily to prior lack of experience in using these probes.
* Platinum - 6% Rhodium in one wire with Platinum - 30% Rhodium in the other wire.

Burning rate (weight loss rate) was measured using a lever arm arrangement with a force transducer, as Illustrated in Figure 1. This technique worked quite well for piles of material or boxes burning in the open. Difficulties were encountered using the technique to measure burn- ing rate in the enclosure tests. These difficulties were due to poor design of the coupling between the platform holding the propellant and the scale outside of the enclosure. The coupling mechanism would stick during the tests. A better coupling design would be required for further enclosure fire tests of the type conducted under this project.
Video and movie coverage of the tests provided the flame configura- tions and event times. Video coverage was found to be more versatile than movies because a video tape can record extremely long duration tests in which the event times are not known beforehand. With movie coverage, there is considerable cost for numerous rolls of film required even dur- ing the "dead time" between events. Video coverage does have a slight image distortion problem that must be accounted for when taking flame shape measurements off of a television monitor. This distortion can be accounted for by placing scale markers in different parts of the camera's view. The inconvenience of having to compensate for this slight distor- tion Is far outweighed by the advantages of using a long running tape that can be conveniently edited to remove dead time at a later date.
An attempt was made to develop techniques required to verify the firebrand lofting model presented in Appendix C. It was found that large fires are required to loft even very small firebrands (e.g., 0.3 cm cube balsa wood and 1 cm square corrugated cardboard). In addition, it is very difficult to photograph the firebrand trajectories after the brands leave the fire column. Due to the great difficulty encountered in obtain- ing adequate results in this effort, and the observations in test series 3 and 4 that indicated firebrands are lofted primarily by fireball pres- sure bursts, this effort was ultimately abandoned.

V Figure 1. Lever Arm Arrangement With a Force Transducer

3. ROCKET MOTOR TESTS
With each of the four sample materials, tests were conducted in three steps. First, small quantities of material were burned to gain experience in handling the material (test series 1). Second, a single box (shipping/storage container) was exposed to a JP-5 liquid pool fire to determine how the box reacts by itself (test series 3). Finally, a stack of boxes was exposed to a JP-5 liquid pool fire to determine the degree of interaction between boxes in a more realistic stacking arrange- ment (test series 4). These three steps also applied to the rocket motor tests, but because there were special considerations in handling the rocket motors, they are discussed separately in this section.
Test series 2 was to gain experience in burning the rocket motors and to determine the best location for conducting the rocket tests. Two concerns existed in handling the rocket motors. First, if field testing of the motors was to be done, the rockets must not self-propel themselves to great distances. Second, if testing were done inside a reinforced steel/concrete test structure (to assure that the rockets could not travel far), we had to be certain that the propellant would not detonate after being "cooked" for a long time in a pool fire.
To determine whether the rockets would self-propel, several tests were conducted inside of a reinforced steel/concrete building at the IITRI Gary, Indiana testing range. The most informative test involved a single rocket ignited inside of a 1.12 m long 10 cm ID steel tube that was fastened to a massive steel I-beam. The rocket was free to move Inside of the tube. To ignite the rocket 120 ml of ball powder was poured into its exhaust nozzles. An electric squib was placed in the ball powder for ignition. A cup in the front end of the rocket motor is designed to blow out if the rocket is ignited without its payload screwed in. This cup was recovered about 17 m downrange after the test. The rocket itself was found to push itself out of the tube and burn on the floor about 1.5 m in the opposite direction. These particular rocket motors were thus found to be safe for field testing in terms of their inability to travel very far.
The storage/shipping container for these rockets consists of four metal tubes (each containing a rocket motor) tied together at the ends with a square metal cap. When it was determined that the rocket could not self-propel very far, a field test was conducted using one shipping container as shown in Figure 2. In this test, three of the tubes were empty - only one rocket motor was involved. The shipping/storage container was exposed to a JP-5 pool fire. The rocket ignited at 17 minutes 23 seconds after ignition of the JP-5. At that time, one end cap of the container was blown off. The rocket merely burned in place until the propellant was consumed.
10

JP5 Fuel Supply
Fuel Pan
Rocket Motor in This Compartment
Figure 2. Test Configuration for Single Box Rocket Motor Test
Finally, a multiple box test was conducted in the field with the rocket motors. The test arrangement is shown in Figure 3. Six cases of rocket motors (24 motors) were stacked and exposed to a JP-5 pool fire. The initial test arrangement and remains after the test are shown in Fig- ure 4. Approximately one-third to one-half of every container and rocket was melted away at the warhead end of the container. All the rockets burned and remained in the container. The primary events that occurred during the test are summarized in Table 2.
11

u •u OJ e o
en 0 -
0)
4J
g g M C
<
to (U H
M C XJ C
^i o o
o pq
P. •H u
I CO
0)
3
12

Figure 4. Multiple Box Rocket Test
13

TABLE 2. MULTIPLE BOX ROCKET MOTOR TEST, SEQUENCE OF EVENTS
Major Event
Sequence
Approximate" Event Time
After Ignition
Peak** Heat Flux at 4.57m n
(cal/cm sec
Typical** Heat Flux at 4.57m
) (cal/cm- sec)
Approximate Pulse
Duration (sec)
1 17 min. 23 sec >0.701 0.053 30
2 20 min. —
3 21 min. 15 sec 0.174 0.105 30
4 21 min. 57 sec 0.174 0.074 24
5 22 min. 35 sec 0.136 0.099 30
6 23 min. 25 sec 0.136 0.136 33
7 24 min. .12 sec 0.202 0.149 30
8 25 min. 5 sec 0.202 0.102 26
9 25 min. 50 sec 0.115 0.115 33
10 27 min. 15 sec 0.155 0.093 26
11 28 min. 20 sec <0.05 <0.05 36
12 35 min. 35 sec 0.031 0.031 —
* Event times recorded at peak heat flux or midpoint of event dura- tion, depending on whether the pulse was sharp or gradual, respectively.
* Typical heat flux characterizes a long duration background heat flux with occasional narrow peaks superimposed.
14

4. SINGLE AND MULTIPLE BOX TESTS (TEST SERIES 3 AND 4)
In both test series 3 and 4 whole shipping/storage boxes of Ml, WC844, or ALA17 candle were exposed to a liquid pool fire until ignition of the sample occurred. In test series 3, single boxes of sample ma- terial were tested, whereas in test series 4 a stack of 8 or 12 boxes of material was used.
A typical test arrangement used in the single box tests is illustra- ted in Figure 5. These tests were monitored with a video camera and a radiometer. Eight single-box tests were completed, and these are summa- rized in Table 3.
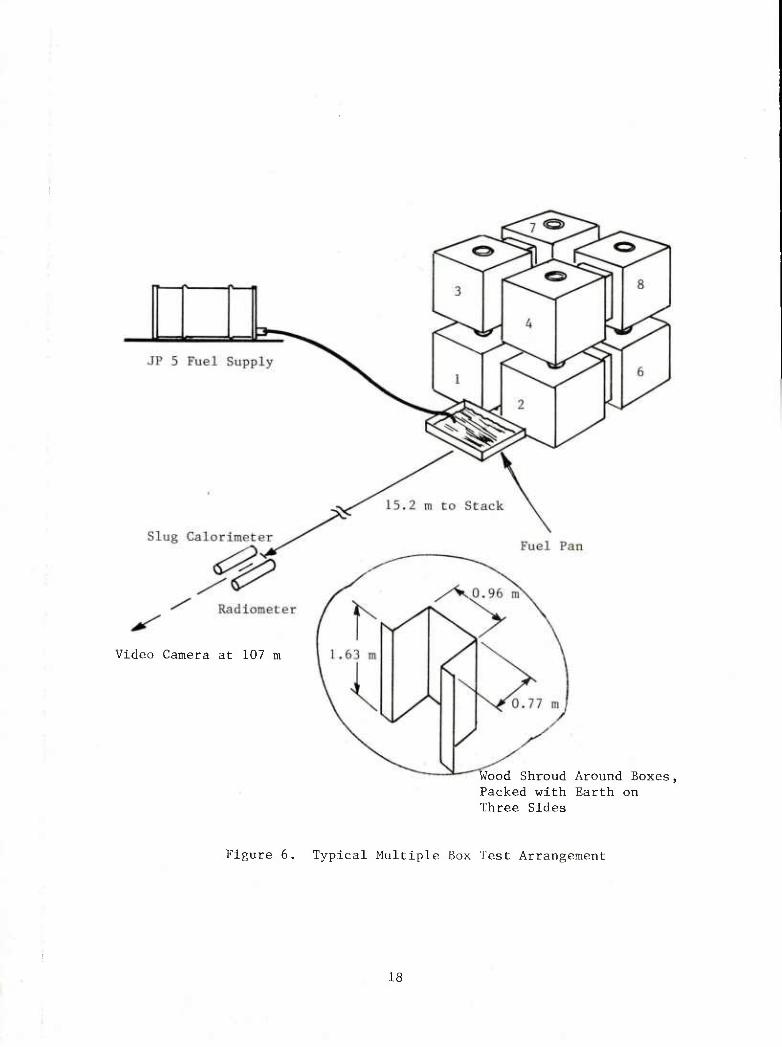
The multiple box tests were conducted in a similar manner, except a stack of boxes was exposed to the pool fire. The boxes were piled as though in storage or transport. They were covered on three sides with a wooden barrier. The barrier was used to simulate additional stacks of boxes beyond the test region (i.e., restricted airflow and radiant rein- forcement). A typical test configuration used in the Ml and WC844 mul- tiple box tests is shown in Figures 6 and 7. In the bottom photograph in Figure 7 the two white poles are 9.14 m apart. The tripod to the left in the photo is holding a radiometer viewing the test. Figure 8 illus- trates the stacking arrangement used in the ALA17 candle multiple box tests. Generally, Ml and WC844 produced fireballs such as shown in Figure 9 in both single and multiple box tests. For the two propellants, the individual events in the multiple box test were quite similar to a single box burning. Conversely, with the ALA17 candle, the single and multiple box tests produced significantly different results. A single box of flares produce individual fires for each half canister, either "dancing" around on the ground as a small white ball of fire (see Figure 10) or a similar white fireball shooting through the air. When 12 boxes of flares were stacked together, substantial interaction was observed. Typical multiple box flare test results are shown in Figure 11. In some cases individual canisters would run around on the ground or shoot through the air as in the single box tests, but at other times large white flames would churn above the stack of boxes spewing burning incen- diary like snow.
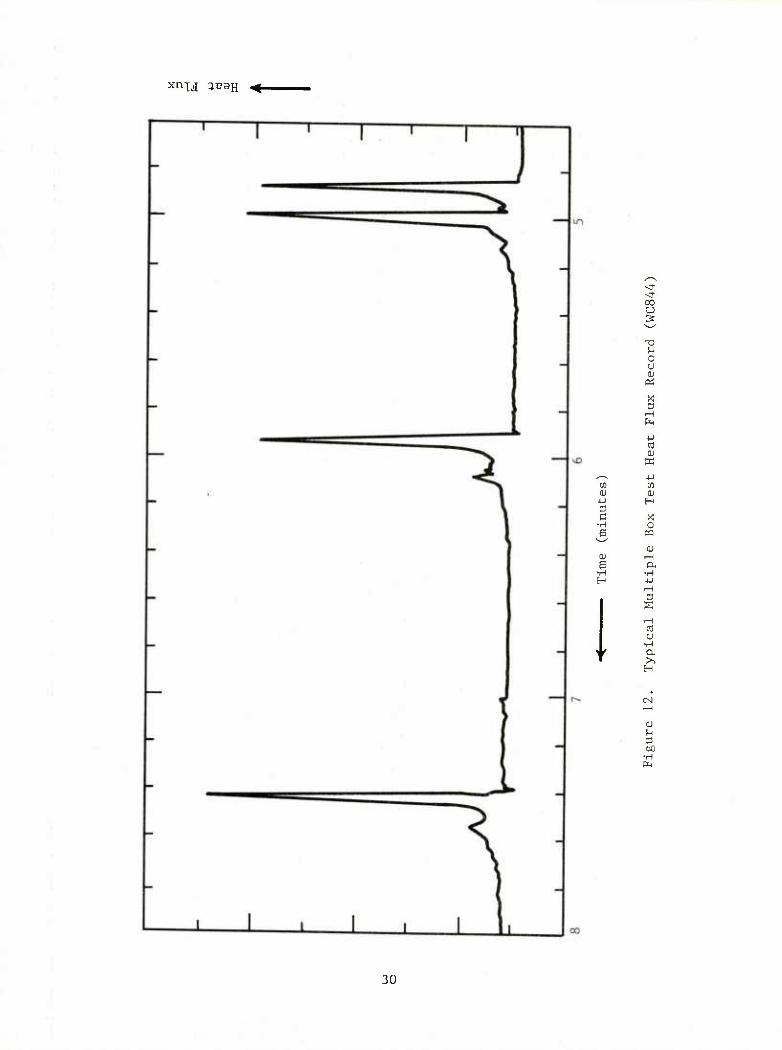
The test results for test series 4 are summarized in Tables 4 through 9. Tables 4 and 5 give event times, peak heat fluxes and pulse energies for the Ml multiple box tests. Some qualitative results are also described. Tables 6 and 7 give similar results for WC844. The two multiple box tests with ALA17 candles were nearly identical, with numerous individual events. The first of these incendiary tests is sum- marized in Table 8. Table 9 gives projected flame areas and equivalent fireball diameter D for selected events in both test series 3 and 4. Finally, Figure 12 is a typical heat flux versus time record for a pro- pellant multiple box test. The record shown is a segment out of the second WC844 test. The initial fireball corresponds to the spike in each event whereas the trailing heat flux hump corresponds to a dying sustained flame that lingered after the initial fireball occurred.
15

Radiometer 1.14 m Above Ground
Video Camera
Figure 5. Single Box Test Arrangement
16

TABLE 3. SINGLE BOX TEST RESULTS (TEST SERIES 3)
Test Material
Time from Peak Pulse Pool Ignition Event Heat Flux Energv Qualitative to the Event Duration (cal/cm2 sec) (cal/cm^) Results
Ml 14 min. 5 sec 4 sec peak 1.72 (3 9.1m 5.91 (? 14 sec 9 , 1m overall
Ml 46 min. 20 sec 4 sec peak 1.488 3 9.1m 4.34 @
Ml
12 sec overall
1 min. 44 sec 13-14 sec 0.45 (3 14.5m
9.1m
Fireball
Pool fire out at 24 rain., initial fireball dies to sustained flame
WC844 12 min. 12 sec
WC844
WC844
(8 flares) (box laid flat)
2 min.
34 min. 15 sec 34 min. 15 sec 39 ram. 30 sec 39 min. 30 sec 39 mm. 40 sec 40 mm. 10 sec 46 mm. 35 sec 49 min. 10 sec 50 mm. 45 sec 51 mm. 12 sec 51 min. 34 sec 51 mm. 36 sec
4 sec peak 2.17 ? 9.1m 17 sec overall
4 sec peak 1.52 0 9.1m 28 sec overall
4 sec peak 0.643 0 14.5m 1.69 @ 31 sec 14.5m overall
no record, flare landed on wire
2.43 @ 14.5m
Box layed on side with pool at top, fireball
8.06 0 9.1m
Initial burst to fireball to sus- tained flame slowly dying
5.27 0 9.1m
Fireball
Box laid on side with pool at top, fireball
• event typically small white balls of fire
• four half assem- blies did not burn
e spent canisters thrown out mostly within 9 to 12 m
• farthest can- ister at 25 m
• canisters acted like rockets shooting out in all directions
• canisters on ground left 36 cm wide char path
ALA 17 32 min. 20 sec 3 0 sec 0 092-"- 0 14* • individual (8 flares) 33 min. 9 sec 4 5 sec 0 062 0 124 flares (half as- (box laid 33 min. 32 sec 4 5 sec 0 124 0 26 semblies going on one 33 min. 53 sec 1 5 sec 0 016 0 016 off) end with top ex- posed to pool fire)
33 34 34 36
min. min. min. min .
58 18 42 25
sec sec sec sec
5 1 2 4
0 5 5 5
sec sec sec sec
0 0 0 0
279 028 428 05
0 0 0 0
691 024 61 113
• three complete plus two half assemblies did not burn
• farthest can- ister at: 27 ra with large burn area
• canisters in one general area in front of box (directional pattern)
Heat flux and energy at 6.1m from fire in test nuraber 8. Note, the flares were running around on the ground or shooting through the air (i.e., not a fixed distance from burning flares to the radiometer).
17
Video Camera at 107 m
Wood Shroud Around Boxes, Packed with Earth on Three Sides
Figure 6. Typical Multiple Box Test Arrangement
18

Figure 7. Multiple Box Test
19

1.9 cm
Figure 8. Test Configuration for ALA17 Candles Multiple Box Tests
20
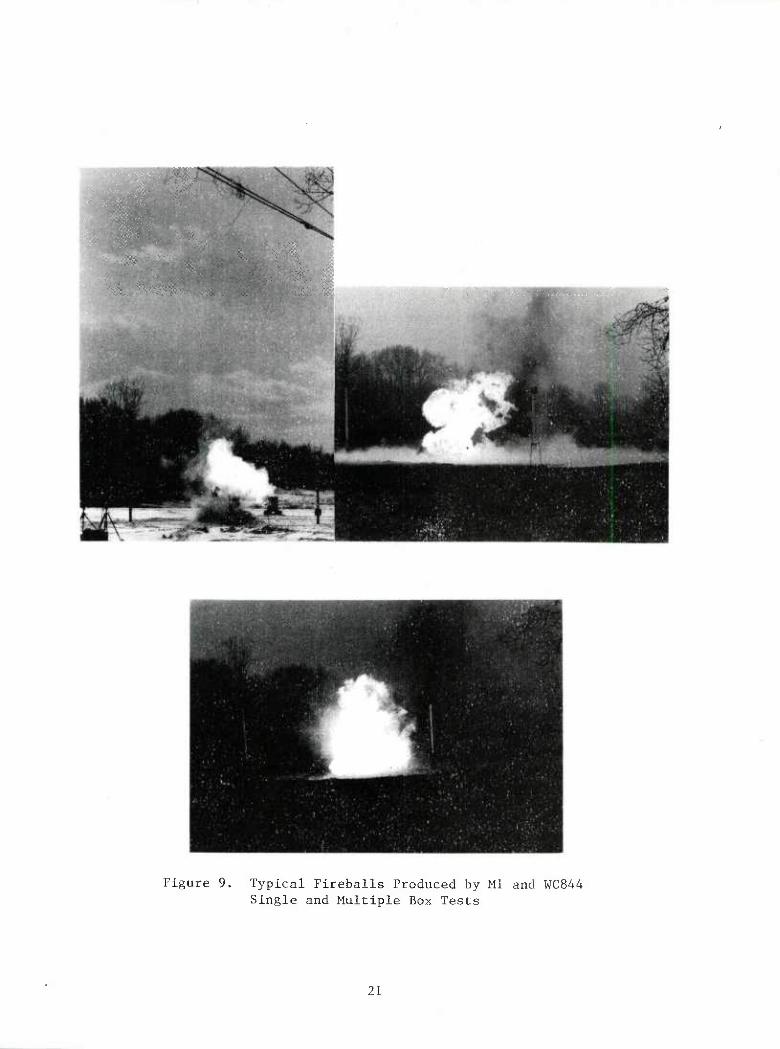
Figure 9. Typical Fireballs Produced by Ml and WC844 Single and Multiple Box Tests
21

Figure 10. ALA17 Single Box Test, Typical Event
22

i ':' i
a a >
u •H
H
H x o
3
-a c ca U
M P 60
•H
23

TABLE 4. TEST SERIES 4, Ml TEST 1 (eight boxes of Ml propellant)
1
Event Approximate Approjcimate Burn Box Time Event Peak Flux* Energy*
Sequence Location (min.) Duration (cal/cm2 sec) (cal/cm2)
II2 (lower front)
#5 (lower front)
H (upper front)
#8 (upper rear)
#3 (lower rear)
//4 (lower rear)
(upper rear)
in (upper front)
(?)
9:49
11:27
13:09
13:10
14:12
14:16
14:17
15:08
18:31
15 sec
13 sec
13-15 sec (cannot see two events on video)
33 sec (22 sec on video)
1.7
1.7J
1.7
6.91
7.01
6.5
0.54
lO.l(total)
9 sec (6 sec on video)
21 sec (23 sec on video)
1.47
1.63
0.43
5.06
6.02
Qualitative Description: Event 1
^<^5 ^ Event 2
^^ /
Event , 4 ^ J 5
^ 1 yy Event 6
T w 7
Fr.-nt Event 8 Event 9
burst, fireball, tall flame, shortening flame more a quick fire (flame) than a fireball
fireball, tall flame, shortening
flaming piece thrown up initially; followed by a short substantial flame; followed by another steep in- crease in flame size resulting in a larger sustained flame dying burst of flame for ~6 sec 23 sec sustained flame
* Radiometer at 9.1
24

TABLE 5. TEST SERIES 5, Ml TEST 2 (eight boxes of Ml propellant)
Event Approximate Approximate Burn Box Time Event Peak Flux* Energy*
Sequence Location (min.) Duration (cal/cm^ sec) (cal/cm^)
#2 4:07 17 sec 0.45 (lower front)
#3 5:46 11 sec 0.78 (upper front)
#4 5:52 18 sec 0.25 (upper front)
#7 7:28 19 sec 0.21 (upper (2 peaks) 0.164 rear)
#8 8:00 10 sec 0.667 (upper rear)
#1 9:03 14 sec 0.722 (lower front)
#6 15:48 0.248 (lower rear)
20 sec
#5 15:50 0.202 (lower rear)
2.23
1.81
2.38
1.1
2.12
2.3
2.77
* Radiometer at 15.2 m
Approximate firebrand map:
/
U— Boxes
15 m
/
/ Several pieces charred wood
I 22m C J
© Charred wood (J) Farthest at 18 m charred wood
2 5

TABLE 6. TEST SERIES 4, WC844 TEST 1 (eight boxes of WC844)
Event Approximate Approximate Burn Box Time Event Peak Flux* Energy*
Sequence Location (min.) Duration (cal/cm2 sec) (cal/cm2)
1
1
#1 (front bottom)
14:28 8 sec 2.6 9.20
2 #2 (front bottom)
14:41 3.5 sec 2.34 4.91
3 #5 (front top)
14:49 9 sec 2.79 6.98
4 #6 (front top)
15:02 22 sec (4 sec peak)
2.43 6,26
5
6
7
order of rear boxes is not clear
16:10
16:17
16:17
18 sec
21 sec
21 sec
2.48
2.57
1.09
7.5
4.57
4.13
8 #4 (rear bottom)
29:35 1 ■*""*" —
* Radiometer at 9.1 m
26

TABLE 7. TEST SERIES 4, ALA17 CANDLE TEST 1 (12 boxes of ALA17 candles)
Burn Sequence
Event Approximate Time Event Peak Flux* Approximate
Box (observer Duration cal Energy* Location at test) (TC) (spike/total) cm^ sec (cal/cm^)
5/6
#3 (upper front)
#4 (upper front)
#1 (lower front)
#2 (lower front)
#7-8 (both upper front)
#6 (lower rear)
#5 (lower rear)
4:45 4:38 5 sec/12 sec 0.78 1.75
4:55 4:47 6 sec/22 sec 0.82
5:53 5:42 5.3 sec/20 sec 0.77
7:18 7:17 4.3 sec/22 sec 0.9
13:30 13:26 5 sec/13 sec 0.34
13:45 13:44 7 sec
14:06 10 sec
0.34
0.19
2.4
2.27
2.68
1.37
1.37
1.75
* Radiometer at 15.2 m
27

TABLE 8. TEST SERIES 4, ALA17 CANDLE TEST 1 (12 boxes of ALA17 candles)
Spike's Aporoximate Approximate
Duration Peak Flux''"'-' Energy Event* Time (sec) (cal/cm2 sec) (cal/cm^)
1 19:28 9.0 0.264 1.39 2 19:52 8.0 0.521 l.bli 3 20:42 4.5 4 21:00 6.0 5 21:07 6.5
6 21:14 5.0 7 21:25 4.0 8 21:43 4 5 9 21:48 9.0
10 22:24 4.6
11 22:33 3.0 12 22:42 4.5 13 22:49 5.0 14 22:59 6.0 15 23:05 5.5
16 23:14 3.6 19.063 17 24:32 4.0 18 24:53 4.5 19 25:05 4.0 20 25:10 18.0
21 25:37 4.0 22 25:56 3.5 23 26:00 3.5 24 26:04 3.5 25 26:14 2.0
26 26:17 4.0 27 26:34 8.0 28 27:13 5.0
* A total of 82 events observed, the majority of which showed up as distinct individual pulses generally in groups of one to four or five in quick succession. For example, two pulses within 12 seconds (events 59 and 60) or four pulses within 22 seconds (events 71 through 74).
** Absolute peak flux (shown) could be as much as 0.016 higher than values (not shown) for relative peak flux (_ 7 percent error).
Qualitative:
Event 1 - swirling smoky fire, no "bang" heard (silent)
Event 2 - small white ball observed at base of black smoke column
Event 3 - somewhat larger fireball than event 2 but similar (i.e. , white at base of black smoke column)
Event 4 - same as event 3
Event 5 - sparks thrown out at time of burst
Event 6 - same as events 3, 4, and 5 but more massive white ball at base
Event 7 - same as events 3, 4, and 5 but smaller
Event 8 - swirling fire at base
Event 9 - small burst at: base shooting off several projectiles with smoke trails
Subsequent events were similar to those described above
0, 264 0, 521 0 319 0, 288 0, 360
0, 583 0, 174 0, 109 0. 490 0 140
0, 241 0, 493 0, 174 0, 159 0. 415
1, 217 0, 233 0, 130 0, 171 1. 3
0, 208 0, 189 0. 183 0, 271 0. 22
0, 217 0, 518 0, 223
28

TABLE 9. PROJECTED FLAME AREAS FOR TEST SERIES 3 AND 4
Equivalent Test Event Area of Flame (m ) Diameter (m)
TS3-M1-1 A 21.1 S 23.57
TS3-M1-2 - 43.3
TS3-M1-3 B 38.5 A >29.0
TS3-WC-1 - 10.9
TS3-WC-2 86.6
TS3-WC-3 A 103.8 B 38.0 C 33.0
TS3-ALA-1 1 2.16 2 (max) 2.76 3 4.09 4 6.54 5 4.97 6 2.92 7 10.29
TS3-ALA-2 1 5.86 . 2 3.5
3 5.29 4 6.33 5 4.37 6 3.89
TS4-M1-1 la 109.0 lb 98.0 2 94.0 3 154.0 max 88.0
TS4-M1-2 1 56.0 (9 min 9 sec 30.0 after start)
TS4-WC-1 1 101.0 2 (max) 103.0 2 (1 ate 95.0
time) 3 71.0 4 68.0 5 41.7 6 81.0 7 48.0 8 69.0
TS4-ALA-1 2 1.85 6 4.88
13 11.9 16 11.9
TS4-ALA-2 1 2.09 3 5.83 4 4.95 5 15.8
5. 18 48
7. 42
7. 0 6. 07
3. 72
10. 5
11. 49 6. 95 6. 48
1. 66 1. 87 2. 28 2. 88 2, 51 1, 93 3, 62
2 73 2, ,11 2 ,59 2. 84 2, ,36 2, .22
11 ,78 11 .7 10 .94 14 ,0 10 .58
8 .44
6 .18
11 .34 11 .45
11 .0
9 .5 9 .3 7 .29
10 .15 7 .82 9 .37
1 .53 2 .49 3 .89 3 .39
1 .63 2 .72 2 .51 4 .48
29
xnjj HB3H ^.
CO
u 3 c
•H
O
I
'CO U s -a M c u
■M CO OJ
Hi
CO
H
X c
a. •H
3 S
o •H
31 M 3 M
•H
30

5. SCALING FREE BURNING FIRE PLUMES (TEST SERIES 5)
The objective of test series 5 was to evaluate scaling models for free burning fires. A small free burning fire can result from a pile of spilled propellant (or other energetic material) being ignited or from an open-topped shipping/storage container becoming involved in a fire. A large free burning fire might result from a stack of boxes being ignited and burning with substantial interaction between box fires, although test series 4 indicated that for many materials boxes probably react indepen- dently with little interaction. Test series 5 was intended to use idealized fires (i.e., cone shaped piles of propellant with symmetric ignition in a no-wind environment) to evaluate scaling relations. The propellant was placed on a platform at the end of a lever arm as shown in Figure 13. A force transducer at the other end of the lever arm was used to measure the sample mass during the tests.
These tests also included instrumentation to measure centerline flame temperature at three heights, gas velocity in the flame, heat flux from both wide and narrow view radiometers, and a video record to give event times and flame dimensions. Much of the data collected on the tests is summarized in Table 10.
The potential for harm from free burning fires is by two mechanisms: radiant heat transfer and firebrands. As discussed in Appendix A, the most promising scaling-prediction model for radiant heat from a free burning fire is the emitting surface model:
q" = T F(L,D,X,e)(l - e aU)E-
where q" is the radiant heat per unit area per unit time impinging on a target surface, T is the atmospheric transmissivity between the target and the source, F(L,D,X,9) is the geometric view factor, L is the visible flame length, D is the effective flame diameter, X is the distance from the source to the target, 9 is the flame tilt angle, a is the flame's attenuation coefficient, and Ef is the emittance of an optically thick flame. As discussed in Appendix C, lofting of firebrands by the convec- tlve fire column depends on the flame's velocity and density (or tempera- ture) profiles. In the following paragraphs, each of these parameters needed for evaluating the radiant heat and firebrand hazards is discussed.
31

WC844 Sample on Scale
Ml Sample on Scale
Figure 13, Propellant on Scale for Test Series 5 Experiments
32

H 5 w s LTl
(/I w H Pi w w H w H
5
3|
a 1 QM^ =■ g o; E to
OOO Oin r^O
O O
1 fO ■« O f- r-.
o o o o
X « « X
O OOOm P-O
o i o ooooo oo
OOOO OOi I I oo
o ■-< o o I-IOO o i o oo
-I en co O r^ (Mr-ooo .-10X000 i5r-.
U U U O U OOOO OOOOO oo
OOOO o uuou ooooo
u u u u OOOO u u DOW uu
% r-< r^ l-t r-< "*
n . 111 41 HI fll fll
•o (X •u u u u e . CO cm c rnn ruo c
> ^.O ^ o o
lill
o o o
O O O O u-i ooinoo O-3"
C O OrH-Hinflr-
OT r-OO O -H^
O O rt iA O O -T -J O -J >-. (M nomo
3 a
33

5.1 Atmospheric Transmisslvity, T
Takata (Ref 2) discussed the attenuation of radiation by the atmo- sphere. His discussion is pertinent here also and is quoted:
"A significant quantity of the radiation emitted by flames is ab- sorbed by water vapor and carbon dioxide or scattered by fog and dust particles and, hence, will not reach a target. An excellent review of available information is presented in an article by Yates (Ref 3) and is summarized in Figures 14 and 15. Figure 14 describes the trans- mission of blackbody radiation corresponding to a 1000 K source between the wavelengths of 0.7 and 12.0 microns, while Figure 15 presents similar data for a 2000 K source. The designated range of wavelengths spans practically the entire spectrum of the radiation emitted by fires of concern to this study. The transmission data of Figure 14 are applicable to fires involving ordinary petroleum fuels while those of Figure 15 are appropriate for fires involving solid fuels. The exceptions are fires in which the spectral distribution of the emitted radiation deviates appreciably from that of a blackbody, such as fires involving liquid hydrogen.
"For blackbody radiation corresponding to 1000 K, it is possible to approximate the transmisslvity of the atmosphere containing 10 grams of water vapor per cubic meter and a C0„ concentration of 0.03 percent by volume by
T (R) = exp(-0.192-R0,16). 3.
Similarly, the transmisslvity for a source at 2000 K, may be approxi- mated by
T (R) = exp(-0.057«R0,30) Si
where the distance R is in feet. Air containing 10 grams of water vapor per cubic meter at 294 K (700F) would have a relative humidity of 50 percent."
Takata, A. N., Review of Fire Hazard Distances, IITRI Final Report J6194 for Armed Services Explosives Safety Board (Contract DAHC04-70-C-0013), April 1970.
Yates, H., Total Transmission of the Atmosphere in the Near-Infrared, Naval Research Laboratory Report 3858, September 1951.
34

u (U u aj e a /->
•H |>, u ^2 4J OJ D -H J-J O TJ (1)
■~~~ <H e M g § B y 8 ^n •H M 4=i 60 0) 3
> o O -H ^^. rH 4J u]
03 ^3 II H 3
OJ h C M (JO 0
•H 4J c •M 0 CM ni a) M a II •u u a <D a QJ P. 0 O ■H c o u O LO nj U w M
*J o d
CN 0) a o c o
J CJ
o CN
»
5
§ o M 0)
cn o
o o
o o ^J3
O O
>. •a o M o nj
o
n c o a
n • o .^-^ c -a- S ^~N
0) 'j 0) IH ^J ^ <U
M 4-1 Pi (3 QJ ^-^
(U m -
(D
^C M O 4J OJ o o [() X! O r_
O M-i e o
■u
M
JC 4-1
M
n o a< n e
C 0) O H
•H CO 4-1 W 03
•H S QJ en u a u « 3 M O
0) M 3
o o
o cc
o o o CM
(luaoasj) uorssTiusuFax
35

<u u (U 0
M a ^-s CJ
•H >. 4-J XI 4-J OJ 3 •H B a id ^^. •H o en g ■H g D 4^ 3 43 3 M U SO cu
> Cfi o •H g 1—1 4J en
Ri M II H
0) 60
c VJ O 0 Csl
•H i-i 4J C II Rj 0) M o C -U M 0 C a) •H a) c 4J o n) c c M o L^ 4-J
CJ ^-^ 5 O a
CM c X 0
H O >
C cu o u cu a
ro o
o ■H
RJ u 4J c tu o c o
o u
>, -O o fi
o M o o vO a
^ pp
u o
14-1
CO c o
o o in
o •H
CN
T3 c c
o o —, r^. o- H •
o
x a f» u 0) 60 OJ U-l C ^ 01 CJ 4-1 Pi
hJ 0) --'
'- W 4-' 0)
o cfl u o o fL, OJ o en ^ o
Pii CM en O "4-1 6 o u <C a)
>-i QJ 3
rC 4J 4-1 03
O M o <4-4 CU
CN o a c CU o H
•H en 4-i tn cd
■H e <u en o
o cC 3 o M o
H w
u-i
K 3 SO
•H pC4
O n
(ruiaDaaj) uoTssTuisuuax
36

Atmospheric transmissivity is important primarily for very large fires viewed from great distances. The experiments conducted under this program were relatively small and viewed by nearby radiometers. There- fore, in analyzing the experimental data generated, a transmissivity of 1 was assumed.
5.2 Geometric View Factor, FCL, P. X, 9)
As discussed in Appendix A, numerous techniques exist for accurately estimating the geometric view factor for vertical and tilted cylinders (approximating the shape of the flame). The view factor is based on the cylinder's length L, diameter D, tilt angle 9, and the distance from the cylinder to the target, X. Since the test series 5 experiments were conducted indoors with no wind, the tilt angle was always zero. In addi- tion the radiometers in the experiments were always far enough from the flame so that a rectangular emitting surface would be a good approxima- tion. For this view factor, Hamilton and Morgan (Ref 4) provide an equation, table and graphs for this view factor.
The configuration is shown in Figure 16. Hamilton and Morgan also give the view factor for a vertical cylinder, which would have been slightly more accurate but was not used in the data analysis. For the configuration in Figure 16, the view factor is computed using the follow- ing equation (Ref 4):
P-i X *- -1/ Y \ Y -li - tan ———I + tan
m2'
5•3 Flame Length, Flame Diameter, and Mass Burning Rate
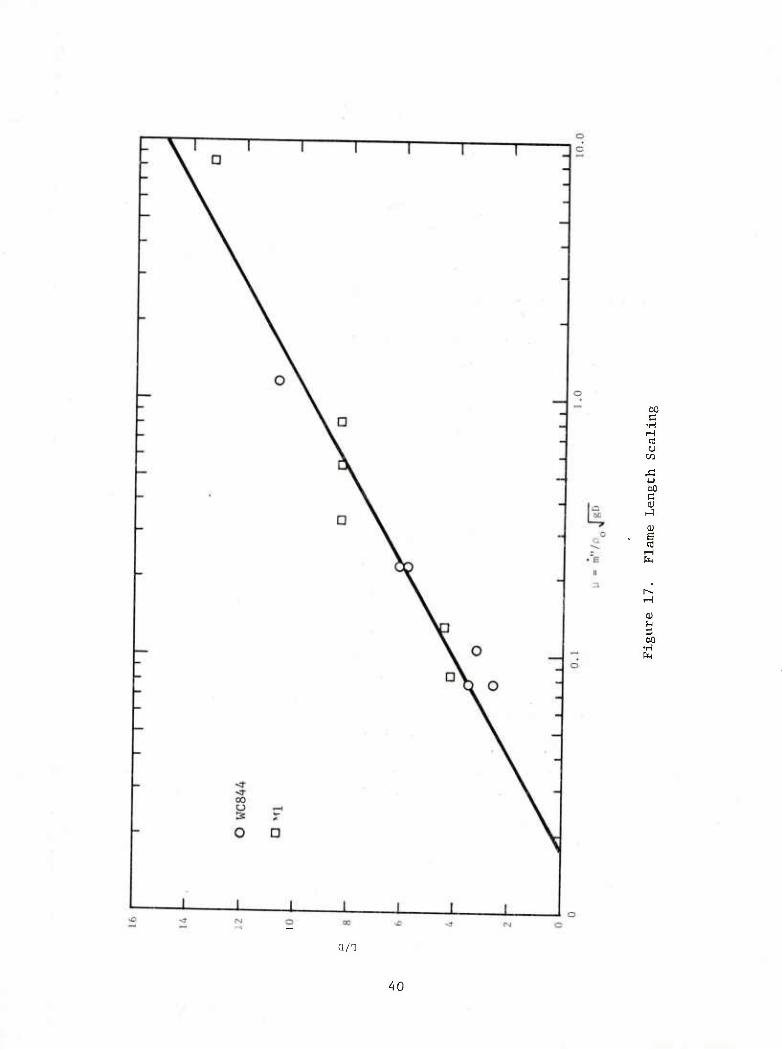
Flame length and diameter must be estimated in order to compute the geometric view factor. As discussed in Appendix A, the correlation param- eters of Thomas (Ref 5) for flame length are expected to apply to sus- tained propellant fires. Seventeen tests were completed in test series 5. The parameters relevant to scaling flame length are summarized In Table 11 for these tests and plotted in Figure 17. The correlation appears to work reasonably well, however flame diameter D was derived from test data rather than predicted. For the flame length correlation to be directly applicable, a technique for predicting flame diameter must be developed. The fuel pile diameter in itself is not adequate to corre- late the data, and a correlation for average flame diameter in terms of the fuel pile properties is currently not available.
Hamilton, D. C. and Morgan, W. R. "Radiant Interchange Configuration Factors", Technical Note 2836, National Advisory Committee for Aero- nautics, Washington, D.C., December 1952.
Thomas, P. H. "The Size of Flames from Natural Fires", 9th Interna- tional Symposium on Combustion, 1962.
37

Radiometer (Target)
Visible Flame Diameter = 2b
Visible Flame Height = a
Flames Projection
Define: X = - and Y = - c c
Figure 16. Configuration for Radiometer Viewing Flame in Test Series 5
38

TABLE 11. FLAME LENGTH SCALING
D (m)
• m"
m" L (m)
L D Test Material (Kg/s)
ul
(Kg/m2-s) Po gD
1 WC844 (0.64)* 0.272 (0.846) (0,274) (4.1) (6.4)
2 WC844 (0.61) 0.392 (1.34) (0.445) (4.64) (7.6)**
3 WC844 (0.85) 0.054 (0.095) (0.027)** ~g (10.6)**
4 WC844 (0.98) 0.099 (0.131) (0.034)** ~g (9.18)**
5 WC844 0.59 0.44 1.61 0.544 4.93 8.36
6 WC844 (0.6) 0.288 (1.02) (0.342) (4.2) (7.0)
7 WC844 0.162 0.267 12.95 8.35 2.13 13.15
8 WC844 0.48 0.163 0.901 0.338 4.0 8.333
9 WC844 0.32 0.144 1.79 0.821 2.71 8.47
10 Ml 0.47 0.536 3.09 1.17 >5.03 >10.7
11 Ml 2.0 1.36 0.433 0.079 >5.13 >2.57
12 Ml 1.98 1.28 0.416 0.077 -7.0 ~3.54
13 Ml 1.66 2.39 1.104 0.222 -9.7 -5.84
14 Ml 1.59 2.15 1.08 0.222 -9.7 -6.1
15 WC844 1.09 0.486 0.521 0.13 4.76 4.37
16 WC844 1.35 0.531 0.371 0.083 5.70 4.22
17 Ml 1.57 1.01 0.52 0.108 >5.14 3.27
* Parentheses indicate that the parameter value shown was inferred from other data and is not the actual data for the test.
** Questionable data and not plotted.
• g = 9.81 m/sec2 and p =1.23 Kg/m3
• D = average flame diameter
• m = mass burning rate
• m'' = mass burning rate per unit flame cross-sectional area
• L = visible flame length
39
s
a w
0) M 3
•H
a/'i
40
In addition to flame diameter, the fuel's mass burning rate must be known in order to use the Thomas correlation parameters. Figure 18 shows mass burning rate versus initial propellant weight for Ml and WC844 separately. A general trend is indicated in the figure, although considerable scatter exists.
5.4 Flame Emissive Power To predict the radiant heat flux from a free burning fire to a tar-
get, the effective emissive power of the flame is still needed. This is the product of the emissive power that would exist if the flame were optically thick, E^, and the effective emissivity of the flame £f. The effective emissivity is related to the attenuation coefficient of the flame gases, a, by the equation
-aD £f = 1 - e
When the fire's diameter and/or the attenuation coefficient are large the emissivity approaches unity, and the product £fEf approaches Ef. Thus, the parameters Ej and a can be determined from experimental data by plotting £fE£ versus D as shown in Figure 19. The data plotted in Figure 19 are summarized in Table 12. The flame effective emissive power was derived from narrow view radiometer records. It was difficult to relate the flame thickness, or diameter, to the time and location of the radiometer readings, which probably accounts for the considerable scatter in the data plotted in Figure 19.
In Figure 19, it should be noted that Ml and WC844 lie in two dif- ferent bands, in both cases still increasing with flame diameter at the largest sizes observed. The maximum emissive power observed in any test was 18.1 cal/cm^sec. To correlate the experimental data E^ should be determined by making narrow view radiometer measurements in even larger fires. For the present purposes, however, it will be assumed that Ej levels off at a value of 20 cal/cm^sec for both sample materials. With this assumption, the product GfEf was plotted in Figure 19. From the curves shown it appears that the attenuation coefficient for the Ml fires would lie roughly between 0.4 and 0.6 per meter and for the WC844 fires between 0.2 and 0.3 per meter, in both cases corresponding to the assumed value for Ejp of 20 cal/cm^sec. These values are used later in the discussion of the open-topped box fires (Section 7) to predict the re- sults obtained in test series 7.
5.5 Fire Plume Axial Gas Velocity
Five additional free burning fire tests were conducted under test series 5 to measure the velocity profile at the centerline of the fire column. Measurements were made using bidirectional velocity probes, described in Appendix D. The velocity profiles measured in these tests are plotted in Figure 20.
41

u
C
2.5 T—i—i—i—|—i—r T r "i—i—i—r
2.0
A Ml
O WC8A4 maximum value
D WC8A4 "typical" value
1.5
3 S3 1.0
X
0.5
m □ D a 9 j [ i i i i_ J L_L
5 10
Initial Propellant Weight (kg)
15 20
Figure 18. Scaling Trends for Mass Burning Rate
A2

20
15 —
CM E U
u
10 —
0
-
I 1 1
o Ml
1 1 1 1 1 ■ i i i i i
- + BP 0 -
- O a = 0.6
Ef = 20 ^
o o ^y^ "
— ^r —
- ^r a = 0.4 y^ Ef = 20^, X
-
/
/ ^^ a = 0.3
gyT Ef = 20 **
— ,
/ / / y^ a = o.2
—
/ y r O^^ Ef = 20^ ̂
_ A. /> X ^S^ _
- / / /
+ /^ -
~ A y r y^ Conclude:
~
"
/ /> / y ' for Ml use a = 0.4 to 0 6"
-
Uy y% for WC844 use a 0.2 to 0.3
-
J. '//x + -
f 1 1 1 1 1 1 1 i 1 1 1 1 1 1 0 1
D (m)
Figure 19. Effective Flame Emissive Power versus Flame Diameter
43

pei w H W
M
en & w > Pi
s o
w > M w CO H
s
w > H
O w
w
o
< < P
e
S o
a)
ed e
a) >Q <
6
S Pi •H
^0 I
■H
a
S
4J
a) H
CM r-l o <!■ o a\
00 ^D ro tH (N r— oo vo vo crs CO
vH CN i—I r—I O I—! I—I
•<r i—I LO 00 ^D s—. LO ^^DOOCTii-H VO-J-LOI—ICTs LTicnconCri 00 OC0LnCT\ ^Or—1^0000 LTli—I
COOO^-IO ^^v-'-^^x ^-'O O O O T—i CM ,-* r-l O i—I CN
-4" r~- O" ^o <|- on --(vo i—i
CM CM i^- CNI >X) m LO r~- co m to en CM vo en
O i-W OrH
m ON r^- en M r~- r^ o -ct- o
r^ en in r^ oo oo ■<)■ vo o oo r-- ^ i—i i—* vD O LO
00 O CN CM
O O CM oo oo r^ oo CM <)• oo
-j-r^. v£> r-^cOi—ICMCO ooro vOOOvDCO<t c^-<fuo^o>x> CMa\LrilJ-iO ^DUD
VO^D-J-OO^D LriO<t-i—ico cMr-iLnLor-- ooi—I
CM <t"CMvD VDOCO CO0O(^00i—I <D 00 COtNI^I^i—I -d-CMI^LOCO i—!0Oi—lr--nH CMCM
VOVDOOOLO LocM-j-cnr^- OTr^ooooun ^or--
<t i—I LO oo c^ ^o 'X; oo a-, en
CM ^>JD oo csi r>H
AD rH <)" CO <|- oo ^D CTN a>
o c^ vo LO o LO r~ CO LO
OOOOO OOOOO CNJ iH i-l r-H rH
r^ oo o o
CM CM O O r^- CT\ I i -<!- CM co <r a> <)-
• • LO ON • OOOOO
o o
oo r-^ co <)■ >X) 00 ^O VO <1- 00 tN CM I—I rH LO
^X) 00 CTi LO 00 CO CM CO r-l <1-
CO i—I LO o
OOOOO r-li—ICMCMO Or-I
CM r-~- co o ^o CM >X> r-l O 00 CM r~- LO CM o
^o o <t o o oo <t LO CM vj- O CO v£) o O
O LO o o o o o co r^ <D ^D r-^ r^ i—I r^ 'Xi LO 'O ^o cs) co
LO <r 00 rH <j-
-d- <1- <!■ ^ <t -* <f -d- <t <)- 00 00 CO 00 CO U CJ> CJ u u ^ s s :s ;s
■<t-i—ICN LOLTiOLOO C0<t-
oo oo oo oo S O CJ U CJ -H t-H i-t iH iH O S^Ds^sS s s a s &
co
ICMCO<1-LO ^Ol^-OOC^O i—ICMC0O-IO vOr^
44

u n
u o
>
^
20
18
16
14
12
10
T r i 1 r
8 -
J L
11,804 gm Ml
26,673 gm WC844
3,519 gm Ml
11,464 gm WC844
3,973 gm WC844
1_L 3 4 5 6 7
Distance Above Fuel (m)
10
Figure 20. Free Burning Fire Axial Velocity Profiles
45

5.6 Flame Temperature Profile Along Centerline
Flame temperatures were measured along the fire column centerline during the 17 primary experiments of test series 5. These temperatures are plotted in Figure 21 versus the distance above the floor. The pro- files all have the same general shape, but better correlation would be expected if a more proper scaled distance were used. In Figure 22 the data are replotted using the parameter
/Z\,'0.4
instead of height above the floor. This scaling parameter was based on the expression from Hottel (Ref 1) given in Appendix A for natural con- vection jets:
T - T = ,-5/3
.(!)
where T0 is the ambient temperature, q is the energy flux, P is the gas density, C- is the specific heat, g is the gravitational constant, r is the radial distance from the jet's centerline, and z is the height above the base of the fire. Since we are only concerned with centerline tem- perature profile at this time, r will be zero and the function f^(r/z) will be a constant. The gas density is inversely proportional to temper- ature and can be moved, as temperature, to the left side of the equation. Specific heat (approximately) and gravity are constants, and energy flux
q is assumed to be proportional to be mass burning rate m. Thus, Hottel's expression yields
f(T) = Cm ;2/3 7-5/3
or equivalently
f(T) = C,m2/3/(^)5/3
The reciprocal of the lumped parameter on the right (to the three-fifth power) is then found to be the parameter used in Figure 22 to improve correlation of the flame temperature data.
Berl, W. G., editor, op cit, 1961.
46

c
^o
LO
cn
w a)
^4 •H IM 0 M fe QJ U 3 u 1
s~\ U e 0) •~-' a u (D o H o
r-J 91 fn a
•H 0) H > M o it ja iJ < 0
a) OJ u o fl u rd g 4J ^J W H
•H fe Q
CM
O o o O O o
J 0
o
a) u 3 00
()}) 9an5T?j;9dra3x auiBXJ
47

2000 r~
^
u 3 4J CB S^ 0) a B OJ H
I rH
1000 -
Z 1 L '0.4
m
Figure 22. Flame Temperature versus Distance Above Floor
48
6. ENCLOSURE FIRE SCALING (TEST SERIES 6)
The objective of test series 6 was to evaluate scaling models and instrumentation for characterizing the potential for harm from enclosure fires, i.e., munitions fires inside of storage structures (buildings or igloos). The major concern was with targets outside of the enclosure. Harm to these targets could result from radiant heat transfer from a flame exiting an opening in the enclosure, from impingement of such a flame onto a nearby structure, and by firebrands. To evaluate the poten- tial for harm from radiant heating, the flame's heat flux must be measur- able and scalable. To evaluate the possibility of flame impingement, the flame's geometry must be known, primarily flame length and lift angle. For predicting firebrand trajectories, the fire must be characterized in terms of gas velocities and the temperature profile.
The experimental arrangement is shown in Figure 23. A 208 liter (55 gallon) drum was used as the enclosure. A 10.2 cm x 10.2 cm (4 inch x 4 inch) or a 20.3 cm x 20.3 cm (8 inch x 8 inch) square hole was cut into one end of the drum to represent the ventilation opening. A pressure transducer for measuring chamber pressure was at the opposite end of the drum, and a' thermocouple probe for chamber temperature entered through the side of the drum with the junction 6.35 cm from the wall and 12.7 cm back from the opening in the end of the drum. The sample material (Ml or WC844) was poured forming a cone onto a platform inside the enclosure. The platform was connected to the scale beneath the drum by means of a vertical rod as shown in the figure. This setup for monitoring mass loss rate was found to stick much of the time making the mass loss rate data meaningless. Therefore, the initial sample mass and event duration were used to give an overall mass loss rate to help interpret the experimental results. Ignition was accomplished with a hot wire at the top center of the propellant pile. The flame emerging from the opening in the drum was viewed by a video camera and instrumented with a platinum-rhodium thermo- couple 0.61 m in front of the opening. A bidirectional flow probe was placed 2.54 cm in front of the opening. A narrow view radiometer was offset from the axis of the drum at a 30 degree angle and was positioned to look directly into the exit opening. A wide view radiometer directed perpendicular to the drum's axis was placed 1.12 m above the floor, 2.44 m in front of the exit hole, and 3.05 m to the side of the drum's axis, i.e., viewing the flame laterally at a distance of 3.05 m.
A total of 45 enclosure tests were completed using Ml propellant and WC844, These are summarized in Table 13. The chamber pressure did not increase significantly during these tests. Therefore, the rocket analogy discussed in Appendix B was determined to be inappropriate for scaling. Rather, the more conventional room fire scaling techniques would be more suitable, particularly for evaluatinng conditions inside of the enclosure.
49

Coupling Rod for Mass Loss Measurement
Square Hole Sample Material
Narrow View Radiometer
Transducer
gal,) Drum
Figure 23. Enclosure Fire Test Arrangement
50

TABLE 13. SUMMARY OF ENCLOSURE TEST RESULTS
Sample Mass
esc Material Cg»)
1 M-l 100 2 M-l 100 1 M-l 200 4 M-l 300 5 M-l 400
6 M-l 500 7 M-l 800 8 M-l 1200 9 M-l 1600
10 WC844 500
11 WC844 800 12 WC844 1200 13 HCS44 1600 14 WC844 2000 15 WC344 1000
16 WC844 2400 17 WC844 3000 IK WC844 3300 19 M-l 1800 20 M-l 1800
21 M-l 1800 22 WC844 500 23 WC844 1000 24 WC844 2000
Active Active Maxinmm Burn Burn Chamber
Vent Time Rate Pressure Size (sec) (kg/sec) (psifi)
Maximum Chamber TC 9
Temperature 0.6lTn (K) (K)
Narrow View Radiometer into Hcle
(cal/cm^ sec)
Wide View Radiometer 0 3.0^m
(cal/cm^ sec)
26 M-l 1200
27 M-l too
28 M-l 800
29 M-l 1600
30 WC844 500
31 WC844 1000
32 WC844 2000
33 WC844 3000
34 WC844 500
35 WC8i.4 1000
36 M-l 400
37 M-l 800
38 M-l 1200
39 WC844 2000
40 WC844 1000
41 WC844 500
42 M-l 500
43 WC844 3300
44 M-l 1800
45 M-l 1800
3.0/ ---/ll.O 6.0/13.0 5.0/17.0 9.0/24.0
18.0/34.5 0.028 23.0/36.0 0.036 18.0/30.0 0.066 15.0/28.0 0.107
9.0/40.0 16.0/50.0 25.0/50.0
25.0/25,0
8.0/23.0
10.0/22.0
0.033
0.033 0.060 0.044
0.056 0.063 0.080
21.0/21.0 0.038
0.048
0.050
0.08
.0/28.0 0.083
11.0/30.0 0.091
20.0/42.0 0.1
'54.0
/65.0
4.0/41.0 0.1
6.0/40.0 0.133
27.0/33.0 0.044
20.0,22.0/ 72.0
7.0.20.0/ 65.0
0.048
0.03 7
8.0.22.0/ 49.0 7.5/22.0
0.017
0.067
28.0.19.0/ 72.0
0,07
10.0,28,0/ 47.0
12.0,28.0/ 40.0
0.047
0. 045
0.2 0.223 0.491 1.62
0.134 0.195
^0
0.096
0.076 1.042 1,0 2,027 1.441
^2.8 0.265
0.127
0.079
0.535
0.139
0.223
1.711
0.184
0.223
0.223
0.223
0
0
0
0
0
0
0
0
0.014
0
1416 1615 1597 1466
546
1542 1633 1564
1778 1796 1834 1678
1767 1588 1588 1678 1446
1396 1470 1765 1851
■2093
1446Cpk) 1494(Dk) 1508(pk) 1108(cyp) 1013(pk) 781(typ)
1928(pk) 794(typ) 1064(pk) 875(typ)
1332(pk) 976(tvp) 1360(pk) 954(1; vp) 1178(pk) 723(typ)
1139(pk) 894(typ) 1204(max) 1064Ctyp) 1426(max) 1148(tyo) 1301(pk) 1009(typ) 1483(pk) 1130(typ)
1310(pk) 969(cyp) 1191(pk) 1130(typ) 1250(pk) U03(typ) 1389(pk) 1157(typ) i494(pk) l,079(typ)
1319(pk) 992(typ) 1355(pk) 945(typ) 1213
(hump/nk) 1225
(hump/typ) 1376(pk) 908(Cyp) 1392(pk) 969(typ)
2040
1834
1988
1324
17.39
1834
1877
1494
1691
1678
11.54
1105
•'651
1504
1573
1765
1722
»2 2 2 2 2
79x10" 55x10" 87x10" 61x10" 31x10"
3 3 3 3
1 3 7 7 2
78x10- 61x10" 96x10" 96x10" 71x10"
3 3 3 3 3
2 2 1 5 2
55x10" 55x10" 03x10" 32x10 83x10
3
I 2.1xl0-2
7x10⁻³ . 3.03X10⁻¹
>=2.9x10⁻² '^5.7x10⁻²
5 3 I 1
57x10 22x10 17x10 02x10
■2 3 2 2
4 08x10 ■3
4 71x10 ■3
3 184x10"
3 82x10 •3
2 .93x10 -3
7 55x in
3 55x 10' 3
3 82x 10' 3
3 44> 10 3
3 98x 10" 3
5 25x 10' 3
6 37x 10 3
5 48> 10 3
4 46> 10 j
4 04x10 3
2 93> 10 3
6 69x10 •3
5 73x10 -3
•3 (o
.lO"2
Ef sea 13x10 V
4xl0-3 , 1.2X10"2, 2.68x10"^ 3.2x10⁻²
1.6x10⁻² 2.4x10⁻² 4x10⁻² 4.8x10⁻²
2 1 1 2 1
4x10⁻² 66x10-2 92xl0-2
4x10⁻² 22x10-2
2 2 3 2 5
18x10"? 75x10-2 04x10-2 88xl0"2 44xl0"':
5 5 1 2
92x10':: 12x10-3 15x10";; 14x10"^
3 84xl0"2
4 74xl0"2
2 5xl0"2
3 46xlO"2
4 48xl0"2
4 8xl0"3
1 82xl0'2
2 .34x10"'
2 .64xl0"2
6 4xlO"3
1 .44xl0"2
8) 10"'
0 164
3 68x10
1 92x10
1 22x10
5 86x10
0 138
0 21
0 212
51

Test results for chamber temperature are summarized in Figure 24. The plotted data points were obtained from thermocouples and the range of values inferred from the narrow view radiometer is also indicated on each plot. The graph for WC844 with a 20.3 cm hole shows the radiometer data plotted along with the thermocouple readings. The agreement was quite good in that specific case but was not always that good in the other tests.
Figure 25 gives a similar set of curves for the flame temperature 0.61 m in front of the drum exit hole. The temperatures outside of the chamber were somewhat higher than inside the drum, indicating additional oxidation in the flame once air was made available. In several of the tests, the base of the visible flame separated from the drum by about 0.76 m, again indicating incomplete burning inside of the chamber.
Several additional tests were conducted to measure the exiting gas flow velocity (for firebrand lofting considerations). The results are summarized in Table 14. The measured velocities ranged from about 8 to 158 m/s for Ml and 15 to 145 m/s for WC844. A scaled velocity was used to correlate the data. The scaled velocity is based on the assumption that the exiting gas flux is equal to the mass burning rate of the pro- pellant, i.e., steady state with constant chamber pressure. Then based on simple continuity and perfect gas law relations, the exit velocity can be shown to equal
m R p T c c
u ■ — 6 A M p P
e e c
where m is the exit mass flux, R is the universal gas constant, M is the gas molecular weight, pc is the chamber gas density, pe is the exit constant gas density, Tc is the chamber temperature, Pc is the chamber pressure, and Ae is the exit area. Since the chamber pressure remains near ambient during the tests and the gas density is not ex- pected to change substantially between inside the chamber and the exit plane, it is expected that the following relation should be approxi- mately valid:
• mT
u = C C
e A e
where C is a constant. Therefore, a new scaled exit velocity is defined
u / 3 u * - e ' m
e /mT \ \kg Kj
This is the constant C in the earlier expression. As shown in Table 14 the scaled exit velocity was found to be about 0.033 for Ml (except for the very first test with a small quantity of material), and 0.012 for WC844.
52

(y) ajniBjatltuaj, aaqmeij^ (^) ajn^easdiuai jaqmeqo
"1 < 1 < 1 r
I 1
u 3 4J nj U a) &
H U
I U
CNi
Q) U
_l I U
()j) aaniej^diuo^ .i.iqaipqj (X) aaiUBjadwaj. uqmmu
53

0 •H a
o 0)
3 o
u a w
O
o M
a •H
H
(^) sjinujrfduisi ^mc[j CH) .uinfjj.ttltinj JIUVIJ
4J cd
i i i 1 1 1 p 1 r
I—h 1—_J 1 1 1 ,__j_
"1 1 1 r
a) U 3
m u a;
s H
a
1---!
u 3
•H
-I 1 1—k-J—I 1 I . I
i.) 'jn]fJ.»tlu^| -HUL'U H, ..Jin^J'duMI -WH-IJ
54

TABLE 14. ENCLOSURE TEST EXIT VELOCITIES
Material Quantity (gms)
Exit Size (cm)
Exit Velocity
(m/s)
Scaled Exit Velocity (m3/Kg-0K)
Ml 500 20.3 x 20.3 ~8 -0.0037
Ml 1800 20.3 x 20.3 57 0.037
Ml 1800 20.3 x 20.3 44 0.028
Ml 1000 10.2 x 10.2 158 0.035
WC844 1000 20.3 x 20.3 -15 0.011
WC844 2000 20.3 x 20.3 23 0.014
WC844 2000 10.2 x 10.2 145 0.011
To predict radiant heating from the flame emerging from the enclo- sure, a simple "point source" model was tried. The emitting surface model discussed in Section 5 for free burning fires would also be appli- cable here and could give better results than the point source model since the configuration would be represented more realistically. How- ever, the point source model was evaluated here to see if simplicity could be gained. The point source model is discussed in Appendix A, giv- ing the relation for radiated heat flux impinging on a target at distance X from the source:
q c "T X
The heat flux data from the enclosure tests were used to compute the con- stant C. The data are plotted for Ml in Figure 26 and WC844 in Figure 27. The correlation is quite poor in both cases, probably because of the configuration not being accounted for accurately enough and m being only approximated.
Finally, the flame configuration was considered. Thomas' correlation parameters were used again to correlate data for flame length (see Figure 28). In this correlation the parameter D is the exit hole diameter (based on equivalent areas) and y is given by
y - m
P A a e
where pa is the ambient air density and Ae is the exit area. The data fall in a clear band but probably would have had less spread if better mass loss rate measurements could have been made.
55

10
oo
td o
10'
10
1 I 1 I 1 1 -— - - - -
- -
— —
-
+ t -
— -
- -
- + + _ + -
+
+ + + + -
_ + + + —
+ wm
... 1 t .—___ _J 1 ._.. 1 1 .,.,._ 1
1000 2000 3000
Initial Sample Weight (gm)
4000
Figure 26. Point Source Model Constant for Ml
56

10" i r r 1 r
00
o u
10 —
10
-
o
o o
0
—
o
— 0
J 1 1 1 1 1 1 1000 2000 3000
Initial Sample Weight (gm)
4000
Figure 27. Point Source Model Constant for WC844
57

100.0
•H
cu 10.0
1.0
1 1 1 1 I I I I | 1 1 1—| I I M_
+ Ml
o WC844
0.1
+ ° 0
+ + O —
J i i i i 11L i i i i i i 11 1.0
y
10.0
Figure 28. Flame Length Correlation for Enclosure Tests
58

Finally, an attempt was made to correlate flame lift angle (j) using the model discussed in Appendix B. In that model the following relation is derived:
;an $ R
where Gr is Grashof number, R is Reynolds number pa is the ambient air density and Pf is the flame gas density. A parameter C was derived to be proportional to the dimensionless group to the right in the above equation.
where If and Ta are the flame and ambient temperatures respectively. The test data for (f have been plotted against E, in Figure 29. The correlation in this case was totally unsuccessful. This may have been due to the strong need for subjective judgement in reading flame tilt angle from the video records. The flame tip was difficult to define and moved vertically considerably during the tests.
59

— —i— 1 r 1 —-r 1 J1 t M
- -
: + :
- o + + -
- °? -
^^^
+ ■^
— + —
- + -*+ -
—
o
o +
^
_ _
- -
- 00 O + -
+
1
o
1 i 1 i 1 1 1
CN
0) co
o
o
o o
u
QJ
u
03
en
v >
&0
M-l ■H
01
PL(
CN
0)
3
■H
O in
o o O CM
(8ap)(
60

7. OPEN TOPPED BOX FIRES (TEST SERIES 7)
Four tests were conducted with open topped propellant shipping/stor- age boxes (Ml and WC844, two tests each) to characterize the hazard imposed by propellant burning under this condition. The test setup is described in Figure 30. Mass loss rate was recorded with the same force transducer-lever arm arrangement used on previous tests. A radiometer was placed at 15 or 7.6 m to monitor radiated heat flux. Each test was documented using a video camera.
The two Ml tests resulted in the same sequence of events. First, a short flame appeared out of the box top. This was replaced by a jet of smoke. After several seconds a flame reappeared with side jets indicat- ing leakage at the box top-box body interface (see Figure 31). This flame slowly died down and eventually disappeared. With WC844 the se- quence started with a short flame. The flame intensified until a "woosh" sound was heard corresponding to the box top blowing off. Then a large flame appeared. This would die down and intensify for several cycles before the propellant was consumed. Quantitative measurements taken dur- ing these t.ests are summarized in Tables 15 through 18.
Using the emitting surface model for free burning fires discussed in Section 5 along with the values for optically thick flame emissive power Ef (20 cal/cm2sec) and attenuation coefficient a (0.5/m for Ml and 0.25/m for WC844) derived from the test series 5 experiments, the radiant heat flux to the radiometer was predicted for each of the tests. The results are summarized in Table 19.
61
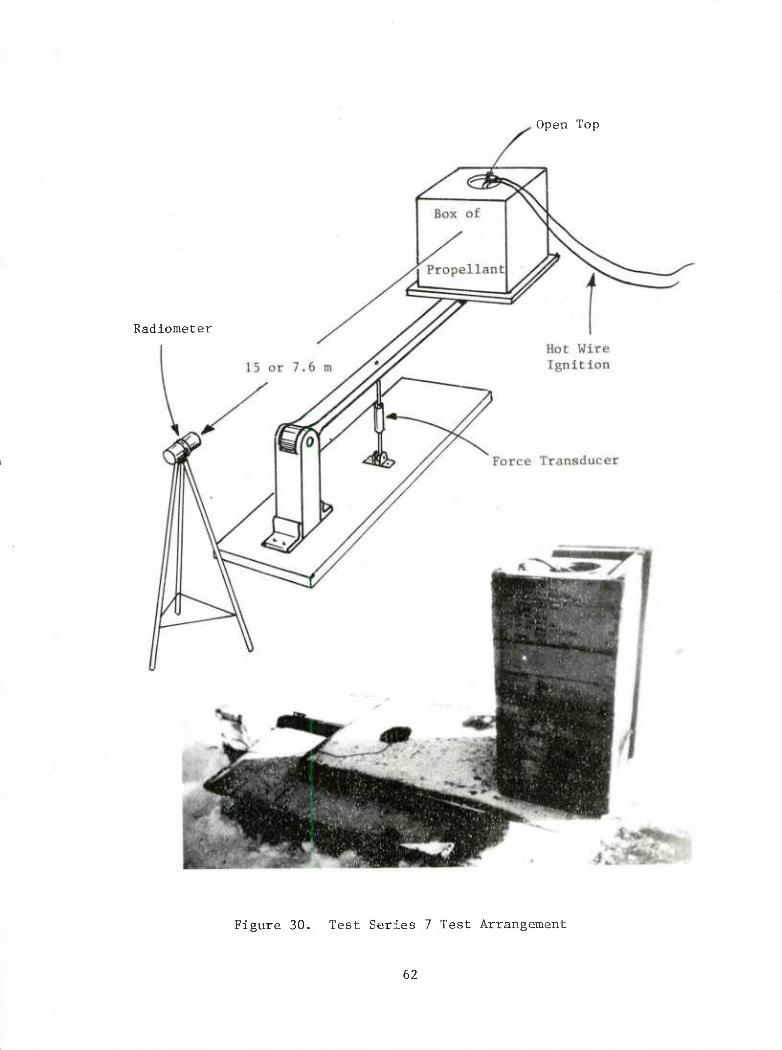
Open Top
Radiometer
Figure 30. Test Series 7 Test Arrangement
62
w o H
X o
pa
o :-
^
BJ a
■H a
0)
•H
63

TABLE 15. SINGLE OPEN-TOPPED BOX OF Ml (TEST 1)
Weight Loss Rate Data
initial weight = 70 Kg (50 Kg propellant)
weight loss rate while top of box was still in place m^ ~ 0.79 kg/s weight loss rate after top of box blew off mv ~ 2.49 kg/s final weight = 16 Kg
Heat Flux Data at 15.2m
• 1 *.. 0-065 (Pk) i / 2 while top of box was In place q = „ „,,., I -. cai/cm sec
2 peak, near time box top blew off q1' = 0.101 (pk) cal/cm sec (linear ramp down to zero after peak occurred)
Event Duration (based on weight loss curve)
while top was in place T ~ 12 sec
after top blew off T ~ 22 sec
total event duration T ~ 34 sec
TABLE 16. SINGLE OPEN-TOPPED BOX OF Ml (TEST 2)
Weight Loss Rate Data
initial weight of assembly M = 70 kg (50 kg propellant)
early weight loss rate, 1.74 kg/s
late weight loss rate, 3.5 kg/s
final weight = 19 kg
Heat Flux Data at 7.6m 2
early 0.025 cal/cm sec
nesk I0'043 (tyP Peak) P 10.05 (actual pk)
Event Duration (based on weight loss curve)
T n = 36 sec total
64

TABLE 17. SINGLE BOX OF WC844 (TEST 1)
Weight Loss Rate Data
(box fell off scale during test)
initial weight = 90 kg
Heat Flux Data at 7. 6m 2
first peak = 0.326 cal/cm sec 2
second peak = 0.132 cal/cm sec 2
late time typical = 0.025 cal/cm sec
Event Duration
first peak = 9 sec
second peak = 3 sec
total = 48 sec
TABLE 18. SINGLE BOX OF WC844 (TEST 2)
Weight Loss Rate Data
initial weight = 90 kg
late time rate = 1.41 kg/s
final weight = 22 kg
Heat Flux Data at 7.6m 2
initial peak = 0.423 cal/cm sec 2
late time typical = 0,034 cal/cm sec 2
late time peaks = 0.081 cal/cm sec
Event Duration
first peak = 7 sec
late time (after first peak) = 48 sec
total = 66 sec
65

TABLE 19. PREDICTION OF OPEN-TOPPED TEST RESULTS BASED ON EMITTING SURFACE MODEL
Test Predicted Heat Flux
(cal/cm^ sec) Measured Heat Flux
(cal/cm sec)
Ml (test 1)
Ml (test 2)
WC844 (test 1)*
WC844 (test 2)
0.156
0.064
1.42
0.39
0.101
0.05
0.326
0.423
* The box fell over during this test.
66

8. SUMMARY OF PHASE 1 RESULTS
The experiments that were accomplished during this program demon- strated a wide variety of fire phenomena. To some extent, each material- packaging combination responds differently when involved in a fire. In all cases, however, the primary mechanisms for doing harm to persons or property in the vicinity of the fire are by radiant heating from the flame and by firebrands. The radiant heating hazard is characterized by peak heat flux for sustained fires and by pulse energy for short bursts. In most of the experiments that were conducted under this project, even for fireballs, the event duration was long enough that heat flux is prob- ably the more appropriate parameter. For firebrands, the farthest dis- tance that significant* firebrands can reach characterized the hazard. In Figure 32, the peak heat fluxes (scaled to 10 m from the source) that, were observed in each type of test are summarized using a bar graph to indicate the overall range of the data with individual data points repre- sented as circles. The bar chart indicates that the fireballs observed during the single and multiple box propellant tests pose the greatest heat flux hazard. Sustained flames from open topped boxes and fireballs from ALA17 candles and rocket motors have much smaller projected flame areas than the propellant fireballs and therefore cannot transfer the heat to a tiarget as effectively. Within the propellant single and mul- tiple box tests, the individual events were quite similar. Slightly higher heat fluxes were recorded during the multiple box tests probably due to more events occurring (larger data base) with some reinforcement between events.
A similar bar graph is given in Figure 33 for firebrand distances. In the figure, the cross-hatched regions of the bars represent the dis- tances within which most of the firebrands were discovered. In many cases, the firebrands clearly demonstated their ignition potential by igniting the surrounding grass and leaving a 'targe burned area.
* The word significant implies that the firebrands are potential ignition sources for "real world" host materials.
67
2.5
0) pe
a)
2.0
1.5 rOi
1.0
0.5 —
rOi
o
rOi O
o
rO-i
o
o rOi
rOi o
.-H X 6C 0 C M
•H CO C
01 -H 0- a c
oc C
•H CO
X -4 O S PO
—I o
X
o 0
0) CO 0) ^H ^a- rH <t oc c <r 00 -4- C 0) 00 C oo H a c; •H CJ uv o S U3 3
—. oc < C X J M O < ^ oa
X o
< s
4-J y) a) ^ ^ o o o
Figure 32. Comparison of Heat Fluxes
68

30
OJ M •H
i U
u-i
dJ O
4-' W
■H P
20
10
Note: Shaded area indicates distances where most firebrands were observed.
rz
XA
n
7
,/
^
rOi 1-°"
7"
PS O
X X P5 x o o 0 ,0 rC v & •H ^r •H r- rH r^ -H ■u «* 4-! -H SO ^H u ^H 00 H < fl < H
--i 3 CJ y J -H i-5 =• SI s 12 S O co <l sa
Figure 33. Comparison o f Firebrand Distances
69

9. REVIEW OF PHASE 1 AND RECOMMENDATIONS FOR PHASE 2.
During phase 1 (the current program), analytical and experimental techniques were evaluated for characterizing thermal output (radiant heat and firebrands) produced by rapidly burning arrays of combustible ma- terials packaged as in storage and shipment. An important aspect of phase 1 was to identify the phenomena and parameters that dominate the thermal output. Idealized experiments were conducted with small piles of bare propellant inside an enclosure and in the open. In addition, indi- vidual boxes or stacks of boxes of munitions were burned in the open. With Ml and WC844, the boxes in a stack of eight burned with little interaction in much the same way as a single box burned, i.e., as a pres- sure burst producing a fireball. Bare propellant (the individual item in this case) produced a sustained fire plume. Increasing the size of the stack to greater than eight boxes or changing the stack configuration would not be expected to increase the interaction between boxes with these materials, although this has not been verified. The effect of an enclosure on such a stack of boxes is yet unknown.
ALA17 candles (flares) burned individually with very little interac- tion in single box tests. In the single box tests, flares would escape from the box. and burn as a white ball of flame running around on the ground or flying through the air. In a stack of 12 boxes of flares, significant interaction was observed. Apparently, the flares could not escape as easily from the stack. Interacting in larger quantities, the ALA17 candles produced a large churning mass of fire spewing out burning incendiary like snow. It is not known whether the ALA17 candle would act differently in even larger stacks, but a significant transition was observed even at the sizes tested during phase 1.
The 2.75 inch rocket motors, conversely, did not show any change in phenomena when tested individually or in a stack of shipping containers. In all the cases, the motors blew out the end that would accommodate a payload and either burned in place or on the ground nearby, typically melting one end of the metal tubes that made up the shipping container. Based on the tests conducted during phase 1, it appears that the rockets would not act differently in larger stacks or different stacking configu- rations, but the stacking configurations for the rockets were small and fixed. Therefore, conclusions relative to larger stacks of rocket motors and other configurations should not be implied at this time.
Only four materials were investigated during phase 1. These were studied in very few stacking configurations. A wide variety of other munitions items, packaging materials, and stacking configurations are possible and could produce event phenomena not uncovered in the phase 1 tests.
Based on the results of phase 1 and the original overall program plan, it is suggested that the parameters which influence the radiated
70

heat flux and firebrand production be investigated in an experimental parameteric sensitivity study under phase 2. Emphasis in this study should be given to the effects of varying the fuel package size, geometry and arrangement of individual items within the fuel package. The objec- tive of phase 2 should then be to determine the minimum test size from which meaningful results can be obtained and to determine whether scaling of test results is valid when scaling to "real life" dimensions.
Therefore, the major effort in phase 2 should be the experimental parameter investigation. These tests should be conducted with stacks in the open and inside of an enclosure, such as a small igloo or a special test structure. Variables for these tests would include the stack height, stack width, stack depth, spacing between boxes, and the item arrangement within the boxes. As an example of item arrangement, WC844 could be tested in its bulk form (as during phase 1) and compared with tests with WC844 in cartridges. These tests should be done in larger stacks than used during phase 1, perhaps up to 5 or 10 boxes laterally and the actual storage, stacking height. Even larger stacks can be simulated by surround- ing the stack with a barrier on three sides as was done in the phase 1 multiple box tests.
Selected tests with several materials not used in phase 1 should also be donfe to assure that the investigation is not being biased by the four basic sample materials. The four materials used during phase 1 should be the primary materials used during phase 2 so that extension and correlation of results can be accomplished.
A series of experiments using ALA17 candles should be designed to provide a better understanding of the factors that influence the transi- tion from independent item burning to strong interaction. The ALA17 can- dles are suited to this type of investigation because such a transition was observed in relatively small-scale experiments during phase 1.
The interaction of the fire with a storage structure to produce firebrands has not been investigated as yet, particularly when the fire consists of a series of pressure bursts resulting in fireballs. In con- ventional structure fires, firebrands are produced by the convective gas flow pulling off looser construction materials and lofting them by aero- dynamic drag. With munitions fires it is likely that pressure bursts resulting in fireballs will lessen additional larger pieces and loft them. Thus the firebrands could be stronger igniters, but may not be thrown as far as by more conventional large building fires. It is sug- gested that several enclosures, perhaps about the size of a small garage, be built with selected different types of construction in order to deter- mine how firebrands are generated by the interaction of the structure with the fire within, and to determine the severity of this problem. In support of these tests, analytical techniques for firebrand lofting should be extended to lofting by pressure bursts inside enclosures and in free air.
71

During early phase 1 testing, it was observed that the wind caused shortening and thickening of the fire plume during the burning of piles of bulk propellant. This phenonenon should be better understood so that its influence on conclusions reached from tests under no-wind conditions can be incorporated into the ultimate procedure for specifying safe sepa- ration distances.
Finally, the effect of ignition type, size, and location on the fire buildup should be investigated. The majority of the experiments of this type would involve sustained liquid hydrocarbon pool fires of different sizes in several different selected locations corresponding to "real world" scenarios. A standard corner fire leading to room flashover should be included in the enclosure ignition tests. This scenario would result in fairly uniform heating of much of the munitions stack and may cause nearly simultaneous ignition of many boxes in the space.
The tasks described here for phase 2 are quite important in defining the final series of tests used to specify safe separation requirements. The final test procedures must be relatively simple and involve as little material as possible. For this reason, phase 2 must be designed to determine the minimum allowable stack sizes for such tests, the suitabil- ity of the proposed scaling techniques for characterizing the actual full- scale potential for harm from small tests, and the sensitivities of the various influencing parameters on the test results.
72

APPENDIX A
SCALING RADIATED HEAT FROM FREE BURNING FIRES
free burnLTfS ^t 8C*™io* "^ —t be considered is the uuLiixng rire. ihis can be vlpwprl ac -■ a-^^i c ■ . ing out in the open and becoming lilted Quite alo^fT f^" been done on free hur-ni™ f • i-guicea. Quite a lot of work has
be reviewed^f wSou. be^re^is^W ^ L^^ ^ ^ suggested for our application! d;LSCUSSinS the scalxng techniques
A'1 Pertinent Literature
^zinsiLir^Tu1 "T0hdi-1hL<rall^) ifirst a"roa^ ^
problem In o^d" to Iden"! ^^-"".'T5 "^ ^""^ the
pertinent. As an Lampl 'St e eSKd th! P"""""8 "hICh are
tlon Jets and fonnd that the ti^rature flSd ToTl/L'^"1 ""'"^ F^LdLure rxeid could be represented by
/ q \ 2/3 /To\l/3 T"To = (pCpj i^j Z'5Jf3(f) (Al)
where terms are defined in TAMP 9n T JJ • . transfer effects can S mLlf I u i" addltlon, radiative heat ej.j.eccs can be modeled by keeoins the fr.n^rT-» constant: *«Bping tne tollowxng parameter
a(T4 - To4) f (e's, KZ? shape)
(PCp)2/3 (qg/ToZ)
1/3 (T - T ) (A2)
1 Berl, W. G. editor, op cit, 1961,
73

TABLE 20. TERMS FOR DIMENSIONAL ANALYSIS (from Ref I)
FORCES
{V - volume; M, r = velocity)
1. Momentum, such as puM and pu'V/r "V-1
2. Viscous stress X area, pAidu/dx) M£« 3. Turbulent stress X area, pvlA (du/dx) "'pi 4. Buoyancy, V(p - pa)g ^Hp - p.)g 5. Pressure-area "*■ 6. Surface tension '*; 7. Friction: various formulations, including CiAu'p/l (Cd){L « p)
MASS RATES (Applied to component «)
10. Transport by convection or bulk-flow, uApfi L2upf, 11. Molecular diffusion rate, -ADip{df,/dx) LDipJi
[Gas diffusion, *)<« T8'3//;; Pore diff'n, Di « T1'2] , , /D ,_ 12. Turbulent transport, -ADrpidfi/dx) L}upU(Re) "
[CT a D/C^e)-"; n « 1, and often ignored*] 13. Chemical reaction rate in a volume, Vkiipfi)" • • • L'k.ipf,)'
, [fr. - k'^-sjKT. Bi - mass reacted per unit volume and time, or per unit mass cone, = i(p/i)" " 'I Tit if
14. Chemical rate, gas with a surface, Ak.ipfi)" L k,{pfi}" 15. Unsteady-state concentration change, Vpdji/dt L'pjjl
ENERGY RATES 20. Convection or bulk-flow
a) of sensible energy, AupCPiT - To) ^1 » ~ b) of chemical energy (species »'), AupfiHi LPupfiHi
21. Conduction, -^X(dr/dx) ^L{T - T.) 22. Turbulent transport _ r, ,T r^
a) of sensible energy, -Avlcp(dT/dx) L*upcPU - 1 ,) b) of chemical energy, -AtlpHi{df,/dx) ■L2"p^i
23. Unsteady bulk-temp, change, VpC,(dT/dt) L'pcp(T - T,)H 24. Burning rate, or heating rate 9 25. Surface-to-surface radiation, g.- _» ,
a) gray, S^f^T,1, where 5,5, S L'fiU's, shape) L'aT'f, b) non-gray, see text
26. Gas-zone to surface-zone_radiation, or vice versa a) gray, S^aV, where SiG, = I^MKL, e's, shape) LVr4/2
b) non-gray, see text 27. Gas-zone to gas-zone radiation
a) gray, G^>7V, where dd = tLftinL, .'«, shape) «LVr'/i b) non-gray, see text
74

Another relation derived by Hottel which is of interest in firebrand production and distribution is for the velocity profile in the column
Note that r is the radial distance away from the axis of the fire column and Z is the height above the fire base. If we rewrite the equation as below, we can obtain some insight into how the velocity profile scales:
i* =
.£S_ a/3 /. \i/3 ^- (A4)
pC T Z poo
where Z0 is a characteristic dimension, say flame height, and u* is a dimensionless upward velocity. In this relation, the function f(r/Z) indicates that the velocity profile is similar at any two heights but spreading 6ut as height is increased. The term Z/Z0 indicates that the dimensionless velocity is decreasing as one goes from the base to the flame tip. Therefore, there does appear to be a type of similarity in velocity profile as the scale, Z0 (flame height) is changed. Since firebrand lofting and ejection are shown to be related to the velocity and density (or temperature) profiles in the flame, it is important that these parameters scale in an identifiable manner.
In reference 1, pertinent papers on scaling fires were also pre- sented by Emmons and Faure. The essences of their papers (at least for our applications are given in Table 21. That is, besides identi- fying several dimensionless parameters which may be applied "an over- all dimensional analysis is probably useless in the fire problem".
In 1971, Friedman presented a very instructive paper along the same lines (Ref 6). With regard to modeling burning rates for free convection dominated fires, Friedman says four dimensionless numbers are controlling:
, heat of combustion Modified B Number ■
heat of preparationi and vaporization
6 Friedman, R., "Aerothermodynamics and Modeling Techniques for Pre- diction of Plastic Burning Rates", Journal of Fire and Flammabllity 2, July 1971, p 240.
75

o E □ o 1-1 u o c X a>
U-l s 3 U-H
B M > t) C 3 3
■u -a a s m O 0 M u
D 3 U -a h x:
a ai Oi B VJ n: x; m o E u 0 C u a h -C c 3 3-a »*-l
<u ■r4 MJ
c « £ < o UH IS c -
UH O E (0
■1) 0) 2 ^ 0)
0) V C Xl
81 X3 > •H
1C C « 4J i w c m v- a E n3-3 c. >. x ai c x ai
^-i ^-< ai o .o ra a c T) <u oca) a; x ij o -a u w C.-H c w u w
w TI O (L J: c c e ^ w.1
M OJ ^-. ^-i UM -H : G -< nj o E
*
ii|
a» B 3 «: ll -H O C ■ D-m 3 ^ E
E a
c OCU y, u E HI a >
oC 0 iw r. jz Zi (U C a> B £ < j=
u 4-t u
x 3 tJ c re 01 O -C c
0 o
X o a <u
6 u <u o 1 3
m o 4J >,
c <u >, X
a ^ •a m o
a> ra E L.
CO 41 3 TJ C a cr 0 0
a> JZ -v ^ n re <u 3 aj >i a ex « u re o > 0 0 c
; i
01 o u
u >. E i V, u D -i C— C r-l tu -^ 3 ^ re B9»w
re &. .c E CJ >.
o o^- (
3 C -.
E « c E h c
C 3 C O
o c -a
M o re j3 C -c
^ ore ra u-i -3 o E Q O
EX SJ o o X > O ■" f- — x x: : i^ w 3
o^
ab4
—ill BP
u4?
uHu
o U V
4-i a. re to OJ ai
<u c
« 3 S- "3 3 C 10 O re u a* E^ o c
or tu VJ
c re c •rH E 01
76

Reynolds Number = p VL g inertial force
viscous force
Froude Number = V inertial force gL gravity force
T3 2 SL P„
Grashof Number = 3AT = buoyancy force viscous force
S
Friedman stresses the potential of using Grashof number to devise a pressure modeling scheme. The gravitational constant could also be varied experimentally using a centrifuge. Since a safe separation test for munitions almost by definition must use the actual munitions being tested, these tests must be fairly large scale. This makes pres- sure modeling or other techniques such as increasing the gravitational acceleration by using a centrifuge quite impractical for our purposes.
One additional work should be mentioned. In 1976, Markstein (Ref 7) presented the results of a study on "Scaling of Radiative Characteristics of Turbulent Diffusion Flames". The analysis which he conducted was somewhat idealized in that the flame was assumed to be^ optically thin whereas large dirty fires are not. However, Markstein found that many fire characteristics could be represented in terms of a parameter C = Z/L where Z is the height above the. fire base and L is the flame length. He showed that flame length is given by
L = Cq X (A5)
where q is the volume flow rate of gas, and C and X are constants. Flame diameter was shown to be a function of q and S such that
D = q f^O (A6)
Markstein, G. H., Scaling of Radiative Characteristics of Turbulent Diffusion Flames, Factory Mutual Research Corporation Tech Report '22361-4, June 1976.
77

Similarly flame irradiance per unit area and per unit length are given by similar relations. This simple dependence on volume flow rate and position between the flame tip and base again indicates that some of the concepts suggested for firebrand ejection in Appendix C have promise.
The background from dimensional analysis outlined above does not really lead us to a practical technique for scaling radiated heat from free burning fires. Therefore, we are led to using simple analytical models describing radiated heat from such fires to provide the needed scaling methods. Historically, this has been the approach followed by others when faced with the problem of scaling such fires, especially in areas such as evaluating the hazard imposed by liquid hydrocarbon pool fires. These techniques have much promise for our application and will be described below.
Simple Models for Radiated Heat From Free Burning Fire
Analytical prediction of the radiated heat field around a free burning fire can be accomplished numerically by rigorous solution of the gas radiation problem. This approach is quite complex, requires spectral data for attenuation coefficient, and the spectral data are a function of species concentrations, temperature and pressure. Be- cause of the' complexity of this approach, particularly when consider- ing the nonuniformity and transient nature of real fires, it is not practical for most applications. Two much simpler techniques have been widely used to model free burning fires, especially pool type fires. These techniques have been shown to provide reasonably good correlation of available experimental data. They embody the parameter relations necessary for scaling and appear to be suitable for our application. These techniques are the "point source" model and the "emitting surface" model.
A.2 Point Source Model
This model considers the remote heat flux to be proportional to the rate of fuel reacted, mv, and inversely proportional to the square of the distance from the source, X:
m q = C-£ (A7) r x2
This comes from the consideration that for each unit of fuel mass, there is an energy, AH, stored chemically in the fuel. A fraction of this energy, n, is released in the reaction and a fraction, f, of that released energy is promptly radiated rather than convected. Depending on atmospheric conditions only a fraction, T, of the energy radiated is transmitted to the target. We assume that the energy is emitted from a point source located in space. At any radial distance, X, from the source, the energy will be uniformly distributed over the
78

imaginary spherical surface of area 4TrX . The point source model can be written in expanded form as
q. m AHnfT V 5 (A8) 4TTX~
where
AHnfx _ c 4Tr
If we consider a quantity of fuel An^ which reacts very quickly pro- ducing a pulse of energy, Aqr, radiated from a fireball, this same approach is quite suitable if written as
Am Aq = C-f (A9)
r x2
Scaling would be accomplished by conducting tests at several sizes to obtain the relations for C and mv versus size. These parameters would then be extrapolated to the full scale to estimate radiated heat flux emitted from full scale fire.
A. 3 Emitting Surface Model
This model represents the fire plume as a solid emitting surface of some simple geometry, generally a cylinder or a tilted cylinder. The surface is assumed to be at a constant effective "flame temperature" Tf or have a constant emissive power per unit surface area, Ef. To ac- count for the effect of flame thickness on emissivity ef, the emissivity is represented as
£f = ! _ e"aD (A10)
where a is the attenuation coefficient and D is the flame diameter. The flame shape and orientation with respect to the target are accounted for by a configuration factor, F. The configuration factor is a func- tion of flame length L, flame diameter D, flame tilt angle 9, and distance to the target X. The fraction of the heat flux transmitted through the air T can also be included. This model is illustrated in Figure 34 and the general equation is given here:
79

.y Target Viewing Flame
Burning Stack of Munitions
Figure 34. Emitting Surface Model
80

q = TF(L,D,X,e) (1 - e aD) aTf4 (All)
Configuration E. Factor
where O is the Stefan-Boltzmann constant.
The emitting surface model approach has the advantage of much more realistically representing the configuration and has much better accu- racy than the point source model for targets near to the source. This model appears to be most suitable for relatively long duration fires, whereas the point source model appears to be more suitable for short bursts of energy such as from a fireball.
When applying the emitting surface model to scale radiated heat flux from free burning fires, the surface emissive power Ef is generally used rather than flame temperature in the model. Emissive power cor- responds to the optically thick flame case where Ef is unity. Ef and a are obtained experimentally by measuring the radiative heat flux with narrow view radiometers from fires of several sizes (vary D) and using equation (All) to correlate the results.
In equation (All), the atmospheric transmissivity can be the true value for a specific situation, a typical value (i.e., 50 percent rela- tive humidity), or a worst case value (T=1) can be used. As indicated in the equation, configuration factor F is a function of the flame length L, the flame diameter D, the flame tilt angle 6 and the distance to the target X. To be able to scale using equation (All), the scaling of D, L, and 9 must be understood.
The flame diameter D, can probably best be scaled by conducting tests at several sizes and plotting the ratio of flame diameter to con- tainer or stack equivalent diameter versus size. This will indicate the flame diameter trend as the experiment size approaches the full scale. Alternatively, some simple model can be used which embodies the pressure expansion of the gases, the initial flow momentum, and air entrainment effects. Such a model has not been developed or un- covered as yet for this application, but remains an option for corre- lating this type of experimental data.
81
Several analytical models have been developed to predict flame height and other characteristics of free burning fires. Among these are the models of Nielsen (Ref 8), Steward (Ref 9 and 10), and Fang (Ref 11). Nielsen's model is for very large scale fires whereas the models of Steward and Fang are for smaller, more conventional fire columns. Fang's work is essentially an extension of Steward's. The recent analytical flame height models seem to support a correlation developed earlier by Thomas (Ref 5). Thomas' correlation is based on a dimensionless flame length L/D and a dimensionless mass flux, such that
(A12)
where a and A are emperically derived constants, m'' is mass flow rate per unit area, pa is the ambient air density, and g is the gravita- tional acceleration. As will be shown in the next section, this cor- relation appears to work well for the limited data compiled on a previous program for Ml propellant strands.
Welker and Sliepcevich (Ref 12 and 13) have studied the effects of wind on tilting and modifying the length of a fire column. They conclude that the effect of wind on flame length is quite small. They derived a correlation for flame tilt angle 9 as
9
10
11
5
12
13
Nielsen, H. J. and Tao, L. 11,, "The Fire Plume Above a Large Free- Burning Fire", 10th International Symposium on Combustion, 1965.
Steward, F. R., "Linear Flame Heights for Various Fuels", Combustion and Flame 8, September 1964.
Steward, F, R,, "Prediction of the Height of Turbulent Diffusion Buoyant Flames", Combustion Science and Technology 2, 1970.
Fang, J. B., Analysis of the Behavior of a Freely Burning Fire in a Quiescent Atmosphere, NBSIR73-115, February 1973 (NTIS PB-226 907).
Thomas, P. H., op cit, 1962
Welker, J. R. and Sliepcevich, C. M. , "Bending of Wind-Blown Flames from Liquid Pools", Fire Technology 2(2), May 1966.
Welker, J. R. and Sliepcevich, C. M. , "Burning Rates and Heat Trans- fer from Wind-Blown Flames", Fire Technology 2^(3), August 1966.
82
^^.aR0-07^0-8^'0-6 (A13) cos6 e r \p y
where Re is Reynolds number based on the burner diameter and wind velocity, Fr is the Froude number and Pg is the density of the fuel vapor at the normal boiling point. A correlation such as this (per- haps with a different constant and different exponents and perhaps with the flame gas density instead of Pg) may be suitable for propel- lant fires. This correlation worked reasonably well for the relatively small flames which were considered but has not been tested with data for very large fires.
Thomas also considered the effects of wind on flame length and found the effect to be quite small. He found that multiplying Froude number to the 0.11 power times the length to diameter ratio correlated the available data. Flame length decreased as wind speed increased, "presumably a result of better mixing".
These correlations along with the distance and orientation of the target define the configuration for radiative interchange. The con- figuration- factor F can be estimated by using existing models. Gener- ally, the flame is considered to be a solid cylinder at a constant temperature Tf or equivalently at a constant emissive power Ef.
The solid cylinder model is illustrated in Figure 35(a). A flat rectangular emitting surface (Figure 35(b)) is probably nearly as realistic as the solid cylinder model and is also simpler. Takata at IITRI has modified a computer code he developed on a previous project for a flat rectangular emitting surface. The surface is tilted toward or away from the target in the model. The normal to the target surface is oriented so that the target experiences the maximum heat flux from the flame. This is approximately the orientation which will cause the target's normal to bisect the angle formed between the lines connecting the top of the flame to the target and the bottom of the flame to the target. The maximum heat flux is pertinent to defining the safe separation distances from the flame. Existing models of this type generally consider only horizontal or vertical targets, neither of which will necessarily experience the maximum heat flux. In addition, the flat rectangle model sizes the width of the rectangle such that it represents the flame width that an observer would actually view (see Figure 35(c)). The observer would see an emitting rectangle with a width about equal to the flame diameter if he were tar enough from the flame, however, a nearby observer would actually see a closer trapezoid that is narrower than the actual flame diameter.
83

Target
(a) Solid Cylinder Model
Target
(c) Equivalent Rectangle Width
Target
(b) Flat Rectangle Model
Figure 35. Simplified Emitting Surface Configurations
84
Eichler (Ref 14) has developed a numerical model that considers the tilted fire column as a stack of slipped disks. This configura- tion is a more accurate representation of a tilted cylinder fire column in that the surface's curvature and the projection viewed by the target are automatically accounted for. Finally, the simple configurations considered by Hamilton and Morgan (Ref 4) are quite useful in estimat- ing most radiation configurations. For many cases, a simple rectangular source parallel or perpendicular to the target surface will be an ade- quate representation. This case is presented in reference 4 by equa- tion, table and graph for convenient application.
A.4 Summary
The literature concerning scaling of free burning fires based on dimensional analysis provides some useful insights but does not really give us a practical tool which can be used for our specific application. Rather, the "point source" and "emitting surface" models provide a basis for scaling radiated heat from free burning munition fires. It is sug- gested that the emitting surface model be applied to long burning fires characterized by a fairly steady state fire column. The point source model is more suitable to scaling very short duration events, charac- terized by a radiated pulse of energy rather than a steady energy flux.
14 Eichler, T., Wiedermann, A. and Pape, R., Study of Liquid Natural Gas (LNG) Spill, Dispersion, and Combustion Phenomenology, IIT Research Institute Final Report J6481 for Argonne National Labora- tory, May 1980.
4 Hamilton, D. C. and Morgan, W. R., op cit, 1952.
85

APPENDIX B
SCALING MUNITIONS FIRES IN ENCLOSURES
The enclosure fire scaling techniques which exist are applicable for fuels which require air to burn (such fuels do not carry their own oxidizers). Therefore, the existing enclosure fire models consider the fire plumes inside the enclosure as "pumps". These "pumps" pull air into the plume by entrainment. The air is pulled in through the lower portions of the ventilation openings and the combustion products are pushed out through the upper portion of the vents. There must al- ways be this balance in these conventional fires because the fuel re- quires air in order to burn.
In munitions fires, the fuel carries its own oxidizer. Therefore, munitions enclosure fires should act more like a rocket combustor where there is always a positive pressure pushing the chamber gases out of the vent. It is possible that for weak munitions fires in enclosures a fire plume may entrain air as with the conventional fires pulling cool air in through the bottom of the vent and pushing hot combustion products out through the top. For this reason, three of the more widely used scaling models are outlined in Table 22.
The relations shown in the table were derived from simple analy- tical models of the enclosure fires being studied. These relations have been shown experimentally to scale the fire characteristics reasonably well over a wide range of sizes.
Since we expect munitions fires to act somewhat differently and not generally be represented by the existing scaling models, scaling relations have been developed for this special problem. The enclosure represents a storage facility, either a conventional above ground building or an earth covered magazine. Figure 36 illustrates the configuration being considered.
The enclosure is assumed to have a volume Vc, the fuel is as- sumed to be homogeneous with a burning surface area A^, and the en- closure is assumed to have a single ventilation opening of area Ae and equivalent diameter De. The combustion products are assumed to exit through the vent at velocity ue and with constant flame tempera- ture T^. The enclosure is assumed to be sufficiently strong to hold together during the fire. The cylindrical enclosure geometry shown in the figure may not be realistic for most storage buildings, but as will be seen, the scaling relations are independent of the exact struc- ture geometry and a cylinder is likely to be used for convenience in experiments to be conducted. Closed enclosures have not been con- sidered because they do not pose a fire hazard to the surroundings un- less an explosion occurs projecting firebrands producing a vent opening.
86

TABLE 22. SUMMARY OF EXISTING ENCLOSURE FIRE SCALING METHODS
1. IITRI Model for "Small" Enclosures (Ref 15)
a cc s* w oc s w
o h
cc
oc
s
h o oc
Fuel burning rate « S
for best match of gas temperature, heat fluxes and species concentrations.
2. Armour Research Foundation Model for "Large" Enclosures (Ref 16)
Heat Flow out of Vent Heat Flow Generated
,5/2
= Constant
if fire size a S"" and all lengths « S
3. Factory Mutual Research Corporation Model for "Large" Enclosure (Ref 17)
Lengths « S Time oc s
Temperatures « 5° 3
Fuel Weight « S
Fuel Production Rate « s
Air Inflow Rate
Heat Flux
5/2
5/2
5/2
* S is the scale factor
15
16
17
Waterman, T. E., Scaling of Fire Conditions Supporting Room Flashover, DASA Report 2031, December 1967.
Busby, A. L. and Pigman, G. L. , Roof Ventilation Requirements for Industrial Plants, Final Report for Project L565, Armour Research Foundation, July 1955.
Heskestad, G., Model Study of Automatic Smoke and Heat Vent Per- formance in Sprinklered Fires, Factory Mutual Research Corporation Tech Report 21933 RC74-T-29, September 1974.

Munitions Burning Inside Storage Structure
Figure 36. Munitions Fire in an Enclosure
The analysis presented here is modeled after solid rocket combustor technology as presented in reference 18. In rocket combustor analysis, simplifications generally can be made due to choked flow, however, this assumption could not be taken advantage of for our munitions storage problem. The approach is to outline the equations governing the fire inside the enclosure and the flame emerging from the vent. These equa- tions are then nondimensionalized to identify the scaling parameters and relations likely to characterize munitions fires in enclosures with vents.
The rate of gas flow me out of the exit vent and the exit gas velocity ue are given by
dec/ (Y-l)RT
,2/Y Y+l Y (Bl)
Hesse, W. J. and Mumford N.V.S., Jr., Jet Propulsion for Aerospace Applications, 2nd edition, Pitman Publishing Corporation, New York, 1964.

f2gtRT u = c^ e d, Y-l
1 - (B2)
where Cd Is the discharge coefficient (ratio of actual to ideal exit velocities, Ae is the exit area, Pc is the chamber pressure, Pe is the exit pressure (approximately ambient), g is the dimensional con- stant, y is the ratio of specific heats, R is the gas constant and Tc is the chamber temperature.
The mass generation rate m-^ is equal to the fuel burning reces- sion rate r times the burning surface area A^ and the fuel mass density p^:
mi = rAbpt (B3)
The recession rate is assumed to be related to the chamber pressure in the following manner:
r = aP (B4)
where the parameters a and n are function of the chamber temperature. The rate of change of mass in the chamber is equal to the mass en- tering as combustion products minus the mass exiting through the vent;
-7- (p V ) = m - m. dt c c e i (B5)
or dV c
}c dt
dp. + V
c dt
V dP c c • • p rA. + —- -r—~ m - m.
c 1) RT dt e i (B5a)
Combining equations (Bl) through (B5a) and rearranging gives the fol- lowing expression for rate of change of chamber pressure:
dP c dt { (p - p ") RT aP
p c c c d c Ab
2gYRT M- m> (B6)
89

This equation tells us that the fire will be stable if r is less than 1 but unstable (runaway Pc rise or drop) if r is greater than 1 (Ref 18). For equilibrium burning, the rate of pressure change is zero and the two terms within the brackets must be equal to each other. Equat- ing these terms and solving for chamber temperature and pressure yields the equations (B7) and (B8).
T = c
c' '^m (p. p ) R a P
c c
(B7)
a(p. P ) RT c c (B8)
caff^
or P = f (B8a)
The equations given above characterize the conditions inside the en- closure and the gas flow rate just coming out of the vent. In addition, we are interested in the characteristics of the flame emerging from the vent opening. Three flame properties can be evaluated. We can estimate the energy flow rate out of the vent, the length of the flame, and the flame lift angle.
The rate of energy flow out of the enclosure's vent is merely the mass flow rate me times the energy per unit mass CT^, where C is the specific heat and Tf is the flame temperature outside of the enclosure.
By extending equation (Bl), the following expression for energy flow rate is obtained:
Hesse, W. J. and Mumford, N.V.S., Jr., op cit, 1964,
90

Q = CCj A P Tc deer ^SX.
(Y-l)RT C L_
2/Y Y+1-, PT
c/ _J (B9)
or 2gYTf
Q = CCj A P /-, r^r & e c J (Y-l)R
(assuming T
2-,
c/ _l
(B9a)
Flame length possibly can be predicted by adapting the correlation of Thomas (Ref 5). Thomas' correlation is based on the dimensionless flame length (length to diameter ratio) being related to a dimension- less mass flux parameter by the following general expression (as described in Appendix A Section A.3):
= a X
VaJ^I (BIO)
where L is the flame length, D is diameter. is mass flow rate per unit area, pa is the ambient air density, g is the gravitational acceleration and a and X are empirically derived constants. For com- bustible materials of construction (e.g., woods and plastics), natural fuels (e.g., dry grass) and for liquids hydrocarbon fuels, a is about 42 and X is 0.61. In recent work by IIT Research Institute for ARRADCOM, Dover, New Jersey, this correlation was fit to data for an inprocess propellant (Ml strands). Since the propellant flame bulged out sig- nificantly above the open topped container that it was burned in, the flame diameter was used in the correlation rather than the container diameter. With a = 23.3 and X = 0.65, the following correlation was obtained for four tests:
Container Diameter (cm) Calculated L/D Observed L/D
15.2 1.11 1.05 22.9 4.1 4.33 30.5 2.43 2.59 40.6 8.43 7.96
Thomas, P. H., op cit, 1962,
91
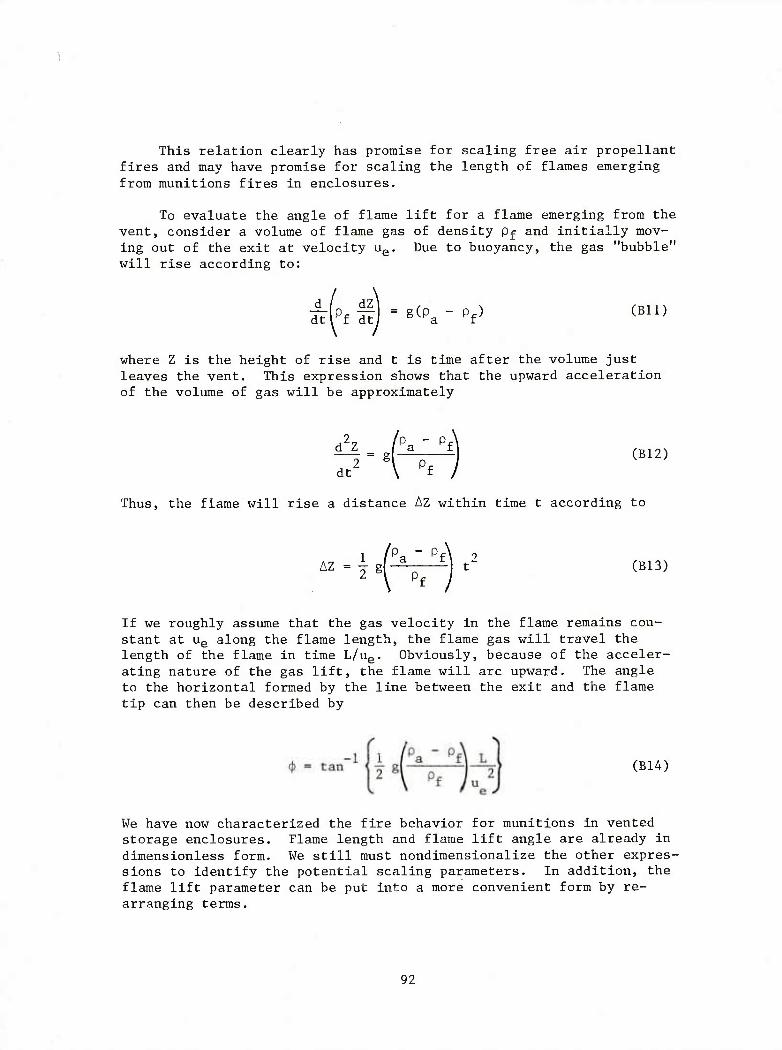
This relation clearly has promise for scaling free air propellant fires and may have promise for scaling the length of flames emerging from munitions fires in enclosures.
To evaluate the angle of flame lift for a flame emerging from the vent, consider a volume of flame gas of density p^ and initially mov- ing out of the exit at velocity ue. Due to buoyancy, the gas "bubble" will rise according to:
where Z is the height of rise and t is time after the volume just leaves the vent. This expression shows that the upward acceleration of the volume of gas will be approximately
5 - f^i <BI2)
Thus, the flame will rise a distance AZ within time t according to
iz ■ I ^rir^ t2 (B13)
If we roughly assume that the gas velocity in the flame remains con- stant at ue along the flame length, the flame gas will travel the length of the flame in time L/ue. Obviously, because of the acceler- ating nature of the gas lift, the flame will arc upward. The angle to the horizontal formed by the line between the exit and the flame tip can then be described by
(B14)
We have now characterized the fire behavior for munitions in vented storage enclosures. Flame length and flame lift angle are already in dimensionless form. We still must nondimensionalize the other expres- sions to identify the potential scaling parameters. In addition, the flame lift parameter can be put into a more convenient form by re- arranging terms.
92

B.l Vent Mass Flow
The rate of mass flow out of the vent (equation (Bl)) can be nondlmensionallzed in the following way:
AtJwmC^rif] -i^' (B15)
The expression to the left can be considered to be a nondimensional mass flux. This parameter is seen to be a function of the discharge coefficient Cd, the ratio of specific heats Y> and the pressure ratio Pc/Pe. For the sake of simplicity, the exit pressure will be con- sidered to be ambient. In general form, equation (BIS) can be pre- sented as:
RT /P
2g-=f^' Cd^l (B16>
It is likely that Y and C^ will be approximately constants and for all practical purposes, the dimensionless mass flux should be a func- tion only of the pressure ratio.
B.2 Exit Velocity
In the same manner, based on equation (B2), a dimensionless exit velocity can be defined and shown to be a function of exactly the same parameters as the mass flux (Pc/Pa, Cj and y).
v , e r y
/■■ /Pa\V
•pr; "" VY-I k (B17)
Thus, for practical purposes, the dimensionless velocity can also be considered to be a function only of the pressure ratio.
B.3 Rate of Energy Flow
Equation (B9a) also reduces to a simple dimensionless form by rearranging terms:
(B18)
93

The term on the left is a dimensionless energy flow rate. It is seen to be a function of the discharge coefficient, ratio of specific heats and pressure ratio, or for practical purposes it is only a function of the pressure ratio.
B.4 Chamber Characteristics
We are also interested in the rate of pressure rise, the pressure and the temperature inside of the chamber. Because of the unknown value of n in the burning surface recession equation (equation (B4)), equations (B6), (B7) and (B8) cannot be characterized quite as well as those describing the flow out of the vent. Equation (B7) (for chamber temperature) can be nondimensionalized as below:
'\2/Y /PV^ al / a\ T
c/ \ cj
/2gR P, 2^
.(P -P ) R /T~ aP n I ' p c v a c ' J
(B19)
As can be seen, the dimensionless chamber temperature is a function of the discharge coefficient, ratio of exit area to burning surface area, ratio of specific heats, ratio of chamber pressure to ambient pressure, and a complex fifth parameter which might be interpreted to be a dimensionless burning rate
(p - p ) R FT a P n p c V a c
From equation (B8a), we see that pressure can be expressed as shown below:
P = f c MW a(pp - pc)
fRT
2g JJ (B20)
94

This equation indicates that the ratio of burning area to exit area and the fuel material density will influence the pressure experienced inside the chamber. From equation (B6), the rate of pressure rise can be written in nondimensional forms as:
V dP _ : = (p - p ) a P /RT
VoA^ dt p c c / c Yg
(B21)
This equation identifies the dimensionless form of rate of pressure rise which can be used to correlate the data. Beyond that, we see that the fuel density and ratio of exit area to fuel surface area should influence the results.
B.5 "Flame length
As discussed earlier, the Thomas correlation for flame length has promise for scaling this parameter. Therefore, it is expected that flame length to diameter ratio will follow the relation
D = a '
where a and X will be determined empirically
B.6 Flame Lift Angle
As described earlier, from simple analysis, the flame lift angle would be expected to follow a relation such as
tan (B23)
The expression in brackets is already in dimensionless form but can be made more convenient and meaningful by rearranging terms somewhat, First, it can be shown from the definition of the volume coefficient of expansion 6 and from the perfect gas law that
95

Pa - Pf = epa (Tf " Ta) (B24)
Forgetting the factor of 1/2, the expression in the brackets becomes
pa-pf\ L ggPa (Tf - "a) L
Pf u2" pfu2
e f e
We note that Grashof and Reynolds numbers can be defined
(B25)
g3(Tf - T ) L3p 2
G = t | — (B26) r 2
yf
p u L R = -i-S- (B27)
where y is the viscosity of the flame gas.
Applying these definitions to equation (B23), we find that
'an 1 f i ^" F" '
Consequently, flame lift angle would be expected to scale based on the parameter
G /P . r / a
R2lpf> e
or at least in terms of the three parameters G , R and p /pf,
96

B.7 Summary
The dimensional analysis presented above provides a format for designing the enclosure munitions fire experiments to be done. Table 23 summarizes the relations which come directly from the analy- sis. The first three flame characteristics listed in the table are functions of chamber pressure, which itself is an experiment result rather than an independent variable. From the table and by referring to equation (B8), we see that chamber pressure is a somewhat complex function essentially of Ae/Ab and fuel density p . Similarly, several of the fire characteristics are functions of the flame temperature which again is a result of the experiment conditions. For example, the energy flow rate and flame lift angle both involve If. One simple approach is to only look at the size scaling effects. If we maintain geometric similarity and vary the scale S, we see from Table 23 that chamber pressure and temperature should be independent of scale, whereas the rate of pressure rise (time factor) should decrease as 1/S. If there is no temperature and pressure scaling effect, then mass flow and heat flow out of the vent should increase with S^- while the exit gas velocity should be independent of the scale. The L/D ratio would be expected to decrease with scale as l/S^*-^ where if A is found to be about 0.67 the effect will be 1/S^- . Finally, from the relations In Table 23, the flame lift (tan6) is expected to be proportional to the scale.
The exact technique for scaling will be worked out by analyzing the experimental results and hopefully identifying insensitive param- eter variations or other simplifications which can be used. At this time, the relations in Table 23 do identify the parameters which can be varied to control the experiments, those which must be measured to be used in correlations, and the primary fire characteristics of in- terest. These are outlined in Table 24. In the experiments, we must be able to vary the exposed burning surface area, the vent area, the fuel density and the fuel composition. The exit velocity profile and gas temperature must be measured to estimate the mass and energy fluxes out of the opening. This can be done with pitot tubes and thermocouples. The chamber and ambient pressures and temperatures must also be measured using pitot tubes and thermocouples. Flame dimensions and lift can be determined from real time movie coverage of the event.
In addition to the measurements Indicated by the above analysis, we plan to use slug calorimeters and thermocouples in the fuel bed to evaluate fire spread rate and the effect of radiative and convective reinforcement. For several fuel arrangements tested inside the en- closure, fires will be conducted with identical fuel arrangements in free air. This will be done to evaluate the significance of the en- closure in reinforcing these fires and to evaluate the ability of a free air test to characterize an enclosure fire, possibly ultimately eliminating the need for the enclosure for the testing.
97

TABLE 23. SUMMARY OF SCALING RELATIONS FOR MUNITIONS FIRES IN VENTED ENCLOSURES
Flame Characteristics
Mass flow out of vent
m / RT
e a r.
Exit velocity
Ir
(Wc P \
Energy flow out of vent
/P
C P 9— rjiZ' f > A sl^rf
Flame length
L 5 = a
m \ 6
\paAe^
Flame lift angle
e \
Chamber Characteristics
Temperature
A P
AT' FT- S"^ \ b a r
RT a n n-1 — a P
Pressure
\ (Pp-Pc)
RT
not dimensionless
Rate of pressure rise
V dP
A, P v/gyRT b cv B c
1 A P e _c
\, ' P b a ^F= f iAT' T' V^ RT
"21 a P ""i
Elimination of P /P c a
T V dP A
Ta AKP yiTRT dt Ab P C be" c
RT* D n-1 -n— a P 2g c
where T* = characteristic temperature
(i.e. , T or T ) c a
98

TABLE 24. EXPERIMENT FORMAT FOR MUNITIONS ENCLOSURE FIRES
Primary Measured Flame Characteristics
V V ^ D' *
Other Measured Values
T , T T P P D r c a c a
Controlled Variables
A \ -, —, p , fuel composition
DC
99

APPENDIX C
FIREBRANDS
This appendix is concerned with the derivation of simple equations with which to predict distances over which firebrands are deposited from ammunition/incendiary fires. In this regard the most useful study found in the literature is that presented by Tarifa (Ref 19). Tarifa's studies were concerned with firebrand trajectories produced by forest fires. Because of substantial flight times he assumed that the fire- brands moved at their terminal velocities throughout their flight. This assumption is not a good one for the more modest fires and shorter fire- brand flight times of concern in this program. For this reason we shall develop equations based upon the transient velocities of the firebrands.
For this purpose fires shall be characterized by their gas density Pg(h) and velocity U(h) as a function of height h. Firebrands are characterized in terms of their drag coefficient CD, area A and mass m which reduce to a single parameter a as indicated by Tarifa (Ref 19) and presented
a - -£- (CD 2m
In order to determine an expression for the firebrand travel distances it is first necessary to derive expressions for the
• optimum heights H at which firebrands may be carried aloft by convection columns produced by fires
• velocities of firebrands leaving the convection columns
• flight times of firebrands.
The problem is illustrated in Figure 37 along with several key parameters used in the forthcoming analysis. Complete nomenclature for this section is presented in Table 25.
19 Tarifa, Carlos, S., Transport and Combustion of Firebrands II, Study Conducted for Department of Agriculture, Forest Service on Grants FG-SP-114 and FG-SP-146, May 1967.
100

a
TABLE 25. NOMENCLATURE FOR FIREBRAND DISCUSSION
Name Definition - _
A Effective area of firebrand, m .
C Drag coefficient, dimensionless.
C See equation (C8), se,.
D Distance traveled by firebrand after leaving column at height h, m.
D Maximum distance traveled by firebrands after leaving column at optimum height H, in.
2 g Acceleration of gravity, m/sec ,
h Height or altitude above ground, m.
Ah Rise of firebrand after leaving convection column, m.
h Sum and h and Ah, m.
H Optimum height reached by firebrands within convection column, m.
m Mass of firebrand, kg.
t Time, sec.
t. Time period while firebrands are rising after leaving column, sec.
t- Time period while firebrands are falling after leaving column, sec.
t„ Sum of t and t., sec.
U Wind velocity, m/sec.
U Velocity of gases within convection column, m/sec.
V Horizontal velocity of firebrands, m/sec,
V Vertical velocity of firebrands, m/sec.
a See equation (Cl), 1/m. 2
P, Density of air at normal temperacure, kg/m . 2
Density of gases within convection column, kg/m .
101

Convection Column
Firebrand Trajectory-
Wind Velocity U
-►v "s.
s,
t V
\
N
N \
time t.
• Figure 37. Illustration of Firebrand Problem
C.1 Optimum Altitudes Achieved by Firebrands Within Convection Column
The differential equation describing the upward velocities Vg of firebrands in a convection column is
dV (h) g dt
g - a _1 (U (h)cose + V (h)V (C2)
where the velocity Vy is considered to be minus with rising firebrands. The minus sign in equation (C2) reflects the fact that drag imparts a force opposite to gravity.
Optimum firebrand heights may be estimated by finding the height at which the net force acting upon the firebrand is zero (dVy/dt = 0) when the firebrand ceases to be in motion vertically (Vv = 0). Substi- tuting the above conditions into equation (C2) and solving for u„(h) yields
Ug(h) -/
8 P,
a p (h) ■/cos 9 (C3)
102
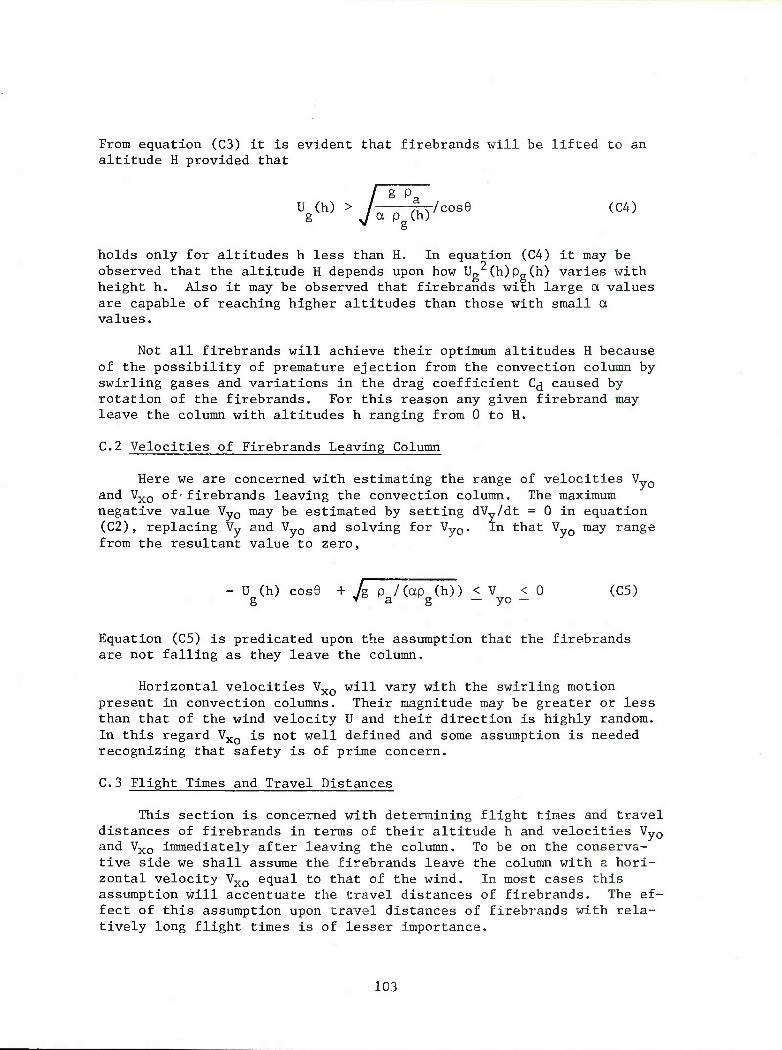
From equation (C3) it is evident that firebrands will be lifted to an altitude H provided that
-. ug(h) > 7^o/cose (c4)
holds only for altitudes h less than H. In equation (C4) it may be observed that the altitude H depends upon how Ug^(h)Pg(h) varies with height h. Also it may be observed that firebrands with large a values are capable of reaching higher altitudes than those with small a values.
Not all firebrands will achieve their optimum altitudes H because of the possibility of premature ejection from the convection column by swirling gases and variations in the drag coefficient C^ caused by rotation of the firebrands. For this reason any given firebrand may leave the column with altitudes h ranging from 0 to H.
C.2 Velocities of Firebrands Leaving Column
Here we are concerned with estimating the range of velocities Vy0 and Vxo of'firebrands leaving the convection column. The maximum negative value Vy0 may be estimated by setting dVy/dt = 0 in equation (C2), replacing Vy and Vy0 and solving for Vy0. In that Vy0 may range from the resultant value to zero,
- U (h) cos9 + /g p /(ap fh)) < V < 0 (C5) g v a g — yo —
Equation (C5) is predicated upon the assumption that the firebrands are not falling as they leave the column.
Horizontal velocities Vxo will vary with the swirling motion present in convection columns. Their magnitude may be greater or less than that of the wind velocity U and their direction is highly random. In this regard Vxo is not well defined and some assumption is needed recognizing that safety is of prime concern.
C.3 Flight Times and Travel Distances
This section is concerned with determining flight times and travel distances of firebrands in terms of their altitude h and velocities Vy0 and Vxo immediately after leaving the column. To be on the conserva- tive side we shall assume the firebrands leave the column with a hori- zontal velocity Vxo equal to that of the wind. In most cases this assumption will accentuate the travel distances of firebrands. The ef- fect of this assumption upon travel distances of firebrands with rela- tively long flight times is of lesser importance.
103

First we shall derive an expression for the flight time t^ and altitude increase Ah (see Figure 37) while firebrands are rising. Then we shall derive an expression for the flight time t2 while the brands are falling.
Velocities Vy of rising firebrands outside of the column are described by the following differential equation
dV 9
-^ = g + a V Z (C6) dt 6 y
where Vv is negative and drag imparts a downward force to the brands.
Integrating equation (C6) with respect to time and setting Vy = V at t = 0 yields
V = jg/a tan (yag{t + c)) (C7)
where
C = — tan'^V o//T/c0 (c8) /og y0
Elapsed time t^ required to achieve V = 0 may be found by substituting Vy = 0 and the expression for C into equation (C7) and solving for t " ti. The result is presented below.
t = — tan'Vv //?/a) (C9) 1 I— yo v 0
/ag
The maximum increase Ah of the firebrand's altitude is given by
Ah
t1 ___
- f Vy(T) dr =^ln/(Vyo//i/a)2 + 1 (CIO)
Thus at time t]^ the brand will have a velocity Vy of zero and be at its maximum altitude h given by
h = h + Ah (Cll)
104
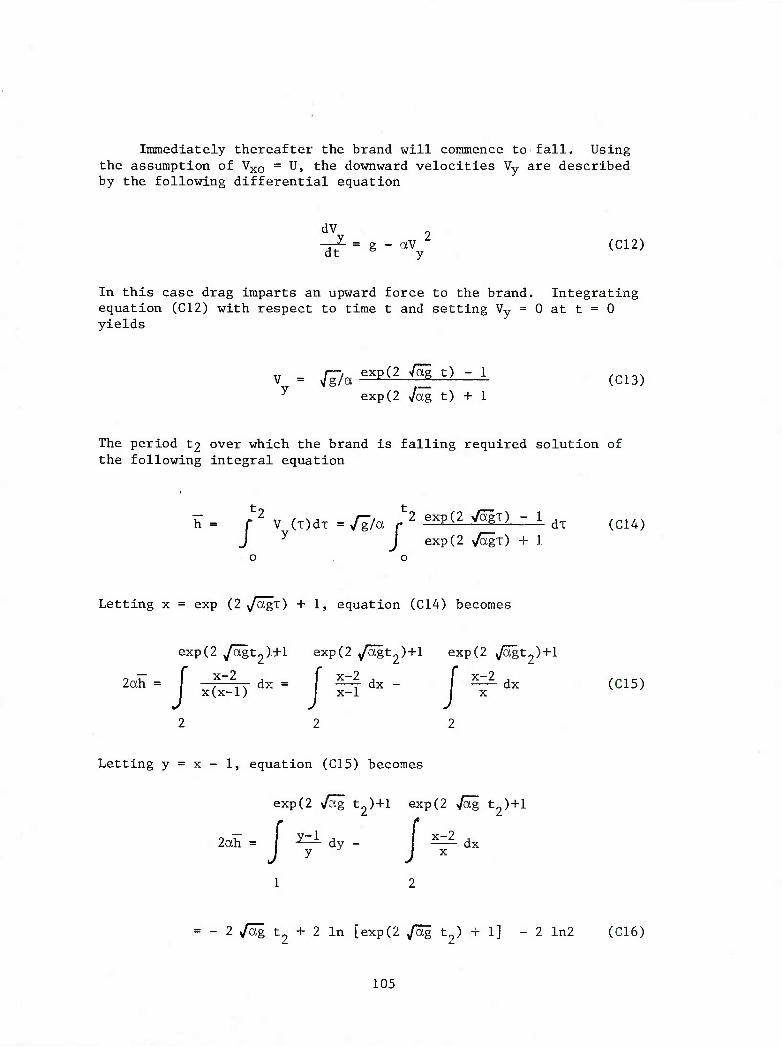
Immediately thereafter the brand will commence to fall. Using the assumption of Vxo ■ U, the downward velocities Vy are described by the following differential equation
dV -^ = g - aVy (C12)
In this case drag imparts an upward force to the brand. Integrating equation (C12) with respect to time t and setting Vy = 0 at t = 0 yields
v . ^7a exp(2 Tog t? - 1 (cl3) y exp(2 Jag t) + 1
The period t2 over which the brand is falling required solution of the following integral equation
h = f'2 V (T)dT = /F/a r2 exp(2 Vagx) - 1 dT (cl4) J J exp(2 v/air) + 1 o o
Letting x = exp (2 JagT) + 1, equation (C14) becomes
exp(2 yagt2)+l exp(2 /agt2)+l exp(2 ^/agt^+l
2ah = f -Mr d>- = f M" dx " f 2L^- dx (C15) j x(x-l) x-1 X
Letting y = x - 1, equation (C15) becomes
exp(2 >/ag t2)+l exp(2 Jag t2)+l
■ ~ dx /-.- /
1
= - 2 Jag t + 2 In [exp(2 ^og t ) + 1] - 2 ln2 (C16)
105

In that equation (C16) is implicit in t2 it is not easily solved for t2. For this reason the following approximation was developed
a ah + In 2 [1 - exp - (2.10 Vah + 0.725ah)] (cl7^
yfag
Errors in t2 are of the order of a few percent or less for all ah values of interest to this program.
The total flight time t3 equals the sum of ti and t2 so that
t3mtl+ '2
C.4 Travel Distances
Travel distances D are given by
D = h sin 6 + U t3 (CIS)
From equations (C9), (C16) and (C17)
tao"l(-V / /g/a)+ah+ln2[l-exp-(2.10 yah+0,725ah)] t = Z2 (C19)
3 /^
For h values less than H
- U,(h)cos9 + f^T/iap (h)) < V < 0, and (C20) f V 0^a g —yo-
yo
For h equal to H
ah = ah + In /(V //g/a)2 + 1 (C21)
V = 0, and (C22) yo
ah = aH (C23)
106

H equals the maximum height h over which the condition expressed by equation (C4) is valid.
C.5 Maximum Travel Distances
Estimates of the maximum travel distances Du, may be achieved by setting h equal to H and using the equation presented in Section C.4. The result is
D = H sirG + U^H+^U-exp-q.lON/^+O.yaSaH)]} .
Two of the four dependent variables H, 9, U and a depend upon the fire, namely 9 and H. Means for calculating the deflection angle 9 are pre- sented by equation (A13) (Appendix A). Evaluation of H may be achieved by one of two approaches. The first is to determine how the functions Pg(h) and Ug(h) scale with fire size, fire intensity, and wind speed. The second is to determine H experimentally by releasing brands having a given a value into the convection columns of fires of different sizes and intensities and observing the optimum height at which the brands leave the column. It is expected that H may be scaled in terms of the flame length which can be scaled with respect to fire size and inten- sity (see equation (A12)). At present we favor the latter approach in that it provides a direct measurement and requires no instrumentation, aside from camera coverage.
107

APPENDIX D
INSTRUMENTATION FOR FIRE CHARACTERISTICS
The development of instrumentation for fire experiments Is, In Itself, an area requiring continuing research. Many of the quanti- ties to be measured are quite small requiring rather delicate sensors and these must function satisfactorily In or near the high temperature environment of the fire. In addition, It Is highly desirable to use^ the same Instrument both In the laboratory and In the field. For this reason, a degree of ruggedness Is required. Where practical, the sen- sor can be expended (such as a thermocouple) but the costs associated with construction and calibration of most of the sensors prohibit this as a general practice. Needless to say, many of the Instruments either are not commercially available or require extensive modification of commercially available components.
Most Instruments for fire experimentation have evolved during the past two decades. Generally, they are designed to permit continuous remote recording of the monitored quantities by measuring DC voltages. The following paragraphs discuss various devices used in or near fires to measure:
• heat transfer
• temperature
• velocity (gas, flame)
• flow patterns
D.1 Heat Transfer Measurements
Many of the safe separation distance criteria defined in this pro- gram will be developed by extrapolation of radiant heat flux measure- ments taken In field laboratory scale experiments. Convection, condensation and conduction will play a less role but may require mea- surement. Since measured results are to be scaled, it is necessary to use accurate flux Instrumentation so that the resultant scaling is meaningful.
D.l.l Radiation
The rate of radiant energy absorption by a surface exposed to a radiant source may be expressed as follows:
q" =aF e a T4 (DI) r s
108

where
q" = radiant heat transfer rate per unit receiver area
a = absorptance of receiver
F = geometric view factor between receiver and source
£ = emmitance of source
O = Stefan-Boltzman constant
T = source temperature
The receiving surface also radiates energy, but if its temperature is low in comparison to the source temperature, this is negligibly small. In this approximation, spatial variations in source emissivity or re- ceiver absorptivity are lumped as averages over the areas being considered.
Instruments for measuring radiant heat transfer are devices which respond to absorbed radiation in a known manner. Superimposed convec- tion effects (heating or cooling) can be assumed small in some in- stances, are accounted for during calibration in others, or are prevented by shielding.
In instances where total (or net) heating rates are to be mea- sured, these same devices, properly protected and configured, are used. An example of this application is measurement of the net heating ef- fects of an enclosed fire in the walls of its enclosure.
Descriptions of commonly used radiation instruments are provided below.
D. 1.1.1 Asymptotic Calorimeter
A sketch of an asymptotic calorimeter (sometimes called the Gardon Calorimeter after the original investigator—Ref 20) is shown in Figure 38. Heat entering the surface of the sensing disk (usually fabricated from Constantan and blackened* on the exposed face) flows radially to a constant-temperature (copper) heat sink. A. copper wire is attached to the center of the sensing disk and another to the heat sink. The voltage generated by this thermocouple is directly propor- tional to the absorbed heat flux as can be seen from the following analysis.
20 Gardon, R., "An Instrument for the Direct Measurement of Intense Thermal Radiation", Rev. Sci. Inst. 24(5), May 1953, pp 366-370.
* a (absorptivity) -0.9
109
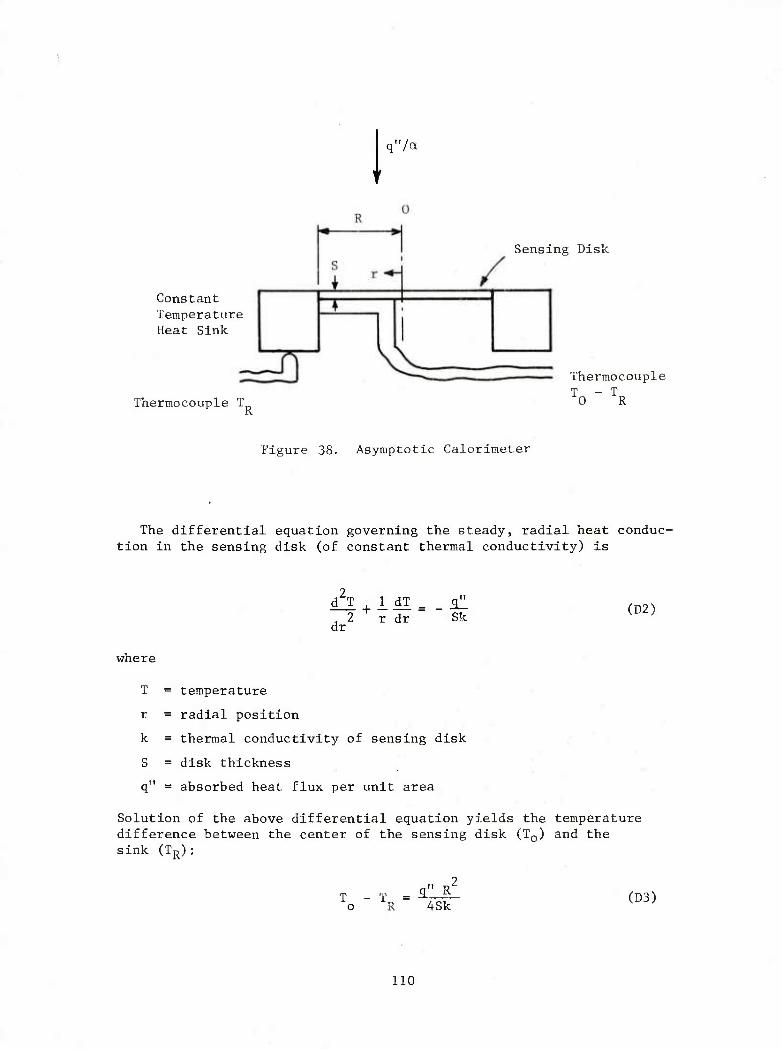
1 q'Va
Constant Temperature Heat Sink
Thermocouple T
Sensing Disk
R
Thermocouple T - T 0 R
Figure 38. Asymptotic Calorimeter
The differential equation governing the steady, radial heat conduc- tion in the sensing disk (of constant thermal conductivity) is
d2T , 1 dT _ c^ J 2 r dr " " Sk dr
(D2)
where
T = temperature
r = radial position
k = thermal conductivity of sensing disk
S = disk thickness
q" = absorbed heat flux per unit area
Solution of the above differential equation yields the temperature difference between the center of the sensing disk (T0) and the sink (TR):
T -T =^^ o R 4Sk (D3)
110
Note that this temperature difference is a linear function of the ab- sorbed heat flux.
The noteworthy features of this type of calorimeter are:
- convenient output signal
- fast response
- small size
- high sensitivity
The undesirable aspect of this type of calorimeter is that is requires a coolant for the heat sink if it is to be used for extended periods.
Alvares (Ref 21) discusses the use of asymptotic calorimeters for heat transfer measurements from burning fabrics.
D.1.1.2 Slug Calorimeter
Figure 39 is a schematic diagram of a slug calorimeter which con- sists of a well insulated, high conductivity material (usually copper) with a thermocouple attached. The absorbed heat flux (exposed face also usually black) uniformly heats the slug (Newtonian heating), and therefore the rate of change of temperature is linearly proportional to the absorbed heat flux, q", as can be seen from the following energy balance.
q" A = M c 4J (D4) 'p dt
or
where
T = temperature of the slug
A = surface area of the slug
M = mass of the slug = SAp
c = specific heat of the slug material
t = time
p = density of the slug material
S = thickness of the slug
21 Alvares, N. J,, Heat Transfer from a Burning Cotton Cloth to an
.Adjacent Isothermal Wall, MS Thesis, University of Minnesota, February 1969.
Ill

Insulation 1 q'Va
Calorimeter Slug
Housing
m Thermocouple T
Figure 39. Slug Calorimeter
The noteworthy features of this type of calorimeter are:
- small size
- simplicity
Its shortcomings are that its output signal is inconvenient (nonsteady), and can be used only intermittently (since it continues to be heated). It also requires either good insulation or thermal guarding to eliminate peripheral heat exchange.
The slug calorimeter is probably the one most used by fire re- searchers in the past. Alvares (Ref 21), Agate et al (Ref 22) and Webster, et al (Ref 23) all employed slug calorimeters for measuring heat flux rates from fabric fires. Webster also used a slug calorimeter in which the thermal mass was stirred water. Most thermal measurements in nuclear weapons tests utilized slug calorimetry.
21
22
23
Alvares, N. J., op cit, 1969.
Agate, F. J., et al, "The Realities of Fabric Flammability", Proc. Sec. Annual Meeting, Info. Council on Fabric Flammability, December 1968, pp 7-29.
Webster, C. T., Wraight, H.G.H. and Thomas, P. H,, "Heat Transfer from Burning Fabrics", J. Textile Institute 53(1), January 1962, pp T29-T37.
112

The slug calorimeter can also be useful for measuring the total energy per unit area emitted during a very short event, such as from a fireball. For such cases, the total energy is found by integrating equation (D4) to be
M c Q" = —r-Z AT (D5)
or
Q" = S p C AT P
where AT is the temperature rise of the slug. To determine total heat rather than heating rate, the output of the slug calorimeter is very convenient. Naturally, if the event duration becomes too long, heat losses will invalidate the result unless accounted for.
D.l.1.3 Equilibrium Calorimeter
A schematic diagram of an equilibrium calorimeter is shown in Figure 40. This calorimeter consists of a sensing disk of small mass, insulated around its perimeter, which comes to thermal equilibrium with a constant temperature heat sink by radiation. The exposed face is usually black; the rear face is polished. Of the heat entering the calorimeter a part is radiated from the exposed face to the environment, and the remainder is radiated from the rear face to a constant tempera- ture sink. The equilibrium temperature of the sensing disk (measured by a thermocouple) is an indication of the incoming heat flux, thus:
q.. = ^- a(T^ . T^ (D6)
where
q" = absorbed heat flux (from front face) per unit area
£ = emissivity of rear face sensing disk and sink
T = sensing disk temperature
T = sink temperature K
The noteworthy features of this type of calorimeter are:
- small size
- fast response
- simplicity
113

I q'Va
Thermocouple T __ R
Sensing Disk
Thermocouple T
Insulation or Constant Temperature Sink
Constant Temperature Sink
Figure 40. Equilibrium Calorimeter
The disadvantages of this device are that the sink requires cooling (or else it can be used only intermittently); and, convective effects within the cell tend to distort linearity when used for high flux exposures.
The well known Eppley cell, which is used to measure low intensity radiant heat fluxes, is a good example of an equilibrium calorimeter.
D.1.1.4 Fluid-Flow Calorimeter
A fluid-flow calorimeter provides a measurement of the energy entering a surface by monitoring the temperature rise of a flowing coolant in contact with the surface. The energy balance for this de- vice is
q" A = M c (T - T.) p o i
(D7)
where
q" = absorbed heat flux per unit area
A ■ surface area of calorimeter
M = mass flow rate of coolant
c = specific heat of coolant
114

T = coolant outlet temperature
T. = coolant inlet temperature
In addition to a temperature measurement, this type of calorimeter re- quires a measurement of mass flow rate. However, the ability to vary the coolant flow rate gives this type of calorimeter a greater versa- tility than many others.
The noteworthy features of this type of calorimeter are:
- versatility
- small size
- convenient output signal
The undesirable features of this device are that it requires a coolant and the measurement of coolant flow rate, and its response is rela- tively slow.
D.1.1.5 Summary
Each of the devices described above has its particular advantages and disadvantages as were described. Past experience suggests the asymptotic calorimeter to offer the advantage of ruggedness for field use. Through proper selection of sensor thickness and diameter, work- ing ranges of flux levels can be selected appropriate to particular applications. In many cases, cooling the heat sink will not be re- quired. When needed, simple systems have been designed which recir- culate water through the heat sink from a reservoir when central water supply systems are too remote.
For measuring total energy pulses emitted from short duration events such as fireballs, slug calorimeters will be used. In munitions fires, it is more likely that such bursts will occur within a back- ground steady fire. For these situations, a fast response asymptotic calorimeter may be more suitable.
D.1.2 Separating Convection and Radiation
Convective heat transfer between hot gases and a receiving surface can be expressed by a convective heat transfer coefficient, h, whose magnitude depends on the properties and dynamics of the gases near the receiver.
q" - h(T - T ) (D8) c a o
115

where
q" = convective heat transfer rate per unit receiver surface area
T = receiver surface temperature o
T = gas temperature a
It can be seen from the above that, if h is constant, the convective heat transfer rate is linearly dependent on the temperature difference between the receiver and its environment. Therefore, as the tempera- ture of the receiver is increased, the convective heat transfer rate will decrease.
Instruments to assess convective heating usually do so by measur- ing total heating and radiant heating and deriving convection as the difference.
D.1.2.1 Two-Color Technique
If one employs a pair of calorimeters, of any type, which are ex- posed to both radiant and convective heat fluxes it is possible to determine the magnitude of each mode of heat transfer by having dif- ferent absorptances on each calorimeter. To illustrate this technique, consider two slug calorimeters, one with an absorptance 04, the other with a2. The energy balance for a slug calorimeter with both radiant and convective heating is
[■ + h (T - T) a A = M c 4r (D9) p dt
or
[a QR + h(Ta " T] J rp
+ h(T - T)|A = M c -7- p dt
where
Q" = incident radiant heating rate per unit area
(QR " ^
h = convective heat transfer coefficient
T = ambient gas temperature
T = slug temperature
116

A = surface area
M = slug mass
c = slug specific heat
t = time
The solution to the preceding differential equation is
._ aQ"+hT T = T. EXP(- MtL) _ R_JL
i Mc h P
where
r^- w^ - M (DIO)
T. = initial temperature of calorimeter
When two identical slug calorimeters with different absorptances are employed the rate of change of the temperature difference between the calorimeters is
t
(a.-ou) A Q"
jfoi - v- l £ R ***<- ^ <D11) p p
Measurement of the rate of change of temperature difference with respect to time and display of these data of semilog coordinates will permit efficient determination of the radiant heating rate Q^, and the convective heat transfer coefficient, h.
If ambient temperature is very much higher than the calorimeter temperature, the convective heat transfer rate is virtually constant. For these conditions, the energy balance for the slug becomes
[^R + *c] A = M c ~z (D12) p dt
where
q" = convective heat transfer rate per unit area.
When two calorimeters of different absorptances are employed
M q" = ^£ Hc A(a -a2)
dT1 din
IF " ai -dTj a2 ^t a1 ! '
117

and
Mc d(T -T9)
Q" - T7—E—r : (D14) yR A(a.-a-) dt
A similar analysis can be made for the two-color technique using other calorimeter types.
Slug calorimeters of this type were designed and constructed by the British Joint Fire Research Organization (Ref 24) for use in fire experiments. Experience with similar units at IITRI showed that prob- lems arise in maintaining constant emissivity in a fire environment, particularly for the surface of low emissivity. A system designed and built for the NASA Saturn Rocket successfully utilized this principle (Ref 25) by limiting exposure to short periods (~2 sec) followed by covering and cooling the calorimeters.
D.1.2.2 Clear Window Technique
If one employs a pair of calorimeters, of any type, which are ex- posed to bot;h radiant and convective heat fluxes it is possible to determine the magnitude of each mode of heat transfer by placing a clear window over one calorimeter. The window eliminates the convective heat transfer from this calorimeter so that it measures radiant heating rates only, while the uncovered calorimeter measures both radiation and convection. The difference between the two heating rates is ob- viously the convection.
Care must be taken in this method to eliminate any thermal convec- tion between the window and the calorimeter surface, and the window must be chosen so that the radiant flux is not modified in passing through the window.
Devices of this type were designed, built, and used at IITRI to separate the radiative and convective heating developed during fire buildup in a room (Ref 26). The calorimeters were of the asymptotic
0 / Fire Research-1964, Department of Scientific and Industrial Research and Fire Offices' Committee, Joint Fire Research Organization, London, 1965.
Sterbutzel, G. A., Taking the Measurement of Heat-Thermal Instru- mentation Research, Research Trends, Technical Quarterly of Cornell Aeronautical Laboratory, Buffalo, NY, Spring-Summer 1965.
° Waterman, T. E., "A Calorimeter for Separating Radiative and Con- vective Heat", Fire Technology 4(2), May 1968.
118

type and employed Irtran 2* as the window material. Irtran 2 is uni- formly transparent to radiation over a wavelength range of about 2 to 12 microns. Both disks, of thin Constantan foil, were blackened to provide surface emlsslvltles of 0.92. Analysis of the results was made as follows:
For the exposed disk
e Q^ + q^ = BEB (D15)
For the disk covered by a window
D Q^ = AEA (D16)
where
Q" = Incident radiant heating rate
q" = convectlve heating rate
e = emlsslvlty of coated disks
B = calibration constant Involving disk thickness, diameter, thermocouple location, losses, etc, for bare disk
A = calibration constant similar to B for covered disk
E and E = signal generated from bare and protected disks, respectively
D = factor Involving transmlttance of window and emlttance of disk
For calibration with a purely radiant source (q" = 0)
E Q" B = E 'caf (D17)
B,
and
0" A = ^R, cal
A, cal
where the subscript, cal. Indicates calibration values,
* Eastman Kodak Company
119
Substituting the calibration values into the original equation yields
EQ" eQR + qc = E
EB (D18)
and
B, cal
Q" QR EA . hA
A, cal
from which
Although calibrated wiht a purely radiant source, performance of the calorimeters was validated using environments with known purely radiative, purely convective, or combined radiative/convective heating. In use, calibration has been found to be retained by cleaning and visual inspection of window and the exposed blackened disk.
D. 1.3 Condensation Heat Transfer
Utilization of any of the above described calorimeters "close-in" to a fire environment may permit condensation of products of combus- tion on the sensor (or window, if used) causing erroneous measurements to be recorded. To avoid this problem, calorimeters are commonly operated at slightly elevated temperatures, above the condensation temperature of the products. In fact, by operating calorimeters at two temperature levels, one on either side of the condensation tempera- ture, rate of heat transfer by condensation can be determined. Since convective heat transfer will be different to each calorimeter, gas temperature and calorimeter temperatures must be known in order to ap- ply an appropriate correction. Indeed, a similar correction is required for any calorimeter measures of convective heat transfer when calorim- eter temperature differs from the surface to which convective heating is to be measured. In essence, a heat transfer coefficient is calcu- lated for the calorimeter (at its temperature) and then applied to the temperature difference between hot gases and actual receiver.
120

D,1.4 Conduction
The conduction of heat through a material is linearly related to the gradient in temperature, namely,
^cd = -k f (D20)
where
q" = conductive heat transfer rate per unit area cd r
k = thermal conductivity of material
T = material temperature
x = position
The principle of operation of a heat-flow meter in measuring the heat flux into a material is analogous to that of an ammeter used to measure the rate of current flow in an electrical circuit. The method consists essentially of measuring the drop in potential across a known resistance which is placed in series with the material so that it ex- periences the same flow. The known resistance must be small when com- pared with 'the other resistances in the series, so that its presence does not significantly affect the overall resistance and thereby the rate of flow.
A heat-flow meter consists of a circular or square piece of sheet material which is usually several inches across and a fraction of an inch thick, with temperature sensors (usually thermocouples) in the center portion of both faces. This piece of material is bonded to the surface through which the heat flow measurement is desired, in such a way that thermal contact resistance is minimized. The area of the meter must be sufficiently great so that in the central region, where temperatures are measured, the heat flow is one-dimensional.
The temperature difference across the meter is linearly related to the heat flux, namely,
*cd-kf (D21)
where
q" , = conductive heat transfer rate per unit area
k = thermal conductivity of meter (known)
AT = temperature difference across meter
L = thickness of meter
121

It is unlikely that heat-flow meters will be required for the present study, unless to characterize thermal properties of an enclosure used as a test bed.
D.2 Temperature Measurements
The measurement of high temperature is usually accomplished by optical (radiation) devices or through the use of thermocouples. For free burning fire plumes, optical means are usually not satisfactory. If the plume is small, it is partially transparent which causes the optically measured result to be lower than the real plume gas tem- perature. If the plume is large (flames generally become "optically thick" at about 1.5 m), pyrometry yields temperatures representative of an integrated average of the first few feet of flame thickness, which may be significantly cooler than the unseen inner flame mass.
Thermometry through use of thermocouples has become the "work- horse" of fire research. The use of thermocouples is based on the fact that contact between dissimilar metals (electrical conductors) generates a voltage that is uniquely dependent on temperature. Various pure metals and alloys are commonly used as thermocouple materials. .Choice for any particular use is made on the basis of useful temperature range, sensitivity (mv/0C), reproducibility, stability and cost.
D.2.1 Thermocouple Materials
The most practical thermocouple for fire studies is the type K (ANSI designation) chromel-alumel* pair. The type K thermocouple has a useful range of -184° to 1371°C, and works well in an oxidiz- ing atmosphere. This thermocouple should serve for much of the upper plume experimentation required here.
When it is necessary to measure even higher temperatures, other thermocouples are available, but each has significant disadvantages. Various platinum and platinum-rhodium thermocouples are available which perform well in oxidizing atmospheres to about 1760 C. The principal disadvantage of these is cost, roughly ten times for chromel-alumel wires of the same diameter. Iridium/iridium-rhodium thermocouples serve to slightly higher temperatures with similar cost limitations. Tungsten and tungsten rhenium thermocouples are available for use up to 23160C but have very poor oxidation resis- tance. Their cost is roughly seven times that of chromel-alumel.
* Chromel, a nickel-chromium alloy; and alumel, a nickel-aluminum alloy, are trade names of Hoskins Manufacturing Company.
122
It should be noted that, if high temperature extremes are to be measured within an enclosure, earlier limitations mentioned for optical pyrometers may not apply and their use can be considered.
D.2.2 Thermocouple Circuitry
Historical practice for employing thermocouples is to provide a temperature reference junction, usually an ice-water mixture, as shown in Figure 41.
This circuit requires that the recorder be wired with the wire A material and that no temperature gradient be permitted at the recorder terminals. More recently, electronic compensating junctions have been devised which permit the external cold junction to be eliminated. Again, however, the recorder must be adapted to the thermocouple wire being used.
To eliminate long runs of relatively expensive thermocouple wire, extension wires have been developed that match the temperature-emf response of the thermocouple wire at low (common room) temperatures. These permit interconnection of extension wire to thermocouple wire with no voltage being generated, as long as the temperature is not significantly elevated. These still require cold junction compensa- tion of some sort, and matching of recorder wiring or control of terminal temperature gradients.
For field experimentation, IITRI engineers have long used the configuration shown in Figure 42.
Here, both thermocouple wires are connected to copper wires in ice-water junctions as soon as practical. Long runs of copper wire to the recorder are of much lower resistance (and cost) than any thermocouple or extension wire. Telephone cables are routinely used for this purpose, where cables with 10 to 15 wire pairs bring multiple signals to the recorder.
D.2.3 Thermocouple Wire Size
Proper sizing of thermocouple wire diameter is a series of tradeoffs between accuracy, response time, useful life, radiation error, and cost. The latter cost was treated above in terms of ma- terial. As a rule of thumb, cost varies with cross-sectional area, or cost is roughly proportional to the square of diameter (very fine wires do not follow this rule due to manufacturing costs),
Accuracy—Even carefully prepared wire will have minor impuri- ties. One of these may represent a mere point in the diameter of a thick wire; but, should that wire be extruded to a very small diam- eter, the impurity may become a significant wire length. Thus, the need to precalibrate thermocouples is most critical at the smaller- wire sizes.
123

Wire A Hot • Junction Recorder
- Cold Junction (0 C)
Figure 41. Common Thermocouple Circuit
Wire A
Hot Junction
Figure 42. Thermocouple Configuration for Field Use
124

Response—The smaller the wire, the lower its mass to surface area ratio; and, the quicker its response to changes in environment. Omega's Temperature Measurement Handbook (Ref 27) provides an example of the behavior which is shown in Table 26.
TABLE 26. THERMOCOUPLE RESPONSE TO IMMERSION IN 4270C ENVIRONMENT (REF 5)
Wire Diameter Time Constant* (seconds) (cm) Still Air 18.3 m/sec Air
0.03 0.05 0.004
0.13 1.0 0.08
0.38 10.0 0.8
0.81 40.0 3.2
* Time to reach 63.2 percent of change
Useful Life—Thermocouple wire suffers from oxidation and corro^ sion by various components of high temperature environments. The smaller the' initial wire diameters, the larger the effect of a given depth of corrosives (i.e., a given time of exposure).
Radiation Error—When a temperature sensor is placed in a hot gas stream, the indicated temperature will normally be considerably different from the true temperature of the gas. The steady state temperature indicated by such a sensor is the result of a heat balance between the heat absorbed by the sensor and the heat lost from it. Heat is gained by the sensor as a result of gas radiation and convec- tion, while the loss from the sensor is primarily by radiation to the cold surrounding environment. An accurate calculation of the true gas temperature from the indicated temperature in such a heat balance is usually impossible in practice because it involves prior knowledge of such factors as the emissivity of the sensor and of the flames, con- vective heat transfer coefficient, and temperature of the surroundings visible to the sensor.
Errors in measuring flame temperature are largest for transparent flames, or near the edge of flames of high opacity. Walker and Stocks (Ref 28) provide examples of this effect as shown in Figure 43.
27
28
1979 Temperature Measurement Handbook, Omega Engineering Inc, Stamford, Connecticut.
Walker, J. D. and Stocks, B. J., "Thermocouple Errors in Forest Fire Research," Fire Technology 4(1), February 1968.
125

-a OJ
in u 0 --—N
u IK (i) 0
OS ^^
e t) a (-1
B 3 ■H J-J X 03
M ^ QJ a
OJ 6 00 QJ K) H h 0) > <
2100 -i
1900 "
1700
1500 -
1,300-
1100-
900
0.010 0.020 0.030
Thermocouple Wire Diameter (inch)
0.040
Pine Needle Fires ^' h
Pine Wood Fires • —-•
Outside Edge of Alcohol Flame )f—
Center of Alcohol Flame o o
Figure 43. The Effect of Thermocouple Wire Diameter on Temperature Measurements (from Ref 28)
126

Figure 43 also Illustrates one method for establishing actual tem- perature from measured results. That is, extrapolation of results, such as shown in Figure 43, to zero wire diameter provides a measure of actual gas (flame) temperature.
D.2.4 True Gas Temperatures
Errors in gas temperature measurement were briefly described above, and one method was shown for adjusting measured readings to actual gas temperatures. Two other techniques have seen previous use.
D.2.4.1 Aspirated Thermocouples
Although radiation losses are the usual cause of erroneous mea- surements of high gas temperatures, the addition of radiation shields around the sensor is not sufficient because they tend to reduce the rate of gas flow over the sensing element and convective heat transfer to it. Therefore, the velocity of the gas over the sensor must be in- duced by artificial means.
One solution is to use a thermocouple which is surrounded by several radiation shields over which the gas velocity is increased by aspiration. A radiation shield that has been used by IITRI (Ref 29) is shown in Figure 44. It consists of seven small-diameter tubes pressed into a circumscribing tube of 3/4 inch diameter. The thermo- couple junction is placed in the middle of the center tube and the lead wires are carried to the outside. This shield assembly is tack- welded to a standard 1/2 inch pipe tee which is in turn connected to a length of pipe with an aspirating blower at the far end. Tests of the assembly over a gas flame were used to establish a conservative aspiration rate for use in the field.
D.2.4.2 Radiation Compensating Thermocouples
Palmer (Ref 30) adapted a design for solar radiation compensa- tion (Ref 31) for use in fire experimentation. This technique assem- bles a series of thermocouple junctions of varying diameter such that
29 Waterman, T. E., et al. Predictions of Fire Damage to Installations and Built-Up Areas from Nuclear Weapons - Phase III, Experimental Studies, Appendix G, National Military Command Systems Support Center, Contract DCA-8, November 1964.
30 Palmer, T. Y., "Comparison of Aspirated and Radiation-Compensating Thermocouples," Fire Technology 6(3), August 1970.
31 Daniels, G. E., "Gas Temperature and the Radiation Compensating Thermocouple," J. Applied Meterology 7, 1968.
127

Thermocouple Wires
Thermocouple Junction
lb
Figure 44. Shielded Thermocouple Assembly
128

their outputs add and subtract to provide an automatic extrapolation such as was previously shown in Figure 43. Examples of Palmer's thermocouples are shown in Figure 45.
These are recommended for use where accurate gas temperatures must be determined. In the lower portions of the plumes to be in- vestigated here, plume opacity may negate the need for such precautions.
D.2.5 Temperature Measurement by Other Means
Temperatures near 16490C are expected in the inner plumes to be measured here. The high costs of thermocouple wire for this tempera- ture range suggests that limited thermocouple use be supplemented by other, less exact, techniques. Tempil* pellets offer a viable means of achieving measurement of approximate maximum temperatures reached at various points in a plume during a given fire. These are small (0.32 cm diameter x 0.32 cm thick) tablets which melt at predetermined temperatures. Tablets are available with melting points in 10oC increments to 13710C and in 380C increments to at least 16490C.
For field use, the pellets can be suspended from ceramic rods by short lengths of platinum wire.
D.3 Velocity Measurements
The measurement of gas velocity in fire experiments is confounded by radiant heating of instruments near the fire and both radiant and convective heating of instruments within the plume. Three types of instruments,
• hot wire anemometers,
• fan or vane anemometers, and
• pitot tubes
have been employed; and each requires added precautions and protection as the measuring point moves nearer the plume.
D.3.1 Hot Wire Anemometer
The hot wire anemometer is commonly used for measuring low air speeds and its sensing element normally consists of a very fine ex- posed wire which is heated by an electric current. The temperature of this wire and consequently its electric resistance depends on the rate of cooling caused by air flowing over it, and therefore, it can
* Trademark of the Tempil Corporation
129

Spiral Design Rectangular Design
3/8"
0.025 0.015
0.025 0.020
0.015 0.032
Cold Bath
0.015 0.025
0.015 0.032
Cold Bath
Butt Weld J_
Twist and Weld —•"
Figure 45. Self-Compensating Chromel-Alumel Thermocouples (from Ref 30)
130

be calibrated for measuring air speed. Such an Instrument, however, cannot be used In the vicinity of a fire because varying thermal radiation from the flame may overshadow the convectlve heat transfer due to airflow.
This difficulty has been overcome (Ref 32) by the use of two identical thin tubes with thermocouples connected in opposition so that the emf signal is a function of the temperature difference between them. If one tube is slightly heated electrically, the output of the differential thermocouple should depend only on the heating current and on the rate of cooling due to the airflow. The effect of radiant heating from a high temperature source, such as flames, is essentially the same for both tubes so long as their temperatures do not differ widely. The difference of the heat balances from each tube in this case yields the relation:
2 T - T„ = T# " IT (T " V (D22) R hA n R
where T and TR are the temperatures of the hot and reference tubes, respectively, I is the constant current through the hot tube, R the heating wire resistance, e the emisslvlty and h the convection co- efficient. When there is no radiation, the relation reduces to
T - T = I2R/hA (D23) R
In the calibration region, T - TR is almost directly proportional to the output of the differential thermocouple. The instrument is based on changes of h with velocity In the forced convection region. For small temperature differences:
T - T„ « (T - T UT , where T < T < T (D24) R R m R m
Then
T Z _iW_ (D25) R 1 + ^ ^3
h m
32 Fire Research - 1956, Department of Scientific and Industrial Research and Fire Officers' Committee, Her Majesty's Stationery Office, London, 1957.
131
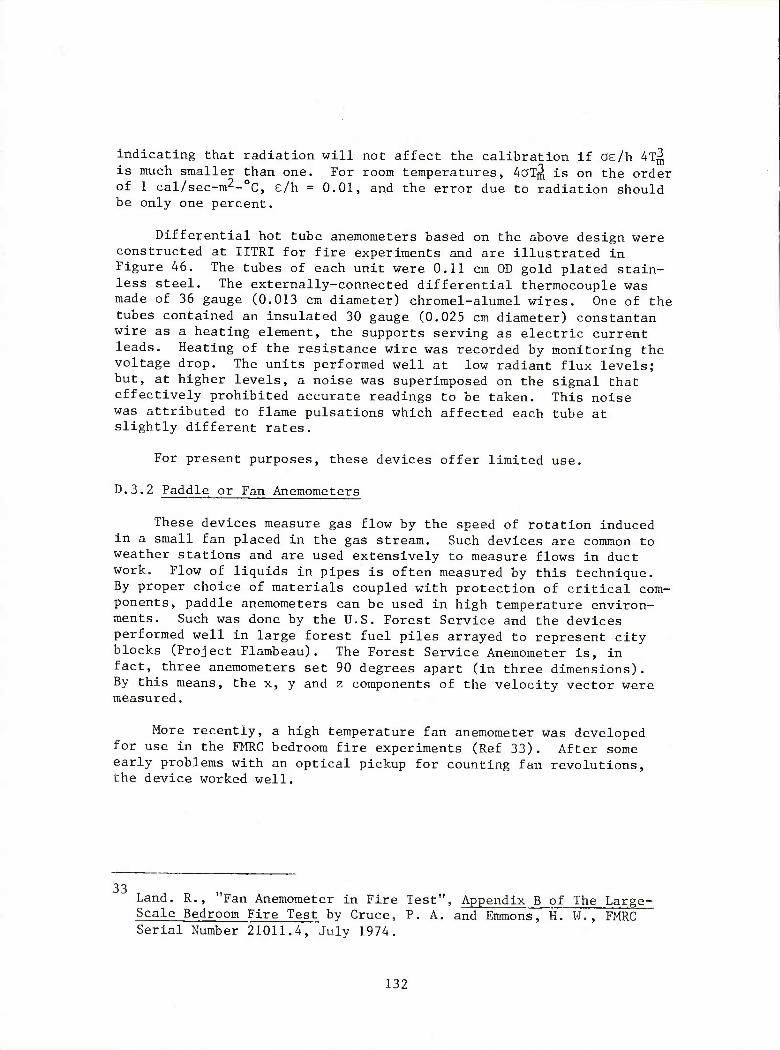
indicating that radiation will not affect the calibration if ae/h 4T^ is much smaller than one. For room temperatures, 4aT^ is on the order of 1 cal/sec-m2-0C, e/h = 0.01, and the error due to radiation should be only one percent.
Differential hot tube anemometers based on the above design were constructed at IITRI for fire experiments and are illustrated in Figure 46. The tubes of each unit were 0.11 cm CD gold plated stain- less steel. The externally-connected differential thermocouple was made of 36 gauge (0.013 cm diameter) chromel-alumel wires. One of the tubes contained an insulated 30 gauge (0.025 cm diameter) constantan wire as a heating element, the supports serving as electric current leads. Heating of the resistance wire was recorded by monitoring the voltage drop. The units performed well at low radiant flux levels; but, at higher levels, a noise was superimposed on the signal that effectively prohibited accurate readings to be taken. This noise was attributed to flame pulsations which affected each tube at slightly different rates.
For present purposes, these devices offer limited use.
D.3.2 Paddle or Fan Anemometers
These devices measure gas flow by the speed of rotation induced in a small fan placed in the gas stream. Such devices are common to weather stations and are used extensively to measure flows in duct work. Flow of liquids in pipes is often measured by this technique. By proper choice of materials coupled with protection of critical com- ponents, paddle anemometers can be used in high temperature environ- ments. Such was done by the U.S. Forest Service and the devices performed well in large forest fuel piles arrayed to represent city blocks (Project Flambeau). The Forest Service Anemometer is, in fact, three anemometers set 90 degrees apart (in three dimensions). By this means, the x, y and z components of the velocity vector were measured.
More recently, a high temperature fan anemometer was developed for use in the FMRC bedroom fire experiments (Ref 33). After some early problems with an optical pickup for counting fan revolutions, the device worked well.
33 Land. R., "Fan Anemometer in Fire Test", Appendix B of The Large- Scale Bedroom Fire Test by Cruce, P. A. and Emmons, H. W., FMRC Serial Number 21011.4, July 1974.
132

Heater / Wire
Current Lead
Figure 46. Hot Tube Anemometer
133

The main reason for choice of a fan anemometer over a pitot tube is measurement of low flow rates (down to about 0.3 m/s). Much higher velocities are anticipated here; and, fan anemometry will not be con- sidered unless preliminary experiments indicate that a low flow device is needed.
D.3.3 Pitot Tubes
Pitot tubes assess velocity by measuring the difference between stagnation pressure generated by the flowing gas and static pressure at the same location. This is commonly achieved by facing a sharp edged tube into a gas stream and a second tube facing at 90 degrees to the first. Alternately, the second tube faces downstream.
A modification to the latter design was developed by Heskestad (Ref 34) which is relatively insensitive to orientation in the flow field, and differentiates between flow in opposite directions. "The probe consists of a section of a circular tube with a barrier midway between the end points which divides the tube into two chambers (see Figure 47). For flows entering from either axial direction, the up- stream chamber senses a pressure close to the stagnation pressure of the flow. The downstream chamber senses a pressure slightly below the static pressure of the flow, in analogy with base pressures for flows about blunt-based bodies. The two pressures are tapped close to the central barrier and are led through tubes, which serve as sup- port for the probe as well, to the sensing instrument (manometer). The expected pressure differential for a given flow velocity is slightly greater than the differential produced by a pitot-static tube" (Ref 34).
"For incompressible Newtonian flow at a given attitude to the probe, the normalized pressure differential sensed by the probe is a function of Reynolds number, i.e.:
^P_ l/2pu2
= f (Re) (D26)
or, alternatively:
1/2 (2Ap/p)i//
C(Re) (D27)
34 Heskestad, G,, "Bidirectional Flow Tube for Fire-Induced Vent Flows", Appendix K of The Large-Scale Bedroom Fire Test by Cruce, P. A. and Emmons, H. W., FMRC Serial Number 21011.4, July 1974.
134

Support Tubes (Connect Pressure Taps to Indicating Instrument)
bJi LJ 0.572 D
"« H
n r^ 0.286 D
Taps Barrier
0.143 D
L__
0.857D D(- )
2 D
Figure 47. Diagram of Bidirectional, Pressure Differential Flow Probe (from Ref 34)
135

where Ap is the pressure differential, p is the fluid density, u is the approach velocity, and f(Re), C(Re) are functions of Reynolds number. C is the calibration "constant" of the probe; for pitot- static tubes, C remains very close to unity down to Reynolds numbers near 300" (Ref 34).
"Insensitivity to inclination angle is demonstrated in Figure 48" (Ref 34).
For this study, the bidirectional probe will be adapted to higher- temperature use by using ceramic construction (or platinum). This configuration was selected primarily because of its insensitivity to flow direction.
D.4 Flow Visualization
The term flow visualization is usually applied to means by which the flow of gas can be made visible to the eye or camera. The primary purpose of flow visualization is usually to define flow paths (i.e., direction). On occasion, it has been used as an aid to measurements of velocity.
"Analyzing the motion of foreign substances that are added to the flow is the principle of many methods of making flows visible. The techniques of introducing the material and those of observing and recording can be crude or refined, depending on the field of applica- tion. Whatever the case, it is important to investigate carefully whether the motion of the foreign substance and the flow of the fluid are identical. In principle, they cannot be exactly the same, but the difference may be very small, particularly if the flow is steady—if it does not change with time. In an unsteady flow field, on the other hand, the movement of fluid and foreign particles can differ greatly" (Ref 35).
"If particles of a foreign substance are injected into the flow at a particular point, the paths of these particles, in a steady flow field, are identical to the streamlines of the fluid flow. This way of quickly surveying the flow around an obstacle is often used for qualitatively checking a flow situation in which the analytical details are not required" (Ref 35). The use of smoke trails in wind tunnel studies is an example of a common application. The trails indicate flow path. By interrupting smoke generation, discrete puffs can often be generated which can be followed on sequentially timed photographs
35 Merzkirch, W., "Making Fluid Flows Visible", American Scientist 67^(3), May-June 1979.
136

©
®
(0=9)A/(0)A
d>
o ©
CO
CO
o E)
DO
-—ob- o
CO
o D
CO
oo
00
d
i>o
o o
oc c
0J
o Q
B
(T)
T3 HI
CO a
o
00
T3
CD
n OJ
H
o
M QJ
O
c cd
c •H
<x> (X >.
o u
o
> •H ■U •H
C OJ O
O
II
M CO
3 M OJ
oo St
U
■H
O I
137

to determine velocity. In other applications, time exposures are taken so that suspended particulates appear as streaks in photographs. These streaks are indicative of both direction and flow rate (length of streak).
The "smoke" and method/configuration of generation must be adapted to the particular need. In some cases, a number of "point sources" are arrayed in the field of interest. In large experiments, smoke streams may be propelled at high speed normal to the expected flow direction.
In the current program, selection of an optimum technique will be included as a task during early experimentation. The main purposes of visualization here will be to get an indication of flow outside the very hot plume area (air entrainment); and, perhaps to augment the pitot probe measurements which will be limited by practical constraints such as cost.
138

APPENDIX E
FIREBRAND CHARACTERISTICS, PRELIMINARY INVESTIGATION
A munitions fire can eject all sorts of debris (firebrands), such as flaming/smoldering packaging materials, hot metal fragments, or even burning propellant. This debris can be thrown onto combustible materials in the vicinity of the fire (e.g., onto exposed propellant, other packages, dry grass, roofs, etc) and could Ignite these materials. To characterize the ignition potential of different types of firebrands, an experimental study has been carried out. For the study, the follow- ing "typical" firebrands and host (target) materials were selected:
Firebrands
1. Smoldering corrugated cardboard (5.08 cm x 15.2 cm sheet)
2. NFPA Class C Brand (3.8 cm x 3.8 cm x 1.98 cm wood block with 0.32 cm saw kerfs)
3. Burning M30 pellet
4. Burning black powder grain
5. Solid copper cylinder (2.22 cm diameter x 2.54 cm long) heated to specified temperatures
6. Hollow metal cylinders of various wall thicknesses heated to specified temperatures
Hosts (conditioned at 55 to 60 percent relative humidity)
1. Black powder grains (0 m/s wind)
2. Wood shingles (mock roof) (1.07 to 1.22 m/s wind)
3. Asphalt shingles (mock roof) (1.07 to 1.22 m/s wind)
4. Corrugated cardboard (2.1 to 2.4 m/s wind)
5. Canvas tarpaulin (2.7 m/s wind)
6. Plastic tarpaulin (0.91 to 1.22 m/s wind)
7. Dry Timothy hay (typical of dry grass) (0,61 to 1.22 m/s wind)
8. Seat cushion (2.47 to 2.7 m/s wind)
The hosts were placed in a steady wind at the velocities indicated. The wind speeds were selected to most strongly promote ignition, based on prior tests of this type done at IITRI.
139
Each firebrand was dropped onto each host material to determine the Ignition potential. The metal cylinders were heated to tempera- tures up to 933 C to determine the characteristic ignition tempera- ture (i.e., temperature at which ignition will occur about 50 percent of the time). The test results are presented in Table 27 and will be discussed below.
Smoldering Cardboard
Corrugated cardboard sheets 5.08 cm wide by 15.2 cm long (1.4 corrugations per cm, single wall construction) were placed in a pro- pane flame for 30 seconds such that the flame just barely emerged around the edges. When the cardboard was removed from the burner, if flaming persisted, the sheet was laid onto a steel plate for an in- stant to remove the flame and produce a red glowing smoldering state. The smoldering firebrand was then laid onto the host material being tested. All of the host materials which were tested, except the plastic tarpaulin and seat cushion, were easily ignited by this firebrand.
C-Brand
NFPA Class C-brands were made and ignited as specified in the NFPA National Fire Codes, Volume 10, Chapter 7 (Sections 7-3 and 7-4), 1978 edition. The C-brand was somewhat less effective than the card- board in igniting the different host materials, although it could bring all the hosts except asphalt shingles to at least smoldering Ignition. Whereas the cardboard could not ignite the plastic tarpaulin or seat cushion, the C-brand was able to ignite these hosts.
M30 Pellet and Black Powder Grain
The M30 pellets used were an inprocess material from the drying operation. They were 0.76 cm diameter by 1.47 cm long with seven axial holes. The individual propellant grains were found to be some- what ineffective firebrands. The M30 pellet was selected because it burns fairly slowly, whereas the black powder was selected to repre- sent a very fast burning material. The black powder grains weighed about 0.1 gm typically. Black powder was found to be incapable of igniting any host material, except more black powder. The burn was too fast to penetrate heat sufficiently deep into the host. M30 could ignite black powder, corrugated cardboard (flaming ignition 80 percent of the time), canvas tarpaulic (smoldering ignition 40 percent of the time), and dry hay (flaming ignition 100 percent of the time). The other hosts could not be ignited by M30.
140

TABLE 27. SUMMARY OF FIREBRAND IGNITION TESTS
Probability of Probability of > Smoldering Flaming
Firebrand Type Host Material Ignition Ignition
Smoldering Black Powder P=l.0(5/5) Corrugated Wood Shingles P=0.8(4/5) P=0.8(4/5) Cardboard Corrugated Cardboard P=0.8(4/5) P=l.0(5/5)
(5 cm x 15 cm) Canvas Tarpaulin P=l.0(5/5) P-l.0(5/5) Plastic Tarpaulin P=0(0/5) P=0(0/5) Dry Hay P=l.0(5/5) P=l.0(5/5) Seat Cushion P=0(0/5) P=0(0/5)
C-Brand Black Powder P-l.0(5/5) (flaming wood) Wood Shingle P'0.5 to 0.8"'
Asphalt Shingle P-Q** p-Q** Corrugated Cardboard P>0.8"
Canvas Tarpaulin P=0.7 to >0.8* Plastic Tarpaulin P=0.8(4/5) P=0.6(3/5) Dry Hay P=l.0(5/5) Seat Cushion P=l.0(5/5) P=l.0(5/5)
M30 Pellets Black Powder P=l.0(5/5) (flaming) Wood Shingle P=0(0/5) P=0(0/5)
Asphalt Shingle P=0(0/5) P=0(0/5) Corrugated Cardboard P=0.8(4/5)
Canvas Tarpaulin P=0.4(2/5) P=0(0/5) Plastic Tarpaulin P=0(0/5) P=0(0/5) Dry Hay P=l(5/5) Seat Cushion P=0(0/5) P=0(0/5)
Black Powder Black Powder P=l. 0(1/1) Grain Ignited Wood Shingle P=0(0.5) P=0(0/5) at Host Asphalt Shingle P=0(0/5) P=0(0/5) (flaming) Corrugated Cardboard P=0(0/5) P=0(0/5)
Canvas Tarpaulin P=0(0/5) P=0(0/5) Plastic Taroaulin P=0(0/5) P=0(0/5) Dry Hay P=0.6(3/5) P=0(0/5) Seat Cushion P=0(0/5) P=0(0/5)
Solid Copper Black Powder Cylinder (Brand 4270C) P=0.167(1/6) (2.2 cm diameter (Brand 5380C) P-l.0(5/5) x 2.5 cm long) .. , ,,, . , . .f. ," V/ood Shingle at specitied (Brand 760oC) P=0(0/1) P=0(0/1) temperature (Brand 95AOc) P=l(l/1) P=l(l/1)
Asphalt Shingle (Brand 760oC) P=0(0/5) P=0(0/5) (Brand 982^) P=l(l/1)
Corrugated Cardboard (Brand 5380C) P=0(0/3) P=0(0/3) (Brand 6490C) P=l(5/5) P=0.6(3/5)
Canvas Tarpaulin (Brand 538,,C) P=0(0/1) P=0(0/1) (Brand 6490C) P"l(6/6) P=0.83(5/6)
Plastic Tarpaulin (Brand JbO'C) P=0(0/2) P=0(0/2) (Brand 8710C) P=0(0/I) P=0(0/1)
Dry Hay (Brand 4270C) P=0(0/5) P=0(0/5) (Brand 5380C) P=0.6(3/5) P=0(0/5) (Brand 614°C) P=l(l/1) P=0(0/1) (Brand 649°C) P=i(5/5) P=0.2(1/5) (Brand 760I'C) P=l(3/3) P=l(3/3)
Seat Cushion (Brand 5380C) P=0(0/1) P-0(0/l) (Brand 6490C) P=0.4(2/5) P=0(0/5) (Brand 760oC) P=0.4(2/5) P=0(0/5)
141
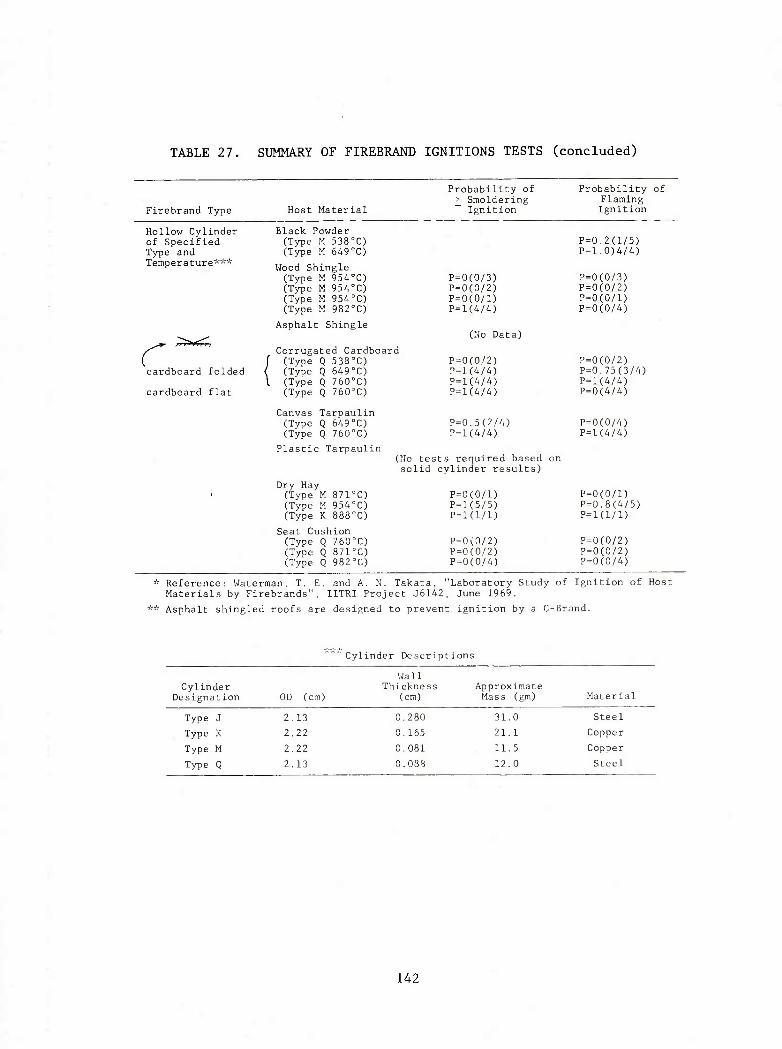
TABLE 27. SUMMARY OF FIREBRAND IGNITIONS TESTS (concluded)
Firebrand Type Host Material
Probability of > Smoldering
Ignition
Probability of Flaming Ignition
Hollow Cylinder of Specified Type and Temperature*-*
cardboard folded
cardboard flat
Black Powder (Type M 5380C) (Type M 6490C)
Wood Shingle (Type M 9540C) (Type M 9540C) (Type M 9540C) (Type M 9820C)
Asphalt Shingle
Corrugated Cardboard (Type Q 5380C) (Type Q 649°C) (Type Q 760oC) (Type Q 760°C)
Canvas Tarpaulin (Tyoe Q 649°C) (Type Q 760oC)
Plastic Tarpaulin
P=0(0/3) P=0(0/2) P=0(0/1) P=l(4/4)
(No Data)
P=0(0/2) P=l(A/4) P=l(4/4) P=l(4/4)
P=0.5(2/4) P=l(4/4)
Dry Hay (Type M 8710C) (Type M 9540C) (Type K 8880C)
Seat Cushion (Type Q 760oC) (Type Q 8710C) (Type Q 982°C)
(No tests required based on solid cylinder results)
P=0(0/1) P=l(5/5) P=l(l/1)
P=0(0/2) P=0(0/2) P=0(0/4)
P=0.2(1/5) P=l.0)4/4)
P=0(0/3) P=0(0/2) P=0(0/1) P=0(0/4)
P=0(0/2) P=0.75(3/4) P=l(4/4) P=0(4/4)
P=0(0/4) P=l(4/4)
P=0(0/1) P=0.8(4/5) P=l(l/1)
P=0(0/2) P=0(0/2) P=0(0/4)
* Reference: Waterman, T. E. and A. N. Takata, "Laboratory Study of Ignition of Host Materials by Firebrands", IITRI Project J6142, June 1969.
'* Asphalt shingled roofs are designed to prevent ignition by a C-Brand.
Cylinder Descriptions
Cylinder Designation OD (cm)
Wall Thickness
(cm) Approximate Mass (gm) Material
Type J 2.13
Type K 2.22
Type M 2.22
Type Q 2.13
0.280
0. 165
0.081
0.038
31.0 Steel
21.1 Copper
11.5 Copper
12.0 Steel
142

Hot Metal Cylinders
To characterize the ignition potential of metal fragments, it was decided to use a standard cylinder with variable wall thickness. Orig- inally it was felt that copper or brass would be most representative of metal fragments ejected from munitions fires. Unfortunately, after several tests it was noticed that the thin walled copper tubing being used deteriorated significantly during the tests. For this reason, later tests were done using hollow steel cylinders (1/2 inch black pipe drilled out). The following five metal "firebrands" were used during the study:
Solid copper cylinder (2.22 cm diameter x 2.54 cm long)
(Type J) Steel tube (2.13 cm OD, 0.277 cm wall, 31 gm mass)
(Type K) Copper tube (2.22 cm OD, 0.178 cm wall, 21.2 gm mass)
(Type M) Copper tube (2.22 cm OD, 0.081 cm wall, 11.5 gm mass)
(Type Q) Steel tube (2.13 cm OD, 0.11 cm wall, 12 gm mass)
Ignition will occur if the host material is exposed to a surface above some critical temperature for some minimum time period or to some material depth within the host. The thicker the tube wall is, the longer the high temperature will be maintained and the deeper the penetration of thermal energy into the host. The wall material will have some effect on the rate of cooling and the total quantity of energy stored, however when considering the nonuniform nature of the different hosts, the change from copper to steel should have a minor influence.
Black Powder requires a solid copper cylinder to be at about 4710C to cause ignition 50 percent of the time, whereas the 0.08 cm walled copper cylinder (Type M) must be at about 5790C for the same result.
Wood Shingle requires the solid copper cylinder to be somewhere between 760 C and 9540C for flaming ignition 50 percent of the time. The thin walled cylinders could only cause smoldering ignition when heated to 9830C, and only the Type Q cylinder (thickest wall) could achieve this result.
Asphalt Shingles were ignited (flaming) by the solid copper cylinder at 9830C but not at 760oC.
Corrugated Cardboard was ignited (always smoldering and usually flaming) by the solid copper at 6490C but not at 5380C. The hollow Type Q cylinder would always initiate smoldering at 6490C and above (but not at 5380C) and would generally cause flaming if the cardboard was creased. Flaming never occurred if the cardboard lay flat on the test table,
143

Canvas Tarpaulin was ignited by the solid copper at 6490C (always smoldering and generally flaming) but not at 5380C. If was slightly more difficult to ignite the canvas with the hollow cylinder. Smolder- ing ignition occurred half the time at 6490C and flaming always oc- curred at 760oC.
Plastic Tarpaulin folded over two layers thick could not be ig- nited by the metal firebrands. The plastic merely melted away from the brand forming a hole.
Dry Timothy Hay (simulating a typical dry grass) will ignite to the smoldering state 50 percent of the time if a solid copper cylinder just below 5380C is dropped onto it. Flaming ignition will be caused 50 percent of the time by a solid cylinder between 6490C and 760oC. Hollow cylinders (Type M and K) were found to require a temperature between 8710C and 9540C for smoldering or flaming ignition 50 percent of the time.
The Seat Cushion hosts consisted of the following: A mock seat corner was constructed of two 0.64-cm plywood sheets connected to each other at right angles with different coverings for the seat back and seat bottom. The seat back consisted of a layer of burlap on the ply- wood, a 3,81 cm thick layer of cotton batting over the burlap and a vinyl covering about 0.95 cm thick consisting of vinyl over foam plastic backed with a thin cotton mesh. The seat bottom was identical except a 1.91 cm thick layer of urethane foam was placed between the cotton batting and the vinyl covering.
It was found that the solid cylinder must be 760oC to induce smoldering ignition 40 percent of the time, whereas the Type Q hollow cylinder could not cause ignition even if at 9820C.
The test results are summarized in Table 28. In the table, an attempt was made to Identify any similarities in the ignition poten- tials between the different firebrands. In very rough terms, perhaps the solid copper at about 4710C and 6490C is equivalent to the metal tube at 593 C and 9820C respectively. In general, smoldering card- board and flaming wood (C-brand) will cause ignition of many "real world" host materials. M30 pellets can also ignite several of the hosts tested. Black powder was found to burn so quickly that it could not ignite anything except more black powder. Hot metal fragments are capable of igniting any of the host materials except the plastic tarpaulin. The solid copper cylinders at temperatures from 4270C (for igniting black powder) to 9820C (for igniting asphalt shingles) are of interest as firebrands. Thin walled hollow metal cylinders at from 538 C to 9820C are also possible ignition sources.
144

TABLE 28. EQUIVALENCY OF FIREBRAND IGNITION POTENTIAL
Firebrand
Host Material Cardboard C-Brand M30 Pellets
Solid Copper
1/2 inch Pipe
Black Powder
Ignites Ignites Ignites 4710C (P~0.5)
5790C (P-0.5)
Wood Shingle
P~0.8 P>0.5 No Ignition
760oC- 9540C (flame P=0.5)
9540C (smolder P-0.5)
Cardboard Ignites P>0.8 P~0.8 Between 5380C
and 6490C (P-0.5)
Between 5380C
and 6490C (P-0.5)
Asphalt Shingle
■
No Ignition
No Ignition
Between 760oC
and 9820C (P-0.5)
Canvas Tarpaulin
Ignites P>0.7 P~0.4 (smolder)
6490C (P=0.83)
6490C (P-0.5 smolder) 760oC
(P=l flame)
Plastic Tarpaulin
No Ignition
P=0.8 (smolder) P=0.6 (flame)
No Ignition
at 8710C No
Ignition
Dry Hay Ignites Ignites Ignites 5380C (P=0.6
smolder) 6490C (P-0.2 flame)
9540C (P=l smolder) and (P=0.8
flame)
Seat Cushion
No Ignition
Ignites No Ignition
6490C and 760°C (P-0.4 smolder)
at 9820C No
Ignition
145
When the ignition potentials of the different types of firebrands were characterized, a technique for identifying potentially hazardous firebrands in field tests was sought. In field tests to be conducted while developing the classification test under this or future projects, a technique may be required to catch firebrands produced in a munitions fire and determine (roughly at least) which firebrands are potentially hazardous. In the first part of this work, we have characterized the ignition potential of several types of firebrands. In the second part of the firebrand study, several candidate field catcher materials were experimentally evaluated using the following firebrands to characterize the catcher material's response to different stimuli:
• smoldering corrugated cardboard
• C-brand
• M30 pellet
o solid copper cylinder at 4270C, 5380C, 6490C, 760oC, 8710C and 9830C
• hollow steel cylinder (Type Q) at 5380C, 6490C, 760oC, 8710C and 9830C
The catcher materials which were evaluated are:
• Fire retarded polyethylene foam sheet 5.08 cm thick (Dow Chemical Eytha Foam 4104)
• Fire retarded polyurethane foam sheet 5.08 cm thick (Dow Chemical)
• Polyethylene foam covered with intumescent paint*
• Polyurethane foam covered with intumescent paint*
• Kraft paper covered with intumescent paint*
• Three layers of asphalt smooth roofing felt
• Matrix of milk cartons filled with water of known initial temperature and mass
The tests actually completed are summarized in Table 29 and some of the test results are described in Tables 30 through 32. The test results are discussed below.
The intumescent paint was Benjamin Moore Brand fire retarding paint,
146

TABLE 29. SUMMARY OF EXPERIMENTAL EVALUATION OF CANDIDATE CATCHER MATERIALS (TESTS COMPLETED)
Brand Type Wind
1/2 Inch Solid Velocity Catcher P ipe Copper Cardboard M-30 C-Brand (mph)
Polyethylene, painted X X X X X 5-6
Polyethylene, unpainted X X X X X 5-6
Polyurethane, painted X X X X X 5-6
Polyurethane, unpainted X X X X X 5-6
Kraft Paper, painted X X X X X 5-6
Kraft Paper, unpainted X X X X X 5-6
Smooth Asphalt Roofing X X X X X 5-6
Polyethylene, painted X X 0
Polyethylene, unpainted X X C
Kraft Paper, painted X X 0
Kraft Paper, unpainted X X 0
Milk Carton filled with water X X X 0
Polyethylene Foam
Polyethylene foam was tested both plain and coated with intumes- cent paint. The basic concept was to characterize firebrands based on the volume of the hole volatilized in the foam, i.e., the vola- tilized volume might be correlated to the materials heat of vaporiza- tion. An intumescent paint coating was tried in order to slow down the firebrand's penetration into the foam. In the case of the polyethylene foam, the effect of the intumescent paint was to more effectively hold heat in the vaporizing hole and in many cases to initiate a fire. For the polyethylene, the paint caused the catcher to be damaged more than the unpainted catcher and consequently caused the results to be much more random and meaningless. The painted polyethylene was clearly less desirable than the unpainted foam and was therefore eliminated.
147

TABLE 30. UNPAINTED POLYETHYLENE CATCHER (7-9 fps wind velocity)
Firebrand Result
Hole Volume (ml) if
Applicable
1. Cardboard
2. Cardboard 3. Cardboard 4. C-Brand 5. C-Brand
6. M30 Pellet 7. M30 Pellet 8. Solid Copper
(9830C) 9. Solid Copper
(871°C) 10. Solid Copper
(760oC)
11. Solid Copper (6490C)
12. Solid Copper (5380C)
13. Solid Copper (4270C)
14. 1/2 inch Pipe (9830C)
15. 1/2 inch Pipe (8710C)
16. 1/2 inch Pipe (760oC)
17. 1/2 inch Pipe (6490C)
18. 1/2 inch Pipe (5380C)
19. 1/2 inch Pipe (4270C)
Flaming ignition of catcher, had to be put out with water Vaporized region Vaporized region Vaporized region (No wind) Vaporized region
Vaporized region (No wind) Vaporized region
Vaporized region
Vaporized region
Vaporized region
Vaporized region
Vaporized region
Vaporized region
Vaporized region
Vaporized region
Vaporized region
Vaporized region
Vaporized region
Vaporized region
NA
230 910 75
137
38 20
480
190
135
98
93
72
179
149
91
63
44
42
The unpainted polyethylene gave generally good results, except that most of the firebrands formed a hole all the way through the 5.08 cm thick sheet. Had the sheets been considerably thicker, the hole depth or total volume vaporized would have been better parameters for correlating the data. From Table 30, we see that the hole volumes for solid copper at 4270C, 5380C, 760oC and 8710C roughly correspond to the volumes for the 1/2 inch pipe at 6490C, 760oC, 8710C and 9820C, respectively. Thus there is some correlation to the ignition test
148

results indicated. The main problem with the polyethylene is its ease of vaporization and potential for flaming ignition by the stronger firebrands,
Unpainted Polyurethane Foam
The unpainted polyurethane acted similar to the unpainted poly- ethylene, except it has a greater tendency to become ignited. From Table 31, we see that the solid copper produced voids at 427°C, 5380C and 6490C which had roughly the same volumes as produced by the 1/2 inch pipe at 5380C, 6490C and 760oC, respectively. This does not correlate quite as well as the polyethylene results, although there is a clear ranking within each group of metal firebrands.
TABLE 31. UNPAINTED POLYURETHANE FOAM (7-8 fps wind velocity)
Hole Volume (ml) if
Firebrand Result Applicable
1. Cardboard Very nonuniform hole, maximum depth 1.25 cm
48
2. C-Brand Flaming, put out with water N/A(>165) 3. M30 Pellet Foam flamed at first then died 41 4. Solid Cooper
(9830C) Flaming, put out with water N/A(>248) 5. Solid Copper
(8710C) Hole vaporized 121
6. Solid Copper (760oC) Hole vaporized 106
7. Solid Copper (6490C) Hole vaporized 54
8. Solid Copper (5380C) Hole vaporized 34
9. Solid Copper (4270C) Hole vaporized 29
10. 1/2 inch Pipe Strong flame, extinguished (9830C) with water N/A(>525)
11. 1/2 inch Pipe (8710C) Hole vaporized 79
12. 1/2 inch Pipe (760oC) Hole vaporized 67
13. 1/2 inch Pipe (6490C) Hole vaporized 38
14. 1/2 inch Pipe (5380C) Hole vaporized 23
15. 1/2 inch Pipe (4270C) Hole vaporized 1
149

TABLE 32. PAINTED POLYURETHANE FOAM (7-9 fps wind velocity)
Firebrand
1. Cardboard
2. C-Brand
3. M30 Pellet 4. Solid Copper
(9830C) 5. Solid Copper
(8710C)
6. Solid Copper (760oC)
7. Solid Copper (6490C)
8. Solid Copper (5380C)
9. Solid Copper (4270C)
10. Solid Copper (4270C)
11. 1/2 inch Pipe (9830C)
12. 1/2 inch Pipe (8710C)
13. 1/2 inch Pipe (760oC)
14. 1/2 inch Pipe (6490C)
15. 1/2 inch Pipe (5380C)
16. 1/2 inch Pipe (4270C)
Result
Scorch mark on paint outlining firebrand Scorch mark on paint and small hole Only small scorch mark on paint
Hole vaporized in foam
Hole vaporized in foam
Hole vaporized in foam
Hole vaporized in foam
Hole vaporized in foam
Hole vaporized in foam
Hole vaporized in foam
Hole vaporized in foam
Hole vaporized in foam
Hole vaporized in foam Small half moon shaped scorch mark Small half moon shaped scorch mark
Did not accomplish test
Hole Volume (ml) if
Applicable
N/A
7
N/A
73
64
45
47
2
2
4
35
22
6.5
N/A
N/A
N/A
Painted Polyurethane Foam
Unlike with the p icant fire retarding e summarized in Table 32 left little more than were somewhat descript brand that was there, significantly smaller catcher produced minor
olyethylene, the intumescent paint had a signif- ffect on the polyurethane. The test results are
The cardboard, C-brand and M30 pellets all scorch marks on the painted surface. The marks ive in terms of helping to identify the type of The holes formed by the hot metal pieces were
than those produced in the other catchers. This holes or just scorch marks for the 1/2 inch
150

pipe at 760oC and below and for the solid copper cylinder at 5380C and below. Also the 1/2 inch pipe at 9820C produced about the same size holes as would be expected for the copper cylinder at 6490C. This catcher shows promise both in terms of withstanding the firebrands (not burning up or melting through easily) and is roughly quantifying the stimulus for hot metal fragments. This material cost $26 per 5.08 cm x 0.91 mx 2.74 m slab, which is not prohibitive for the ap- plication envisioned.
Additional Catchers Evaluated
Several other catchers were also tried. Open-topped milk cartons filled with a measured quantity of water were studied. In the field, it was envisioned that a matrix of such containers would be set out. Hot metal fragments could be characterized reasonably well by the rise in temperature of the water, while burning firebrands would be extin- guished and preserved. Although the concept has some promise it was found that the water temperature cooled fairly quickly after the ini- tial rise that was due to the firebrand. To record the peak tempera- ture for each cell (milk carton), a thermocouple would be needed for each. The number of channels required and other difficulties in handling the matrix in the field make the concept impractical.
Unpainted Kraft paper was tried but merely became ignited under many of the stimuli. Painted Kraft paper and smooth asphalt roofing (three layers thick) left descriptive marks which could be used to identify different types of brands. To use these catchers In the field, a catalogue of responses to known firebrands would be used to compare markings to those produced in the field testing. Clearly, some judgement would be required to label the firebrands using their burn marks in this manner.
In summary, all of the concepts except the milk cartons could be used to roughly characterize the firebrands in field testing by comparison to a catalogue of known firebrand responses. Painted polyethylene was found to be made too flammable for many of the brands and unpainted polyethylene, although acceptable, still ignited in some cases and produced large holes. Unpainted polyurethane again was ignited by some of the more intense brands, but the intumescent paint eliminated this problem and still allowed holes to be formed which roughly quantify the thermal characteristics of the hot metal pieces. This appears to be the best of the options tested. Unpainted Kraft paper generally burned, while painted Kraft paper and smooth asphalt roofing provided burn or melt marks which could be character- ized using a catalogue of known responses.
151

REFERENCES
1. Berl, W. G., editor, International Symposium on the Use of Models in Fire Research, National Academy of Sciences - National Research Council, Publication 786, Washington, DC, 1961,
2. Takata, A. N., Review of Fire Hazard Distances, IITRI Final Report J6194 for Armed Services Explosives Safety Board (Contract DAHC04-70-C-0013), April 1970.
3. Yates, H., Total Transmission of the Atmosphere in the Near- Infrared, Naval Research Laboratory Report 3858, September 1951.
4. Hamilton, D. C. and Morgan W. R., "Radiant Interchange Configura- tion Factors", Technical Note 2836, National Advisory Committee for Aeronautics, Washington, DC, December 1952.
5. Thomas, P. H., "The Size of Flames from Natural Fires", 9th Inter- national Symposium on Combustion, 1962.
6. Friedman, R., "Aerothermodynamics and Modeling Techniques for Prediction of Plastic Burning Rates", Journal of Fire and Flam- mability ,2, July 1971, p 240.
7. Markstein, G. H., Scaling of Radiative Characteristics of Turbu- lent Diffusion Flames, Factory Mutual Research Corporation Tech Report 22361-4, June 1976.
8. Nielson, H. J. and Tao, L. N., "The Fire Plume Above a Large Free- Burning Fire", 10th International Symposium on Combustion, 1965.
9. Steward, F. R., "Linear Flame Heights for Various Fuels", Combus- tion and Flame 8, September 1964.
10. Steward, F, R., "Prediction of the Height of Turbulent Diffusion Buoyant Flames", Combustion Science and Technology 2, 1970.
11. Fang, J. B., Analysis of the Behavior of a Freely Burning Fire in a Quiescent Atmosphere, NBSIR73-115, February 1973 (NTIS PB-226 907).
12. Welker, J. R. and Sliepcevich, C. M., "Bending of Wind-Blown Flames from Liquid Pools", Fire Technology 2(2), May 1966.
13. Welker, J. R. and Sliepcevich, C. M., "Burning Rates and Heat Transfer from Wind-Blown Flames", Fire Technology 2^(3), August 1966.
152

14. Eichler, T., Wledermann, A. and Pape, R., Study of Liquid Natural Gas (LNG) Spill, Dispersion, and Combustion Phenomenology, IIT Research Institute Final Report J6481 for Argonne National Labora- tory, May 1980,
15. Waterman, T. E., Scaling of Fire Conditions Supporting Room Flashover, DASA Report 2031, December 1967.
16. Busby, A. L. and Plgman, G. L., Roof Ventilation Requirements for Industrial Plants, Final Report for Project L565, Armour Research Foundation, July 1955.
17. Heskestad, G., Model Study of Automatic Smoke and Heat Vent Per- formance In Sprlnklered Fires, Factory Mutual Research Corporation Tech Report 21933 RC74-T-29, September 1974.
18. Hesse, W. J. and Mumford, N.V.S., Jr., Jet Propulsion for Aerospace Applications, 2nd edition. Pitman Publishing Corporation, New York, 1964.
19. Tarlfa, Carlos, S., Transport and Combustion of Firebrands II, Study Conducted for Department of Agriculture, Forest Service on Grants FG-SP-114 and FG-SP-146, May 1967.
20. Garden, R., "An Instrument for the Direct Measurement of Intense Thermal Radiation", Rev. Scl. Inst. 24(5), May 1953, pp 366-370.
21. Alvares, N. J., Heat Transfer from a Burning Cotton Cloth to an Adjacent Isothermal Wall, MS Thesis, University of Minnesota, February 1969,
22. Agate, F. J., et al, "The Realities of Fabric Flammablllty", Proc. Sec. Annual Meeting, Info. Council on Fabric Flammablllty, December 1968, pp 7-29.
23. Webster, C. T. , Wraight, H.G.H. and Thomas, P. H., "Heat Transfer from Burning Fabrics", J. Textile Institute 53(1), January 1962, pp T29-T37.
24. Fire Research-1964, Department of Scientific and Industrial Research and Fire Offices' Committee, Joint Fire Research Organization, London, 1965.
25. Sterbutzel, G. A., Taking the Measurement of Heat-Thermal Instru- mentation Research, Research Trends, Technical Quarterly of Cornell Aeronautical Laboratory, Buffalo, NY, Spring-Summer 1965.
26. Waterman, T. E,, "A Calorimeter for Separating Radiative and Con- vective Heat", Fire Technology 4(2), May 1968.
153

27. 1979 Temperature Measurement Handbook, Omega Engineering Inc, Stamford, Connecticut.
28. Walker, J. D. and Stocks, B. J., "Thermocouple Errors in Forest Fire Research", Fire Technology 4(1), February 1968.
29. Waterman, T. E., et al. Predictions of Fire Damage to Instllations and Built-Up Areas from Nuclear Weapons - Phase III, Experimental Studies, Appendix G, National Military Command Systems Support Center, Contract DCA-8, November 1964.
30. Palmer, T. Y., "Comparison of Aspirated and Radiation-Compensating Thermocouples", Fire Technology 6(3), August 1970.
31. Daniels, G. E., "Gas Temperature and the Radiation Compensating Thermocouple", J. Applied Meterology 7, 1968.
32. Fire Research-1956, Department of Scientific and Industrial Research and Fire Officers' Committee, Her Majesty's Stationery Office, London, 1957.
33. Land, R,, "Fan Anemometer in Fire Test", Appendix B of the Large- Scale Bedroom Fire Test by Cruce, P. A. and Emmons, H. W., FMRC Serial Number 21011.4, July 1974.
34. Heskestad, G., "Bidirectional Flow Tube for Fire-Induced Vent Flows", Appendix K of the Large-Scale Bedroom Fire Test by Cruce, p- A. and Emmons, H. W., FMRC Serial Number 21011,4, July 1974.
35. Merzkirch, W., "Making Fluid Flows Visible", American Scientist 67^(3), May-June 1979.
154
![LG FFH-5500[1]](https://static.fdocuments.net/doc/165x107/55cf9a0e550346d033a045cc/lg-ffh-55001.jpg)


![Ffh St Edwards40209[1]](https://static.fdocuments.net/doc/165x107/554c12f6b4c905f1518b4b07/ffh-st-edwards402091.jpg)