CSR 報告書 2014 CSR REPORT 2014DOWA S報告書は、DOWA グループのCSRのえ方と主な動につ いて、すべてのステークホルダーの方々にわかりやすくお伝えすることを

CSR Activity 2019Data Book
ContentsP.1
P.25
P.31
■ 環境報告Environmental Report
■ 社会性報告Social Report
■ コーポレート・ガバナンスCorporate Governance
ニッポンハムグループ
Issued on June 25, 2019
2019年6月25日発行※環境報告に掲載している「前年度比」は端正処理前の数値をもとに算出しています。* Percentage points from the previous year in the Environment Report is calculated based on figures before being rounded.

環境目標 Environmental targets
Environmental Report
中期経営計画2020の進捗状況 Progress of Medium-Term Management Plan 2020
「新中期経営計画パート5」結果 Results of the New Medium-Term Plan Part5
※1 製品の製造数量あたりの原単位* 1 Primary unit per unit of product.
※1 製品の製造数量あたりの原単位* 1 Primary unit per unit of product.
※2 用水使用量には、生産部門において一部推計を含む* 2 Water consumption includes some estimated values from
production departments.
※2 用水使用量には、生産部門において一部推計を含む* 2 Water consumption includes some estimated values from
production departments.
※5 2018年に発生した台風21号及び北海道胆振東部地震に伴う廃棄物は除く* 5 Excluding the waste from Typhoon No.21 and the Hokkaido Eastern Iburi
earthquake in the FY 2018.
※3 ファーム糞尿を除く* 3 Excluding farm excreta.
※3 ファーム実績を除く* 3 Excluding farm results of farm.
※4 基準値からの削減率* 4 Reduction rate from reference value.
※4 基準値からの削減率* 4 Reduction rate from reference value.
取組項目 Initiatives
基準値Reference value
2012~2016年度平均値Average (FY2012-FY2016 )
目標値Target value
2018~2020年度平均値Average (FY2018-FY2020)
削減率※4
Reduction*4
2018年度進捗(基準値より)FY 2018 Progress (based on the reference value)
削減率Reduction
地球温暖化防止 Mitigation of climate change CO2発生量原単位※1 CO2 emissions *1 701.1kg-CO2/t 645.1kg-CO2/t 8.0% 648.1kg-CO2/t 7.6%
省資源の取り組み Resource saving
熱量原単位※1 Thermal energy*1 012.0GJ/t 011.0GJ/t 8.0% 011. 6GJ/t 3.3%
用水使用量原単位※1※2 Water consumption*1*2 017.7m3/t 017.2m3/t 3.0% 018.6m3/t ▲5.1%
廃棄物排出量原単位※1※3 Discharged waste*1*3 207.5kg/t 195.1kg/t 6.0% 226.2kg/t ▲9.0%
再資源化の推進 Promotion of recycling 廃棄物リサイクル率 Waste recycling rate 090.8% 094.0%以上 - 088.5% -
改善項目 Improvement items
基準値Reference valuee
2005~2010年度平均値Average (FY2005-FY2010)
中計パート5 目標値Target value
2015~2017年度平均値Average (FY2015-FY2017)
削減率※4
Reduction*4
中計パート5 結果(未達成)Result (Unachieved target)
2015~2017年度平均値Average (FY2015-FY2017)
削減率Reduction
地球温暖化防止 Mitigation of climate change CO2排出量※1 CO2 emissions 816.2kg-CO2/t 665.2kg-CO2/t 18.5% 686.2kg-CO2/t (21.0kg-CO2/t) 15.9%
省資源の取り組み(コストダウンへの取り組み) Resource saving
熱量※1 Thermal energy*1 013.6GJ/t 011.4GJ/t 16.0% 011.7GJ/t(0.3GJ/t) 13.7%
用水使用量※1※2 Water consumption*1*2 017.9m3/t 017.2m3/t 4.0% 018.0m3/t(0.1m3/t) ▲0.6%
廃棄物発生量※1※3 Generated waste*1*3 245.8kg/t 231.1kg/t 6.0% 240.3kg/t(9.2kg/t) 2.3%
再資源化の推進 Promotion of recycling 廃棄物リサイクル率 Waste recycling rate 095.8% 098.0%以上 - 094.6% -
環境報告
1
CO2排出量の割合 Breakdown of CO2 Emissions
Environmental Report
項目 Items 2014年度FY2014
2015年度FY2015
2016年度FY2016
2017年度FY2017
2018年度FY2018
食品工場 Food plants 055.9 059.4 058.6 055.7 55.8
生産・飼育の施設や牧場 Livestock breeding facilities and feedlots
017.8 017.0 017.6 018.2 18.1
物流センター・営業所等 Logistics centers, Sales offices and etc
013.9 012.4 011.0 013.7 13.9
食肉の処理・加工工場等 Fresh meat processing and plants
012.4 0012.4 012.8 012.4 12.2
合計 Total 0100.0% 0100.0% 0100.0% 100.0% 100.0%
環境報告
項目 Items 2014年度FY2014
2015年度FY2015
2016年度FY2016
2017年度FY2017
2018年度FY2018
前年度比Change from Previous Year
CO2排出量(千t-CO2)
CO2 emissions(thousand tons -CO2)
524.0 540.5 560.7 517.1 516.7 99.9%
排出量原単位(kg-CO2/t)
Emission intensity(kg-CO2/t)
688.0 709.9 708.5 640.9 648.1 101.1%
※ 温室効果ガスについては、算定シナリオを見直したことにより、一部実績がこれまでの情報と異なる場合があります* GHG emission data may differ from past disclosures due to revised calculation methods.
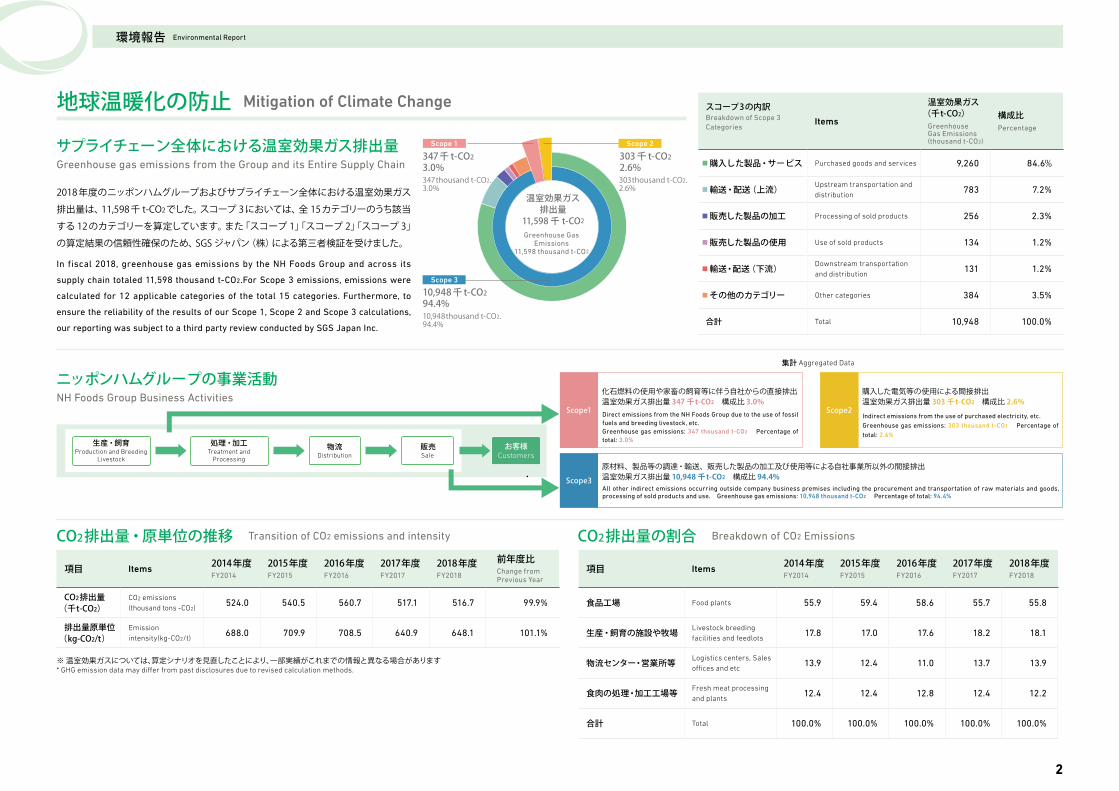
地球温暖化の防止 Mitigation of Climate Change
CO2排出量・原単位の推移 Transition of CO2 emissions and intensity
サプライチェーン全体における温室効果ガス排出量Greenhouse gas emissions from the Group and its Entire Supply Chain
2018 年度のニッポンハムグループおよびサプライチェーン全体における温室効果ガス排出量は、11,598 千 t-CO2でした。スコープ 3 においては、全 15カテゴリーのうち該当する 12 のカテゴリーを算定しています。また「スコープ 1」「スコープ 2」「スコープ 3」の算定結果の信頼性確保のため、SGS ジャパン(株)による第三者検証を受けました。
In fiscal 2018, greenhouse gas emissions by the NH Foods Group and across its
supply chain totaled 11,598 thousand t-CO2.For Scope 3 emissions, emissions were
calculated for 12 applicable categories of the total 15 categories. Furthermore, to
ensure the reliability of the results of our Scope 1, Scope 2 and Scope 3 calculations,
our reporting was subject to a third party review conducted by SGS Japan Inc.
Scope 1
347thousand t-CO2.3.0%
10,948thousand t-CO2.94.4%
303thousand t-CO2.2.6%
Scope 2
温室効果ガス排出量
11,598 千 t-CO2
347 千 t-CO2
3.0%303 千 t-CO2
2.6%
10,948 千 t-CO2
94.4%
Scope 3
Greenhouse Gas Emissions
11,598 thousand t-CO2
スコープ3の内訳Breakdown of Scope 3 Categories
Items
温室効果ガス (千t-CO2)
Greenhouse Gas Emissions (thousand t-CO2)
構成比Percentage
■ 購入した製品・サービス Purchased goods and services 9,260 84.6%
■ 輸送・配送 (上流) Upstream transportation and distribution
0,783 07.2%
■ 販売した製品の加工 Processing of sold products 0,256 02.3%
■ 販売した製品の使用 Use of sold products 0,134 01.2%
■ 輸送・配送 (下流) Downstream transportation and distribution
0,131 01.2%
■ その他のカテゴリー Other categories 0,384 03.5%
合計 Total 10,948 100.0%
ニッポンハムグループの事業活動 NH Foods Group Business Activities
生産・飼育Production and Breeding
Livestock
処理・加工Treatment and
Processing
物流Distribution
販売Sale
お客様Customers
集計 Aggregated Data
原材料、製品等の調達・輸送、販売した製品の加工及び使用等による自社事業所以外の間接排出 温室効果ガス排出量 10,948 千t-CO2 構成比 94.4%
化石燃料の使用や家畜の飼育等に伴う自社からの直接排出温室効果ガス排出量 347 千t-CO2 構成比 3.0%
All other indirect emissions occurring outside company business premises including the procurement and transportation of raw materials and goods, processing of sold products and use. Greenhouse gas emissions: 10,948 thousand t-CO2 Percentage of total: 94.4%
Direct emissions from the NH Foods Group due to the use of fossil fuels and breeding livestock, etc.Greenhouse gas emissions: 347 thousand t-CO2 Percentage of total: 3.0%
Scope1
Scope3
Scope2
購入した電気等の使用による間接排出温室効果ガス排出量 303 千t-CO2 構成比 2.6%
Indirect emissions from the use of purchased electricity, etc.
Greenhouse gas emissions: 303 thousand t-CO2 Percentage of
total: 2.6%
2
Environmental Report環境報告
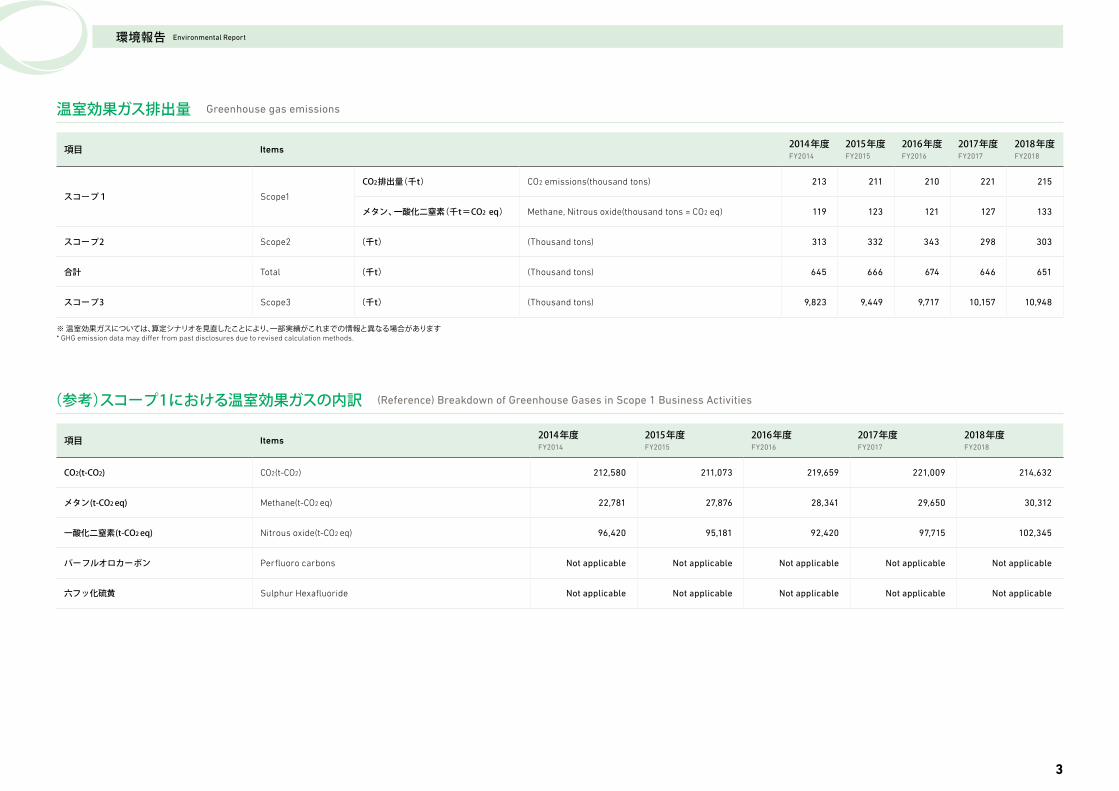
(参考)スコープ1における温室効果ガスの内訳 (Reference) Breakdown of Greenhouse Gases in Scope 1 Business Activities
温室効果ガス排出量 Greenhouse gas emissions
項目 Items 2014年度FY2014
2015年度FY2015
2016年度FY2016
2017年度FY2017
2018年度FY2018
CO2(t-CO2) CO2(t-CO2) 212,580 211,073 219,659 221,009 214,632
メタン(t-CO2 eq) Methane(t-CO2 eq) 022,781 027,876 028,341 29,650 30,312
一酸化二窒素(t-CO2 eq) Nitrous oxide(t-CO2 eq) 096,420 095,181 092,420 97,715 102,345
パーフルオロカーボン Perfluoro carbons Not applicable Not applicable Not applicable Not applicable Not applicable
六フッ化硫黄 Sulphur Hexafluoride Not applicable Not applicable Not applicable Not applicable Not applicable
項目 Items 2014年度FY2014
2015年度FY2015
2016年度FY2016
2017年度FY2017
2018年度FY2018
スコープ1 Scope1
CO2排出量(千t) CO2 emissions(thousand tons) 213 211 210 221 215
メタン、一酸化二窒素(千t=CO2 eq) Methane, Nitrous oxide(thousand tons = CO2 eq) 119 123 121 127 133
スコープ2 Scope2 (千t) (Thousand tons) 313 332 343 298 303
合計 Total (千t) (Thousand tons) 645 666 674 646 651
スコープ3 Scope3 (千t) (Thousand tons) 9,823 9,449 9,717 10,157 10,948
※ 温室効果ガスについては、算定シナリオを見直したことにより、一部実績がこれまでの情報と異なる場合があります* GHG emission data may differ from past disclosures due to revised calculation methods.
3

省資源の取り組み Resource Saving Initiatives
Environmental Report
電力使用量・原単位の推移 Transition of Electricity Consumption and Consumption Per Unit of Production
項目 Items 2014年度FY2014
2015年度FY2015
2016年度FY2016
2017年度FY2017
2018年度FY2018
前年度比Change from Previous Year
電力使用量(百万kWh) Electricity Consumption (million kWh) 568.8 572.5 584.3 581.1 590.0 101.5%
使用量原単位(kWh/t) Consumption per Unit of Production (kWh/t) 747.0 752.0 738.3 720.2 740.0 102.7%
環境報告
電力使用量の割合 Breakdown of Electricity Consumption
項目 Items 2014年度FY2014
2015年度FY2015
2016年度FY2016
2017年度FY2017
2018年度FY2018
食品工場 Food plants 058.1 058.5 058.9 058.9 058.6
生産・飼育の施設や牧場 Livestock breeding facilities and feedlots 012.9 013.1 013.1 012.9 013.2
物流センター・営業所等 Logistics centers, Sales officers and etc 016.9 016.2 015.8 016.1 016.1
食肉の処理・加工工場等 Fresh meat processing and plants 012.1 012.1 012.2 012.0 012.1
合計 Total 100.0% 100.0% 100.0% 100.0% 100.0%
4

Environmental Report環境報告
燃料使用量の割合 Breakdown of Fuel Consumption
項目 Items 2014年度FY2014
2015年度FY2015
2016年度FY2016
2017年度FY2017
2018年度FY2018
食品工場 Food plants 056.3 056.0 055.7 055.3 55.9
生産・飼育の施設や牧場 Livestock breeding facilities and feedlots 023.5 022.4 022.6 023.5 22.9
物流センター・営業所等 Logistics centers, Sales offices and etc 008.7 010.2 009.9 009.5 9.8
食肉の処理・加工工場等 Fresh meat processing and plants 011.6 011.4 011.8 011.7 11.4
合計 Total 100.0% 100.0% 100.0% 100.0% 100.0%
項目 Items 2014年度FY2014
2015年度FY2015
2016年度FY2016
2017年度FY2017
2018年度FY2018
前年度比Change from Previous Year
燃料使用量(千kl) Fuel Consumption (thousand kl) 087.2 087.1 091.2 092.1 90.6 98.4%
→内、車両燃料以外(千kl) Amount of the above other than vehicle fuel (thousand kl) 074.0 074.6 078.6 080.9 79.7 98.5%
→内、車両燃料 (千kl) Amount of the above that is vehicle fuel (thousand kl) 013.0 012.6 012.6 011.2 10.9 097.3%
使用量原単位 (l/t) Consumption Per Unit of Production (l/t) 114.5 114.4 119.8 114.1 113.7 099.6%
燃料使用量・原単位の推移 Transition of Fuel Consumption and Consumption Per Unit of Production
※ 燃料は原油換算されたものです。* Fuel is crude oil eguivalent value.
5

項目 Items 2014年度FY2014
2015年度FY2015
2016年度FY2016
2017年度FY2017
2018年度FY2018
前年度比Change from Previous Year
廃棄物発生量(千t) Waste Generation (thousand tons) 395.7 402.1 416.6 423.1 434.7 102.7%
発生量原単位 (kg/t) Waste Generation Per Unit of Production (kg/t) 519.4 508.1 526.4 524.4 545.3 0104.0%
Environmental Report環境報告
廃棄物発生量の割合 Breakdown of Waste Generation
廃棄物の内訳 Breakdown of Waste Generation
廃棄物発生量・原単位の推移 Transition of Waste Generation and Waste Per Unit of Production
項目 Items 2014年度FY2014
2015年度FY2015
2016年度FY2016
2017年度FY2017
2018年度FY2018
食品工場 Food plants 019.9 020.6 023.3 021.4 20.5
生産・飼育の施設や牧場 Livestock breeding facilities and feedlots 054.8 055.0 052.9 055.1 54.2
物流センター・営業所等 Logistics centers, Sales offices and etc 001.8 001.7 001.8 001.8 1.9
食肉の処理・加工工場等 Fresh meat processing and plants 023.5 022.7 021.9 021.7 23.4
合計 Total 100.0% 100.0% 100.0% 100.0% 100.0%
項目 Items 2014年度FY2014
2015年度FY2015
2016年度FY2016
2017年度FY2017
2018年度FY2018
廃棄物発生量(t) Waste Generation (t) 395,651 402,076 416,569 423,080 434,709
再生利用量(t) Recycling of waste (t) 375,421 386,055 393,812 398,738 405,250
最終処分量 (t) Final Disposal waste (t) 16,639 16,021 16,718 16,896 20,295
再資源化率 (%) Recycling Rate (%) 94.9% 94.9% 94.6% 94.3% 93.6%
※ 2018年に発生した台風21号及び北海道胆振東部地震に伴う廃棄物は除く* Excluding the waste from Typhoon No.21 and the Hokkaido Eastern Iburi earthquake in the FY 2018.
※ 2018年に発生した台風21号及び北海道胆振東部地震に伴う廃棄物は除く* Excluding the waste from Typhoon No.21 and the Hokkaido Eastern Iburi earthquake in the FY 2018.
6
項目 Items 2014年度FY2014
2015年度FY2015
2016年度FY2016
2017年度FY2017
2018年度FY2018
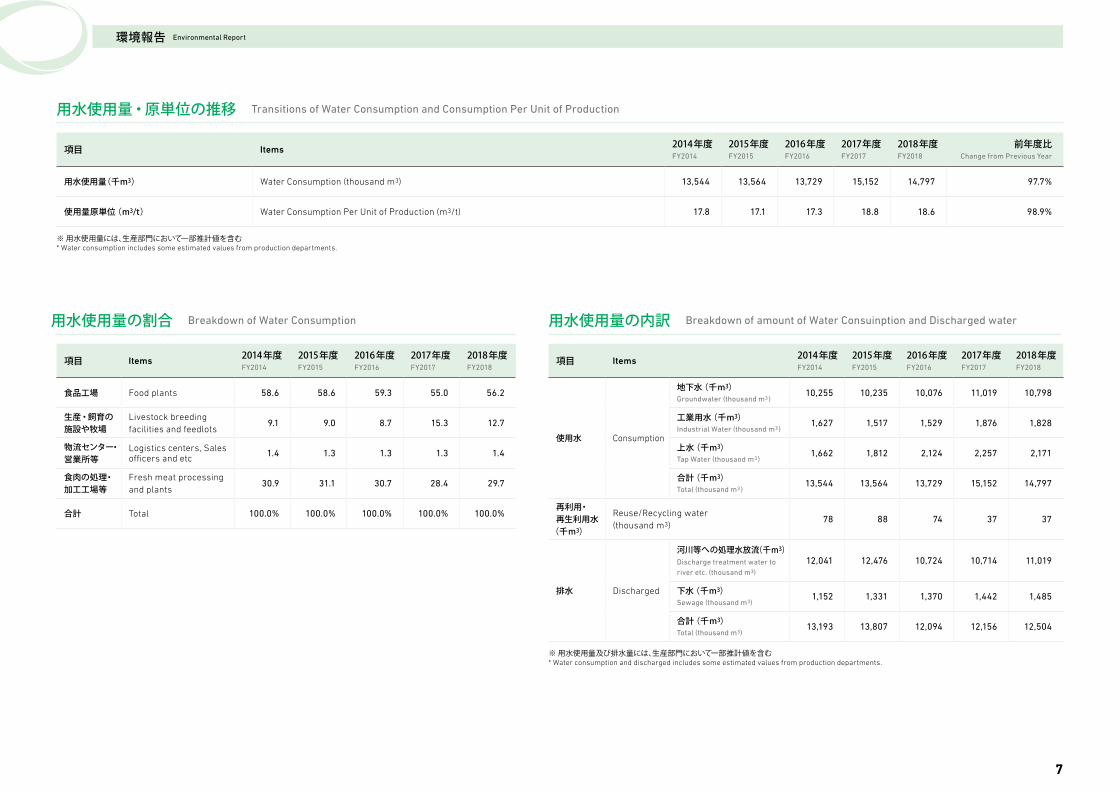
使用水 Consumption
地下水 (千m3)Groundwater (thousand m3)
10,255 10,235 10,076 11,019 10,798
工業用水 (千m3)Industrial Water (thousand m3)
1,627 1,517 1,529 1,876 1,828
上水 (千m3)Tap Water (thousand m3)
1,662 1,812 2,124 2,257 2,171
合計 (千m3)Total (thousand m3)
13,544 13,564 13,729 15,152 14,797
再利用・再生利用水
(千m3)
Reuse/Recycling water(thousand m3)
78 88 74 37 37
排水 Discharged
河川等への処理水放流(千m3)Discharge treatment water to river etc. (thousand m3)
12,041 12,476 10,724 10,714 11,019
下水 (千m3)Sewage (thousand m3)
1,152 1,331 1,370 1,442 1,485
合計 (千m3)Total (thousand m3)
13,193 13,807 12,094 12,156 12,504
項目 Items 2014年度FY2014
2015年度FY2015
2016年度FY2016
2017年度FY2017
2018年度FY2018
食品工場 Food plants 058.6 058.6 059.3 055.0 56.2
生産・飼育の施設や牧場
Livestock breeding facilities and feedlots
009.1 009.0 008.7 015.3 12.7
物流センター・営業所等
Logistics centers, Sales officers and etc 001.4 001.3 001.3 001.3 1.4
食肉の処理・加工工場等
Fresh meat processing and plants
030.9 031.1 030.7 028.4 29.7
合計 Total 100.0% 100.0% 100.0% 100.0% 100.0%
項目 Items 2014年度FY2014
2015年度FY2015
2016年度FY2016
2017年度FY2017
2018年度FY2018
前年度比Change from Previous Year
用水使用量(千m3) Water Consumption (thousand m3) 13,544 13,564 13,729 15,152 14,797 97.7%
使用量原単位 (m3/t) Water Consumption Per Unit of Production (m3/t) 13,5 17.8 13,5 17.1 13,517.3 13,518.8 18.6 98.9%
Environmental Report環境報告
用水使用量・原単位の推移 Transitions of Water Consumption and Consumption Per Unit of Production
用水使用量の割合 Breakdown of Water Consumption 用水使用量の内訳 Breakdown of amount of Water Consuinption and Discharged water
※ 用水使用量には、生産部門において一部推計値を含む* Water consumption includes some estimated values from production departments.
※ 用水使用量及び排水量には、生産部門において一部推計値を含む* Water consumption and discharged includes some estimated values from production departments.
7

容器包装を利用している企業は、容器包装リサイクル法により、容器包装の再商品化義務が課せられています。ニッポ
ンハムグループは、公益財団法人 日本包装リサイクル協会に再商品化を委託し、製造・販売した商品の数量に応じた
再商品化実施委託料金を支払っています。
契約年度 Contracted Year 2014年度FY2014
2015年度FY2015
2016年度FY2016
2017年度FY2017
2018年度FY2018
対象容器包装の排出見込量(t)Expected Weight of the Applicable
Containers and Packaging Generated (t)
プラスチック容器包装Plastic
12,244 12,277 12,661 7,735 7,188
紙容器包装Paper
0867 00,966 00,933 041 54
びんGlass
01,470 01,453 01,454 00,509 547
PET ボトルPET Bottle
01,470 01,470 01,470 01,470 0
契約の根拠となる排出見込量の実績算定年度 Year used as basis for projected Volume under contract2012年度FY2012
2013年度FY2013
2014年度FY2014
2015年度FY2015
2016年度FY2016
Environmental Report環境報告
容器包装の再商品化実施委託 Outsourcing the Recycling of Containers and Packaging
For Japan’s Containers and Packaging Recycling Law, requires companies that use containers and packaging to
reuse those materials. NH Foods Group outsources the recycling of materials into products to the Japan Containers
and Packaging Recycling Association and pays recycling outsourcing fees according to product manufacturing and
sales volumes.
※ 「対象容器包装の排出見込量」は前々年度の製造・販売実績から算出しています* The projected waste packaging volume is based on production and sales results two years earlier.
取水源別使用量及び排水先別の割合 Breakdown of Water Consumption by Source and Discharged water by Destinations
項目 Items 2014年度FY2014
2015年度FY2015
2016年度FY2016
2017年度FY2017
2018年度FY2018
地下水 Groundwater 75.7 75.5 73.4 70.6 73.0
工業用水 Industrial Water 12.0 11.2 11.1 13.4 12.3
上水 Tap Water 12.3 13.4 15.5 16.1 14.7
合計 Total 100.0% 100.0% 100.0% 100.0% 100.0%
8

環境法令の遵守状況 State of Compliance with Environmental Laws and Regulations
Environmental Report
日本ハム食品 (株)桑名プラントKuwana Plant of NH Foods Ltd.
概要Overview
2018年11月、従業員が作業中、資材タンクの配管を誤って破損させたため、タンクに保管されている酢酸が漏出し、雨水溝から用水路に流出しました。
An operator mistakenly broke the piping for a material storage tank while at work on November 2018, causing acetic acid kept in the tank to leak and flow into an irrigation channel through a rainwater
drainage ditch.
対応Response
発見後速やかに用水路に土嚢を設置し、せき止め処置を実施し、管轄行政に報告を行いました。行政担当者の現地点検後、せき止め区間内の水と堆積物の回収を行いました。後日、行政担当者による現地確認の結果、「環境に問題がない」との判断をいただきました。合わせて、立ち入り区域の見直しや配管の材質変更などの再発防止策を実施しました。
Sandbag walls were placed in the irrigation channel promptly to hold back water when the leak was found, and a report was made to relevant authorities. After an on-site inspection was made by
administrative personnel in charge, water and sediment in the area where water had been contained were removed.
As a result of the on-site verification carried out subsequently by personnel in charge, the administrative authorities concluded that there was no environmental problem. In addition, measures such as
reviewing restricted areas and changing piping materials were taken to prevent recurrences.
環境報告
2018 年度、ニッポンハムグループの事業所において、環境へ重大な影響を与える事故は発生しませんでした。
しかしながら、下記の通り対応が必要な事象が発生しました。発生直後の対応とともに継続的な対策を取ることにより、
以後、同様の事象は発生していません。
In fiscal 2018, no accidents that had a significant effect on the environment occurred at business sites of the NH
Foods Group.
However, as shown below, some situations requiring a response occurred. By taking action immediately thereafter
and implementing ongoing measures, similar situations have not arisen since.
項目 Items 2014年度FY2014
2015年度FY2015
2016年度FY2016
2017年度FY2017
2018年度FY2018
罰金額(円) Amount of fines (yen) 0 0 0 0 0
環境関連の罰金(日本ハム(株))Fines related to environmental issues (NH Foods Ltd.)
9

事業活動と環境影響 Business Activities and Environmental Impact
Environmental Report環境報告
投入量 Inputs
ニッポンハムグループは、お客様に製品をお届けする過程において、環境に対しさまざまな影響を与えています。 In the process of delivering its products to customers, NH Foods Group has various effects on the environment.
項目 Items 2014年度FY2014
2015年度FY2015
2016年度FY2016
2017年度FY2017
2018年度FY2018
前年度比Change from Previous Year
とうもろこし・麦等の飼料(千t) Feed including corn and wheat (thousand tons) 651 668 666 667 640 96.0%
製品の原材料(千t) Raw materials for products (thousand tons) 255 252 264 267 249 93.3%
電力 (百万kWh) Electricity (million kWh) 569 573 584 581 590 101.5%
水 (百万m3) Water (million m3) 014 013 014 015 15 100.0%
燃料 (原油換算)(千kl) Fuel (crude oil equivalent) (thousand kl) 074 075 079 081 80 98.8%
車両の燃料 (原油換算)(千kl) Vehicle fuel (crude oil equivalent) (thousand kl) 013 013 013 011 11 100.0%
※ INPUTの数値は、ニッポンハムグループ国内事業所における実績です* Scope: All NH Foods Group business sites in Japan and all Vehicles used in Japan.
※ 水には、生産部門において一部推計値を含む* Data for water input partially includes estimated values from production departments.
10

項目 Items 2014年度FY2014
2015年度FY2015
2016年度FY2016
2017年度FY2017
2018年度FY2018
前年度比Change from Previous Year
商品(千t) Products (thousand tons) 762 761 791 807 797 98.8%
温室効果ガス(千t) Greenhouse gases (thousand tons) 645 666 684 646 651 100.8%
排水 (百万m3) Discharged Water (million m3) 013 014 012 12 13 108.3%
廃棄物 (発生量) (千t) Waste (among generated) (thousand tons) 396 402 417 423 435 102.8%
廃棄物 (リサイクル率)(%) Waste (recycling rate) (%) 094.9 94.9 94.6 94.3 936 99.3%
Environmental Report環境報告
出荷・排出量 Output
※ OUTPUTの数値は、ニッポンハムグループ国内事業所における実績です* Scope: All NH Foods Group business sites in Japan and all Vehicles used in Japan.
※ 温室効果ガスについては、算定シナリオを見直したことにより、一部実績がこれまでの情報と異なる場合があります* GHG emission data may differ from past disclosures due to revised calculation methods.
※ 排水には、生産部門において一部推計値を含む* Wastewater data partially includes estimated values from production departments.
※ 2018年に発生した台風21号及び北海道胆振東部地震に伴う廃棄物は除く* Excluding the waste from Typhoon No.21 and the Hokkaido Eastern Iburi earthquake in the FY 2018.
容器包装 Containers and Packaging
プラスチック容器包装(t)Plastic 12,244 12,277 12,661 7,735 7,188 92.9%
紙容器包装(t)Paper
867 966 933 41 54 131.7%
びん(t)Glass
1,470 1,453 1,454 509 547 107.5%
PET ボトル(t)PET Bottle
0 0 0 0 0 -
11

項目 Items 2014年度FY2014
2015年度FY2015
2016年度FY2016
2017年度FY2017
2018年度FY2018
ガソリン (kl) Gasoline (kl) - - - 3 -
軽油(kl) Light Oil (kl) - - - 0.2 -
A重油 (kl) Heavy fuel oil A (kl) 1,369 1,596 1,381 1,468 1,381
灯油 (kl) Kerosene (kl) 12,314 12,667 13,801 14,819 14,352
液化石油ガス LPG (t)
Liquefied petroleum gas LPG (t)
2,579 2,594 2,764 2,940 2,792
購入電力 (千kWh) Electricity purchased (thousand kWh) 73,531 74,965 76,158 75,147 77,717
用水 (千m3) Water consumption (thousand m3) 1,229 1,217 1,190 2,316 * 1,885 *
排水 (千m3) Discharged Water(thousand m3) 3,394 3,844 1,952 1,947 * 2,172 *
Environmental Report環境報告
詳細データ Detailed Data
■ エネルギー、用水の使用量及び排水量 Energy, Water Consumption and Discharged Water
※ 用水及び排水には、生産部門において一部推計値を含む* Water consumption and discharged water include some estimated values from production departments.
※ 温室効果ガスについては、算定シナリオを見直したことにより、一部実績がこれまでの情報と異なる場合があります。* GHG emission data may differ from past disclosures due to revised calculation methods.
■ 大気排出量 Air Emissions
項目 Items 2014年度FY2014
2015年度FY2015
2016年度FY2016
2017年度FY2017
2018年度FY2018
CO2(千t-CO2) CO2 (thousand t-CO2) 83 87 91 88 88
NOx(t) NOx (t) 53 54 56 59 58
SOx (t) SOx (t) 13 15 13 14 13
メタン (t) Methane (t) 1,085 1,115 1,134 1,186 1,212
一酸化二窒素 (t)
Nitrous oxide (t) 311 319 310 328 343
事業別環境データ Environmental Data by Business
対象 :
インターファーム株式会社 4 事業所 / 日本ホワイトファーム株式会社 4 生産部 / ニイブロ株式会社 生産部 / 宮崎環境保全協
同組合 / 有限会社純粋黒豚種豚農場
Applicable Sites:
4 production departments of Interfarm Co., Ltd. / 4 production departments of Nippon White Farm Co., Ltd., /
production department of Niiburo Co., Ltd. / Miyazaki Environmental Preservation Cooperative / Junsui Kurobuta
Shuton Nogyo Y.K.
生産飼育の施設や牧場の環境負荷 Environmental Impact of Production and Livestock Breeding Facilities and Feedlots
12

Environmental Report環境報告
廃棄物の発生及び再資源化状況 Waste Generation and Recycling Status
■ 合計値 Total Figures
■ 2018年度の詳細データ FY2018 Detailed Data
項目 Items 2014年度FY2014
2015年度FY2015
2016年度FY2016
2017年度FY2017
2018年度FY2018
発生量(t) Waste Generation (t) 216,952 221,075 220,513 233,284 235,502
排出量(t) Discharged Waste (t) 90,186 90,506 60,217 63,842 64,116
最終処分量 (t) Final Disposal Waste (t) 2,639 2,405 1,787 1,715 1,147
再資源化率 (%) Recycling Rate (%) 97.1 97.3 97.0 97.3 98.2
減量・再資源化率 (%) Percentage Reduced or Recycled (%) 98.8 98.9 99.2 99.3 99.5
項目 Items 脱水汚泥Dewatered Sludge
廃油Waste Oil
廃プラスチックWaste Plastic
動植物性残渣Plant and Animal Residues
紙くず・廃ダンボールWaste Paper and Cardboard
金属クズScrap Metal
焼却灰Ash
その他Other
合計Total
発生量(t) Waste Generation (t) 33,498 1 258 2,939 43 125 - 198,639 235,503
排出量(t) Discharged Waste (t) 5,113 1 258 1,363 43 125 202 57,012 64,117
最終処分量 (t) Final Disposal Waste (t) 11 - 253 5 21 19 202 637 1,148
再資源化率 (%) Recycling Rate (%) 99.8 100.0 1.9 99.6 51.2 84.8 0.0 98.9 98.2
減量・再資源化率 (%) Percentage Reduced and Recycled (%) 99.97 100.0 1.9 99.8 51.2 84.8 - 99.7 99.5
※ 2018年に発生した台風21号及び北海道胆振東部地震に伴う廃棄物は除く* Excluding the waste from Typhoon No.21 and the Hokkaido Eastern Iburi earthquake in the FY 2018.
※ 2018年に発生した台風21号及び北海道胆振東部地震に伴う廃棄物は除く* Excluding the waste from Typhoon No.21 and the Hokkaido Eastern Iburi earthquake in the FY 2018.
13

Environmental Report環境報告
詳細データ Detailed Data
項目 Items 2014年度FY2014
2015年度FY2015
2016年度FY2016
2017年度FY2017
2018年度FY2018
ガソリン (kl) Gasoline (kl) - - - 0.2 0.3
軽油(kl) Light Oil (kl) - - 9.0 0.5 3.0
A重油 (kl) Heavy Oil A (kl) 8,567 7,817 8,364 8,472 7,422
灯油 (kl) Kerosene (kl) 271 252 266 266 230
都市ガス (千m3) Town Gas (thousand m3) - - - - 13
液化石油ガスLPG (t)
Liquefied petroleum gasLPG (t) 677 1,038 1,219 1,254 1,301
液化天然ガス LNG (t)
Liquefied natural gas LNG (t) - - - - 430
購入電力 (千kWh) Electricity purchased (thousand kWh) 68,991 69,519 70,647 69,879 71,366
用水 (千m3) Water Consumption(thousand m3) 4,178 4,214 4,213 4,307 4,386
排水 (千m3) Discharged Water (thousand m3) 3,680 3,704 3,700 3,817 3,860
※ ニッポンハムグループの食肉処理事業所での環境データです。集計は、下記の事業所を対象としています。* The following is environmental data on the meat processing sites operated by the NH Foods Group. The data applies to the following business sites.
■ 大気排出量 Air Emissions
項目 Items 2014年度FY2014
2015年度FY2015
2016年度FY2016
2017年度FY2017
2018年度FY2018
CO2(千t-CO2) CO2 (thousand t-CO2) 64 65 68 63 62
NOx(t) NOx (t) 41 40 42 42 41
SOx (t) SOx (t) 72 66 70 71 62
対象 :
日本ホワイトファーム株式会社 5 工場 / 日本フードパッカー株式会社 5 工場 / 日本フードパッカー鹿児島株式会社 /
日本フードパッカー四国株式会社 / 日本フードパッカー津軽株式会社 / 宮崎ビーフセンター株式会社 /
ニイブロ株式会社 食品工場
Applicable Sites:
5 plants of Nippon White Farm Co., Ltd. / 5 plants of Nippon Food Packer, Inc. / Nippon Food Packer Kagoshima, Inc.
/ Nippon Food Packer Shikoku, Inc. / Nippon Food Packer Tsugaru, Co.,Ltd. / Miyazaki Beef Center Co., Ltd. / Niiburo
co., Ltd. Food Plant
食肉の処理加工工場の環境負荷 Environmental Impact of Fresh Meat Processing and Plants
■ エネルギー、用水の使用量及び排水量 Energy, Water Consumption and Discharged Water
14

Environmental Report環境報告
廃棄物の発生及び再資源化状況 Waste Generation and Recycling Status
■ 合計値 Total Figures
■ 2018年度の詳細データ FY2018 Detailed Data
項目 Items 2014年度FY2014
2015年度FY2015
2016年度FY2016
2017年度FY2017
2018年度FY2018
発生量(t) Waste Generation (t) 92,824 91,418 91,401 91,767 101,633
排出量(t) Discharged Waste (t) 69,763 68,966 68,500 69,387 78,492
最終処分量 (t) Final Disposal Waste (t) 5,419 5,470 5,615 6,235 8,722
再資源化率 (%) Recycling Rate (%) 92.2 92.1 91.8 91.0 88.9
減量・再資源化率 (%) Percentage Reduced and Recycled (%) 94.2 94.0 93.9 93.2 91.4
項目 Items 脱水汚泥Dewatered Sludge
廃油Waste Oil
廃プラスチックWaste Plastic
動植物性残渣Plant and Animal Residues
紙くず・廃ダンボールWaste Paper and Cardboard
金属クズScrap Metal
その他Other
合計Total
発生量(t) Waste Generation (t) 16,121 199 431 61,134 157 78 23,512 101,632
排出量(t) Discharged Waste (t) 16,121 199 431 37,993 157 78 23,512 78,491
最終処分量 (t) Final Disposal Waste (t) 518 198 187 3,720 88 18 3,992 8,721
再資源化率 (%) Recycling Rate (%) 96.8 0.5 56.6 90.2 43.9 76.9 83.0 88.9
減量・再資源化率 (%) Percentage Reduced and Recycled (%) 96.8 0.5 56.6 93.9 43.9 76.9 83.0 91.4
※ 2018年に発生した台風21号及び北海道胆振東部地震に伴う廃棄物は除く* Excluding the waste from Typhoon No.21 and the Hokkaido Eastern Iburi earthquake in the FY 2018.
※ 2018年に発生した台風21号及び北海道胆振東部地震に伴う廃棄物は除く* Excluding the waste from Typhoon No.21 and the Hokkaido Eastern Iburi earthquake in the FY 2018
15

Environmental Report環境報告
詳細データ Detailed Data
項目 Items 2014年度FY2014
2015年度FY2015
2016年度FY2016
2017年度FY2017
2018年度FY2018
ガソリン (kl) Gasoline (kl) - - 0.4 0.2 0.2
軽油(kl) Light Oil (kl) - - 3 7 1
A重油 (kl) Heavy Oil A (kl) 8,529 7,873 7,997 7,819 7,539
灯油 (kl) Kerosene (kl) 55 56 66 63 35
都市ガス (千m3) Town Gas (thousand m3) 6,664 6,302 2,062 2,167 2,046
液化石油ガスLPG (t)
Liquefied petroleum gasLPG (t) 898 814 808 722 590
液化天然ガスLNG (t)
Liquefied natural gasLNG (t) - - 3,721 3,680 3,537
購入電力 (千kWh) Electricity purchased (thousand kWh) 114,317 109,730 110,741 106,551 105,870
購入蒸気、冷水、温水 (GJ)
Steam, cold water, hot water purchased (GJ) - - 8,964 8,988 9,849
用水 (千m3) Water Consumption (thousand m3) 2,757 2,655 2,605 2,752 2,747
排水 (千m3) Discharged Water(thousand m3) 2,696 2,649 2,582 2,446 2,546
■ 大気排出量 Air Emissions
項目 Items 2014年度FY2014
2015年度FY2015
2016年度FY2016
2017年度FY2017
2018年度FY2018
CO2(千t-CO2) CO2 (thousand t-CO2) 104 102 104 93 91
NOx(t) NOx (t) 65 62 55 60 58
SOx (t) SOx (t) 72 66 67 66 63
対象 :日本ハムファクトリー株式会社 5 工場 / 東北日本ハム株式会社 / 日本ハム北海道ファクトリー株式会社 / 南日本ハム株式会社 /株式会社函館カール・レイモン / 株式会社鎌倉ハム富岡商会 / 協同食品株式会社 / 株式会社ジャバス
Applicable Sites:
5 plants of Nipponham Factory Ltd. / Nipponham Northeast Ltd. / Nipponham Hokkaido Factory Ltd. / Nipponham
Southwest Ltd. / Hakodate Carl Raymon Co., Ltd. / Kamakura Ham Tomioka Co., Ltd. / Kyodo Foods Co., Ltd. / Japan
Assorted Business Services Co., Ltd.
ハム・ソーセージ製造の環境負荷 Environmental Impact of Ham and Sausage Production
■ エネルギー、用水の使用量及び排水量 Energy, Water Consumption and Discharged Water
※ 温室効果ガスについては、算定シナリオを見直したことにより、一部実績がこれまでの情報と異なる場合があります。* GHG emission data may differ from past disclosures due to revised calculation methods.
16

Environmental Report環境報告
廃棄物の発生及び再資源化状況 Waste Generation and Recycling Status
■ 合計値 Total Figures
■ 2018年度の詳細データ FY2018 Detailed Data
項目 Items 2014年度FY2014
2015年度FY2015
2016年度FY2016
2017年度FY2017
2018年度FY2018
発生量(t) Waste Generation (t) 22,981 21,355 30,977 22,924 22,377
排出量(t) Discharged Waste (t) 21,665 21,355 30,974 22,924 22,373
最終処分量 (t) Final Disposal Waste (t) 2,076 1,745 2,036 2,038 2,282
再資源化率 (%) Recycling Rate (%) 90.4 91.8 93.4 91.1 89.8
減量・再資源化率 (%) Percentage Reduced and Recycled (%) 91.0 91.8 93.4 91.1 89.8
項目 Items 脱水汚泥Dewatered Sludge
廃油Waste Oil
廃プラスチックWaste Plastic
動植物性残渣Plant and Animal Residues
紙くず・廃ダンボールWaste Paper and Cardboard
金属クズScrap Metal
その他Other
合計Total
発生量(t) Waste Generation (t) 7,497 20 3,853 6,087 3,916 359 645 22,377
排出量(t) Discharged Waste (t) 7,497 20 3,853 6,087 3,916 359 641 22,373
最終処分量 (t) Final Disposal Waste (t) 89 0 1,905 95 50 5 138 2,282
再資源化率 (%) Recycling Rate (%) 98.8 100.0 50.6 98.4 98.7 98.6 78.5 89.8
減量・再資源化率 (%) Percentage Reduced and Recycled (%) 98.8 100.0 50.6 98.4 98.7 98.6 78.6 89.8
※ 2018年に発生した台風21号及び北海道胆振東部地震に伴う廃棄物は除く* Excluding the waste from Typhoon No.21 and the Hokkaido Eastern Iburi earthquake in the FY 2018.
※ 2018年に発生した台風21号及び北海道胆振東部地震に伴う廃棄物は除く* Excluding the waste from Typhoon No.21 and the Hokkaido Eastern Iburi earthquake in the FY 2018.
17

Environmental Report環境報告
詳細データ Detailed Data
項目 Items 2014年度FY2014
2015年度FY2015
2016年度FY2016
2017年度FY2017
2018年度FY2018
ガソリン (kl) Gasoline (kl) - - 0.004 - 0.060
軽油(kl) Light Oil (kl) - - 18 7 78
A重油 (kl) Heavy Oil A (kl) 7,035 6,795 6,551 6,986 6,683
灯油 (kl) Kerosene (kl) 32 33 29 27 24
都市ガス (千m3) Town Gas (thousand m3) 14,612 16,031 17,149 17,356 18,055
液化石油ガスLPG (t)
Liquefied petroleum gasLPG (t) 1,470 1,481 1,627 2,119 2,153
購入電力 (千kWh) Electricity purchased (thousand kWh) 184,862 192,113 199,825 203,191 205,821
用水 (千m3) Water Consumption (thousand m3) 4,028 4,219 4,439 4,500 4,504
排水 (千m3) Discharged Water (thousand m3) 2,574 2,702 2,919 2,983 2,984
■ 大気排出量 Air Emissions
項目 Items 2014年度FY2014
2015年度FY2015
2016年度FY2016
2017年度FY2017
2018年度FY2018
CO2(千t-CO2) CO2 (thousand t-CO2) 158 170 178 168 171
NOx(t) NOx (t) 96 102 106 110 113
SOx (t) SOx (t) 59 57 55 59 56
対象 :
日本ハム株式会社 / 日本ハム食品株式会社 3 工場 / 日本ハム惣菜株式会社 3 工場 / 日本ピュアフード株式会社 8 工場 /
株式会社宝幸 2 工場 / 南日本フレッシュフード株式会社 / プレミアムキッチン株式会社 2 工場
Applicable Sites:
NH Foods Ltd. / 3 plants of Nipponham Processed Foods Ltd. / 3 plants of Nipponham Delicatessen Ltd. / 8 plants
of Nippon Pure Food, Inc. / 2 plants of Hoko Co., Ltd. / Minami Nippon Fresh Foods Co.,Ltd. / 2 plants of Premium
Kitchen Co., Ltd.
加工食品製造の環境負荷 Environmental Impact of Processed Food Production
■ エネルギー、用水の使用量及び排水量 Energy, Water Consumption and Discharged Water
18

Environmental Report環境報告
廃棄物の発生及び再資源化状況 Waste Generation and Recycling Status
■ 合計値 Total Figures
■ 2018年度の詳細データ FY2018 Detailed Data
項目 Items 2014年度FY2014
2015年度FY2015
2016年度FY2016
2017年度FY2017
2018年度FY2018
発生量(t) Waste Generation (t) 43,136 45,990 50,636 52,923 53,054
排出量(t) Discharged Waste (t) 32,766 35,291 38,784 44,167 45,691
最終処分量 (t) Final Disposal Waste (t) 2,511 3,278 2,986 2,989 3,931
再資源化率 (%) Recycling Rate (%) 92.3 90.7 92.3 93.2 91.4
減量・再資源化率 (%) Percentage Reduced and Recycled (%) 94.2 92.9 94.1 94.4 92.6
項目 Items 脱水汚泥Dewatered Sludge
廃油Waste Oil
廃プラスチックWaste Plastic
動植物性残渣Plant and Animal Residues
紙くず・廃ダンボールWaste Paper and Cardboard
金属クズScrap Metal
焼却灰Ash
その他Other
合計Total
発生量(t) Waste Generation (t) 14,106 4,490 3,815 22,423 6,360 939 - 921 53,054
排出量(t) Discharged Waste (t) 10,664 3,368 3,368 19,850 6,360 939 220 921 45,690
最終処分量 (t) Final Disposal Waste (t) 416 66 1,453 826 116 25 220 810 3,932
再資源化率 (%) Recycling Rate (%) 96.1 98.0 56.9 95.8 98.2 97.3 0.0 12.1 91.4
減量・再資源化率 (%) Percentage Reduced and Recycled (%) 97.1 98.5 61.9 96.3 98.2 97.3 - 12.1 92.6
※ 2018年に発生した台風21号及び北海道胆振東部地震に伴う廃棄物は除く* Excluding the waste from Typhoon No.21 and the Hokkaido Eastern Iburi earthquake in the FY 2018.
※ 2018年に発生した台風21号及び北海道胆振東部地震に伴う廃棄物は除く* Excluding the waste from Typhoon No.21 and the Hokkaido Eastern Iburi earthquake in the FY 2018.
19

Environmental Report環境報告
詳細データ Detailed Data
対象 :
マリンフーズ株式会社 / 日本ルナ株式会社 3 工場 / 株式会社宝幸 3 工場 / 釧路丸水株式会社
Applicable Sites:
The Marine Foods Corporation / 3 plants of Nippon Luna Inc. / 3 plants of Hoko Co., Ltd. / Kushiro Marusui Co., Ltd.
水産・乳製品製造の環境負荷 Environmental Impact of Marine and Dairy Product Production
項目 Items 2014年度FY2014
2015年度FY2015
2016年度FY2016
2017年度FY2017
2018年度FY2018
ガソリン (kl) Gasoline (kl) - - 0.01 0.03 0.01
軽油(kl) Light Oil (kl) - - - 0.03 0.02
A重油 (kl) Heavy Oil A (kl) 2,307 2,061 1,882 1,847 1,730
灯油 (kl) Kerosene (kl) 29 30 32 37 35
都市ガス (千m3) Town Gas (thousand m3) 900 1,142 1,306 1,395 1,350
液化石油ガスLPG (t)
Liquefied petroleum gasLPG (t) 315 435 511 269 223
購入蒸気、冷水、 温水 (GJ)
Steam, cold water, hot water purchased (GJ) - - - - 2,632
購入電力 (千kWh) Electricity purchased (thousand kWh) 31,164 33,274 34,938 32,765 34,151
用水 (千m3) Water Consumption (thousand m3) 1,155 1,077 1,102 1,077 1,062
排水 (千m3) Discharged Water (thousand m3) 794 862 894 901 869
■ 大気排出量 Air Emissions
項目 Items 2014年度FY2014
2015年度FY2015
2016年度FY2016
2017年度FY2017
2018年度FY2018
CO2(千t-CO2) CO2 (thousand t-CO2) 26 29 30 26 26
NOx(t) NOx (t) 16 17 18 17 17
SOx(t) SOx (t) 19 17 16 16 15
■ エネルギー、用水の使用量及び排水量 Energy, Water Consumption and Discharged Water
20

Environmental Report環境報告
廃棄物の発生及び再資源化状況 Waste Generation and Recycling Status
■ 合計値 Total Figures
■ 2018年度の詳細データ FY2018 Detailed Data
項目 Items 2014年度FY2014
2015年度FY2015
2016年度FY2016
2017年度FY2017
2018年度FY2018
発生量(t) Waste Generation (t) 12,600 15,364 15,561 14,535 13,862
排出量(t) Discharged Waste (t) 12,493 15,246 15,466 14,435 13,761
最終処分料 (t) Final Disposal Waste (t) 971 522 644 806 830
再資源化率 (%) Recycling Rate (%) 92.2 96.6 95.8 94.4 94.0
減量・再資源化率 (%) Percentage Reduced and Recycled (%) 92.3 96.6 95.9 94.5 94.0
項目 Items 脱水汚泥Dewatered Sludge
廃油Waste Oil
廃プラスチックWaste Plastic
動植物性残渣Plant and Animal Residues
紙くず・廃ダンボールWaste Paper and Cardboard
金属クズScrap Metal
その他Other
合計Total
発生量(t) Waste Generation (t) 4,514 1 701 7,328 1,012 140 166 13,862
排出量(t) Discharged Waste (t) 4,514 1 701 7,227 1,012 140 166 13,761
最終処分量 (t) Final Disposal Waste (t) 80 0 400 205 - 5 140 830
再資源化率 (%) Recycling Rate (%) 98.2 100.0 42.9 97.2 100.0 96.4 15.7 94.0
減量・再資源化率 (%) Percentage Reduced and Recycled (%) 98.2 100.0 42.9 97.2 100.0 96.4 15.7 94.0
※ 2018年に発生した台風21号及び北海道胆振東部地震に伴う廃棄物は除く* Excluding the waste from Typhoon No.21 and the Hokkaido Eastern Iburi earthquake in the FY 2018.
※ 2018年に発生した台風21号及び北海道胆振東部地震に伴う廃棄物は除く* Excluding the waste from Typhoon No.21 and the Hokkaido Eastern Iburi earthquake in the FY 2018.
21

Environmental Report環境報告
詳細データ Detailed Data
対象 :
日本ハム株式会社 / 日本ハム北海道販売株式会社 / 日本ハム東販売株式会社 / 日本ハム西販売株式会社 / 日本ルートサー
ビス株式会社 / 日本ハム冷凍食品株式会社 / 日本ハムカスタマー・コミュニケーション株式会社 / 日本物流センター株式会社 /
日本チルド物流株式会社 / 日本デイリーネット株式会社 / ジャパンフード株式会社 /NH ジャパンフード株式会社 / 東日本フー
ド株式会社 / 関東日本フード株式会社 / 中日本フード株式会社 / 西日本フード株式会社 / マリンフーズ株式会社 / 株式会社
宝幸 / 株式会社北海道日本ハムファイターズ / 日本ルナ株式会社 / 南日本フレッシュフード株式会社 / 株式会社函館カール・
レイモン / 株式会社ウスネ
Applicable Sites:
NH Foods Ltd. / Nipponham Hokkaido Sales Ltd. / Nipponham East Sales Ltd. / Nipponham West Sales Ltd. /
Nippon Route Service Co., Ltd. / Nipponham Frozen Foods Ltd. / Nipponham Customer Communications Ltd. /
Nippon Logistics Center, Inc. / Nippon Chilled Logistics, Inc. / Nippon Daily Net Co., Ltd. / Japan Food Corporation
/ NHJF Corporation / Higashi Nippon Food, Inc. / Kanto Nippon Food, Inc. / Naka Nippon Food, Inc. / Nishi Nippon
Food, Inc. / The Marine Foods Corporation / Hoko Co., Ltd. / Hokkaido Nippon-Ham Fighters Baseball Club Co.,
Ltd. / Nippon Luna, Inc. / Minami Nippon Fresh Foods Co.,Ltd. / Hakodate Carl Raymon Co., Ltd. / Usune Co., Ltd.
営業所、物流拠点、本社・支社、研究所の環境負荷 Environmental Impact of Sales Offices, Distribution Centers, Headquarters, Branches, Offices and Research Institutes
項目 Items 2014年度FY2014
2015年度FY2015
2016年度FY2016
2017年度FY2017
2018年度FY2018
ガソリン (kl) Gasoline (kl) - - - - 0.03
灯油 (kl) Kerosene (kl) 117 137 109 115 105
都市ガス (千m3) Town Gas (thousand m3) 179 182 186 190 213
液化石油ガスLPG (t)
Liquefied petroleum gasLPG (t) 40 40 46 42 41
購入電力 (千kWh) Electricity purchased (thousand kWh) 95,949 92,939 91,970 93,532 95,042
購入蒸気、冷水、 温水 (GJ)
Steam, cold water, hot water purchased (GJ) - - - - 8,134
用水 (千m3) Water Consumption (thousand m3) 196 182 181 200 213
■ 大気排出量 Air Emissions
項目 Items 2014年度FY2014
2015年度FY2015
2016年度FY2016
2017年度FY2017
2018年度FY2018
CO2(千t-CO2) CO2 (thousand t-CO2) 54 55 55 49 50
NOx(t) NOx (t) 28 28 27 28 29
SOx (t) SOx (t) 0.02 0.02 0.01 0.02 0.01
■ エネルギー、用水の使用量 Energy, Water Consumption
22

Environmental Report環境報告
廃棄物の発生及び再資源化状況 Waste Generation and Recycling Status
■ 2018年度の詳細データ FY2018 Detailed Data
項目 Items 紙くず・廃ダンボールWaste Paper and Cardboard
金属クズScrap Metal
その他Other
合計Total
発生量(t) Waste Generation (t) 3,505 3,478 1,298 8,281
排出量(t) Discharged Waste (t) 3,505 3,478 1,298 8,281
最終処分量 (t) Final Disposal Waste (t) 1,436 1,183 1,185 3,804
再資源化率 (%) Recycling Rate (%) 59.0 66.0 8.7 54.1
減量・再資源化率 (%) Percentage Reduced and Recycled (%) 59.0 66.0 8.7 54.1
■ 合計値 Total Figures
項目 Items 2014年度FY2014
2015年度FY2015
2016年度FY2016
2017年度FY2017
2018年度FY2018
発生量(t) Waste Generation (t) 7,158 6,897 7,481 7,646 8,280
排出量(t) Discharged Waste (t) 5,999 6,865 7,378 7,542 8,280
最終処分量 (t) Final Disposal Waste (t) 3,023 2,987 3,650 3,284 3,804
再資源化率 (%) Recycling Rate (%) 49.6 56.5 50.5 56.5 54.0
減量・再資源化率 (%) Percentage Reduced and Recycled (%) 57.8 56.7 51.2 57.1 54.1
※ 2018年に発生した台風21号及び北海道胆振東部地震に伴う廃棄物は除く* Excluding the waste from Typhoon No.21 and the Hokkaido Eastern Iburi earthquake in the FY 2018.
※ 2018年に発生した台風21号及び北海道胆振東部地震に伴う廃棄物は除く* Excluding the waste from Typhoon No.21 and the Hokkaido Eastern Iburi earthquake in the FY 2018.
23

Environmental Report環境報告
詳細データ Detailed Data
■ 車両の燃料使用量 Vehicle Fuel Consumption
項目 Items 2014年度FY2014
2015年度FY2015
2016年度FY2016
2017年度FY2017
2018年度FY2018
軽油(kl) Light Oil (kl) 11,789 11,162 11,122 10,033 9,853
ガソリン (kl) Gasoline (kl) 2,088 1,871 1,984 1,621 1,503
天然ガス (千m3) Natural Gas (thousand m3) 37 32 14 2 -
■ 車両からの大気排出量 Air Emissions from Vehicles
項目 Items 2014年度FY2014
2015年度FY2015
2016年度FY2016
2017年度FY2017
2018年度FY2018
CO2(千t-CO2) CO2 (thousand t-CO2) 35 33 33 30 29
NOx(t) NOx (t) 238 220 220 197 193
SOx (t) SOx (t) 10 9 9 8 8
対象 :
ニッポンハムグループが国内で使用する車両約 4,000 台(2019 年 3 月 31日現在)
Applicable Sites:
Approximately 4,000 vehicles used by the NH Foods Group in Japan (as of March 31st, 2019)
車両の環境負荷 Environmental Impact of Vehicles
24

項目 Items 2015年度FY2015
2016年度FY2016
2017年度FY2017
2018年度FY2018
従業員数(人) Number of Employees 2,358 2,372 2,384 2,403
男性(人)正規従業員のみ Male 1,488 1,390 1,341 1,011
女性 (人) 正規従業員のみ Female 293 331 363 348
女性従業員比率 (%) Percentage of Female Employees (%) 16.5 19.2 21.3 20.4
女性管理職比率 (%) Percentage of Female Managers (%) 3.4 3.4 3.3 3.8
臨時従業員数 (平均)(人) Number of Temporary Employees (average) 962 956 957 972
平均年齢 (歳) Average Age (years old) 42.2 42.2 42.5 42.5
男性 (歳) Male 43.6 44.5 44.3 44.6
女性 (歳) Female 36.7 37.2 36.4 36.9
平均勤続年数 (年) Average Duration of Employment (years) 18.5 18.5 18.8 18.8
男性 (年) Male 20.4 21.2 21.0 20.7
女性 (年) Female 12.7 12.8 12.2 12.2
新卒採用数 (人) New Graduates Hired 37 42 35 61
男性 (人) Male 24 26 22 34
女性 (人) Female 13 16 13 27
平均給与 (円) Average Salary (yen) 8,588,984 8,677,427 8,706,025 8,570,717
離職率 (%) Turnover Rate (%) 2.7 5.0 2.9 3.7
自主退職率 (%) Voluntary Retirement Rate (%) 1.02 0.90 1.56 1.72
従業員の概要 Summary of Employees
Social Report社会性報告
※ 各年度において3月31日現在の在籍者を基準としている* Based on the number of current employees as of March 31st in each fiscal year.
※ 女性管理職比率: (女性管理職数)/(管理職総数)×100* Percentage of female managers: [no. of female managers] / [total number of managers] x 100.
従業員の状況(日本ハム(株))
地域別従業員の状況(ニッポンハムグループ)
Status of Employees (NH Foods Ltd.) Status of Employees by Region (NH Foods Group)
項目 Items 2015年度FY2015
2016年度FY2016
2017年度FY2017
2018年度FY2018
国内(人) Domestic 22,499 22,863 22,725 22,883
海外(人) Overseas 6,905 6,816 7,930 7,957
グループ合計 Group Total 29,404 29,679 30,655 30,840
※ 各年度において3月31日現在の在籍者を基準としている * Based on the number of current employees as of March 31st in each fiscal year.
※ 平均臨時雇用者数を含む * Includes average number of temporary employees.
25

Status of Re-employment Following Mandatory Retirement (NH Foods Ltd.)
ダイバーシティ Diversity
Social Report社会性報告
※ 再雇用者数: 定年退職後にグループ会社にて雇用をした者を含む* Number of re-employed retirees: includes individuals employed at Group companies following mandatory retirement.
項目 Items 2015年度FY2015
2016年度FY2016
2017年度FY2017
2018年度FY2018
人数(人) Number of Employees 41 41 38 40
雇用率(%) Employment Rate (%) 1.7 1.7 1.6 1.7
※ 障がい者法定雇用率は2.2%* Statutory employment rate of disabled people is 2.2%.
※ 非正規従業員を含む* Includes non-regular employees.
定年退職後の再雇用状況(日本ハム(株))
障がい者雇用状況(日本ハム(株))
Status of Hiring of Disabled People (NH Foods Ltd.)
育児・看護関連制度の利用状況(日本ハム(株)) Usage of Child and Nursing Care-related Systems (NH Foods Ltd.)
項目 Items 内容 Details 2015年度FY2015
2016年度FY2016
2017年度FY2017
2018年度FY2018
産前産後休暇取得者数(人)
Before and After Childbirth
Leave (number of leave takers)産前6週間(多胎妊娠の場合は14週間)、産後8週間は本人出産休暇が取得できる
An employee giving birth can take the leave six weeks before giving birth (or fourteen weeks for a multiple pregnancy) and eight weeks after giving birth
26 26 40 30
配偶者出産休暇取得者数 (人)
Spousal Childbirth Leave (number of leave takers)
配偶者の出産予定日1週間前から出産後1週間の間に2日取得できる (有給)
For a period from one week before the expected delivery date of an employees’ spouse and one week after giving birth, an employee may take two days of leave (paid leave)
41 28 52 27
育児休業取得者数 (人)
Childcare Leave子が1歳6ヵ月に達するまで、または1歳到達後の4月まで (開始5日間は保存有給使用可)
Until the child of an employee reaches the age of one year and six months, or until April of the year in which the child has reached one year of age (reserve paid leave can be used for the first five days)
52 63 76 70
男性 (人) Male 5 5 8 4
女性 (人) Female 47 58 68 66
復職率 (%)Rate of Employees Returning to
Work (%)(育児休業からの復職者数)/(育児休業
からの復職予定者数)×100(Number of employees returning from childcare leave) / (Number of employees expected to return from childcare leave) x 100
95.5 91.3 97.0 97.1
育児時短勤務取得者数 (人)
Shortened Working Hours for
Childcare (number of users)子が小学校3年生末日まで1日の所定労働時間を2時間以内で短縮できる
Until an employee’s child finishes the third year of elementary school, the employee’s scheduled working hours in a day may be shorted by up to two hours
61 59 64 91
看護休暇取得者数(人)
Nursing Leave (number of
leave takers)
小学校就学前の子の看護が必要なときに、子が1人の場合は年間6日、2人以上の場合は年間10日 (保存有給使用可)
When the child or children of an employee up to the age of entering elementary school require nursing, up to six days of leave per year for a single child and up to ten days of leave per year for two or more children can be taken (reserve paid leave can be used)
39 58 59 118
※ 保存有給: 2年間で時効により消滅した年次有給休暇を積み立てた休暇のこと(最長40日)* Remaining paid leave: Annual paid leave which expired two years after being granted and was put into reserve (up to 40 days)
項目 Items 2015年度FY2015
2016年度FY2016
2017年度FY2017
2018年度FY2018
定年退職者数(人) Mandatory Retirees 88 16 29 16
再雇用者数(人) Re-employed Retirees 15 11 19 15
再雇用率 (%) Re-employment Rate (%) 17.0 68.8 65.5 93.8
26

人財育成 Human Resource
Social Report社会性報告
結社の自由と団体交渉 Freedom of Association and Collective Bargaining
日本ハム株式会社は、日本国憲法・法令により認められた結社の自由および団体交渉の権利を尊重しています。「日本ハム
ユニオン(以下、労働組合)」との間に、ユニオン・ショップ協定を締結しており、管理職、準ずる資格のある者、その他業務
の性質などを勘案して個別の合意に基づき非組合員とする者を除いた全職員が加入することとなっています。
また、グループ会社においても、結社の自由および団体交渉の権利を尊重する考えのもとで、当該国の法令・労働慣行を遵
守・尊重していきます。
NH Foods Ltd. respects the freedom of association and the rights of collective bargaining as recognized in the
Constitution of Japan, and laws and regulations. A union shop agreement has been entered with the NH Foods
Workers' Union (called "Employee Union"). Members consist of all employees excluding ones in management
positions or with equivalent qualifications and others who are excluded based on individual agreements in light of
such factors as the nature of their work.
In addition, companies with the Group comply with and respect the laws, regulations, and labor practices of their
respective coutries, based on a stance that respects the freedom association and the rights of collective bargaining.
項目 Items 2015年度FY2015
2016年度FY2016
2017年度FY2017
2018年度FY2018
MBO評価対象者数(人) Employees Under the Management by Objectives (MBO) System 1,448 1,412 1,367 1,731
MBO評価対象者の比率(%) Percentage of MBO Employees (%) 61.4 59.5 57.3 72.0
業績とキャリア開発についての定期的評価を受けている従業員の比率(日本ハム(株)) Percentage of employees subject to periodic evaluation with respect to business performance and career development (NH Foods Ltd.)
※ 2018年度から、正規従業員は100% 実施となります* Since FY2018, all of the regular employees are under the Management by Objectives (MBO) System.
※ 2018年度の加入率は91.1%です
* The enrollment rate in FY2018 is 91.1%.
27

健康および労働安全衛生 Employee Health and Occupational Health & Safety
Social Report社会性報告
労働時間と年次有給休暇取得状況(日本ハム(株)) Status of Working Hours and Use of Annual Paid Leave (NH Foods Ltd.)
項目 Items 2015年度FY2015
2016年度FY2016
2017年度FY2017
2018年度FY2018
年間総実労働時間(時間) Annual Actual Working Hours (hours) 2,155 2,161 2,116 2,087
有給休暇平均付与日数(日) Average Number of Days of Annual Paid Leave Granted (days) 18 19 18 18
有給休暇平均取得日数 (日) Average Number of Days of Annual Paid Leave Taken (days) 10 10 12 12
有給休暇平均取得率 (%) Average Usage Rate of Annual Paid (%) 53 53 67 69
労働災害強度率(ニッポンハムグループ) Occupational Accident Severity Rate (NH Foods Group)
項目 Items 2015年度FY2015
2016年度FY2016
2017年度FY2017
2018年度FY2018
全国製造業平均 National Manufacturing Industry Average 0.09 0.06 0.07 0.08
全国食料品製造業平均 National Food Manufacturing Industry Average 0.11 0.12 0.15 0.18
ニッポンハムグループ平均 NH Foods Group Average 0.07 0.05 0.05 0.05
項目 Items 2015年度FY2015
2016年度FY2016
2017年度FY2017
2018年度FY2018
全国製造業平均 National Manufacturing Industry Average 1.06 1.06 1.15 1.02
全国食料品製造業平均 National Food Manufacturing Industry Average 3.21 3.26 3.85 0.95
ニッポンハムグループ平均 NH Foods Group Average 3.00 2.89 2.69 2.00
労働災害度数率(ニッポンハムグループ) Frequency Rate of Occupational Accidents (NH Foods Group)
※ 労働災害度数率:実労働延べ100万時間あたりの労働災害による死傷者数で、災害発生の頻度を表す* Frequency rate of occupational accidents: the number of casualties due to occupational accidents per million hours of actual work, as an indication of the frequency at which accidents occur.
※ 労働災害強度率: 従業員全員の労働延べ時間に対する、災害に起因する休業延べ日数の実績* Occupational accident severity rate: Results of the total number of days of lost time due to accidents with respect to total worked hours of all employees.
28

Social Report社会性報告
ストレスチェック受検率(ニッポンハムグループ) Stress Check Examination Rate (NH Foods Ltd.)
OHSAS18001の認証取得状況(2019年4月1日現在) OHSAS 18001 Certification Status (as of April 1, 2019)
項目 Items 2015年度FY2015
2016年度FY2016
2017年度FY2017
2018年度FY2018
受検率(%) Examination Rate (%) 96.1 93.9 93.0 91.5
※ ストレスチェック:事業者が労働者に対して行う心理的な負担の程度を把握するための検査* Stress check: An examination to ascertain the degree of psychological burden a business operator places on an employee.
■ OHSAS18001 (Occupationnal Health and Safety Assessment Series)
■ 認証事業所 6拠点(認証事業所比率 1.0%) 6 business sites certified (certified business site ratio: 1.0%)
日本Japan
タイThailand
● 日本ハム惣菜株式会社(本社・新潟工場、
北海道工場、宮崎工場)
● タイ日本ベジタブル● タイ日本フーズ● タイ日本コールドストレージ
Thai Nippon Vegetable Co., Ltd.
Thai Nippon Foods Co., Ltd.
Thai Nippon Cold Storage Co., Ltd.
Nipponham Delicatessen Ltd.
(Headquarters, Niigata Plant,
Hokkaido Plant, Miyazaki Plant)
国際コンソーシアムが 1999 年に発行した「労働安全衛生」に関する国際規格。従業員の安全と衛生的な作業環境の
構築および維持・改善を目的としています。
An international standard on occupational health and safety issued in 1999 by an international consortium. The
standard aims to develop, maintain and improve safety and healthy work environments for employees.
29
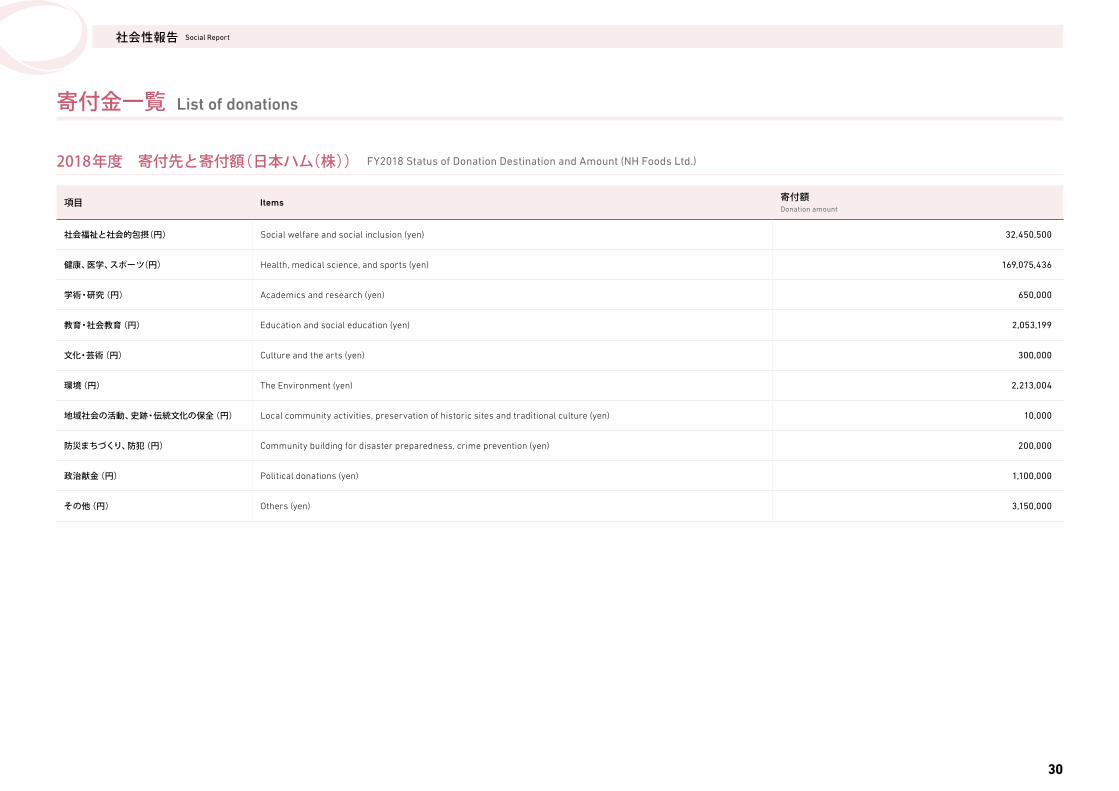
寄付金一覧 List of donations
Social Report社会性報告
2018年度 寄付先と寄付額(日本ハム(株)) FY2018 Status of Donation Destination and Amount (NH Foods Ltd.)
項目 Items 寄付額Donation amount
社会福祉と社会的包摂(円) Social welfare and social inclusion (yen) 32,450,500
健康、医学、スポーツ(円) Health, medical science, and sports (yen) 169,075,436
学術・研究 (円) Academics and research (yen) 650,000
教育・社会教育 (円) Education and social education (yen) 2,053,199
文化・芸術 (円) Culture and the arts (yen) 300,000
環境 (円) The Environment (yen) 2,213,004
地域社会の活動、史跡・伝統文化の保全 (円) Local community activities, preservation of historic sites and traditional culture (yen) 10,000
防災まちづくり、防犯 (円) Community building for disaster preparedness, crime prevention (yen) 200,000
政治献金 (円) Political donations (yen) 1,100,000
その他 (円) Others (yen) 3,150,000
30

コーポレート・ガバナンス Corporate Governance
2018年度 任意委員会出席状況 FY2018 Status of Optional Committee Attendance
役位Position
氏名Name
出席回数/開催回数Number of Meetings Attended / Number of Meetings Convened
出席率Attendance Rate
代表取締役Representative Director
畑 佳秀Yoshihide Hata
6/6 100%
代表取締役Representative Director
篠原 三典Kazunori Shinohara
6/6 100%
取締役Director
髙松 肇Hajime Takamatsu
6/6 100%
役位Position
氏名Name
出席回数/開催回数Number of Meetings Attended / Number of Meetings Convened
出席率Attendance Rate
代表取締役Representative Director
畑 佳秀Yoshihide Hata
4/4 100%
代表取締役Representative Director
篠原 三典Kazunori Shinohara
4/4 100%
代表取締役Representative Director
井上 勝美Katsumi Inoue
4/4 100%
代表取締役Representative Director
川村 浩二Koji Kawamura
4/4 100%
取締役Director
大社 啓二Hiroji Okoso
4/4 100%
取締役Director
木藤 哲大Tetsuhiro KIto
4/4 100%
取締役Director
髙松 肇Hajime Takamatsu
4/4 100%
取締役Director
井川 伸久Nobuhisa Ikawa
4/4 100%
取締役 (社外)Outside Director
片山 登志子Toshiko Katayama
1/1 100%
取締役 (社外)Outside Director
河野 康子Yasuko Kono
3/3 100%
取締役 (社外)Outside Director
髙 巖Iwao Taka
3/3 100%
取締役 (社外)Outside Director
大塚 明Akira Otsuka
3/3 100%
■ コンプライアンス委員会 Compliance Committee ■ CSR推進委員会 CSR Promotion Committee
Corporate Governanceコーポレート・ガバナンス
31

役位Position
氏名Name
出席回数/開催回数Number of Meetings Attended / Number of Meetings Convened
出席率Attendance Rate
代表取締役Representative Director
畑 佳秀Yoshihide Hata
3/3 100%
代表取締役Representative Director
篠原 三典Kazunori Shinohara
3/3 100%
取締役 (社外)Outside Director
片山 登志子Toshiko Katayama
1/1 100%
取締役 (社外)Outside Director
髙 巖Iwao Taka
2/3 67%
取締役 (社外)Outside Director
河野 康子Yasuko Kono
2/2 100%
監査役 (社外)Outside Auditor
大塚 明Akira Otsuka
3/3 100%
役位Position
氏名Name
出席回数/開催回数Number of Meetings Attended / Number of Meetings Convened
出席率Attendance Rate
取締役 (社外)Outside Director
片山 登志子Toshiko Katayama
1/1 100%
取締役 (社外)Outside Director
髙 巖Iwao Taka
1/2 50%
取締役 (社外)Outside Director
河野 康子Yasuko Kono
1/1 100%
監査役 (社外)Outside Auditor
大塚 明Akira Otsuka
2/2 100%
監査役 (社外)Outside Auditor
芝 昭彦Akihiko Shiba
2/2 100%
監査役 (社外)Outside Auditor
岩﨑 淳Atsushi Iwasaki
2/2 100%
■ 報酬検討委員会 Compensation Committee
■ 独立社外役員会議 Board of Independent Outside Officers
役位Position
氏名Name
出席回数/開催回数Number of Meetings Attended / Number of Meetings Convened
出席率Attendance Rate
代表取締役Representative Director
篠原 三典Kazunori Shinohara
7/7 100%
取締役Director
髙松 肇Hajime Takamatsu
7/7 100%
取締役 (社外)Outside Director
片山 登志子Toshiko Katayama
1/1 100%
取締役 (社外)Outside Director
髙 巖Iwao Taka
7/7 100%
取締役 (社外)Outside Director
河野 康子Yasuko Kono
5/6 83%
監査役 (社外)Outside Auditor
芝 昭彦Akihiko Shiba
7/7 100%
■ 役員指名検討委員会 Executive Appointments Committee
Corporate Governanceコーポレート・ガバナンス
32

役位Position
氏名Name
出席回数/開催回数Number of Meetings Attended / Number of Meetings Convened
出席率Attendance Rate
代表取締役Representative Director
畑 佳秀Yoshihide Hata
2/2 100%
代表取締役Representative Director
篠原 三典Kazunori Shinohara
2/2 100%
代表取締役Representative Director
井上 勝美Katsumi Inoue
2/2 100%
代表取締役Representative Director
川村 浩二Koji Kawamura
2/2 100%
取締役 (社外)Outside Director
片山 登志子Toshiko Katayama
1/1 100%
取締役 (社外)Outside Director
髙 巖Iwao Taka
2/2 100%
取締役 (社外)Outside Director
河野 康子Yasuko Kono
1/1 100%
監査役 (社外)Outside Auditor
大塚 明Akira Otsuka
2/2 100%
監査役 (社外)Outside Auditor
芝 昭彦Akihiko Shiba
2/2 100%
監査役 (社外)Outside Auditor
岩﨑 淳Atsushi Iwasaki
1/2 50%
役位Position
氏名Name
出席回数/開催回数Number of Meetings Attended / Number of Meetings Convened
出席率Attendance Rate
代表取締役Representative Director
畑 佳秀Yoshihide Hata
3/3 100%
代表取締役Representative Director
篠原 三典Kazunori Shinohara
3/3 100%
取締役 (社外)Outside Director
髙 巖Iwao Taka
2/4 50%
監査役 (社外)Outside Auditor
大塚 明Akira Otsuka
4/4 100%
■ 独立社外役員・代表取締役会議 Board of Independent Officers and Representative Directors ■ 企業価値向上委員会 Corporate Value Enhancement Committee
Corporate Governanceコーポレート・ガバナンス
33
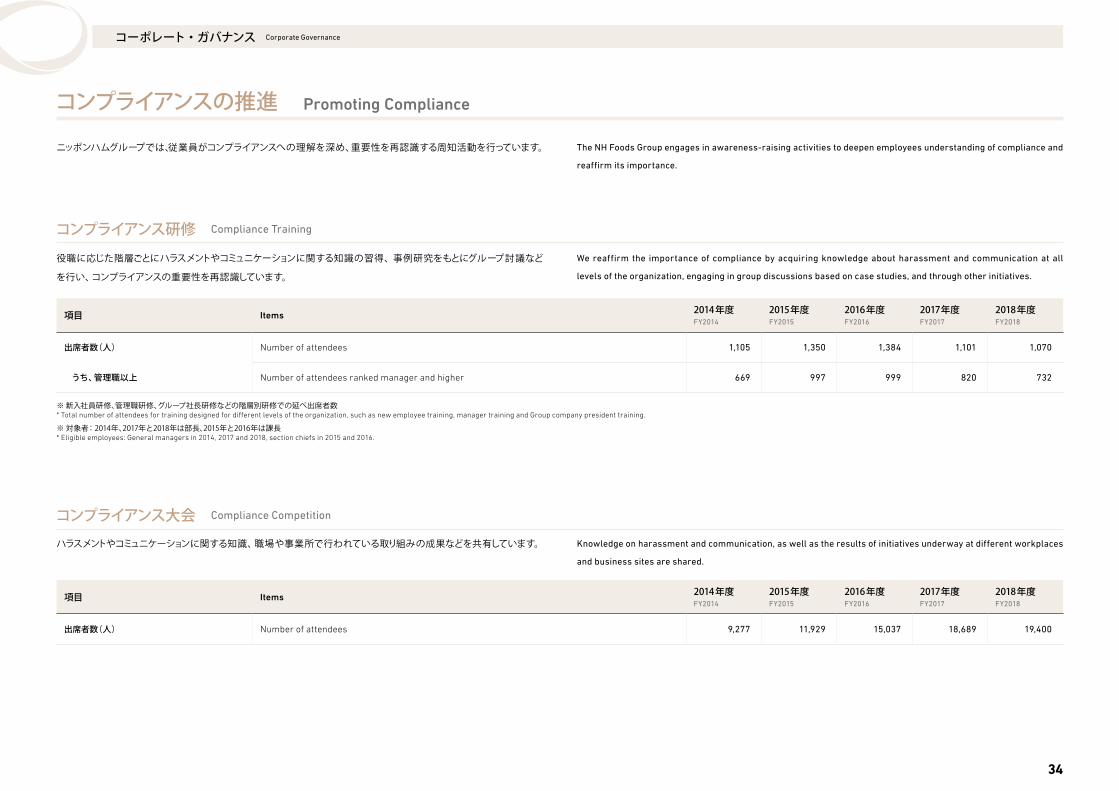
コンプライアンス研修 Compliance Training
コンプライアンス大会 Compliance Competition
コンプライアンスの推進 Promoting Compliance
項目 Items 2014年度FY2014
2015年度FY2015
2016年度FY2016
2017年度FY2017
2018年度FY2018
出席者数(人) Number of attendees 1,105 1,350 1,384 1,101 1,070
うち、管理職以上 Number of attendees ranked manager and higher 669 997 999 820 732
項目 Items 2014年度FY2014
2015年度FY2015
2016年度FY2016
2017年度FY2017
2018年度FY2018
出席者数(人) Number of attendees 9,277 11,929 15,037 18,689 19,400
※ 新入社員研修、管理職研修、グループ社長研修などの階層別研修での延べ出席者数* Total number of attendees for training designed for different levels of the organization, such as new employee training, manager training and Group company president training.
※ 対象者: 2014年、2017年と2018年は部長、2015年と2016年は課長* Eligible employees: General managers in 2014, 2017 and 2018, section chiefs in 2015 and 2016.
Corporate Governanceコーポレート・ガバナンス
34
ニッポンハムグループでは、従業員がコンプライアンスへの理解を深め、重要性を再認識する周知活動を行っています。
役職に応じた階層ごとにハラスメントやコミュニケーションに関する知識の習得、 事例研究をもとにグループ討議など
を行い、コンプライアンスの重要性を再認識しています。
ハラスメントやコミュニケーションに関する知識、職場や事業所で行われている取り組みの成果などを共有しています。
The NH Foods Group engages in awareness-raising activities to deepen employees understanding of compliance and
reaffirm its importance.
We reaffirm the importance of compliance by acquiring knowledge about harassment and communication at all
levels of the organization, engaging in group discussions based on case studies, and through other initiatives.
Knowledge on harassment and communication, as well as the results of initiatives underway at different workplaces
and business sites are shared.

Corporate Governanceコーポレート・ガバナンス
ニッポンハムグループ相談窓口 NH Foods Group Consultation Desk
コンプライアンス事業所訪問 Compliance Visits to Business Sites
項目 Items 2014年度FY2014
2015年度FY2015
2016年度FY2016
2017年度FY2017
2018年度FY2018
相談受付年度別件数(件) Number of Consultations Received by Fiscal Year 153 199 185 192 201
項目 Items 2014年度FY2014
2015年度FY2015
2016年度FY2016
2017年度FY2017
2018年度FY2018
訪問したグループ会社数(社) Number of Group Companies Visited 19 8 12 17 9
訪問した事業所数 (事業所) Number of Business Sites Visited 35 45 48 36 96
対象従業員数 (人) Target Number of Employees約 2,400
Approx. 2,400
約 1,500Approx. 1,500
約 1,800Approx. 1,800
約 1,000Approx. 1,000
約 1,300Approx. 1,300
35
グループ従業員が自由に職場実態について通報・相談できるよう、社内相談窓口のほかに独立した社外相談窓口を
設けています。
リスクの回避・低減・予防を図ることを目的にコンプライアンス部が事業所を訪問し、事業所内の雰囲気や業務上の
課題や人間関係などに関する従業員の気持ちをヒアリングしています。
In addition to an internal consultation desk, an independent outside consultation desk has also been set up so that
Group employees can freely report and consult on actual workplace conditions.
With the aim of avoiding, mitigating and preventing risks, the Compliance Department visits business sites where it listens
to employee sentiments regarding the atmosphere on site, business-related issues, interpersonal issues and so on.