Affordable Day Care Program to empower Indian mothers ADB 3ie conference

Formal Financial Institutions and Informal Finance
Experimental Evidence from Village India
Isabelle Cohen (Centre for Micro Finance)[email protected]
September 3, 2014, Making Impact Evaluation Matter

Acknowledgements
This presentation is based on the following in-progress papers:
• Binzel, Christine, Erica Field and Rohini Pande. “Does the Arrival of a Formal Financial Institution Alter Informal Sharing Arrangements? Experimental Evidence from Village India.” 2014.
• Cohen, Isabelle, Erica Field, Elisa Maffioli and Rohini Pande. “The Impact of Formal Finance on the Moneylender Market: Evidence from Rural India.” 2014.

Table of Contents
1. Introduction
2. Study Design and Context
3. Access to Formal Banking Services
4. Formal Finance and Village Risk-Sharing Capacity
5. Formal Finance and Moneylenders
6. Conclusion

Table of Contents
1. Introduction
2. Study Design and Context
3. Access to Formal Banking Services
4. Formal Finance and Village Risk-Sharing Capacity
5. Formal Finance and Moneylenders
6. Conclusion

Introduction: Motivation
• The arrival of formal financial institutions is considered a key step in the path of development (Besely, 1995; Burgess and Pande, 2005)
• From a policy standpoint, there is currently a push towards financial inclusion in rural India
– “Modi promises access to banking for India’s poor” – Financial Chronicle, August 16, 2014
– “Microlenders to open 30 million bank accounts by Aug 2015” – Livemint.com, August 13, 2014
– “Banks gear up for financial inclusion drive in 2 states” – Business Standard, August 22, 2014
• However, even without formal institutions, households still have the ability to avail informal financial services, which may be a critical component of their economic well-being (or lack thereof)
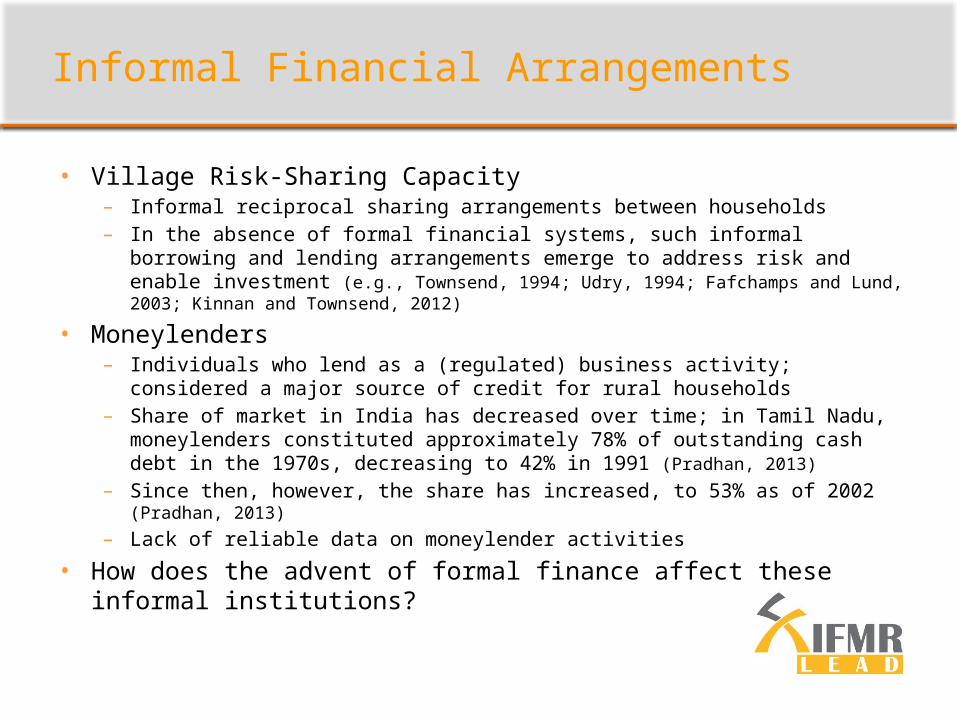
Informal Financial Arrangements
• Village Risk-Sharing Capacity– Informal reciprocal sharing arrangements between households– In the absence of formal financial systems, such informal borrowing and lending
arrangements emerge to address risk and enable investment (e.g., Townsend, 1994; Udry, 1994; Fafchamps and Lund, 2003; Kinnan and Townsend, 2012)
• Moneylenders– Individuals who lend as a (regulated) business activity; considered a major source
of credit for rural households– Share of market in India has decreased over time; in Tamil Nadu, moneylenders
constituted approximately 78% of outstanding cash debt in the 1970s, decreasing to 42% in 1991 (Pradhan, 2013)
– Since then, however, the share has increased, to 53% as of 2002 (Pradhan, 2013)
– Lack of reliable data on moneylender activities
• How does the advent of formal finance affect these informal institutions?

Study Overview
• Exploit randomized rollout of bank branches by a large rural formal financial institution (FFI) in South India
– Characterized by physical bank branch and broad range of products offered
– Loans: Grameen-style JLG loans, jewelry loans, and other types of loans
– Insurance: Personal accident insurance, term life insurance, and other type of insurance
• Multiple waves of surveying: baseline (pre-opening), midline (1.5 years post-opening) and endline (3 years post-opening)
• Use household/individual survey data on financial behavior (loans and gifts/transfers) and social network-based borrowing capacity
– Borrowing capacity is the maximum the respondent could have borrowed from a social network contact in the event of a (hypothetical) emergency

Key Findings
• To date: data from initial 8 Phase 1 service area pairs– Phase II on-going, includes an additional 35 pairs, baseline survey complete,
endline survey to start January 2015– Phase III on-going, including an additional 7 pairs, baseline survey in progress
• Preliminary findings– Significant increase in both outstanding formal loan amount and
number of loans– Decline in outstanding informal loan amount and incidence of
having an outstanding informal loan– Reduction in borrowing capacity across within-village contacts– Decrease in incidence of outstanding loans from moneylenders

Table of Contents
1. Introduction
2. Study Design and Context
3. Access to Formal Banking Services
4. Formal Finance and Village Risk-Sharing Capacity
5. Formal Finance and Moneylenders
6. Conclusion

Pairwise Matched Design
• Constructed service areas using GPS-based population survey
– Average service area has a radius of 3-5 km from the branch location and contains approximately 10,000 households
• Service areas paired using Edmond’s algorithm for global distance minimization
– In each pair, one service area assigned to treatment and the other to control
– Pair-fixed effects explain roughly 70% of the variation in several 2001 census village outcomes (e.g. caste composition, number of primary schools, etc.)
• Use data from household surveys to examine the impact on loans, savings, insurance and transfers
• One respondent per household is asked to list her social network
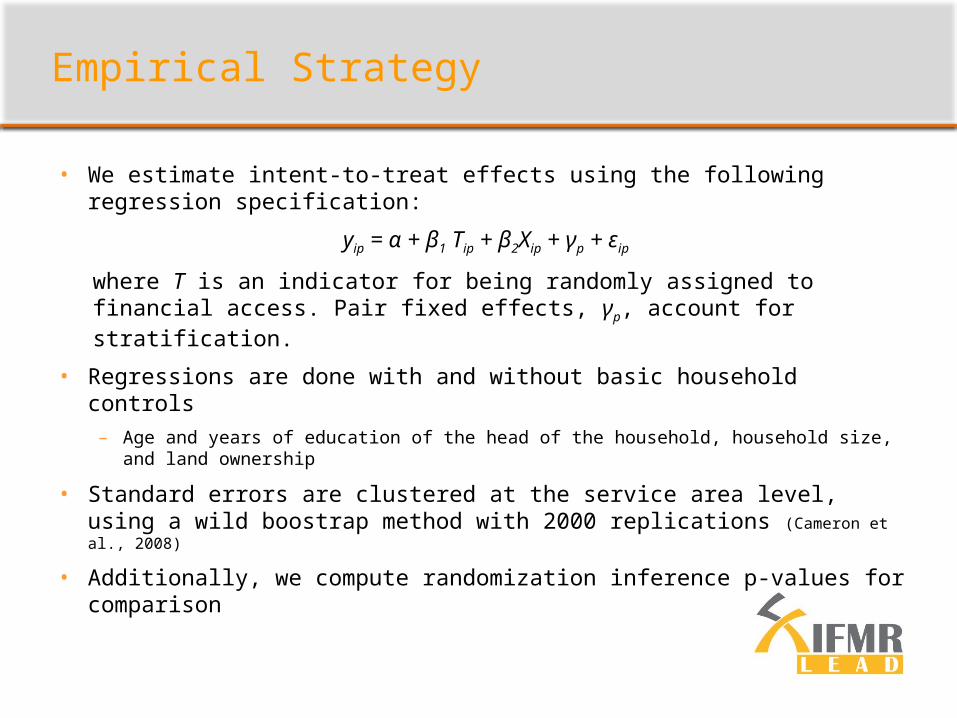
Empirical Strategy
• We estimate intent-to-treat effects using the following regression specification:
yip = α + β1 Tip + β2Xip + γp + εip
where T is an indicator for being randomly assigned to financial access. Pair fixed effects, γp, account for stratification.
• Regressions are done with and without basic household controls
– Age and years of education of the head of the household, household size, and land ownership
• Standard errors are clustered at the service area level, using a wild boostrap method with 2000 replications (Cameron et al., 2008)
• Additionally, we compute randomization inference p-values for comparison

Table of Contents
1. Introduction
2. Study Design and Context
3. Access to Formal Banking Services
4. Formal Finance and Village Risk-Sharing Capacity
5. Formal Finance and Moneylenders
6. Conclusion

Over 25% of Households Take FFI Loans

Increased Access to Formal Finance
Table 1: Formal Financial Access
Loan Amount Number of Loans Any Loan
Outstanding Repaid Outstanding Repaid Outstanding Repaid
(1) (2) (3) (4) (5) (6)
Panel A: without controls
Treatment 14109.5*(7983.9)
0.072
3809.3***(1318.8)
0.016
0.213*(0.115)0.059
0.0855**(0.0335)
0.027
0.0264(0.0504)
0.262
0.0353*(0.0189)
0.057
Panel B: with controls
Treatment 16138.6**(6616.9)
0.047
4010.6***(1213.3)
0.019
0.248***(0.0800)
0.029
0.0938***(0.0347)
0.020
0.0360(0.0364)
0.151
0.0393*(0.0205)
0.040
Control Mean 35,101.3 3,514.0 1.152 0.196 0.574 0.160
N 651 663 651 663 666 666***p < 0.01, **p < 0.05, *p < 0.10
Notes: Estimated using OLS with wild bootstrap errors clustered at the treatment level in parenthesis (nr. of replications 2000) and randomization inference p-values reported below. All specifications include service area pair fixed effects and a constant. “Outstanding” refers to all outstanding loans (over Rs. 2000) at the time of the survey while “repaid” refers to loans (over Rs. 2000) the household had repaid during the 12 months prior to the survey. The loan and the average amounts are in Rs. Controls are age and years of education of the household head, household size, and whether the household owns any land.

Decrease in Informal Loans and Transfers
Table 2: Informal Loans and Transfers
Loan Amount Any Loan Outside-Village Transfers Lending to Non-Relatives
Outstanding Repaid Outstanding Repaid Sent Received Any Items Nr of Items
(1) (2) (3) (4) (5) (6) (7) (8)
Panel A: without controls
Treatment -5845.7**(2963.8)
0.037
-10876.2(9110.8)
0.133
-0.0836**(0.0396)
0.042
-0.0137(0.0413)
0.305
-0.114***(0.0343)
0.022
-0.0022(0.0484)
0.457
-0.0222(0.0392)
0.265
-0.116*(0.0636)
0.046
Panel B: with controls
Treatment -5306.2**(2525.1)
0.037
-10150.5(7423.7)
0.126
-0.0755**(0.0369)
0.037
-0.0081(0.0355)
0.381
-0.107***(0.0345)
0.032
0.0063(0.0324)
0.439
-0.0136(0.0406)
0.352
-0.0914(0.0581)
0.069
Control Mean 31,787.8 16,504 0.708 0.280 0.373 0.330 0.407 0.875
N 651 663 667 664 659 657 669 670***p < 0.01, **p < 0.05, *p < 0.10
Notes: Estimated using OLS with wild bootstrap errors clustered at the treatment level in parenthesis (nr. of replications 2000) and randomization inference p-values reported below. All specifications include service area pair fixed effects and a constant. “Outstanding” refers to all outstanding loans (over Rs. 2000) at the time of the survey while “repaid” refers to loans (over Rs. 2000) the household had repaid during the 12 months prior to the survey. Loan amounts are in Rs. Transfers refer to informal transfers /gifts (over Rs. 500) sent to and received from households outside the village during the 4 months prior to the survey. Items lent refers to items the household had lent to other households in the village or let people use during the week prior to the survey. Only items lent to non-relatives are considered. Controls are age and years of education of the household head, household size, and whether the household owns any land.
Table of Contents
1. Introduction
2. Study Design and Context
3. Access to Formal Banking Services
4. Formal Finance and Village Risk-Sharing Capacity
5. Formal Finance and Moneylenders
6. Conclusion

Mechanisms of Impact
• Formal financial access may expand the giving capacity of resource-constrained households (Feigenberg et al., 2013)
• Conversely, formal financial access may reduce the real and perceived need for sharing and may reduce possible punishment options (e.g., Ligon et al. 2000; Foster and Rosenzweig, 2000; Conning and Udry, 2007)
– Decreases incentive to maintain and formal informal sharing arrangements
– Potential decrease in trust within the network due to an increase in external options for financial support (substitutes)
• Historical evidence suggests that traditional informal financial institutions diminish in importance as capital markets develop
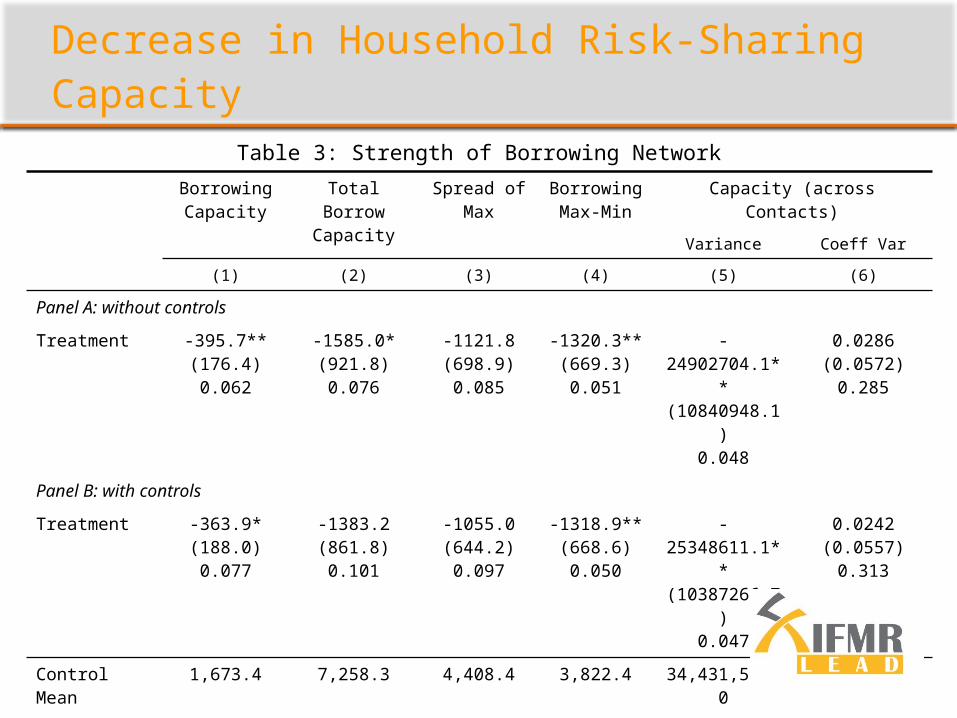
Decrease in Household Risk-Sharing Capacity
Table 3: Strength of Borrowing Network
Borrowing Capacity
Total Borrow Capacity
Spread of Max Borrowing Max-Min
Capacity (across Contacts)
Variance Coeff Var
(1) (2) (3) (4) (5) (6)
Panel A: without controls
Treatment -395.7**(176.4)0.062
-1585.0*(921.8)0.076
-1121.8(698.9)0.085
-1320.3**(669.3)0.051
-24902704.1**(10840948.1)
0.048
0.0286(0.0572)
0.285
Panel B: with controls
Treatment -363.9*(188.0)0.077
-1383.2(861.8)0.101
-1055.0(644.2)0.097
-1318.9**(668.6)0.050
-25348611.1**(10387266.7)
0.047
0.0242(0.0557)
0.313
Control Mean 1,673.4 7,258.3 4,408.4 3,822.4 34,431,544.0 0.688
N 2,853 665 615 615 548 548***p < 0.01, **p < 0.05, *p < 0.10
Notes: Estimated using OLS with wild bootstrap errors clustered at the treatment level in parenthesis (nr. of replications 2000) and randomization inference p-values reported below. All specifications include service area pair fixed effects and a constant. Borrowing capacity refers to the maximum amount the respondent expected to be able to borrow from a network contact. In column (1), results are based on an unbalanced respondent-contact panel depending on the number of contacts listed in the network section. Column (2) reports results for a respondent’s total borrowing capacity (i.e. the sum over all contacts). The spread is measured as follows: the single largest amount that a respondent can borrow from one of her contacts (column 3), the absolute difference between the maximum and minimum amounts (column 4), the variance (column 5), and the coefficient of variation (sd/mean, column 6). Controls are age and years of education of the household head, household size, and whether the household owns any land.

Table of Contents
1. Introduction
2. Study Design and Context
3. Access to Formal Banking Services
4. Formal Finance and Village Risk-Sharing Capacity
5. Formal Finance and Moneylenders
6. Conclusion

Mechanisms of Impact
• Formal financial institution (FFI) and moneylenders may be substitutes or complements
• Channels of impact in the literature:– Crowding Out: Entrance of FFI encourage borrowers to shift from moneylenders
to FFI due to lower interest rates– Crowding In: Inflexible and frequent repayments required for FFI loans may
actually increase borrowing from moneylenders (Mallick, 2012)
– Scale Dis-economies and/or Cream-Skimming: Entry of FFI may result in the loss of an economy of scale for moneylenders; alternatively, low-risk borrowers may gravitate to the cheaper FFIs, leaving higher-risk borrowers to face a (worse) moneylender market
– Re-lending: Moneylenders may borrow from formal financial institutions and re-lend to other householders
– Collusion: Moneylenders may collude with formal financial institutions to set interest rates (Maitra et al, 2013)

Mechanisms of Impact (cont)
Incidence of borrowing from moneylenders
Interest rate charged by moneylenders
ComplementsCrowding-In Increase Increase
Collusion Increase Ambiguous
Substitutes
Competition Decrease Decrease
Crowding-Out Decrease Ambiguous
Cream-Skimming Decrease Increase
Scale Diseconomies Decrease Increase

Decrease in Borrowing from Moneylenders
Table 4: Informal Moneylender Loans
Any Loan Number of Loans Loan Size
Outstanding Repaid Outstanding Repaid Outstanding Repaid
(1) (2) (3) (4) (5) (6)
Panel A: without controls
Treatment -0.119***(0.0360)
0.00581(0.0147)
-0.208***(0.0719)
-0.0352(0.0415)
-5530.2(3532.7)
-832.4(1148.9)
Panel B: with controls
Treatment -0.114***(0.0367)
0.00964(0.0170)
-0.184**(0.0782)
-0.0324(0.0433)
-5059.4(3561.9)
-787.7(1117.1)
Control Mean 0.453 0.109 0.852 0.188 17372.4 3046.3
N 623 635 613 634 613 634***p < 0.01, **p < 0.05, *p < 0.10
Notes: Estimated using OLS with wild bootstrap errors clustered at the treatment level in parenthesis (nr. of replications 2000) and randomization inference p-values reported below. All specifications include service area pair fixed effects and a constant. “Outstanding” refers to all outstanding loans (over Rs. 2000) at the time of the survey while “repaid” refers to loans (over Rs. 2000) the household had repaid during the 12 months prior to the survey. The loan and the average amounts are in Rs. Controls are age and years of education of the household head, household size, and whether the household owns any land.

Table of Contents
1. Introduction
2. Study Design and Context
3. Access to Formal Banking Services
4. Formal Finance and Village Risk-Sharing Capacity
5. Formal Finance and Moneylenders
6. Conclusion

Conclusion
• How does the process of economic development influence household behavior?
• When other options become available, households shift away from pre-existing informal finance options
– This is true for both informal sharing arrangements and regulated moneylender activities
– Moneylender loans in particularly are likely to be more expensive than formal credit; evidence also suggests that friends and relatives also charge interest on many loans
• In response to availability of formal credit, respondent households may be less willing to invest in maintaining financial ties

Thank You