Fertilizer Trade and Pricing in Uganda - AgEcon...
15
Agrekon, Vol 42, No 4 (December 2003) Omamo FERTILIZER TRADE AND PRICING IN UGANDA SW Omamo 1 Abstract Liberalized fertilizer markets in eastern Africa typically deliver fertilizer to smallholder farming regions at prices that render its use unprofitable. Simultaneously, faced with little demand for fertilizer in these regions, fertilizer traders appear unwilling to invest in measures that might reduce farm-gate prices. A basic question throughout the region is therefore how to cost-effectively increase smallholders’ access to fertilizer, under conditions of liberalized and privatised trade in the input. This paper explores that question for Uganda using data from a wide- ranging study of Uganda’s fertilizer sub-sector. The prevailing system of fertilizer procurement and distribution is found to imply a market structure dominated by retail-level trade, high prices, and low net margins. The study concludes that there is no inherent pressures in the extant system of fertilizer procurement and distribution toward development of a wholesaling backbone that might allow capture of scale economies. But with imaginative and sustained investments in institutional innovation and strengthening, there is scope to reduce prices and increase net trading margins. 1. FERTILIZER TRADE AND PRICING IN UGANDA Soil nutrient depletion is widespread on small farms in eastern Africa (De Jager et al, 1998; KARI, 1998; Pender et al, 2001; Sanchez et al, 1997; World Bank, 2001). Improved management of soil organic matter is well recognized as crucial to soil fertility replenishment in the region (Woomer & Swift, 1994). Greater use of inorganic fertilizers is also central to realizing the productivity and yield increases required to override smallholders’ motives to pursue nutrient-depleting subsistence-oriented production strategies (Palm et al, 1997). But throughout the region, farmers typically apply inorganic fertilizers at rates well below recommended levels, or not at all (Tegemeo, 1998; Pender et al, 2001). Low rates of fertilizer adoption and utilization have been linked not only to poor knowledge and understanding of fertilizer-based cultural practices 1 Research Fellow and Network Coordinator, International Food Policy Research Institute, 18 KAR Drive, PO Box 28565, Kampala, Uganda. Tel: 256-41-234613; Fax: 256-41-234614; E-mail: [email protected]. 310
Transcript of Fertilizer Trade and Pricing in Uganda - AgEcon...

Agrekon, Vol 42, No 4 (December 2003) Omamo FERTILIZER TRADE AND PRICING IN UGANDA SW Omamo1 Abstract Liberalized fertilizer markets in eastern Africa typically deliver fertilizer to smallholder farming regions at prices that render its use unprofitable. Simultaneously, faced with little demand for fertilizer in these regions, fertilizer traders appear unwilling to invest in measures that might reduce farm-gate prices. A basic question throughout the region is therefore how to cost-effectively increase smallholders’ access to fertilizer, under conditions of liberalized and privatised trade in the input. This paper explores that question for Uganda using data from a wide-ranging study of Uganda’s fertilizer sub-sector. The prevailing system of fertilizer procurement and distribution is found to imply a market structure dominated by retail-level trade, high prices, and low net margins. The study concludes that there is no inherent pressures in the extant system of fertilizer procurement and distribution toward development of a wholesaling backbone that might allow capture of scale economies. But with imaginative and sustained investments in institutional innovation and strengthening, there is scope to reduce prices and increase net trading margins. 1. FERTILIZER TRADE AND PRICING IN UGANDA Soil nutrient depletion is widespread on small farms in eastern Africa (De Jager et al, 1998; KARI, 1998; Pender et al, 2001; Sanchez et al, 1997; World Bank, 2001). Improved management of soil organic matter is well recognized as crucial to soil fertility replenishment in the region (Woomer & Swift, 1994). Greater use of inorganic fertilizers is also central to realizing the productivity and yield increases required to override smallholders’ motives to pursue nutrient-depleting subsistence-oriented production strategies (Palm et al, 1997). But throughout the region, farmers typically apply inorganic fertilizers at rates well below recommended levels, or not at all (Tegemeo, 1998; Pender et al, 2001). Low rates of fertilizer adoption and utilization have been linked not only to poor knowledge and understanding of fertilizer-based cultural practices 1 Research Fellow and Network Coordinator, International Food Policy Research Institute, 18 KAR Drive, PO Box 28565, Kampala, Uganda. Tel: 256-41-234613; Fax: 256-41-234614; E-mail: [email protected].
310

Agrekon, Vol 42, No 4 (December 2003) Omamo among smallholders (Seward & Okello, 2000), but also to systematic exclusion of smallholders from fertilizer markets (Tegemeo, 1998). These recently liberalized markets typically deliver fertilizer to smallholder farming regions at prices that render its use unprofitable (Mose, 1998; Mose et al, 1997; Tegemeo, 1998). Simultaneously, faced with little demand for fertilizer in smallholder regions, fertilizer traders appear to be unwilling to invest in measures that might reduce those farm-gate prices (Omamo & Mose, 2001). Several efforts are underway in the region to try to override these failures in fertilizer markets. Initiatives range from relatively isolated but focused, community-oriented initiatives (e.g. Seward & Okello, 2000), to wider-reaching programs aiming to build stockist networks in smallholder areas (e.g. IDEA, 2002; SG-2000, 2002; AT-Uganda, 2001), to centrally coordinated national schemes with broad development aims (e.g. World Bank, 2001). A basic question facing all of these efforts is how to cost-effectively increase smallholders’ access to fertilizer, under conditions of liberalized and privatised trade in the input. This paper explores that question for Uganda using data from a wide-ranging study of Uganda’s fertilizer sub-sector. The study was undertaken between November 2001 and June of 2002 and comprised informal interviews and a structured survey of a range of stakeholders including fertilizer traders, transporters, farmers, farmer organizations, NGOs, and government officials. Secondary data sources were also exploited. In this paper, qualitative information on how fertilizer trading is organized is combined with quantitative data on trading costs and price formation to assess prospects for market-based reductions in retail fertilizer prices and trading margins. The next section describes the principal channels used to procure and distribute fertilizer in the country. Prices and marketing margins for the major traded fertilizers are then analysed. This is followed by a discussion of options for reducing prices and increasing marketing margins. Implications for policy are drawn. 2. PROCUREMENT AND DISTRIBUTION Figure 1 shows the current organization of fertilizer procurement and distribution in Uganda. Table 1 shows total imports and import shares of the leading firms.
311

Agrekon, Vol 42, No 4 (December 2003) Omamo
Ugandan importers and wholesalers
Farmer groups and associations
Retail stockists
NGOs
Large-scale farms
Small-scale farmers
Kenyan importers Overseas suppliers Source: Author’s survey of traders. Note: The principal procurement and distribution channel is shown in bold. Figure 1: Principal procurement and distribution channels for fertilizer in
Uganda in the 2001-2002 cropping year The key players are importers based in the capital, Kampala, and in Mbale, a town near the border with Kenya. These importers procure fertilizer either directly from overseas suppliers or from other, larger importers based in Nairobi, Kenya. The latter source is the more common of the two. Fertilizer availability in Kenya therefore determines that in Uganda; fertilizer prices in Uganda are based on those in Kenya. An important feature of the marketing system is that Uganda’s importers also function as wholesalers. The survey of traders did not yield a single wholesaling operation outside Kampala and Mbale. Save for two importer-wholesalers based in Mbale, fertilizer wholesaling is concentrated in Kampala.
312

Agrekon, Vol 42, No 4 (December 2003) Omamo Large-scale farms typically procure fertilizer directly from overseas, only occasionally putting out tenders for supply by domestic firms. The market is therefore essentially a retail market. Table 1: Estimated import shares of leading firms in Uganda, 2001
Rank of importer Quantity imported (tons)
Share of imports (%)
Cumulative share (%)
1 4,933 25 25 2 3,500 18 43 3 1,814 9 52 4 908 5 57 5 500 3 60 6 390 2 62 7 350 2 63 8 175 1 64
Total of top 8 12,570 64 64 Total for Uganda 19,564 - -
Sources: Uganda Revenue Authority and author’s survey of traders. The absence of a geographically dispersed wholesaling backbone is the most important feature of Uganda’s fertilizer market. Virtually all the fertilizer sold outside Kampala and Mbale is sold on a retail basis. Several interviewed traders quote “wholesale” prices. But almost invariably, “wholesale” refers to a few 50 kg bags. “Retail” refers to fertilizer sold in 5 kg or 1 kg bags. Given the extreme seasonality in fertilizer sales, fertilizer retail stockists are invariably engaged in other retailing activities. Other agricultural inputs, various farm implements, and common consumer dry goods are typical groupings. Scales of operation are small. In most cases, fertilizer trade occurs in one-person outfits sited in small stalls (kiosks) in or near central market places. A number of NGOs involved in agricultural development have invested in building capacity for input supply among stockists and in catalysing demand for inputs by smallholders, typically in collaboration with local farmer groups and associations. In some cases, the NGOs merely serve to link farmers with Kampala and Mbale based importer-distributors, with trade proceeding on a commercial basis (e.g. AT-Uganda, 2002; IDEA, 2002; SG-2000, 2002). In other cases, the NGOs actually procure fertilizer and distribute it to farmers at a subsidized rate (Gasparotti, 2002). In some towns—such as Mbarara and Kabale in western Uganda—district branches of the Uganda National Farmers Association (UNFA) are active, selling fertilizer at rates that appear to reflect major marketing costs.
313

Agrekon, Vol 42, No 4 (December 2003) Omamo Liberalization of Uganda’s fertilizer market has induced a vigorous response from the private sector, implying that broad efficiency gains have accrued to the farming sector. However, due in large part to the high cost of entry and participation in fertilizer importation, the fertilizer market is imperfectly competitive. The level of concentration is high. The eight leading importer-wholesalers—i.e., those who do not concentrate on the large-farm segment of the market—jointly account for 12,500 tons of fertilizer imports, almost two-thirds of the entire market of 19,500 tons.2 Their actual share of domestically traded fertilizer is much larger, since direct imports of fertilizer by large-scale farms account for most of the remaining 7,000 tons. For instance, one large tea estate in western Uganda imported 1,845 tons in 2001; one firm that concentrates on large-scale flower producers accounted for 800 tons in that year. The leading importer accounts for fully one-quarter of the market. The top four firms—all Kampala-based—account for almost 60% of the market. 3. PRICES AND MARGINS Fertilizer prices in Uganda have fallen significantly in recent years.3 But they remain high. In late May 2002, the wholesale price of one tons of diammonium phosphate (DAP) in Kampala was $325. In comparison, the price in Nairobi was $265/ton. The fob price in Tampa, US was $165. Given that retail sales dominate fertilizer trade in Uganda (Figure 1), the remainder of this section focuses on retail prices and margins. Within Uganda, retail prices rise steadily from Mbale in the east to towns like Mbarara and Kabale in the west (Table 2). At the time of the trader survey (May-June, 2002), retail margins ranged from 5% (in Bukedea) to 28% (in Kabale). These margins were generally lower than were those reported for 2000 (IFDC, 2001). The reason for this decline is not fully clear. One cause might be increased competition as more firms enter a market that is growing slowly, if at all.4 To build understanding of the nature of that market, consider prices and margins in the three towns of Bukedea, Iganga and Kabale. 2 At 19,500 tons, the size of Uganda’s market (i.e., excluding the large farm sector) in 2001 appears to be equivalent to its size in 2000 (IFDC, 2001). 3 Urea and diammonium phosphate (DAP) prices fell from between US$26.25 and US$31.25 per 50 kg bag, respectively, in late 1998 to US$16.70 and US$$20.55 per 50 kg bag, respectively, in December 2000. 4 Cf. footnote 1.
314

Agrekon, Vol 42, No 4 (December 2003) Omamo Table 2: Retail prices and gross retail margins for major fertilizers in
selected locations in Uganda, May-June 2002
DAP CAN Urea
Location Average
retail price
(Ushs/kg)
Gross retail
margin (%)
Average retail price (Ushs/kg)
Gross retail
margin (%)
Average retail price
(Ushs/kg)
Gross retail
margin (%)
Eastern Mbale* 670 10 520 12 570 11 Kapchorwa** 740 8 580 7 600 10 Bukedea** 800 5 - - - - Iganga* 750 18 725 10 650 12 Western Kampala* 705 7 628 11 620 9 Buwana** - - 700 na 700 na Masaka* 720 8 560 14 - - Mbarara** 900 22 - - 900 22 Kabale** 900 23 - - 800 28 Kasese** 760 8 - - 700 11 Fort Portal** 760 9 - - 760 9 Averages (Ushs/kg) 777 12 639 11 704 15 (US$/bag) 21.81 0.34 17.94 0.30 19.79 0.41
Source: Author’s survey of traders. Notes: Ushs = Uganda shilling; 1 Rand = Ushs 205; DAP = diammonium phosphate;
CAN = calcium ammonium nitrate; * = commonly quoted price for a 50 kg bag; ** = commonly quoted price for one kilogram; - = fertilizer was not available at the time of the survey; na = the information was not available, or that traders were unable or unwilling to provide the information.
Bukedea is a small rural trading centre roughly 30 kilometres west of Mbale on the road to Kumi and Soroti. There is just one agricultural input trader in the town that sells these inputs along with various consumer essentials. Fertilizers and seeds are supplied to the trader on credit by an NGO working to develop an input stockist network in that part of the country. The NGO suggests retail prices and associated margins. The in-kind credit arrangement calls for repayment as stocks are sold. Sales of seeds are brisk. The opposite is true for fertilizers, despite the very small margin taken (5%). Fertilizer sales for 2000 totalled just 200 kg (four 50 kg bags). The trader attributes this sluggish demand to lack of awareness of fertilizer use among farmers. Price likely also matters. DAP costs 16% less in nearby Mbale. The fertilizer supplied by the NGO was sourced in Kampala, where prices are higher than they are in Mbale. The trader is well aware of that differential, having recently begun to re-stock seed supplies from an Mbale-based wholesaler. But the trader is unwilling to invest in new, lower-priced supplies of fertilizer until her slow-moving high-priced stock sourced in Kampala is sold. She is also unwilling to lower prices of held stocks and incur the associated loss.
315
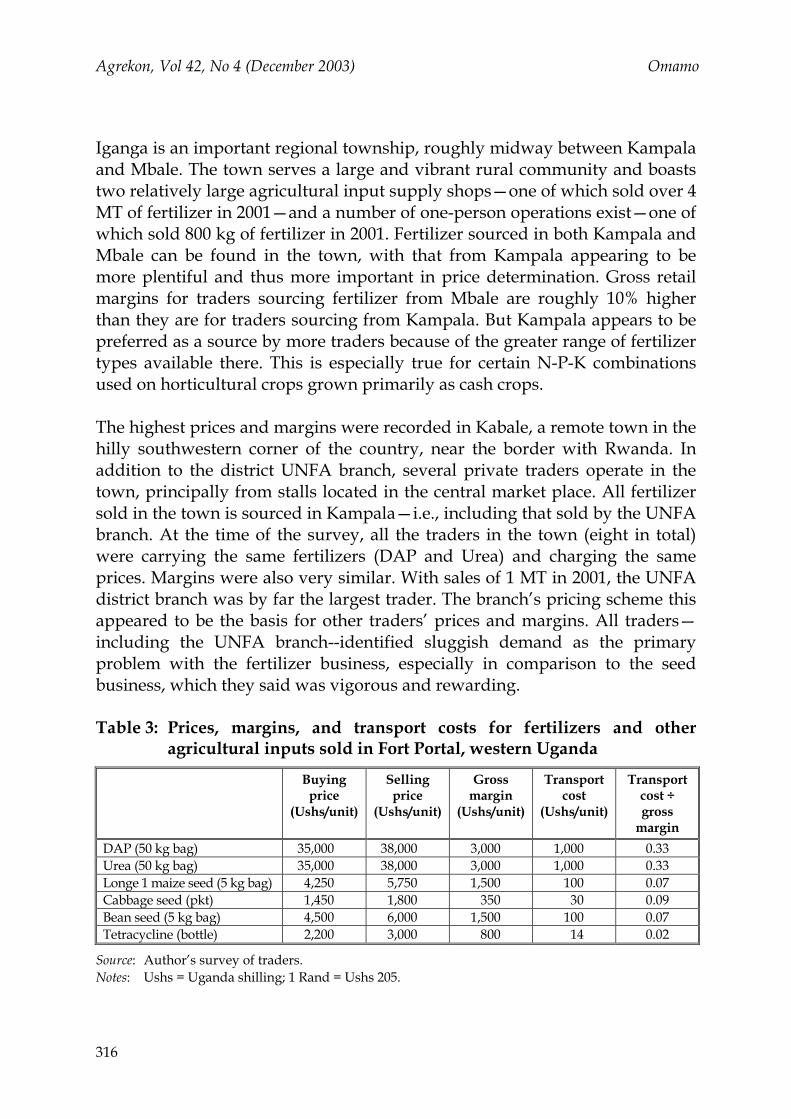
Agrekon, Vol 42, No 4 (December 2003) Omamo Iganga is an important regional township, roughly midway between Kampala and Mbale. The town serves a large and vibrant rural community and boasts two relatively large agricultural input supply shops—one of which sold over 4 MT of fertilizer in 2001—and a number of one-person operations exist—one of which sold 800 kg of fertilizer in 2001. Fertilizer sourced in both Kampala and Mbale can be found in the town, with that from Kampala appearing to be more plentiful and thus more important in price determination. Gross retail margins for traders sourcing fertilizer from Mbale are roughly 10% higher than they are for traders sourcing from Kampala. But Kampala appears to be preferred as a source by more traders because of the greater range of fertilizer types available there. This is especially true for certain N-P-K combinations used on horticultural crops grown primarily as cash crops. The highest prices and margins were recorded in Kabale, a remote town in the hilly southwestern corner of the country, near the border with Rwanda. In addition to the district UNFA branch, several private traders operate in the town, principally from stalls located in the central market place. All fertilizer sold in the town is sourced in Kampala—i.e., including that sold by the UNFA branch. At the time of the survey, all the traders in the town (eight in total) were carrying the same fertilizers (DAP and Urea) and charging the same prices. Margins were also very similar. With sales of 1 MT in 2001, the UNFA district branch was by far the largest trader. The branch’s pricing scheme this appeared to be the basis for other traders’ prices and margins. All traders—including the UNFA branch--identified sluggish demand as the primary problem with the fertilizer business, especially in comparison to the seed business, which they said was vigorous and rewarding. Table 3: Prices, margins, and transport costs for fertilizers and other
agricultural inputs sold in Fort Portal, western Uganda
Buying price
(Ushs/unit)
Selling price
(Ushs/unit)
Gross margin
(Ushs/unit)
Transport cost
(Ushs/unit)
Transport cost ÷ gross
margin DAP (50 kg bag) 35,000 38,000 3,000 1,000 0.33 Urea (50 kg bag) 35,000 38,000 3,000 1,000 0.33 Longe 1 maize seed (5 kg bag) 4,250 5,750 1,500 100 0.07 Cabbage seed (pkt) 1,450 1,800 350 30 0.09 Bean seed (5 kg bag) 4,500 6,000 1,500 100 0.07 Tetracycline (bottle) 2,200 3,000 800 14 0.02
Source: Author’s survey of traders. Notes: Ushs = Uganda shilling; 1 Rand = Ushs 205.
316

Agrekon, Vol 42, No 4 (December 2003) Omamo A basic problem facing fertilizer traders across the country is that while fertilizer prices and margins are high, these prices and margins are low relative to unit costs of transporting fertilizer, especially relative to other important farm inputs. For instance, in the western Uganda town of Fort Portal, the ratios of transport costs to gross retail margins for DAP and Urea are five times those of popular seed varieties, and more than ten times that of a common veterinary input (Table 3). Were traded quantities of these fertilizers high, these relationships would not be so damaging. But traded quantities are low. Table 4: Cost and price build-up for DAP from Nairobi, Kenya to
Kapchorwa, Uganda
Cost item Description Cost
(Ushs/kg) Cumulative
cost (Ushs/kg)
Nairobi Nairobi sales price $265/mt 472 472 Mbale Transport to Mbale Road transport @ $US 2.90 per 50 kg bag 103 575 Clearing charges at border Agent commission Ushs 100,000/15 mt lorry 7 582 Unloading Ushs 50/bag 1 583 Handling Ushs 50/bag 1 584 Storage 15 mt for 2 weeks @ 18% 62 646 Overheads (0.2*1,701,000)/175,000 2 648 Licences (0.2*350,000)/175,000 0.4 648 Total costs Nairobi price + marketing costs 648 Selling price Actual selling price 670 Importer's net margin Selling price - total costs 22 % mark-up of importer Net margin*100/selling price 3.23 Kapchorwa Transport to Kapchorwa Road transport @ Ushs 1000/ 50 kg bag 20 668 Unloading Ushs 50/bag 1 669 Handling Ushs 50/bag 1 670 Storage 10 bags for @ 18% 7 677 Overheads (0.2*70,000)/500 28 705 Licences (0.2*20,000)/500 8 713 Total costs Nairobi price + marketing costs 713 Selling price Actual selling price 740 Trader's net margin Selling price - total costs 27 % mark-up of trader Net margin*100/selling price 3.60
Source: Author’s survey of traders. Notes: Ushs = Uganda shilling; 1 Rand = Ushs 205. The figures in Table 3 thus illustrate the basic impediment to development of a wholesaling backbone in Uganda’s fertilizer market. Better roads would reduce transport costs and improve the ratios somewhat for all the items. But such reductions would not change the basic fact that fertilizer has a very high
317

Agrekon, Vol 42, No 4 (December 2003) Omamo transport cost relative to its sale value. That conclusion is further reinforced by the finding of small net margins to fertilizer trading at all levels of the market (Table 4 and 5). Ranging from 3 to 5%, these net margins are lower than are many of those in Kenya, which range between 1 and 9% (Wanzala, 2001). Table 5: Cost and price build-up for DAP from Nairobi, Kenya to Fort
Portal, Uganda
Cost item Description Cost
(Ushs/kg) Cumulative
cost (Ushs/kg)
Nairobi Nairobi sales price $265/mt 472 472 Kampala Transport to Kampala Road transport @ $US 3.50/50 kg bag 125 597 Clearing charges at border Agent commission Ushs 100,000/15 mt lorry 7 604 Unloading Ushs 50/bag 1 605 Handling Ushs 50/bag 1 606 Storage 15 mt for 2 weeks @ 18% 62 668 Overheads (0.2*1,701,000)/175,000 2 670 Licences (0.2*350,000)/175,000 0.4 670 Total costs Nairobi price + marketing costs 670 Selling price Actual selling price 705 Importer's net margin Selling price - total costs 35 % mark-up of importer Net margin*100/selling price 4.92 Fort Portal Transport to Fort Portal Road transport @ Ushs 1000/50 kg bag 20 690 Unloading Ushs 50/bag 1 691 Handling Ushs 50/bag 1 692 Storage 10 bags for @ 18% 7 699 Overheads (0.2*70,000)/500 28 727 Licences (0.2*20,000)/500 8 735 Total costs Nairobi price + marketing costs 735 Selling price Actual selling price 760 Trader's net margin Selling price - total costs 25 % mark-up of trader Net margin*100/selling price 3.24
Source: Author’s survey of traders. Notes: Ushs = Uganda shilling; 1 Rand = Ushs 205. 4. REDUCING PRICES AND INCREASING MARGINS What is the scope for reducing fertilizer prices to farmers? Preliminary answers are suggested by the results in Tables 4 and 5. Viewed in light of additional information obtained during fieldwork, the results in the tables identify different forms and organizational arrangements in transportation and direct importation of fertilizer as possible sources of costs reductions.
318

Agrekon, Vol 42, No 4 (December 2003) Omamo 4.1 Road transport Tables 4 and 5 show that at each level of the market, road transport costs account for between 50 and 60% of marketing costs. Fuel, maintenance, and depreciation charges dominate these costs. It is difficult to imagine significant reductions in such charges. The need to traverse Kenya’s Rift Valley is unavoidable. Road quality is improving in Uganda but not in Kenya. Interest rates are high on both countries. However, the survey revealed that improved management and coordination of transportation services can lead to meaningful reductions in fertilizer prices. For instance, the retail price of calcium ammonium nitrate (CAN) in Masaka (a large town 120 kilometres west of Kampala) in early June was Ushs 560 per kg (Ushs 28,000 per 50 kg bag). This price was 11% lower than that in Kampala and only 8% higher than that in distant Mbale. The gross retail margin was also higher than were those in most other towns. This low price and attractive margin resulted from a Masaka-based maize trader’s having transported maize to Busia in Kenya. Finding cheap CAN on sale there, the trader back-loaded it to Masaka. Similar opportunities to reduce transport costs may exist elsewhere in the country. Improved market information (intelligence) is crucial to identification and exploitation of such opportunities. 4.2 Rail transport An obvious avenue through which to reduce fertilizer costs lies in greater use of rail transport. Traders indicate that a one-third reduction in transport costs between Nairobi and Kampala could emanate from this source. Such a reduction in transport costs would translate into a 7% (Ushs 42 per kg) reduction in the cost of delivering fertilizer to Kampala, doubling the associated net margin. But rail transport is unreliable and delay-prone. The costs associated with these delays are enormous. Consider DAP moved from Nairobi to Kampala (Table 5). The cost of capital tied up for the 3 to 4 weeks currently required to move this fertilizer between these two cities by rail would add 7% to total costs (i.e. Ushs 46 per kg), wiping out profit margins. There are few indications of improvements in railway administration in either Kenya or Uganda. Improvements in railway administration would require cross-border cooperation and coordination between Kenya and Uganda. As the East African Community gathers momentum, such cooperation and coordination may become more likely than it appears to be at present.
319

Agrekon, Vol 42, No 4 (December 2003) Omamo 4.3 Direct imports Every interviewed importer identified direct importing of fertilizer into Uganda—i.e., rather than via Kenya—as an attractive and feasible option for reducing fertilizer prices. For DAP, data reported in Wanzala (2001) suggest potential savings of at least Ushs 65 per kg from circumvention of Kenya-based handling and storage costs. This would mean 10% reductions in prices of DAP in both Kampala and Mbale. Assuming other costs were to remain the same, net margins in Kampala would be thrice as high; those in Mbale would be four times larger. The principal stumbling block to realization of such gains is the requirement by overseas suppliers that consignments be at least 300 MT in size. Such consignments cost more than $100,000 (close to Ushs 180 million), well beyond the reach of the typical Ugandan importer. Limited overdraft facilities, high interest rates on such overdrafts (18% and above), and a range of stiff service charges and commissions on foreign exchange transactions add between 3 and 5% to these costs. Only two firms indicated that they regularly imported fertilizer directly from overseas. Their ability to do so was clearly based on relationships with large exporters in Europe (a parent company in one case). With these relationships comes the availability of cheap credit from European sources, relatively long repayment periods for in-kind credit, and circumvention of high charges, commissions, and cash deposit requirements levied by local banks. Resulting savings are high. The highest hurdle facing newcomers to fertilizer importing appears to be the need to demonstrate the ability to cover up-front the full costs of a large consignment. To qualify for letters of credit, most Ugandan banks require importers to deposit into their accounts amounts equivalent to the costs of entire consignments. This effectively excludes all but one or two companies from the direct importing business. Recently, the Bank of Uganda provided an official guarantee that circumvented the deposit requirement and facilitated granting of a letter of credit by a private bank to a consortium of private grain traders. This made possible procurement and export of 40,000 MT of maize to southern Africa at a time when the domestic market was awash with the commodity and prices had hit rock bottom. A similar arrangement might permit direct importation of fertilizer and lead to associated reductions in prices and increases in margins. This would require a brand of organization and collective actions among fertilizer traders that is currently absent. A major challenge would be to convince the Ugandan government that a measure used to rescue the maize
320

Agrekon, Vol 42, No 4 (December 2003) Omamo market in a year of unusually low prices is sorely needed in the fertilizer market in all years. 5. SUMMARY AND CONCLUSIONS The basic message of this paper is that the prevailing system of fertilizer procurement and distribution in Uganda implies a market structure dominated by retail-level trade, high prices, and low net margins. The high transport cost of fertilizer relative to its price means that scale economies are largely captured in Kenya, or at the first stage of the marketing chain within Uganda. There are no inherent pressures toward development of the kind of wholesaling backbone that exists in Kenya. Governments in the region—including that in Uganda—are under pressure from international lending agencies to “let markets work.” Most of these governments have taken that edict to mean that they should not do anything at all in markets. That interpretation is unfortunate because it ignores the fact that the default condition for many markets is failure. Potential efficiency-enhancing markets far outnumber actual ones. Uganda’s fertilizer market clearly exists. But its most fundamental efficiency-enhancing component—a wholesaling backbone—remains in the domain of the potential. Is there scope for efficient intervention in the fertilizer market that would reduce prices to farmers and increase net margins to traders? The results suggest that this scope lies in improved market information systems, improved rail services, and flexibility in application of rules governing financing of imports. Given the structure of Uganda’s fertilizer market, the impetus for changes that could lead to realization of this potential must come from private importers. But that raises a number of challenges. The data suggest few incentives for these large market participants to invest in market development. A crucial recognition is that the small-scale retail-oriented trade predominant in Uganda’s farm input sector reflects small-scale subsistence-oriented production patterns across the rural landscape. Such production systems imply low demand for improved inputs. Success in developing Uganda’s fertilizer market thus hinge to a large degree on success in spurring new demand for fertilizer among smallholders. Experience from Kenya suggests that a promising innovation lies in linking fertilizer packaged and distributed in small, affordable sizes (“mini-packs”) with dissemination of improved information on cultural practices, broadly
321

Agrekon, Vol 42, No 4 (December 2003) Omamo defined—e.g., planting in rows, spacing between rows, seeding rates, timing and rate of fertilizer application (Seward & Okello, 2000). Such an approach requires cooperation between local community organizations, NGOs, and fertilizer traders. It is likely to prove appropriate in Uganda since, like their Kenyan counterparts, Uganda’s smallholders are constrained by both poor access to credit and poor access to relevant and timely information. The Ugandan government also has a crucial role to play. Local communities, NGOS, and private traders are unlikely to invest in the improved market information systems, or in the improved functioning and coordination of rail services that the analysis suggests are central to significant cost and price reductions in fertilizer markets. Individual traders are unlikely to be able to convince conservative bankers to bend long-established rules. The Ugandan government should be preoccupied with such concerns; it should be able to convince private traders to organize themselves toward profitable collective outcomes; and it should be able to convince private financial institutions to make low-risk adjustments in standard procedures. The current analysis indicates that such investments are also required if potential reductions in retail prices and increases in net margins are to be realized. ACKNOWLEDGEMENTS Many thanks to the Editor and an anonymous reviewer for helpful comments on an earlier draft. The Rockefeller Foundation, Nairobi Office, provided funding for the research. The research was undertaken while the author was a Research Fellow with the International Service for National Agricultural Research (ISNAR), based at the Eastern and Central Africa Program for Agricultural Policy Analysis (ECAPAPA) in Entebbe, Uganda. A version of the paper was presented at the ECAPAPA workshop on The Assessment of the Fertilizer Sub-Sector in Eastern Africa and Strategic Planning of a Regional Project to Improve Fertilizer Availability, Access and Utilization held 15-17 July in Nairobi, Kenya. REFERENCES AT-UGANDA (2002). Kampala: Appropriate Technology-Uganda. Various Reports of Appropriate Technology-Uganda. www.enterpriseworks.org. DE JAGER A, KARIUKI I, MATIRI FM, ODENDO M & WANYAMA JM (1998). Linking economic performance and nutrient balances in different farming systems in Kenya: A synthesis towards an integrated analysis of economic and ecological sustainability. Agriculture, Ecosystems, and Environment 71(2):81-92.
322
Agrekon, Vol 42, No 4 (December 2003) Omamo GASPAROTTI A (2002). Personal communication. Mr Andrea Gasparotti, Marketing Advisor to Technoserve Uganda Project, Kampala, Uganda. INTERNATIONAL FERTILIZER DEVELOPMENT CENTER (IFDC) 2001. An assessment of fertilizer prices in Kenya and Uganda: Domestic prices vis-à-vis international market prices. Unpublished paper of the International Fertilizer Development Center, Alabama. INVESTMENT IN DEVELOPING EXPORT AGRICULTURE (IDEA) (2002). Fourteenth Semi Annual and Seventh Annual Progress Report of Uganda’s Investment in Developing Export Agriculture (IDEA) project. Agribusiness Development Centre, Kampala, Uganda. KENYA AGRICULTURAL RESEARCH INSTITUTE (KARI) (1998). Soil fertility research priorities in Kenya. KARI-Soil Fertility and Plant Nutrition Research Program. Kenya Agricultural Research Institute, Nairobi, Kenya. MOSE L (1998). Factors affecting the distribution and use of fertilizer in agriculture: A preliminary assessment. Unpublished Manuscript, Egerton University Tegemeo Institute. Egerton University Tegemeo Institute of Agricultural Policy and Development, Nairobi, Kenya. MOSE L, NYANGITO H & MUGUNIERI L (1997). An economic analysis of the determinants of fertilizer use among smallholder maize producers in western Kenya. Unpublished Manuscript, KARI. Kenya Agricultural Research Institute, Nairobi, Kenya. OMAMO SW & MOSE L (2001). Fertilizer trade under market liberalization: Preliminary evidence from Kenya. Food Policy 26:1-10. PALM CA, MYERS RJK & NANDWA SM (1997). Combined use of organic and inorganic nutrient sources for soil fertility maintenance and replenishment. In: Buresh RJP, Sanchez A & Calhoun F (eds), Replenishing soil fertility in Africa. Soil Science Society of America, Madison, Wisconsin. PENDER J, JAGGER P, NKONYA E & SSERUNKUUMA D (2001). Development pathways and land management in Uganda: Causes and implications. EPTD Discussion Paper No. 85. International Food Policy Research Institute, Washington DC. SANCHEZ PA, SHEPERD KD, SOULE MJ, PLACE FM, BURESH RJ, IZAC A-MN, MOKWUNYE AU, KWESIGA FR, NDIRITU CG & WOOMER PL (1997). Soil ferility replenishment in Africa: An investment in natural resource capital. In:
323

Agrekon, Vol 42, No 4 (December 2003) Omamo Buresh RJ, Sanchez PA & Calhoun F (eds), Replenishing soil fertility in Africa. Soil Science Society of America, Madison, Wisconsin. SASAKAWA GLOBAL 2000 (SG-2000) (2002). Various reports of Sasakawa Global 2000. Sasakawa Global 2000, Kampala, Uganda. SEWARD P & OKELLO D (2000). SCODP’s mini-pack method: The first step towards improved food security for small farmers in western Kenya. Paper presented at the 68th Annual Conference of the International Fertilizer Industry Association. Oslo, Norway, May 22-25. TEGEMEO INSTITUTE OF AGRICULTURAL POLICY AND DEVELOPMENT (1998). Monitoring for improved agricultural sector policy making. Working Paper, Egerton University, Tegemeo Institute of Agricultural Policy and Development, Nairobi, Kenya. WANZALA M (2001). Fertilizer markets and agricultural production incentives: Insights from Kenya. Background document for the Tegemeo Institute Agricultural Monitoring and Policy Analysis Conference on Poverty, Technology and Competitiveness, September 6th, Nairobi, Kenya. WOOMER PL & SWIFT MJ (eds) (1994). The biological management of tropical soil fertility. John Wiley and Sons, Chichester. WORLD BANK (2001). Tanzania soil fertility recapitalization and agricultural intensification project. World Bank African Regional Office, Washington DC.
324