Assessing Groundwater Nitrate Pollution in Yaound©, Cameroon
Upload
bijay-singhCategory
view
212download
0
JOURNAL OF
contaminant Hydrology
E L S E V I E R Journal of Contaminant Hydrology 20 (1995) 167-184
Fertilizer-N use efficiency and nitrate pollution of groundwater in developing countries
Bijay-Singh *, Yadvinder-Singh, G.S. Sekhon Department of Soils, Punjab Agricultural University, Ludhiana 141 004, India
Received 15 November 1994; accepted 15 May 1995 after revision
Abstract
Around 76% of the world's population lives in developing countries where more fertilizer-N is currently applied than in developed countries. Fertilizers are applied preferentially in regions where irrigation is available, and soil and climatic conditions are favorable for the growth of crop plants. Due to low N application rates during the last 3 or 4 decades, negative N balances in the soil are a characteristic feature of the crop production systems in developing countries. In the future, with increasing fertilizer-N application rates, the possibility of nitrate pollution of groundwater in developing countries will be strongly linked with fertilizer-N use efficiency. A limited number of investigations from developing countries suggest that, in irrigated soils of Asia or in humid tropics of Africa, the potential exists for nitrate pollution of groundwater, especially if fertilizer-N is inefficiently managed. In a large number of developing countries in West and Central Asia and North Africa, the small amount of fertilizer applied to soils (mostly Aridisols) that remain dry almost all the year, do not constitute a major threat for nitrate pollution of groundwater, except possibly when soils are irrigated. In Asia and the Pacific regions, where 70% of the fertilizers are used to grow wetland rice on soils with low percolation rates, leaching of nitrates is minimal. Climatic water balance and soil moisture conditions do not favor leaching of nitrates from the small amount of fertilizer-N applied to Oxisols and Ultisols in Latin America. In developing countries located in the humid tropics, attempts have not been made to correlate fertilizer-N use with nitrate level in groundwater; however, fertilizers are being increasingly used. Besides high rainfall, irrigation is becoming increasingly available to farmers in the humid tropics and substantial leaching of N may also increase.
* Corresponding author.
0169-7722/95/$09.50 © 1995 Elsevier Science B.V. All rights reserved SSDI 0169-7722(95)00067-4

168 Bijay-Singh et al. / Journal of Contaminant Hydrology 20 (1995) 167-184
1. Introduction
Three quarters of the world population live in developing countries and a majority (60%) are engaged in farming. Farmers in developing countries possess ~ 54% of the arable land available in the world and produce as much cereals as in developed countries (FAO, 1991b). Land reserves are limited and in some cases non-existent, especially in Asia which accounts for 58% of the total world population. The only way to increase agricultural production to satisfy the food needs of the 76% of the world population living in developing countries is to increase yield levels per hectare of utilizable land; including through increased use of fertilizers.
Cropping systems based on nutrient supply through fertilizers, when superimposed on the natural ecosystem, can create a modified ecosystem that may not be in harmony with other environmental entities. Excessive use of N fertilizers and irrigation has made it possible to increase production and diversify the type of crops grown at the risk of increasing percolation and leaching of nitrates to groundwater. In both developed and developing countries, the environmental consequences of irrigation coupled with increas- ing rates of N fertilization are already being recognized, particularly in regions where groundwater is relatively shallow. In humid and subhumid regions, irrigation may not be possible or economically feasible, but precipitation is frequently sufficient to cause nitrate leaching.
Nitrate leaching is inevitable under most agricultural production systems. While it is not possible to halt nitrate leaching, improved management practices leading to in- creased fertilizer-N use efficiency (FUE) can reduce the potential for nitrate contamina- tion of groundwater. Increased crop N uptake and yield achieved through an awareness and careful integration of soil, climate and cultural variables over the entire year result in improved FUE to help ensure reduced leaching of nitrates.
Due to excessive fertilizer use in developed countries during the last 3 or 4 decades, groundwater at some locations is already polluted with nitrate that has leached particu- larly from intensively or over irrigated soils (Follett, 1992; Williams, 1992). Although there has been a concurrent rise in nitrate concentration in groundwater with fertilizer-N usage, animal excreta, sewage effluent and decomposition of soil organic matter are the other sources contributing nitrate-N significantly to groundwater bodies (Keeney, 1989). With increasing fertilizer use, a situation similar to developed countries may also arise in developing countries. Thus, developing countries possess a distinct advantage of being late-comers in the development process and are in a position to avoid some of the costly and needless mistakes made by developed countries in the past. This paper attempts to assess the present status of nitrate pollution of groundwater due to fertilizer use and the possibilities for such an occurrence in developing countries located in Asia, Africa and Latin America. The role of FUE has been discussed as the factor which can effectively be used to help control leaching losses of nitrate beyond the root zone of crops.
2. Fertilizer use in developing countries: patterns and trends
Data pertaining to consumption of fertilizer-N in developed and developing countries and the world are summarized in Table 1. During 1980/1981 to 1989/1990 annual

Bijay-Singh et al. /Journal of Contaminant Hydrology 20 (1995) 167-184
Table 1 World fertilizer-N consumption (Gg)
169
1975-1976 1980-1981 1985-1986 1989-1990
Developing countries 12,171 24,997 31,372 40,907 Developed countries 30,737 35,693 38,612 38,171 World 42,908 60,690 69,984 79,078
Source: FAO (1980, 1985,1987,1991a).
fertilizer-N consumption increased by ~ 63%, ~ 7% and ~ 30% for developing countries, developed countries and the world, respectively. In 1990/1991 fertilizer (NPK) consumption in developed countries fell by 10% and it is expected to fall further by ~ 8% in 1991/1992. On the other hand, fertilizer consumption in developing countries continued to grow by ~ 4% in 1990/1991 and is expected to increase by ~ 5% in 1991/1992. As per forecasts prepared by IFA (Isherwood and Soh, 1992), the fertilizer consumption in 1996J1997 and even in the year 2000 is likely to be well below the 1989/1990 level in developed countries. In contrast, consumption in develop- ing countries is expected to continue to increase at a rate of ~ 2.6% per annum.
Although average fertilizer-N application level in developing countries is fast ap- proaching that in developed countries (Table 2), different regions and countries differ widely with respect to fertilizer-N consumption per unit of arable land. In 1991/1992 Latin America's share of total world fertilizer-N consumption was only 4.5% but Brazil and Mexico accounted for 56% of that consumption. African countries used only 1.6% of the fertilizer-N consumed all over the world in 1991/1992. However, the Republic of South Africa (a developed nation) and Nigeria accounted for 31% and 17%, respec- tively, of Africa's fertilizer-N consumption. At present fertilizer-N consumption in Nigeria is fairly stable and it possesses tremendous potential for increased fertilizer use. Egypt, Iran and Turkey account for 75% of the fertilizer-N consumption in the Near East, where 4.6% of the fertilizer-N produced in the world has been applied in 1991/1992. In South Asia with 13.7% of the world fertilizer-N consumption, India accounted for 78% of the fertilizer-N consumption, Pakistan for 14% and Bangladesh for 6%. In socialist Asia, 27% of the total fertilizer-N produced in the world was consumed in 1991/1992. China alone accounted for 94% of the fertilizer consumption in the region.
Table 2 Fertilizer-N consumption for arable land and permanent crops (kg ha 1 )
1970 1975 1980 1985 1989
Developing countries 11.7 16.8 31.9 39.2 50.9 Developed countries 34.4 46.1 53.2 57.1 56.6 World 22.6 30.5 41.7 47.4 53.5
Source: FAO (1980, 1985, 1987, 1991a).

170 Bijay-Singh et al. /Journal of Contaminant Hydrology 20 (1995) 167-184
3. Nitrogen uptake by crops and balances in the soil
W h e n crops are harves ted , the nutr ients present in the harves ted p roduce are r e m o v e d
f rom the site and the soil is dep le ted to that extent . The degree of nutr ient removal
depends on the crop, its compos i t ion , yie ld level and the extent to w h i c h res idues such
as leaves, s traw, etc., are re ta ined on the field. W h e n more ni t rogen is hauled away in
c rops than is added to soil th rough fert i l izers or b io logica l N 2 f ixation, less n i t rogen will
be avai lable in the soil for l each ing to g roundwa te r bodies .
Resul ts o f an inves t iga t ion init iated in 1963 at Nioro du Rip in central Senegal (Sarr,
1981) wi th a f a l l o w - g r o u n d n u t - s o r g h u m - g r o u n d n u t rotat ion up to 1972 and a m a i z e -
c o t t o n - s o r g h u m - g r o u n d n u t rotat ion a f te rwards are s h o w n in Table 3. Ni t rogen ba lances
Table 3 Estimated nutrient balance after 17 years (1963-1979) of a 4-year rotation in Senegal
(kg ha 1 N)
Treatment Crop removal Fertilizer Balance + crop residues + biological fixed N
No fertilizer - 746 Standard recommendation for NPK - 1,371
+ return of cereal straw
Standard recommendation for NPK - 1,669 + return of straw + supplementary N and P on cereals
+ 252 - 494 + 956 - 415
+ 1,338 - 331
Source: Sarr (1981).
Table 4 Nitrogen balance: actual fertilizer use minus crop removals for wheat and rice in some Indian states
State Crop Crop yields Average N Actual N Nitrogen 1983 / 1984 removal fertilizer use balance (t ha l ) (kg ha 1 ) (kg ha- 1) (kg ha- 1 )
Punjab rice 3.1 65 wheat 3.0 82
total 6.-1- 14~ 10~ 40
Uttar rice 1.3 27 Pradesh wheat 1.9 52
total 3.-~ 79 51 - 28
Bihar rice 1.0 21 wheat 1.5 41
total 2.5 62 20 - 42
Source: Sekhon and Puri (1986).
Bijay-Singh et al. /Journal of Contaminant Hydrology 20 (1995) 167-184 171
YEAR 0 I '
1961
1971
1 9 8 6
19B9
NUTRIENT REMOVAL ( KG I HA)
20 40 60 80 100 120 140 160 i i
L 2 0 0 0 ~
~ ' ~ FERTILISER ADDITIONS
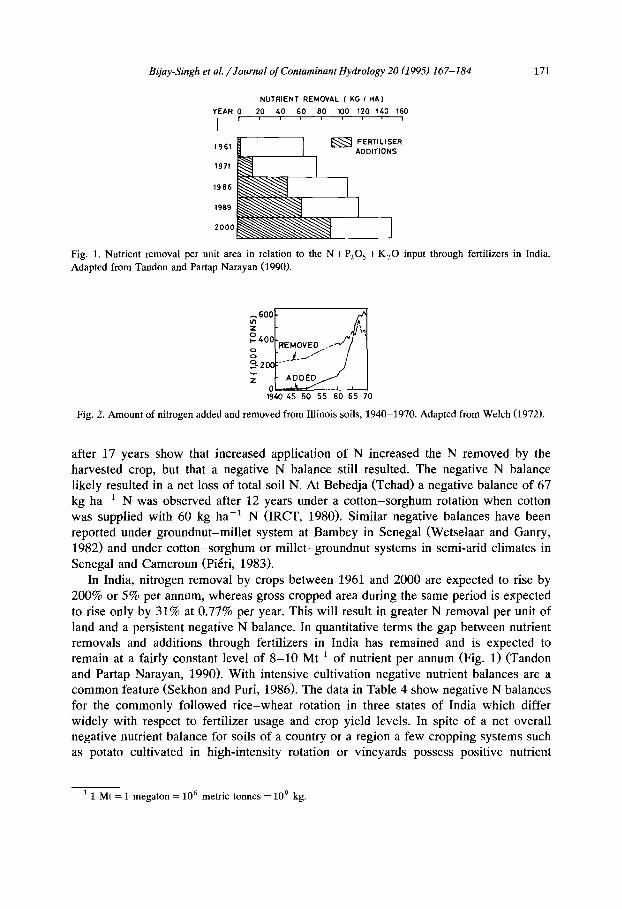
Fig. 1. Nutrient removal per unit area in relation to the N+ P205 +K20 input through fertilizers in India. Adapted from Tandon and Partap Narayan (1990).
0 4 ,v ~- 001"REMOVE D ..... ~7 ~I
19t.oz,5 50 S5 60 65 70
Fig. 2. Amount of nitrogen added and removed from Illinois soils, 1940-1970. Adapted from Welch (1972).
after 17 years show that increased application of N increased the N removed by the harvested crop, but that a negative N balance still resulted. The negative N balance likely resulted in a net loss of total soil N. At Bebedja (Tchad) a negative balance of 67 kg ha 1 N was observed after 12 years under a cot ton-sorghum rotation when cotton was supplied with 60 kg ha -1 N (IRCT, 1980). Similar negative balances have been reported under groundnut-millet system at Bambey in Senegal (Wetselaar and Ganry, 1982) and under cot ton-sorghum or millet-groundnut systems in semi-arid climates in Senegal and Cameroun (Pi6ri, 1983).
In India, nitrogen removal by crops between 1961 and 2000 are expected to rise by 200% or 5% per annum, whereas gross cropped area during the same period is expected to rise only by 31% at 0.77% per year. This will result in greater N removal per unit of land and a persistent negative N balance. In quantitative terms the gap between nutrient removals and additions through fertilizers in India has remained and is expected to remain at a fairly constant level of 8 - 1 0 Mt 1 of nutrient per annum (Fig. 1) (Tandon and Partap Narayan, 1990). With intensive cultivation negative nutrient balances are a common feature (Sekhon and Puri, 1986). The data in Table 4 show negative N balances for the commonly followed r ice-wheat rotation in three states of India which differ widely with respect to fertilizer usage and crop yield levels. In spite of a net overall negative nutrient balance for soils of a country or a region a few cropping systems such as potato cultivated in high-intensity rotation or vineyards possess positive nutrient
1 1 Mt = 1 megaton = 1 0 6 metric tonnes = 1 0 9 kg.

172 Bijay-Singh et al. /Journal of Contaminant Hydrology 20 (1995) 167-184
balance (Tandon and Partap Narayan, 1990) and can pose a potential threat to groundwa- ter quality.
Negative nutrient balances are a common feature of soils in several developing countries. Two to three decades ago, in developed countries, similar negative nutrients balances in soils could also be observed. For example, as shown in Fig. 2 (Welch, 1972), in 1940 in Illinois (U.S.A), harvested crops removed 0.22 Mt N more than was added as fertilizer. In 1969, crops removed 0.141 Mt less than that was added. At present, a positive nutrient budget can be observed in developed nations and it enhances the potential for nitrate pollution of groundwater bodies in these countries.
4. Fertilizer use efficiency and pollution
Percent recovery of fertilizer-N by a crop is known as the fertilizer use efficiency. It varies with the N source and the rate at which fertilizer is applied, the nature of the chemical and biochemical reactions between soil and fertilizer, the timing and placement of fertilizer, the nature of crop and its N requirement, the adequacy of other nutrients and a host of soil, climatic and management factors. The range encountered in percentage recovery of applied N by crops is very wide, whether considered on a local, regional or national scale. Under favorable conditions, > 80% of the fertilizer-N may be recovered by the crop, but under most situations efficiencies of < 50% are common (Allison, 1966).
Depending on the time and circumstance, efficiency of fertilizer means different things to different people. When fertilizers are relatively expensive and market price for the product low, one wants the maximum utilization of the nutrients by the crop. Such conditions often exist in developing countries as they once did in developed countries 30-40 years ago. Because of the shape of the typical yield-input curve (response curve) in which each successive fertilizer increment produces a smaller increase in yield, the response curve flattens near the maximum yield. In most cases, the point of greatest economic return to applied N is somewhere below the point of maximum yield and it is doubtful whether the few last increments can be justified. Since fertilizer-N has been relatively cheap in developed countries and marginal returns obtained near the flat portion of the response curve turn out to be economical, many farmers would opt to operate near the point of maximum yield rather than greatest economic return. This practice, however, results in a very low fertilizer-N use efficiency. A large fraction of the applied N remains unutilized in the soil and creates a potential threat for nitrate pollution of natural waters. Due to subsidization of fertilizer prices, many farmers in some developing countries too, have been using fertilizers rather indiscriminately touching even the point of maximum yield.
When the recovery of fertilizer-N by the harvested portion of crops is less than desirable, improvement in this area is central to the issue of reducing environmental effects of fertilizer use. Fertilizer use efficiency deserves careful attention if agricultur- ists are to produce maximum crop yields and prevent pollution of natural waters with plant nutrients. Fig. 3 (Broadbent and Rauschkolb, 1977) is based on results obtained on an extremely N-deficient soil and shows the general relationship frequently observed

Bijay-Singh et al. /Journal of Contaminant Hydrology 20 (1995) 167-184 173
o
v
o
10
0' 0 100 200 300 400 S00 600
FERTILIZER N APPLIED (KglhQ)
S00
~oo
300 z
200 u
100 o
Fig. 3. Excess accumulation of N in soil in relation to maize yield and plant uptake as affected by N fertilizer rate. Adapted from Broadbent and Rauschkolb (1977).
between applied fertilizer-N, crop yield and N remaining in the soil; presumably this residual soil N is leachable under certain circumstances. The optimum N rate consistent with minimum potential for N loss is somewhat below the maximum yield rate of ~ 200 kg ha- a N. Application rates of N greater than this level resulted in very little additional N uptake by the crop and a substantial amount of N became available for potential leaching. The message contained in this figure is equally valid in developing and developed nations. For example, Fig. 4 (Grove, 1979) shows that the recovery of fertilizer-N by maize was similar at several temperate and tropical region sites located in developed and developing nations in the Western Hemisphere. At N application rates between 35 and 125 kg ha -a N, a fairly constant 55% was recovered in harvested plant tops. FUE dropped sharply when application rates exceeded the assimilative capacity of the crop so that < 40% was recovered at 200 kg ha-~ N.
Nitrogen recoveries for paddy rice, where urea is the predominant fertilizer-N source, are commonly in the range of 20-40% (Vlek and Byrnes, 1986). Such low recoveries are often due to difficulties in controlling N losses by volatilization and denitrification from flooded soils. Thus, low FUE does not always imply that unused N will leach into groundwater. In fact, a significant portion of the unrecovered N remain in the root zone in either immobilized or inorganic forms for use by the following crop and does not
"•80 Go
8 ~o
z2o / • az i l ( N = 4 )
a Nebraska(N=14) • NewYork (N=4) • P u e r t o r i c o ( N : 5 )
510 ' 100 150 200 APPLIED N ( kg / ha,)
Fig. 4. Apparent N recovery by maize at different locations. Adapted from Grove (1979).

174 Bijay-Singh et al. /Journal of Contaminant Hydrology 20 (1995) 167-184
necessarily pose a hazard to the environment as long as excess water does not leach it beneath the rooting depth.
Vigorous crop growth and N assimilation capacity, and application of N in phase with crop demand ensure high FUE and minimal risks of nitrate pollution of groundwa- ter. In order to achieve high FUE and to maintain unutilized N at environmentally acceptable levels, Bijay-Singh et al. (1978) advocated application of fertilizer-N at a level which is the smaller of: (1) the point at which greatest economic returns are obtained, or (2) the point at which the amount of applied N in excess of the environmentally permissible amount of N in the soil profile is absorbed by the crop.
5. Fertilizer nitrogen management and potential for nitrate pollution of groundwa- ter
Since 1950, farmers in the highly developed countries of the world have had little economic incentive to feel concerned about efficient N management, particularly because the cost/benefit ratio for N fertilizer has been low. In fact most mismanage- ment of N fertilizer has occurred in the developed nations (Peterson and Frye, 1989). Thus, the impact on groundwater of large quantities of N fertilizers that have been used in the developed countries is large. As affluence increases in developing nations the problem of groundwater contamination with N will likewise increase (Peterson and Frye, 1989).
Mismanagement of N fertilizer in many regions in both developed and developing countries may have created a nitrate load perched in the vadose zone between the root zone and water table. Any mismanagement of irrigation water or ill-timed or excessive natural precipitation can move the nitrate into or near the water table. In developing countries too, a number of workers have studied efficient use of N fertilizers both from the point of improving crop yields and controlling nitrate leaching beyond potential rooting zone.
It is very common in developing nations that fertilizer use is concentrated in certain districts or areas. For example, the Indian states of Punjab, Haryana and 17 districts of Uttar Pradesh (0.3.106 km 2) consume as much fertilizer as the states of Gujarat, Madhya Pradesh, Maharashtra and Rajasthan combined (1.3. 10 6 km2). This pattern exists within states as well. Thus, in some regions where fertilizer-N usage equals or exceeds even that of developed nations, there exists the possibility of nitrates leaching to groundwater bodies. Fertilizer application levels in some regions are also tuned to factors such as rainfall patterns and amounts. For example in Turkey, fertilizer applica- tion for rain-fed wheat in the low-rainfall areas is restricted to 17.5 kg ha ~ P; under good rainfall conditions it is 60 kg ha 1 N + 17.5 kg ha 1 p. For high yielding varieties under irrigated conditions the recommendation is 80-100 kg ha-1 N + 26 kg ha ~ P (De Geus, 1973). In Jordan, fertilizers are mainly used for irrigated wheat in the
I Jordan valley, but very small amounts are used in the dry region with > 450 mm yr of rainfall (De Geus, 1973)
When 15N-labelled urea was applied at 50, 100 and 150 kg ha ~ to wheat grown at New Delhi, India (Sachdev et al., 1977), distribution of residual fertilizer-N in the soil

Bijay-Singh et al. /Journal of Contaminant Hydrology 20 (1995) 167-184 175
900"
~ 800-
• 700, E E 600
g 500. o
"o~ 400, "13
3oo.
200'
1170,
O,
z 50 ~
30 C
20 ~
to ~
f * Nitrate leaching below 50 cm x Nitrate teaching below 150cm A Drainage from 50cm depth a Drainage from 150 cm depth
'J ' A ' S ' O ' N' O' J ' F'M' A 'M'J ' J 'A ' S' O' N' O' 1975 I 1976 I
Fig. 5. Cumulative drainage and cumulative fertilizer nitrate-N leached below 50- and 150-cm soil depths under maize grown in monsoon season at New Delhi, India. Adapted from R.P. Arora et al. (1980).
profile after the harvest of crop revealed that potential for leaching of nitrogen beyond the rooting zone increased rapidly with increasing level of fertilizer-N. Wheat utilized as much as 48% of the applied N. On a similar coarse-textured alluvial soil, when 15N-labelled urea was applied to maize at 120 kg ha 1 N, N utilization was only 11-22% (R.P. Arora et al., 1980). Maize grows in summer when monsoon rains (400-500 mm) are received, whereas wheat grows in winter when only ~ 100-mm rainfall is recorded. Data in Fig. 5 show that during the monsoon season as much as 50% of the fertilizer-N applied to maize was leached below a depth of 50 cm; ~ 15% was leached below 150 cm.
In the Indian Punjab, where fertilizer application rates are amongst the highest in the country and compare with those in several developed countries, Bijay-Singh and Sekhon (1976a) were able to show that balanced application of N, P and K can significantly reduce the amount of unutilized nitrates in the root zone. When only N was applied to wheat or maize, a substantial portion was recoverable as nitrate from the soil profile up to 2-m depth. But when along with 120 kg ha-~ N, 26 kg ha-I p and 25 kg ha-~ K were applied, there was little nitrate-N in the soil profile which could potentially leach below the root zone. Bijay-Singh and Sekhon (1976b) could demonstrate that as the irrigation rate was increased while its frequency decreased, more nitrate-N was leached to deeper soil layers (Table 5). With lighter and more frequent irrigation schedules, nitrate-N from only the third or fourth split dose of fertilizer remained unutilized in the root zone. Ensuring a deep and extensive root system in early stages of crop by adopting proper irrigation and fertilizer application schedule could considerably reduce the leaching of nitrate-N beyond the root zone. These results pointed out the need to delay large nitrogen application until the crop can utilize it and to avoid irrigation when a large amount of nitrate-N is present in the root zone.

176 Bijay-Singh et al. /Journal of Contaminant Hydrology 20 (1995) 167-184
Table 5 Effect of depth and frequency of irrigation and application of fertilizer-N in split doses on the amount of nitrate-N present at 0-180-cm soil depth after the harvest of wheat
Irrigation depth Frequency of (cm) irrigation
Application of 150 kg ha- l N fertilizer ~ in
single dose 2 split doses 3 split doses 4 split doses
(kg ha- 1 NO~-N)
5.5 7 21.6 26.9 51.2 71.1 7.5 5 44.2 31.9 48.2 48.0 9.5 4 59.1 66.5 80.3 132.0
a Single dose or first split dose was applied at the time of sowing of wheat. For irrigation depths of 5.5, 7.5 and 9.5 cm second split dose was applied 32, 32 and 38 days, respectively, after sowing of wheat; third split dose was applied 71, 80 and 80 days, respectively, after sowing of wheat; and fourth split dose was applied 84, 100 and 106 days, respectively, after sowing of wheat. Source: Bijay-Singh and Sekhon (1976b).
Vegetation retards nitrate leaching from root zone by absorbing nitrates and water. Rooting habits of plants exert a profound influence on nitrate mobili ty in the root zone. Bijay-Singh and Sekhon (1977) showed that maximum leaching of nitrate-N below the root zone occurred from crop rotations with heavily fertilized shallow rooted crops like potato, Wheat, when grown in a rotation absorbed a large fraction of the applied N due to its deep rooting system.
Large amounts of fertil izer-N in developing countries in Asia are applied to wetland rice. Due to reduced soil conditions, ammonium-N is not readily converted to nitrate-N under rice. The limited amount of nitrates produced under rice are preferentially lost via denitrification so that losses via leaching are small. Studies carried out with 15N-labelled materials or otherwise (Bijay-Singh et al., 1991b; Katyal et al., 1985) provide substantial evidence that nitrates are not leached in large amounts beyond the potential rooting zone of rice.
Nitrogen uptake efficiency of cereal crops in the humid and subhumid tropics is often low (Sanchez, 1972; Jones, 1973; Oyedokun, 1976; Kang et al., 1977; Haque, 1979) and as little as 22% of the applied N is found in the plant at harvest (Y. Arora and Juo, 1982). Low recoveries ( < 50%) are generally observed when higher rates of N were applied or when fertilizer was applied to soils with high native N-supplying capacity. Rapid losses of native and applied N through leaching are believed to be a major cause. This is particularly so in the highly permeable Ultisols and Oxisols in the humid regions where precipitation greatly exceeds evapotranspiration during the growing season. Leaching losses may also occur, though to a lesser extent, in the drier areas (Wild, 1972; Jones, 1975; Jones, 1976). Gamboa et al. (1971) reported leaching losses of 65% of applied N in Costa Rican alluvial soils under a maize crop. Charreau (1972) observed progressive losses of N in West African Ultisols as rainfall increased.
Y. Arora et al. (1987) found that recovery of applied N by maize grown under humid conditions in Nigeria from calcium ammonium nitrate (CAN) and urea were 28% and 50%, respectively; whereas recovery under subhumid condition was 46% and 34%, respectively. Total recovery (soil to 120-cm depth + plant uptake) of urea-N was much

Bijay-Singh et aL /Journal of Contaminant Hydrology 20 (1995) 167-184 177
lower under subhumid (40%) than under humid (60%) conditions, suggesting that excessive N leaching loss from CAN under humid conditions and volatilization loss from urea under subhumid conditions were responsible for poor efficiency of fertilizer-N. Mughobo et al. (1990) reported research from the forest zone to savanna experimental sites in Guinea that differed greatly in amounts of rainfall received. These 15N balance studies showed losses of 11-33% of applied N. On the basis of N distribution in the soil profile, leaching was postulated to have been a problem at the wettest site. In a coarse-textured kaolinitic Ultisol under mono-modal high rainfall conditions, application of fertilizer-N in one-, two- or three-split doses resulted in percentage recovery of applied N by maize as 22%, 35% and 41% and by rice as 31%, 39% and 61%, respectively (Y. Arora and Juo, 1982). Splitting of N from one to three applications reduced the leaching loss from 53% to 28% of applied N. Under the conditions of high precipitation and heavy overcast of the humid tropics, the probability exists that up to > 50% of mineral-N initially in the soil may be lost through leaching between the onset of the rain and plant establishment (Osiname et al., 1983). In Tanzania, only 7% of the fertilizer-N was recovered within the 120-cm depth of the uncropped bare plot one year after application (Leutenegger, 1956).
Although it is assumed that leaching of nitrates is rapid in savanna soils, field observations indicate wide variation in leaching efficiency (0.2-7.0 cm downward movement of nitrate per cm rainfall) varying with site (Jones, 1976). Texture is important but the mode of water movement through soil is still very incompletely understood. At Bambey, Senegal, rapid leaching of surface applied nitrate was attributed to preferential water movement through the large pores (Blondel, 1971). At Samaru, Nigeria, Wild (1972) explained the slow leaching of native nitrate in terms of rapid drainage of storm water through deep cracks and channels in the soil, leaving much of the nitrate within fine pores from which diffusion was slow. According to Jones (1976) rapidly percolating water may carry with it up to a quarter of the fertilizer nitrate applied to the top soil, but the greater part of the applied nitrate moves down through the profile only as a slow wave and is likely to remain within the rooting zone for a large part of the growing season.
In tropical Brazilian soils under sugarcane ~ 30% of the 15N-labelled fertilizer-N was lost via leaching or denitrification from the 0-120-cm soil profile (Cervellini et al., 1980). In Chile, application of 100 mm of water to a dystrandept (Vilcun soil) could transport surface applied sodium nitrate (12.8-1280 kg ha -1 N) to a depth of 55 cm. Application of another 10 cm of water could transport all the nitrate-N to the 55-90-cm soil depth (Schenkel and Baherle, 1983).
In a study based on 65 arable, livestock or mixed ecosystems located all over the world (Frissel, 1978) output of all arable systems was between 30% and 100% of the input. Up to a farm input of 150 kg ha -1 yr -1 N, the output efficiencies were often close to 66%. For inputs above 150 kg ha-1 yr 1 N, the outputs were scattered around the 50% efficiency curve, indicating slightly lower efficiencies at higher farm inputs. From 1% to 100% of the farm input and up to 90 kg ha -1 yr -1 N was lost via leaching from all the ecosystems (Fig. 6). Highest values are reported from systems based on cotton, mixed farming, vegetables and tea. From a few systems including those from Latin America, leaching losses were < 1 kg ha -1 yr 1 N. When data from some

178 Bijay-Singh et al. / Journal of Contaminant Hydrology 20 (1995) 167-184
~o0 z ~so
~2o
z 5 3
z !
Lectc hing 200100 6650 30 20 10"/ systems / J ' ~ / /
~ _ ~___.~_~.~_o~ .................
' la 2a s ; 10'o 700 sob 10oo FARM INPUT (kg N/ha)
Fig. 6. Leaching of nitrogen vs. farm input of nitrogen. The full lines connect points with equal leaching percentages [100X(leaching)/(farm input)]. Leaching values below 1 kg ha -1 yr-1 N are grouped near abscissa and indicated with < 1. Closed symbols: nitrogen fixation > 35 kg ha -1 yr -j N; open symbols: nitrogen fixation < 35 kg ha -l yr a N or unknown. Adapted from Frissel (1978).
systems based on rough estimates are disregarded, it appears that leaching losses for farm inputs below 150 kg ha i yr 1 N are scattered around the 10% leaching curve, while for inputs above 150 kg ha ~ yr-~ N, they are scattered around the 20% leaching curve. Biological nitrogen fixation does not seem to influence the leaching percentage.
6. Nitrate content of groundwater vis-h-vis fertilizer use in developing countries
Some of the arable soils in European countries, Canada, eastern half of the U.S.A. and Russia remain wet or moist nearly all year or remain dry for periods amounting to less than 3 months per year. These soils possess potential for groundwater contamination through leaching of nitrates if good soil and fertilizer management practices are not followed. Soils in several developing countries located in Southeast Asia, Africa and Latin America remain moist part of the year and dry for more than 90 days. These may present problems, particularly in hot climates where high-intensity rains occur over short periods of time resulting in leaching of nitrates, if present. Also during the dry season, dead or dormant plants do not utilize nitrate-N which accumulates in the soil (Klingebiel, 1973).
In a large number of developing countries in West and Central Asia and North Africa, soils (mostly Aridisols) remain dry all the year and are seldom moist. These are not likely to be potential sources of high N losses via leaching except possibly if soils are irrigated and fertilizer management practices are poor. Agriculture in most of the cultivated areas in semi-arid and arid regions continues to be mainly rain fed. For example by the year 2000 in India, the percentage of net irrigated area to net sown area is likely to be only 41%. Whether precipitation falls in summer (as in Ethiopia, Mali, India, Pakistan, Nigeria) or winter (as in Turkey, Syria, Lebanon, Israel, Jordan, Saudi Arabia, Yemen, Oman, U.A.R., Qatar, Iraq, Kuwait and Iran in Asia; Morocco, Algeria, Tunisia, Libya, Sudan and Egypt in North Africa; central Chile in Latin America) there is only a 2-3-month period each year that rainfall exceeds evapotranspiration to permit

Bijay-Singh et al. /Journal of Contaminant Hydrology 20 (1995) 167-184
Table 6 Loss of nitrogen by leaching under crops in Senegal, Cameroun and Ivory Coast
179
Place Annual rainfall Crop Drainage N leaching loss (mm) (ram) (kg ha- 1 yr- i)
Bambey, 507 (1981) millet 9.5 0.3 Senegal groundnut 100.0 25.1
Maroua, 705 (1975) sorghum 2 traces Cameroun 683 (1977) cotton 83 2.1
Bouak6, 633 (1981) maize 210 6.1 Ivory Coast 532 (1982) cotton 260 7.1
Source: Senegal, Pi6ri (1982); Cameroun, Gigou (1982); Ivory Coast, Chabalier (1984).
some soil water recharge. Data in Table 6 support this contention. At Breda in northwest Syria (mean rainfall 278 mm, range 75-430 mm), 15 N-labelled fertilizer was applied at rates up to 120 kg ha -1 N to barley grown in a Typic Calciorthid (Harmsen et al., 1983). While apparent fertilizer-N recovery ranged from 20% to 50%, 15N balances showed that 80 -95% of the applied N was recovered in the soi l -crop system, about one half in the crop and half in the soil. Thus except in those regions where fertilizers are applied to irrigated crops, the possibility of nitrates originating from fertilizer to leach down to groundwater is small. In a plot drainage system in the Nile Delta, Egypt, high concentrations of nitrate-N were found in discharge of deep lateral or closely spaced drains during summer from irrigated cotton, maize and rice crops. High nitrate-N concentrations were observed in shallow drinking water wells (Abdel-Dayem and Abdel-Ghani, 1992). In a study based on seven representative soil units under different crop rotations in the Kopias area of Greece it was found that N was leached to deeper soil layers and to the unsaturated zone by both excess winter rainfall and spring irrigation of different crops (Theocharopoulos et al., 1993). The amount of N leached (18-81% of applied N under maize and 71 -94% of applied N under wheat) depended on amount of N fertilizer, and nitrate content of groundwater was often > 25 mg L -1.
Only 9% of the total area of Latin America is used for crop production while ~ 28% is under permanent pastures (FAO, 1991b). Technical and economic difficulties and lack of an adequate infrastructure prevent the use of fertilizers on an extensive scale. Climatic water balances and soil water conditions are usually unfavorable for agricultural purposes and leaching of nitrate from the small amount of N fertilizer applied to Oxisols and Ultisols of Latin America is minimal (Husz, 1978). Recently, Mugni and Kruse (1993) observed that in the northwest region of Buenos Aires province (Argentina), nitrate concentration in groundwater varied from 10 to 1300 mg L-1 N as compared to 5 to 200 mg L l N in the northeast region. High values in the northwest region were attributed to intensive cultivation and use of fertilizers; the northeast region lacked these activities.
In a paper prepared by F A D I N A P / A R S A P , ESCAP, Bangkok (Anonymous, 1990) on the ecological aspects of fertilizer use in developing countries of Asia and the Pacific, it was concluded that since almost 70% of the fertilizer is used to grow wetland rice,

180 Bijay-Singh et al. /Journal of Contaminant Hydrology 20 (1995) 167-184
losses through leaching of nitrate are minimal. In soils under wetland rice, puddling results in a drastic reduction of percolation rates and therefore leaching. Occasionally the potential of nitrate enrichment of groundwater may occur near peasant dwell ings where small backyard vegetable gardens are grown intensively with heavy rates of fertilizer or manure application.
In extensively irrigated regions of northwestern India, particularly in the state of Punjab, fertilizer application rates exceed 200 kg ha 1 yr 1 N. In some central districts, fertilizer levels exceed 300 kg ha-~ yr 1 N and possibly at several farms fertilizers are poorly managed. The soils in the region are predominantly light in texture (sandy loam and loamy sand as the dominant textural classes) and ~ 75% of the total annual rainfall of more than 600 mm is received during July to September. In an investigation carried out by Bijay-Singh and Sekhon (1976c) nitrate concentration of water, from shallow ( 4 - 1 0 m deep) open wells located in cultivated areas, decreased significantly with depth to water table and correlated posit ively with amount of fertil izer-N applied per ha per year on the farms located in the vicinity of wells. The amount of nitrate-N contained in the soil profile down to 2.10-m depth in June correlated significantly with the nitrate concentration of well water in September, confirming that nitrates tend to reach the water table during the rainy season (July-September) . During 1975-1988, average N fertilizer consumption in the Indian Punjab increased from 56 to 188 kg ha ~ yr-1 N (on net area sown basis). Monitoring of the nitrate-N concentrations in the shallow well waters in 1982 and 1988 (Bijay-Singh et al., 1991a) revealed that the increase in fertilizer consumption was associated with an increase of nitrate-N by almost 2 mg L (Table 7). Recently Bajwa et al. (1993) investigated 236 samples from 21- to 38-m-deep tube wells in different blocks of Punjab where fertil izer-N consumption ranged from 151 to 249 kg ha-~ yr ~ N. No significant correlation was observed between fertilizer consumption and nitrate content of well waters, possibly because samples were taken from deep wells. Nevertheless, percentage of groundwater samples containing > 5 mg L i NO3_ N from tube wells located in vegetable growing areas was 17 as compared to 3% and 6% from wells located in regions where, respectively, r i ce -whea t and po ta to - wheat rotations are followed.
Table 7 Nitrate concentration (mg L 1 NO3_N) in water samples from shallow wells (4-10 m deep) located in cultivated areas of Ludhiana district (central Punjab) during 1975-1988
1975 1982 1988
Jun. Sep. Apr. N o v . Nov./Dec.
Number of observations 46 33 26 26 28 Range 0.04-6.15 0.05-7.90 0.35-10.11 0.23-15.17 0.31-13.30 Geometric mean 0.42 0.42 1.48 2.13 2.29 Correlation (r) between fertilizer-N n.s. 0.51 a n.s. 0.51 a 0.59 ~
applied per ha per year and nitrate content of well water
Source: Bijay-Singh and Sekhon (1976c), Bijay-Singh et al. (1991a). n.s. = not significant. a Significant at 5% level of significance.

Bijay-Singh et aL /Journal of Contaminant Hydrology 20 (1995) 167-184 181
In Nigerian humid tropics, besides plenty of rainfall, irrigation is also becoming increasingly available to farmers growing maize using substantial quantities of nitrogen as calcium ammonium nitrate and urea. There exists the possibility of nitrate leaching beyond the rooting zone of these crops. In a continuously cropped lowland area of southwestern Nigeria, Adetunji (1993) estimated that ~ 30% of the N applied to maize was lost below the root zone. Over a 3-year period the applied N contributed to nitrate pollution of groundwater significantly in excess of the maximum level accepted for potable water. In the valley bottom nitrate-N content of groundwater ranged from 12.8 to 24.6 mg L -1. Measurements from over 40 wells in a shallow lateritic aquifer around the city of Sokoto, Nigeria, showed nitrate enrichment ranging between 20 and 100 mg L -1 (Uma, 1993). The values were less for forested and residential areas and more around agricultural farmlands. Evidence from earlier measurements suggested that the input of nitrate occurred in the last ten years and was related to land use practices.
7. Conclus ions
In a large number of developing countries located in arid and semi-arid climatic zones in Central and West Asia and North Africa, the small amount of N fertilizer applied to rain-fed Aridisols is generally not prone to leaching losses even if low fertilizer use efficiency is observed. Unless the soils in these climates are irrigated, nitrate is not a threat to groundwater. In Oxisols and Ultisols of Latin America, there is only a remote possibility of nitrate pollution of groundwater because climatic water balances do not favor leaching of nitrates from the small amount of N fertilizer applied to only 9% of the total area under crop production. In developing countries of Asia and the Pacific, where 70% of the fertilizers are used to grow wetland rice, low fertilizer use efficiency is caused by excessive N losses via volatilization and denitrification rather than leaching.
With increasingly high N application rates being practised in regions with assured irrigation facilities or where substantial rainfall is received during the cropping season, fertilizer consumption is increasing in developing countries. Although fertilizer use efficiency is generally high under irrigated agriculture, poor fertilizer, irrigation, or soil management can result in low fertilizer use efficiency and substantial losses of the applied N fertilizer to the groundwater. At a few locations increasing nitrate-N levels in groundwater, due to fertilizer use, have already been recorded. However, in many regions no such measurements have been made.
References
Abdel-Dayem, S. and Abdel-Ghani, M., 1992. Concentration of agricultural chemicals in drainage water. In: Drainage and Water Table Control. Proc. 6th Int. Drainage Symp., 13-15 Dec. 1992, Nashville, TN/St. Joseph, MI, pp. 353-360.
Adetunji, M.T., 1993. Nitrogen application and under groundwater contamination in some agricultural soils of south western Nigeria. Fert. Res., 37: 159-163.
Allison, F.E., 1966. The fate of nitrogen applied to soils. Adv. Agron., 18: 219-258. Anonymous, 1990. Ecological aspects of fertilizer use. Agrochem. News Brief, 13(2): 13-15.

182 Bijay-Singh et al. /Journal of Contaminant Hydrology 20 (1995) 167-184
Arora, R.P., Sachdev, M.S., Sud, Y.K., Luthra, V.K. and Subbiah, B.V., 1980. Fate of fertilizer nitrogen in a multiple cropping system. In: Soil Nitrogen as Fertilizer or Pollutant. IAEA (Int. At. Energy Agency), Vienna, pp. 3-22.
Arora, Y. and Juo, A.S.R., 1982. Leaching of fertilizer ions in a kaolinitic Ultisol in the high rainfall tropics: Leaching of nitrate in field plots under cropping and bare fallow. Soil Sci. Soc. Am. J., 46: 1212-1218.
Arora, Y., Nnadi, L.A. and Juo, A.S.R., 1987. Nitrogen efficiency of urea and calcium ammonium nitrate for maize (Zea mays) in humid and subhumid regions of Nigeria. J. Agric. Sci., 109: 47-51.
Bajwa, M.S., Bijay-Singh and Parminder-Singb, 1993. Nitrate pollution of groundwater under different systems of land management in the Punjab. 1st Agric. Sci. Congr., 1992 Proc., Natl. Acad. Agric. Sci., New Delhi, pp. 223-230.
Bijay-Singh and Sekhon, G.S., 1976a. Some measures of reducing leaching loss of nitrates beyond potential rooting zone, II. Balanced fertilization. Plant Soil, 44: 391-395.
Bijay-Singh and Sekhon, G.S., 1976b. Some measures of reducing leaching losses of nitrates beyond potential rooting zone, I. Proper co-ordination of nitrogen splitting with water management. Plant Soil, 44: 193-200.
Bijay-Singh and Sekhon, G.S., 1976c. Nitrate pollution of ground water from nitrogen fertilizers and animal wastes in the Punjab, India. Agric. Environ., 3: 57-67.
Bijay-Singh and Sekhon, G.S., 1977. Some measures of reducing leaching loss of nitrates beyond potential rooting zone, III. Proper crop rotation. Plant Soil, 47: 585-591.
Bijay-Singh, Biswas, C.R. and Sekhon, G.S., 1978. A rational approach for optimizing application rates of fertilizer nitrogen to reduce potential nitrate pollution of natural waters. Agric. Environ., 4: 57-64.
Bijay-Singh, Sadana, U.S. and Arora, B.R., 1991a. Nitrate pollution of ground water with increasing use of nitrogen fertilizers in Punjab, India. Indian J. Environ. Health, 33: 516-518.
Bijay-Singh, Yadvinder-Singh, Khind, C.S. and Meelu, O.P., 1991b. Leaching losses of urea-N applied to permeable soils under wetland rice. Fert. Res., 28: 179-184.
Blondel, D., 1971. Agron. Trop. 26: 687. [cited from Jones (1976)] Broadbent, F.E. and Rauschkolb, R.S., 1977. Nitrogen fertilization and water pollution. Calif. Agric., 31:
24-25. Cervellini, A., Ruschel, A.P., Victoria, R.L. and Reichardt, K., 1980. Fate of 15N applied as ammonium
sulphate to bean crop. In: Soil Nitrogen as Fertilizer or Pollutant. IAEA (Int. At. Energy Agency), Vienna, pp. 23-36.
Chabalier, P.F., 1984. Comparaison de deux m6thodes de mesure de la lixiviation en sol ferrallitique. Agron. Trop., 39(1): 22-30.
Charreau, C., 1972. Probl~mes pos6s par l'utilization agricole des sols tropicaux par des cultures annuelles. Agron. Trop., 27: 905-929.
De Geus, J.G., 1973. Fertilizer guide for tropics and subtropics. Cent. I~tude Azote, Ziirich. FAO (Food and Agricultural Organization), 1980. FAO Fertilizer Yearbook 1979. Statistical Series No. 30.
Volume 29. United Nations, Rome, Italy. FAO (Food and Agricultural Organization), 1985. FAO Fertilizer Yearbook 1984. United Nations, Rome, Stat.
Ser. No. 62, Vol. 34. FAO (Food and Agricultural Organization), 1987. FAO Fertilizer Yearbook 1986. United Nations, Rome, Stat.
Ser. No. 77, Voh 36. FAO (Food and Agricultural Organization), 1991a. FAO Fertilizer Yearbook 1990. United Nations, Rome,
Star. Ser. No. 100, Vol. 40. FAO (Food and Agricultural Organization), 1991b. FAO Production Yearbook 1990. United Nations, Rome,
Stat. Ser. No. 99, Vol. 44. Follett, R.F., 1992. Fertilizer related pollution issues for managing nutrients. In: M.S. Bajwa, N.S. Pasricha,
P.S. Sidhu, M.R. Chaudhary, D.K. Benbi and V. Beri (Editors), Proceedings of the International Symposium on Nutrient Management for Sustained Productivity, Vol. 1. Punjab Agric. Univ., Ludhiana, pp. 227-243.
Frissel, M.J., 1978. Cycling of Mineral Nutrients in Agricultural Ecosystems. Elsevier, Amsterdam, 356 pp. Gamboa, J., Parez, G. and Blasco, M., 1971. Un modelo para describir los procesos de retenclon y lixiviatlon
en los suelos. Turialba, 21: 312-316. Gigou, J., 1982. Dynamique de l'azote min6ral en sol nu ou cultiv6 de r6gion tropicale sbche du Nord
Cameroun. Tb~se Doc., USTL (Univ. Sci. Tech. Languedoc), Montpellier, 171 pp.

Bijay-Singh et al. /Journal of Contaminant Hydrology 20 (1995) 167-184 183
Grove, T., 1979. Nitrogen fertility in Oxisols and Ultisols of the humid tropics. NY State Coll. Agric. Life Sci., Cornell Univ., Ithaca, NY,Cornell Int. Agric. Bull. No. 36, 28 pp.
Haque, I., 1979. Timing the application of N to maize in Sierra Leone. Exp. Agric., 15: 247-251. Harmsen, K., Shepherd, K.D. and Allan, A.Y., 1983. Crop response to nitrogen and phosphorus in rainfed
agriculture. In: Nutrient Balances and the Need for Fertilizers in Semi-arid and Arid Regions. Proc. 17th Colloq. Int. Potash Inst., Rabat/Marrakech, Int. Potash Inst., Basel, pp. 223-248.
Husz, G.St., 1978. Agroecosystems in South America. In: M.J. Frissel (Editor), Cycling of Mineral Nutrients in Agricultural Ecosystems. Elsevier, Amsterdam, pp. 244-276.
IRCT (Institut de Recherches du Cotonet des Textiles Exotiques), 1980. Station Centrale de Bebedja (Tchad) - - Rapport 1978-79 - - - t~tude et synth~se. Doc. IRCT (Inst. Rech. Coton Tex. Exot.), Paris (unpublished).
Isherwood, K.F. and Soh, K.G., 1992. The agricultural situation and fertilizer demand. Pap. presented at IFA (Int. Fert. Ind. Assoc.) Annu. Conf., Seoul, May 1992. IFA, Paris, Doc. No. A / 9 2 / 7 1 .
Jones, M.J., 1973. Time of application of nitrogen fertilizer to maize at Samaru, Nigeria. Exp. Agric., 9: 113-120.
Jones, M.J., 1975. Leaching of nitrate under maize at Samaru, Nigeria. Trop. Agric. (Trinidad), 52: 1-10. Jones, M.J., 1976. Water movement and nitrate leaching in a Nigerian savanna soil. Exp. Agric., 12: 69-79. Kang, B.T., Donlesh, F. and Moody, K., 1977. Soil fertility management investigations on benchmark soils in
the humid low altitude tropics of West Africa: Investigations on Egbeda soil series. Agron. J., 69: 651-656.
Katyal J.C., Bijay-Singh, Vlek, P.L.G. and Craswell, E.T., 1985. Fate and efficiency of nitrogen fertilizers applied to wetland rice, II. Punjab, India. Fert. Res., 6:279-290.
Keeney, D.R., 1989. Sources of nitrate to groundwater. In: R.F. Follett (Editor), Nitrogen Management and Groundwater Pollution. Elsevier, Amsterdam, pp. 23-34.
Klingebiel, A.A., 1973. Nutrient enrichment of natural waters. Qual. Plant Meter. Veg., 22: 223-248. Leutenegger, F., 1956. Changes in ammonia and nitrate contents of a tropical red loam as influenced by
manuring and mulching during period of one year. E. Afr. Agric. J., 22: 81-87. Mughobo, S.K., Christianson, C.B., Stumpe, J.M. and Vlek, P.L.G., 1990. Nitrogen efficiency at three sites in
Nigeria as affected by N source and management. Trop. Agric. (Trinidad), 67: 127-132. Mugni, J. and Kruse, E., 1993. Nitrate evolution in groundwater in Buenos Aires province (Argentina). In: B.
Nath, L. Candela, L. Hens and J.P. Robinson (Editors), Proceedings of the International Conference on Environmental Pollution, Vol. 1, Sitges, Barcelona, Sept. 1993. Eur. Cent. Pollut. Res., London, pp. 225-231.
Osiname, O., Van Gijn, H. and Vlek, P.L.G., 1983. Effect of nitrification inhibitors on the fate and efficiency of nitrogenous fertilizers under simulated humid tropical conditions. Trop. Agric. (Trinidad), 60: 211-217.
Oyedokun, J.B., 1976. Effect of time of nitrogen application on upland rice (Oryza sativa L.) grown as rainfed rice. Niger. Agric. J., 13: 11-23.
Peterson, G.A. and Frye, W.W., 1989. Fertilizer nitrogen management. In: R.F. Follett (Editor), Nitrogen Management and Groundwater Pollution. Elsevier, Amsterdam, pp. 183-219.
Pirri, C., 1982. Estimation du bilan des pertes moyennes en eau et en ~lrments minrraux dans une succession culturale mil-arachide. C.R. Mission AIEA (Agent Int. l~nergie At.), Srnrgal, 26 pp.
Pirri, C., 1983. Nutrient balances in rainfed farming systems in arid and semiarid regions. In: Nutrient balances and the need for fertilizers in semi-arid and arid regions. Proc. 17th Colloq. Int. Potash Inst., Rabat/Marrakech, Int. Potash Inst., Basel, pp. 181-209.
Sachdev, M.S., Oza, A.M. and Subbiah, B.V., 1977. Possibilities of improving the efficiency of nitrogenous fertilizers. In: Soil Organic Matter Studies. IAEA (Int. At. Energy Agency), Vienna, pp. 371-382.
Sanchez, P.A., 1972. Nitrogen fertilization. In: P.A. Sanchez (Editor), A Review of Soils Research in Tropical Latin America. N.C. State Univ., Tech. Bull. No. 219, pp. 90-125.
Sarr, P.L., 1981. Analyse des effects induits par l'intensification des cultures sur quelques caractrristiques physico-chimiques d'un sol ferrugineux tropical du Srnrgal. Th~se Doc., USTL (Univ. Sci. Tech. Languedoc), Montpellier, 100 pp.
Schenkel, S.G. and Baherle, V.P., 1983. Fertility changes in Chilean soil profiles, 3. Leaching of five levels of sodium nitrate in a Vilcun soil. Agric. Techn., 43: 105-119.
Sekhon, G.S. and Puri, D.N., 1986. The input-output balance of plant nutrients in some intensive multiple cropping systems in India. Potash Rev., Subject 6, Suite 52.

184 Bijay-Singh et al. /Journal of Contaminant Hydrology 20 (1995) 167-184
Tandon, H.L.S. and Partap Narayan, 1990. Fertilizers in Indian agriculture - - Past, present and future (1950-2000). Fert. Dev. Consult. Org., New Delhi, 160 pp.
Theocharopoulos, S.P., Karayianni, M., Gatzogiani, P., Abentaki, A. and Aggelides, S., 1993. Nitrogen leaching from soils in Kopias area of Greece. Soil Use Manage., 9: 76-84.
Uma, K.O., 1993. Nitrates in shallow (regolith) aquifers around Sokoto Town, Nigeria. Environ. Geol., 21: 70-76.
Vlek, P.L.G. and Byrnes, B.H., 1986. The efficiency and loss of nitrogen in lowland rice. In: S.K. DeDatta and W.H. Patrick, Jr. (Editors), Nitrogen Economy of Flooded Rice Soils. Martinus Nijhoff, Dordrecht, pp. 131-148.
Welch, L.F., 1972. More nutrients are added to soil than are hauled away in crops. Ill. Res., 14(1): 3-4. Wetselaar, R. and Ganry, F., 1982. Nitrogen balance in tropical agrosystems. In: Y. Dommergues and H.G.
Dien (Editors), Microbiology of Tropical Soils and Plant Productivity - - Implications in Agricultural Management. Martinus Nijhoff, The Hague.
Wild, A., 1972. Nitrate leaching under bare fallow at a site in northern Nigeria. J. Soil Sci., 23: 315-324. Williams, P.H.T., 1992. The role of fertilizers in environmental pollution. In: M.S. Bajwa, N.S. Pasricha, P.S.
Sidhu, M.R. Chaudhary, D.K. Benbi and V. Beri (Editors), Proceedings of the International Symposium on Nutrient Management for Sustained Productivity, Vol. I. Punjab Agric. Univ., Ludhiana, pp. 195-215.