
Ferroelectric polymer-ceramic composite thick films for ...
12
Ferroelectric polymer-ceramic composite thick films for energy storage applications Paritosh Singh, Hitesh Borkar, B. P. Singh, V. N. Singh, and Ashok Kumar Citation: AIP Advances 4, 087117 (2014); doi: 10.1063/1.4892961 View online: http://dx.doi.org/10.1063/1.4892961 View Table of Contents: http://scitation.aip.org/content/aip/journal/adva/4/8?ver=pdfcov Published by the AIP Publishing Articles you may be interested in Polymer-ceramic composite filler selection using mixing rules J. Appl. Phys. 117, 064103 (2015); 10.1063/1.4908012 Enhanced dielectric properties of BaTiO3/poly(vinylidene fluoride) nanocomposites for energy storage applications J. Appl. Phys. 113, 034105 (2013); 10.1063/1.4776740 Reverse boundary layer capacitor model in glass/ceramic composites for energy storage applications J. Appl. Phys. 113, 024103 (2013); 10.1063/1.4775493 Epoxy-based nanocomposites for electrical energy storage. II: Nanocomposites with nanofillers of reactive montmorillonite covalently-bonded with barium titanate J. Appl. Phys. 108, 074117 (2010); 10.1063/1.3487471 Thick film polymer-ceramic composites for pyroelectric applications J. Appl. Phys. 101, 054113 (2007); 10.1063/1.2653978 All article content, except where otherwise noted, is licensed under a Creative Commons Attribution 3.0 Unported license. See: http://creativecommons.org/licenses/by/3.0/ Downloaded to IP: 14.139.60.97 On: Fri, 24 Apr 2015 08:39:56
Transcript of Ferroelectric polymer-ceramic composite thick films for ...

Ferroelectric polymer-ceramic composite thick films for energy storage applicationsParitosh Singh, Hitesh Borkar, B. P. Singh, V. N. Singh, and Ashok Kumar Citation: AIP Advances 4, 087117 (2014); doi: 10.1063/1.4892961 View online: http://dx.doi.org/10.1063/1.4892961 View Table of Contents: http://scitation.aip.org/content/aip/journal/adva/4/8?ver=pdfcov Published by the AIP Publishing Articles you may be interested in Polymer-ceramic composite filler selection using mixing rules J. Appl. Phys. 117, 064103 (2015); 10.1063/1.4908012 Enhanced dielectric properties of BaTiO3/poly(vinylidene fluoride) nanocomposites for energy storageapplications J. Appl. Phys. 113, 034105 (2013); 10.1063/1.4776740 Reverse boundary layer capacitor model in glass/ceramic composites for energy storage applications J. Appl. Phys. 113, 024103 (2013); 10.1063/1.4775493 Epoxy-based nanocomposites for electrical energy storage. II: Nanocomposites with nanofillers of reactivemontmorillonite covalently-bonded with barium titanate J. Appl. Phys. 108, 074117 (2010); 10.1063/1.3487471 Thick film polymer-ceramic composites for pyroelectric applications J. Appl. Phys. 101, 054113 (2007); 10.1063/1.2653978
All article content, except where otherwise noted, is licensed under a Creative Commons Attribution 3.0 Unported license. See: http://creativecommons.org/licenses/by/3.0/
Downloaded to IP: 14.139.60.97 On: Fri, 24 Apr 2015 08:39:56
AIP ADVANCES 4, 087117 (2014)
Ferroelectric polymer-ceramic composite thick filmsfor energy storage applications
Paritosh Singh, Hitesh Borkar, B. P. Singh, V. N. Singh, and Ashok Kumara
CSIR-National Physical Laboratory, Dr. K. S. Krishnan Marg, New Delhi 110012, India
(Received 11 June 2014; accepted 31 July 2014; published online 11 August 2014)
We have successfully fabricated large area free standing polyvinylidene fluoride-Pb(Zr0.52Ti0.48)O3 (PVDF-PZT) ferroelectric polymer-ceramic composite (wt% 80–20, respectively) thick films with an average diameter (d) ∼0.1 meter and thickness (t)∼50 μm. Inclusion of PZT in PVDF matrix significantly enhanced dielectric constant(from 10 to 25 at 5 kHz) and energy storage capacity (from 11 to 14 J/cm3, usingpolarization loops), respectively, and almost similar leakage current and mechanicalstrength. Microstructural analysis revealed the presence of α and β crystalline phasesand homogeneous distribution of PZT crystals in PVDF matrix. It was also found thatapart from the microcrystals, well defined naturally developed PZT nanocrystals wereembedded in PVDF matrix. The observed energy density indicates immense potentialin PVDF-PZT composites for possible applications as green energy and power densityelectronic elements. C© 2014 Author(s). All article content, except where otherwisenoted, is licensed under a Creative Commons Attribution 3.0 Unported License.[http://dx.doi.org/10.1063/1.4892961]
I. INTRODUCTION
There have been needs of inherent self-powered energy storage devices which can replacebatteries to power the microelectronic devices like wireless sensors, mobile communication systems,electric vehicles, health monitoring systems and pulse power applications. Systems which can harnessenergy from natural sources have been of great interest among the researchers from past few decades.Two criteria are very important for any energy storage devices, the first one is how much energy can itstore per unit of its volume or mass (energy density) and secondly the power density available to load.The power density refers how quick a system can discharge its stored energy to the external load.Our concern is to develop a system which shows higher energy storage ability and simultaneouslyhigh discharge capacity (power density). Although a system having superior energy density andpower density is not possible at the same time so there is a compromise. In particular, conventionalbatteries have very high energy density, but very slow discharge capacity, on the other hand thedielectric capacitors have high discharge capacity, but very low energy density.1
The conversion from mechanical and vibrational energy from natural sources like wind, wavesor human motions into electrical energy have been of a great interest in scientific community.2–6 Oneway to harness electrical energy from sources of mechanical vibrations is to utilize the piezoelec-tric properties of ferroelectric materials. This work investigates the ferroelectric polymer-ceramiccomposite for its property to store high energy. The monomer unit of this polymer is CH2-CF2 issemi crystalline in nature, half crystalline and half amorphous. The crystalline region consists of atleast four crystal polymorphs named α, β, γ and δ.7, 8 Among four polymorphs, α phase is moststable nonpolar phase having conformation structure TGTG (T-trans, G-gauche).9 The β phase ofthe PVDF polymer has planer all trans (TTTT) conformation (Fig. 1).9 In β phase, the H and F atomsare attached in the chain in such a way the dipole moments associated with two C-H and two C-Fbonds add up and align in the direction perpendicular to the carbon backbone to give higher dipole
aCorresponding Author: Dr. Ashok Kumar ([email protected]).
2158-3226/2014/4(8)/087117/11 C© Author(s) 20144, 087117-1
All article content, except where otherwise noted, is licensed under a Creative Commons Attribution 3.0 Unported license. See: http://creativecommons.org/licenses/by/3.0/
Downloaded to IP: 14.139.60.97 On: Fri, 24 Apr 2015 08:39:56

087117-2 Singh et al. AIP Advances 4, 087117 (2014)
FIG. 1. Molecular structure of α and β PVDF.
moments per unit cell.10 It is the β phase which attracts the researchers for its high piezoelectricand ferroelectric properties. So lots of research is going on for yielding high β-phase content in thematerial. Different phases exist in PVDF depending on various processing parameters like type ofsolvent in solution casting, solvent evaporation temperatures, fillers in the polymer matrix, stretchingload and annealing to make stable β-phase, controlled annealing or electrical poling of the preparedPVDF film.11–13
The need of high energy density storage system has led to the development of ferroelectricpolymer-ceramic composite system. Polymer-ceramic system combines the property of both ferro-electric polymer and ceramic fillers. PVDF polymer has light weight, larger chain flexibility, goodmechanical properties, chemical and electrical resistance, availability and good process ability. Dueto good chain flexibility, PVDF based energy harvester systems can sustain larger vibration. Inclu-sion of high dielectric constant ceramic fillers in the polymer matrix exhibits enhanced dielectricbehavior and piezoelectric response of the polymer-ceramic composite material in comparison toferroelectric polymer.14, 15 Polymer-ceramic composite system combines high dielectric constant (ε)and stiffness of ceramics and flexibility, elasticity and high dielectric breakdown of ferroelectricpolymers.
The existing technology of polymer capacitor has potential to store an energy density <3 J/cm3,16
however the future pulsed power electronic industries required a capacitor with minimum energydensity equivalent to the existing electrochemical capacitor ∼18–29 J/cm3 and very fast dischargecapacity.17 Significant progress has been made to achieve the above mentioned target; however,reliable data for large area scalable at industrial level are missing. Tomer et al. have shown∼19 J/cm3 energy density for PVDF-HFP comonomers and kaolinite-clay composites.18 PenghaoHu et al. illustrate low energy density (∼3–4 J/cm3) for (Ba,Sr)TiO3/poly(vinylidene-fluoride-trifluoroethylene), flexible nanocomposites.19 Literature survey indicates that numerous investiga-tions on ceramic-polymer composites on PVDF and PVDF-co-polymer matrix has been carriedout, such as BaTiO3,20 Pb(Mg1/3Nb2/3)O3–PbTiO3,21 Pb(ZrxTi1-x)O3 (PZT),22 and etc., however,reproducibility, large scale production, energy storage capability, and fast energy release properties,still need further rigorous systematic study.
In this study we have used micron size lead-zirconate-titante particles Pb(Zr0.52Ti0.48)O3 (PZT)(ε ∼ 400, density ∼ 7.5 g/cm3) as filler in PVDF matrix (ε ∼ 8–10, density ∼ 1.78 g/cm3). Theproblem in getting higher dielectric constant with inclusion of PZT filler into polymer matrix alsoincreases dielectric loss and weak mechanical properties in composite system as we increase thecontent of PZT in polymer. In order to compromise between dielectric constant and tangent loss,
All article content, except where otherwise noted, is licensed under a Creative Commons Attribution 3.0 Unported license. See: http://creativecommons.org/licenses/by/3.0/
Downloaded to IP: 14.139.60.97 On: Fri, 24 Apr 2015 08:39:56

087117-3 Singh et al. AIP Advances 4, 087117 (2014)
PVDF-PZT composite of wt%80–20, respectively, was fabricated and investigated for various func-tional properties.
II. METHODS
PVDF powder was procured from Alfa Aesar India Pvt. Ltd and PZT powder was synthesized inthe laboratory by conventional solid state reaction technique. The PVDF and PVDF-PZT compositethick films have been prepared by solution cast method. For PVDF thick film, PVDF powder wasdissolved in N, N-Dimethylformamide (DMF) solvent by magnetic stirring for 6 hours at 50 ◦C. Thedissolved solution then poured into uncovered petri dish and this assembly was kept inside microwaveoven at 100◦C for 12 hours for crystallization. In this time duration the solvent completely evaporatedand a free standing PVDF film of thickness 50 μm obtained. For PVDF-PZT nano-composite film,we have taken PVDF powder and PZT nanoparticles in the ratio of wt% 80–20 respectively. Themixture was dispersed in DMF solvent by ultra-sonication for 50 minutes at 40 ◦C. The PVDF-PZTsolution then magnetically stirred for 6 hours at 50 ◦C. Now the obtained solution was sonicated againfor 50 minutes and the rest process is same as of the casting of PVDF film. We obtained PVDF-PZTfree standing film of thickness 50μm. X-Ray diffraction measurement of PVDF and PVDF-PZTcomposite thick films were carried out by using CuKα radiation (λ = 1.5460 Å) over a wide range ofθ–2θ Bragg angles. Raman spectra were recorded on Renishaw in Via Reflex Raman spectrometer,UK, with an excitation source of 785 nm. Scanning electron microscopy (SEM) technique wasused to understand the matrix using Zeiss EVO MA-10, Scanning Electron Microscope. To checkmechanical properties, tensile testing has been carried out in INSTRON tensile testing machinewith strain rate of 0.5 mm/minute. Temperature dependent dielectric constant and tangent loss werecarried out by using LCR meter (4200-SCS Analyzer) at oscillating amplitude of 0.5 V over widerange of frequencies (1 kHz-1 MHz). Polarization-electric field (P-E) hysteresis loops were measuredon Radiant Ferroelectric Tester for different voltage cycles at 10 Hz.
III. RESULTS AND DISCUSSION
A. X-Ray Diffraction Analysis
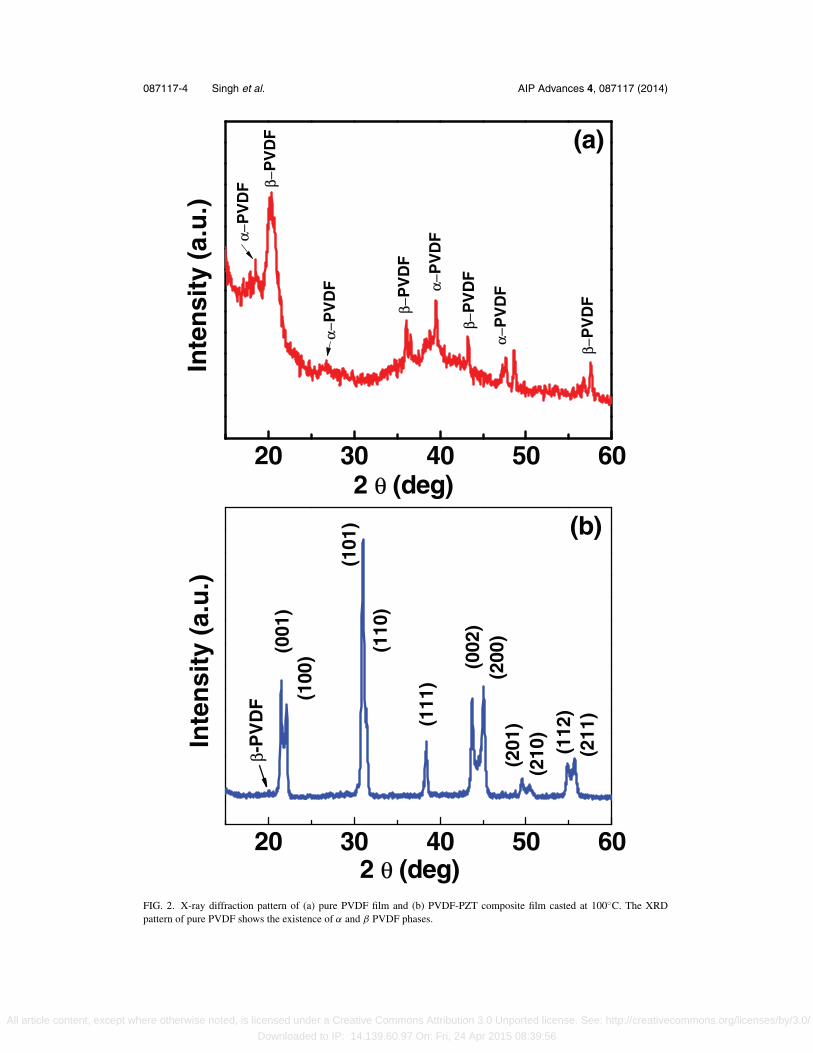
X-ray diffraction (XRD) studies have been carried out on both PVDF and PVDF-PZT compositefree standing thick films casted at temperature 100◦C, as shown in the Fig. 2(a) and 2(b). It isevident from Figure 2(a) that the peaks at 2θ corresponding to 18.5o, and 26.5o present in XRDpattern indicates the presence of α-phase.23 Presence of high intense peak at 20.2o confirms thepresence of β-phase in PVDF film.24 Other XRD peaks at 36.1o, 43.2o and 57.4o are indexed tothe corresponding β-phase of PVDF film and α-phase corresponds to 39.5o and 48.6o.Thus the neatPVDF film developed by solvent casting using solvent N,N-Dimethyl formamide at temperature100◦C shows the presence of both α and β phase which agree with the published literature byresearchers.25, 26 XRD pattern thus indicates the semi-crystalline nature of PVDF polymer film. TheXRD spectra of PVDF-PZT composite system with PZT chemical compositions Pb(Zr0.52Ti0.48)O3
have been shown in Fig. 2(b), indexing and peak positions matched with the JCPDS file # 33–0784.The obtained XRD peaks of PZT in the composite matched with the PZT peaks reported near themorphotropic phase boundary (MPB) and suggests the tetragonal crystal structure with the latticeparameters, a = b = 0.4036 nm, c = 0.4146 nm, corresponding phase matched well with the reporteddata (JCPDS: 33–0784). It is observed that there is no shift in PZT peaks position due to the presenceof PVDF matrix.27, 28 It can be clearly seen in the XRD spectra of the composite film that most XRDpeaks of PVDF is dominated by PZT peaks. For further confirmation of α and β phases present inthe PVDF and composite, Raman analysis have been carried out.
B. Raman Analysis
Figures 3(a)–3(d) represents the Raman spectra of PVDF and PVDF-PZT nano-composite thickfilms from 100 cm−1 -1100 cm−1. Three major Raman modes at 798, 812 and 839 cm−1 of PVDF
All article content, except where otherwise noted, is licensed under a Creative Commons Attribution 3.0 Unported license. See: http://creativecommons.org/licenses/by/3.0/
Downloaded to IP: 14.139.60.97 On: Fri, 24 Apr 2015 08:39:56
087117-4 Singh et al. AIP Advances 4, 087117 (2014)
20 30 40 50 60
(111
)
(110
)
(101
)
(211
)
(210
)(1
12)
(201
)(2
00)
(002
)
(100
)
(b)
(001
)β-
PV
DF
Inte
nsi
ty (
a.u
.)
2 θ (deg)
20 30 40 50 60
α−P
VD
F
α−P
VD
Fα−P
VD
F
α−P
VD
F
β−P
VD
F
β−P
VD
F
β−P
VD
F
β−P
VD
F (a)
Inte
nsi
ty (
a.u
.)
2 θ (deg)
FIG. 2. X-ray diffraction pattern of (a) pure PVDF film and (b) PVDF-PZT composite film casted at 100◦C. The XRDpattern of pure PVDF shows the existence of α and β PVDF phases.
All article content, except where otherwise noted, is licensed under a Creative Commons Attribution 3.0 Unported license. See: http://creativecommons.org/licenses/by/3.0/
Downloaded to IP: 14.139.60.97 On: Fri, 24 Apr 2015 08:39:56

087117-5 Singh et al. AIP Advances 4, 087117 (2014)
200 400 600 800 1000
Inte
nsi
ty (
a.u
.)
Raman Shift (cm-1)
Back surface
780 800 820 840 860
β-P
VD
F
γ-P
VD
F
α-P
VD
F
Inte
nsi
ty (
a.u
.)
Raman Shift (cm-1)
(d)(c)
(b)
800 850 900
α, β
, γ -
PV
DF
β-P
VD
F
γ-P
VD
F
α-P
VD
F
Inte
nsi
ty (
a.u
.)
Raman Shift (cm-1)200 400 600 800 1000
PZ
T
PZ
T
PZ
T
PZ
T
α-P
VD
F
Inte
nsi
ty (
a.u
)
Raman Shift (cm-1)
PVDF PVDF_PZT
(a)
FIG. 3. Raman Spectra of PVDF and PVDF-PZT composite films. (a) Raman spectra in frequency range 100 cm−1 to1100 cm−1 for both films, (b) Raman spectra in frequency range 780 cm−1 to 900 cm−1, revealing the α, β and γ phases ofPVDF, (c) Raman spectra of back surface of PVDF-PZT composite system, mainly showing PZT bands in frequency range100 cm−1 to 1100 cm−1 and (d) three major Raman modes at 798, 812 and 839 cm−1 of PVDF film have been analyzed bydamped harmonic oscillator model (DHO).
and PVDF-PZT films have been analyzed by damped harmonic oscillator model (DHO).29 Thesephonon modes were fitted with the spectral response function.
S(ν) =∑
i
χ0i�iν20iν
(ν2 − ν20i ) + �2
i ν2
F(ν, T ) (1)
where F(ν,T) = [n(ν) + 1] (Stokes scattering) and n(ν) = [exp(hν/κT) − 1]−1. The parametersin Eq. (1) amplitude χ0 (in arbitrary units), the mode frequency ν0, the damping constant �, andthe temperature T, describe each phonon modes as a damped harmonic oscillator. Intense PVDFRaman bands in the range of 775–860 cm−1 are analyzed with DHO model as shown in theFig. 3(d). The low intensity peak at 798 cm−1 represents the presence of α phase of PVDF.30 Peakat 839 cm−1 represents β-phase, in addition of PZT filler in PVDF matrix enhanced the β-phaseas can be seen in Fig. 3(b) where the intensity of β-phase mode is relatively higher compare toα-phase.31, 32 Significant amount of γ phase also coexist in both the systems. The Raman band at812 cm−1 corresponds to γ phase of PVDF film matched with the reported results.30, 33 Peaks at484 and 512 cm−1 can be attributed to α and β phases respectively.34The Raman peaks at 610 cm−1
and 411 cm−1 correspond to α phase and 284 cm−1 correspond to β phase of PVDF.35 The broadRaman peak at 881 cm−1 represents the presence of all three phases (α, β and γ ).36 The diffusedRaman bands appearing from 1074 to 1095 cm−1 may be assigned to combination of both α and
All article content, except where otherwise noted, is licensed under a Creative Commons Attribution 3.0 Unported license. See: http://creativecommons.org/licenses/by/3.0/
Downloaded to IP: 14.139.60.97 On: Fri, 24 Apr 2015 08:39:56
087117-6 Singh et al. AIP Advances 4, 087117 (2014)
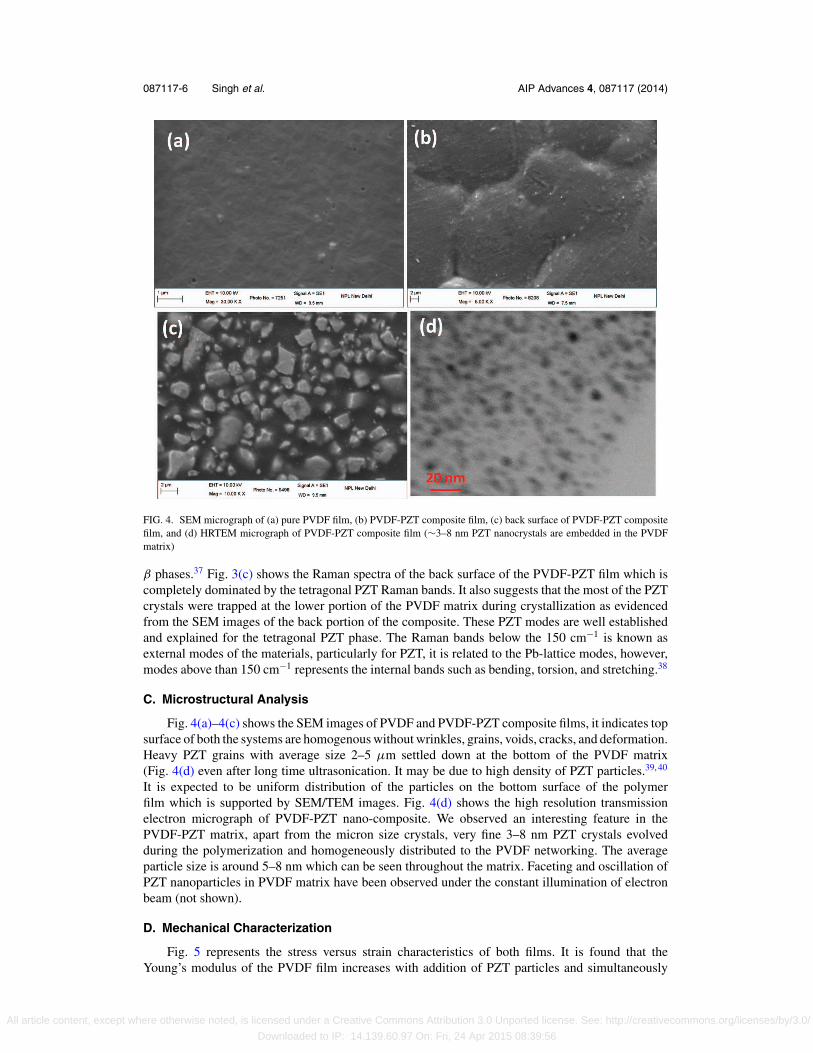
FIG. 4. SEM micrograph of (a) pure PVDF film, (b) PVDF-PZT composite film, (c) back surface of PVDF-PZT compositefilm, and (d) HRTEM micrograph of PVDF-PZT composite film (∼3–8 nm PZT nanocrystals are embedded in the PVDFmatrix)
β phases.37 Fig. 3(c) shows the Raman spectra of the back surface of the PVDF-PZT film which iscompletely dominated by the tetragonal PZT Raman bands. It also suggests that the most of the PZTcrystals were trapped at the lower portion of the PVDF matrix during crystallization as evidencedfrom the SEM images of the back portion of the composite. These PZT modes are well establishedand explained for the tetragonal PZT phase. The Raman bands below the 150 cm−1 is known asexternal modes of the materials, particularly for PZT, it is related to the Pb-lattice modes, however,modes above than 150 cm−1 represents the internal bands such as bending, torsion, and stretching.38
C. Microstructural Analysis
Fig. 4(a)–4(c) shows the SEM images of PVDF and PVDF-PZT composite films, it indicates topsurface of both the systems are homogenous without wrinkles, grains, voids, cracks, and deformation.Heavy PZT grains with average size 2–5 μm settled down at the bottom of the PVDF matrix(Fig. 4(d) even after long time ultrasonication. It may be due to high density of PZT particles.39, 40
It is expected to be uniform distribution of the particles on the bottom surface of the polymerfilm which is supported by SEM/TEM images. Fig. 4(d) shows the high resolution transmissionelectron micrograph of PVDF-PZT nano-composite. We observed an interesting feature in thePVDF-PZT matrix, apart from the micron size crystals, very fine 3–8 nm PZT crystals evolvedduring the polymerization and homogeneously distributed to the PVDF networking. The averageparticle size is around 5–8 nm which can be seen throughout the matrix. Faceting and oscillation ofPZT nanoparticles in PVDF matrix have been observed under the constant illumination of electronbeam (not shown).
D. Mechanical Characterization
Fig. 5 represents the stress versus strain characteristics of both films. It is found that theYoung’s modulus of the PVDF film increases with addition of PZT particles and simultaneously
All article content, except where otherwise noted, is licensed under a Creative Commons Attribution 3.0 Unported license. See: http://creativecommons.org/licenses/by/3.0/
Downloaded to IP: 14.139.60.97 On: Fri, 24 Apr 2015 08:39:56

087117-7 Singh et al. AIP Advances 4, 087117 (2014)
0 2 4 6 8
0
10
20
30
40
50St
ress
(MPa
)
Strain (% mm/mm)
PVDF PVDF-PZT
FIG. 5. Stress-strain behavior of PVDF and PVDF-PZT composite system.
tensile strength of the composite film decreases in comparison to neat PVDF film.41 With 20 wt%PZT in PVDF the Young’s modulus and tensile strength was found to be 2.3 GPa and 44.57 MParespectively whereas it was 1.8 GPa and 47.29 in case of neat PVDF film. Increase in Young’smodulus leads to enhanced piezoelectric properties of the composite film.39 The flexibility ofcomposite film was found to be reduced from 7.8% to 7.3% as it sustains less elongation just beforefailure.
E. Dielectric Analysis
Fig. 6 represents the dielectric constant and tangent loss (inset) of PVDF and PVDF-PZTcomposite film over wide range of frequencies. PVDF is a polar polymer which consists of α
and β phases which is revealed by XRD analysis and Raman spectra. This polar property ofpolymer plays a significant role in determining the dielectric properties. In β phase the H and Fatoms are aligned in such a manner to give a net dipole moment on the other hand α phase ismore stable but nonpolar so this phase does not contribute to polarization.24 Electronic and atomicpolarization are instantaneous which are better able to follow the phase of alternating field incomparison to orientational polarization which takes some time to align the dipoles in the directionof field. So the orientational polarization is the main factor which restricts the dielectric constantat higher frequencies.42 In general, the dielectric constant of polymer also increases with increasein temperature, in this circumstance, the polymer chain breaks due to thermal agitation. The polargroups will now be freer to align themselves in the direction of changing field. The dielectric lossarises from the inability of dipoles to follow the oscillating electric field. The relaxation (the timeto come back of dipoles in their original random orientational state) of dipoles does not occurinstantaneously. At higher frequencies the dipoles are not able to keep phase with oscillating fieldso losses are more at higher frequencies.
All article content, except where otherwise noted, is licensed under a Creative Commons Attribution 3.0 Unported license. See: http://creativecommons.org/licenses/by/3.0/
Downloaded to IP: 14.139.60.97 On: Fri, 24 Apr 2015 08:39:56

087117-8 Singh et al. AIP Advances 4, 087117 (2014)
103 104 105 106 107
10
20
30
40
103 104 105 106 107
0.01
0.1
tan δ
Frequency (Hz)
PVDF PVDF+PZT
Die
lect
ric C
onst
ant( ε
)
Frequency (Hz)FIG. 6. Frequency dependence dielectric constant and tangent loss (inset) of pure PVDF film and PVDF-PZT compositefilm at room temperature, from 1 kHz to 10 MHz.
PVDF-PZT composite showed almost 2.5 times increase in dielectric constant with almostsimilar dielectric loss compared to neat PVDF thick film.43, 44 The increase in dielectric con-stant of composite is attributed to high dielectric constant of PZT nanoparticles and the in-terface between particles and polymer matrix. Yamada model predicts the equivalent dielectricconstant of two phase polymer-ceramic composite with average ellipsoidal dimension of solid
particles.49ε = ε1
{1 + nq(ε2−ε1)
nε1+(ε2−ε1)(1−q)
}where n = 4π/m, q = Nv/V is the volume fraction of solid
particles, ε1 is the dielectric constant of continuum matrix and ε2 is the dielectric constant of el-lipsoidal solid particles. The experimental value of the dielectric constant of PVDF-PZT (∼25)matched with the theoretical calculation using the Yamada model with n = 10.6. The average spher-ical/ellipsoidal particles impede the thermal motion of dipoles at higher temperature due to whichincrease in dielectric constant was observed at elevated temperatures.45, 46 It is noticeable that athigher frequencies loss decreases because the dipoles which are not able to align with field at lowertemperature now able to keep in phase with oscillating field.
F. Polarization-Electric Field loops
Hysteresis loop of PVDF and PVDF-PZT nano-composite thick film taken at 10 Hz is pre-sented in Fig. 7. The top and bottom surfaces of both films were silver coated for electrode purpose.The PVDF-PZT nano-composite thick film showed increased saturation polarization in comparisonto neat PVDF thick film. In this study the maximum polarization 21.6 μC/cm2 at electric field1.8 MV/cm were reported in case of composite whereas this value is around 17 μC/cm2 at elec-tric field 1.8 MV/cm in neat PVDF film.47, 48The breakdown field in both cases was comparable,which reached up to 1.8 MV/cm without breakdown (compliance limit ∼1 mA, and the instrument
All article content, except where otherwise noted, is licensed under a Creative Commons Attribution 3.0 Unported license. See: http://creativecommons.org/licenses/by/3.0/
Downloaded to IP: 14.139.60.97 On: Fri, 24 Apr 2015 08:39:56
087117-9 Singh et al. AIP Advances 4, 087117 (2014)
-2 -1 0 1 2
-20
-10
0
10
20
-6 -4 -2 0 2 4 61E-10
1E-9
1E-8
1E-7
1E-6
Cur
rent
(A)
Voltage (kV)
PVDF PVDF-PZT
5000V-10Hz cycle
0.0 0.4 0.8 1.2 1.60
5
10
15
20
Pola
rizat
ion
( μC
/cm
2 )
Electric Field (MV/cm)
APo
lariz
atio
n ( μ
C/c
m2 )
Electric Field(MV/cm)
PVDF PVDF-PZT
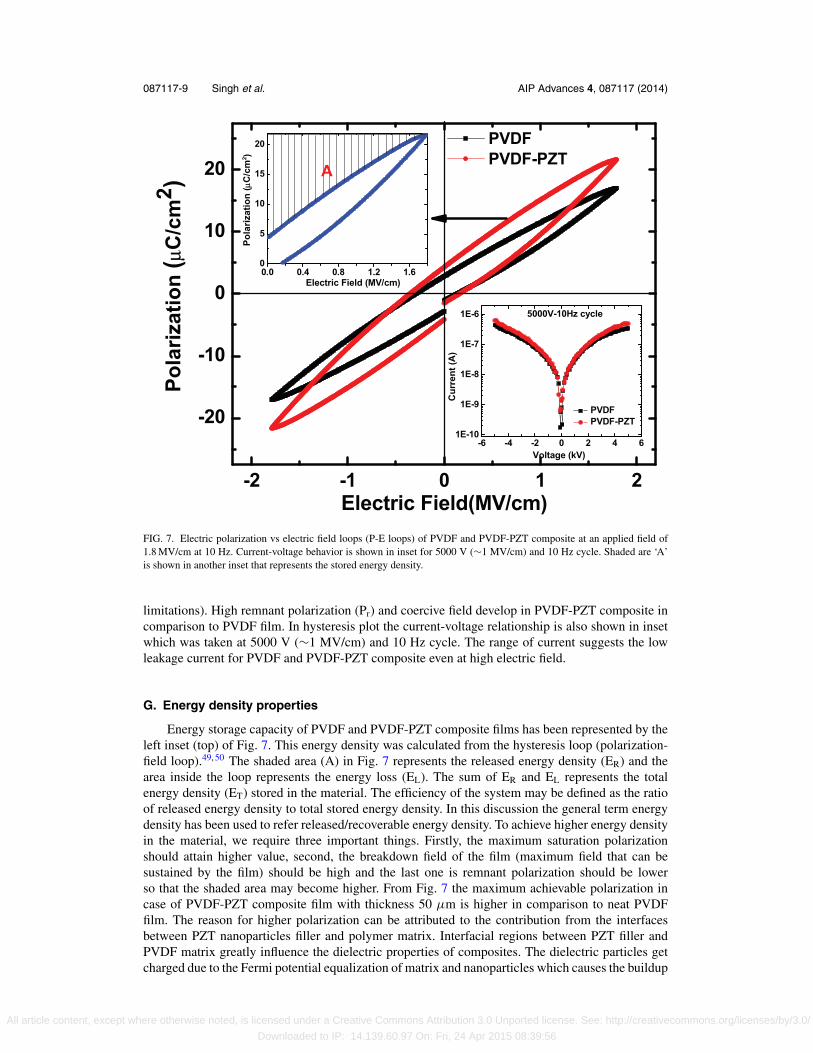
FIG. 7. Electric polarization vs electric field loops (P-E loops) of PVDF and PVDF-PZT composite at an applied field of1.8 MV/cm at 10 Hz. Current-voltage behavior is shown in inset for 5000 V (∼1 MV/cm) and 10 Hz cycle. Shaded are ‘A’is shown in another inset that represents the stored energy density.
limitations). High remnant polarization (Pr) and coercive field develop in PVDF-PZT composite incomparison to PVDF film. In hysteresis plot the current-voltage relationship is also shown in insetwhich was taken at 5000 V (∼1 MV/cm) and 10 Hz cycle. The range of current suggests the lowleakage current for PVDF and PVDF-PZT composite even at high electric field.
G. Energy density properties
Energy storage capacity of PVDF and PVDF-PZT composite films has been represented by theleft inset (top) of Fig. 7. This energy density was calculated from the hysteresis loop (polarization-field loop).49, 50 The shaded area (A) in Fig. 7 represents the released energy density (ER) and thearea inside the loop represents the energy loss (EL). The sum of ER and EL represents the totalenergy density (ET) stored in the material. The efficiency of the system may be defined as the ratioof released energy density to total stored energy density. In this discussion the general term energydensity has been used to refer released/recoverable energy density. To achieve higher energy densityin the material, we require three important things. Firstly, the maximum saturation polarizationshould attain higher value, second, the breakdown field of the film (maximum field that can besustained by the film) should be high and the last one is remnant polarization should be lowerso that the shaded area may become higher. From Fig. 7 the maximum achievable polarization incase of PVDF-PZT composite film with thickness 50 μm is higher in comparison to neat PVDFfilm. The reason for higher polarization can be attributed to the contribution from the interfacesbetween PZT nanoparticles filler and polymer matrix. Interfacial regions between PZT filler andPVDF matrix greatly influence the dielectric properties of composites. The dielectric particles getcharged due to the Fermi potential equalization of matrix and nanoparticles which causes the buildup
All article content, except where otherwise noted, is licensed under a Creative Commons Attribution 3.0 Unported license. See: http://creativecommons.org/licenses/by/3.0/
Downloaded to IP: 14.139.60.97 On: Fri, 24 Apr 2015 08:39:56

087117-10 Singh et al. AIP Advances 4, 087117 (2014)
0.4 0.6 0.8 1.0 1.2 1.4 1.6 1.8 2.00
2
4
6
8
10
12
14
0.4 0.6 0.8 1.0 1.2 1.4 1.6 1.8 2.0
60
65
70
75
80
85
90
95
PVDF PVDF-PZT
Eff
icie
ncy
( η)
Electric Field (MV/cm)
En
erg
y D
ensi
ty (
J/cm
3 )
Electric Field (MV/cm)
PVDF PVDF-PZT
FIG. 8. Energy density of PVDF and PVDF-PZT composite calculated from P-E loops and the corresponding efficiency forboth systems (inset).
of charge distribution layer in polymer matrix in the vicinity of charged nanoparticles.51 Interfaciallayers become more conductive than polymer matrix, which prohibits the space charge accumulationand field by rapid discharge through conductive channel. This process improves breakdown fieldof composite which in turn allows higher degree of polar domains switching and hence enhancedpolarization in PVDF-PZT composite.
Fig. 8 shows the variation of stored energy density and efficiency of the system (inset) withapplied electric field. It is apparent from the figure 8 that the energy density stored in the 50 μmcomposite film is increased significantly than the neat PVDF film, however the efficiency of thecomposite system got slightly decreased due to some extent high energy loss. The composite showedthe capacity to store the maximum energy density up to 13.94 J/cm3.
IV. CONCLUSIONS
The microstructure and the functional properties of PVDF film is influenced with inclusionof PZT micro/nano fillers. Inclusion of polar PZT in PVDF matrix improved the spontaneouspolarization, with almost similar breakdown field and leakage current. Young’s modulus is enhancedwhich results in good piezoelectric response although some reduction in tensile strength from47.29 MPa to 44.57 MPa is also observed. Dielectric constant of composite film is increased (almost2.5 times) in frequency range 5 kHz-50 kHz in comparison to neat PVDF film with almost similardielectric loss. Increase in dielectric constant with almost similar breakdown field leads to increasein stored electrical energy density of PVDF-PZT composite to 13.94 J/cm3.
ACKNOWLEDGMENT
Mr. Paritosh Singh would like to thank Prof. R C Budhani (Director, CSIR-NPL) andProf. A Dhar for his constant encouragement and CSIR-NPL (AcSIR) for M. Tech fellowship.
All article content, except where otherwise noted, is licensed under a Creative Commons Attribution 3.0 Unported license. See: http://creativecommons.org/licenses/by/3.0/
Downloaded to IP: 14.139.60.97 On: Fri, 24 Apr 2015 08:39:56
087117-11 Singh et al. AIP Advances 4, 087117 (2014)
Authors would like to thank Prof. Vinay Gupta, Delhi University, and Dr. D. K. Pradhan, NITRourkela for their valuable suggestions and experimental supports. Authors would like to thank Mr.K N Sood for SEM imaging and Mr. Dinesh Singh for TEM illustrations.
1 Thomas Christen and Martin W. Carlen, Journal of Power Sources 91, 210 (2000).2 B. Z. Tian, X. L. Zheng, T. J. Kempa, Y. Fang, N. F. Yu, G. H. Yu, J. L. Huang, and C. M. Lieber, Nature 449, 885 (2007).3 R. S. Yang, Y. Qin, L. M. Dai, and Z. L. Wang, Nat. Nanotechnol. 4(1), 34 (2009).4 J. H. Song, J. Zhou, and Z. L. Wang, Nano Lett. 6(8), 1656 (2006).5 C. F. Pan, H. Wu, C. Wang, B. Wang, L. Zhang, Z. D. Cheng, P. Hu, W. Pan, Z. Y. Zhou, X. Yang, and J. Zhu, J. Adv.
Mater. 20(9), 1644 (2008).6 D. Choi, M. Y. Choi, W. M. Choi, H. J. Shin, H. K. Park, J. S. Seo, J. Park, S. M. Yoon, S. J. Chae, Y. H. Lee, S. W. Kim,
J. Y. Choi, S. Y. Lee, and J. M. Kim, Adv. Mater. 22(19), 1 (2010).7 A. J. Lovinger, Macromolecules 14, 322 (1981).8 J. B. Lando, H. G. Olf, and A. Peterlin, J. Polym. Sci., Part A 4, 941 (1966).9 A. J. Lovinger, in Developments in crystalline polymers, edited by D. C. Basset (Applied Science Publishers Ltd, N. J.
Englewood, 1982).10 S. Chen, K. Yao, F. E. H. Tay, and C. L. Liow, J. Appl. Phys. 102, 104108 (2007).11 M. G. Buonomenna, P. Macchi, M. Davoli, and E. Drioli, Euro. Polym. J. 43, 1557 (2007).12 X. He and K. Yao, Appl. Phys. Lett. 89, 112909 (2006).13 P. Sajkiewicz, A. Wasiak, and Z. Goclowski, Euro. Polym. J. 35, 423 (1999).14 Z. M. Dang, Y. H. Lin, and C. W. Nan, Adv. Mater. 15, 1625–1629 (2003).15 H. Chen, X. Dong, T. Zeng, Z. Zhou, and H. Yang, Ceram. Inter. 33, 1369–1374 (2007).16 F. M. Dougall, J. Ennis, X. H. Yang, R. A. Copper, J. E. Gilbert, J. F. Bates, T. R. Jow, J. Ho, C. J. Scozzie, and S. P. S.
Yen, IEEE Pulsed Power Conference (Wshington DC, 2009).17 Z. M. Dang, J. K. Yuan, S. H. Yao, and R. J. Liao, Adv. Mater. 25, 6334 (2013).18 V. Tomer, E. Manias, and C. A. Randall, J. Appl. Phys. 110, 044107 (2011).19 Penghao Hu, Yu Song, Haiyang Liu, Yang Shen, Yuanhua Lin, and Ce-Wen Nan, J. Mater. Chem. A 1, 1688 (2013).20 Z. M. Dang, D. Xie, and C. Y. Shi, Appl. Phys. Lett. 91, 222902 (2007).21 Y. Bai, Z. Y. Cheng, V. Bharti, H. S. Xu and Q. M. Zhang, Appl. Phys. Lett. 76, 3804 (2000).22 T. Yamada, T. Ueda, and T. Kitayama, J. Appl. Phys. 53(6), 4328 (1982).23 B. A. Newman, C. H. Yoon, and K. D. Pae, J. Appl. Phys. 50, 6095 (1979).24 S. Chen, K. Yao, F. E. H. Tay, and C. L. Liow, J. Appl. Phys. 102, 104108 (2007).25 G. T. Davis, J. E. Mekinny, M. G. Broadhurst, and S. C. Roth, J. Appl. Phys. 49(10), 4992 (1978).26 K. Tashio and K. Takano, Polymer 24, 199 (1983).27 X. Zheng, Y. Zhou, and Z. Uan, Mat. Res. 4, 1648 (2003).28 Ashok Kumar, R. S. Katiyar, and J. F. Scott, J. Appl. Phys. 108, 064105 (2010).29 R. S. Katiyar, J. F. Ryan, and J. F. Scott, Phys. Rev. B 4, 2635 (1971).30 T. Boccaccio, Bottino, G. Capannelli, and P. Piaggio, J. Membrane Sci. 210, 315 (2002).31 M. Kobayashi, K. Tashiro, and H. Tadokoro, Macromolecules 8, 158 (1975).32 U. Hoffmann, F. Pfeifer, S. Okretic, N. Volkl, M. Zahedi, and H. W. Siesler, Appl Spectr 47(9), 1531 (1993).33 S. Satapathy, S. Pawar, P. K. Gupta, and K. B. R. Varma, Bull. Mater. Sci. 34, 727 (2011).34 B. Mattsson, H. Ericsson, L. M. Torell, and F. Sundholm, J. Polym. Sci A: Polym Chem 37, 3317 (1999).35 V. P. Pavlovic, V. B. Pavlovic, B. Vlahovic, D. K. Bozanic, J. D. Pajovic, R. Dojcilovic, and V. Djokovic, Physica Scripta
T157, 014006 (2013).36 Y. Bormashenko, R. Pogreb, O. Stanevsky, and E. Bormashenko, Polym. Testing 23, 791 (2004).37 C. J. L. Constantino, A. E. Job, R. D. Simoes, J. A. Giacometti, V. Zucolotto, Jr., O. N. Oliveira, G. Gozzi, and D. L.
Chinaglia, Appl. Spectrosc. 59, 275 (2005).38 A. G. Souza Filho, K. C. V. Lima, A. P. Ayala, I. Guedes, P. T. C. Freire, J. Mendes Filho, E. B. Araujo, and J. A. Eiras,
Phys. Rev. B 61, 14283 (2000).39 S. Firmino Mendes, C. M. Costa, V. Sencadas, J. Serrado Nunes, P. Cost, R. Gregorio, Jr., and S. Lanceros-Mendez, Appl.
Phys. A 96, 899 (2009).40 M. B. Suresh, T. H. Yeh, C. C. Yu, and C. C. Chou, Ferroelectrics 381, 80 (2009).41 L. E. Nielsen, J. Appl. Polym. Sci. 10, 97 (1966).42 T. Furukawa, J. Aiba, and E. Fukada, J. Appl. Phys. 50(5), 3615 (1979).43 J. Lovinger, T. Furukawa, G. T. Davis, and M. G. Broadhurst, Polymer 24, 1225 (1983).44 R. Gregorio, Jr., M. Cestart, and F. E. Bernardino, J. Mater. Sci., 31, 2925 (1996).45 T. Yamada, T. Ueda, and T. Kitayama, J. Appl. Phys. 53(6), 4328 (1982).46 B. Hilczer, J. Kutek, and E. Markiewicz, Processing of Electroceramics (2003).47 O. R. Hughes, J. Polym. Sci. B Polym. Phys. 45, 3207 (2007).48 D. Rollik, S. Bauer, and R. Gerhard-Multhaupt, J. Appl. Phys. 85, 3282 (1999).49 V. Tomer and C. A. Randall, J. Appl. Phys. 104, 074106 (2008).50 V. Tomer, C. Randall, G. Polizos, J. Kostelnick, and E. Manias, J. Appl. Phys. 103, 034115 (2008).51 T. J. Lewis, IEEE Transactions on Dielectrics and Electrical Insulation 11, 739 (2004).
All article content, except where otherwise noted, is licensed under a Creative Commons Attribution 3.0 Unported license. See: http://creativecommons.org/licenses/by/3.0/
Downloaded to IP: 14.139.60.97 On: Fri, 24 Apr 2015 08:39:56


![FERROELECTRIC RAM [FRAM]](https://static.fdocuments.net/doc/165x107/56816799550346895ddcd567/ferroelectric-ram-fram.jpg)
