Fermentation of lignocellulosic material by the ... · CBS 11269 EX0564 Independent project in...
46
Uppsala BioCenter Independent project 2010:4 Department of Microbiology Faculty of Natural Resources and Agriculture Sciences Swedish University of Agricultural Sciences ISSN 1101-8151 Uppsala ISRN SLU-MIKRO-EX–10/4–SE Fermentation of lignocellulosic material by the alternative industrial ethanol yeast Dekkera bruxellensis Emily South
Transcript of Fermentation of lignocellulosic material by the ... · CBS 11269 EX0564 Independent project in...

Uppsala BioCenter Independent project 2010:4 Department of Microbiology Faculty of Natural Resources and Agriculture Sciences Swedish University of Agricultural Sciences ISSN 1101-8151 Uppsala ISRN SLU-MIKRO-EX–10/4–SE
Fermentation of lignocellulosic material by the alternative industrial ethanol yeast Dekkera bruxellensis Emily South

Uppsala BioCenter Independent project 2010:4 Department of Microbiology Faculty of Natural Resources and Agriculture Sciences Swedish University of Agricultural Sciences ISSN 1101-8151 Uppsala ISRN SLU-MIKRO-EX–10/4–SE
Fermentation of lignocellulosic material by the alternative industrial ethanol yeast Dekkera bruxellensis Emily South Supervisors: Johanna Blomqvist Volkmar Passoth Examiner: Karin Jacobsson Keywords: Lignocellulosic material, steam explosion, aspen
sawdust, enzymatic saccharification, ethanol production, Saccharomyces cerevisiae J672, Dekkera bruxellensis CBS 11269
EX0564 Independent project in biology D, 30 HEC Thesis for Master of Science degree in Engineering Biology at Linköping Institute of Technology, Linköping University Performed at the Department of Microbiology, SLU


Abstract South, E. 2010. Fermentation of lignocellulosic material by the alternative industrial ethanol yeast Dekkera bruxellensis.
Bioethanol is one alternative energy fuel that can be produced from different types of biomass. Second generation bioethanol comes from fermentation of lignocellulosic material and can be seen as a more environmental friendly alternative as e.g. forest residues and agricultural by-products are used. To be able to use lignocellulosic biomass in ethanol production, it has to be subjected to different treatments first. In this study, aspen sawdust was used as lignocellulosic material. After pretreatment with steam explosion and hydrolysis, using enzymes, a hydrolysate was obtained containing dissolved sugars, e.g. glucose. Fermentation of glucose into ethanol was done using two different yeasts to compare the differences: the traditional baker’s yeast Saccharomyces cerevisiae J672 and the yeast Dekkera bruxellensis CBS 11269, most known as a spoilage yeast but recently found to be the producing organism of ethanol in an ethanol production plant. In the study, the addition of (NH4)2SO4 at 2 g/L did not affect the growth negatively. Yeast extract was observed to be an essential media component for growth of D. bruxellensis CBS 11269 and improved the growth for S. cerevisiae J672. Due to the high amounts of toxic compounds acting inhibitory to the yeast, the hydrolysate produced needed to be diluted in order to achieve yeast growth. Unadapted S. cerevisiae J672 grew in 1:5 and 1:10 diluted hydrolysate while D. bruxellensis CBS 11269 only grew in the 1:10 dilution. Adapted yeast cells, of both yeasts, in a continuous experiment with recirculation, grew well in both 1:10 and 1:5 diluted hydrolysate resulting in an ethanol yield between 0.21-0.26 g ethanol/g glucose. No clear difference between the yeasts was seen. When applying the same procedure in fermenters, the same dilution rate as in the smaller scale experiment was not achieved properly and neither did the dilution rate become the same for both yeasts. No comparison between the yeasts could therefore be made for the fermenter part. The ethanol yield for S. cerevisiae J672 was between 0.35-0.36 g ethanol/g glucose for the media compositions that occurred during the experiments and for D. bruxellensis CBS 11269 it varied between 0.31-0.37 g ethanol/g glucose.
Keywords: Lignocellulosic material, steam explosion, aspen sawdust, enzymatic saccharification, ethanol production, Saccharomyces cerevisiae J672, Dekkera bruxellensis CBS 11269.


Sammanfattning South, E. 2010. Fermentation av lignocellulosa material med hjälp av den alternativa industriella etanoljästen Dekkera bruxellensis.
Bioetanol är en alternativ energikälla som kan produceras från olika typer av biomassa. Till första generationen bioetanol används socker eller stärkelse medan andra generationen bioetanol fås från fermentation av lignocellulosa material och kan ses som ett mer miljövänligt alternativ då t.ex. restprodukter från skogsindustrin och lantbruk kan användas. Lignocellulosa består av cellulosa, hemicellulosa och lignin. För att kunna använda lignocellulosa material i etanolproduktion, måste materialet förbehandlas. Förbehandlingen bryter upp strukturen i lignocellulosa materialet och gör det lättare för enzymer, som senare används, att komma åt cellulosan. I den här studien användes sågspån av asp. Efter att ha förbehandlat sågspånet med den s.k. ångexplosionsmetoden och sedan hydrolys, m.h.a. enzymer, fås ett hydrolysat som innehåller lösta kolhydrater, bl.a. glukos. Fermentation av glukos till etanol kan utföras av bl.a. jäst och en jämförelse mellan två jästsorter gjordes: den traditionella bagerijästen Saccharomyces cerevisiae J672 och jästen Dekkera bruxellensis CBS 11269, som mest är känd som en kontaminationsjäst i vinindustrin men som nyligen upptäcktes vara den etanolproducerande organismen i en etanolindustrifabrik. I studien upptäcktes att tillsatsen av (NH4)2SO4, 2 g/L, inte tycktes påverkas jästen negativt. Jästextrakt upptäcktes vara en nödvändig mediakomponent för att uppnå tillväxt av D. bruxellensis CBS 11269 men inte av S. cerevisiae J672. Där förbättrades bara tillväxten hos jästen vid tillsats. P.g.a. de höga halterna av inhibitorer i hydrolysatet behövdes det spädas för att få tillväxt av jästen. Celler som direkt tillsattes till hydrolysat, d.v.s. oadapterade celler, dog annars. S. cerevisiae J672 växte i 1:5 och 1:10 spätt hydrolysat medan D. bruxellensis CBS 11269 bara växte i en 1:10 spädning. I ett experiment med kontinuerlig odling, d.v.s. med återcirkulation, där jästcellerna långsamt utsattes för en högre och högre koncentration av hydrolysat, så att de blev adapterade, var tillväxten bra i både 1:10 och 1:5 spätt hydrolysat för både D. bruxellensis CBS 11269 och S. cerevisiae J672. Där blev etanolutbytet mellan 0.21-0.26 g etanol/g glukos för de två jästsorterna. Ingen tydlig skillnad i etanolutbyte kunde ses mellan dem. När samma experiment skulle utföras i större skala i fermentorer uppnåddes tyvärr inte samma utspädningshastighet som i det kontinuerliga försöket i mindre skala och utspädningshastigheten blev heller inte samma för D. bruxellensis CBS 11269 och S. cerevisiae J672. Inga jämförelser kan därför göras mellan jästarterna. Etanolutbytet för S. cerevisiae J672 var mellan 0.35-0.36 g etanol/g glukos för de mediasammansättningar som användes under experimentet och för D. bruxellensis CBS 11269 varierade utbytet mellan 0.31-0.37 g etanol/g glukos.
Nyckelord: Lignocellulosa material, ångexplosion, sågspån av asp, enzymatisk sackarifikation, etanol produktion, Saccharomyces cerevisiae J672, Dekkera bruxellensis CBS 11269.


Table of contents 1. Introduction ................................................................................................................................ 9
1.1 The need of bioethanol to reduce the emission of greenhouse gases ............................... 9
1.2 Composition and pretreatment of lignocellulosic material ................................................ 9
1.3 Aspen ................................................................................................................................. 10
1.4 Formation of toxic compounds ......................................................................................... 10
1.5 Enzymatic saccharification and analysis of carbohydrates with HPAE‐PAD ..................... 11
1.6 Fermentation ..................................................................................................................... 12
1.7 Dekkera bruxellensis .......................................................................................................... 12
2 Aim of the project ..................................................................................................................... 13
3 Materials and methods ............................................................................................................. 14
3.1 Materials ........................................................................................................................... 14
3.1.1 Aspen sawdust .......................................................................................................... 14
3.1.2 Enzyme solution ........................................................................................................ 14
3.1.3 Strains ........................................................................................................................ 14
3.1.4 Preculture .................................................................................................................. 14
3.2 Preparations for fed‐batch enzymatic hydrolysis of aspen sawdust ................................ 15
3.2.1 Steam explosion ........................................................................................................ 15
3.2.2 Moisture analysis ...................................................................................................... 15
3.2.3 Hydrolysis .................................................................................................................. 15
3.3 Analyses ............................................................................................................................. 17
3.3.1 Carbohydrate analysis by HPAE‐PAD ........................................................................ 17
3.3.2 Optical Density (OD) .................................................................................................. 17
3.3.3 HPLC analysis of compounds after fermentation ...................................................... 17
3.3.4 Total viable count (TVC) ............................................................................................ 18
3.4 Fermentation experiments ............................................................................................... 18
3.4.1 Experiment investigating the effect of (NH4)2SO4 using hydrolysate batch 1 at 30°C ..
................................................................................................................................... 18
3.4.2 Experiment investigating the effect of (NH4)2SO4 using hydrolysate batch 2 at 30°C ..
................................................................................................................................... 18
3.4.3 Experiment investigating at what dilution both D. bruxellensis CBS 11269 and
S. cerevisiae J672 grow in hydrolysate batch 2 at 30°C ............................................ 18
3.4.4 Experiment with undiluted and 1:10 diluted hydrolysate batch 2 with yeast extract
present from the beginning at 30°C .......................................................................... 19
3.4.5 Continuous culture experiment with D. bruxellensis CBS 11269 and S. cerevisiae
J672 with hydrolysate batch 2 at 30°C ...................................................................... 19
3.4.6 Continuous cultivation with simulation of cell recycling in fermenters with
D. bruxellensis CBS 11269 and S. cerevisiae J672 with hydrolysate batch 2 at 30°C 20
4 Results and discussion ............................................................................................................... 22
4.1 Moisture analysis .............................................................................................................. 22
4.2 Carbohydrate analysis ....................................................................................................... 22
4.2.1 Batch 1 ....................................................................................................................... 22
4.2.2 Batch 2 ....................................................................................................................... 22
4.2.3 Yield of carbohydrates .............................................................................................. 23
4.3 Experiment investigating the effect of (NH4)2SO4 using hydrolysate batch 1 at 30°C ...... 23
4.4 Experiment investigating the effect of (NH4)2SO4 using hydrolysate batch 2 at 30°C ...... 25
4.5 Experiment investigating at what dilution both D. bruxellensis CBS 11269 and
S. cerevisiae J672 grow in hydrolysate batch 2 at 30°C .................................................... 26
4.6 Experiment with undiluted and 1:10 diluted hydrolysate batch 2 with yeast extract
present from the beginning at 30°C .................................................................................. 29
4.7 Continuous culture experiment with D. bruxellensis CBS 11269 and S. cerevisiae J672
with hydrolysate batch 2 at 30°C ...................................................................................... 30
4.8 Continuous cultivation with simulation of cell recycling in fermenters with D. bruxellensis
CBS 11269 and S. cerevisiae J672 with hydrolysate batch 2 at 30°C ................................ 33
5 Conclusions ............................................................................................................................... 36
6 Acknowledgements ................................................................................................................... 38
7 References ................................................................................................................................. 39
8 Appendix ................................................................................................................................... 42

9
1. Introduction
1.1 The need of bioethanol to reduce the emission of greenhouse gases The need for alternative energy sources has increased over the years since it has become evident that the emissions of CO2 have become larger. One alternative is using biomass as an energy source to produce biofuels, e.g. bioethanol (Alvira et al. 2010).
Bioethanol is divided into different groups depending on what kind of biomass it is produced from. First generation bioethanol is derived from sugar or starch while second generation is a result from the fermentation of lignocellulosic biomass, e.g. energy crops, forest residues and agricultural by-products. One essential difference between the two types is that the reduction of greenhouse gases is larger with the ethanol coming from lignocellulosic material. This is based on the amount of oil that is needed in the procedure (Olofsson et al. 2008). One example is also the greater reduction of greenhouse gas emission when using lignocellulosic material to produce ethanol compared to when it comes from corn. When compared to gasoline, the reduction is 80% with lignocellulosic biomass and 20-30% with corn (Demain 2009).
Another important factor when it comes to ethanol production is its consequences to food and feed production. Globally, sugar and corn starch have been used to produce bioethanol. In the US, corn could yield up to 13 billion gallons of ethanol per year. At the moment, 23% of the corn is used for ethanol production. However, this use of corn for the production of bioethanol has caused economic problems like elevated costs of corn intended for human need and animal feed. When it comes to transportation, only 2% of the fuel comes from ethanol originating from corn, implying that an increased need of corn for transportation needs would become a dangerous competitor with the food crops. Therefore, using lignocellulosic material for ethanol production would be a better alternative (Demain 2009).
1.2 Composition and pretreatment of lignocellulosic material A common practice in ethanol production from lignocellulosic material is to pretreat it, either thermally or chemically, before an enzymatic hydrolysis. The dissolved sugars from the hydrolysis are used in the following fermentation part (Olofsson et al. 2008).
Lignocellulosic materials are composed mostly of cellulose, hemicellulose and lignin. Cellulose is the main component in the cell walls of the plant and is a linear polymer of β-D-glucose units. These are linked together by β-1,4-glycosidic bonds and makes the construction very inflexible. Hemicellulose and lignin surround the cellulose parts. The difference between hemicellulose and cellulose is that hemicellulose is branched (and cellulose is unbranched) and also a heteropolymer consisting of L-arabinose, D-galactose, D-glucose, D-mannose and D-xylose. It can also have acetyl or methyl groups connected to its main carbon chain. Due to the non-crystalline structure, hemicellulose is not as hard as cellulose to hydrolyze (Olsson and Hahn-Hägerdal 1996; Kumar et al. 2009). Lignin has a

10
larger and more complex structure. It consists of cross-linked polymers of phenolic monomers and is found in the primary cell wall (Kumar et al. 2009).
The pretreatment step is necessary to degrade the lignin and disrupt the structure of the cellulose. In that way, enzymes can hydrolyze the cellulose (Kumar et al. 2009). Steam explosion is a common physicochemical pretreatment for lignocellulose. Small pieces of biomass are exposed to pressurised steam for a certain time interval before being depressurised (Alvira et al. 2010). Because of the high temperature, the process degrades the hemicellulose and transforms the lignin and in that way promotes the hydrolysis of the cellulose (Kumar et al. 2009). An autohydrolysis reaction will then start. Organic acids will catalyze the degradation of hemicelluloses. These organic acids are created from acetyl groups present in the biomass promoted by the high temperature (Alvira et al. 2010; Sassner et al. 2005). When hemicellulose is removed, the cellulose becomes more accessible for the enzymes (Kumar et al. 2009). A mechanical effect due from the steam explosion is the separation of fibres because of the reduced pressure. In this manner, the lignin will be redistributed and to some part taken away from the biomass material and a partial hydrolysis of the hemicellulose and solubilisation will occur (Alvira et al. 2010).
1.3 Aspen Aspen (Populus tremula), a hardwood tree (Klinke et al. 2004), is a deciduous tree which is found from the British Isles to the eastern part of Asia and from Northern Scandinavia to Northern Africa (de Carvalho et al. 2010). In northern forest ecosystems, European aspen has a major significant function concerning ecological aspects. Its litter has a high content of calcium which raises the pH of the soil. Apart from the use of aspen in the traditional forest industry, it is also used for bioenergy production and in phytoremediation (Nikula et al. 2010). In phytoremeditiation, e.g. using plants to clean up soils contaminated with heavy metals and other pollutants, aspen is especially well suited as it removes the contaminants in many ways, e.g. by acting as a trap or filter, by degrading them or encaging them (Laureysens et al. 2005). Aspen biomass consists of 51% cellulose, 29% hemicellulose and 16% lignin (Olsson and Hahn-Hägerdal 1996).
1.4 Formation of toxic compounds Both the pretreatment and the hydrolysis (Section 1.5) procedures can create inhibitory compounds (Olsson and Hahn-Hägerdal 1996). This also includes the steam explosion pretreatment method. The toxic compounds that are created there may have an effect on the hydrolysis and fermentation which follow (Alvira et al. 2010). The amount of toxic compounds and the specific ones created depends on what material is used, what prehydrolysis and hydrolysis procedures that are used and the severity of the pretreatment (Olsson and Hahn-Hägerdal 1996).
Common substances that are released during the pretreatment and the hydrolysis are acetic acid, originating from the degraded hemicellulose, and extractives like terpenes, alcohols and aromatic compounds. A second group of inhibitors are furfural, 5-hydroxymethyl furfural, laevulinic acid, formic acid and humic substances. These compounds are produced as a result of the degradation of sugars in the pretreatment and the hydrolysis. Due to the
11
lignin degradation during the pretreatment and the hydrolysis, many aromatic and polyaromatic compounds are created (Olsson and Hahn-Hägerdal 1996).
When it comes to steam explosion, furan derivatives, weak acids and phenolic compounds are the most common inhibitors. The furan derivatives come from the degradation of pentoses and hexoses, where the most common ones are furfural, which is derived from pentoses, and 5-hydroxymethyl furfural, which comes from hexoses (Alvira et al. 2010). If these compounds are present, they can lead to a decrease in ethanol yield and productivity of the microorganisms (Palmqvist and Hahn-Hägerdal 2000).
During the actual fermentation process, common products produced there can also inhibit the microorganism, e.g. ethanol, acetic acid, glycerol and lactic acid (Olsson and Hahn-Hägerdal 1996).
1.5 Enzymatic saccharification and analysis of carbohydrates with HPAEPAD
The hydrolysis part can either be carried out with weak acids or enzymes. The use of acids was more common earlier but it has the disadvantage of making the hydrolysate quite toxic to the fermenting microorganisms. It has also been seen to limit the glucose yield. Instead, it has become more common to use enzymes which are specialized to break the β-1,4-glycosidic bonds of the cellulose. These specialized enzymes are called cellulases and can be further divided into sub-groups depending on their specific activity, e.g. endoglucanases, exoglucanases and β-glucosidases. Endoglucanases attack at random the inner parts of the cellulose as they are responsible for decreasing the degree of polymerization of the substrate. Exoglucanases bind to the glucan ends and release mainly cellobiose units and in this manner, shorten the glucan molecules step by step. The β-glucosidases divide the disaccharide cellobiose into two subunits of glucose (Olofsson et al. 2008).
Many types of microorganisms can produce cellulase systems, but the most efficient cellulase producing one has been found to be the fungus Trichoderma reesei. That microorganism is today dominating the industrial cellulase production (Olofsson et al. 2008).
Different analytical methods have been developed to analyze carbohydrates, e.g. enzymatic assays, Gas Chromatography (GC) and High-Performance Liquid Chromatography (HPLC). High-Performance Anion-Exchange Chromatography with Pulsed Amperometric Detection (HPAE-PAD) is another analytical method which has the advantage of having no interfering background which many HPLC methods have (Feinberg et al. 2009). HPAE-PAD enables a direct quantification of nonderivatized carbohydrates at low nanomolar levels. As carbohydrates have a weakly acid character, they can be dissociated and separated as anions by using an eluent with a high pH and a base stable polymer anion exchange stationary phase (Jahnel et al. 1998).

12
1.6 Fermentation Ethanol is a by-product of anaerobic metabolism in yeasts (Teh and Lutz 2010). When it comes to ethanol production, there exists many different microorganisms that can produce ethanol from hexoses and a few microorganisms that can use pentoses as a substrate (Olsson and Hahn-Hägerdal 1996). Pichia stipitis is a xylose fermenter (Demain 2009). When it comes to hexoses, Saccharomyces cerevisiae is the most common process organism to use. S. cerevisiae provides high ethanol yields having a high tolerance for ethanol at the same time (Olsson and Hahn-Hägerdal 1996). High productivity, inhibitor tolerance and temperature tolerance are other useful characteristics for the fermenting organism to have. S. cerevisiae has been seen to have an ethanol yield above 0.45 g ethanol/g glucose at optimal conditions, a specific rate up to 1.3 g cell mass/(g glucose·hour) and an ethanol tolerance over 100 g/L (Olofsson et al. 2008).
1.7 Dekkera bruxellensis Dekkera bruxellensis (anamorph Brettanomyces bruxellensis) is a yeast known by many wine producers (de Souza Liberal et al. 2007). It plays a role in the wine fermentation industry with its production of 4-ethyl-phenol. At levels less than 400 µg/L, 4-ethyl-phenol contributes to the wine’s flavor with its aroma of spices, leather, smoke or game. However, at concentrations above 620 µg/L, some consumers still enjoy the wine while others find it undrinkable (Brandam et al. 2008; Loureiro and Malfeito-Ferreira 2003). D. bruxellensis is also used commercially in the production of the alcoholic beverage lambic beer (van Nedervelde and Debourg 1995) and is a normal component in the microflora of sourdough (Meroth et al. 2003).
Recently, it was discovered that D. bruxellensis and Lactobacillus vini together had taken over the whole fermentation process at a Swedish ethanol production plant. The fermenter, initially inoculated with S. cerevisiae, runs in a continuous fermentation mode with recirculation of the yeast. As the change of the type of fermenting yeast had not resulted in any changes in productivity, yield or by-product formation, the company running the ethanol plant had no plans of trying to change the D. bruxellensis-L. vini association back to S. cerevisiae (Passoth et al. 2007).
Further research on the characteristics of D. bruxellensis has been done in regard to what influence pH and temperature have on the yeast’s growth rate and ethanol yield. The results were that D. bruxellensis was robust to major changes in temperature and pH. It was also proposed that the yeast could have a more energy efficient metabolism compared to S. cerevisiae under oxygen limiting conditions. This characteristic could make D. bruxellensis more competitive in fermentation systems running in a continuous mode with recirculation of the cells (Blomqvist et al. 2010).
13
2 Aim of the project The aim of this project is to investigate the potential of the alternative yeast D. bruxellensis CBS 11269 to ferment lignocellulosic hydrolysate in comparison with the traditional production yeast S. cerevisiae J672. As lignocellulosic material, aspen sawdust will be used. After a pretreatment step, using the steam explosion method, an enzymatic saccharification will yield dissolved sugars in the produced hydrolysate. The hydrolysate will be used in different fermentation experiments with the industrial strains D. bruxellensis CBS 11269 and S. cerevisiae J672, where also the effect of adding ammonium sulphate ((NH4)2SO4) and yeast extract will be investigated. The fermentation experiments will be performed in batch and in a continuous manner both in the smaller scale using microtiter wells and in the larger scale using fermenters.

14
3 Materials and methods
3.1 Materials
3.1.1 Aspen sawdust The material used for the hydrolysate was aspen (Populus tremula) sawdust, originated from a ~40 year old tree north of Uppsala, Sweden. The sawdust was made from radial cuts of the log and therefore contained a homogenous mixture of the tree from its centre out to its surface, apart from the bark which was preremoved. The final aspen sawdust had a particle size of 1-5 mm.
3.1.2 Enzyme solution The enzyme solution used in the enzymatic saccharification, AccelleraseTM 1000, was a kind gift from Genencor – A Danisco Division (Palo Alto, CF, USA). It is a cellulase blend product from a genetically modified strain of T. reesei complemented with extra β-glucosidase enzyme. The solution is capable of hydrolysing lignocellulosic material to monosaccharides. According to the supplied product data sheet, the particular batch used had an endoglucanases activity of 2 707 CMC (carboxymethylcellulose) U/g and a β-glucosidase activity of 431 pNPG (para-nitrophenyl β-glucoside) U/g. One CMC unit of activity releases 1 µmol of reducing sugars from 0.5% CMC in one minute and one pNPG unit liberates 1 µmol of nitrophenol from pNPG in ten minutes. Both activities were measured at pH 4.8 and at 50°C. Before using the enzyme solution, it was centrifuged at 6 000xg for 20 minutes and then the supernatant was sterile filtered through a 0.2 µm syringe filter (Filtropur, Sarstedt). The filtered supernatant was then used in the enzymatic saccharification at a final enzyme dosage of 0.1 mL enzyme/g DM (Dry Matter) SEAS (Steam Exploded Aspen Sawdust).
3.1.3 Strains Strains used in the fermentation experiments were D. bruxellensis CBS 11269, isolated at a Swedish ethanol production plant in Lidköping, and S. cerevisiae J672, isolated at Agroetanol in Norrköping, Sweden. Both strains were grown on YPD (Yeast Peptone Dextrose) agar plates consisting of glucose 20 g/L, peptone 20 g/L, yeast extract 10 g/L and agar 16 g/L dissolved in deionized water and autoclaved at 121°C for 20 minutes.
3.1.4 Preculture
3.1.4.1 Preculture medium The preculture medium consisted of KH2PO4 9.375 g/L, (NH4)2HPO4 3 g/L, MgSO4·7H2O 1.13 g/L, yeast nitrogen base (YNB, DifcoTM, Becton Dickinson and Company, USA) 6.5 g/L and glucose 30 g/L dissolved in deionized water, with a pH of 5.0 (adjusted with 9.75 M HCl) and sterilised by filtration using 500 mL 0.2 µm bottle top filter unit (NalgeneTM, Sigma Aldrich Inc, St Louis, MO, USA).

15
3.1.4.2 Start of preculture The preculture medium was inoculated with cells from D. bruxellensis CBS 11269 or S. cerevisiae J672 and incubated at a horizontal rotary shaker at 150 rpm at 30°C for 72 hours (D. bruxellensis CBS 11269) or 24 hours (S. cerevisiae J672).
3.1.4.3 Preparation of preculture before inoculation A calculated volume of the preculture, required to obtain the desired initial optical density (OD) in the subsequent fermentation culture, was centrifuged at 4 200 rpm for 5 minutes. The pellet was washed once in the same volume of NaCl at 9 g/L before being centrifuged again at 4 200 rpm for 5 minutes. The pellet was suspended in a small volume of medium before being added to the fermentation culture.
3.2 Preparations for fedbatch enzymatic hydrolysis of aspen sawdust
3.2.1 Steam explosion The aspen sawdust was pretreated with the steam explosion method, which took place at UMB (Norwegian University of Life Science) in Ås, Norway. In a 20 L pressure tank, the aspen biomass was kept at constant temperature and pressure by automatic feeding of steam from a steam boiler. For ten minutes, the material was kept at a temperature of 220°C and at a pressure of 22 bar. The treatment was ended by a fast release of pressure and material into a flash tank. The pressure was initially released to 10 bar and then to 0 bar immediately after. No chemicals were used in this treatment.
3.2.2 Moisture analysis A moisture analysis was done initially to estimate the dry matter content in the SEAS. The instrument used for this purpose was a “Moisture analyzer XM 60” (Precisa Instruments AG). The specific analysis used for this material on this instrument was a “Dry matter (DM) content measurement”. The procedure followed was according to the supplier’s manual. Analyses were done on three replicates. An amount of material between 3-4 g was used. The instrument heats up the material up to 105-106°C and at the same time displays the percentage of dry matter during the measurement. After ~50 minutes, all moisture has left the material and the heating is switched off. The instrument was then left to cool down for ~30 minutes before opening it and removing the heated material. For confirmation the dry material was weighed to see how much the dry matter weighs. That weight should correspond to the same weight as the original weight of the heated matter multiplied with the dry matter content recently estimated. An average value of the percentage of dry matter was also calculated and used later.
3.2.3 Hydrolysis
3.2.3.1 Preparation and start (aiming to get 2 L hydrolysate) An amount of SEAS corresponding to 60 g of dry matter was to be added to a Fernbach flask every day for five days. Portions of 128 g were prepared in bottles which incubated in a water bath at 100°C for 10-15 minutes. The bottles were stored at 8°C until they were used.
16
The amount of anhydrous citric acid needed to get a 1 M solution was weighed and dissolved in deionized water and the pH was set to 5 with 25% w/v NaOH solution. Fifty mL of the 1 M Na-citrate pH 5.0 solution was added to each of two bottles containing 700 mL of deionized water. In this manner, the concentration would be 50 mM in the final volume of hydrolysate in the Fernbach flask and the pH would become suitable for the enzymes.
At the start of the hydrolysate preparation, the sterile Na-citrate buffer solution was added to two 3 L side-baffled Fernbach flasks (Bellco Glass) together with the daily amount of SEAS. The weight of the empty flasks, with and without the double layer of aluminium foil, acting as a cap, had been noted.
3.2.3.2 Procedure The aim was to obtain an enzyme dosage of 0.1 mL enzyme/g DM SEAS in the end, i.e. 30 mL in total. The sterile filtered AccelleraseTM 1000 solution was added twice. Half of the required enzyme solution was added at the start of the enzymatic saccharification and the other half after three days of incubation.
Every day, the Fernbach flask was first weighed. Then a 1 mL sample was taken from it before adding the daily amount of SEAS and water (~50 mL). Before returning the Fernbach flask to the incubator, at 40°C and at 90 rpm, the flasks were weighed again.
3.2.3.3 End of enzymatic saccharification and preparation of samples before carbohydrate analysis
On the eighth day, the enzymatic saccharification was ended. The content of the Fernbach flasks was centrifuged for 30 minutes at 10 000 rpm. The supernatant was then sterile filtrated with a 500 mL bottle top vacuum filtration unit (0.2 µm Filtropur BT50, Sarstedt AG, Germany). One mL sample was taken from the sterile hydrolysate.
The original one mL samples collected during the hydrolysate preparation were first centrifuged and then the supernatant was sterile filtrated in a centrifuge using a VectaSpin Micro Anopore 0.2 µm (Whatman). This sterile solution was diluted before carbohydrate analysis to obtain an appropriate concentration of carbohydrates.
3.2.3.4 Alternative way of making hydrolysate One alternative way of making the hydrolysate was tested – this differing slightly from the method previously described. Instead of incubating the bottles with SEAS in a water bath at 100°C for 10-15 minutes, these bottles were autoclaved. Autoclaving has though been observed to increase the concentrations of inhibitors in the hydrolysate (Klinke et al. 2003) and it was therefore decided to replace autoclaving by the less fierce method of water bathing the bottles containing SEAS. The other difference was the end of the enzymatic saccharification, where the pellets were washed, to obtain as much hydrolysate as possible. In this manner, the volume of the hydrolysate increased, but at the same time the concentration of the different carbohydrates decreased due to the larger amount of deionized water used. Hydrolysate produced in this way was used for the first set of

17
experiments where the effect of adding (NH4)2SO4 was investigated and is called hydrolysate batch 1.
3.3 Analyses
3.3.1 Carbohydrate analysis by HPAE-PAD Analyses were done using High-Performance Anion-Exchange Chromatography with Pulsed Amperometric Detection (HPAE-PAD). Measurements of the carbohydrates in the samples taken during the enzymatic saccharification were performed on a Dionex ICS 3000 chromatograph equipped with Pulsed Amperometric Detection. The column used was a CarboPac PA10 4×250 mm/guard column 4×50 mm. A post-column pump adding a flow rate of 0.25 mL/min 0.3 M NaOH was used to improve the signal at the detection. Chromatographic equipment was controlled be Chromeleon 6.80 (Service Pack 4). Temperature during separation and detection was 30.0°C. Standards contained arabinose, galactose, glucose, xylose, mannose and cellobiose. Five different standards were made to obtain a five-point standard curve, in the range of 2-80 mg/L for all components.
The solvents used for elution medium were: A: 100% deionized H2O B: 0.2 M NaOH C: 0.2 M NaOH + 0.5 M NaOAc
The following program was applied with a flow of 1 mL/min: -12 min → -7 min: isocratic elution: 94.2% B and 5.8% C (regeneration of column) -7 min → -6 min: rapid gradient to 100% A -6 min → 0: isocratic elution: 100% A (preparation before separation) time 0: injection 0 → 17.5 min: isocratic elution: 100% A (separation part 1, elution of most
monosaccharides) 17.5 min → 29 min: gradient 1 to 50% B (separation part 2, elution of some
monosaccharides and some disaccharides) 29 min → 35 min: gradient 2 to 94.2% B and 5.8% C (separation 3, elution of some
oligosaccharides)
3.3.2 Optical Density (OD) Samples taken for Optical Density (OD) measurements were diluted in NaCl at 9 g/L solution to get an OD value between 0.1-0.4. Measurements were done on an Ultrospec 1100 pro, Biochrom at 600 nm.
3.3.3 HPLC analysis of compounds after fermentation Before analysis, the samples were centrifuged at 8 000xg for 2 minutes and the supernatant was sterile filtrated 0.2 μm (Filtropur, Sarstedt). Analyses were done using HPLC on an Agilent 1100 Series (Agilent Technologies, Stockholm, Sweden) containing an automatic injector, quaternary pumps, a Rezex-ROA-Organic Acid H+ 300x7.80 mm (Skandinaviska Genetec AB, Sweden) and a refractive index detector. Five µL of sample was injected and

18
the mobile phase was 5 mM H2SO4 with a flow of 0.6 mL/min. Temperature during separation and detection was 60°C. Chromatographic equipment was controlled by ChemStation for LC systems (Agilent Technologies, Stockholm, Sweden). Standards contained glucose, acetate, ethanol, glycerol and xylose. Six different standards were used to obtain a calibration curve, in the range of 0.10-30 g/L for glucose, acetate, ethanol and glycerol and between 0.02-5 g/L for xylose.
3.3.4 Total viable count (TVC) Samples taken for total viable count (TVC) were diluted in NaCl at 9 g/L solution. Ten μL from appropriate dilutions were then dropped out on YPD agar plates. The agar plates were incubated at 30°C for 24 hours for S. cerevisiae J672 and for 72 hours for D. bruxellensis CBS 11269.
3.4 Fermentation experiments
3.4.1 Experiment investigating the effect of (NH4)2SO4 using hydrolysate batch 1 at 30°C
Hundred mL serum bottles which contained 80% v/v hydrolysate batch 1 will either have a concentration of 0 g/L or 2 g/L ammonium sulphate ((NH4)2SO4). The cells from the preculture were suspended in 10 mL hydrolysate batch 1 to an initial OD of 1. The experiment was run in triplicates.
Samples were taken for measurements of OD (0.1 mL), HPLC (0.9 mL) and TVC (1 mL) at inoculation and at least once every day. The serum bottles were incubated at 30°C at 155 rpm.
3.4.2 Experiment investigating the effect of (NH4)2SO4 using hydrolysate batch 2 at 30°C
Twenty mL serum bottles, with a working volume of 10 mL, which contained 80% v/v hydrolysate batch 2 will either have a concentration of 0 g/L or 2 g/L ammonium sulphate ((NH4)2SO4). The cells from the preculture were suspended in 1 mL hydrolysate batch 2 to an initial OD of 1. The experiment was run in duplicates.
Samples were taken for measurements of OD (0.1 mL) at inoculation and apart from that once every day. Samples for HPLC (0.9 mL) and TVC (0.1 mL) were taken at the end of the experiment. The serum bottles were incubated at 30°C at 155 rpm.
3.4.3 Experiment investigating at what dilution both D. bruxellensis CBS 11269 and S. cerevisiae J672 grow in hydrolysate batch 2 at 30°C
As no carbohydrate analysis had been made prior to this experiment, it was assumed that the glucose concentration in the hydrolysate from batch 2 was 40 g/L (this assumption based on the glucose concentration in hydrolysate from batch 1).

19
In this experiment, 6-well microtiter plates were used. The hydrolysate was diluted to three different dilutions, 1:2, 1:5 and 1:10, and there were two wells for each dilution and yeast. In each well, there was 5 mL of sample. Extra glucose was added to each dilution to obtain the same total glucose concentration in all dilutions. In that way, the conditions would be the same with regard to available glucose for the yeasts.
Due to a calculation mistake, which was discovered when the experiment was finished, the glucose concentration in the 1:2 solution was 33 g/L (20 + 13) instead of 40 g/L (20 + 20). The reason for this was that a too small an amount of glucose was added to the 1:2 solution.
For each dilution, the components were mixed in a sterile bottle. The following glucose concentration mentioned is the one for the extra added glucose. All solutions contained ammonium sulphate (NH4)2SO4 at 2 g/L. The 1:2 dilution solution contained 50% v/v hydrolysate and extra glucose 13 g/L (should have been 20 g/L). The 1:5 dilution solution contained 20% v/v hydrolysate and extra glucose 32 g/L. The 1:10 dilution solution contained 10% v/v hydrolysate and extra glucose 36 g/L.
To two wells in each 6-well microtiter plate, 4.5 mL of each dilution was added. The cells from the preculture medium was suspended in 0.5 mL sterile water and added to the well to an initial OD of 1.
Samples were taken for measurements of OD (0.1 mL) at inoculation, and then twice a day. The microtiter plates were incubated at 30°C at 40 rpm.
Three days after inoculation, 400 μL YNB solution 6.7 g/L was added to one of the two wells in each dilution to see if the yeasts had a need for extra vitamins.
3.4.4 Experiment with undiluted and 1:10 diluted hydrolysate batch 2 with yeast extract present from the beginning at 30°C
Nine mL medium of either undiluted or 1:10 diluted hydrolysate batch 2 was added to 20 mL serum bottles. The cells from the preculture were suspended in 1 mL of either undiluted solution of hydrolysate batch 2 or 1:10 diluted solution of hydrolysate batch 2. The start OD was 1. Both solutions of hydrolysate contained yeast extract 5 g/L and (NH4)2SO4 2 g/L. The 1:10 diluted solution also contained glucose 36 g/L (apart from the glucose from the hydrolysate).
Samples were taken for measurements of OD (0.1 mL) at inoculation and then twice a day. Samples for HPLC (1 mL) were taken three times: at inoculation, in the middle and in the end of the experiment. The serum bottles were incubated at 30°C at 155 rpm.
3.4.5 Continuous culture experiment with D. bruxellensis CBS 11269 and S. cerevisiae J672 with hydrolysate batch 2 at 30°C
From the carbohydrate analysis, the glucose concentration in the hydrolysate was estimated to ~40 g/L.

20
In this experiment, two 6-well microtiter plates were used one for each yeast. The experiment was run in triplicates, i.e. three wells for each yeast (two separate microtiter plates were used to avoid cross contamination).
Initially, the yeast was grown in preculture medium, where YNB 6.5 g/L had been replaced with yeast extract 5 g/L. After two days, that medium was continuously replaced with a 1:10 solution of the hydrolysate. Four days later, the 1:10 solution of hydrolysate was continuously replaced with a 1:5 solution of hydrolysate. Both solutions contained yeast extract 5 g/L, ammonium sulphate ((NH4)2SO4) 2 g/L and extra glucose so that the final glucose concentration in the solution was 40 g/L.
The cells from the preculture were suspended in 5 mL fresh preculture medium (not the medium they came from initially) and added to the well in the microtiter plate to an initial OD of 20.
After having added the cell suspension to the well, 1 mL was removed and 0.1 mL was used for OD and 0.1 mL for TVC. The rest was centrifuged, the supernatant was used for HPLC and the pellet was suspended in 1.5 mL new glucose medium before being added back to the well in the microtiter plate. The microtiter plates were incubated at 30°C on a horizontal rotary shaker at 40 rpm. Four times per day, at 8:00 am, 12:00 am, 4:00 pm and 8:00 pm, 0.5 mL medium was added to each well. Once a day, at 12:00 am, 2 mL cell suspension was removed from the wells and samples for OD (0.1 mL), TVC (0.1 mL) and HPLC (the rest of the sample apart from the pellet) was taken. Measurement of pH was made on the supernatant. The pellet was afterwards resuspended in 0.5 mL fresh medium and transferred back to the well.
3.4.6 Continuous cultivation with simulation of cell recycling in fermenters with D. bruxellensis CBS 11269 and S. cerevisiae J672 with hydrolysate batch 2 at 30°C
3.4.6.1 Start of fermenters The pH electrode and the pO2 electrode in each fermenter were calibrated prior the start of the experiment. The fermenters (Belach Bioteknik AB) have a total volume of 1.8 L and in this experiment a starting volume of 700 mL was used.
Preculture medium (Section 3.1.4.1), where YNB 6.5 g/L had been replaced with yeast extract 5 g/L and the glucose concentration was 40 g/L instead of 30 g/L was used. All components apart from yeast extract and glucose were added to the fermenter before autoclaving it, which was done after all parts had been assembled. The yeast extract and glucose were added after. The cells from the preculture were suspended in a small volume of NaCl at 9 g/L solution and injected into the fermenter. The initial OD was 1. The fermenters were run in batch mode until the glucose concentration was 0 g/L. This was measured with glucose sticks (Biophan G, Kallies Feinchemie AG, Seibritz, Germany).
The fermenter constantly had a stirring speed of 200 rpm, a temperature of 30°C and a pH of 5.

21
3.4.6.2 Start of the continuous fermentation in the fermenters To get the same dilution rate as in the continuous experiment with the microtiter wells, where 40% of the volume was replaced each day, 280 mL were pumped in and taken out each day. Initially, the plan was that a 1:10 solution of hydrolysate should be continuously pumped in to the fermenter at a rate of 280 mL/24 h. The 1:10 solution contained the same components as in the continuous experiments in the microtiter plates. However, due to problems with the pumps, the scheduled specific dilution rate was not reached from the beginning for both pumps. In the end, the 1:10 diluted solution was replaced with an undiluted solution of hydrolysate (also containing yeast extract 5 g/L and (NH4)2SO4 2 g/L).
Cell suspension was removed until the level of 700 mL was reached. From this removed volume 0.1 mL was used for OD, 2 mL for HPLC and 1 mL for TVC. The rest of the cell suspension taken out was centrifuged at 4 200 rpm for 5 minutes. The pellet was suspended in a small volume of sterile H2O mL (as small as possible) and then injected into the fermenter.
22
4 Results and discussion
4.1 Moisture analysis To estimate the percentage of dry matter in the SEAS, a moisture analysis was performed and the result is shown in Table 2 (Appendix). The average value was calculated to be 47% DM.
4.2 Carbohydrate analysis
4.2.1 Batch 1 The samples taken during the enzymatic saccharification were analyzed using HPAE-PAD and the final concentrations in the sterile filtrated hydrolysate were galactose 0.02 g/L, glucose 23.15 g/L, xylose 1.01 g/L, mannose 0.25 g/L and cellobiose 0.60 g/L. The values for all the samples taken during the enzymatic saccharification are shown in Table 3 (Appendix). The difference in carbohydrate concentration between “Day 8” and “Day 8, final hydrolysate” was due to the washing of the pellets with deionized water to release additional carbohydrates. What can be noted was that the concentration of xylose was quite low compared to results from similar experiments by other authors (Delgenes et al. 1996). This difference may be due to the different conditions the material was subjected to. In the steam explosion done on the aspen sawdust here, no H2SO4 was used which might have an effect on the xylose yield.
4.2.2 Batch 2 The samples taken during the enzymatic saccharification were analyzed using HPAE-PAD and the final concentrations in the sterile filtrated hydrolysate were glucose 39.82 g/L, xylose 1.80 g/L, mannose 0.41 g/L and cellobiose 0.59 g/L. The values for all the samples taken during the enzymatic saccharification for both bottles are shown in Table 4 (Appendix). As the two bottles did not have exactly the same concentrations of the different carbohydrates, the contents of the two bottles were mixed resulting in the concentrations given above. In the preparation of this batch, no extra deionized water was used for washing the pellet, thus there was no extra dilution.
As in batch 1, the relatively low xylose concentration may be due to different pretreatment conditions in comparison to results published by other authors (Delgenes et al. 1996).

23
4.2.3 Yield of carbohydrates The yield of carbohydrates for the two batches of hydrolysate is shown in Table 1. Some carbohydrates had not reached measureable values and no yield could be calculated. In both the hydrolysates, the yields were more or less the same for the different carbohydrates apart from cellobiose where the yield was slightly higher for batch 1 than batch 2. Based on earlier results done with steam exploded oat straw, the values are reasonable for what could be expected from the enzymatic saccharification.
Table 1 – Yield of carbohydrates from hydrolysate batch 1 and 2. The yields are based on the concentrations (g/L) of sugars in the final filter sterilised hydrolysate and the added concentration (g/L) of aspen dry matter.
Yield of carbohydrates[g/L of sugars in final hydrolysate/g/L added aspen DM]
Arabinose Galactose Glucose Xylose Mannose Cellobiose
Hydrolysate batch 1 <0.001 0.220 0.010 0.002 0.006
Hydrolysate batch 2 0.220 0.010 0.002 0.003
4.3 Experiment investigating the effect of (NH4)2SO4 using hydrolysate batch 1 at 30°C
The experiments investigating the effect of adding (NH4)2SO4 2 g/L to the batch cultures were performed at 30°C using hydrolysate batch 1. One yeast strain was run at a time, starting with D. bruxellensis CBS 11269. The results of the OD measurements are shown in Figure 1. As can be seen, D. bruxellensis CBS 11269 did not grow very well in the hydrolysate, although no decrease in OD was seen. The difference between the cultures growing in medium with added (NH4)2SO4 and those which did not have extra added (NH4)2SO4 was not that large. Those with added (NH4)2SO4 showed a slightly higher OD value in the end and did not seem to have been influenced negatively by the addition of extra (NH4)2SO4. Although, the slight increase in OD could be in the range of the error margin for the OD measurements. The TVC made at the start of the experiment showed that the yeast cells were viable, but was unfortunately uncountable due to the fact that the cells had grown too big. During the rest of the time that the experiment lasted, no yeast cell colonies appeared indicating that D. bruxellensis CBS 11269 died at an early stage or at least was not able to grow on the agar plates. Therefore, it is hard to say what effect the extra addition of (NH4)2SO4 at 2 g/L had.
The experiment with S. cerevisiae J672 was performed under similar conditions, at 30°C and with hydrolysate batch 1. As is shown in Figure 2, that experiment lasted for a shorter period than that with D. bruxellensis CBS 11269. The reason for that was the distinct non-growth of S. cerevisiae J672, which showed a decrease in OD value instead of a continuous increase. Also here, there was no clear difference between the cultures that grew with extra added (NH4)2SO4 and those which did not. For S. cerevisiae J672, the same problem as with D. bruxellensis CBS 11269 and growth on the YPD agar plates occurred. The TVC made at inoculation showed viable cells while the rest did not.
From the HPLC analysis, it was shown that the glucose concentration in the cultures did not change during the time that the experiment lasted, indicating a non-growth of yeast

24
cells. For neither yeast, production of ethanol occurred. The concentration of acetate also remained constant during the experimental time. The non-growth of both yeast cells was most probably caused by the high concentrations of inhibitors in the hydrolysate and perhaps also by the absence of yeast extract in the culture medium.
Figure 1 – Experiment investigating the effect of (NH4)2SO4 with D. bruxellensis CBS 11269 in 80% v/v hydrolysate batch 1 at 30°C. D01, D02 and D03 are grown in a medium with (NH4)2SO4 0 g/L and D21, D22 and D23 are grown in a medium with (NH4)2SO4 2 g/L. Due to improper stirring of the cultures when taking the first sample, the replicates’ OD values are not all (near) 1.
Figure 2 – Experiment investigating the effect of (NH4)2SO4 with S. cerevisiae J672 in 80% v/v hydrolysate batch 1 at 30°C. S01, S02 and S03 are grown in a medium with (NH4)2SO4 0 g/L and S21, S22 and S23 are grown in a medium with (NH4)2SO4 2 g/L.
0,4
0,6
0,8
1
1,2
1,4
1,6
0 50 100 150 200 250 300 350
Optical D
ensity (OD)
Time [h]
Experiment with D. bruxellensis CBS 11269 estimating the effect of adding (NH4)2SO4 in hydrolysate batch 1 at 30°C
D01
D02
D03
D21
D22
D23
0,4
0,6
0,8
1
1,2
1,4
1,6
0 10 20 30 40 50 60
Optical D
ensity (OD)
Time [h]
Experiment with S. cerevisiae J672 estimating the effect of adding (NH4)2SO4 i hydrolysate batch 1 at 30°C
S01
S02
S03
S21
S22
S23

25
4.4 Experiment investigating the effect of (NH4)2SO4 using hydrolysate batch 2 at 30°C
As the first hydrolysate (batch 1) appeared to contain too many (or too high concentrations of) toxic compounds, a new hydrolysate (batch 2) was prepared using a slightly different procedure. To determine the yeast’s ability to grow in this medium, experiments were carried out. As it was not evident whether the addition of extra (NH4)2SO4 was beneficial in the first experiments with hydrolysate batch 1, this was further investigated here. As is shown in Figure 3, D. bruxellensis CBS 11269 grew in the medium (reaching slightly higher OD values in a shorter time than in the first hydrolysate (batch 1)) with a slightly higher OD for those cultures having extra added (NH4)2SO4. For S. cerevisiae J672, the growth was more unstable, showing more of a decrease than an increase in OD (Figure 4). No clear difference was seen between the cultures which had additional (NH4)2SO4 and those which did not. Samples from the cultures of both yeasts were also spread on YPD agar plates after ~71 hours but no yeast colonies appeared. A possible explanation of this is that the yeast did not actually grow in the experiments, but died at quite an early state. The slight increase in OD which is seen for D. bruxellensis CBS 11269 was not that large and could be in the range of the error margin for the OD measurements. The samples taken for HPLC in the end confirmed that the yeast did not grow at all well in the medium. The glucose concentration was the same as the initial one and no ethanol had been produced.
Figure 3 – Experiment investigating the toxicity in 80% v/v hydrolysate batch 2 and the effect of adding (NH4)2SO4 with D. bruxellensis CBS 11269 at 30°C. D0A and D0B are grown in a medium with (NH4)2SO4 0 g/L and D2A and D2B are grown in a medium with (NH4)2SO4 2 g/L.
0,80,91
1,11,21,31,41,51,61,71,8
0 20 40 60 80 100
Optical D
ensity (OD)
Time [h]
Experiment estimating the effect of (NH4)2SO4 using hydrolysate batch 2 with D. bruxellensis CBS 11269 at 30°C
D0A
D0B
D2A
D2B

26
Figure 4 – Experiment investigating the toxicity in hydrolysate batch 2 and the effect of adding (NH4)2SO4 with S. cerevisiae J672 at 30°C. S0A and S0B are grown in a medium with (NH4)2SO4 0 g/L and S2A and S2B are grown in a medium with (NH4)2SO4 2 g/L.
4.5 Experiment investigating at what dilution both D. bruxellensis CBS 11269 and S. cerevisiae J672 grow in hydrolysate batch 2 at 30°C
From the experiments with cultures growing in media with different concentrations of hydrolysate batch 2, it became clear that both yeasts grew better in a more diluted hydrolysate (Section 3.4.3). Due to a mistake in the calculation, which was discovered after the experiment was finished, the initial glucose concentration in the 1:2 diluted solution was set to 33 g/L instead of 40 g/L. However this should have affected the yeast in those cultures only marginally as 33 g/L still represents a sugar concentration above the capacity of the cellular sugar uptake systems. Therefore, initial growth rate of the yeasts should be determined by their sensitivity to the inhibitors present in the hydrolysate.
For the cultures growing in a medium containing 1:2 diluted hydrolysate batch 2 (Figure 5), more or less similar growth patterns were observed for D. bruxellensis CBS 11269 and S. cerevisiae J672. None of the cultures (D2B and S2B) which got an addition of YNB solution (D2B and S2B) seemed to grow much better than those that did not (D2A and S2A). During the whole experiment, both yeast cultures had an OD ~1. In the 1:5 diluted hydrolysate cultures, S. cerevisiae J672 grew well and definitely better than D. bruxellensis CBS 11269 (Figure 6). The addition of YNB solution (to D5B and S5B) did not seem to have any effect on either yeast. From the cultivation in the 1:10 diluted medium, it became clear that D. bruxellensis CBS 11269 (D10B) reacted positively to the addition of YNB solution (Figure 7). D. bruxellensis CBS 11269 showed a rapid increase in growth after the addition while the replicate (D10A) which did not get YNB solution (D10A) continued its slower growth. S. cerevisiae J672 had from the beginning shown a continuous growth which stagnated after a while and did not seem to become affected by the addition of YNB solution. A possible explanation for this could be a limitation of the substrate, i.e. glucose,
0,80,91
1,11,21,31,41,51,61,71,8
0 20 40 60 80 100
Optical D
ensity (OD)
Time [h]
Experiment estimating the effect of (NH4)2SO4 using hydrolysate batch 2 with S. cerevisiae J672 at 30°C
S0A
S0B
S2A
S2B

27
towards the end as S. cerevisiae J672 had grown already from the beginning, while D. bruxellensis CBS 11269 did not start to use its substrate properly until after the addition of YNB solution. Therefore, it is quite reasonable that D. bruxellensis CBS 11269 (D10B) reacted more positively to the addition than did S. cerevisiae J672 (S10B).
In a similar experiment, D. bruxellensis CBS 11269 and S. cerevisiae J672 were added to 1:2 and 1:5 diluted hydrolysates containing yeast extract 5 g/L (and (NH4)2SO4 2 g/L), i.e. there were vitamins available from the beginning. There, the only culture where growth was observed was in the 1:5 diluted hydrolysate with S. cerevisiae J672, implying that the presence of yeast extract in the 1:2 diluted solutions of hydrolysate was not enough to make the yeast grow there; the presence of toxic compounds (inhibitors) had a stronger effect (data not shown).
Figure 5 – Experiment investigating the growth of D. bruxellensis CBS 11269 (D2A and D2B) and S. cerevisiae J672 (S2A and S2B) in 1:2 diluted hydrolysate batch 2 at 30°C. All cultures are grown in a medium containing (NH4)2SO4 2 g/L. After ~69 hours, 400 μL YNB 6.7 g/L solution was added to the B-cultures.
0
1
2
3
4
5
6
7
8
0 50 100 150
Optical D
ensity (OD)
Time [h]
Experiment with 1:2 diluted hydrolysate batch 2 with D. bruxellensisCBS 11269 and S. cerevisiae J672 at 30°C
D2A
D2B
S2A
S2B

28
Figure 6 – Experiment investigating the growth of D. bruxellensis CBS 11269 (D5A and D5B) and S. cerevisiae J672 (S5A and S5B) in 1:5 diluted hydrolysate batch 2 at 30°C. All cultures are grown in a medium containing (NH4)2SO4 2 g/L. After ~69 hours, 400 μL YNB 6.7 g/L solution was added to the B-cultures.
Figure 7 – Experiment investigating the growth of D. bruxellensis CBS 11269 (D10A and D10B) and S. cerevisiae J672 (S10A and S10B) in 1:10 diluted hydrolysate batch 2 at 30°C. All cultures are grown in a medium containing (NH4)2SO4 2 g/L. After ~69 hours, 400 μL YNB 6.7 g/L solution was added to the B-cultures.
0
1
2
3
4
5
6
7
8
0 50 100 150
Optical D
ensity (OD)
Time [h]
Experiment with 1:5 diluted hydrolysate batch 2 with D. bruxellensisCBS 11269 and S. cerevisiae J672 at 30°C
D5A
D5B
S5A
S5B
0
1
2
3
4
5
6
7
8
0 50 100 150
Optical D
ensity (OD)
Time [h]
Experiment with 1:10 diluted hydrolysate batch 2 with D. bruxellensis CBS 11269 and S. cerevisiae J672 at 30°C
D10A
D10B
S10A
S10B

29
4.6 Experiment with undiluted and 1:10 diluted hydrolysate batch 2 with yeast extract present from the beginning at 30°C
To investigate whether it is the absence of yeast extract or the presence of the inhibitors in the hydrolysate that makes the yeast unable to grow well in the medium, additional experiments were performed. In Figure 8, it is shown that the yeast grew better in the 1:10 diluted solution of hydrolysate batch 2. However, though it is not as distinct, D. bruxellensis CBS 11269 in the undiluted solution of hydrolysate also showed a slow growth, similar to the growth shown in Figure 5 for the cultures D2A and D2B. If a comparison is done between the cultures in the 1:10 diluted hydrolysate here (with yeast extract) and those which grew in 1:10 diluted hydrolysate without yeast extract (D10A and D10B) in Figure 7, it is shown that those with yeast extract present from the beginning grew clearly better, implying the need for adding yeast extract (containing vitamins) for optimal growth of yeast cells. For S. cerevisiae J672, the growth pattern was similar apart from a slightly quicker increase in initial growth, which can be explained by the more rapid growth rate of S. cerevisiae J672 (Figure 9). If that growth pattern is compared to those (S10A and S10B) in Figure 7, it becomes clear that S. cerevisiae J672 has a need for yeast extract to grow well, as that is the only factor that differs between the two experiments.
From the HPLC analysis, it was determined that for both yeasts, no ethanol had been produced in the undiluted cultures. In the cultures with 1:10 diluted hydrolysate, more or less all glucose had been consumed and ethanol had been produced. The ethanol yield for the 1:10 diluted cultures was 0.45 g ethanol/g glucose for both D. bruxellensis CBS 11269 and S. cerevisiae J672 (n=2). No clear difference could be seen between the yeasts.
Figure 8 – Experiment investigating the growth of D. bruxellensis CBS 11269 in undiluted (D0A and D0B) and 1:10 diluted (D10A and D10B) hydrolysate batch 2 in the presence of yeast extract at 30°C. All cultures are grown in a medium containing (NH4)2SO4 2 g/L and yeast extract 5g/L.
0
2
4
6
8
10
12
14
16
18
0 50 100 150
Optical D
ensity (OD)
Time [h]
Experiment with undiluted and 1:10 diluted hydrolysate batch 2 in the presence of yeast extract with D. bruxellensis CBS 11269 at 30°C
D0A
D0B
D10A
D10B

30
Figure 9 – Experiment investigating the growth of S. cerevisiae J672 in undiluted (S0A and S0B) and 1:10 diluted (S10A and S10B) hydrolysate batch 2 in the presence of yeast extract. All cultures are grown in a medium containing (NH4)2SO4 2 g/L and yeast extract 5g/L.
4.7 Continuous culture experiment with D. bruxellensis CBS 11269 and S. cerevisiae J672 with hydrolysate batch 2 at 30°C
In the continuous experiment with recirculation of yeast, the yeast initially grew in the glucose medium. This medium was then gradually replaced with diluted solutions of hydrolysate batch 2: first a 1:10 diluted solution then later on with a 1:5 diluted solution. In this manner, the cells became adapted to the hydrolysate and to its content of inhibitors. Each day, 40% of the volume in the well was replaced with new medium. The dilution rate was 0.017 h-1.
The growth of the yeasts is shown in Figure 10. No start concentration of D. bruxellensis CBS 11269 is seen as those agar plates contained too many cells to be countable. The yeasts did not appear to be influenced by the increased concentration of hydrolysate as they both did not show any decrease. The variation that is seen can either be natural variation or caused by inaccuracy in the measurement method. The stable growth can be explained by the adaptation to the hydrolysate which has occurred. D. bruxellensis CBS 11269 also showed a higher number of CFU (colony forming unit) than S. cerevisiae J672. This can be explained by the fact that when doing TVC on cultures of D. bruxellensis and S. cerevisiae having the same OD value, D. bruxellensis will always have a higher CFU than S. cerevisiae as it has a smaller cell size.
The pH, which was measured every day, was also stable for both D. bruxellensis CBS 11269 and S. cerevisiae J672. It varied between pH 3.6-4.0 for most of the time for S. cerevisiae J672 and being slightly lower for D. bruxellensis CBS 11269. To be noted is the relatively low pH in the undiluted hydrolysate, pH 3.7. However, D. bruxellensis CBS 11269 usually grows well in glucose media at pH 3 (Blomqvist et al. 2010). What probably
0
2
4
6
8
10
12
14
16
18
0 50 100 150
Optical D
ensity (OD)
Time [h]
Experiment with undiluted and 1:10 diluted hydrolysate batch 2 in the presence of yeast extract with S. cerevisiae J672
S0A
S0B
S10A
S10B

31
affects the yeasts is the combination of low pH and the high acetate concentration (inhibitor in the hydrolysate). Acetic acid has a pKa of 4.76 (at 25°C), so the majority of the acid will be in the undissociated form as the hydrolysate had a pH of 3.7. As acetate in its undissociated form can diffuse through the membrane of the yeast cell and lower the intracellular pH, a high concentration of acetate will clearly affect the yeast negatively.
From the HPLC analysis, the ethanol yield for the different media compositions during the experimental time could be compared (Figure 11). No clear difference between D. bruxellensis CBS 11269 and S. cerevisiae J672 could be seen. The ethanol yield varied between 0.21 to 0.24 g ethanol/g glucose for D. bruxellensis CBS 11269 and 0.23 to 0.26 g ethanol/g glucose for S. cerevisiae J672. As the microtiter wells were not air tight, some evaporation may have occurred which could affect the yield of ethanol. A lower amount of glucose in the first sample taken at inoculation for S. cerevisiae J672 was noticed. Instead of having a value of 30 g/L, the value was about ~20 g/L for all three replicates (Table 6 (Appendix)). As both yeasts were placed in the same type of medium and as samples were taken at the same time, the only explanation to this is that S. cerevisiae J672 can more quickly utilise the glucose in the medium than D. bruxellensis CBS 11269 can, which will especially influence the measured concentration when such a high cell concentration (OD 20) is used in the experiment. This was also confirmed by (Blomqvist et al. 2010) who discovered that S. cerevisiae J672 had about a five times higher specific ethanol production rate than D. bruxellensis CBS 11269. As the sample for HPLC was not sterile filtrated immediately after its removal from the culture, there is a possibility that the cells in the sample used some of the substrate to produce ethanol. This hypothesis is supported by the higher level of ethanol in the first inoculation samples for S. cerevisiae J672 (3.3-4.3 g/L) (Table 6 ((Appendix)) than for D. bruxellensis CBS 11269 (0.3-0.7 g/L) (Table 5 ((Appendix)). The ethanol yield is supposed to be measured during steady state conditions. Therefore only columns for those time periods when such conditions occurred are shown in the results (Figure 11). The increase in acetate concentration in the cultures that was seen can be explained by the increased concentration of hydrolysate. As the hydrolysate contains acetate 10-11 g/L there will naturally be an increase with time as the fraction of hydrolysate in the medium is increased.
High initial concentration of cells has been found to improve the fermentability of hydrolysates containing toxic compounds. The reason for this is the higher volumetric conversion rates of inhibitors caused by the increased cell density (Almeida et al. 2007). In this continuous experiment, the initial OD was 20 (instead of e.g. OD 1) giving the cells a better chance to cope with the high concentrations of inhibitors in the hydrolysate. Also, it has been discovered that S. cerevisiae J672 has, to some extent, a natural ability to convert some inhibitors to less damaging compounds (Almeida et al. 2007). Starting with a high concentration of yeast cells will then clearly also be beneficial taking that aspect into view. D. bruxellensis CBS 11269 may most probably have similar converting abilities, making it equivalent to S. cerevisiae J672 in this aspect. Comparison between them should therefore be possible.

32
Figure 10 – Continuous culture experiment investigating the growth of D. bruxellensis CBS 11269 and S. cerevisiae J672 in different dilutions of hydrolysate batch 2 at 30°C. Mean values for the three wells that represented each yeast are shown. All cultures are grown in a medium containing (NH4)2SO4 2 g/L and yeast extract 5g/L. After ~49 h, 1:10 diluted hydrolysate batch 2 was used as the medium added back to the well. After ~145 h, 1:5 diluted hydrolysate batch 2 was used in the same manner. To be noted is the very low standard deviation for some of the samples taken.
Figure 11 – Ethanol yield from glucose in continuous culture with D. bruxellensis CBS 11269 and S. cerevisiae J672 at 30°C. The values for each staple are mean values from the time when that specific composition of medium occurred in the well (glucose: n=3, 1:10 dilution: n=6, 1:5 dilution: n=6). Glucose represents the initial preculture medium, 1:10 represents the 1:10 diluted hydrolysate batch 2 and 1:5 represents the 1:5 diluted hydrolysate batch 2. Data is based on HPLC analysis.
0
0,05
0,1
0,15
0,2
0,25
0,3
0,35
Glucose 1:10 1:5
[g ethan
ol/g glucose]
Ethanol yield from glucose from continuous experiment with D. bruxellensis CBS 11269 and S. cerevisiae J672 at 30°C
D. bruxellensis CBS 11269 S. cerevisiae J672

33
4.8 Continuous cultivation with simulation of cell recycling in fermenters with D. bruxellensis CBS 11269 and S. cerevisiae J672 with hydrolysate batch 2 at 30°C
To confirm the results in the continuous experiment, fermenters were used with the aim of having the same dilution rate of medium as in the continuous experiments in the microtiter wells. In this way the cells would become adapted to the components in the hydrolysate. Unfortunately, the scheduled specific dilution rate, 0.017 h-1 was not achieved from the beginning for D. bruxellensis CBS 11269. For S. cerevisiae J672, the dilution rate 0.017 h-1 was not achieved at all during the whole experiment. Therefore comparison between the yeasts for the different media compositions could not be done. Another difference between this experiment and the continuous in microtiter wells was the glucose concentration in the initial preculture medium. In the microtiter well experiment, the concentration was 30 g/L and in the fermenter experiments the concentration was 40 g/L, i.e. the same glucose concentration as in the undiluted hydrolysate.
The TVC curves for the two yeasts can be seen in Figure 12 and Figure 13. As the two yeasts had very different numbers of CFU, the scale is not the same in the figures. Due to a power cut which occurred during the experiment, the correct pH, temperature and stirring speed could not be held during those two hours. A decrease can be seen for D. bruxellensis CBS 11269 in Figure 12, which might be caused by the power cut as the samples were taken just before it happened but could not be analyzed until it was over. However, the OD measurements did not show any impact from the power cut, there a slight increase was observed later on instead, so what was shown in the total viable count might simply be a natural variation. Of course, when measuring OD on a sample, no difference is made between dead and viable cells, so some cells may have died from the power cut. The growth curve for S. cerevisiae J672 in Figure 13 was quite stable with only a slight natural variation and did not seem to be affected by the power cut.
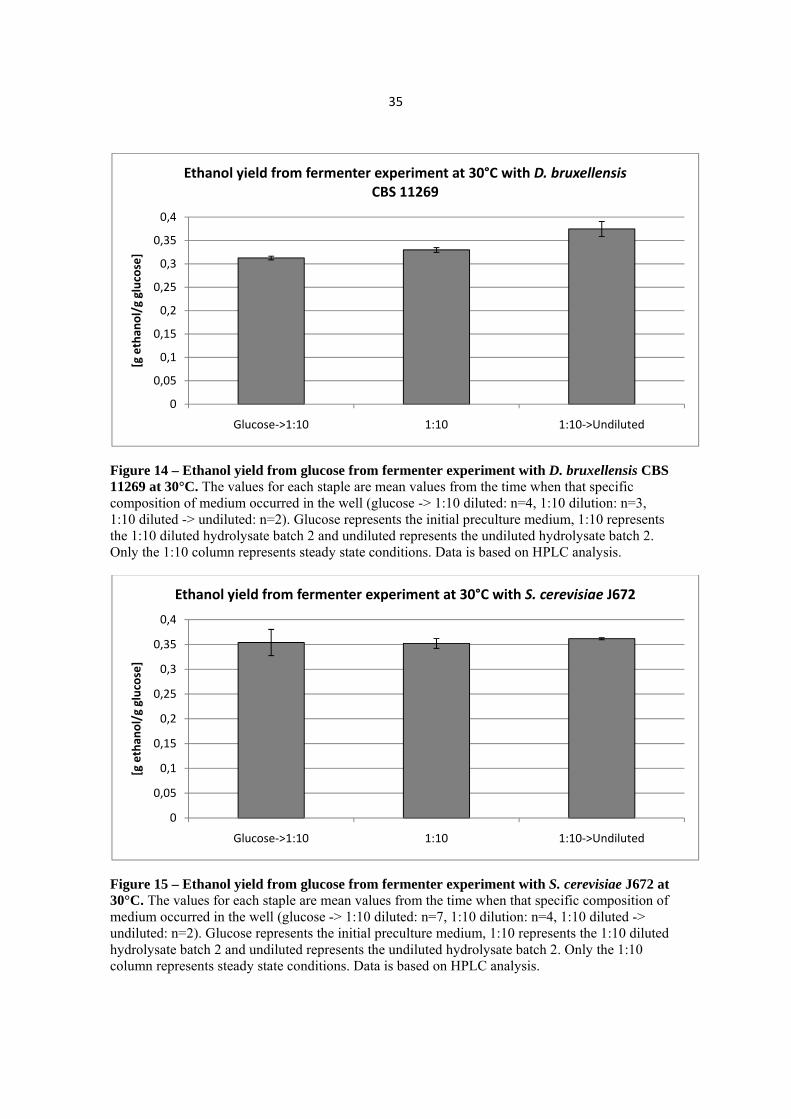
Based on HPLC analysis, the ethanol yield could be calculated for the fermentations (Figure 14 and Figure 15). As the dilution rate was not the same for D. bruxellensis CBS11269 and S. cerevisiae J672 no comparison could be made with regard to the ethanol yield. What can be seen is that the yield is more or less the same for the three different media compositions for S. cerevisiae J672, 0.35-0.36 g ethanol/g glucose (Figure 15) and with a slight increasing trend for D. bruxellensis CBS 11269, 0.31-0.37 g ethanol/g glucose (Figure 14). The ethanol yield is supposed to be measured during steady state conditions. In this case, steady state was only reached for the 1:10 diluted hydrolysate; the values in the other columns are therefore not from proper steady state conditions.

34
Figure 12 – Fermenter experiment investigating the growth of D. bruxellensis CBS 11269 in different concentrations of hydrolysate batch 2 at 30°C. All media pumped into the fermenter contained (NH4)2SO4 2 g/L and yeast extract 5g/L. After ~51 h, the infusion of 1:10 diluted hydrolysate batch 2 began. After ~193 h, that solution was replaced by undiluted hydrolysate batch 2. A power cut for nearly two hours occurred during the experiment. During that time, the proper pH, temperature and stirring speed could not be maintained. Standard deviation is seen for those time points where several YPD agar plates were used.
Figure 13 – Fermenter experiment investigating the growth of S. cerevisiae J672 in different concentrations of hydrolysate batch 2 at 30°C. All media pumped into the fermenter contained (NH4)2SO4 2 g/L and yeast extract 5g/L. After 23 h, the infusion of 1:10 diluted hydrolysate batch 2 began. After 261 h, that solution was replaced by undiluted hydrolysate batch 2. A power cut for nearly two hours occurred during the experiment. During that time, the proper pH, temperature and stirring speed could not be maintained.
35
Figure 14 – Ethanol yield from glucose from fermenter experiment with D. bruxellensis CBS 11269 at 30°C. The values for each staple are mean values from the time when that specific composition of medium occurred in the well (glucose -> 1:10 diluted: n=4, 1:10 dilution: n=3, 1:10 diluted -> undiluted: n=2). Glucose represents the initial preculture medium, 1:10 represents the 1:10 diluted hydrolysate batch 2 and undiluted represents the undiluted hydrolysate batch 2. Only the 1:10 column represents steady state conditions. Data is based on HPLC analysis.
Figure 15 – Ethanol yield from glucose from fermenter experiment with S. cerevisiae J672 at 30°C. The values for each staple are mean values from the time when that specific composition of medium occurred in the well (glucose -> 1:10 diluted: n=7, 1:10 dilution: n=4, 1:10 diluted -> undiluted: n=2). Glucose represents the initial preculture medium, 1:10 represents the 1:10 diluted hydrolysate batch 2 and undiluted represents the undiluted hydrolysate batch 2. Only the 1:10 column represents steady state conditions. Data is based on HPLC analysis.
0
0,05
0,1
0,15
0,2
0,25
0,3
0,35
0,4
Glucose‐>1:10 1:10 1:10‐>Undiluted
[g ethan
ol/g glucose]
Ethanol yield from fermenter experiment at 30°C with D. bruxellensisCBS 11269
0
0,05
0,1
0,15
0,2
0,25
0,3
0,35
0,4
Glucose‐>1:10 1:10 1:10‐>Undiluted
[g ethan
ol/g glucose]
Ethanol yield from fermenter experiment at 30°C with S. cerevisiae J672

36
5 Conclusions Two different batches of hydrolysate were made of which the second batch was used in most of the experiments as suspicions arose concerning the fact that autoclaving the lignocellulosic biomass could have increased the concentrations of inhibitors in the following hydrolysate. However, from the fermentation experiments it was discovered that also the second hydrolysate was very inhibitory and needed to be diluted before use.
The effect of adding (NH4)2SO4 2 g/L was in the experiments observed to at least not influence the cells negatively. Earlier results published by other authors states that (NH4)2SO4 has a significant effect on glucose consumption, growth and ethanol production for B. bruxellensis as long as the concentration is below 2 g/L (Uscanga et al. 2000). Based on this, the addition of (NH4)2SO4 2 g/L was continued throughout the experiments.
When it comes to growth of unadapted cells, D. bruxellensis CBS 11269 grew well only in 1:10 diluted hydrolysate while S. cerevisiae J672 grew in both 1:10 and 1:5 diluted hydrolysate. However, to enable growth of D. bruxellensis CBS 11269, yeast extract 5 g/L was discovered to be an essential component as a source of vitamins. For S. cerevisiae J672, growth was obtained without extra added vitamins in the dilutions previously mentioned. However, the growth of the yeast was improved when yeast extract 5 g/L was added. These results agree with what has been observed by others (Uscanga et al. 2000). These authors also stated that yeast extract has an important and significant role in the process of growth for B. bruxellensis. They had observed a linear relationship between the increase in synthesized biomass and the concentration of yeast extract added. Other evidence that stated its importance was the change in morphology to the B. bruxellensis cells in the absence of yeast extract.
In the continuous experiment with cells adapted to the hydrolysate and at high cell concentration, both yeasts had a stable growth showing the beneficial effect of adapted cells in high number. There was no clear difference in ethanol yields between D. bruxellensis CBS 11269 and S. cerevisiae J672. In the fermenter experiment, no comparison could be made between the two yeasts, but the effect of adaptation is seen here as well, as the yeasts seem not to be negatively influenced by increasing concentrations of the hydrolysate. Also, here, the cell number was reasonably high, as the fermenters were run in batch mode before the continuous part started. It is therefore difficult to distinguish which of these two aspects that affected the growth of yeasts the most to grow in the increasing concentration of hydrolysate.
37
Suggestions for further studies
Fermenter experiments where the dilution rate is the same for both D. bruxellensis CBS 11269 and S. cerevisiae J672 during the whole experimental time so that comparison can be done.
Experiments with higher dilution rates as the specific rate used in the experiments here is rather low.
Additional dilution experiments to determine the highest concentration of hydrolysate in which the yeast can grow well in.
Experiments with the first batch of hydrolysate (where the SEAS had been autoclaved) to determine whether yeast growth is possible to achieve when diluting it.
Differences between hydrolysates made using different lignocellulosic material when it comes to carbohydrate concentrations (especially glucose), yeast growth and ethanol yield.
Continuous experiments at temperatures other than 30°C to determine optimal temperature for growth when cells are recirculated.
Further experiments using adapted cells which are directly subjected to undiluted hydrolysate (containing yeast extract) and see how well they grow in regard to the specific medium composition.
Further research to discover characteristics that differ between D. bruxellensis CBS 11269 and S. cerevisiae J672 when it comes to ethanol production from different materials.

38
6 Acknowledgements I would like to thank..
…My supervisors Johanna Blomqvist and Volkmar Passoth and my examiner Karin Jacobsson at the Department of Microbiology at SLU in Uppsala for their support and help and for the interesting discussions we have had during my time at SLU.
…Jerry Ståhlberg, Majid Haddad Momeni, Henrik Hansson and Mats Sandgren at the Department of Molecular Biology at SLU in Uppsala for their help concerning the aspen sawdust.
…The other members in the “3377 lab” for their company and help.
…All the other people at the Department of Microbiology at SLU in Uppsala who have helped me and enlarged my knowledge of microbiology.
39
7 References Almeida J RM, Modig T, Petersson A, Hähn-Hägerdal B, Lidén G, Gorwa-Grauslund M F 2007. Increased tolerance and conversion of inhibitors in lignocellulosic hydrolysates by Saccharomyces cerevisiae. J Chem Technol Biotechnol 82: 340-349.
Alvira P, Tomás-Pejó E, Ballesteros M, Negro M J 2010. Pretreatment technologies for an efficient bioethanol production process based on enzymatic hydrolysis: A review. Bioresour Technol 101: 4851-4861.
Blomqvist J, Eberhard T, Schnürer J, Passoth V 2010. Fermentation characteristics of Dekkera bruxellensis strains. Appl Microbiol Biotechnol: DOI 10.1007/s00253-010-2619-y.
Brandam C, Castro-Martínez C, Délia ML, Ramón-Portugal F, Strehaiano P 2008. Effect of temperature on Brettanomyces bruxellensis: metabolic and kinetic aspects. Can J Microbiol 54: 11-18.
de Carvalho D, Ingvarsson P K, Joseph J, Suter L, Sedivy C, Macava-Sanz D, Cottrell J, Heinze B, Schanzer I, Lexer C 2010. Admixture facilitates adaptation from standing variation in the European aspen (Populus tremula L.), a widespread forest tree. Mol Ecol 19: 1638-1650.
de Souza Liberal A T, Basílio A C M, do Monte Resende A, Brasileiro B T V, da Silva-Filho E A, de Morais J O F, Simões D A, de Morais Jr M A 2007. Identification of Dekkera bruxellensis as a major contaminant yeast in continuous fuel ethanol fermentation. J Appl Microbiol 102: 538-547.
Delgenes J P, Laplace J M, Moletta R, Navarro J M 1996. Comparative study of separated fermentations and cofermentation processes to produce ethanol from hardwood derived hydrolysates. Biomass Bioenergy 11: 353-360.
Demain A L 2009. Biosolutions to the energy problem. J Ind Microbiol Biotechnol 36: 319-332.
Feinberg M, San-Redon J, Assié A 2009. Determination of complex polysaccharides by HPAE-PAD in foods: Validation using accuracy profile. J Chromatography B 877: 2388-2395.
Jahnel J B, Ilieve P, Frimmel F H 1998. HPAE-PAD – a sensitive method for the determination of carbohydrates. Fresen J Anal Chem 360: 827-829.
Klinke H B, Thomsen A B, Ahring B K 2004. Inhibition of ethanol-producing yeast and bacteria by degradation products produced during pre-treatment of biomass. Appl Microbiol Biotechnol 66: 10-26.
40
Klinke H B, Olsson L, Thomsen A B, Ahring B K 2003. Potential inhibitors from wet oxidation of wheat straw and their effect on ethanol production of Saccharomyces cerevisiae: Wet oxidation and fermentation by yeast. Biotechnol Bioeng 81:6: 738-747.
Kumar P, Barrett D M, Delwiche M J, Stroeve P 2009. Methods for pretreatment of lignocellulosic biomass for efficient hydrolysis and biofuel production. Ind Eng Chem Res 48: 3713-3729.
Laureysens I, de Temmerman L, Hastir T, van Gysel M, Ceulemans R 2005. Clonal variation in heavy metal accumulation and biomass production in a poplar coppice culture. II. Vertical distribution and phytoextraction potential. Environ Pollut 133: 541-551.
Loureiro V, Malfeito-Ferreira M 2003. Spoilage yeasts in the wine industry. Int J Food Microbiol 86: 23-50.
Meroth C B, Hammes W P, Hertel C 2003. Identification and population dynamics of yeasts in sourdough fermentation processes by PCR-denaturing gradient gel electrophoresis. Appl Environ Microbiol 69: 7453-7461.
Nikula S, Vapaavuori E, Manninen S 2010. Urbanization-related changes in European aspen (Populas tremula L.): Leaf traits and litter decomposition. Environ Pollut 158: 2132-2142.
Olofsson K, Bertilsson M, Lidén G 2008. A short review on SSF – an interesting process option for ethanol production from lignocellulosic feedstocks. Biotechnol Biofuels 2008 1:7.
Olsson L, Hahn-Hägerdal B 1996. Fermentation of lignocellulosic hydrolysates for ethanol production. Enz Microbial Technol 18: 312-331.
Palmqvist E, Hahn-Hägerdal B 2000. Fermentation of lignocellulosic hydrolysates. II: inhibitors and mechanisms of inhibition. Bioresour Technol 74: 25-33.
Passoth V, Blomqvist J, Schnürer J 2007. Dekkera bruxellensis and Lactobacillus vini form a stable ethanol-producing consortium in a commercial alcohol production process. Appl Environ Microbiol 73: 4354-4356.
Sassner P, Galbe M, Zacchi G 2005. Steam pretreatment of Salix with and without SO2 impregnation for production of bioethanol. Appl Biochem Biotechnol 121-124: 1101-1118.
Teh KY, Lutz A E 2010. Thermodynamic analysis of fermentation and anaerobic growth of baker’s yeast for ethanol production. J Biotechnol 147: 80-87.
41
Uscanga M G A, Delia ML, Strehaiano P 2000. Nutritional requirements of Brettanomyces bruxellensis: Growth and physiology in batch and chemostat cultures. Can J Microbiol 46: 1046-1050.
van Nedervelde L, Debourg A 1995. Properties of Belgian acid beers and their microflora. II. Biochemical properties of Brettanomyces yeasts. Cerevisia Biotechnol 20: 43-48.

42
8 Appendix Table 2 – Data for moisture analysis on steam exploded aspen sawdust. The weight of the three replicates before and after heating, together with the estimated percentage of dry matter is shown. The estimated percentage of dry matter is also multiplied with the weight of the material before the heating to see that it corresponds with the weight the material had after heating.
Replicate
Weight before heating [g]
Weight after heating [g]
Estimated percentage of dry
matter [%]
Estimated percentage of dry matter
multiplied with the weight before heating
[g]
Average value of the
percentage of dry matter [%]
1 3.61 1.7 47.31 1.71
2 3.44 1.6 46.37 1.60
3 3.68 1.8 47.17 1.74
46.95

43
Table 3 – Result from carbohydrate analysis of hydrolysate batch 1. The amounts of different carbohydrates in hydrolysate batch 1 after HPAE-PAD analysis. To be noted, is that the hydrolysate was left over night between “Day 8” and “Day 8, final hydrolysate”, which probably explains the increased concentrations of galactose and mannose as enzymes, still active, were present in the solution.
Carbohydrate
Arabinose [mg/L]
Galactose [mg/L]
Glucose[mg/L]
Xylose [mg/L]
Mannose [mg/L]
Cellobiose [mg/L]
Day 1, before adding enzymes
3.3980 12.3488 313.9101 195.5802 61.7047 66.8763
Day 1, after adding enzymes
3.2424 19.2934 642.1390 243.8973 102.6611 12.6605
Day 2 0 0 8 879.9875 257.7684 0 531.4651
Day 3 0 0 13 499.6057 456.4650 0 851.1148
Day 4 0 0 18 511.7938 663.9264 0 1 001.2520
Day 5 0 0 23 967.7295 928.9302 171.0958 951.2216
Day 8 0 0 49 283.9197 2 193.9353 0 1 164.8756
Day 8, final hydrolysate
0 18.17075 23 145.24465 1 008.82585 253.87905 596.14955
Table 4 – Result from carbohydrate analysis of hydrolysate batch 2. The amounts of different carbohydrates in the two bottles in hydrolysate batch 2 and the final hydrolysate concentrations after HPAE-PAD analysis. To be noted, are the relatively low values for xylose and mannose from the sample “Day 8, final hydrolysate”. These values should be mean values from the concentrations from two bottles, although for xylose and mannose, this does not seem to be the case. A possible explanation to this could be a certain inaccuracy in the HPAE-PAD analysis.
Carbohydrate
Arabinose [mg/L]
Galactose [mg/L]
Glucose[mg/L]
Xylose [mg/L]
Mannose [mg/L]
Cellobiose [mg/L]
Day 1 No 1, after adding enzymes
5.504 41.490 799.248 339.043 168.307 18.751
Day 1 No 2, after adding enzymes
5.846 45.064 796.190 338.544 177.151 18.295
Day 2 No 1 0 33.599 15 325.211 728.343 158.089 1 089.607
Day 2 No 2 0 39.462 16 668.359 823.543 169.760 1 178.776
Day 3 No 1 0 49.707 23 645.203 1 662.064 664.663 1 312.815
Day 3 No 2 0 0 21 043.834 1 507.922 552.057 1 195.697
Day 4 No 1 0 46.323 23 221.297 1 333.579 243.854 972.838
Day 4 No 2 0 65.272 25 766.048 1 288.856 431.421 961.156
Day 5 No 1 0 94.300 37 085.820 2 881.353 1 197.900 1 203.379
Day 5 No 2 0 94.753 33 996.559 2 697.412 1 079.166 1 115.019
Day 8 No 1 0 0 36 588.117 1 957.422 415.936 563.861
Day 8 No 2 0 106.970 43 599.689 3 315.217 1 364.838 685.978
Day 8, final hydrolysate
0 0 39 821.684 1 804.069 410.516 593.213

44
Table 5 – Result from HPLC analysis for determination of compounds after continuous experiment with D. bruxellensis CBS 11269 at 30°C. Data is shown for the three replicates in regard to concentrations (g/L) of glucose, glycerol, acetate and ethanol during the experimental time.
D. bruxellensis CBS 11269
Time [h]
0
25.33
49.25
73.33
98.33
121.08
145.25
169.83
193.33
217.25
240.92
Replicate A
Glucose 30.0687 0 0 0 0 0 0 0 0 0.050387 0
Glycerol 0.092368 0.197517 0.2567 0.358316 0.520874 0.5645 0.985048 0.665434 0.619142 0.072686 0.554571
Acetate 0.16483 0.316516 0.42179 0.907294 1.62675 1.72619 3.0833 2.47818 2.4305 3.0604 2.637161
Ethanol 0.736668 10.83322 7.28142 6.88926 7.72724 7.36416 12.37262 6.77202 6.1167 7.09588 6.215034
Replicate B
Glucose 29.64468 0 0 0 0 0 0 0 0 0 0
Glycerol 0 0.178229 0.228572 0.418296 0.496564 0.543844 0.680058 0.92298 0.713414 0.674048 0.545886
Acetate 0.152956 0.278358 0.42433 0.968908 1.653156 1.632218 2.11472 3.42982 2.76586 2.82992 2.531609
Ethanol 0.299456 10.06922 6.94634 7.45504 8.908 7.59842 9.01568 10.59538 7.88334 7.3559 6.406397
Replicate C
Glucose 27.2462 0 0 0 0 0 0 0 0 0 0.016061
Glycerol 0 0.169514 0.229222 0.502588 0.445302 0.714652 0.60307 0.662148 0.72064 0.721692 0.604936
Acetate 0.145074 0.334338 0.41893 1.208938 1.452682 2.1558 1.886856 2.5117 2.8755 2.98462 2.599071
Ethanol 0.31334 9.40348 6.142 8.36124 6.81442 9.02468 6.95736 6.88486 6.9969 6.76024 5.909449
Table 6 – Result from HPLC analysis for determination of compounds after continuous experiment with S. cerevisiae J672 at 30°C. Data is shown for the three replicates in regard to concentrations (g/L) of glucose, glycerol, acetate and ethanol during experimental time.
S. cerevisiae J672
Time [h]
0
25.33
49.25
73.33
98.33
121.08
145.25
169.83
193.33
217.25
240.92
Replicate A
Glucose 19.6716 0 0 0 0 0 0 0 0 0 0.03519
Glycerol 0.848394 1.671264 1.308384 1.55186 1.30563 1.310024 1.327614 1.053964 1.014226 0.828612 0.638807
Acetate 0.248022 0.41099 0.326828 0.732016 0.944786 1.156356 1.32704 1.786284 2.425 2.44098 2.145946
Ethanol 3.4666 9.09974 6.06412 6.97762 6.64582 7.53828 6.67242 7.14384 8.26498 7.61048 6.556364
Replicate B
Glucose 19.54508 0 0 0 0 0.069409 0 0.066378 0.075459 0 0
Glycerol 0.877688 1.36342 1.366384 1.594218 1.381458 1.352972 1.789014 1.034414 0.821354 0.83586 0.569818
Acetate 0.295828 0.29092 0.345474 0.75597 1.046704 1.166556 1.801286 1.667568 1.758072 2.30062 2.071371
Ethanol 3.32826 8.21826 6.7275 8.11694 7.7774 8.44774 12.4675 7.5583 6.87648 8.10968 7.21238
Replicate C
Glucose 16.1548 0 0 0 0 0.109218 0.074406 0 0 0 0
Glycerol 0.999318 1.688174 1.740936 1.741396 1.261636 2.02996 1.197168 1.07648 0.999166 0.869776 0.550995
Acetate 0.243474 0.38584 0.416814 0.880858 0.940914 1.720362 1.199324 1.750614 2.22754 2.33558 2.098633
Ethanol 4.34248 9.23566 8.1512 8.76466 6.5014 11.87278 7.5456 7.14478 7.77574 7.5916 7.112412