Feldman (2001) Bayesian contour integrationwexler.free.fr/library/files/feldman (2001) bayesian...
12
Perception & Psychophysics 2001, 63 (7), 1171-1182 Perceptual grouping is the process whereby individual items in the visual image are aggregated into larger struc- tures. Grouping is known to influence many low-level vi- sual computations, such as the perception of lightness (Adelson, 1993; Gilchrist, 1977), the perception of mo- tion (Shimojo & Nakayama, 1990;Weiss & Adelson, 1998), and visual search (He & Nakayama, 1992; Treis- man, 1982). Yet the process by which a grouping inter- pretation is chosen, often described in terms of somewhat vague and poorly understood Gestalt principles, has proven difficult to characterize precisely. Perhaps the main obsta- cle has been the difficulty in specifying in a mathemati- cally rigorous way the various candidate interpretations from which the visual system unconsciously chooses, and the function determining subjective preference among these interpretations. This paper attempts to develop such a theory in the specific case of contour integration —that is, the aggregation of a sequence of visual items into a vir- tual curve—and then to test the predictions of this model against the judgments of human observers. Bayesian Approaches to Perception A natural candidate for a rigorous model is Bayesian probability theory, which has often been advocated as an optimal method for making decisions under conditions of uncertainty (Jaynes, 1983) and has recently attracted a great deal of interest among investigators of human vision (Bülthoff & Yuille, 1991; Knill & Richards, 1996; Landy Maloney, Johnston, & Young, 1995). Bayesian or quasi- Bayesian models have been brought to bear on the inter- pretation of motion (Weiss & Adelson, 1998) and surfaces (Mamassian & Landy, 1998; Nakayama & Shimojo, 1992), recognition of objects (Liu, Knill, & Kersten, 1995), clas- sification of shapes (Feldman, 2000), and combination of distinct cue sources (Landy et al., 1995; Yuille & Bülthoff, 1996). The application of Bayesian theory to grouping may be more difficult than in these other cases, because, in grouping, the target inference—the “best grouping”—is difficult to describe formally and, arguably, might not admit an objective definition (this issue is discussed below). A fully realized Bayesian theory of human percep- tual grouping would need to spell out the observer’s sub- jective model of what alternative grouping hypotheses are possible, how they might give rise to possible image con- figurations, and with what likelihoods. In Bayesian theory, the degree of belief in a perceptual hypothesis H 0 (henceforth called the target hypothesis or target interpretation) given image I is expressed by the posterior probability : (1) where H 0 , H 1 , . . . are candidate interpretations, p(H i ) is the prior probability of hypothesis H i , and p(I | H i ), called a likelihood term, is the probability that the observed image I would be generated by the hypothesis H i . The likelihood term is a measure of fit between the hypothesis under consideration and the image configuration. The prospect pH I pI H pH pI H pH i i i ( | ) ( | )( ) ( | )( ) , 0 0 0 = å 1171 Copyright 2001 Psychonomic Society, Inc. This work was supported by National Science Foundation Grant SBR-9875175. I am grateful to G. John Andersen and two anonymous reviewers for helpful comments on the manuscript and to Henry Chi for assistance in data collection. Address correspondence to J. Feldman, De- partment of Psychology, Center for Cognitive Science, Rutgers Univer- sity, Busch Campus, New Brunswick, NJ 08903 (e-mail: jacob@ruccs. rutgers.edu). Bayesian contour integration JACOB FELDMAN Rutgers University, New Brunswick, New Jersey The process by which the human visual system parses an image into contours, surfaces, and ob- jects—perceptual grouping—has proven difficult to capture in a rigorous and general theory. A natural candidate for such a theory is Bayesian probability theory, which provides optimal interpretations of data under conditions of uncertainty. But the fit of Bayesian theory to human grouping judgments has never been tested, in part because methods for expressing grouping hypotheses probabilistically have not been available. This paper presents such methods for the case of contour integration —that is, the aggregation of a sequence of visual items into a “virtual curve.” Two experiments are reported in which human subjects were asked to group ambiguous configurations of dots (in Experiment 1, a sequence of five dots could be judged to contain a “corner” or not; in Experiment 2, an arrangement of six dots could be judged to fall into two disjoint contours or one smooth contour). The Bayesian theory ac- counts extremely well for subjects’ judgments, explaining more than 75% of the variance in both tasks. The theory thus provides a far more quantitatively precise account of human contour integration than has been previously possible, allowing a very precise calculation of the subjective goodness of a vir- tual chain of dots. Because Bayesian theory is inferentially optimal, this finding suggests a “rational jus- tification,” and hence possibly an evolutionary rationale, for some of the rules of perceptual grouping.
Transcript of Feldman (2001) Bayesian contour integrationwexler.free.fr/library/files/feldman (2001) bayesian...
Perception amp Psychophysics2001 63 (7) 1171-1182
Perceptual grouping is the process whereby individualitems in the visual image are aggregated into larger struc-tures Grouping is known to influence many low-level vi-sual computations such as the perception of lightness(Adelson 1993 Gilchrist 1977) the perception of mo-tion (Shimojo amp Nakayama 1990Weiss amp Adelson1998) and visual search (He amp Nakayama 1992 Treis-man 1982) Yet the process by which a grouping inter-pretation is chosen often described in terms of somewhatvague and poorly understood Gestalt principles has provendifficult to characterize precisely Perhaps the main obsta-cle has been the difficulty in specifying in a mathemati-cally rigorous way the various candidate interpretationsfrom which the visual system unconsciously chooses andthe function determining subjective preference amongthese interpretations This paper attempts to develop such atheory in the specific case of contour integrationmdashthat isthe aggregation of a sequence of visual items into a vir-tual curvemdashand then to test the predictions of this modelagainst the judgments of human observers
Bayesian Approaches to PerceptionA natural candidate for a rigorous model is Bayesian
probability theory which has often been advocated as anoptimal method for making decisions under conditions of
uncertainty (Jaynes 1983) and has recently attracted agreat deal of interest among investigators of human vision(Buumllthoff amp Yuille 1991 Knill amp Richards 1996 LandyMaloney Johnston amp Young 1995) Bayesian or quasi-Bayesian models have been brought to bear on the inter-pretation of motion (Weiss amp Adelson 1998) and surfaces(Mamassian amp Landy 1998 Nakayama amp Shimojo 1992)recognition of objects (Liu Knill amp Kersten 1995) clas-sification of shapes (Feldman 2000) and combination ofdistinct cue sources (Landy et al 1995 Yuille amp Buumllthoff1996) The application of Bayesian theory to groupingmay be more difficult than in these other cases because ingrouping the target inferencemdashthe ldquobest groupingrdquomdashisdifficult to describe formally and arguably might notadmit an objective definition (this issue is discussedbelow) A fully realized Bayesian theory of human percep-tual grouping would need to spell out the observerrsquos sub-jective model of what alternative grouping hypotheses arepossible how they might give rise to possible image con-figurations and with what likelihoods
In Bayesian theory the degree of belief in a perceptualhypothesis H0 (henceforth called the target hypothesis ortarget interpretation) given image I is expressed by theposterior probability
(1)
where H0 H1 are candidate interpretations p(Hi) is theprior probability of hypothesis Hi and p(I |Hi) called alikelihood term is the probability that the observed imageI would be generated by the hypothesis Hi The likelihoodterm is a measure of fit between the hypothesis underconsideration and the image configuration The prospect
p H Ip I H p H
p I H p Hi i i
( | )( | ) ( )
( | ) ( )0
0 0=aring
1171 Copyright 2001 Psychonomic Society Inc
This work was supported by National Science Foundation GrantSBR-9875175 I am grateful to G John Andersen and two anonymousreviewers for helpful comments on the manuscript and to Henry Chi forassistance in data collection Address correspondence to J Feldman De-partment of Psychology Center for Cognitive Science Rutgers Univer-sity Busch Campus New Brunswick NJ 08903 (e-mail jacobruccsrutgersedu)
Bayesian contour integration
JACOB FELDMANRutgers University New Brunswick New Jersey
The process by which the human visual system parses an image into contours surfaces and ob-jectsmdashperceptual groupingmdashhas proven difficult to capture in a rigorous and general theory A naturalcandidate for such a theory is Bayesian probability theory which provides optimal interpretations ofdata under conditions of uncertainty But the fit of Bayesian theory to human grouping judgments hasnever been tested in part because methods for expressing grouping hypotheses probabilistically havenot been available This paper presents such methods for the case of contour integrationmdashthat is theaggregation of a sequence of visual items into a ldquovirtual curverdquo Two experiments are reported in whichhuman subjects were asked to group ambiguous configurations of dots (in Experiment 1 a sequenceof five dots could be judged to contain a ldquocornerrdquo or not in Experiment 2 an arrangement of six dotscould be judged to fall into two disjoint contours or one smooth contour) The Bayesian theory ac-counts extremely well for subjectsrsquo judgments explaining more than 75 of the variance in both tasksThe theory thus provides a far more quantitatively precise account of human contour integration thanhas been previously possible allowing a very precise calculation of the subjective goodness of a vir-tual chain of dots Because Bayesian theory is inferentially optimal this finding suggests a ldquorational jus-tificationrdquo and hence possibly an evolutionary rationale for some of the rules of perceptual grouping
1172 FELDMAN
of formulating a Bayesian model of grouping hinges onthe construction of suitable likelihood terms for group-ing hypotheses
We focus on the case of grouping individual visualitems (dots edge fragments etc) into smooth contoursa process known to occur early and to be essential in theconstruction of visual representations (Caelli amp Uman-sky 1976 Glass 1969) The visual systemrsquos tendency toextract approximately collinear patterns from the imagehas been investigated in some detail (Feldman 1996 1997Pizlo Salach-Golyska amp Rosenfeld 1997 Smits amp Vos1987 Smits Vos amp van Oeffelen 1985) Yet there is stillno quantitative model that will predict both (1) the subjec-tive coherence of a dot pattern as a function of its geom-etry and (2) the particular grouping interpretation that ahuman observer will perceive in an ambiguous configura-tion (eg the particular assignment of dots to distinct vir-tual curves Moreover what is known about the quantita-tive properties of curve grouping does not afford anyconvenient mathematical generalization to other types ofgrouping problems such as grouping into surfaces and ob-jects Such a generalization might be provided by Bayesiantheory which is in principle completely general in its ap-plication
A major obstacle is the lack of a model for how the sys-tem combines the many local estimates of collinearity(eg the outputs of local orientation-tuned cells) into a sin-gle global judgment of curve coherence a problem some-times referred to as cooperativity (Kubovy amp Wagemans1995 Zucker Stevens amp Sander 1983) It is believed thatraw judgments of collinearity propagate laterally in visualcortex (Field Hayes amp Hess 1993) but the mathematicalform of the combination rule is unknown Arguments fromdifferential geometry suggest that along a smooth curvesampled at intervals to produce visible points successiveangles between points should tend to be collinear and theimplicit curve should be well approximated by the localtangent (Parent amp Zucker 1989) But such arguments donot specify exactly how much deviation from collinearityshould suppress the impression of a subjective curve norhow successive angles should interact (ie the combina-tion rule) These lacunae need to be repaired in order toconstruct suitable subjective likelihood functions
A Bayesian Model of Smooth CurvesEarlier studies (Feldman 1996 1997) have suggested
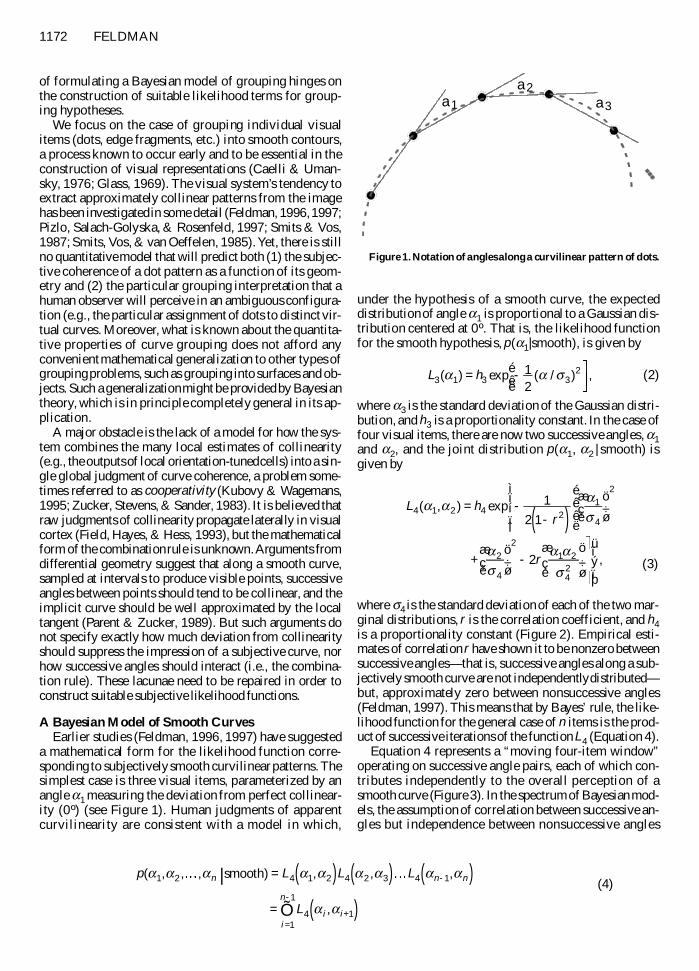
a mathematical form for the likelihood function corre-sponding to subjectively smooth curvilinear patterns Thesimplest case is three visual items parameterized by anangle a1 measuring the deviation from perfect collinear-ity (0ordm) (see Figure 1) Human judgments of apparentcurvilinearity are consistent with a model in which
under the hypothesis of a smooth curve the expecteddistribution of angle a1 is proportional to a Gaussian dis-tribution centered at 0ordm That is the likelihood functionfor the smooth hypothesis p(a1|smooth) is given by
(2)
where a3 is the standard deviation of the Gaussian distri-bution and h3 is a proportionality constant In the case offour visual items there are now two successive angles a1and a2 and the joint distribution p(a1 a2 | smooth) isgiven by
(3)
where s4 is the standard deviation of each of the two mar-ginal distributions r is the correlation coefficient and h4is a proportionality constant (Figure 2) Empirical esti-mates of correlation r have shown it to be nonzero betweensuccessive anglesmdashthat is successive angles along a sub-jectively smooth curve are not independently distributedmdashbut approximately zero between nonsuccessive angles(Feldman 1997) This means that by Bayesrsquo rule the like-lihood function for the general case of n items is the prod-uct of successive iterations of the function L4 (Equation 4)
Equation 4 represents a ldquomoving four-item windowrdquooperating on successive angle pairs each of which con-tributes independently to the overall perception of asmooth curve (Figure 3) In the spectrum of Bayesian mod-els the assumption of correlation between successive an-gles but independence between nonsuccessive angles
L hr
r
4 1 2 4 21
4
2
2
4
21 2
42
1
2 1
2
( ) exp
a a as
as
a as
= --( )
aeligegraveccedil
oumloslashdivide
eacute
euml
ecircecirc
igraveiacuteiuml
icirciuml
+aeligegraveccedil
oumloslashdivide
-aelig
egraveccedil
ouml
oslashdivide
uumlyacuteiuml
thorniuml
L h3 1 3 321
2( ) exp ( ) a a s= -eacute
eumlecirc
a3
aa
12
Figure 1 Notation of angles along a curvilinear pattern of dots
p L L L
L
n n n
i
n
i i
( | )
a a a a a a a a a
a a
1 2 4 1 2 4 2 3 4 1
41
1
1
smooth = ( ) ( ) ( )= ( )
-
=
-
+Otilde(4)
BAYESIAN CONTOUR INTEGRATION 1173
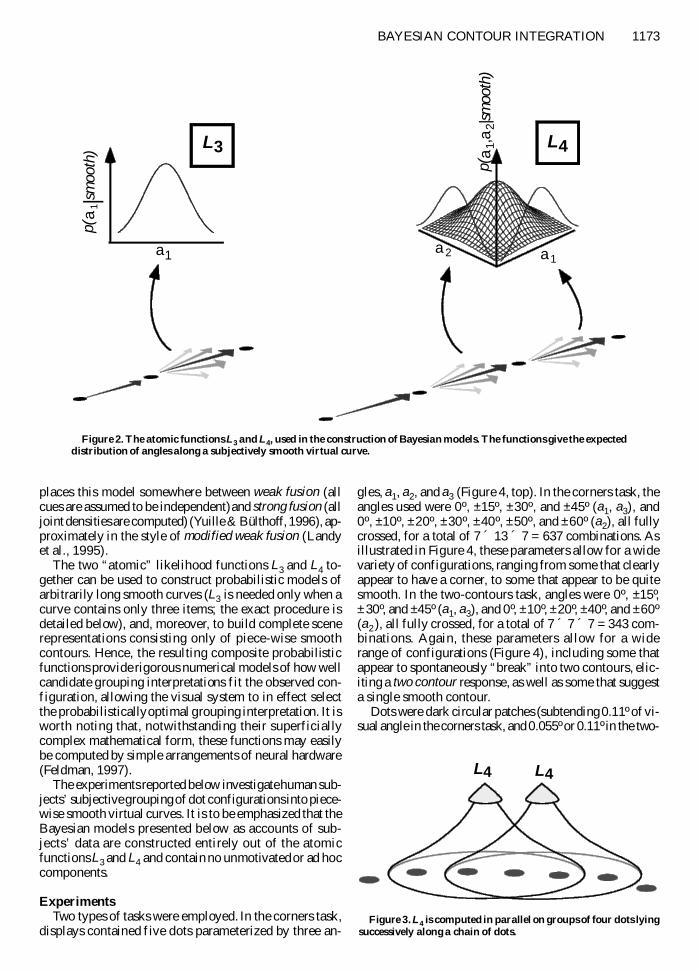
places this model somewhere between weak fusion (allcues are assumed to be independent) and strong fusion (alljoint densities are computed) (Yuille amp Buumllthoff 1996) ap-proximately in the style of modified weak fusion (Landyet al 1995)
The two ldquoatomicrdquo likelihood functions L3 and L4 to-gether can be used to construct probabilistic models ofarbitrarily long smooth curves (L3 is needed only when acurve contains only three items the exact procedure isdetailed below) and moreover to build complete scenerepresentations consisting only of piece-wise smoothcontours Hence the resulting composite probabilisticfunctions provide rigorous numerical models of how wellcandidate grouping interpretations fit the observed con-figuration allowing the visual system to in effect selectthe probabilistically optimal grouping interpretation It isworth noting that notwithstanding their superficiallycomplex mathematical form these functions may easilybe computed by simple arrangements of neural hardware(Feldman 1997)
The experiments reported below investigate human sub-jectsrsquo subjective grouping of dot configurations into piece-wise smooth virtual curves It is to be emphasized that theBayesian models presented below as accounts of sub-jectsrsquo data are constructed entirely out of the atomicfunctions L3 and L4 and contain no unmotivated or ad hoccomponents
ExperimentsTwo types of tasks were employed In the corners task
displays contained five dots parameterized by three an-
gles a1 a2 and a3 (Figure 4 top) In the corners task theangles used were 0ordm plusmn15ordm plusmn30ordm and plusmn45ordm (a1 a3) and0ordm plusmn10ordm plusmn20ordm plusmn30ordm plusmn40ordm plusmn50ordm and plusmn60ordm (a2) all fullycrossed for a total of 7 acute 13 acute 7 = 637 combinations Asillustrated in Figure 4 these parameters allow for a widevariety of configurations ranging from some that clearlyappear to have a corner to some that appear to be quitesmooth In the two-contours task angles were 0ordm plusmn15ordmplusmn30ordm and plusmn45ordm (a1 a3) and 0ordm plusmn10ordm plusmn20ordm plusmn40ordm and plusmn60ordm(a2 ) all fully crossed for a total of 7 acute 7 acute 7 = 343 com-binations Again these parameters allow for a widerange of configurations (Figure 4) including some thatappear to spontaneously ldquobreakrdquo into two contours elic-iting a two contour response as well as some that suggesta single smooth contour
Dots were dark circular patches (subtending 011ordm of vi-sual angle in the corners task and 0055ordm or 011ordm in the two-
p(a 1
a2|s
moo
th)
a2 a1
L4
a1
p(a
1 |sm
ooth
) L3
Figure 2 The atomic functions L3 and L4 used in the construction of Bayesian models The functions give the expecteddistribution of angles along a subjectively smooth virtual curve
L4 L4
Figure 3 L4 is computed in parallel on groups of four dots lyingsuccessively along a chain of dots
1174 FELDMAN
contours task) on a uniform white background displayedat high contrast in a darkened room at a 60-cm viewingdistance with observersrsquo heads fixed by a chinrest
In the corners task each configuration was displayedin a randomly chosen orientation In the two-contourstask configurations were presented upright as in Figure 4(That is each figure was displayed so that the secondand third dots were at the same height as each other andlikewise the fourth and fifth dots) Nineteen naive sub-jects were asked to judge on a 1ndash5 scale whether the dotstraced out a corner or a single smooth curve (1 = defi-nitely a smooth curve 5 = definitely a corner) In the two-contours task displays contained six dots again parame-terized by three angles a1 a2 and a3 (Figure 4 bottom)(In addition two stimulus sizes were employed but noscale effects were found and henceforth the data are pre-sented collapsed across scale) Seventeen naive subjectsnone of whom had participated in the corners experimentwere asked to rate whether the display contained two dis-tinct smooth contours or one long smooth contour againon a 1ndash5 scale (1 = definitely one smooth contour 5 =definitely two smooth contours) Subjectsrsquo mean ratingsof each condition after normalization to the interval (01)were taken to represent the subjectsrsquo a posteriori beliefthat the stimulus configuration belonged to the target in-terpretation
The two tasks were chosen in order to reflect two fun-damental modes of contour extraction Dots can be as-signed to two completely disjoint contours or they can beassigned to two distinct sections of the same contour thatare separated by a perceived tangent discontinuity (Linkamp Zucker 1987) One of the advantages of a Bayesian ap-proach is the possibility of treating these two modes of
grouping in a theoretically uniform manner and in factboth Bayesian models described below (one for each task)draw on the same probabilistic vocabularymdashnamely thefunctions L3 and L4
Bayesian Models of the Two TasksIn each task several grouping interpretations are possi-
ble some leading to the target interpretation (corner ortwo contours respectively) others leading to the percep-tion of a single smooth contour One immediate compli-cation is that in each task there are several different per-ceptually distinct interpretations that all lead to the targetresponse Consider first the corners task In this task onemay perceive a corner at the central dot denote this inter-pretation by Hc Alternatively one may perceive a cornerat either the second or the fourth dot again leading to acorner response denote these interpretations by Hccent andHcsup2 Counterposed to these is the smooth interpretation HsAll hypotheses under consideration are depicted schemat-ically in Figures 5 (corners) and 6 (two-contours)
For any hypothesis Hi denote by Pi the productp(Hi)p(I | Hi) of its prior and its likelihood By Bayesrsquorule the probability of the target response (corner re-gardless of where the corner is perceived) is
(5)
where h is a free scaling factor relating this expression tothe subjectsrsquo numeric ratings Likelihood functions p(I|Hi)were constructed for each interpretation in the followingmanner Three dots at an angle a1 are assigned likelihoodL3(a1) Four or more dots with angles a1 a2 are as-signed likelihood by concatenations of the function L4 as
p I hP P P
P P P Pc c c
c c c s
( | ) corner = + ++ + +
cent centcent
cent centcent
Figure 4 The two tasks employed showing sample stimuli (left with likely responses stimuli not drawn to scale)and illustration of the experimental variables a1 a2 and a3 (right)
BAYESIAN CONTOUR INTEGRATION 1175
in Equation 4 One- or two-dot groups are each perfectlyconsistent with a straight line and hence have likelihoodunity they drop out of the resulting formulae The fullBayesian model for the corners task is then provided byEquation 5 substituting p(Hi)p(I | Hi) for each Pi andthen using Figure 5 to provide expressions for each like-lihood term p(I | Hi)
The free parameters of the Bayesian model include threeparameters s3 s4 and r of the atomic functions L3 and L4the overall scaling parameter h and the priors Althoughthere are four separate scalar priors in Equation 5 (one foreach hypothesis) there are in fact really only two degreesof freedom among the priors after one assumes p(Hccent) =p(Hcsup2) (by symmetry) and further expresses all the priorsrelative to one standard prior chosen arbitrarily [In theanalysis p(Hs) is omitted implicitly representing p(Hc)and p(Hccent) as proportions of it] Boiling this all down theBayesian model for the corners task contains six free pa-rameters s3 s4 r p(Hc) p(Hccent)[=p(Hcsup2)] and h The firstthree are the parameters of the atomic likelihood func-tions L3 and L 4 the next two are the free priors and thelast is the overall scaling factor The free parameters areadmittedly more numerous than in some previous con-tour integration theories but all are motivated directly byBayesian theory and readily admit meaningful interpre-tation In the analysis below these six variables are treatedas free parameters in a nonlinear regression fitting theBayesian model to subjectsrsquo ratings
An extremely similar analysis applies to the two-contours tasks with hypotheses H2 H2cent and H2sup2 associated
with the response two contours and Hs associated withone contour (Figure 6 note that here Hs has a differentmathematical form than in the corners task due to thedifferent stimulus geometry) Figures 5 and 6 give explicitexpressions for the likelihood of each hypothesis underconsideration in both tasks
ResultsFirst for both tasks the effects and interactions of all
three angular variables a1 a2 and a3 were submitted to ananalysis of variance (ANOVA) In both tasks all three maineffects all 3 two-way interactions and the three-way inter-action were significant at p lt 0001 (statistical details aregiven in Table 1) Figures 7 (corners) and 8 (two-contours)show the main effects of a1 a2 and a3 (along with theBayesian model discussed below) and Figures 9 and 10show the 3 two-way interactions a1 acute a2 a1 acute a3 and a2 acutea3 The most salient main effects were that in both taskstarget interpretations (1) increased markedly as angle a2increased and (2) decreased as a1 and a2 increased ex-cept at the tails where target interpretations again in-creased The effect of a2 was much larger in magnitudethan that of a1 and a3
The significant interactions suggest a nonlinear deci-sion surface and indeed the plots of the 3 two-way inter-actions (Figures 9 and 10) show highly curved surfacesAs remarked by Jaynes (1993) ldquoBayesrsquo theorem automat-ically generates the exact nonlinear function called for bythe problemrdquo (p 268) and hence it might be hoped thatBayesian theory would provide a quantitative account of
Figure 5 Candidate hypotheses in the corners task showing illustration(left) and mathematical form (right)
1176 FELDMAN
the shapes of these surfaces Hence in the next analysisthe Bayesian model derived above was fit to the full four-dimensional decision surface (probability as a function ofa1 a2 and a3)
Figures 7 and 8 show the best-fit Bayesian model (cho-sen by LevenburgndashMarquardt using least-squared error)superimposed on the subjectsrsquo data For ease of viewingthe Bayesian model is shown superimposed on the mar-ginal means (main effects) only but note that the modelshown reflects a fit not just to this relatively small num-ber of data points but rather to the full 4-D response sur-face comprising 637 independent data points in the cor-ners task and 343 in the two-contours task while usingonly six degrees of freedom in each model The fit is ex-tremely good [corners R2 = 8443 F(6631) = 8878 p lt000001 two-contours R2 = 7686 F(6337) = 4317307p lt 000001] although in the two-contours data the sub-jectsrsquo responses seem slightly more peaked than in the
model The good fit of the models to relatively subtle ef-fects (eg the rising tails in a1 and a3) reflects the powerof Bayesian machinery to make quantitative predictionsbeyond what is intuitively obvious In particular theBayesian model makes an accurate prediction about ex-actly how various angular cues are combinedmdashthe prob-lem of cooperativity that is rarely successfully addressedin conventional theories
Estimated parameters of the Bayesian models aregiven in Table 2 All six parameters in each model madesignificant contributions to the fit as determined by com-paring fits with versus without each parameter (detailsare given in Table 2) The parameters s3 s4 and r con-trolling the atomic functions L3 and L4 are very similar inthe two tasks (see the first three rows in Table 2) This re-sult is especially crucial because it supports the hypoth-esis that notwithstanding the difference between the twotasks subjectsrsquo judgments were constructed from a fixedand stable probabilistic lexicon It is worth noting how-ever that these estimates differ from earlier estimates(Feldman 1997) These differences may be attributableto the difference in tasks (judging the smoothness of asingle dot pattern vs grouping an entire configurationinto separate smooth components) although this is ad-mittedly speculative Such context-driven modulation ofparameters may be related to the neurophysiologicalfinding of rapid modulation of lateral connections withinvisual cortex (Gilbert 1995) and in Bayesian theory to themathematical notion of competitive priors (Yuille ampBuumllthoff 1996)
Figure 6 Candidate hypotheses in the two-contours task showing illustration (left) and mathematicalform (right)
Table 1Details of the Analyses of Variance
Corners zTask Two-Contours Task
Effect F p lt F p lt
a1 6141 0001 25486 0001a2 502242 0001 1095154 0001a3 5778 0001 10056 0001a1 acute a2 9955 0001 27971 0001a1 acute a3 2882 0001 26278 0001a2 acute a3 9140 0001 22679 0001a1 acute a2 acute a3 1701 0001 1620 0001
BAYESIAN CONTOUR INTEGRATION 1177
Figure 7 Subjectsrsquo data and the Bayesian model in the corners task show-ing proportion corners judgment as a function of a1 (top) a2 (middle) and a3(bottom) Error bars are standard errors
1178 FELDMAN
Figure 8 Subjectsrsquo data and the Bayesian model in the two-contours taskshowing proportion two contours judgments as a function of a1 (top) a2 (mid-dle) and a3 (bottom) Data shown are collapsed over scale Error bars are stan-dard errors
BAYESIAN CONTOUR INTEGRATION 1179
ConclusionsThe very close fit of the Bayesian model compares fa-
vorably with the results from existing theories in othergrouping domains By comparison only a few years agonumerical theories of proximity grouping were judged tobe empirically successful simply when they agreed withhuman judgments more often than chance (Compton ampLogan 1993) although more recently standards of empir-ical success in that areamdashbut not in collinearity groupingmdashhave improved (Kubovy Holcombe amp Wagemans 1998)This good fit means that with the aid of Bayesian calcu-lations the subjective goodness of a virtual curve of dotscan be calculated with about an order of magnitude moreprecise than with conventional treatments (In most cur-
rent treatments curves are classified simply as curved[angles generated at random from eg plusmn30ordm] or straight[angles near 0ordm] this means that subjective goodness istreated as if it depended only on the mean angle over theentire curve a far coarser measure than the combinationsof L4 used here)
Some of the goodness of fit could be due to the choiceof Gaussian likelihood functions and the use of pooleddata because sums of independent distributions tend to-ward normality (the central limit theorem) However sta-tistical analysis of individual subjectrsquos data in earlier stud-ies (Feldman 1997) showed that the model fit is reducedonly slightly and visual inspection of individual subjectsrsquodata in the present experiments suggests the same In any
Figure 9 Two-way interactions in the corners task a1 acute a2 (top) a1 acute a3 (middle) and a2 acutea3 (bottom)
1180 FELDMAN
case the use of Gaussian likelihood functions is well mo-tivated by Bayesian theory The Gaussian distribution isthe maximum-entropy distribution given a fixed meanand variance (Bernardo amp Smith 1994) In the present casethis means that given an assumption that curves tend tocontinue smoothly with a certain expectation s of spreadabout the expected direction a Gaussian likelihood func-tion encodes this assumption with the absolute minimumof additional assumptions or information (Jaynes 1983)This makes the choice of Gaussians a very reasonable onefor a visual system in which contours are expected to becurvilinear but in which any more specific knowledge of
the geometry of contours in its environment (as in Bruns-wik 1956) is lacking Ultimately the close fits reportedabove suggest that whatever their rationale Gaussians arethe visual systemrsquos choice or very nearly so
Traditionally within psychology perceptual groupinghas often been treated as a ldquosubjectiverdquo taskmdashthat is onewithout a definitely correct or incorrect answer Indeedthe ldquogoodnessrdquo of a grouping interpretation has some-times been treated by Gestalt writers as if it were virtu-ally an aesthetic attribute Conversely it is possible toview grouping as the solution to a definite problemmdashnamely the identification of visual elements in the image
Figure 10 Two-way interactions in the two-contours task a1 acute a2 (top) a1 acute a3 (middle)and a2 acute a3 (bottom)
BAYESIAN CONTOUR INTEGRATION 1181
that arose from the same physical source in the scenemdashfor example the same object edge or surface This viewis attractive from a computational point of view in thatit provides the beginnings of a rationale for the selectionof algorithms Prefer those algorithms that tend to solvethat problem successfully Clearly this is the assumptionimplicit in the Bayesian theory proposed above in whichthe observer explicitly chooses between the hypothesisthat a given element arises from one curve and the hypoth-esis that it arises from another Nevertheless some caremust be taken to avoid circularity here because the ques-tion of which elements in the scene are ldquotrulyrdquo part ofthe same object does not bear a completely objective an-swer and would normally be answered by appealing per-ceptual grouping (perhaps from another view of the samescene at a different viewing angle or at a different time)Still one can certainly imagine that some grouping in-terpretations would be more successful than others interms of their consistency with the later actions of the ob-server such as manipulation of the objects observed inthe scene
In the case of Bayesian grouping this raises a puzzleIf Bayesian theory tends to yield the ldquocorrectrdquo answerwhat exactly is correct about it in the case of grouping Anargument drawn from the historical debate over Bayesian-ism provides one possible answer The Bayesian groupinginterpretation is not necessarily an objectively optimal in-terpretation of the world but it does represent a provablyoptimal use of the observerrsquos prior knowledge and beliefs(Bernardo amp Smith 1994 Jaynes 1983) in this case thevisual systemrsquos beliefs about the geometric form of smoothcurves as here embodied by the likelihood functions L3and L4 That is Bayesian theory yields grouping perceptsthat parse the world in a way most harmonious with thevisual systemrsquos implicit mental model of smooth curvesThat this tends to lead to successful percepts reflects boththe aptness of the subjective priors and the optimality ofBayesian theoryrsquos use of them
In this sense Bayesian grouping theory is not truly nor-mative because the priors and likelihood functions aremotivated by extra-Bayesian considerations (JepsonRichards amp Knill 1996 Richards Jepson amp Feldman1996) and in some surprising respects even run counterto mathematically correct statistical reasoning (Feldman1996) Nevertheless these functions are apparently ma-nipulated by neural machinery in an almost strictlyBayesian fashion This realization sheds new light on the
Gestalt principle of good continuation which alongwith other Gestalt principles is conventionally held up as acornerstone of human perceptual grouping As has oftenbeen pointed out such principles really describe a partic-ular behavioral tendency rather than explain or justify itThe link to Bayesrsquo rule demonstrated here suggests thatthe principle of good continuation and given the theo-retically universal range of applicability of Bayesian rea-soning perhaps other Gestalt principles can indeed beregarded as a rational strategy for perception The signif-icance of this point in the context of the recent debateover the evolutionary adaptiveness of human mentalstrategies and heuristics is obvious Indeed the naturalnext step is to extend the mathematics presented above toother types of perceptual grouping (eg region group-ing amodal completion etc) with the hope that theclose fit to human judgments found here can be dupli-cated outside the narrow case of contour integration
REFERENCES
Adelson E H (1993) Perceptual organization and the judgment ofbrightness Science 262 2042-2044
Bernardo J M amp Smith A F M (1994) Bayesian theory Chi-chester UK Wiley
Brunswik E (1956) Perception and the representative design of psy-chological experiments Berkeley University of California Press
Buumllthoff H H amp Yuille A L (1991) Bayesian models for see-ing shapes and depth Comments on Theoretical Biology 2 283-314
Caelli T M amp Umansky J (1976) Interpolation in the visual sys-tem Vision Research 16 1055-1060
Compton B J amp Logan G D (1993) Evaluating a computationalmodel of perceptual grouping by proximity Perception amp Psycho-physics 53 403-421
Feldman J (1996) Regularity vs genericity in the perception ofcollinearity Perception 25 335-342
Feldman J (1997) Curvilinearity covariance and regularity in per-ceptual groups Vision Research 37 2835-2848
Feldman J (2000) Bias toward regular form in mental shape spacesJournal of Experimental Psychology Human Perception amp Perfor-mance 26 1-14
Field D J Hayes A amp Hess R F (1993) Contour integration bythe human visual system Evidence for a local ldquoassociation fieldrdquo Vi-sion Research 33 173-193
Gilbert C D (1995) Dynamic properties of adult visual cortex InM S Gazzaniga (Ed) The cognitive neurosciences (pp 73-90)Cambridge MA MIT Press
Gilchrist A L (1977) Perceived lightness depends on perceived spa-tial arrangement Science 195 185-187
Glass L (1969) Moireacute effects from random dots Nature 223 578-580He Z J amp Nakayama K (1992) Surfaces versus features in visual
search Nature 359 231-233
Table 2Estimated Parameters of the Bayesian Models
Corners Task Two-Contours Task
Parameter Estimate SE F(6637) p lt Parameter Estimate SE F(6343) p lt
s3 1664ordm 072 10236 000001 s3 1321ordm 094 2486 000001s4 2759ordm 058 55624 000001 s4 2950ordm 124 18330 000001r 027 002 5307 000001 r 032 003 2262 000001p(Hc) 023 002 3593 000001 p(H2) 019 005 512 00005p(Hccent) 006 0003 38206 000001 p(H2cent) 018 002 9296 000001h 079 001 28221 000001 h 077 001 2039 000001
1182 FELDMAN
Jaynes E T (1983) E T Jaynes Papers on probability statistics andstatistical physics (R D Rosenkrantz Ed) Dordrecht D Reidel
Jaynes E T (1993) A backward look to the future In W T Grandy ampP W Milonni (Eds) Physics and probability (pp 261-275) Cam-bridge Cambridge University Press
Jepson A Richards W A amp Knill D C (1996) Modal structure andreliable inference In D C Knill amp W Richards (Eds) Perception asBayesian inference (pp 63-92) Cambridge Cambridge UniversityPress
Knill D amp Richards W (Eds) (1996) Perception as Bayesian in-ference Cambridge Cambridge University Press
Kubovy M Holcombe A O amp Wagemans J (1998) On the law-fulness of grouping by proximity Cognitive Psychology 35 71-98
Kubovy M amp Wagemans J (1995) Grouping by proximity and mul-tistability in dot lattices A quantitative gestalt theory PsychologicalScience 6 225-234
Landy M S Maloney L T Johnston E B amp Young M (1995)Measurement and modeling of depth cue combination In defense ofweak fusion Vision Research 35 389-412
Link N K amp Zucker S W (1987) Sensitivity to corners of flowpatterns Spatial Vision 2 233-244
Liu Z Knill D C amp Kersten D (1995) Object classification forhuman and ideal observers Vision Research 35 549-568
Mamassian P amp Landy M S (1998) Observer biases in the 3D in-terpretation of line drawings Vision Research 38 2817-2832
Nakayama D amp Shimojo S (1992) Experiencing and perceiving vi-sual surfaces Science 257 1357-1363
Parent P amp Zucker S W (1989) Trace inference curvature con-sistency and curve detection IEEE Transactions on Pattern Analysisamp Machine Intelligence 11 823-839
Pizlo Z Salach-Golyska M amp Rosenfeld A (1997) Curve de-tection in a noisy image Vision Research 37 1217-1241
Richards W A Jepson A amp Feldman J (1996) Priors prefer-ences and categorical percepts In D C Knill amp W Richards (Eds)Perception as Bayesian inference (pp 93-122) Cambridge Cam-bridge University Press
Shimojo S amp Nakayama K (1990) Amodal representation of oc-cluded surfaces Role of invisible stimuli in apparent motion corre-spondences Perception 19 285-299
Smits J T amp Vos P G (1987) The perception of continuous curvesin dot stimuli Perception 16 121-131
Smits J T Vos P G amp van Oeffelen M P (1985) The perceptionof a dotted line in noise A model of good continuation and some ex-perimental results Spatial Vision 1 163-177
Treisman A (1982) Perceptual grouping and attention in visual searchfor features and for objects Journal of Experimental PsychologyHuman Perception amp Performance 8 194-214
Weiss Y amp Adelson E H (1998) Slow and smooth A Bayesian the-ory for the combination of local motion signals in human vision (AIMemo No 1624) Cambridge MA Massachusetts Institute of Tech-nology Artificial Intelligence Laboratory
Yuille A L amp Buumllthoff H H (1996) Bayesian decision theory andpsychophysics In D C Knill amp W Richards (Eds) Perception asBayesian inference (pp 123-162) Cambridge Cambridge UniversityPress
Zucker S W Stevens K A amp Sander P (1983) The relation be-tween proximity and brightness similarity in dot patterns Perceptionamp Psychophysics 34 513-522
(Manuscript received August 15 2000 revision accepted for publication January 31 2001)
1172 FELDMAN
of formulating a Bayesian model of grouping hinges onthe construction of suitable likelihood terms for group-ing hypotheses
We focus on the case of grouping individual visualitems (dots edge fragments etc) into smooth contoursa process known to occur early and to be essential in theconstruction of visual representations (Caelli amp Uman-sky 1976 Glass 1969) The visual systemrsquos tendency toextract approximately collinear patterns from the imagehas been investigated in some detail (Feldman 1996 1997Pizlo Salach-Golyska amp Rosenfeld 1997 Smits amp Vos1987 Smits Vos amp van Oeffelen 1985) Yet there is stillno quantitative model that will predict both (1) the subjec-tive coherence of a dot pattern as a function of its geom-etry and (2) the particular grouping interpretation that ahuman observer will perceive in an ambiguous configura-tion (eg the particular assignment of dots to distinct vir-tual curves Moreover what is known about the quantita-tive properties of curve grouping does not afford anyconvenient mathematical generalization to other types ofgrouping problems such as grouping into surfaces and ob-jects Such a generalization might be provided by Bayesiantheory which is in principle completely general in its ap-plication
A major obstacle is the lack of a model for how the sys-tem combines the many local estimates of collinearity(eg the outputs of local orientation-tuned cells) into a sin-gle global judgment of curve coherence a problem some-times referred to as cooperativity (Kubovy amp Wagemans1995 Zucker Stevens amp Sander 1983) It is believed thatraw judgments of collinearity propagate laterally in visualcortex (Field Hayes amp Hess 1993) but the mathematicalform of the combination rule is unknown Arguments fromdifferential geometry suggest that along a smooth curvesampled at intervals to produce visible points successiveangles between points should tend to be collinear and theimplicit curve should be well approximated by the localtangent (Parent amp Zucker 1989) But such arguments donot specify exactly how much deviation from collinearityshould suppress the impression of a subjective curve norhow successive angles should interact (ie the combina-tion rule) These lacunae need to be repaired in order toconstruct suitable subjective likelihood functions
A Bayesian Model of Smooth CurvesEarlier studies (Feldman 1996 1997) have suggested
a mathematical form for the likelihood function corre-sponding to subjectively smooth curvilinear patterns Thesimplest case is three visual items parameterized by anangle a1 measuring the deviation from perfect collinear-ity (0ordm) (see Figure 1) Human judgments of apparentcurvilinearity are consistent with a model in which
under the hypothesis of a smooth curve the expecteddistribution of angle a1 is proportional to a Gaussian dis-tribution centered at 0ordm That is the likelihood functionfor the smooth hypothesis p(a1|smooth) is given by
(2)
where a3 is the standard deviation of the Gaussian distri-bution and h3 is a proportionality constant In the case offour visual items there are now two successive angles a1and a2 and the joint distribution p(a1 a2 | smooth) isgiven by
(3)
where s4 is the standard deviation of each of the two mar-ginal distributions r is the correlation coefficient and h4is a proportionality constant (Figure 2) Empirical esti-mates of correlation r have shown it to be nonzero betweensuccessive anglesmdashthat is successive angles along a sub-jectively smooth curve are not independently distributedmdashbut approximately zero between nonsuccessive angles(Feldman 1997) This means that by Bayesrsquo rule the like-lihood function for the general case of n items is the prod-uct of successive iterations of the function L4 (Equation 4)
Equation 4 represents a ldquomoving four-item windowrdquooperating on successive angle pairs each of which con-tributes independently to the overall perception of asmooth curve (Figure 3) In the spectrum of Bayesian mod-els the assumption of correlation between successive an-gles but independence between nonsuccessive angles
L hr
r
4 1 2 4 21
4
2
2
4
21 2
42
1
2 1
2
( ) exp
a a as
as
a as
= --( )
aeligegraveccedil
oumloslashdivide
eacute
euml
ecircecirc
igraveiacuteiuml
icirciuml
+aeligegraveccedil
oumloslashdivide
-aelig
egraveccedil
ouml
oslashdivide
uumlyacuteiuml
thorniuml
L h3 1 3 321
2( ) exp ( ) a a s= -eacute
eumlecirc
a3
aa
12
Figure 1 Notation of angles along a curvilinear pattern of dots
p L L L
L
n n n
i
n
i i
( | )
a a a a a a a a a
a a
1 2 4 1 2 4 2 3 4 1
41
1
1
smooth = ( ) ( ) ( )= ( )
-
=
-
+Otilde(4)
BAYESIAN CONTOUR INTEGRATION 1173
places this model somewhere between weak fusion (allcues are assumed to be independent) and strong fusion (alljoint densities are computed) (Yuille amp Buumllthoff 1996) ap-proximately in the style of modified weak fusion (Landyet al 1995)
The two ldquoatomicrdquo likelihood functions L3 and L4 to-gether can be used to construct probabilistic models ofarbitrarily long smooth curves (L3 is needed only when acurve contains only three items the exact procedure isdetailed below) and moreover to build complete scenerepresentations consisting only of piece-wise smoothcontours Hence the resulting composite probabilisticfunctions provide rigorous numerical models of how wellcandidate grouping interpretations fit the observed con-figuration allowing the visual system to in effect selectthe probabilistically optimal grouping interpretation It isworth noting that notwithstanding their superficiallycomplex mathematical form these functions may easilybe computed by simple arrangements of neural hardware(Feldman 1997)
The experiments reported below investigate human sub-jectsrsquo subjective grouping of dot configurations into piece-wise smooth virtual curves It is to be emphasized that theBayesian models presented below as accounts of sub-jectsrsquo data are constructed entirely out of the atomicfunctions L3 and L4 and contain no unmotivated or ad hoccomponents
ExperimentsTwo types of tasks were employed In the corners task
displays contained five dots parameterized by three an-
gles a1 a2 and a3 (Figure 4 top) In the corners task theangles used were 0ordm plusmn15ordm plusmn30ordm and plusmn45ordm (a1 a3) and0ordm plusmn10ordm plusmn20ordm plusmn30ordm plusmn40ordm plusmn50ordm and plusmn60ordm (a2) all fullycrossed for a total of 7 acute 13 acute 7 = 637 combinations Asillustrated in Figure 4 these parameters allow for a widevariety of configurations ranging from some that clearlyappear to have a corner to some that appear to be quitesmooth In the two-contours task angles were 0ordm plusmn15ordmplusmn30ordm and plusmn45ordm (a1 a3) and 0ordm plusmn10ordm plusmn20ordm plusmn40ordm and plusmn60ordm(a2 ) all fully crossed for a total of 7 acute 7 acute 7 = 343 com-binations Again these parameters allow for a widerange of configurations (Figure 4) including some thatappear to spontaneously ldquobreakrdquo into two contours elic-iting a two contour response as well as some that suggesta single smooth contour
Dots were dark circular patches (subtending 011ordm of vi-sual angle in the corners task and 0055ordm or 011ordm in the two-
p(a 1
a2|s
moo
th)
a2 a1
L4
a1
p(a
1 |sm
ooth
) L3
Figure 2 The atomic functions L3 and L4 used in the construction of Bayesian models The functions give the expecteddistribution of angles along a subjectively smooth virtual curve
L4 L4
Figure 3 L4 is computed in parallel on groups of four dots lyingsuccessively along a chain of dots
1174 FELDMAN
contours task) on a uniform white background displayedat high contrast in a darkened room at a 60-cm viewingdistance with observersrsquo heads fixed by a chinrest
In the corners task each configuration was displayedin a randomly chosen orientation In the two-contourstask configurations were presented upright as in Figure 4(That is each figure was displayed so that the secondand third dots were at the same height as each other andlikewise the fourth and fifth dots) Nineteen naive sub-jects were asked to judge on a 1ndash5 scale whether the dotstraced out a corner or a single smooth curve (1 = defi-nitely a smooth curve 5 = definitely a corner) In the two-contours task displays contained six dots again parame-terized by three angles a1 a2 and a3 (Figure 4 bottom)(In addition two stimulus sizes were employed but noscale effects were found and henceforth the data are pre-sented collapsed across scale) Seventeen naive subjectsnone of whom had participated in the corners experimentwere asked to rate whether the display contained two dis-tinct smooth contours or one long smooth contour againon a 1ndash5 scale (1 = definitely one smooth contour 5 =definitely two smooth contours) Subjectsrsquo mean ratingsof each condition after normalization to the interval (01)were taken to represent the subjectsrsquo a posteriori beliefthat the stimulus configuration belonged to the target in-terpretation
The two tasks were chosen in order to reflect two fun-damental modes of contour extraction Dots can be as-signed to two completely disjoint contours or they can beassigned to two distinct sections of the same contour thatare separated by a perceived tangent discontinuity (Linkamp Zucker 1987) One of the advantages of a Bayesian ap-proach is the possibility of treating these two modes of
grouping in a theoretically uniform manner and in factboth Bayesian models described below (one for each task)draw on the same probabilistic vocabularymdashnamely thefunctions L3 and L4
Bayesian Models of the Two TasksIn each task several grouping interpretations are possi-
ble some leading to the target interpretation (corner ortwo contours respectively) others leading to the percep-tion of a single smooth contour One immediate compli-cation is that in each task there are several different per-ceptually distinct interpretations that all lead to the targetresponse Consider first the corners task In this task onemay perceive a corner at the central dot denote this inter-pretation by Hc Alternatively one may perceive a cornerat either the second or the fourth dot again leading to acorner response denote these interpretations by Hccent andHcsup2 Counterposed to these is the smooth interpretation HsAll hypotheses under consideration are depicted schemat-ically in Figures 5 (corners) and 6 (two-contours)
For any hypothesis Hi denote by Pi the productp(Hi)p(I | Hi) of its prior and its likelihood By Bayesrsquorule the probability of the target response (corner re-gardless of where the corner is perceived) is
(5)
where h is a free scaling factor relating this expression tothe subjectsrsquo numeric ratings Likelihood functions p(I|Hi)were constructed for each interpretation in the followingmanner Three dots at an angle a1 are assigned likelihoodL3(a1) Four or more dots with angles a1 a2 are as-signed likelihood by concatenations of the function L4 as
p I hP P P
P P P Pc c c
c c c s
( | ) corner = + ++ + +
cent centcent
cent centcent
Figure 4 The two tasks employed showing sample stimuli (left with likely responses stimuli not drawn to scale)and illustration of the experimental variables a1 a2 and a3 (right)
BAYESIAN CONTOUR INTEGRATION 1175
in Equation 4 One- or two-dot groups are each perfectlyconsistent with a straight line and hence have likelihoodunity they drop out of the resulting formulae The fullBayesian model for the corners task is then provided byEquation 5 substituting p(Hi)p(I | Hi) for each Pi andthen using Figure 5 to provide expressions for each like-lihood term p(I | Hi)
The free parameters of the Bayesian model include threeparameters s3 s4 and r of the atomic functions L3 and L4the overall scaling parameter h and the priors Althoughthere are four separate scalar priors in Equation 5 (one foreach hypothesis) there are in fact really only two degreesof freedom among the priors after one assumes p(Hccent) =p(Hcsup2) (by symmetry) and further expresses all the priorsrelative to one standard prior chosen arbitrarily [In theanalysis p(Hs) is omitted implicitly representing p(Hc)and p(Hccent) as proportions of it] Boiling this all down theBayesian model for the corners task contains six free pa-rameters s3 s4 r p(Hc) p(Hccent)[=p(Hcsup2)] and h The firstthree are the parameters of the atomic likelihood func-tions L3 and L 4 the next two are the free priors and thelast is the overall scaling factor The free parameters areadmittedly more numerous than in some previous con-tour integration theories but all are motivated directly byBayesian theory and readily admit meaningful interpre-tation In the analysis below these six variables are treatedas free parameters in a nonlinear regression fitting theBayesian model to subjectsrsquo ratings
An extremely similar analysis applies to the two-contours tasks with hypotheses H2 H2cent and H2sup2 associated
with the response two contours and Hs associated withone contour (Figure 6 note that here Hs has a differentmathematical form than in the corners task due to thedifferent stimulus geometry) Figures 5 and 6 give explicitexpressions for the likelihood of each hypothesis underconsideration in both tasks
ResultsFirst for both tasks the effects and interactions of all
three angular variables a1 a2 and a3 were submitted to ananalysis of variance (ANOVA) In both tasks all three maineffects all 3 two-way interactions and the three-way inter-action were significant at p lt 0001 (statistical details aregiven in Table 1) Figures 7 (corners) and 8 (two-contours)show the main effects of a1 a2 and a3 (along with theBayesian model discussed below) and Figures 9 and 10show the 3 two-way interactions a1 acute a2 a1 acute a3 and a2 acutea3 The most salient main effects were that in both taskstarget interpretations (1) increased markedly as angle a2increased and (2) decreased as a1 and a2 increased ex-cept at the tails where target interpretations again in-creased The effect of a2 was much larger in magnitudethan that of a1 and a3
The significant interactions suggest a nonlinear deci-sion surface and indeed the plots of the 3 two-way inter-actions (Figures 9 and 10) show highly curved surfacesAs remarked by Jaynes (1993) ldquoBayesrsquo theorem automat-ically generates the exact nonlinear function called for bythe problemrdquo (p 268) and hence it might be hoped thatBayesian theory would provide a quantitative account of
Figure 5 Candidate hypotheses in the corners task showing illustration(left) and mathematical form (right)
1176 FELDMAN
the shapes of these surfaces Hence in the next analysisthe Bayesian model derived above was fit to the full four-dimensional decision surface (probability as a function ofa1 a2 and a3)
Figures 7 and 8 show the best-fit Bayesian model (cho-sen by LevenburgndashMarquardt using least-squared error)superimposed on the subjectsrsquo data For ease of viewingthe Bayesian model is shown superimposed on the mar-ginal means (main effects) only but note that the modelshown reflects a fit not just to this relatively small num-ber of data points but rather to the full 4-D response sur-face comprising 637 independent data points in the cor-ners task and 343 in the two-contours task while usingonly six degrees of freedom in each model The fit is ex-tremely good [corners R2 = 8443 F(6631) = 8878 p lt000001 two-contours R2 = 7686 F(6337) = 4317307p lt 000001] although in the two-contours data the sub-jectsrsquo responses seem slightly more peaked than in the
model The good fit of the models to relatively subtle ef-fects (eg the rising tails in a1 and a3) reflects the powerof Bayesian machinery to make quantitative predictionsbeyond what is intuitively obvious In particular theBayesian model makes an accurate prediction about ex-actly how various angular cues are combinedmdashthe prob-lem of cooperativity that is rarely successfully addressedin conventional theories
Estimated parameters of the Bayesian models aregiven in Table 2 All six parameters in each model madesignificant contributions to the fit as determined by com-paring fits with versus without each parameter (detailsare given in Table 2) The parameters s3 s4 and r con-trolling the atomic functions L3 and L4 are very similar inthe two tasks (see the first three rows in Table 2) This re-sult is especially crucial because it supports the hypoth-esis that notwithstanding the difference between the twotasks subjectsrsquo judgments were constructed from a fixedand stable probabilistic lexicon It is worth noting how-ever that these estimates differ from earlier estimates(Feldman 1997) These differences may be attributableto the difference in tasks (judging the smoothness of asingle dot pattern vs grouping an entire configurationinto separate smooth components) although this is ad-mittedly speculative Such context-driven modulation ofparameters may be related to the neurophysiologicalfinding of rapid modulation of lateral connections withinvisual cortex (Gilbert 1995) and in Bayesian theory to themathematical notion of competitive priors (Yuille ampBuumllthoff 1996)
Figure 6 Candidate hypotheses in the two-contours task showing illustration (left) and mathematicalform (right)
Table 1Details of the Analyses of Variance
Corners zTask Two-Contours Task
Effect F p lt F p lt
a1 6141 0001 25486 0001a2 502242 0001 1095154 0001a3 5778 0001 10056 0001a1 acute a2 9955 0001 27971 0001a1 acute a3 2882 0001 26278 0001a2 acute a3 9140 0001 22679 0001a1 acute a2 acute a3 1701 0001 1620 0001
BAYESIAN CONTOUR INTEGRATION 1177
Figure 7 Subjectsrsquo data and the Bayesian model in the corners task show-ing proportion corners judgment as a function of a1 (top) a2 (middle) and a3(bottom) Error bars are standard errors
1178 FELDMAN
Figure 8 Subjectsrsquo data and the Bayesian model in the two-contours taskshowing proportion two contours judgments as a function of a1 (top) a2 (mid-dle) and a3 (bottom) Data shown are collapsed over scale Error bars are stan-dard errors
BAYESIAN CONTOUR INTEGRATION 1179
ConclusionsThe very close fit of the Bayesian model compares fa-
vorably with the results from existing theories in othergrouping domains By comparison only a few years agonumerical theories of proximity grouping were judged tobe empirically successful simply when they agreed withhuman judgments more often than chance (Compton ampLogan 1993) although more recently standards of empir-ical success in that areamdashbut not in collinearity groupingmdashhave improved (Kubovy Holcombe amp Wagemans 1998)This good fit means that with the aid of Bayesian calcu-lations the subjective goodness of a virtual curve of dotscan be calculated with about an order of magnitude moreprecise than with conventional treatments (In most cur-
rent treatments curves are classified simply as curved[angles generated at random from eg plusmn30ordm] or straight[angles near 0ordm] this means that subjective goodness istreated as if it depended only on the mean angle over theentire curve a far coarser measure than the combinationsof L4 used here)
Some of the goodness of fit could be due to the choiceof Gaussian likelihood functions and the use of pooleddata because sums of independent distributions tend to-ward normality (the central limit theorem) However sta-tistical analysis of individual subjectrsquos data in earlier stud-ies (Feldman 1997) showed that the model fit is reducedonly slightly and visual inspection of individual subjectsrsquodata in the present experiments suggests the same In any
Figure 9 Two-way interactions in the corners task a1 acute a2 (top) a1 acute a3 (middle) and a2 acutea3 (bottom)
1180 FELDMAN
case the use of Gaussian likelihood functions is well mo-tivated by Bayesian theory The Gaussian distribution isthe maximum-entropy distribution given a fixed meanand variance (Bernardo amp Smith 1994) In the present casethis means that given an assumption that curves tend tocontinue smoothly with a certain expectation s of spreadabout the expected direction a Gaussian likelihood func-tion encodes this assumption with the absolute minimumof additional assumptions or information (Jaynes 1983)This makes the choice of Gaussians a very reasonable onefor a visual system in which contours are expected to becurvilinear but in which any more specific knowledge of
the geometry of contours in its environment (as in Bruns-wik 1956) is lacking Ultimately the close fits reportedabove suggest that whatever their rationale Gaussians arethe visual systemrsquos choice or very nearly so
Traditionally within psychology perceptual groupinghas often been treated as a ldquosubjectiverdquo taskmdashthat is onewithout a definitely correct or incorrect answer Indeedthe ldquogoodnessrdquo of a grouping interpretation has some-times been treated by Gestalt writers as if it were virtu-ally an aesthetic attribute Conversely it is possible toview grouping as the solution to a definite problemmdashnamely the identification of visual elements in the image
Figure 10 Two-way interactions in the two-contours task a1 acute a2 (top) a1 acute a3 (middle)and a2 acute a3 (bottom)
BAYESIAN CONTOUR INTEGRATION 1181
that arose from the same physical source in the scenemdashfor example the same object edge or surface This viewis attractive from a computational point of view in thatit provides the beginnings of a rationale for the selectionof algorithms Prefer those algorithms that tend to solvethat problem successfully Clearly this is the assumptionimplicit in the Bayesian theory proposed above in whichthe observer explicitly chooses between the hypothesisthat a given element arises from one curve and the hypoth-esis that it arises from another Nevertheless some caremust be taken to avoid circularity here because the ques-tion of which elements in the scene are ldquotrulyrdquo part ofthe same object does not bear a completely objective an-swer and would normally be answered by appealing per-ceptual grouping (perhaps from another view of the samescene at a different viewing angle or at a different time)Still one can certainly imagine that some grouping in-terpretations would be more successful than others interms of their consistency with the later actions of the ob-server such as manipulation of the objects observed inthe scene
In the case of Bayesian grouping this raises a puzzleIf Bayesian theory tends to yield the ldquocorrectrdquo answerwhat exactly is correct about it in the case of grouping Anargument drawn from the historical debate over Bayesian-ism provides one possible answer The Bayesian groupinginterpretation is not necessarily an objectively optimal in-terpretation of the world but it does represent a provablyoptimal use of the observerrsquos prior knowledge and beliefs(Bernardo amp Smith 1994 Jaynes 1983) in this case thevisual systemrsquos beliefs about the geometric form of smoothcurves as here embodied by the likelihood functions L3and L4 That is Bayesian theory yields grouping perceptsthat parse the world in a way most harmonious with thevisual systemrsquos implicit mental model of smooth curvesThat this tends to lead to successful percepts reflects boththe aptness of the subjective priors and the optimality ofBayesian theoryrsquos use of them
In this sense Bayesian grouping theory is not truly nor-mative because the priors and likelihood functions aremotivated by extra-Bayesian considerations (JepsonRichards amp Knill 1996 Richards Jepson amp Feldman1996) and in some surprising respects even run counterto mathematically correct statistical reasoning (Feldman1996) Nevertheless these functions are apparently ma-nipulated by neural machinery in an almost strictlyBayesian fashion This realization sheds new light on the
Gestalt principle of good continuation which alongwith other Gestalt principles is conventionally held up as acornerstone of human perceptual grouping As has oftenbeen pointed out such principles really describe a partic-ular behavioral tendency rather than explain or justify itThe link to Bayesrsquo rule demonstrated here suggests thatthe principle of good continuation and given the theo-retically universal range of applicability of Bayesian rea-soning perhaps other Gestalt principles can indeed beregarded as a rational strategy for perception The signif-icance of this point in the context of the recent debateover the evolutionary adaptiveness of human mentalstrategies and heuristics is obvious Indeed the naturalnext step is to extend the mathematics presented above toother types of perceptual grouping (eg region group-ing amodal completion etc) with the hope that theclose fit to human judgments found here can be dupli-cated outside the narrow case of contour integration
REFERENCES
Adelson E H (1993) Perceptual organization and the judgment ofbrightness Science 262 2042-2044
Bernardo J M amp Smith A F M (1994) Bayesian theory Chi-chester UK Wiley
Brunswik E (1956) Perception and the representative design of psy-chological experiments Berkeley University of California Press
Buumllthoff H H amp Yuille A L (1991) Bayesian models for see-ing shapes and depth Comments on Theoretical Biology 2 283-314
Caelli T M amp Umansky J (1976) Interpolation in the visual sys-tem Vision Research 16 1055-1060
Compton B J amp Logan G D (1993) Evaluating a computationalmodel of perceptual grouping by proximity Perception amp Psycho-physics 53 403-421
Feldman J (1996) Regularity vs genericity in the perception ofcollinearity Perception 25 335-342
Feldman J (1997) Curvilinearity covariance and regularity in per-ceptual groups Vision Research 37 2835-2848
Feldman J (2000) Bias toward regular form in mental shape spacesJournal of Experimental Psychology Human Perception amp Perfor-mance 26 1-14
Field D J Hayes A amp Hess R F (1993) Contour integration bythe human visual system Evidence for a local ldquoassociation fieldrdquo Vi-sion Research 33 173-193
Gilbert C D (1995) Dynamic properties of adult visual cortex InM S Gazzaniga (Ed) The cognitive neurosciences (pp 73-90)Cambridge MA MIT Press
Gilchrist A L (1977) Perceived lightness depends on perceived spa-tial arrangement Science 195 185-187
Glass L (1969) Moireacute effects from random dots Nature 223 578-580He Z J amp Nakayama K (1992) Surfaces versus features in visual
search Nature 359 231-233
Table 2Estimated Parameters of the Bayesian Models
Corners Task Two-Contours Task
Parameter Estimate SE F(6637) p lt Parameter Estimate SE F(6343) p lt
s3 1664ordm 072 10236 000001 s3 1321ordm 094 2486 000001s4 2759ordm 058 55624 000001 s4 2950ordm 124 18330 000001r 027 002 5307 000001 r 032 003 2262 000001p(Hc) 023 002 3593 000001 p(H2) 019 005 512 00005p(Hccent) 006 0003 38206 000001 p(H2cent) 018 002 9296 000001h 079 001 28221 000001 h 077 001 2039 000001
1182 FELDMAN
Jaynes E T (1983) E T Jaynes Papers on probability statistics andstatistical physics (R D Rosenkrantz Ed) Dordrecht D Reidel
Jaynes E T (1993) A backward look to the future In W T Grandy ampP W Milonni (Eds) Physics and probability (pp 261-275) Cam-bridge Cambridge University Press
Jepson A Richards W A amp Knill D C (1996) Modal structure andreliable inference In D C Knill amp W Richards (Eds) Perception asBayesian inference (pp 63-92) Cambridge Cambridge UniversityPress
Knill D amp Richards W (Eds) (1996) Perception as Bayesian in-ference Cambridge Cambridge University Press
Kubovy M Holcombe A O amp Wagemans J (1998) On the law-fulness of grouping by proximity Cognitive Psychology 35 71-98
Kubovy M amp Wagemans J (1995) Grouping by proximity and mul-tistability in dot lattices A quantitative gestalt theory PsychologicalScience 6 225-234
Landy M S Maloney L T Johnston E B amp Young M (1995)Measurement and modeling of depth cue combination In defense ofweak fusion Vision Research 35 389-412
Link N K amp Zucker S W (1987) Sensitivity to corners of flowpatterns Spatial Vision 2 233-244
Liu Z Knill D C amp Kersten D (1995) Object classification forhuman and ideal observers Vision Research 35 549-568
Mamassian P amp Landy M S (1998) Observer biases in the 3D in-terpretation of line drawings Vision Research 38 2817-2832
Nakayama D amp Shimojo S (1992) Experiencing and perceiving vi-sual surfaces Science 257 1357-1363
Parent P amp Zucker S W (1989) Trace inference curvature con-sistency and curve detection IEEE Transactions on Pattern Analysisamp Machine Intelligence 11 823-839
Pizlo Z Salach-Golyska M amp Rosenfeld A (1997) Curve de-tection in a noisy image Vision Research 37 1217-1241
Richards W A Jepson A amp Feldman J (1996) Priors prefer-ences and categorical percepts In D C Knill amp W Richards (Eds)Perception as Bayesian inference (pp 93-122) Cambridge Cam-bridge University Press
Shimojo S amp Nakayama K (1990) Amodal representation of oc-cluded surfaces Role of invisible stimuli in apparent motion corre-spondences Perception 19 285-299
Smits J T amp Vos P G (1987) The perception of continuous curvesin dot stimuli Perception 16 121-131
Smits J T Vos P G amp van Oeffelen M P (1985) The perceptionof a dotted line in noise A model of good continuation and some ex-perimental results Spatial Vision 1 163-177
Treisman A (1982) Perceptual grouping and attention in visual searchfor features and for objects Journal of Experimental PsychologyHuman Perception amp Performance 8 194-214
Weiss Y amp Adelson E H (1998) Slow and smooth A Bayesian the-ory for the combination of local motion signals in human vision (AIMemo No 1624) Cambridge MA Massachusetts Institute of Tech-nology Artificial Intelligence Laboratory
Yuille A L amp Buumllthoff H H (1996) Bayesian decision theory andpsychophysics In D C Knill amp W Richards (Eds) Perception asBayesian inference (pp 123-162) Cambridge Cambridge UniversityPress
Zucker S W Stevens K A amp Sander P (1983) The relation be-tween proximity and brightness similarity in dot patterns Perceptionamp Psychophysics 34 513-522
(Manuscript received August 15 2000 revision accepted for publication January 31 2001)
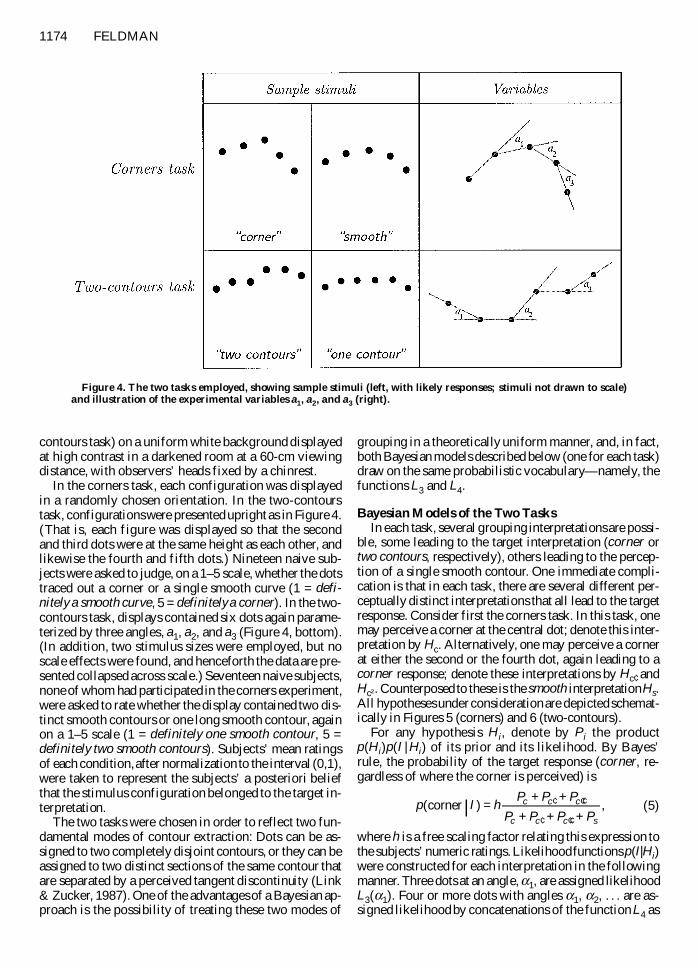
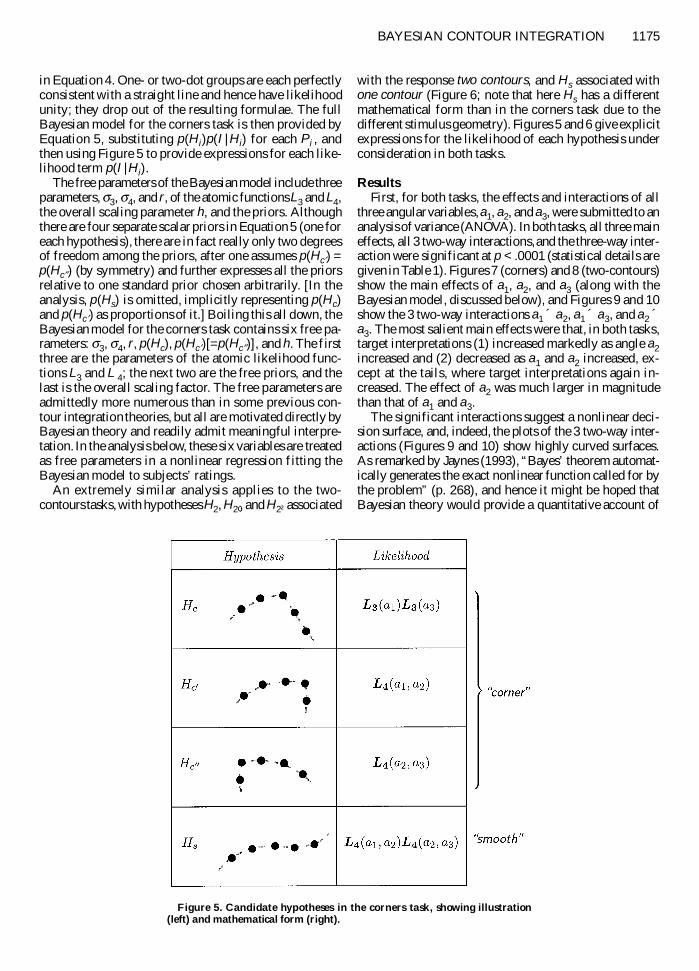
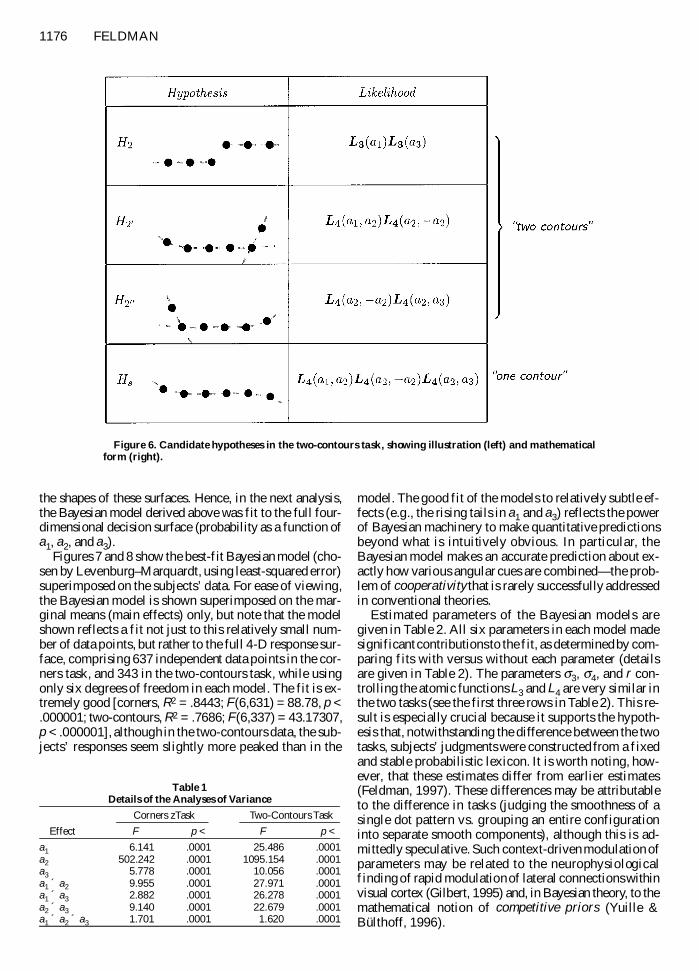
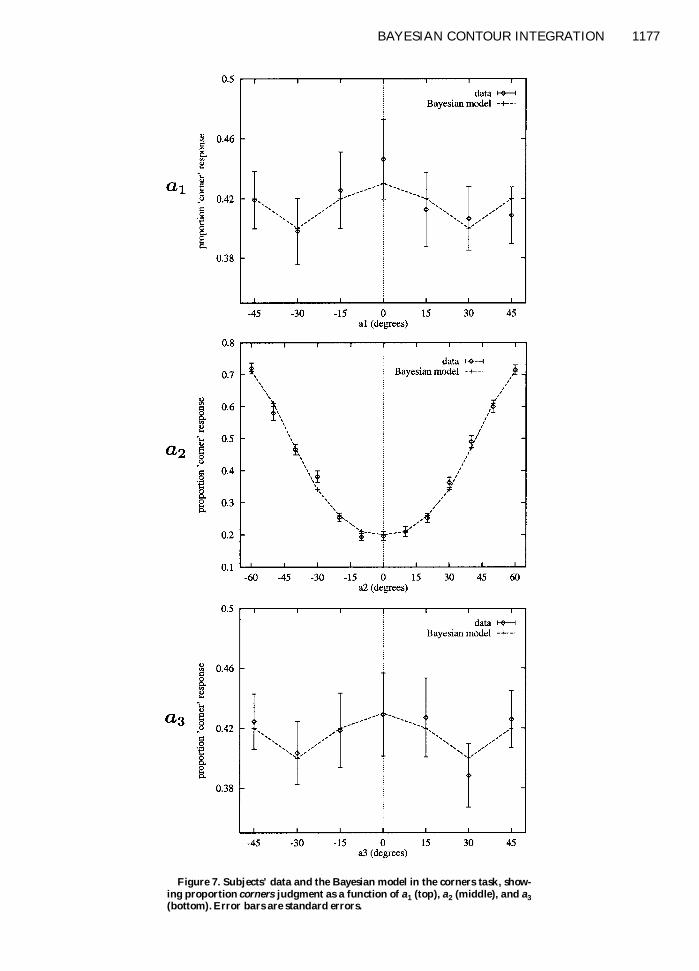
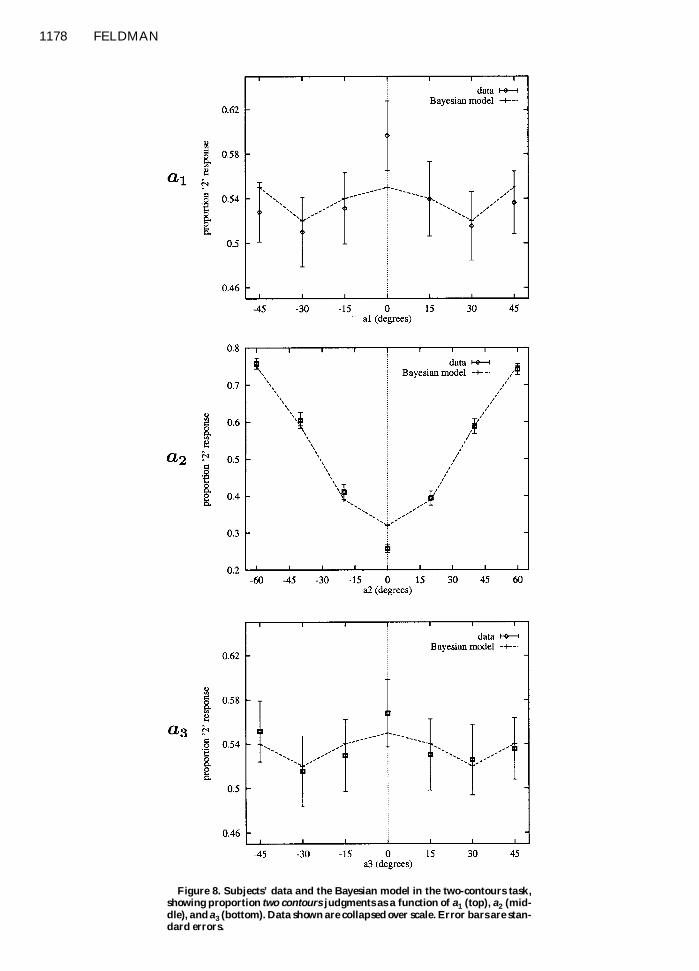
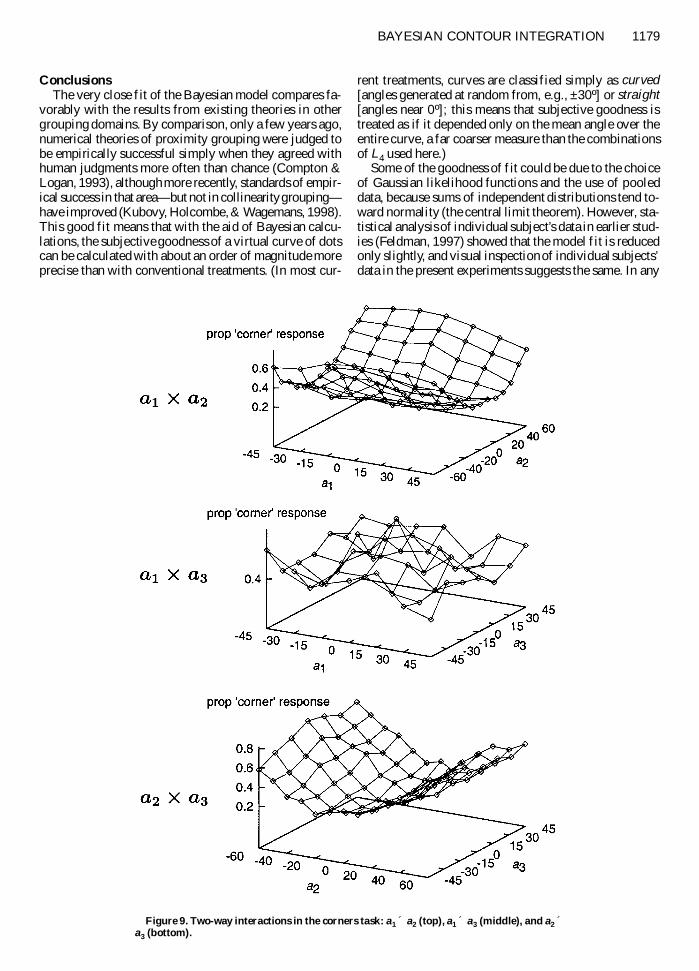
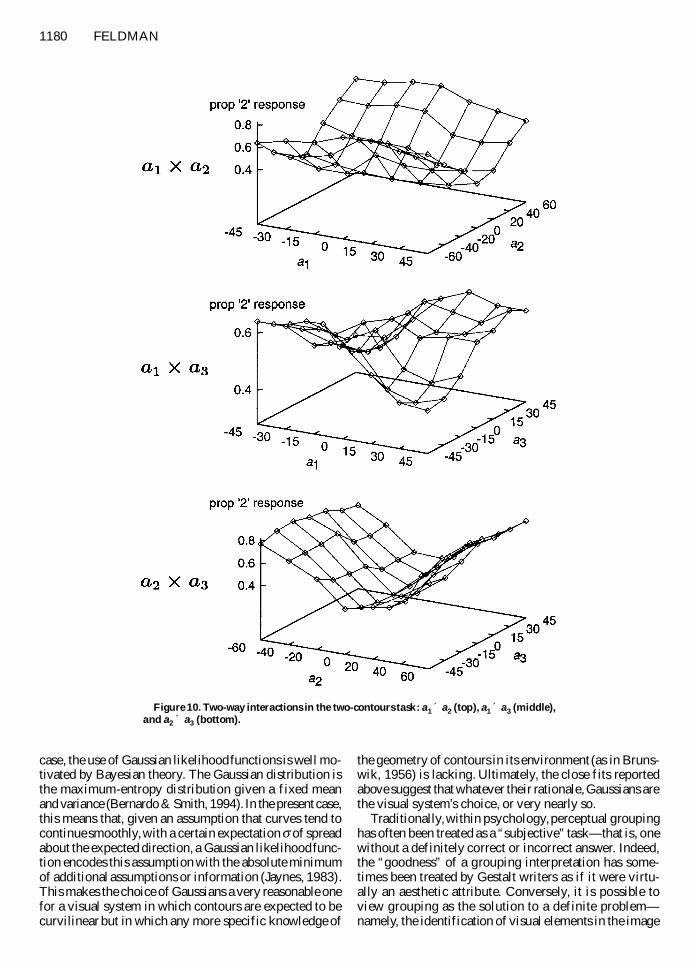
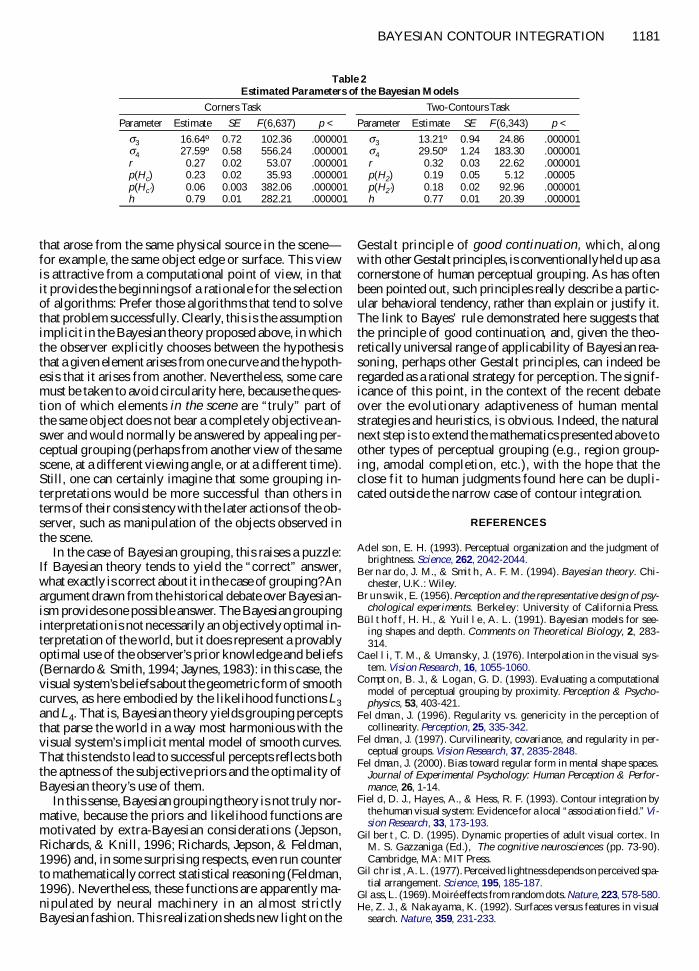