FELDA
93
Plantations MALAYSIA August 6, 2012 IMPORTANT DISCLOSURES, INCLUDING ANY REQUIRED RESEARCH CERTIFICATIONS, ARE PROVIDED AT THE END OF THIS REPORT. Designed by Eight, Powered by EFA Coming into bloom Conceived as the vehicle for FELDA’s global expansion and growth ambitions, Felda Global Ventures Holdings (FGVH) is already a major palm oil force in Malaysia. It aims to become a dominant global agribusiness group over the next few years. We initiate coverage on FGVH with a Neutral call and RM5.05 target price (based on a 10% discount to SOP). The stock offers growth prospects given the improving efficiency at its estates, the turnaround of its overseas assets and M&A activities. However, this is already reflected in the current share price as valuations are in line with peers. Dominant agri group FGVH is a global agribusiness group with operations in over 10 countries though its key operating assets are mostly in Malaysia. It is the third largest palm oil estate operator in the world and, through 49%-associate Felda Holdings Berhad, is the world’s largest CPO producer and the second largest Malaysian palm oil refiner. The group is the largest sugar refiner in Malaysia through MSM Holdings. The group’s dominant position in the palm oil space provides it with better economies of scale. There are plans to expand its agribusiness to ASEAN and Africa and build its downstream value-add. We expect the group to leverage its links with the government in its pursuit of overseas M&As. Room for growth There is scope to improve its estate yields and oil extraction rates at its mills by replanting old trees with higher-yield seeds and consolidating the management of its estates. The group plans to improve its estates’ age profile over the next five years through more aggressive replanting. Plans are also underway to merge the management of its smaller estates to reduce costs. We estimate every 1 tonne/ha gain in FFB yields would add 6% to its FY13 net profit forecast. In line with peers We start coverage on the stock with a Neutral call as current valuations, which are in line with peers, are already fairly pricing in the group’s earnings potential. We would turn more positive on the group if it is successful in its plans to acquire earnings-accretive M&As. Notes from the Field Ivy Ng Lee Fang CFA T (60) 3 20849697 E [email protected] Company Visit Expert Opinion Channel Check Customer Views “M&A is the key. We will expand our plantation estates, whether for greenfields or brownfields.” – Dato’ Sabri, Group President and CEO Felda Global Ventures COMPANY NOTE FGV MK / FGVH.KL Current RM5.05 SHORT TERM (3 MTH) LONG TERM Market Cap Avg Daily Turnover Free Float Target RM5.05 US$5,887m US$42.55m 49.2% Previous Target N/A RM18,423m RM135.2m 3,648 m shares Up/downside 0.0% Conviction 97 101 105 110 114 118 122 4.4 4.6 4.8 5.0 5.2 5.4 5.6 Price Close Relative to FBMKLCI (RHS) Source: Bloomberg 50 100 150 200 250 300 Jun-12 Jul-12 Jul-12 Jul-12 Vol m Financial Summary Dec-11A Dec-12F Dec-13F Dec-14F Revenue (RMm) 7,475 10,372 11,486 11,905 Operating EBITDA (RMm) 1,247 1,386 1,546 1,643 Net Profit (RMm) 942 1,050 1,250 1,347 Core EPS (RM) 0.35 0.33 0.34 0.37 Core EPS Growth 0.00% (5.85%) 3.04% 7.74% FD Core P/E (x) 14.30 17.55 14.74 13.68 DPS (RM) 0.00 0.14 0.17 0.18 Dividend Yield 0.00% 2.85% 3.39% 3.65% EV/EBITDA (x) 10.00 8.10 8.37 7.70 P/FCFE (x) 6.53 45.04 30.28 19.10 Net Gearing 45.0% (51.5%) (47.5%) (46.7%) P/BV (x) 11.37 3.07 2.78 2.52 Recurring ROE 29.2% 19.8% 19.3% % Change In Core EPS Estimates CIMB/consensus EPS (x) 1.03 1.14 1.21 5.05 5.05 4.55 5.50 Target 52-week share price range Current SOURCE: CIMB, COMPANY REPORTS
Transcript of FELDA

Plantations MALAYSIA August 6, 2012
IMPORTANT DISCLOSURES, INCLUDING ANY REQUIRED RESEARCH CERTIFICATIONS, ARE PROVIDED AT THE END OF THIS REPORT. Designed by Eight, Powered by EFA
Coming into bloom Conceived as the vehicle for FELDA’s global expansion and growth ambitions, Felda Global Ventures Holdings (FGVH) is already a major palm oil force in Malaysia. It aims to become a dominant global agribusiness group over the next few years.
We initiate coverage on FGVH with a Neutral call and RM5.05 target price (based on a 10% discount to SOP). The stock offers growth prospects given the improving efficiency at its estates, the turnaround of its overseas assets and M&A activities. However, this is already reflected in the current share price as valuations are in line with peers.
Dominant agri group FGVH is a global agribusiness group with operations in over 10 countries though its key operating assets are mostly in Malaysia. It is the third largest palm oil estate operator in the world and, through 49%-associate Felda Holdings Berhad, is the world’s largest CPO producer and the second largest Malaysian palm oil refiner. The group is the largest sugar refiner in Malaysia through MSM Holdings. The group’s dominant position in the palm oil space provides it with better economies of scale. There are plans to expand its agribusiness to ASEAN and Africa and build its downstream value-add. We expect the group to
leverage its links with the government in its pursuit of overseas M&As.
Room for growth There is scope to improve its estate yields and oil extraction rates at its mills by replanting old trees with higher-yield seeds and consolidating the management of its estates. The group plans to improve its estates’ age profile over the next five years through more aggressive replanting. Plans are also underway to merge the management of its smaller estates to reduce costs. We estimate every 1 tonne/ha gain in FFB yields would add 6% to its FY13 net profit forecast.
In line with peers We start coverage on the stock with a Neutral call as current valuations, which are in line with peers, are already fairly pricing in the group’s earnings potential. We would turn more positive on the group if it is successful in its plans to acquire earnings-accretive M&As.
Notes from the Field
Ivy Ng Lee Fang CFA
T (60) 3 20849697 E [email protected]
Company Visit Expert Opinion
Channel Check Customer Views
“M&A is the key. We will expand our plantation estates, whether for greenfields or brownfields.”
– Dato’ Sabri, Group
President and CEO
Felda Global Ventures COMPANY NOTE FGV MK / FGVH.KL Current RM5.05 SHORT TERM (3 MTH) LONG TERM
Market Cap Avg Daily Turnover Free Float Target RM5.05 US$5,887m US$42.55m 49.2% Previous Target N/A RM18,423m RM135.2m 3,648 m shares Up/downside 0.0%
Conviction
Sources: CIMB. COMPANY REPORTS
97
101
105
110
114
118
122
4.4
4.6
4.8
5.0
5.2
5.4
5.6
Price Close Relative to FBMKLCI (RHS)
Source: Bloomberg
50100150200250300
Jun-12 Jul-12 Jul-12 Jul-12
Vo
l m
Financial Summary
Dec-11A Dec-12F Dec-13F Dec-14F
Revenue (RMm) 7,475 10,372 11,486 11,905
Operating EBITDA (RMm) 1,247 1,386 1,546 1,643
Net Profit (RMm) 942 1,050 1,250 1,347
Core EPS (RM) 0.35 0.33 0.34 0.37
Core EPS Growth 0.00% (5.85%) 3.04% 7.74%
FD Core P/E (x) 14.30 17.55 14.74 13.68
DPS (RM) 0.00 0.14 0.17 0.18
Dividend Yield 0.00% 2.85% 3.39% 3.65%
EV/EBITDA (x) 10.00 8.10 8.37 7.70
P/FCFE (x) 6.53 45.04 30.28 19.10
Net Gearing 45.0% (51.5%) (47.5%) (46.7%)
P/BV (x) 11.37 3.07 2.78 2.52
Recurring ROE 29.2% 19.8% 19.3%
% Change In Core EPS Estimates
CIMB/consensus EPS (x) 1.03 1.14 1.21
5.05
5.05
4.55 5.50
Target
52-week share price range
Current
SOURCE: CIMB, COMPANY REPORTS

Felda Global Ventures
August 6, 2012
2
PEER COMPARISON
Research Coverage
Bloomberg Code Market Recommendation Mkt Cap US$m Price Target Price Upside
Felda Global Ventures FGV MK MY NEUTRAL 5,887 5.05 5.05 0.0%
Genting Plantations GENP MK MY NEUTRAL 2,253 9.29 9.56 2.9%
Hap Seng Plantations HAPL MK MY TRADING BUY 767 3.00 3.45 15.0%
IOI Corporation IOI MK MY NEUTRAL 10,640 5.18 5.11 -1.4%
Kuala Lumpur Kepong KLK MK MY UNDERPERFORM 8,111 23.78 21.60 -9.2%
Sime Darby Bhd SIME MK MY TRADING BUY 18,837 9.81 11.00 12.1%
0.0
1.0
2.0
3.0
4.0
5.0
6.0
7.0
Jan-08 Jan-09 Jan-10 Jan-11 Jan-12
Rolling P/BV (x)
Felda Global Ventures Genting Plantations Hap Seng Plantations
IOI Corporation Kuala Lumpur Kepong
0
5
10
15
20
25
30
35
Jan-08 Jan-09 Jan-10 Jan-11 Jan-12
Rolling FD Core P/E (x)
Felda Global Ventures Genting Plantations Hap Seng Plantations
IOI Corporation Kuala Lumpur Kepong
0%
5%
10%
15%
20%
25%
30%
35%
40%
45%
50%
0.0
0.5
1.0
1.5
2.0
2.5
3.0
3.5
4.0
4.5
5.0
Jan-08 Jan-09 Jan-10 Jan-11 Jan-12 Jan-13
Peer Average: P/BV vs Recurring ROE
Rolling P/BV (x) (lhs) Recurring ROE (rhs)
-40%
-7%
27%
60%
93%
127%
160%
0
5
10
15
20
25
30
Jan-08 Jan-09 Jan-10 Jan-11 Jan-12 Jan-13
Peer Average: FD Core P/E vs FD Core EPS Growth
Rolling FD Core P/E (x) (lhs) FD Core EPS Growth (rhs)
Valuation
FD Core P/E (x) P/BV (x) EV/EBITDA (x)
Dec-11 Dec-12 Dec-13 Dec-11 Dec-12 Dec-13 Dec-11 Dec-12 Dec-13
Felda Global Ventures 14.30 17.55 14.74 11.37 3.07 2.78 10.00 8.10 8.37
Genting Plantations 15.88 18.57 14.89 2.17 2.01 1.83 10.75 12.77 10.05
Hap Seng Plantations 9.49 12.27 10.18 1.28 1.23 1.17 6.23 7.80 6.37
IOI Corporation 17.12 15.74 14.19 2.74 2.58 2.44 11.55 11.25 10.37
Kuala Lumpur Kepong 18.71 18.94 16.07 3.56 3.38 3.04 11.54 12.14 10.90
Sime Darby Bhd 15.50 14.27 13.37 2.37 2.21 2.04 9.04 8.52 7.93
Growth and Returns
FD Core EPS Growth Recurring ROE Dividend Yield
Dec-11 Dec-12 Dec-13 Dec-11 Dec-12 Dec-13 Dec-11 Dec-12 Dec-13
Felda Global Ventures na -18.5% 19.0% 29.2% 19.8% 0.00% 2.85% 3.39%
Genting Plantations 35.5% -14.5% 24.7% 14.5% 11.2% 12.9% 1.73% 1.62% 2.01%
Hap Seng Plantations 49.6% -22.7% 20.5% 13.9% 10.2% 11.8% 6.67% 5.00% 5.33%
IOI Corporation 9.4% 8.8% 10.9% 16.7% 16.9% 17.7% 3.00% 3.19% 3.52%
Kuala Lumpur Kepong 24.6% -1.2% 17.9% 20.2% 18.3% 19.9% 3.41% 2.97% 3.06%
Sime Darby Bhd 15.8% 8.6% 6.8% 16.1% 16.0% 15.8% 3.22% 3.50% 3.74%
SOURCE: CIMB, COMPANY REPORTS
Calculations are performed using EFA™ Monthly Interpolated Annualisation and Aggregation algorithms to December year ends

Felda Global Ventures August 6, 2012
3
Weaker FFB production and
lower palm products prices to
dampen FY12 earnings
although these are partially
offset by lower losses from
the downstream division.
The group targets to pay out
50% of net income as
dividends.
Share price info
Share px perf. (%) 1M 3M 12M
Relative -9.2
Absolute -7.5
Major shareholders % held
Federal Land Development Authority 37.0
Lembaga Tabung Haji 7.5
KWAP 6.3
0%
6%
12%
18%
23%
29%
35%
0.0
1.0
2.0
3.0
4.0
5.0
6.0
Jan-08 Jan-09 Jan-10 Jan-11 Jan-12 Jan-13
P/BV vs Recurring ROE
Rolling P/BV (x) (lhs) Recurring ROE (rhs)
-25%-19%-14%-8%-3%3%8%14%19%25%
16.1516.2016.2516.3016.3516.4016.4516.5016.5516.60
Jan-08 Jan-09 Jan-10 Jan-11 Jan-12 Jan-13
FD Core P/E vs FD Core EPS Growth
Rolling FD Core P/E (x) (lhs) FD Core EPS Growth (rhs)
Profit & Loss
(RMm) Dec-11A Dec-12F Dec-13F Dec-14F
Revenue 7,475 10,372 11,486 11,905
Other Operating Income
Cost Of Sales (5,464) (8,352) (9,240) (9,543)
Gross Profit 2,010 2,020 2,246 2,362
Total Operating Costs (889.4) (779.0) (858.3) (890.3)
Operating Profit 1,121 1,241 1,388 1,471
Operating EBITDA 1,247 1,386 1,546 1,643
Depreciation And Amortisation (125.6) (145.2) (157.7) (171.4)
Operating EBIT 1,121 1,241 1,388 1,471
Net Interest Income (103.2) (42.5) 34.3 48.4
Exchange Gains - - - -
Other Income 78.84 10.00 10.00 10.00
Associates' Profit 275.4 276.4 309.1 335.0
Profit Before Tax (pre-EI) 1,372 1,485 1,742 1,865
Exceptional Items - - - -
Pre-tax Profit 1,372 1,485 1,742 1,865
Taxation (357.4) (302.1) (358.1) (382.5)
Exceptional Income - post-tax - - - -
Profit After Tax 1,015 1,183 1,383 1,482
Minority Interests (72.5) (132.6) (133.6) (135.9)
Other Adjustments - post-tax - - - -
Net Profit 942 1,050 1,250 1,347
Recurring Net Profit 942 1,050 1,250 1,347
Cash Flow
(RMm) Dec-11A Dec-12F Dec-13F Dec-14F
Pre-tax Profit - 1,484.7 1,741.6 1,864.9
Depreciation And Non-cash Adj. - (88.7) (185.6) (212.0)
Change In Working Capital - (241.9) (93.4) (35.5)
Tax Paid - (357.4) (302.1) (358.1)
Other Operating Cashflow - 634.4 277.7 519.0
Cashflow From Operations - 1,431.1 1,438.2 1,778.3
Capex - (250.0) (350.0) (350.0)
Disposals Of FAs/subsidiaries - - 0.0 0.0
Acq. Of Subsidiaries/investments - - - -
Other Investing Cashflow - (164.9) (285.0) (283.0)
Cash Flow From Investing - (414.9) (635.0) (632.9)
Debt Raised/(repaid) - (729.0) (229.0) (229.0)
Equity Raised/(Repaid) - 4,459.0 - -
Dividends Paid - (525.0) (624.9) (673.3)
Net Cash Interest - 66.8 34.3 48.4
Other Financing Cashflow - (333.6) 78.8 27.5
Cash Flow From Financing - 2,938.2 (740.8) (826.4)
Total Cash Generated - 3,954.5 62.4 318.9
Change In Net Cash - 4,683.4 291.4 547.9
Free Cashflow To Equity - 354.1 608.5 964.7
BY THE NUMBERS
SOURCE: CIMB, COMPANY REPORTS

Felda Global Ventures August 6, 2012
4
The group is in a net cash
position following the IPO
exercise, which raised
around RM4.5bn.
Balance Sheet
(RMm) Dec-11A Dec-12F Dec-13F Dec-14F
Fixed Assets 1,703 1,808 2,303 2,653
Intangible Assets 662.7 662.7 662.7 662.7
Other Long Term Assets 6,145 6,226 6,318 6,419
Total Non-current Assets 8,511 8,697 9,284 9,735
Total Cash And Equivalents 1,734 5,496 5,345 5,439
Inventories 464.1 644.0 713.2 739.2
Accounts Receivable 407.7 564.1 624.2 646.8
Other Current Assets 35.77 35.77 35.77 35.77
Total Current Assets 2,642 6,739 6,718 6,861
Trade Creditors 245.0 339.9 376.4 390.2
Short-term Debt 762.0 262.0 262.0 262.0
Other Current Liabilities 816.0 816.0 816.0 816.0
Total Current Liabilities 1,823 1,418 1,454 1,468
Total Long-term Debt 1,876 1,647 1,418 1,189
Other Liabilities 5,309 5,270 5,270 5,270
Deferred Tax 136.9 136.9 136.9 136.9
Total Non-current Liabilities 7,321 7,053 6,824 6,595
Shareholders' Equity 1,185 6,009 6,634 7,307
Minority Interests 823 956 1,090 1,225
Preferred Shareholders Funds -
Total Equity 2,008 6,965 7,723 8,533
Key Drivers
Dec-11A Dec-12F Dec-13F Dec-14F
Planted Estates (ha) 323,588 323,588 323,588 323,588
Mature Estates (ha) 267,671 267,671 255,436 254,864
FFB Yield (tonnes/ha) 19.9 18.8 19.9 20.2
FFB Output Growth (%) 7.0% -5.8% 4.1% 1.1%
CPO Price (US$/tonne) 3,219 3,130 3,160 3,200
BY THE NUMBERS
Key Ratios
Dec-11A Dec-12F Dec-13F Dec-14F
Revenue Growth N/A 38.8% 10.7% 3.6%
Operating EBITDA Growth N/A 11.2% 11.5% 6.3%
Operating EBITDA Margin 16.7% 13.4% 13.5% 13.8%
Net Cash Per Share (RM) (0.34) 0.98 1.00 1.09
BVPS (RM) 0.44 1.65 1.82 2.00
Gross Interest Cover 7.94 11.13 13.72 16.19
Tax Rate 26.0% 20.3% 20.6% 20.5%
Net Dividend Payout Ratio 0.0% 50.0% 50.0% 50.0%
Accounts Receivables Days N/A 17.15 18.88 19.48
Inventory Days N/A 24.28 26.81 27.77
Accounts Payables Days N/A 12.82 14.15 14.66
ROIC (%) N/A 16.3% 16.9% 16.7%
ROCE (%) N/A 19.4% 16.7% 16.6%
SOURCE: CIMB, COMPANY REPORTS

Felda Global Ventures August 6, 2012
5
Coming into bloom 1. BACKGROUND
1.1 Global agribusiness group
Felda Global Ventures Holdings (FGVH) is a Malaysian-based global agribusiness group with operations spanning over 10 countries. The group is the third largest oil palm operator in the world and the largest sugar refiner in Malaysia. Its 49%-owned associate Felda Holdings Berhad (FHB) is the largest CPO producer in the world and the second largest palm oil refiner in Malaysia by capacity. Apart from palm oil and sugar, the group is also involved in soybean and canola crops through its crushing and refining operations in Canada. The company was listed on Bursa Malaysia on 28 June 2012.
Figure 1: FGVH’s key business activities
Plantations Downstream Sugar Felda Holdings Bhd (FHB)
Malaysia
•Approximately 355,864 ha of
plantations on leased land and
managed land
oPrimarily oil palmsoSmall proportion of rubber
plantations
Indonesia
•14,385 ha of 95%-owned oil palm estate
•42,000 ha of oil palm estate
through JV
Overseas
•1 wholly-owned oleochemical
facility in the US
•1 wholly owned soybean and
canola crushing and refining facility in Canada
Through JV
•2 refineries in Malaysia
•4 refineries in Indonesia, China, and Turkey
•2 downstream processing
facilities in China and South
Africa
•1 other oils and fats facility in the US
•Contract with Felda Palm Industries (FPI), 72% subsidiary of
FHB, for use of palm oil mills
-FFB processing for substantially all internal crop
-CPO offtake for substantially all of FPI’s internal and
external crop*.
Malaysia
•1 sugar milling facility
•2 sugar refineries
•20% stake inTradewinds (M)
Bhd•2 additional sugar refineries in
Malaysia through Tradewinds
(M)
Palm Oil Operations
•70 operating palm oil mills,
•5 palm oil refineries in
Malaysia , 1 refinery in
Pakistan through an associate, and 1 refinery in China through
JV
•1 oleochemical plant through
an associate
Other Businesses
•Research & Development
(12,746 ha of oil palm estates)
•Manufacturing of rubber,
cocoa, and fertiliser products•Livestock operations
•Bulking installations
•Transportation services
•Travel and tourism
•Other businesses
FGVH
FELDA
KPF
100% 100% 51% 51%49%
Ownership relationship
Contractual relationship
*Excluding consumption of Felda Palm Industry’s CPO by Delima Oil Products, FHB’s subsidiary. In 2011,
237,368MT of CPO was used by DOP.
SOURCES: CIMB, COMPANY REPORTS
Table of Contents
1. BACKGROUND p.5
2. BACKGROUND ON MAJOR SHAREHOLDER
p.9
3. BUSINESS ACTIVITIES p.12
4. COMPETITIVE ADVANTAGES p.22
5. OUTLOOK p.26
6. SWOT ANALYSIS p.36
7. RISKS p. 37
8. FINANCIALS p. 43
9. FORECAST p. 55
10. VALUATION AND RECOMMENDATION p. 59
APPENDICES p. 61

Felda Global Ventures August 6, 2012
6
1.2 Commercial arm of FELDA
The group has a relatively short history. It was incorporated on 19 December 2007 to spearhead government agency Felda Land Development Authority’s (FELDA) expansion into overseas markets and other agribusinesses (see Section 2 for more on FELDA).
Since its inception, FGVH has been actively acquiring assets and interests in companies from its parent and third parties. Although the group may be a relatively new kid on the block, some of its operating entities have a long history, dating back to as early as 1964. The group currently owns ten direct subsidiaries, two associates and two joint venture companies (see Appendix 2 for a more detailed corporate structure).
Figure 2: FGVH’s key milestones
FGVH incorporated
as a wholly owned
subsidiary of FELDA
2007 2008 2009 2010 2011
FGVH acquired FGV
North America from
FELDA
•Gaining control of TRT
Holdings, which operates oleochemical
facilities in Quincy,
Massachusetts, USA
FGVH acquired a 49%
equity interest in FHB
from FELDA
FGVH acquired a 50%
equity interest in FELDA IFFCO from
FHB
FGVH acquired a 50%
interest in Trurich from
Lembaga TabungHaji
2012
FGVH acquired 100%
interest in MSM, a 50%
interest in KGFP, a
20% stake in
Tradewinds (M) and 5,797 ha of sugar cane
plantation land from
PPB group
MSM Holdings
was listed on the
Main Market of
Bursa Securities
FGVH has
acquired a 95%
interest in PT Citra
Niaga Perkasa.
Introduction of New
Business Model
•Land Lease Agreement
and Sarawak Land
Management Agreement between FELDA and
FGVH regarding
approximately 355,864
ha of land
•FFB sale and CPO purchase agreement
between FGVH and FPI
SOURCES: CIMB, COMPANY REPORTS
1.3 Transformation into a leading CPO player
FGVH transformed itself into a global palm oil player after this year’s signing of two landmark agreements that are part of the FELDA group’s new business model plan:
(1) A land-lease agreement with FELDA made on 1 November 2011 but having effect as from 1 January 2012 that gives FGVH the right to lease 347,584ha of plantation estates in Malaysia for up to 99 years. The agreement was novated by FGVH to its wholly owned subsidiary, Felda Global Ventures Plantations (Malaysia) Sdn Bhd (FGVPM) held through Felda Global Ventures Plantations Sdn Bhd on 6 Jan 2012. Before this agreement, the estates were managed by a subsidiary of its associate Felda Holdings Berhad (FHB). There is also a management agreement with FELDA in relation to 8,280 of land in Sarawak.
(2) A contractual agreement between FGVPM and FHB’s subsidiary Felda Palm (F Palm) on 1 March 2012 to sell almost all the fresh fruit bunches (FFB) produced by its estates to F Palm’s mills. Under the same agreement, F Palm will sell a substantial portion of its total CPO production back to FGVPM which will resell it to third parties, FHB’s subsidiaries and joint ventures.

Felda Global Ventures August 6, 2012
7
We estimate that under this arrangement, the group will have access to 3.3m tonnes of CPO production in Malaysia to be traded or sold to related and third parties. This represents 17% of Malaysia’s palm oil output and 7% of global output, placing the group among the top two CPO traders in Malaysia.
1.4 Plantation is the largest earnings contributor
Plantation is the largest contributor to the group, accounting for 88.5% of group gross profit in FY11. We estimate that MSM Malaysia, its sugar division contributed 23% of its gross profit. Downstream division posted a gross loss of RM233.5m in FY11. Associates, led by 49%-owned Felda Holdings Berhad (FHB) and 20%-owned Tradewinds (M) were significant contributors, making up 24% of the group’s FY11 pretax profit. FGVH’s downstream division and joint ventures (50% stake in Felda IFFCO and Trurich) were loss-making in 2011.
Figure 3: FGVH’s FY11 gross profit by segment
1,779.5
464.4 (233.5)
2,010.4
0
500
1,000
1,500
2,000
2,500
Plantations Sugar Downstream Gross profit
(RM m)
SOURCES: CIMB, COMPANY REPORTS
Figure 4: FGVH’s FY11 pretax profit breakdown
2,027.0
1,819.5
1,372.0
(207.5)
(125.6)(530.0)
(103.2) 35.9
329.3 (54.0)
0
500
1,000
1,500
2,000
2,500
EBITDA exlc. Impairment
Impairment EBITDA incl. impairment
Depreciation LLA Net finance cost
Others Associates JV PBT
(RM m)
SOURCES: CIMB, COMPANY REPORTS
1.5 Assets mostly located in Malaysia
Most of the group’s operational assets are located in Malaysia. The group’s key overseas business exposure comes from (1) an oleochemical plant in the US, (2) soybean and canola crushing and refining facilities in Canada and (3) overseas refineries held through its JV, Felda IFFCO group. In FY11, 70% of the group’s

Felda Global Ventures August 6, 2012
8
revenue came from Malaysia, 20% from North America, 5% from Europe, 3% from Asia (ex-Malaysia) and 2% from others.
Figure 5: FGVH’s revenue by location
Title:
Source:
Please fill in the values above to have them entered in your report
78.6%
78.5%70.0%
3.9%
3.3%2.2%
4.8%
21.1%
13.7%
19.5%
0.3%
1.8%
2.4%
0
1,000
2,000
3,000
4,000
5,000
6,000
7,000
8,000
2009 2010 2011
Malaysia Asia (ex-M'sia) Europe N. America Others
(RM m)
SOURCES: CIMB, COMPANY REPORTS

Felda Global Ventures August 6, 2012
9
2. BACKGROUND ON MAJOR SHAREHOLDER
2.1 FELDA is a government agency
Felda Land Development Authority (FELDA) is a statutory body founded on 1 July 1956 under the Land Development Ordinance (Land Development Act), 1956. Its historical mission was to carry out land development and settlement in new areas to alleviate poverty.
From 1959 to 1990, which marked the end of Malaysia’s resettlement period, FELDA assisted in the resettlement of 114,400 households. By 1990, a total of 853,313ha had been brought under cultivation through FELDA’s operations. This comprises 317 settlement schemes and 152 estates in 12 of the 13 states in Malaysia.
FELDA is the sole owner of FGVH through its 20% direct stake and 17% indirect stake held through wholly-owned subsidiary Felda Asset Holdings Company Sdn Bhd (FAHC). FAHC was incorporated on 27 March 2012 as an investment holding company.
Figure 6: Shareholding structure of FGVH
FGVH
FAHC
FELDA
100%
17%
20%
Public60%
SOURCES: CIMB, COMPANY REPORTS
2.2 Connection to settlers
FELDA is currently responsible for ensuring that the agricultural activities undertaken by the settlers under the FELDA scheme are performed in a cost-effective and efficient manner. FELDA and its affiliate corporations including FGVH and FHB are involved in the following activities:
managing the operation of the holdings of certain settlers
sourcing and supply of inputs required for agricultural process to settlers
transporting settlers’ FFB to Felda Palm Industries’ palm oil mills for processing
downstream activities and sourcing markets for settlers’ end products
training settlers in modern and efficient agricultural methods and practices in order to improve yields
offering replanting services to settlers when oil palms and rubber trees are due for replanting.
On top of this, FELDA provides financial assistance to settlers when their oil palm estates are still immature. It also offers settlers integrated replanting and long-term management services on their oil palm holdings through contracts entered directly with the settlers.

Felda Global Ventures August 6, 2012
10
2.3 Background on FELDA settlers
FELDA estimates the number of FELDA settler households to be 112,635 currently. Its website puts the total estates under FELDA settlers at approximately 520,000ha. Each FELDA settler typically owns 10 (4ha) to 14 acres (5.7ha) of land cultivated with either oil palm or rubber. However, the majority of the settlers’ estates are devoted to oil palm. Also, each FELDA settlement scheme typically comprises 1,400 to 2,500ha.
The FELDA settlers’ scheme is similar to Indonesia’s plasma or smallholder scheme except that, in this case, a government agency in the form of FELDA rather than individual plantation owners (in the case of Indonesia) is responsible for developing the smallholder estates. The FELDA settlement scheme was discontinued in 1990 while the plasma scheme in Indonesia is still ongoing.
Figure 7: Basic facts about FELDA settlers (as at March 2012)
Number of settlers 112,635
Size of settlers' estate 521,938 ha
Average size of estate per household 4.6ha/settler
Average income earned by the settlers RM3,047 per month in 2010
Location of settlers P. Malaysia:
Northen region: 9%
East Coast region: 48%
Central region: 17%
Southern region: 26%
East Malaysia:
Sabah: 1% SOURCES: CIMB, FELDA WEBSITES
2.4 KPF links to settlers and FGVH
Apart from FELDA (government arm) and FGVH (commercial arm), there is a third entity linked to the FELDA group known as Koperasi Permodalan FELDA Malaysia (KPF). KPF is a cooperative for the settlers and employees of FELDA, FHB and FGVH. It was set up on 1 July 1980 to encourage savings and provide FELDA settlers with opportunities to participate in the companies involved in the commercial activities under the FELDA group. KPF currently owns the remaining 51% stake in Felda Holdings Berhad (FHB). Each settler household and eligible employee is eligible to subscribe to up to 250,000 units (RM250,000) in KPF. The cooperative has historically paid out good dividend yields of 10-15%, according to KPF’s websites.
Figure 8: Basic facts about KPF
As of 31 Dec 2010
Established in July 1980
Membership eligibility 1. Felda settlers/employees or
2. Spouse or children of Felda settlers/employees
Number of member Settler: 193,506
FELDA's employees: 26,701
Total fund size RM1.64bn
Average annual dividend return 14% SOURCES: CIMB, KPF WEBSITES

Felda Global Ventures August 6, 2012
11
Figure 9: How the FELDA group entities are linked
Felda Holdings Bhd
(Incorporated in 1995)
Felda Global Ventures
Holdings Bhd (incorporated
in 2007)
FELDA
37%
49%
51%
Koperasi Permodalan Felda
(Established in 1980)
Government agency:
Social responsibilities
Company: Commercial activities
Company: Domestic multi-crop
agro-based enterprises (Malaysia)
SOURCES: CIMB, COMPANY REPORTS

Felda Global Ventures August 6, 2012
12
3. BUSINESS ACTIVITIES
3.1 Plantations
FGVH’s plantation business can be divided into two parts (1) operating the estates leased from FELDA and its estates in Indonesia as well as managing affiliated estates, and (2) trading of crude palm oil (CPO) produce from its own estates and Felda Palm Industries (F Palm).
The group operates 355,864ha of FELDA leased and managed estates in Malaysia, of which 347,584ha are leased from FELDA for 99 years starting 1 Jan 2012. Oil palm makes up 97% of the planted area, with rubber (10,308ha) accounting for the remainder of the land leased from FELDA. Approximately 83% of the group’s estates are mature. Among the big-cap planters in Malaysia, the group has the second largest estates after Sime Darby.
It also owns estates in Indonesia through its 95% stake in PT Citra Niaga and 50% stake in Trurich, a joint venture with Lembaga Tabung Haji, Malaysia’s pilgrimage fund. PT Citra Niaga owns 14,385ha of estates in West Kalimantan while Trurich owns 42,000ha of estates in east and central Kalimantan.
It also indirectly owns and manages 12,746ha of land held by Felda Agricultural Services, a 76.9%-owned subsidiary of FHB. In total, the group has 424,995ha of land across all the businesses that are linked directly to the FELDA group.
Figure 10: Total estates under management by the group
Oil Palm
•Cultivated:
323,588 ha
•Uncultivated:
19,933 ha
Rubber
•10,308 ha in Pen.
M’sia
Timber
• 2,035 ha
Oil Palm
•11,723 ha
Other uses
•1,023 ha
Oil Palm
(Trurich JV)
•42,000 ha in
East/ Central
Kalimantan
Oil Palm (PT
Citra Niaga JV)
•14,385 ha in
West Kalimantan
IndonesiaMalaysia (Felda
Agricultural Services)
Malaysia (LLA and management agreement)
355,864 ha
50% 95%
Total Land Under Management
SOURCES: CIMB, COMPANY REPORTS
The plantation division has historically sold substantially all of the FFB production from the FELDA-leased and managed estates to Felda Palm Industries (F Palm), a subsidiary of FHB. This changed on 1 March 2012 following the inking of a contractual agreement between FGVPM, a wholly-owned subsidiary of FGVH and F Palm, which owns 70 palm oil mills in the country.
Under the agreement, F Palm will purchase substantially all of the FFB that FGVPM produces from the FELDA-leased estates. F Palm will produce crude palm oil (CPO) and palm kernel (PK) using the FFB it acquires from FGVPM and others.
Felda Global Ventures August 6, 2012
13
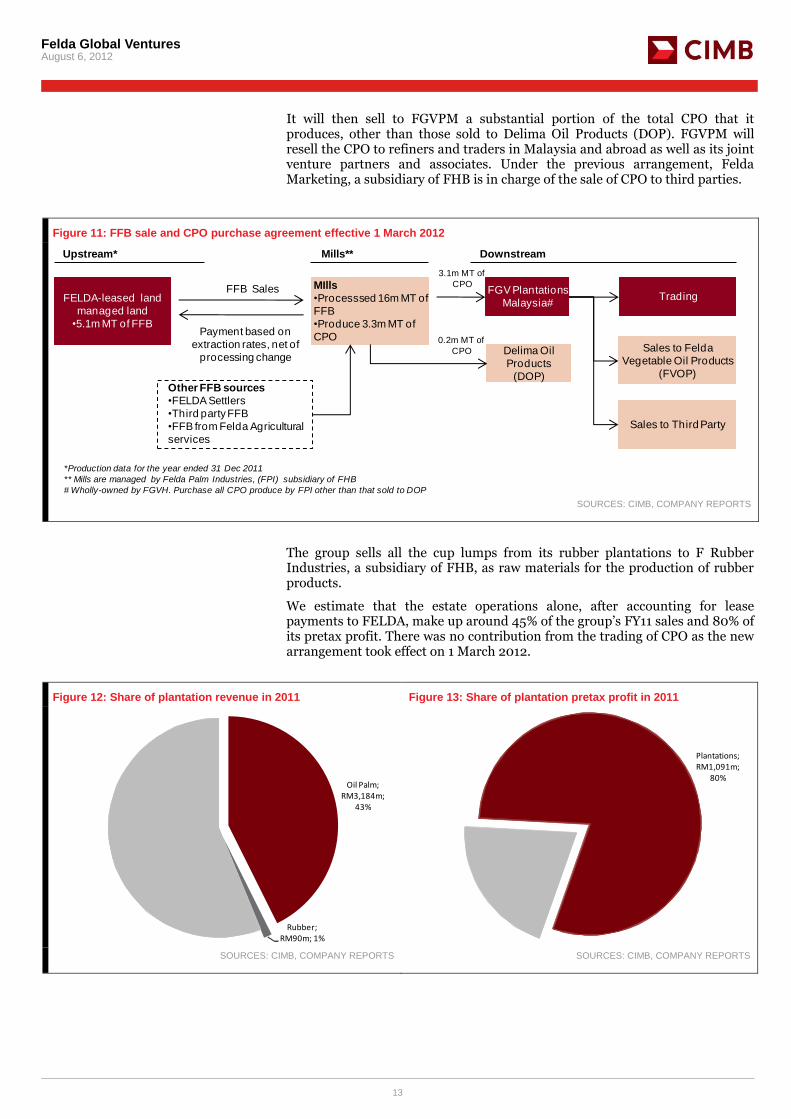
It will then sell to FGVPM a substantial portion of the total CPO that it produces, other than those sold to Delima Oil Products (DOP). FGVPM will resell the CPO to refiners and traders in Malaysia and abroad as well as its joint venture partners and associates. Under the previous arrangement, Felda Marketing, a subsidiary of FHB is in charge of the sale of CPO to third parties.
Figure 11: FFB sale and CPO purchase agreement effective 1 March 2012
FELDA-leased land
managed land
•5.1m MT of FFBPayment based on
extraction rates, net of
processing change
FGV Plantations
Malaysia#Trading
Sales to Felda
Vegetable Oil Products
(FVOP)
Sales to Third Party
Other FFB sources
•FELDA Settlers
•Third party FFB
•FFB from Felda Agricultural
services
Upstream* Downstream
Delima Oil
Products
(DOP)
MIlls
•Processsed 16m MT of
FFB
•Produce 3.3m MT of
CPO
FFB Sales
Mills**
3.1m MT of
CPO
0.2m MT of
CPO
*Production data for the year ended 31 Dec 2011
** Mills are managed by Felda Palm Industries, (FPI) subsidiary of FHB
# Wholly-owned by FGVH. Purchase all CPO produce by FPI other than that sold to DOP SOURCES: CIMB, COMPANY REPORTS
The group sells all the cup lumps from its rubber plantations to F Rubber Industries, a subsidiary of FHB, as raw materials for the production of rubber products.
We estimate that the estate operations alone, after accounting for lease payments to FELDA, make up around 45% of the group’s FY11 sales and 80% of its pretax profit. There was no contribution from the trading of CPO as the new arrangement took effect on 1 March 2012.
Figure 12: Share of plantation revenue in 2011 Figure 13: Share of plantation pretax profit in 2011
Title:
Source:
Please fill in the values above to have them entered in your report
Oil Palm; RM3,184m;
43%
Rubber; RM90m; 1%
Title:
Source:
Please fill in the values above to have them entered in your report
Plantations; RM1,091m;
80%
SOURCES: CIMB, COMPANY REPORTS SOURCES: CIMB, COMPANY REPORTS

Felda Global Ventures August 6, 2012
14
3.2 Downstream segment
The group’s downstream division consists mainly of its operations in North America. These include an oleochemical plant in Quincy, Massachusetts, US held by 100%-owned TRT Holdings and soybean and canola crushing and refining facilities held by 100%-owned TRT-ETGO in Becancour, Quebec Canada.
FGVH acquired the oleochemical plant in 2008 through the acquisition of FGV North America from FELDA in 2008. The TRT Holdings facility has an annual production capacity of 150,000 tonnes of fatty acids and 25,000 tonnes of glycerin. The plant’s utilisation rate was 88% in 2011. Most of the products are sold in the US.
TRT-ETGO owns and operates an integrated soybean and canola crushing and refining facility in Canada. The group started construction of this facility in 2008. The facility started operations in September 2010 and produces soy and canola oils as well as soy and canola meals from soybean and canola seeds. As at 31 March 2012, the facility has an annual crushing capacity of 1.05m tonnes of soybeans and canola seeds, annual oil refining capacity of 396,000 tonnes of soy and canola oil and annual meal production capacity of 720,000 tonnes.
As part of its turnaround plan for its overseas assets, the group entered into a tolling agreement with Bunge ETGO on 9 December 2011, under which Bunge ETGO will provide the group with canola and soybean seeds to be processed into soybean and canola products that Bunge ETGO will market and sell to end customers. Bunge ETGO is 49% owned by FGVH and Bunge Limited owns the remaining 51%. Following this arrangement, the group will no longer recognise revenue from the sale of soybean and canola products or cost of sales from the purchase of soybean and canola seeds.
The downstream division was unprofitable in the past two years, due mainly to weak profit margins, start-up costs and asset impairment. In FY11, this division accounted for 25% of the group’s revenue but posted a gross loss of RM234m.
The group is also exposed to downstream operations through its associate FHB and JV company, Felda IFFCO. But earnings from this division are captured under the JV and associates earnings of the group.
Figure 14: Share of downstream revenue in 2011 Figure 15: Historical gross profit/(loss) of downstream division
Title:
Source:
Please fill in the values above to have them entered in your report
Downstream; RM1,889m;
25%
17.0
(22.9) (233.5)
(250)
(200)
(150)
(100)
(50)
0
50
2009 2010 2011
(RM m)
SOURCES: CIMB, COMPANY REPORTS SOURCES: CIMB, COMPANY REPORTS

Felda Global Ventures August 6, 2012
15
3.3 Malaysia’s largest sugar refiner
The group bought the sugar business and 20% stake in Tradewinds (M) (TWI MK) from PPB Group for RM1.5bn in January 2010.
It reorganised the sugar business and incorporated MSM Malaysia Holdings (MSM MK) on 10 March 2011 as the listing vehicle for its sugar division. MSM Malaysia Holdings was listed on the main board of Bursa Malaysia on 28 June 2011 and boasts a market capitalisation of RM3,585m as at 2 August 2012.
Today, the group owns 51% of MSM Malaysia Holdings (MSM MK), which is the largest sugar refiner in the country. MSM produced 57% of the total sugar output in Malaysia in 2011. It owns and operates two sugar refineries in the country. Tradewinds (M) (TWI MK), FGVH’s 20%-owned associate, accounted for the remaining 47% of total refined sugar output in Malaysia.
The group’s sugar refining facilities in Prai and Chuping can produce up to 1.1m tonnes of refined sugar per annum. The refined sugar is packaged and sold under two key brands, “Gula Prai” and “Gula Perlis”, in Malaysia and other countries through traders, wholesalers and distributors. In 2011, 84% of the group’s output was sold locally and the remaining 16% was exported.
All of the group’s operating assets are located in Malaysia. MSM derives almost all of its earnings from the sugar refining business. In FY11, this division accounted for 31% of FGVH’s revenue and 26% of its pretax profit.
Figure 16: MSM’s corporate structure Figure 17: MSM produced 57% of the country’s 2011 sugar output
MSM Holdings, 57%
Tradewinds (M), 43%
SOURCES: CIMB, COMPANY REPORTS SOURCES: CIMB, COMPANY REPORTS
Astakonas (Logistics)
MSM Properties
Kilang Gula Felda Perlis
Malayan Sugar Manufacturing
(MSM)
MSM Holdings Bhd
10 0% 100%
100 % 100 %

Felda Global Ventures August 6, 2012
16
Figure 18: Sugar’s contribution to revenue in FY11 Figure 19: Sugar’s contribution to pretax profit in FY11
Title:
Source:
Please fill in the values above to have them entered in your report
Sugar; RM2,300m;
31%
Title:
Source:
Please fill in the values above to have them entered in your report
Sugar; RM359m; 26%
SOURCES: CIMB, COMPANY REPORTS SOURCES: CIMB, COMPANY REPORTS
Figure 20: Snapshot of the group’s sugar operations in Malaysia
SOURCES: CIMB, COMPANY REPORTS
Procurement Processing Sales and Distribution Customers
Sourcing of raw materials • Imports 100% of raw sugar
requirements from overseas
Processing capacities • MSM capacity – 960,000
tonnes/annum • KGFP capacity – 150,000
tonnes/annum Market leader with 57% share of total sugar output in the country in 2011
Distribution of finished products • Market products under “ Gula
Prai ” and “ Gula Perlis” brands • Sales team based in KL. • Domestic refined sugar products
are sold to distributor/retailers and industrial customers
Breakdown by sales volume in 2011
• Domestic – 81% of total • Local export* – 3% of total • Export – 12% of total • Others – 4 % of total * Sales to domestic customers who
use sugar purchased to manufacture products for export
Felda Global Ventures August 6, 2012
17
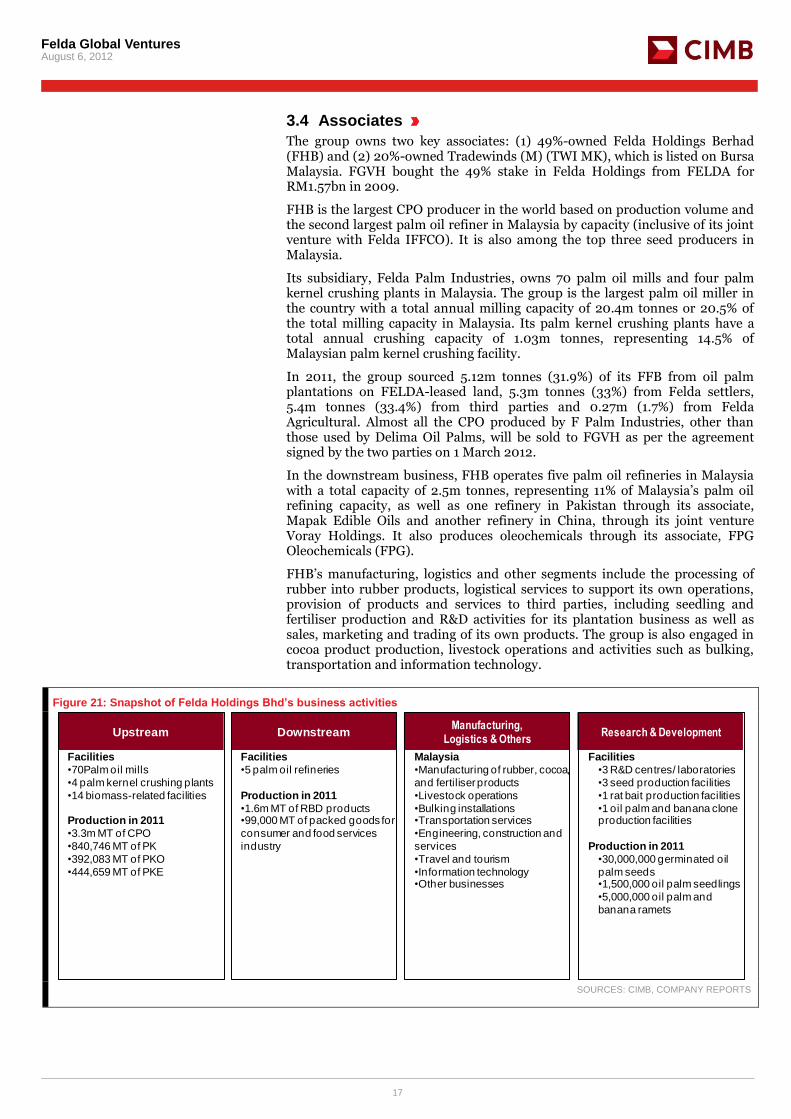
3.4 Associates
The group owns two key associates: (1) 49%-owned Felda Holdings Berhad (FHB) and (2) 20%-owned Tradewinds (M) (TWI MK), which is listed on Bursa Malaysia. FGVH bought the 49% stake in Felda Holdings from FELDA for RM1.57bn in 2009.
FHB is the largest CPO producer in the world based on production volume and the second largest palm oil refiner in Malaysia by capacity (inclusive of its joint venture with Felda IFFCO). It is also among the top three seed producers in Malaysia.
Its subsidiary, Felda Palm Industries, owns 70 palm oil mills and four palm kernel crushing plants in Malaysia. The group is the largest palm oil miller in the country with a total annual milling capacity of 20.4m tonnes or 20.5% of the total milling capacity in Malaysia. Its palm kernel crushing plants have a total annual crushing capacity of 1.03m tonnes, representing 14.5% of Malaysian palm kernel crushing facility.
In 2011, the group sourced 5.12m tonnes (31.9%) of its FFB from oil palm plantations on FELDA-leased land, 5.3m tonnes (33%) from Felda settlers, 5.4m tonnes (33.4%) from third parties and 0.27m (1.7%) from Felda Agricultural. Almost all the CPO produced by F Palm Industries, other than those used by Delima Oil Palms, will be sold to FGVH as per the agreement signed by the two parties on 1 March 2012.
In the downstream business, FHB operates five palm oil refineries in Malaysia with a total capacity of 2.5m tonnes, representing 11% of Malaysia’s palm oil refining capacity, as well as one refinery in Pakistan through its associate, Mapak Edible Oils and another refinery in China, through its joint venture Voray Holdings. It also produces oleochemicals through its associate, FPG Oleochemicals (FPG).
FHB’s manufacturing, logistics and other segments include the processing of rubber into rubber products, logistical services to support its own operations, provision of products and services to third parties, including seedling and fertiliser production and R&D activities for its plantation business as well as sales, marketing and trading of its own products. The group is also engaged in cocoa product production, livestock operations and activities such as bulking, transportation and information technology.
Figure 21: Snapshot of Felda Holdings Bhd’s business activities
Upstream DownstreamManufacturing,
Logistics & OthersResearch & Development
Facilities
•70Palm oil mills
•4 palm kernel crushing plants
•14 biomass-related facilities
Production in 2011
•3.3m MT of CPO
•840,746 MT of PK
•392,083 MT of PKO
•444,659 MT of PKE
Facilities
•5 palm oil refineries
Production in 2011
•1.6m MT of RBD products•99,000 MT of packed goods for
consumer and food services
industry
Malaysia
•Manufacturing of rubber, cocoa,
and fertiliserproducts
•Livestock operations
•Bulking installations•Transportation services
•Engineering, construction and
services
•Travel and tourism
•Information technology•Other businesses
Facilities
•3 R&D centres/ laboratories
•3 seed production facilities
•1 rat bait production facilities
•1 oil palm and banana clone production facilities
Production in 2011
•30,000,000 germinated oil
palm seeds•1,500,000 oil palm seedlings
•5,000,000 oil palm and
banana ramets
SOURCES: CIMB, COMPANY REPORTS

Felda Global Ventures August 6, 2012
18
Figure 22: Market share of refining capacity in Malaysia
FHB; 14%*
Wilmar; 19%
Mewah; 12%
IOI; 9%
SIME; 4%
KLK; 3%
Others; 39%
Total refining capacity:
24.0m MT/yr
*Include Felda IFFCO's refining capacity in Malaysia of 800,000 tonnes/yr
SOURCES: CIMB, COMPANY REPORTS
20%-associate Tradewinds (M) is listed on the Bursa Malaysia and has a market capitalisation of RM2,493m (as at 2 Aug 2012). It is a significant agricultural producer in Malaysia. It owns two sugar refineries in Malaysia and controls 43% of the sugar market in the country. It also owns 100,700ha of planted estates through its listed plantation arm, Tradewinds Plantations, making it the seventh largest listed plantation company by planted area in Malaysia. The group is also Malaysia’s largest rice miller and sole rice importer and distributor through its 72.57% stake in Padiberas Berhad.
FGVH’s associates have historically contributed RM329m-391m to group earnings, making up 24-75% of the group’s FY09-11 pretax profit.
Figure 23: Tradewinds (M)’s corporate structure
Tradewinds
Plantation
Retus
Plantation
Padiberas
Bhd
Central Sugar
Refinery
Gula Padang
Terap
Sugar DivisionRice DivisionPlantation Division
100% 100%
Tradewinds (M) Bhd
73%60%70%
SOURCES: CIMB, COMPANY REPORTS

Felda Global Ventures August 6, 2012
19
Figure 24: Snapshot of Tradewinds (M)’s business activities
•Oil palm plantation throughTradewindsPlantation Berhad.
•141,450 ha of land bank as of Dec 2011
•101,700 ha planted with oil planted palm and rubber
Plantations Sugar Rice
• Operates two sugar refineries with a combined capacity of
2,300mt a day.
•Operates paddy processing through its subsidiary, BERNAS.
•Control about 24% of the paddy market and
45% of the local rice demand.
SOURCES: CIMB, COMPANY REPORTS
Figure 25: Tradewinds (M)’s FY11 revenue breakdown Figure 26: Tradewinds (M)’s FY11 pretax profit breakdown
3,534.4
1,843.2
1,630.2 2.1 7,007.8
0
1,000
2,000
3,000
4,000
5,000
6,000
7,000
8,000
Rice Plantations Sugar Investment Holdings
total
(RM m)
855.7
303.8
575.0
249.5
203.7 (286.7)
991.0 (135.3)
0
200
400
600
800
1,000
1,200
1,400
Rice Plantations Sugar Others Elimination EBIT Finance cost
PBT
(RM m)
SOURCES: CIMB, COMPANY REPORTS SOURCES: CIMB, COMPANY REPORTS
3.5 Joint ventures
The group has two key joint ventures: (1) a 50% stake in Felda IFFCO, and (2) a 50% stake in Trurich Resources.
Felda IFFCO is a joint venture with IFFCO group, a mass-market consumer goods manufacturer and marketer based in the United Arab Emirates. Felda IFFCO owns two refineries in Malaysia as well as four palm oil refineries located in Indonesia, China, Turkey and two downstream processing facilities in China and South Africa with a total refining capacity of 2.1m tonnes as at 31 March 2012. It also operates sales and marketing offices in France and Spain and holds a 17% stake in AA Co, the largest beef cattle producing company in Australia by herd size.
Trurich Resources, a joint venture with Lembaga Tabung Haji, is involved in oil palm cultivation in Indonesia. As at 31 March 2012, it had 42,000ha of plantation land in east and central Kalimantan, out of which 13,905ha (33%) are planted.

Felda Global Ventures August 6, 2012
20
Figure 27: Key assets/investments by Felda IFFCO
Major Assets Effective
Interest
Additional information
Selangor, Malaysia 50.0% Refine both CPO and PKO into bulk and packed products for sale to other Felda IFFCO entities and external customers. Total
refining capacity: 542,500 tpa.
Johor, Malaysia 37.5% Refine CPO into bulk RBD products for sale to industrial users both in the Malaysian market and overseas markets, including
Southeast Asia, the United Arab Emirates, South Africa and North America. Total refining capacity: 490,000 tpa.
Batam, Indonesia 25.0% Refine CPO into bulk RBD products for sale to overseas markets, including South Asia, North Africa and the Middle East. The CPO
required for its operations is sourced from Tabung Haji Indo Plantation (THIP) and from other third parties within Indonesia. Total
refining capacity: 525,000 tpa.
Dongguan, China 48.5% The China operations do not conduct significant refining or downstream processing activities and, accordingly, do not have
meaningful capacity utilisation rates. Currently, the China operations focus mainly on refreshing or double fractionating oils on a
tolling basis. Total refining capacity: 630,000 tpa.
Izmir, Turkey 50.0% The Turkey operations refine soft oils, including canola, soy, olive and palm oils, sourced from the local market and FGVH's
Malaysian operations under Felda IFFCO to produce specialty fats such as margarines for sale to the retail and food service
sectors. Total refining capacity: 52,500 tpa.
Associate company
AA co 8.5% Largest cattle producing company in Australia by herd size. SOURCES: CIMB, COMPANY REPORTS
Figure 28: Annual capacity of Felda IFFCO’s palm oil refineries
Location Effective
Interest
Packed product
capacity#
(MT per year)
CPO PKO CPO PKO
Selangor, Malaysia 50.0% 350,000 192,500 262,500 70,000 653,100
Johor, Malaysia 37.5% 490,000 - 455,000 - 108,500
Batam, Indonesia 25.0% 525,000 - 525,000 87,500
Dongguan, China * 48.5% 630,000 - 930,000 - 152,000
Izmir, Turkey 50.0% 52,500* - - - 82,250**
Total - 2,047,500 192,500 2,172,500 70,000 1,083,350
#Capacity figures have not been discounted to reflect joint venture interest
Refining capacity# Fractionation
capacity#
(MT per year) (MT per year)
*Dongguan, China has two plants.
**Capacity includes soft oils, such as palm, soy, canola and sunflower oils.
SOURCES: CIMB, COMPANY REPORTS
Figure 29: Land and estates held through Trurich
6,000ha2,667ha
5,238ha
22,887ha
4,443ha
280ha
485ha
0
5,000
10,000
15,000
20,000
25,000
30,000
35,000
East Kalimantan Central Kalimantan
Immature Mature Greenfield land Remaining land
SOURCES: CIMB, COMPANY REPORTS

Felda Global Ventures August 6, 2012
21
Figure 30: FGVH’s share of results of associates and joint ventures
Title:
Source:
Please fill in the values above to have them entered in your report
349.2
391.2
329.3
8.8
(24.7)(54.0)
(100)
(50)
0
50
100
150
200
250
300
350
400
450
2009 2010 2011
Share of results from associates Share of results from jointly controlled entities(RM m)
SOURCES: CIMB, COMPANY REPORTS

Felda Global Ventures August 6, 2012
22
4. COMPETITIVE ADVANTAGES
In this section, we take a closer look at FGVH’s key strengths relative to its peers.
4.1 Economies of scale
FGVH is the third largest listed palm oil operator globally and it produced 5.5% of the total FFB production in Malaysia in 2011. In 2011, Malaysia’s planted oil palm area stood at 5m ha. At 323,588ha, FGVH’s planted oil palm estates in Malaysia accounted for 6.4% of the Malaysia’s total planted area and 3% of total planted oil palm area, globally. The group’s large-scale estate operations enable it to enjoy better bargaining power when it sources raw materials like fertiliser and sells its products. Its oil palm estates are also larger than its peers. For instance, its Sahabat palm oil estates in Sabah are located in one contiguous block of 95,542ha, representing 28% of the group’s oil palm estates on the FELDA-leased land. This allows the group to achieve better efficiency through lower transportation costs and optimal sharing of infrastructure (housing, mills, refineries, jetties, power plants and security and management resources in the estates. This enables the group to achieve lower estate costs at some of its estates compared to its smaller peers.
Figure 31: Third largest palm oil operator in the world Figure 32: FHB’s mills produced 17% of Malaysia’s 2011 CPO
SIME4.6%
GGR3.1% FGVH
2.9% WIL2.1%
IFAR/SIMP1.8%
TWB*0.8%
Other84.8%
*Planted area as at 31 Dec 2010
Total planted area:11.7m ha
3,112 (17%)
2,989(18%)
3,293(17%)
14,852 14,005
15,618
-
2,000
4,000
6,000
8,000
10,000
12,000
14,000
16,000
18,000
20,000
2009 2010 2011
FHB Malaysia (excl. FHB)
('000 tonnes)
SOURCES: CIMB, COMPANY REPORTS SOURCES: CIMB, COMPANY REPORTS
4.2 Integrated operations
The group’s palm oil operations are totally integrated. The activities of FGVH and its associate FHB span all aspects of the palm oil product value chain: (1) R&D and seedling production, (2) estate operations, (3) sourcing and processing of fresh fruit bunches for its mills, (4) processing of CPO into cooking oil, and (5) transportation and distribution of these products through its distribution channels. Through its integrated palm oil model, FGVH is able to capture every part of the value chain of the palm products. This will also enable it to control the quality of its products better, which is a plus given increasing consumer demand for traceability of products consumed.

Felda Global Ventures August 6, 2012
23
Figure 33: Integrated palm oil operations enable the group to capture every part of the palm oil value chain
355,864 ha of FELDA-leased and managed plantation
estates•343,521 ha of oil
palm plantations, producing 5.2m MT of FFB
•10,308 ha of rubber plantations
Plantations/ Estates Mills Refineries Logistics
Specialty Fats & Customers Products
70 Palm Oil Mills•20.4m tonnes of annual FFB
processing capacity•3.3m tonnes of CPO
produced
7 palm oil refineries•5 palm oil refineries through associate
(FHB) and 2 palm oil refineries through JV
(Felda IFFCO)•Capacity of 3.3m tonnes/yr (including
JV)
7 bulking installations•486 storage tanks with 752,250 tonnes
capacity
2 warehouses•88,000 tonnes storage capacity
7 distribution depots
• Production of 99,000 tonnes of packed goods from
consumers and food services industry
•Production of 1.6m tonnes of RBD
products
FGVHFHB (associate) & Felda IFFCO (JV)
SOURCES: CIMB, COMPANY REPORTS
4.3 Strong R&D support
Its investments in research & development in oil palm breeding and selection, biotechnology, agronomy and crop protection through FHB’s subsidiary, Felda Agricultural give the group direct access to high-yielding planting materials for its new planting and replanting programmes for the estates of the group as well as settlers. Felda Agricultural has a long track record in R&D spanning more than 40 years. The “Felda Yangambi” seeds produced by the group are capable of achieving FFB yields of above 30 tonnes/ha and OER of 25% based on field trials. This will significantly improve oil palm yields for the group’s and settlers’ estates that are planted with these superior planting materials. The better yields will flow through to its milling profit margins and oil extraction rates. The R&D team is also looking into biomolecular research and recently launched an applied technology division, which focuses on applying new technologies to improve the operations and efficiencies of its operations.
4.4 Captive supply of fruits from settlers and leased estates
The group’s FELDA-leased and managed estates and FELDA settlers supply 65% of FHB’s milling capacity. FHB’s mills have a captive market for FFB from these two parties, which in total own around 850,000ha or 17% of planted oil palm estates in Malaysia. Under a contractual agreement, FELDA-leased estates will sell substantially all of their FFB output to FHB’s mills. The FELDA settlers are obligated to sell all their FFB to FHB’s mills based on the agreement signed with FELDA. As such, the group is able to build bigger mills to achieve a lower cost of production. Its geographically diversified milling operations in the country also allow the group to purchase fruits from third-party estate owners in the country to raise the utilisation of its mills. It procures 33% of the FFB supply for its mills from third parties. In 2011, its milling division processed 16.1m tonnes of FFB, representing 17.7% of Malaysia’s total production. Its big market position gives the group stronger pricing power when it sells to the market.

Felda Global Ventures August 6, 2012
24
Figure 34: 2011 sources of FFB for FHB’s mills Figure 35: Market share of FHB’s capacities in Malaysia
Title:
Source:
Please fill in the values above to have them entered in your report
FGVH's leased land from
FELDA; 32%
FELDA Settlers ; 33%
Third parties; 33%
Felda Agricultural Services; 2%
20%
16%
11%
0%
5%
10%
15%
20%
25%
Mills PK Crushing Refinery
SOURCES: CIMB, COMPANY REPORTS SOURCES: CIMB, COMPANY REPORTS
4.5 Largest sugar producer in Malaysia
The group also owns the largest sugar refinery in the country. The larger scale of its operations relative to its peers allows it to purchase and store raw materials when market prices are favourable and optimise its operating costs through a greater volume of production. The MSM facility is strategically located adjacent to the Prai river near Penang Port and has onsite a dedicated jetty that enables barges to easily and cost-effectively offload imported raw sugar from the large vessels into storage for use in the refining process.
Its MSM facility is also located adjacent to the railway track which allows the group to transport its products to its warehouses in the central and south regions of Peninsular Malaysia. This places the group in a more competitive position than its peers in terms of transport costs and distribution.
Its other competitive advantage lies in its effective logistic infrastructure which integrates its storage, packing and distribution network to ensure timely delivery of the right quality products in the right quantity to its customers. The group has also built strong relationships with a broad base of 260 customers in Malaysia. The local sugar division also faces limited competition in the domestic market as there are currently only two sugar producers. FGVH owns stakes in both players.

Felda Global Ventures August 6, 2012
25
Figure 36: Daily raw sugar melting capacity Figure 37: Breakdown of sugar refining capacity
Title:
Source:
Please fill in the values above to have them entered in your report
-
500
1,000
1,500
2,000
2,500
3,000
3,500
MSM KGFP CSR GPT
(tonnes/day)
Title:
Source:
Please fill in the values above to have them entered in your reportMSM47%
KGFP9%
CSR31%
GPT13%
SOURCES: CIMB, COMPANY REPORTS SOURCES: CIMB, COMPANY REPORTS
4.6 Experience and professional management team
FGVH has a professional and experienced management team in the entire agribusiness value chain. Members of its key management team have on average 30 years of relevant experience in related fields. For instance, its group president and CEO has 42 years of experience in the agriculture industry, is a former CEO of Golden Hope Plantations and has served as the chairman of Malaysian Palm Oil Board. Its head of global plantations has over 25 years of experience in the agriculture industry while the head of the downstream division has over 30 years of relevant experience. The top four in its sugar division have between them more than 90 years in the Malaysian sugar industry.
4.7 Strong parentage
We believe the group’s association with its parent FELDA is a plus. FELDA has a strong reputation for successfully establishing the settlement programme in Malaysia. Many countries are currently following or studying the FELDA model for implementation in their own countries in order to develop their agriculture industry, reduce poverty and improve employment. We expect the group’s strong association with FELDA to help it to develop its overseas footprint.

Felda Global Ventures August 6, 2012
26
5. OUTLOOK
5.1 Beneficiary of strong demand prospects for CPO
We believe FGVH, as one of the largest palm oil operators in the world, is well-placed to benefit from the bullish long-term demand prospects for palm oil. We expect the usage of palm oil for food and non-food purposes to increase due to its attractive pricing relative to other edible oils, rising per capita consumption in China and India, higher usage in the US due to mandatory transfat labelling laws and rising usage of palm oil in Indonesia and Malaysia due to biodiesel mandates.
Palm oil is currently the cheapest edible oil in the market. This enabled it to raise its global edible oil market share. China, India and Pakistan are the three largest consumers of palm oil, consuming a combined 41% of global palm oil imports in 2011, based on statistics from Oil World publication.
We are positive on the potential demand growth in all these three countries in view of their rising affluence, low average per capita edible oil consumption relative to the global average and insufficient domestic oilseed production. Annual per capita consumption of edible oils is 11.4kg in India, 25kg in China and 21.6kg in Pakistan, still below the world’s average of 25.7kg.
The increasing use of edible oil for biodiesel production will lift the growth of non-food usage of edible oils. Currently, around 10% of the global supply of palm oil is used for biodiesel production. The demand growth for biodiesel will be supported by rising biodiesel mandates in Malaysia, Indonesia, Argentina, Brazil and US. However, biodiesel demand from Europe may slow down as governments may cut back subsidies to reduce their fiscal deficits.
Figure 38: Uses of edible oils and fats in 2011
SOURCES: CIMB, OIL WORLD
Figure 39: Per capita consumption of the world's 17 oils & fats for 2011 (kg)
Title:
Source:
Please fill in the values above to have them entered in your report
59.7
54.7
45
35.4
25
14.6
27.421.6
15.1
0
10
20
30
40
50
60
70
EU-27 USA Hong Kong Taiwan China India Indonesia Pakistan Nigeria
World average is 25.7 kg
SOURCES: CIMB, POC 2012
Biofuels Food Oleochemicals Others Soya oil 17% 77% 4% 2% Palm oil 10% 77% 8% 5% Rape oil 27% 67% 3% 3% Sun oil 2% 96% 1% 1% Tallow 13% 17% 55% 15% Lard 5% 65% 10% 20% Coconut 3% 50% 47% 0% Palm kernal oil 0% 28% 70% 2% Other oil <1%

Felda Global Ventures August 6, 2012
27
5.2 Weather concerns will prop up CPO prices
CPO prices started the year on a positive note due to concerns over the impact of drought on soybean crops in South America, rising crude oil prices, improving global economic prospects and better liquidity. We remain positive on CPO prices in 2H on the back of a smaller-than-expected soybean crop from North America, the result of unexpectedly low rainfall, which will tighten the supply of soybean oil and weaker 1H palm oil production from Malaysia.
Palm oil supply is expected to grow at a slower rate as Malaysian estates are projected to report lower production following the weak performance (-9% yoy) in 1H12. Demand for edible oil for food will remain favourable while growth in biodiesel demand may slow in view of slower rollout of mandates.
We think CPO prices may spike in the later part of the year if the drought in Midwest US persists and converges with a potential El Nino in 2H of this year. In our recent regional plantation report “Mercury Rising”, we indicated that if these two events happen concurrently, CPO prices may rise to as high as RM3,500 per tonne from the current level of RM2,950 per tonne. The other factor that is supportive of CPO prices is the widening discount against soybean oil, which may lead to substitution. We estimate that every RM100 per tonne change in CPO prices will impact our FY13 net profit forecast for the group by 3%.
Figure 40: Historical CPO prices
Title:
Source:
Please fill in the values above to have them entered in your report
1,000
1,500
2,000
2,500
3,000
3,500
4,000
4,500
300
500
700
900
1,100
1,300
1,500
Jan-06 Jul-06 Jan-07 Jul-07 Jan-08 Jul-08 Jan-09 Jul-09 Jan-10 Jul-10 Jan-11 Jul-11 Jan-12
(RM per tonne)(US$ per tonne)International CPO Prices (LHS) Local CPO Price (RHS)
SOURCES: CIMB, BLOOMBERG

Felda Global Ventures August 6, 2012
28
Figure 41: CPO price is trading at a wider discount to soybean oil price
Title:
Source:
Please fill in the values above to have them entered in your report
(500)
(450)
(400)
(350)
(300)
(250)
(200)
(150)
(100)
(50)
0
-
200
400
600
800
1,000
1,200
1,400
1,600
1,800
Jan-05 Jul-05 Jan-06 Jul-06 Jan-07 Jul-07 Jan-08 Jul-08 Jan-09 Jul-09 Jan-10 Jul-10 Jan-11 Jul-11 Jan-12
Palm discount against soya - RHS Palm oil - LHS Soya oil - LHS(US$ /tonne) (US$/tonne)
SOURCES: CIMB, MPOB, OIL WORLD
Figure 42: Drought conditions in Midwest US
None Abnormally dry Moderate Severe Extreme Exceptional
24 Jul, 2012 13.1% 86.9% 73.7% 55.5% 28.9% 4.3%
17 Jul, 2012 14.1% 85.9% 72.7% 48.1% 11.9% 0.8%
24 Apr, 2012 58.8% 41.2% 16.1% 6.0% - -
27 Dec, 2011 71.8% 28.2% 13.4% 6.8% - -
27 Sept, 2011 58.9% 41.2% 14.0% 5.0% - -
19 Jul, 2011 89.8% 10.2% 0.1% - - -
Drought
SOURCES: CIMB, NOAA

Felda Global Ventures August 6, 2012
29
Figure 43: Sharp drop in soybean rated “good and excellent” Figure 44: Bigger drop in corn crops rated “good and excellent”
20
30
40
50
60
70
80
3-Jun 17-Jun 1-Jul 15-Jul 29-Jul 12-Aug 26-Aug 9-Sep 23-Sep 7-Oct
2012 2011 10-year Average(%)
20
30
40
50
60
70
80
20-May 3-Jun 17-Jun 1-Jul 15-Jul 29-Jul 12-Aug 26-Aug 9-Sep 23-Sep 7-Oct
2012 2011 10-year Average(%)
SOURCES: CIMB, USDA SOURCES: CIMB, USDA
Figure 45: US seasonal drought outlook
SOURCES: CIMB, NOAA

Felda Global Ventures August 6, 2012
30
Figure 46: US soybean crop progress
0
10
20
30
40
50
60
70
80
90
100
22-Apr 29-Jul 4-Nov
2012 2011 2010
Planted
Emerged
Blooming
Setting Pods
Dropping Leaves
Harvested
(Cumulative %)
SOURCES: CIMB, USDA
5.3 Room to improve yields
Management has gained full control of the FELDA-leased estates through the land lease agreement signed with FELDA on 1 November 2011. This will allow the group to implement initiatives to improve the productivity and future earnings of the estates.
There are plans to consolidate the management of estates to 15,000ha per plantation manager to achieve better economies of scale and reduce the cost of production. It will continue to implement best agriculture practices, including application of the optimal level of fertiliser based on leaf and soil sampling and ensuring stable supply of labour at its estates to maintain, collect and harvest FFBs. New KPIs and incentives will be introduced to ensure that the interests of the various parties in the group are aligned.
To improve the age profile of its plantations, it plans to accelerate its replanting programme to 15,000 per ha, (representing around 5% of its planted estates). The group will use high-yielding planting materials to ensure that the new plantings have stronger FFB yields, offsetting the lower yields from its older palms. This will help ensure a stable supply of FFB from its estates.
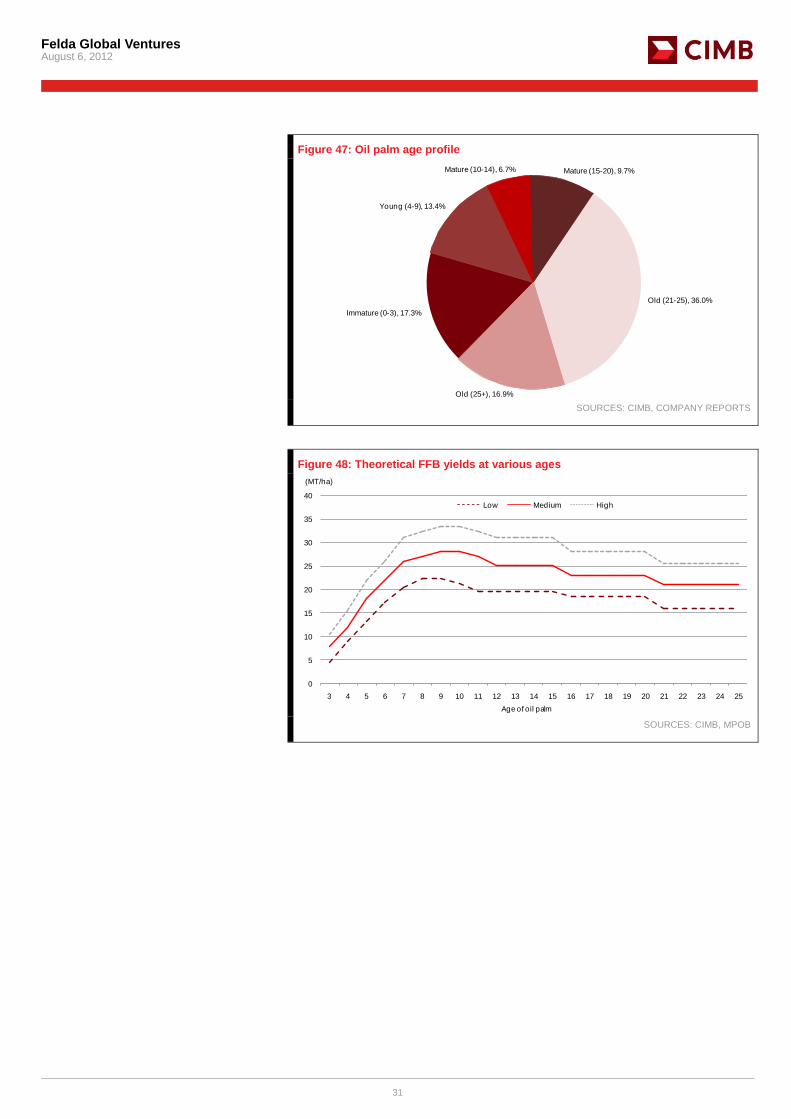
We expect the group to deliver lower FFB yields in the current year as it may take time for the new initiatives to bear fruit, in line with the weaker production achieved by the country in 1H12. Should the group succeed in raising yields at its estates in the current year, it would mean upside potential to our FFB yield forecast. Its estates’ average FFB yield of 19.9 tonnes/ha in 2011 is in line with the industry’s average but below most of its Malaysian-listed peers. We believe that this is due to its older estates as the average age of its estates is 17 years, above that of most of the planters in our coverage whose estates range from 10 years to 14 years. We estimate that every 1 tonne/ha improvement in yields at the estates would raise the group’s earnings by 6%.
Felda Global Ventures August 6, 2012
31
Figure 47: Oil palm age profile
Title:
Source:
Please fill in the values above to have them entered in your report
Immature (0-3), 17.3%
Young (4-9), 13.4%
Mature (10-14), 6.7% Mature (15-20), 9.7%
Old (21-25), 36.0%
Old (25+), 16.9% SOURCES: CIMB, COMPANY REPORTS
Figure 48: Theoretical FFB yields at various ages
0
5
10
15
20
25
30
35
40
3 4 5 6 7 8 9 10 11 12 13 14 15 16 17 18 19 20 21 22 23 24 25
Low Medium High
(MT/ha)
Age of oil palm SOURCES: CIMB, MPOB

Felda Global Ventures August 6, 2012
32
Figure 49: Comparing FGVH FFB yields with peers (FY2011)
12
14
16
18
20
22
24
26
IOI GENP SIME (MAL)
BWPT HAPL FR KLK* AALI GGR SGRO** FGVH WIL SIME (IND) LSIP IFAR/SIMP
BAL KAGR
(MT/ha)
SOURCES: CIMB, COMPANY REPORTS
Figure 50: FFB yield achievement by FGVH vs. Malaysia Figure 51: CPO and FFB prices achieved by FGVH
19.8
18.8
19.9
19.2
18.0
19.7
17.0
17.5
18.0
18.5
19.0
19.5
20.0
20.5
2009 2010 2011
FGVH Malaysia Average(MT/ha)
414535 613
2,236
2,701
3,219
-
500
1,000
1,500
2,000
2,500
3,000
3,500
2009 2010 2011
FGVH FFB price CPO price (M'sia)
(RM /MT)
SOURCES: CIMB, COMPANY REPORTS SOURCES: CIMB, COMPANY REPORTS
Figure 52: Replanting programme (ha)
Title:
Source:
Please fill in the values above to have them entered in your report
2,1122,712
4,672
6,319
5,213
12,01912,736
8,238
13,665
14,428
15,292 15,000 15,000 15,000
0
2,000
4,000
6,000
8,000
10,000
12,000
14,000
16,000
18,000
2002 2003 2004 2005 2006 2007 2008 2009 2010 2011 2012F 2013F 2014F 2015F
(ha)
SOURCES: CIMB, COMPANY REPORTS

Felda Global Ventures August 6, 2012
33
Figure 53: Areas planted with new materials
Title:
Source:
Please fill in the values above to have them entered in your report
2,1122,712
4,672
6,319
5,213
12,019
12,736
8,238
13,66514,428
0
2000
4000
6000
8000
10000
12000
14000
16000
2002 2003 2004 2005 2006 2007 2008 2009 2010 2011
(ha)
SOURCES: CIMB, COMPANY REPORTS
5.4 Turnaround plan for its Canadian downstream unit
The group’s integrated soybean and canola crushing and refining facilities in Canada have been unprofitable since they started operations in 2010 due mainly to unfavourable market conditions and internal restructuring. Part of the losses stemmed from asset impairment charges. To turn around this operation, the group has entered into a tolling agreement with Bunge ETGO which will take charge of the procurement and sales of soybean and canola products for the plant as its partner Bunge Limited, a leading company in soy products and soft oils globally, has better market intelligence and a wider distribution network for these products. This arrangement will allow the group to concentrate on improving the operational efficiency of its plant. The group is taking steps to improve the performance of its plant by purchasing a fifth expeller unit to improve the efficiency of its crushing facility. It is also taking steps to improve the supply chain logistics. We believe this will boost the group’s earnings, which have been dampened by large losses from its overseas downstream unit.
Figure 54: Historical gross losses at its downstream division
17.0
(22.9) (233.5)
(250)
(200)
(150)
(100)
(50)
0
50
2009 2010 2011
(RM m)
SOURCES: CIMB, COMPANY REPORTS

Felda Global Ventures August 6, 2012
34
5.5 Keen to expand estates and processing facilities
The group is keen to acquire existing planted and unplanted estates in Southeast Asia and Africa to expand its revenue and earnings base. Palm oil will remain the dominant crop though there are plans to expand its rubber exposure to complement its palm oil business. FGVH plans to plant rubber trees in areas where palm oil cultivation is unsuitable. The group aims to raise its rubber plantation landbank from 10,308ha currently to 30,000ha. In pursuing M&As, FGVH can leverage its ties with FELDA which has a strong reputation in the global market. In the sugar division, there are plans to raise domestic refining capacity and look for overseas expansion opportunities for its refining business. The expansion plan will enable the group to manage its capital better and grow its earnings base and revenue. Successful acquisition of planted estates at attractive valuations would be earnings accretive to the group.
Figure 55: Expansion plans for its sugar refinery
960
1,300
150
200
0
200
400
600
800
1,000
1,200
1,400
1,600
2011 2015/2016
MSM KGFP
(000 MT/annum)
SOURCES: CIMB, COMPANY REPORTS
5.6 Expanding its downstream capabilities
FGVH intends to grow its downstream capabilities and market access in order to gain better visibility on product flows and enhance the margins of its upstream division. It plans to expand its downstream segment through the acquisition of refinery assets, consumer packed plants and bulking facilities where the group has limited operations.
There are plans to enter into strategic partnerships in markets where it will enable the group to (1) gain access to key target manufacturers through reliable supply of certified sustainable palm-based components, (2) develop products in palm oil consumer products globally, (3) capture higher margins from increasing global demand for specialty fats, and (4) leverage its partner’s distribution network to penetrate overseas markets rapidly.
We are more positive on the group’s plans to seek partnerships to allow it to gain distribution networks and raise the sale of value-added products in key markets. We are less optimistic on its plans to raise its refining capacity as we think there may be a global refining margin squeeze in the next few years due to rapid expansion of downstream capacity in Indonesia. This may depress global refining margins but could provide opportunities for the group to penetrate key markets during the downturn.

Felda Global Ventures August 6, 2012
35
Figure 56: Strong refining margin in Indonesia encouraged plant-ups
(200)
(100)
0
100
200
300
400
Jan-11 Mar-11 May-11 Jul-11 Sep-11 Nov-11 Jan-12 Mar-12 May-12
MAL Refiner Net Margin IND Refiner Net Margin(RM/MT)
SOURCES: CIMB, MPOB

Felda Global Ventures August 6, 2012
36
6. SWOT ANALYSIS
FGVH’s main strength is its large-scale and integrated palm oil operations, which provide it with better economies of scale than its smaller peers. We believe its large estates allow the group to procure raw materials like fertiliser at competitive costs and attract workers more easily than smaller estate owners. It also has secure feedstock supplies for its palm oil milling operations from the settlers and FELDA-leased land totalling 850,000ha. Its associates’ control 17% of Malaysia’s CPO output gives it better bargaining power in the sale of its products. The group’s integrated palm oil model allows it to capture value add at every point of the palm oil value chain. Its estates are fairly efficient, generating a yield of 19.9 tonnes/ha although 16.9% of the estates have been in existence for more than 25 years. FGVH’s strong connection with FELDA gives it the upper hand when vying for overseas plantation and downstream assets.
The various avenues that the group could take to improve its earnings include boosting the productivity of its estates and its mills’ oil extraction rate. Within the region, it could also scout for estates with a young age profile to improve the age profile of its estates. We believe its plans to scour for more downstream assets should add to earnings if the group has a strong local partner and distribution network. There is scope to improve the efficiency and operating performance of its overseas downstream operations which have been loss-making over the past two years.
The key weakness of the group is that 53% of its estates are above 21 years and are due for replanting in the next few years. Also, FGVH could lose control of the FELDA-leased land if FELDA decides not to renew the leases. The profitability of its plantation business is lower than its peers as the group needs to pay leases of around RM500-550m a year to FELDA for the estates and its replanting costs are higher than its peers in Malaysia. The group’s Malaysian refining businesses are facing stiff competition from Indonesian refiners. Furthermore, FFB output growth in Malaysia is expected to slow over the next few years due to limited arable land and worker shortage. This may limit the growth potential of its processing business in Malaysia. The group lacks competitive advantage in its soybean and crushing facilities in Canada and has a mixed track record in overseas expansion.
The key threats to FGVH are lower CPO price and overcapacity in the palm oil processing industry in Malaysia, leading to lower processing margins. Other external factors that could affect the group’s businesses are poor weather, changes in government regulations and increased competition in the market.
Figure 57: SWOT analysis
Strengths Opportunities
Large scale and integrated operations Room to improve yields and OER at its estates
Captive supplies of FFB from FELDA settlers Accelerate replanting program
Exprerienced and professional management M&A to improve age profile of estates
Strategic and well-located estates Brings in expertise through joint ventures
Strong parentage Turnaround its downstream division
Weaknesses Threats
53% of estates are over 21 years old Lower CPO selling prices
Estates achieve lower profit per ha vs. peers Overcapacity in global processing industry
Refining division hit by uncompetitive feedstock costs Adverse weather conditions at its estates
Limited land bank for expansion Higher palm oil taxes and unfavourable export tax
Overseas downstream activities were loss-making Political risks SOURCES: CIMB

Felda Global Ventures August 6, 2012
37
7. RISKS
7.1 CPO price risk
Approximately 80% of the group’s gross profit is sensitive to movements in CPO price, which we believe will peak in 2Q. We estimate that every RM100 per tonne change in CPO price would shave 3% off FGVH’s earnings. The group can mitigate the fall in CPO price by locking in a significant portion of its future production at a fixed CPO price. Also, the group may fetch below-market prices for FFB crops harvested by its older estates as the millers typically use a lower oil extraction rate in deriving FFB prices for older estates.
7.2 Weather risk
Rainfall deficits or excessive rainfalls at the group’s estates due to global warming or the impact of El Nino or La Nina conditions may adversely impact its FFB yields and production as well as oil extraction rates achieved by its mills. These may affect its plantation earnings if the decline in production is not fully compensated by higher selling prices. The group’s production and supply of FFB were adversely affected by El Nino conditions from June 2009 to April 2010. The La Nina condition in 2011/12, which led to drier weather in South America and wetter weather in South East Asia, ended recently. While there is talk that El Nino may resurface, the view of most weather experts is that it is too early to confirm this weather pattern. An El Nino condition may bring drought to Southeast Asia which may lead to lower FFB production from the group as well as settlers’ estates. This could result in lower crops for its milling division and a lower profit margin. In the past, the price increase more than compensated for the decline in yields.
Figure 58: CPO price tends to rally during El Nino periods (+ve ONI of >0.5)
Title:
Source:
Please fill in the values above to have them entered in your report
0
200
400
600
800
1,000
1,200
1,400
(2.5)
(2.0)
(1.5)
(1.0)
(0.5)
0.0
0.5
1.0
1.5
2.0
2.5
Jan-90 Jan-92 Jan-94 Jan-96 Jan-98 Jan-00 Jan-02 Jan-04 Jan-06 Jan-08 Jan-10 Jan-12
Positive ONI (LHS) Negative ONI (LHS) CPO prices Rotterdam (RHS)
La N
iña
El N
iño
(Oceaninc Nino Index) (US$/MT)
SOURCES: CIMB, NOAA
7.3 Dependent on foreign workers
The Malaysian plantation industry is heavily dependent on foreign workers to remain competitive. Foreign workers account for 84% of the group’s estates workers as at 31 March 2012, slightly higher than the industry’s average of 76%. To retain the workers, the group has put in place competitive remuneration packages and housing amenities. Any shortage of labour due to new immigration rules or labour policy may affect the productivity of its estates. The rapid expansion of estates in Indonesia has increased competition for Indonesian estate workers. As a result, the cost of hiring foreign workers has also been rising for the group. Malaysia’s recent proposal for a minimum monthly wage of RM800 in Peninsular Malaysia to RM900 is expected to raise the cost of estate workers over time. We gathered that estate workers are generally paid between RM700 and RM2,000 per month inclusive of

Felda Global Ventures August 6, 2012
38
productivity payments. We have incorporated a 5% increase in labour costs in our forecasts for the group to account for this.
Figure 59: FGVH’s workforce distribution
Job Function
2009 2010 2011 2011 2012
Employees
Executives 679 830 881 843 929
Non-executives 1,865 2,842 2,842 2,808 3,614
Others (daily rated workers) - 185 135 177 140
Subtotal 2,544 3,857 3,858 3,828 4,683
Estate Workers
Local estate workers 5,469 4,499 4,542 4,464 4,712
Foreign estate workers 25,553 23,572 22,026 23,063 25,558
Subtotal 31,022 28,071 26,568 27,527 30,270
Total 33,566 31,928 30,426 31,355 34,953
As at 31 December As at 31 March
SOURCES: CIMB, COMPANY REPORTS
Figure 60: Workforce distribution in Malaysian estates
Harvesters Field Workers Others Total
Local Malaysians 13,967 31,341 70,509 115,817
Foreign Workers 181,775 126,930 61,016 369,721
195,742 158,271 131,525 485,538
% Foreign Worker 93% 80% 46% 76% SOURCES: CIMB, POC 2012
7.4 Replanting programme
FGVH plans to replant around 60,292ha of its old estates over the next four years. This may affect the group’s near-term yields as the replanted estates represent around 17.6% of its total estates and will not generate any yields during the first three years after replanting. The group will rely on rising yields from its young estates, which account for 13.4% of total planted area, to mitigate the impact of loss of production from its replanted areas.
7.5 Dependence on land lease from FELDA
The group’s FFB production is highly dependent on the use of the land leased from FELDA. Under the land lease agreement, FELDA is permitted to retake any portion or all of the leased land for any reason after giving notice of 6-18 months for land of 10,000ha or less and 18 months for any portion of land that is more than 10,000ha. In addition, FELDA is obligated to pay compensation according to the terms of the lease, taking into account the loss of expected future profit. One of the agreements also provides that for 19,854ha of the FELDA-leased land, FELDA may terminate the agreement for all or part of the land if FELDA were to lose possession over any portion of the land to third parties. Should the group lose the right to use any of the land, it may affect its profitability and valuations.
7.6 Potential changes in palm oil taxes
The government imposes cess, windfall tax and sales taxes in Sabah as well as a host of other taxes on the plantation business in Malaysia. A hike in any of these taxes would dampen the group’s plantation earnings. We believe that the government is unlikely to raise any of these taxes ahead of the general election as it would have a negative impact on the income of the smallholders and settlers. However, we believe that there is a good chance that the Malaysian government may consider reducing the export tax on crude palm oil to help the local refiners to regain competitiveness against Indonesian refiners. If implemented, this may result in lower domestic selling prices and dent the profitability of its plantation operations.

Felda Global Ventures August 6, 2012
39
Figure 61: Palm oil taxes in Malaysia
CategoryMPOB Cess RM11.00/tonne of CPO
Cess for price stabilisation fund RM2/tonne of CPO
Windfall profit levy 15% above RM2,500/tonne CPO in Peninsular Malaysia
7.5% above RM3,000/tonne CPO in Sabah & Sarawak
Foreign Worker's Levy RM590/worker/annum
Sabah Sales Tax 7.5% when CPO price is above RM1,000/tonne
Sarawak Sales Tax 2.5% when CPO price is between RM1,000-RM1,500/tonne
5% when CPO price is above RM1,500/tonne
Sarawak Land Tax RM5.00/ha/annum SOURCES: CIMB, NSTP
Figure 62: Malaysia’s export duty framework
Crude Palm Oil Processed Palm Oil
On the first RM 650.00 per tonne Nil Nil
Plus on the next RM 50.00 per tonne 10% Nil
Plus on the next RM 50.00 per tonne 15% Nil
Plus on the next RM 50.00 per tonne 20% Nil
Plus on the next RM 50.00 per tonne 25% Nil
Plus on the balance 30% Nil SOURCES: CIMB, COMPANY REPORTS
Figure 63: Actual export tax rates for palm products in Indonesia and Malaysia
Crude palm oil RBD palm oil Crude palm oil RBD palm oil
Jan-11 20.0% 18.5% 24.1% nil
Feb-11 25.0% 23.0% 24.2% nil
Mar-11 25.0% 23.0% 23.8% nil
Apr-11 22.5% 21.0% 23.4% nil
May-11 17.5% 16.0% 23.4% nil
Jun-11 17.5% 16.0% 23.4% nil
Jul-11 20.0% 18.5% 22.9% nil
Aug-11 15.0% 13.5% 22.9% nil
Sep-11 15.0% 13.5% 22.9% nil
Oct-11 16.5% 6.0% 22.3% nil
Nov-11 15.0% 5.0% 22.5% nil
Dec-11 15.0% 5.0% 22.7% nil
Jan-12 15.0% 5.0% 22.9% nil
Feb-12 16.5% 6.0% 22.9% nil
Mar-12 16.5% 6.0% 23.2% nil
Apr-12 18.0% 7.0% 23.5% nil
May-12 19.5% 8.0% 23.5% nil
Jun-12 19.5% 8.0% 22.5% nil
Jul-12 15.0% 5.0% 22.7% nil
Indonesia export tax rate Malaysia export tax rate
SOURCES: CIMB, MPOB, MINISTRY OF TRADE OF INDONESIA

Felda Global Ventures August 6, 2012
40
7.7 Weaker palm refining margins in Malaysia
The Malaysian refiners are adversely affected by Indonesia’s new export duty structure which gives its refiners a tax advantage over Malaysian producers in the export of refined palm oil products. The issue is compounded by the issuance of CPO duty-free quotas, which reduce the availability of domestic CPO for the local refining industry. A relatively high proportion (35%) of the group’s total refining costs is fixed. As such, any reduction in the utilisation rates of its refining facilities would increase its unit cost. This affects the group’s refining profitability in Malaysia as the group has the second largest refining capacity in the country. We think that currently, refiners in Malaysia are unprofitable. We estimate that the Malaysian refining business accounted for 1% of the group’s FY11 pretax profit.
Figure 64: Key changes in export tax for key palm products
CPO base
price
(US$ per tonne) Old New Old New Old New Old New Old New Old New
≤700 0.0% 0.0% 0.0% 0.0% 0.0% 0.0% 0.0% 0.0% 0.0% 0.0% 0.0% 0.0%
701-750 1.5% 0.0% 0.0% 0.0% 1.5% 0.0% 0.0% 0.0% 0.0% 0.0% 0.0% 0.0%
751-800 3.0% 7.5% 1.5% 0.0% 3.0% 2.0% 0.0% 0.0% 0.0% 0.0% 1.5% 7.5%
801-850 4.5% 9.0% 3.0% 0.0% 4.5% 3.0% 1.5% 0.0% 0.0% 0.0% 3.0% 9.0%
851-900 6.0% 10.5% 4.5% 2.0% 6.0% 4.0% 3.0% 2.0% 0.0% 0.0% 4.5% 10.5%
901-950 7.5% 12.0% 6.0% 3.0% 7.5% 5.0% 4.5% 3.0% 2.0% 0.0% 6.0% 12.0%
951-1000 10.0% 13.5% 8.5% 4.0% 10.0% 6.0% 6.0% 4.0% 2.0% 2.0% 8.5% 13.5%
1001-1050 12.5% 15.0% 11.0% 5.0% 12.5% 7.0% 7.5% 5.0% 2.0% 2.0% 11.0% 15.0%
1051-1100 15.0% 16.5% 13.5% 6.0% 15.0% 8.0% 11.0% 6.0% 2.0% 2.0% 13.5% 16.5%
1101-1150 17.5% 18.0% 16.0% 7.0% 17.5% 9.0% 13.5% 7.0% 5.0% 2.0% 16.0% 18.0%
1151-1200 20.0% 19.5% 18.5% 8.0% 20.0% 10.0% 16.0% 8.0% 5.0% 5.0% 18.5% 19.5%
1201-1250 22.5% 21.0% 21.0% 9.0% 22.5% 11.5% 18.5% 9.0% 7.5% 5.0% 21.0% 21.0%
>1250 25.0% 22.5% 23.0% 10.0% 25.0% 13.0% 21.0% 10.0% 10.0% 7.5% 23.0% 22.5%
CPO Crude PK OilBiodieselRBD Palm
Stearin
RBD Palm
OleinRBD PO
SOURCES: CIMB, MINISTRY OF TRADE OF INDONESIA
7.8 Sugar industry is regulated by the government
All of the group’s domestic sugar sales are subject to a price ceiling set by the government, which means that future rises in raw material costs may not be matched by increases in the price ceiling or sugar subsidy. This may have a significant impact on the group’s profit margin and the profitability of MSM Holdings.
The group’s sugar business is highly dependent on imported raw sugar. The existing long-term supply contracts fixed the purchase price for a substantial portion of MSM Holdings’ raw sugar requirements at US$0.26 per lb (including freight). If raw sugar prices decrease to levels below the purchase price under the long-term supply contracts, the group may be obligated to purchase a substantial portion of its raw sugar at prices that are higher than the international market price, which may make it uncompetitive.
The group pays prevailing market prices for its remaining raw sugar needs. As a result, higher raw sugar prices would be negative for the group, potentially leading to weaker margins if sugar prices are not raised to compensate for the higher costs.
The import of refined sugar into Malaysia is restricted by the government. If it relaxes this policy, it may lead to more competition from overseas refiners and may affect the profitability of the group.

Felda Global Ventures August 6, 2012
41
Figure 65: Historical raw sugar futures
Title:
Source:
Please fill in the values above to have them entered in your report
0
5
10
15
20
25
30
35
40
Jan-01 Jan-02 Jan-03 Jan-04 Jan-05 Jan-06 Jan-07 Jan-08 Jan-09 Jan-10 Jan-11 Jan-12
(US cent/lb)
SOURCES: CIMB, BLOOMBERG
7.9 Forex fluctuations
A substantial portion of the group’s FY11 revenue is denominated in US$ and some of its raw materials such as fertiliser are purchased in US$. A stronger ringgit would be negative for local CPO prices though the impact would be mitigated by lower fertiliser costs and reduced capex. But a firmer ringgit is good news for MSM Holdings as it lowers its raw sugar costs in ringgit terms though the impact will be tempered by lower export sales. The bulk of MSM Holdings’ FY11 cost of sales was denominated in US$. Our house view is for the ringgit to strengthen by 4.4% in the current year. This will be slightly negative for CPO price.
Figure 66: Ringgit has recently weakened against the US$
2.8
2.9
3.0
3.1
3.2
3.3
3.4
3.5
3.6
3.7
3.8
Jan-09 Jul-09 Jan-10 Jul-10 Jan-11 Jul-11 Jan-12
(US$/RM)
SOURCES: CIMB, BLOOMBERG

Felda Global Ventures August 6, 2012
42
7.10 Pest and disease risks
Outbreak of diseases or pest infection at its estates may result in loss of crops and higher expenditure, leading to lower profitability.
7.11 Execution risk
Management may not be successful in its efforts to expand its estates, venture into downstream value-added for its palm products and turn around its downstream overseas operations. Failure of the group’s efforts to raise efficiency, planned capacity and productivity at its manufacturing facilities may negatively impact the group’s earnings prospects.
7.12 Dependent on its associate FHB
FGVH sells virtually all of the FFB it produces from its oil palm estates on FELDA-leased land to Felda Palm Industries, a subsidiary of FHB, under a contractual arrangement signed between the two parties on 1 March 2012. In the event of termination of these arrangements, the group would need to find alternative buyers for its palm produce. In addition to this, the group is dependent on FHB to provide it with R&D services, supply raw materials like fertiliser for its plantation division and purchase cup lumps produced on its rubber plantations. It also depends on the uninterrupted operations of FHB’s production, storage and distribution facilities and various modes of transportation from those facilities to deliver CPO and other products among its various facilities and to its customers.
7.13 Risks relating to FHB operations
FHB obtains approximately one-third of its annual requirements of FFB from FELDA settlers and another one-third from third parties. Any significant interruption in the supply of FFB from these two parties as well as FELDA-leased land could have a material impact on FHB’s production of CPO. FHB may also be subject to litigation on its various businesses. In the past three years, five material civil suits have been brought against FELDA and F Palm Industries in respect of the determination of the quality and grading system for the sale of FFB that FHB believes are material. FHB believes that there are reasonable grounds to defend these claims. The government regulates the retail price of palm olein-based cooking oil and allows producers to claim a subsidy to compensate for their loss of profit. Should the government eliminate or reduce the cooking oil subsidy, it may subject the group to greater competition and may result in lower sales.
Figure 67: Total sources of FFB by FHB’s CPO mills
FYE Dec 31
('000 MT) % ('000 MT) % ('000 MT) %
Plantation estates on the FELDA-leased and
managed land 5,213 34.4% 4,744 32.8% 5,128 31.9%
FELDA Settlers 4,794 31.6% 4,774 33.0% 5,307 33.0%
Third parties 4,896 32.3% 4,693 32.5% 5,381 33.4%
F Agricultural. 260 1.7% 248 1.7% 272 1.7%
Total 15,163 100% 14,459 100% 16,088 100%
2009 2010 2011
SOURCES: CIMB, COMPANY REPORTS

Felda Global Ventures August 6, 2012
43
8. FINANCIALS
8.1 Historical earnings based on proforma figures
The group’s historical financial statements below are based on proforma figures, which assume that it had signed the land lease agreement with FELDA throughout the historical three years presented. As such, the historical earnings statement is the combination of the consolidated financial statements of FGVH and the carved-out historical financial information of the estates.
8.2 Plantation and sugar dominate revenue stream
FGVH’s sales can be broken down into three key segments: (1) plantations, (2) sugar, and (3) downstream.
Figure 68: Historical breakdown of revenue by segment
Title:
Source:
Please fill in the values above to have them entered in your report
2,274(79.0%)
2,668(46.0%)
3,286(44.0%)
606(21.0%)
989(17.0%)
1,889(25.3%)
2,148(37.0%)
2,300(30.8%)
0
1,000
2,000
3,000
4,000
5,000
6,000
7,000
8,000
2009 2010 2011
Plantations Downstream Sugar
(RM m)
SOURCES: CIMB, COMPANY REPORTS
The plantation segment, which reflects the estate operations, was the top revenue contributor at 44% of the group’s proforma revenue in 2011. Historical sales from the plantation division came from the sale of fresh fruit bunches (FFB) and cup lumps (rubber) from its estates.
FFB sales accounted for 97-98% of its total plantation revenue, with rubber and others making up the remainder. The group’s plantation revenue hinges on production, sales volume and selling prices achieved for its palm and rubber products.
Plantation revenue rose by 17.3% in FY10 as the higher selling prices achieved offset the lower volume of FFB harvested and sold due to adverse weather. In 2011, the group’s plantation revenue improved 23.2% due to a 14.6% rise in average selling prices (ASP) of FFB and a 7% increase in FFB sales volume.
The group’s historical plantation revenue included real estate, property management, sale of foods and beverages and management fees of RM8.8m to RM12.6m.
We do not expect the revenue stream from this division to recur as the group sold FGV Middle East and Arabia, which are involved in provision of real estate and F&B services, to FELDA in 2011.
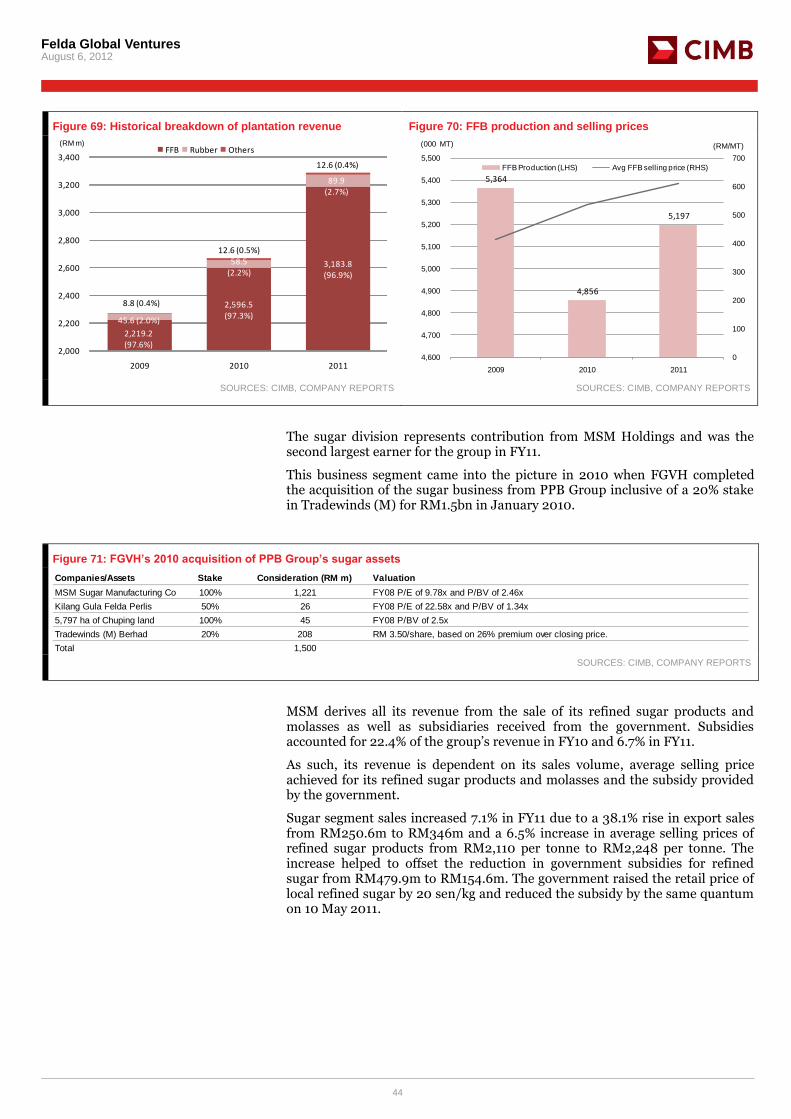
Felda Global Ventures August 6, 2012
44
Figure 69: Historical breakdown of plantation revenue Figure 70: FFB production and selling prices
Title:
Source:
Please fill in the values above to have them entered in your report
2,219.2(97.6%)
2,596.5 (97.3%)
3,183.8(96.9%)
45.6 (2.0%)
58.5 (2.2%)
89.9(2.7%)
8.8 (0.4%)
12.6 (0.5%)
12.6 (0.4%)
2,000
2,200
2,400
2,600
2,800
3,000
3,200
3,400
2009 2010 2011
FFB Rubber Others(RM m)
5,364
4,856
5,197
0
100
200
300
400
500
600
700
4,600
4,700
4,800
4,900
5,000
5,100
5,200
5,300
5,400
5,500
2009 2010 2011
FFB Production (LHS) Avg FFB selling price (RHS)
(000 MT) (RM/MT)
SOURCES: CIMB, COMPANY REPORTS SOURCES: CIMB, COMPANY REPORTS
The sugar division represents contribution from MSM Holdings and was the second largest earner for the group in FY11.
This business segment came into the picture in 2010 when FGVH completed the acquisition of the sugar business from PPB Group inclusive of a 20% stake in Tradewinds (M) for RM1.5bn in January 2010.
Figure 71: FGVH’s 2010 acquisition of PPB Group’s sugar assets
Companies/Assets Stake Consideration (RM m) Valuation
MSM Sugar Manufacturing Co 100% 1,221 FY08 P/E of 9.78x and P/BV of 2.46x
Kilang Gula Felda Perlis 50% 26 FY08 P/E of 22.58x and P/BV of 1.34x
5,797 ha of Chuping land 100% 45 FY08 P/BV of 2.5x
Tradewinds (M) Berhad 20% 208 RM 3.50/share, based on 26% premium over closing price.
Total 1,500 SOURCES: CIMB, COMPANY REPORTS
MSM derives all its revenue from the sale of its refined sugar products and molasses as well as subsidiaries received from the government. Subsidies accounted for 22.4% of the group’s revenue in FY10 and 6.7% in FY11.
As such, its revenue is dependent on its sales volume, average selling price achieved for its refined sugar products and molasses and the subsidy provided by the government.
Sugar segment sales increased 7.1% in FY11 due to a 38.1% rise in export sales from RM250.6m to RM346m and a 6.5% increase in average selling prices of refined sugar products from RM2,110 per tonne to RM2,248 per tonne. The increase helped to offset the reduction in government subsidies for refined sugar from RM479.9m to RM154.6m. The government raised the retail price of local refined sugar by 20 sen/kg and reduced the subsidy by the same quantum on 10 May 2011.

Felda Global Ventures August 6, 2012
45
Figure 72: Breakdown of revenue from sugar business
480(22.4%)
155 (6.7%)
1,650(76.9%) 2,128
(92.6%)
17(0.8%)
17(0.7%)
0
500
1,000
1,500
2,000
2,500
2010 2011
Sugar subsidies Refined sugar Molasses(RM m)
SOURCES: CIMB, COMPANY REPORTS
Downstream sales accounted for 25.3% of our proforma sales, mainly reflecting revenue from the sale of oleochemicals as well as canola and soybean products from its US and Canada downstream facilities.
This division was the third largest revenue contributor in the past two years. Sales jumped by a whopping 90.9% in 2011 to RM1,889m, reflecting a full 12 months of revenue from soybean and canola products. The increase was partly offset by lower sales volume for its oleochemical products.
Figure 73: Revenue from downstream business
552.7 557.1 752.7
53.2 37.6
34.4 210.7
674.1
14.0
67.6
68.0
186.9
86.9
126.2
0.8
15.0
46.9
0
200
400
600
800
1,000
1,200
1,400
1,600
1,800
2,000
2009 2010 2011
Fatty acids Glycerin Canola oil Soy oil Canola meal Soy meal Others(RM m)
SOURCES: CIMB, COMPANY REPORTS

Felda Global Ventures August 6, 2012
46
Figure 74: Production volume for oleochemicals Figure 75: Production volume for soybean and canola products
Title:
Source:
Please fill in the values above to have them entered in your report
136.9
148.0
129.5
120
125
130
135
140
145
150
2009 2010 2011
(000 MT)
Title:
Source:
Please fill in the values above to have them entered in your report
216.1
563.3
-
100
200
300
400
500
600
2010 2011
(000 MT)
SOURCES: CIMB, COMPANY REPORTS SOURCES: CIMB, COMPANY REPORTS
Figure 76: Soybean and canola product revenues inside and outside Canada
SOURCES: CIMB, COMPANY REPORTS
Figure 77: Oleochemical revenues inside and outside the US
SOURCES: CIMB, COMPANY REPORTS
8.3 Downstream has the largest share of cost of sales
The downstream division accounted for 39% or the largest share of the group’s total cost of sales in FY11. Cost of sales from this segment increased significantly in FY11 due to a full-year contribution from its canola and soybean facilities in Canada.
The group recorded RM1.06bn cost of soybean and canola, reflecting a full-year cost of sales for the group’s soy and canola business compared to a 3-month contribution of RM348.7m in FY10 as the soy and canola business started operations in Sep 2010. On top of that, the FY11 cost of sales included an impairment charge of RM164.7m for property, plant and equipment compared to RM17.7m in FY10. The charge mainly reflects the difference between the estimated recoverable amount of the group’s refinery assets and the carrying value of the assets.
FYE Dec 31 (RM m) Net Sales Percentage Net Sales Percentage Net Sales Percentage Outside the United States Canada 15.2
2.5% 25.4 4.2% 40.9 4.9%
Mexico 41.8 6.9% 50.6
8.3% 62.6 7.5% Other countries* 0.4
0.1% - -
0.8 0.1% Total oleochemical exports 57.4
9.5% 76.0 12.5% 104.3 12.5%
Inside the United States 549.3 90.5% 533.6
87.5% 729.8 87.5% Total oleochemical revenues 606.7
100.0% 609.6 100.0% 834.1 100.0%
*In 2010, percentage of sales to "other countries" was approximately 0.002%
2011 2010 2009
FYE Dec 31 (RM m) Net Sales Percentage Net Sales Percentage Outside Canada United States 74.8 19.7% 324.1 30.7% Germany 115.8 30.5% 338.5 32.1% Other countries 40.6 10.7% 16.5 1.6% Total soybean and canola product exports 231.2 61.0% 679.1 64.4% Inside Canada 148.4 39.1% 375.7 35.6% Total soybean and canola product revenues 379.6 100.0% 1,054.8 100.0%
2011 2010

Felda Global Ventures August 6, 2012
47
The bulk of the downstream cost of sales in FY09 and FY10 relates to purchases of tallow and lauric oils used in the group’s oleochemicals business. The 71.6% jump in FY10 cost of sales reflects the maiden inclusion of the cost of the soybeans and canola seeds. The impairment charge of RM17.7m in FY10 relates to the group’s oleochemical business.
The sugar division’s cost of sales made up 33.6% of the total cost of sales in FY11. This comprises the cost of raw sugar, energy and utilities, packaging and other supplies as well as depreciation of operating assets. Total cost of sales climbed 7% in FY11 due to higher raw sugar prices in the international market though this was partially offset by a drop in realised fair value losses on sugar futures contracts from RM25.9m in FY10 to RM9.3m in FY11. Raw sugar costs are the main component of the group’s proforma cost of sales for this division, making up 96% of the total cost of sales.
Plantation cost of sales comprises mainly fertiliser, cultivation, managing and harvesting of FFB as well as labour costs. The cost of sales for this division jumped 22% in FY11 due to higher cost for staff, transportation and fertiliser, in line with the higher volume of FFB sold. Harvesting and cultivation is the primary cost of sales in the plantation segment, making up 50.5% of proforma cost of sales.
Figure 78: Breakdown of historical cost of sales by division Figure 79: Proforma cost of sales by business segment
Title:
Source:
Please fill in the values above to have them entered in your report
1,424
1,231
1,507
590
1,012
2,122
1,7191,835
0
500
1,000
1,500
2,000
2,500
2009 2010 2011
Plantations Downstream* Sugar
(RM m)
*Includes impairment of property, plant and equipment of RM17.7m for 2010 and RM164.7m for 2011
Title:
Source:
Please fill in the values above to have them entered in your report
1,424 1,231 1,507
1,7191,835
590
1,012
2,122
0
1,000
2,000
3,000
4,000
5,000
6,000
2009 2010 2011
Plantations Sugar Downstream*
(RM m)
*Includes impairment of property, plant and equipment of RM17.7m for 2010 and RM164.7m for 2011
SOURCES: CIMB, COMPANY REPORTS SOURCES: CIMB, COMPANY REPORTS
The main components of the group’s historical cost of sales can also be broken down into the following: (1) raw materials and chemicals, (2) harvesting and cultivation, (3) staff and labour expenses, (4) replanting costs, (5) impairment of plant, property and equipment, (6) energy and utilities, (7) maintenance and repairs, and (8) others. Raw materials for purchases formed 60% of FY11 total cost of sales, followed by harvesting and cultivation costs which made up 14% of total costs.

Felda Global Ventures August 6, 2012
48
Figure 80: FGVH’s proforma cost of sales breakdown
FYE Dec 31
(RM m) % (RM m) % (RM m) %
Raw Materials and chemicals 466.1 23% 2,276.1 57% 3,274.6 60%
Harvesting and cultivation 821.1 41% 675.7 17% 761.2 14%
Staff and labour 234.0 12% 295.9 7% 377.0 7%
Replanting expenses 245.3 12% 235.2 6% 243.9 4%
Impairment of plant, property, and equipment - 0% 17.7 0% 164.7 3%
Energy and utilities 28.4 1% 80.7 2% 105.9 2%
Depreciation 38.9 2% 94.3 2% 100.1 2%
Maintenance and repairs 95.7 5% 103.4 3% 127.6 2%
Others 83.8 4% 182.9 5% 309.4 6%
Total 2,013.3 100% 3,961.9 100% 5,464.4 100%
201120102009
SOURCES: CIMB, COMPANY REPORTS
8.4 Plantation is the most profitable division
The plantation division was the top gross profit generator of the group over the past three years. Gross profit from this division soared 69% in FY10 and 24% in FY11 due to higher ASPs achieved for its FFB and rubber products. Gross profit margin from this division was fairly stable at 54% in FY10 and FY11 as the increases in selling prices were in line with the rise in cost of sales.
The sugar division recorded an 8% improvement in gross profit in FY11 due to higher export sales and profit margins. Gross profit margin for the sugar division rose by 0.2% pts to 20.2% in FY11.
Losses from the downstream division widened from RM22.9m in FY10 to RM233.5m in FY11, due partly to a spike in impairment charges on property, plant and equipment from RM17.7m to RM164.7m. But even without the impairment charges, the downstream division remained in the red as the rise in the cost of sales outpaced sales growth.
Overall, the group’s gross profit margin fell by 4.85% pts to 27% due to losses for the downstream division.
Figure 81: Breakdown of historical gross profit by segment
850.0
1,436.9
1,779.5
428.7
464.4
17.0
(22.9) (233.5)
-500
0
500
1,000
1,500
2,000
2,500
2009 2010 2011
Plantations Sugar Downstream
(RM m)
SOURCES: CIMB, COMPANY REPORTS

Felda Global Ventures August 6, 2012
49
Figure 82: Breakdown of historical gross profit margins by segment
37.4%
53.5% 54.2%
20.0% 20.2%
2.8%
(2.3%)
(12.4%)(20%)
(10%)
10%
20%
30%
40%
50%
60%
2009 2010 2011
Plantations Sugar Downstream
SOURCES: CIMB, COMPANY REPORTS
8.5 Higher administrative expenses in 2011
The group’s proforma operating expenses consist of (1) administrative expenses, (2) selling and distribution expenses, and (3) other operating expenses.
The administrative expenses comprises mainly management and staff costs, rent and lease payments for land and management fees paid to Felda Plantations, a subsidiary of Felda Holdings Berhad, for the management of the estates. Payment of management fees will stop on 31 Dec 2011 and FGVH will start to recognise operating expenses relating to the management of the plantations on 1 Jan 2012.
Administrative expenses jumped 27% in FY11 due mainly to expenses incurred for MSM Holdings’ initial public offering and an increase in profit sharing payments to Felda Plantations due to the higher average sales price for FFB.
Selling and distribution expenses relate to freight and other transportation, warehousing and handling costs as well as sales commissions for export sales. These costs were fairly stable in FY11.
Figure 83: Breakdown of operating expenses Figure 84: Historical trend of operating expenses
Title:
Source:
Please fill in the values above to have them entered in your report
131.1167.7
212.5
56.3
98.6
97.0
68.6
45.4
85.8
0
50
100
150
200
250
300
350
400
450
2009 2010 2011
Administrative expensesSelling and distribution expensesOther operating expenses
(RM m)
Title:
Source:
Please fill in the values above to have them entered in your report
131.1
167.7
212.5
56.3
98.6 97.0
68.6
45.4
85.8
0
50
100
150
200
250
2009 2010 2011
Administrative expenses
Selling and distribution expenses
Other operating expenses
(RM m)
SOURCES: CIMB, COMPANY REPORTS SOURCES: CIMB, COMPANY REPORTS

Felda Global Ventures August 6, 2012
50
8.6 Other key items in income statement
The group’s income statement also include (1) fair value changes in land lease liabilities, (2) other operating income, (3) other operating expenses, and (4) other (losses)/ gains, before arriving at the group’s EBIT before associates and joint ventures.
The proforma fair value changes in land lease liability of RM516m-530m in FY09-11 consisted of changes in the amount deemed effective interest and the financial liability arising from the land lease agreement, consistent with the agreement’s schedule of annual liability. This amount is coincidentally roughly the same as our calculation of the lease payment due to FELDA.
FGVH posted a higher operating income of RM19m in FY10 compared with RM18m in FY09. This item relates to an increase in the amount due from the government for the oil palm replanting incentive scheme.
Other operating income jumped to RM78.8m in 2011 due mainly to RM68.2m gains on disposal of Felda Global Ventures Middle East and Felda Global Ventures Arabia Limited in Sep 2011 to FELDA, partially offset lower replanting subsidy from the government. Felda Global Ventures Middle East is involved in real estate management while Felda Global Ventures Arabia is involved in the sale of food and beverages in the Middle East.
Other operating expenses shot up 89% to RM85.8m due to a RM42.8m impairment loss for the intangible assets of Twin River Technologies and RM31.4m impairment loss on the sale of TRT-ETGO Inc’s inventory and soy and canola futures contracts to Bunge ETGO, a joint venture company. In FY10, the group had booked an impairment loss of RM30.4m on Twin River Technologies’ assets. The RM68.6m other operating expenses recorded in FY09 relate to the impairment of an apartment belonging to Felda Global Ventures Middle East Sdn Bhd.
Other net gains of RM35.9m in FY11 vs. a net loss of RM66.3m in FY10 reflect a reduction in losses arising from changes in the fair value of foreign exchange forward contracts (RM47m loss in FY10 vs. RM2.4m loss in FY11). These losses were offset against a fair value gain of RM38.3m arising from changes in futures contracts for raw sugar, soybeans and canola seeds in 2011 vs. fair value losses of RM19.3m in FY10.
Figure 85: EBIT breakdown for FY10 Figure 86: EBIT breakdown for FY11
Title:
Source:
Please fill in the values above to have them entered in your report
1,843 (312)
19 (66) (527)
957
-
200
400
600
800
1,000
1,200
1,400
1,600
1,800
2,000
Gross profit Operating expenses
Other operating
income
Other (losses)/gain
FV changes in LLA liability*
EBIT
(RM m)
Title:
Source:
Please fill in the values above to have them entered in your report
2,010 (395)
79 36 (530)
1,200
-
500
1,000
1,500
2,000
2,500
Gross profit Operating expenses
Other operating
income
Other (losses)/gain
FV changes in LLA liability*
EBIT
(RM m)
SOURCES: CIMB, COMPANY REPORTS SOURCES: CIMB, COMPANY REPORTS

Felda Global Ventures August 6, 2012
51
8.7 Net interest income items
Finance costs consist of interest expenses on bank borrowings, term loans and a loan from FELDA at fixed interest rates. Finance costs increased in FY10 and FY11 as the group took up more borrowings to fund a string of acquisitions including the sugar business and FHB.
Finance income relates to interest income from bank borrowings, which rose in FY11 due mainly to proceeds from the sale of MSM shares following the IPO in May 2011.
Figure 87: Historical finance cost/income of FGVH*
FYE Dec 2009 2010 2011
RM '000 RM '000 RM '000
Finance cost (10,035) (151,557) (141,211)
Finance income 6,878 12,243 38,055
Net finance cost (3,157) (139,314) (103,156)
*Exclude fair value changes in Land Lease Agreement liability of RM515.8m, RM527.0m and RM530.0m in 2009, 2010, and 2011
respectively. SOURCES: CIMB, COMPANY REPORTS
Figure 88: Major acquisitions by the group
Year Assets Acquisition price (RM m) Mode of pruchase
2009 49% stake in FHB from FELDA 1,567.6 Issuance of share
2009 50% stake in FELDA IFFCO 145.2 Issuance of debt
2009 50% stake in Trurich 102.3 Cash
2010 100% stake in MSM, 50% KGFP, 20% in Tradewinds M and sugar cane plantations 1,500.0 Cash
2011 49% JV with Bunge ETGO with Bunge Limited 75.7 Cash
2012 95% stake in PT Citra Niaga from Joko Sintarajaya 16.5 n/a
Total 3,407.3 SOURCES: CIMB, COMPANY REPORTS
8.8 Share of results from associates
Associates in the group are 49%-owned Felda Holdings Berhad (FHB) and 20%-owned Tradewinds (M) Berhad.
The share of results from associates fell 15.8% to RM329.3m in FY11 due to the non-recurrence of the RM116.1m negative goodwill booked in FY10 when it acquired Tradewinds (M). The higher earnings from FHB helped to offset these losses in FY11.
FHB posted a higher net profit in FY11, thanks to better earnings from its milling operations and rubber business which more than offset the lower margins for its refining business.
In FY10, the share of results from associates improved 12% due to a maiden contribution from Tradewinds (M). However, this was offset by a 61.4% plunge in negative goodwill from RM301m in FY09 to RM116.1m.
Excluding the negative goodwill item, the share of associates’ earnings would have soared 471% to RM275.1m, reflecting the group’s full-year share of earnings from its equity interest in FHB and Tradewinds (M). This compares to only three months of contribution from FHB in 2009.
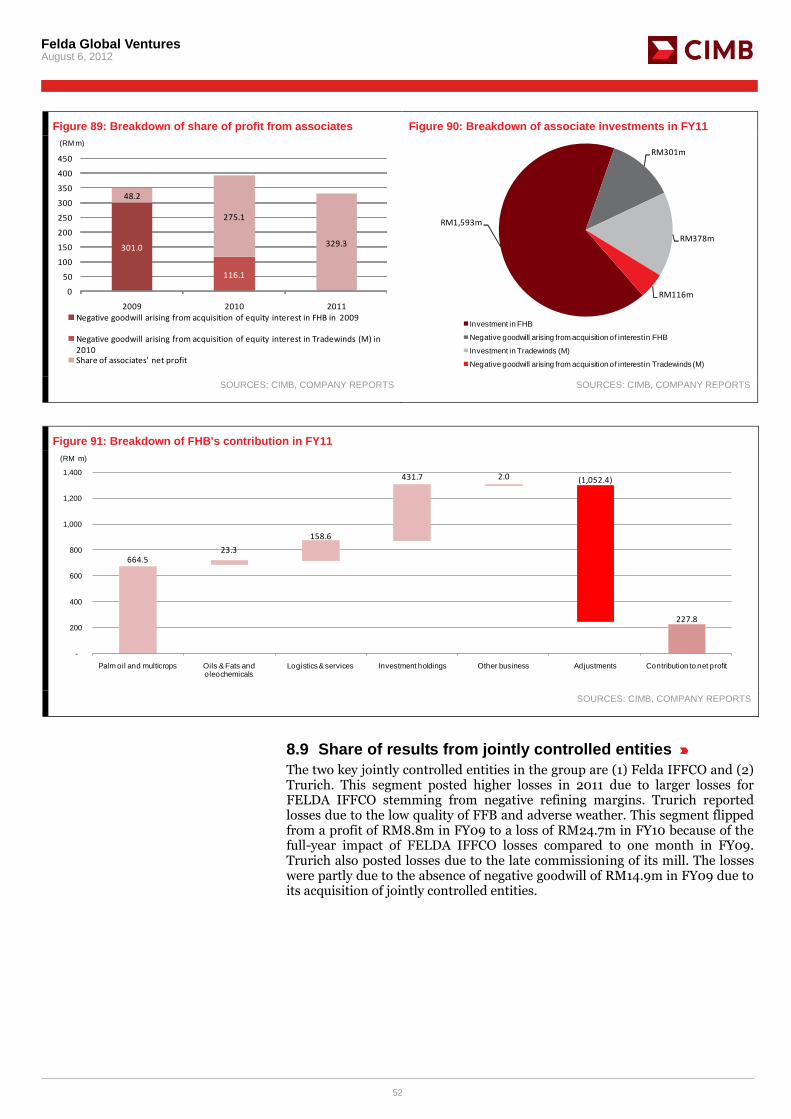
Felda Global Ventures August 6, 2012
52
Figure 89: Breakdown of share of profit from associates Figure 90: Breakdown of associate investments in FY11
Title:
Source:
Please fill in the values above to have them entered in your report
301.0
116.1
48.2
275.1
329.3
0
50
100
150
200
250
300
350
400
450
2009 2010 2011Negative goodwill arising from acquisition of equity interest in FHB in 2009
Negative goodwill arising from acquisition of equity interest in Tradewinds (M) in 2010Share of associates' net profit
(RM m)
Title:
Source:
Please fill in the values above to have them entered in your report
RM1,593m
RM301m
RM378m
RM116m
Investment in FHB
Negative goodwill arising from acquisition of interest in FHB
Investment in Tradewinds (M)
Negative goodwill arising from acquisition of interest in Tradewinds (M)
SOURCES: CIMB, COMPANY REPORTS SOURCES: CIMB, COMPANY REPORTS
Figure 91: Breakdown of FHB's contribution in FY11
664.523.3
158.6
431.7 2.0 (1,052.4)
227.8
-
200
400
600
800
1,000
1,200
1,400
Palm oil and multicrops Oils & Fats and oleochemicals
Logistics & services Investment holdings Other business Adjustments Contribution to net profit
(RM m)
SOURCES: CIMB, COMPANY REPORTS
8.9 Share of results from jointly controlled entities
The two key jointly controlled entities in the group are (1) Felda IFFCO and (2) Trurich. This segment posted higher losses in 2011 due to larger losses for FELDA IFFCO stemming from negative refining margins. Trurich reported losses due to the low quality of FFB and adverse weather. This segment flipped from a profit of RM8.8m in FY09 to a loss of RM24.7m in FY10 because of the full-year impact of FELDA IFFCO losses compared to one month in FY09. Trurich also posted losses due to the late commissioning of its mill. The losses were partly due to the absence of negative goodwill of RM14.9m in FY09 due to its acquisition of jointly controlled entities.

Felda Global Ventures August 6, 2012
53
Figure 92: Historical contributions from JV
Title:
Source:
Please fill in the values above to have them entered in your report
8.8
(24.7)
(54.0)(60)
(50)
(40)
(30)
(20)
(10)
-
10
20
2009 2010 2011
(RM m)
SOURCES: CIMB, COMPANY REPORTS
8.10 Discontinued operations in 2009
In FY09, the group reported a loss of RM139.3m from the discontinued operations of Twin River Technologies Natural Ingredients, LCC. The business was sold to FELDA IFFCO in 2009 for RM75.5m. The group recorded a loss of RM18.6m from the disposal.
8.11 Net profit
The proforma effective tax rate rose from 21.5% in FY10 to 26% in FY11 due to higher impairment costs. The FY10 rate was also higher than FY09’s 7.6% due to higher contributions from its sugar division. Minority interests jumped in FY11 following the listing of MSM Holdings, which diluted the group’s stake in the company from 100% to 51%. Overall net profit edged up 1.1% in FY11 as higher contributions from the plantations and sugar businesses more than offset the higher tax rate and losses posted by its downstream division. The stronger net profit achieved in FY10 was due to full-year contributions from its sugar division as well as FHB and Tradewinds (M), which again more than offset losses from associates.
Figure 93: Positive MI in FY10 due to downstream losses Figure 94: Higher MI in FY11 due to lower stake in MSM
Title:
Source:
Please fill in the values above to have them entered in your report
1,184 (255)
3 932
-
200
400
600
800
1,000
1,200
1,400
Pretax profit Taxes Minority interests Net profit
(RM m)
Title:
Source:
Please fill in the values above to have them entered in your report
1,372 (357)
(72) 942
-
200
400
600
800
1,000
1,200
1,400
1,600
Pretax profit Taxes Minority interests Net profit
(RM m)
SOURCES: CIMB, COMPANY REPORTS SOURCES: CIMB, COMPANY REPORTS

Felda Global Ventures August 6, 2012
54
8.12 1Q FY12 results
FGVH reported a 2% improvement in sales revenue in 1QFY12 as higher plantation and sugar sales offset lower downstream sales. Plantation revenue rose 26% yoy in 1Q12 as the group captured maiden sales of CPO starting on 1 March 2012 under the new arrangement with Felda Palms. Sugar revenue improved in line with higher export volumes and increased selling prices for refined sugar products. However, downstream revenue fell 48% yoy as the group no longer recognised revenue from the sale of soybean and canola products, following the tolling agreement with Bunge-ETGO.
The group posted a 43% decline in 1Q12 pretax profit due to lower contribution from its all key divisions except associates and jointly controlled entities. Plantation earnings were hit by lower selling prices and higher cost of production. We gathered that during the quarter, the group applied more fertiliser or 40% of its requirements for the year in view of favourable weather and in line with the group’s plans to raise yields after taking control over the management of the estates in Jan 2012. Stocks at the plantation unit were also higher as at end-March 2012. Sugar earnings were affected by higher raw sugar costs while downstream posted lower profits due to losses at its processing plant in Canada. Associates reported better earnings, thanks to higher contributions from Felda Holdings Berhad while earnings from jointly controlled entities improved on the back of better profit contribution from Bunge-ETGO and Trurich which more than offset losses from Felda-IFFCO. We expect the group to post higher earnings in subsequent quarters, driven by higher production and lower fertiliser costs.
Figure 95: 1Q12 results
FY End : December (RMm) 1Q12 1Q11 Chg Comments
Sales 1,720 1,689 2% Higher CPO sales boost earnings
Cost of sales (1,330) (1,037) 28% Higher cost of sales due to purchase of CPO
Gross profit 390 652 (40%) Weaker earnings from plantations & sugar divisions
Other operating income 1 4 (75%) Lower rental income
Selling and distribution expenses (31) (38) (18%) Lower transportation costs
Administrative expenses (57) (44) 30% Absorbing costs of managing estates
Other operating expenses 0 (10) nm Absence of impairment charges for FGV Arabia
Other net gains/losses (0) (17) nm Refers to forex gains/losses
FV changes in LLA liability (48) 0 nm Refers to fair valuation of land lease agreement
Net interest expenses (16) (24) nm Higher interest income
Share of results of associates 35 (11) nm Improvement in milling profit margins
Share of results of jointly controlled entities 7 (17) nm Bunge-ETGO and Turich were profitable
Profit before taxation 281 495 (43%) Lower FFB selling prices and higher estates costs
Taxes (58) (145) (60%) Deferred tax adjustments
Minority interests (31) 9 nm Reflects its lower stake in MSM following IPO
Net profit 192 359 (47%) Lower plantation and sugar contributions
Gross profit margin 23% 39%
Effective tax rate 21% 29% SOURCES: CIMB, COMPANY REPORTS

Felda Global Ventures August 6, 2012
55
9. FORECASTS
9.1 Proforma earnings do not reflect new arrangements
The group’s historical proforma accounts are not comparable to future earnings as they do not take into consideration the following:
(1) Contractual arrangement between FGVH and Felda Palm Industries for the sale and purchase of FFB and CPO, which came into effect on 1 March 2012.
Before 1 March 2012, the group did not sell any CPO, which means that the accounts reflect mainly the revenue from the sale of FFB. Starting from 1 March 2012, the group will recognise the sales and cost of sales of CPO in its accounts and will no longer recognise FFB sales.
(2) Historical earnings reflect the estate management arrangements that existed prior to the land lease arrangement, where a management fee was paid to Felda Plantations, a subsidiary of FHB.
Future earnings will not reflect the payment of management fees by the estates but will include the cost of expenses relating to the management of the estates.
(3) The group’s historical accounts include the sales of soybean and canola as well as the cost of sales from the purchase of soybeans and canola until 9 December 2011, when the tolling agreement with Bunge ETGO took effect. Following this, the group no longer recognises revenue and cost of sales for soybean and canola seeds in its financial accounts.
In view of the above, future sales from the plantation division are expected to be higher as they will incorporate sales of CPO which fetches higher selling prices than FFB. Furthermore, it will include sales of FHB-processed CPO from FELDA settlers and third parties’ estates to affiliate entities or third parties.
Figure 96: Historical FFB production Figure 97: Historical CPO production by FHB
Title:
Source:
Please fill in the values above to have them entered in your report
5,213
4,744
5,128
4,500
4,600
4,700
4,800
4,900
5,000
5,100
5,200
5,300
2009 2010 2011
(000 MT)
Title:
Source:
Please fill in the values above to have them entered in your report
2,871 2,774
3,056
241
215
237
2,500
2,600
2,700
2,800
2,900
3,000
3,100
3,200
3,300
3,400
2009 2010 2011
CPO production less DOP's consumptionDOP's annual CPO consumption
(000 MT)
SOURCES: CIMB, COMPANY REPORTS SOURCES: CIMB, COMPANY REPORTS
9.2 Lower plantation earnings in FY12
We forecast the group to post a 39% jump in FY12 revenue, driven by better average selling prices achieved for its palm products and new contribution from the sale of CPO purchased from FHB’s subsidiary under the new contractual agreement starting 1 March 2012.
FY12 plantation revenue is expected to include 10 months of contribution from the sale of CPO by the group following a new contractual arrangement with Felda Palm Industries. We forecast that the group will sell 2.3m tonnes of CPO at an average price of RM3,130 per tonne in FY12.

Felda Global Ventures August 6, 2012
56
We estimate that plantation cost of sales will rise by 240% in FY12 due to higher estate costs arising from higher fertiliser and labour costs and the inclusion of the cost of buying CPO products from Felda Palm Industries.
Overall, we estimate plantation gross profit to decline by 10% in FY12, due to higher estates costs and weaker production. For 2013-14, we project plantation gross profit to grow by 5-13% due to higher selling prices and production. Our gross profit estimates for the plantation division exclude the actual lease payment due to FELDA which we have incorporated under the fair value changes in the lease payment item in the income statement.
9.3 Slight decline in sugar contributions
We project FGVH’s sugar revenue to increase 15% in FY12, fuelled by higher sales volume and government subsidies. We estimate a 5% rise in sales volume coming from stronger domestic and export sales. The total sugar subsidy from the government is also expected to increase in line with the 34 sen/kg increase in sugar subsidy to 54 sen/kg effective 1 Jan 2012.
The sugar division is expected to post a 5% decline in gross profit in FY12 as the rise in raw sugar costs more than offset the lower operating costs from its loss-making sugar estates. We estimate that the group will enjoy cost savings of RM15m p.a. following the conversion of its loss-making sugar estates in Perlis to rubber estates during the year.
The group’s cost of raw sugar is expected to rise this year as the previous long-term contracts for raw sugar, which covers 70% of the domestic sugar requirements, at 17.5 US cts/lb expired on 31 December 2011. The government, though the refiners, has since locked in new long-term contracts for sugar at 26 US cts/lb. This is 49% higher than the price for raw sugar under the previous year’s contract.
9.4 Lower losses from downstream business segment
We expect the group’s downstream division to post lower losses in 2012 due to the absence of impairment charges on assets and goodwill totalling RM207.5m in FY11 and its venture into a tolling agreement to turn around its downstream operations in Canada. For 2013-14, we project this division to post a profit of RM5-11m.
We are projecting a sharp drop in sales and cost of sales from the downstream division as the group will no longer recognise any sales of processed products and cost of raw materials for its soybean and canola facilities following the tolling agreement with Bunge ETGO. Instead, it will recognise tolling revenue based on certain agreed computations with TRT-ETGO. As such, the revenue and earnings for the downstream business will mainly reflect sales and earnings contribution from its oleochemical division.
To recap, 100%-owned TRT-ETGO entered into a tolling agreement with 49%-owned Bunge ETGO on 9 December 2011. Bunge ETGO is a joint venture between Bunge Limited and the TRT-ETGO. Under the joint venture agreement, TRT-ETGO agreed to crush canola seeds and soybeans and refine edible oils for the partnership at its canola and soybean crushing plant and edible oils refinery. The partnership (Bunge ETGO) will take over the supply of canola seeds and soybeans and sales of processed products from the facilities. TRT-ETGO will perform certain upgrades at its facility to achieve the agreed benchmarks. Until these benchmarks are achieved, Bunge ETGO will pay it a fixed and variable fee for each tonne of crushed materials and 80% of certain applicable transportation costs.
9.5 Other assumptions in our earnings forecasts
We have incorporated our calculation of the actual lease payments to FELDA based on a fixed amount and a percentage of operating profit under the changes

Felda Global Ventures August 6, 2012
57
in fair value of land lease liability for FY13-14. In our estimate, we have assumed that the profit sharing element in the lease agreement is 15% of the plantation’s operating profit. Our projection of this payment for FY13-14 is fairly stable at RM512m-543m, in line with the group’s plantation earnings.
Other operating income is expected to decline to RM10m in FY12-14 due the absence of gains from the disposal of subsidiaries.
9.6 Net profit to improve 11% in 2012
Overall, we estimate that the group will post a 11% jump in FY12 net profit, driven lower losses from its downstream division. In our projections, we have estimated that it will register an effective tax rate of around 20% and higher minority interests because of a full-year impact of the reduction in its stake in MSM Holdings from 100% to 51% after the IPO exercise in May 2011. We project an 19% and 8% rise in net profit in FY13 and FY14 net profit as the rise in selling prices for palm products and efficiency gain will more than offset the higher cost of production.
9.7 Earnings sensitivity to changes in key assumptions
For the plantation division, our sensitivity analysis revealed that every 1 tonne/ha change in our FFB yield forecast will change our FY13 net profit by RM77m or 6%. Every RM100 per tonne change in our CPO price forecasts will change our FY13 net profit by 3%.
Figure 98: Debt breakdown proforma as at 31 December 2011 Figure 99: Debt breakdown by currency (excl. loan from FELDA)
Short term debt; RM502m;
21%
Loan from FELDA;
RM1,835m;
77%
Other long term debt; RM41m;
2%
Title:
Source:
Please fill in the values above to have them entered in your report
Ringgit Malaysia (RM); RM288m; 53%
Canadian Dollar (CAD);
RM164m; 30%
US Dollar (USD); RM91m; 17%
SOURCES: CIMB, COMPANY REPORTS SOURCES: CIMB, COMPANY REPORTS

Felda Global Ventures August 6, 2012
58
Figure 100: Income Statement
FY End : December (RMm) 2009 2010 2011 2012F 2013F 2014F
Sales 2,880.3 5,804.6 7,474.8 10,372.2 11,486.0 11,904.9
- Plantation 2,273.6 2,667.6 3,286.3 6,698.7 7,653.2 7,929.5
- Sugar - 2,147.7 2,299.7 2,654.0 2,763.6 2,854.1
- Downstream 606.7 989.3 1,888.8 1,019.5 1,069.2 1,121.2
Cost of sales (2,013.3) (3,961.9) (5,464.4) (8,352.5) (9,239.5) (9,543.1)
- Plantation (1,423.6) (1,230.7) (1,506.8) (5,108.5) (5,856.5) (6,034.7)
- Sugar - (1,719.0) (1,835.3) (2,214.2) (2,319.2) (2,398.4)
- Downstream (589.7) (1,012.2) (2,122.3) (1,029.7) (1,063.8) (1,110.0)
Gross profit 867.0 1,842.7 2,010.4 2,019.8 2,246.5 2,361.8
- Plantation 850.0 1,436.9 1,779.5 1,590.1 1,796.7 1,894.8
- Sugar 428.7 464.4 439.8 444.4 455.8
- Downstream 17.0 (22.9) (233.5) (10.2) 5.3 11.2
Other operating income 18.3 19.4 78.8 10.0 10.0 10.0
Selling and distribution expenses (56.3) (98.6) (97.0) (111.5) (117.1) (123.0)
Administrative expenses (131.1) (167.7) (212.5) (227.4) (238.8) (250.7)
Other operating expenses (68.6) (45.4) (85.8)
Other net gains/losses - (66.3) 35.9
FV changes in LLA liability (515.8) (527.0) (530.0) (440.0) (502.4) (516.6)
Finance costs (10.0) (151.6) (141.2) (111.5) (101.2) (90.9)
Finance income 6.9 12.2 38.1 69.0 135.5 139.3
Share of results of associates 349.2 391.2 329.3 266.4 289.1 305.0
- Felda Holdings Berhad 54.3 212.8 277.5 190.3 213.0 229.0
- Tradewinds Malaysia Berhad - 96.2 96.1 96.1 96.1 96.1
- Negative goodwill for Tradewinds - 116.1 -
- Negative goodwill for FHB 301.0 - -
-Others (6.1) (33.9) (44.3) (20.0) (20.0) (20.0)
Share of results of jointly controlled entities 8.8 (24.6) (54.0) 10.0 20.0 30.0
Profit before taxation 468.4 1,184.4 1,372.0 1,484.7 1,741.6 1,864.9
Taxes (35.5) (255.0) (357.4) (302.1) (358.1) (382.5)
Loss from discontinued ops (139.3) - -
Minority interests 28.7 2.6 (72.5) (132.6) (133.6) (135.9)
Net profit 322.3 932.1 942.2 1,050.0 1,249.8 1,346.5 SOURCES: CIMB, COMPANY REPORTS
Figure 101: Key assumptions for plantations
FY End December 2009 2010 2011 2012F 2013F 2014F
Avg mature area - oil palm ('000 ha) 271 258 261 260 256 255
FFB yields (tonnes/ha) 19.8 18.8 19.9 18.8 19.9 20.2
FFB production ('000 tonnes) 5,364 4,856 5,197 4,894 5,096 5,154
FFB output growth na (9%) 7% (6%) 4% 1%
Average FFB selling prices (RM/tonne) 414 535 613 639 647 656
Average CPO selling prices (RM/ tonne) 2,236 2,701 3,219 3,130 3,160 3,200
CPO extraction rate 20.5% 20.7% 20.5% 20.4% 20.4% 20.4%
PK extraction rate 5.4% 5.3% 5.2% 5.1% 5.1% 5.1%
CPO sales volumes ('000 tonnes) - - - 2,309 3,114 3,165
Avg mature area (ha) - rubber 4,272 4,272 4,272 5,139 5,861 6,463
Rubber yields (kg/ha) 1,904 1,380 1,702 1,662 1,581 1,648
Rubber production (tonnes) 8,135 5,895 7,269 8,540 9,267 10,652
Average rubber selling price (RM/tonne) 5,611 9,932 12,362 10,508 10,823 11,148 SOURCES: CIMB, COMPANY REPORTS

Felda Global Ventures August 6, 2012
59
10. VALUATION AND RECOMMENDATION
10.1 FGVH offers high earnings leverage to CPO prices
FGVH is the fourth largest plantation stock by market capitalisation in the Malaysian plantation sector space. The unique feature of this company is that it leases the land from FELDA. It is also the largest CPO producer in Malaysia and has a captive market for milling fruits, i.e. the Felda settlers, through its associate Felda Holdings Berhad. The group’s advantage lies in its close link with FELDA, which may aid the group’s M&A pursuits. FGVH recently raised RM4.5bn from the IPO issue and plans to utilise the proceeds to acquire upstream and downstream assets to boost future earnings. Among the big-cap planters in Malaysia, FGVH offers one of the highest earnings leverage to CPO prices as it derives a higher percentage or 80% of its earnings from the plantation business compared to its peers, where only 60-70% of earnings come from the upstream plantation segment.
10.2 Using SOP to value the group
We value the group using sum-of-the-parts (SOP) calculation as it allows us to apply appropriate valuation methods to its various business segments.
FGVH’s 100% stake in the land leased from FELDA for up to 99 years is the most valuable asset as it allows the group to ride the bullish long-term CPO price trend. We estimate that the strong cash flows from its existing estates will be more than sufficient to fund the group’s replanting programme.
We apply a 14x P/E, similar to what we accorded to other big-cap Malaysian planters, to value the group’s estates and arrive at a value of RM11.8bn. We value the group’s 14,385ha landbank in Indonesia held through PT Citra Niaga at an EV/ha range of US$1,000, similar to recent transacted prices for unplanted landbank that we gathered from the market.
For the downstream business, we assign a P/BV of 1x for its North American business operations and deduce a total value of RM562m for the assets. We choose to value the downstream assets on a P/BV basis in view of the volatile earnings trend. Furthermore, this division posted losses over the past two years due partly to asset impairment charges.
We value the group’s 51% stake in MSM Holdings at our target price of RM5.05, which is based on a forward P/E of 13x.
We apply forward P/Es of 12x to arrive at the valuation range for the group’s 49% stake in Felda Holdings Berhad. We value the company at a discount to our target market P/E of 13.3x due to concerns over potential losses for the group’s refining division given the unfavourable export tax structure in Malaysia. We also value its 20% stake in Tradewinds (M) at its market value.
For its Felda IFFCO JV, we apply the last transacted price of RM145m in 2009 as the business is currently loss-making. As for the group’s 50% stake in Trurich Resources, we value the estates at our assumed price range for planted and unplanted oil palm estates in Indonesia.
We strip out the group’s net debt from the total value of the group’s assets to arrive at an SOP value of RM5.61, which we discount by 10% to arrive at our target price of RM5.05. There is upside to our target price if the group snaps up earnings-enhancing assets at attractive prices.
10.3 Borrowings and capex
We project that the group may incur RM250m-350m capex per annum over the next three years for capacity expansion and efficiency improvement in its plants. As at 31 December 2011, the group had RM1,185m net debt which works out to be a net gearing ratio of 80%. The group’s borrowings relate mostly to acquisitions over the past few years for its new business activities. Its outstanding borrowings are primarily denominated in ringgit while its overseas borrowings relate mostly to loans taken up by its subsidiaries. Also, the majority of the group’s debt relates to loans and advances from its parent, FELDA totalling RM1,835m. These loans and advances are due in instalments

Felda Global Ventures August 6, 2012
60
between now and 2020 and carry a fixed effective interest rate of 4.805% per annum. Post IPO exercise, the group is in net cash position of RM2.7bn.
10.4 Dividend payout policy of 50%
In line with the group’s intention to adopt a dividend payout ratio of at least 50% of its net profit excluding non-recurring income, we incorporate dividend payouts of between RM525m and RM673m in our FY12-14 forecasts. This translates to a dividend per share of 14sen and 18sen and represents a yield of 3-4% for FY12-14.
Figure 102: SOP valuations
Segments Stake Method RM m
Plantation
Land-leased estates in Malaysia 100% Forward P/E of 14x 11,835
PT Citra Niaga 95% EV/ha of US$0.5-1k for unplanted 42.4
Downstream business
TRT US (Oleo plant) 100% 1x of 31 Dec 2011 net book value 173
TRT-ETGO Inc (canola and soybean crushing) 100% 1x of 31 Dec 2011 net book value 389
Sugar business -
MSM Malaysia 51% CIMB's fair value 1,811
Associates -
Felda Holdings Berhad 49% Forward P/E of 12x 2,556
Tradewinds Malaysia 20% Market value 498
Joint venture entities -
Felda IFFCO 50% Historical purchase price in 2009 145
Trurich Resources 50% EV/ha of US$5-10k planted and US$0.5-1k unplanted 263
Cash 5,662
Total debts (2,919)
Total Sum-of-Parts value 20,456
10% holding co discount (2,046)
Target value for FGVH 18,410
Equity valuation per share 5.05 SOURCES: CIMB, COMPANY REPORTS
Figure 103: Utilisation of proceeds
Details of use of proceeds Estimated timeframe for utilisation upon listing RM '000 %
Selective Acquisition of oil and fats, manufacturing and logistic businesses within 3 years 2,190,000 49.1
Construction or acquisition of mills and refineries within 3 years 840,000 18.9
Loan repayment for overseas operation within 3 years 780,000 17.5
Capital expenditure for increases in efficiency, as well as extension of capabilities within 6 months 260,000 5.8
Working capital requirements, general corporate purposes within 2 years 100,000 2.2
Estimated listing expenses within 6 months 129,000 2.9
Total gross proceeds within 6 months 160,000 3.6
4,459,000 100.0 SOURCES: CIMB, COMPANY REPORTS
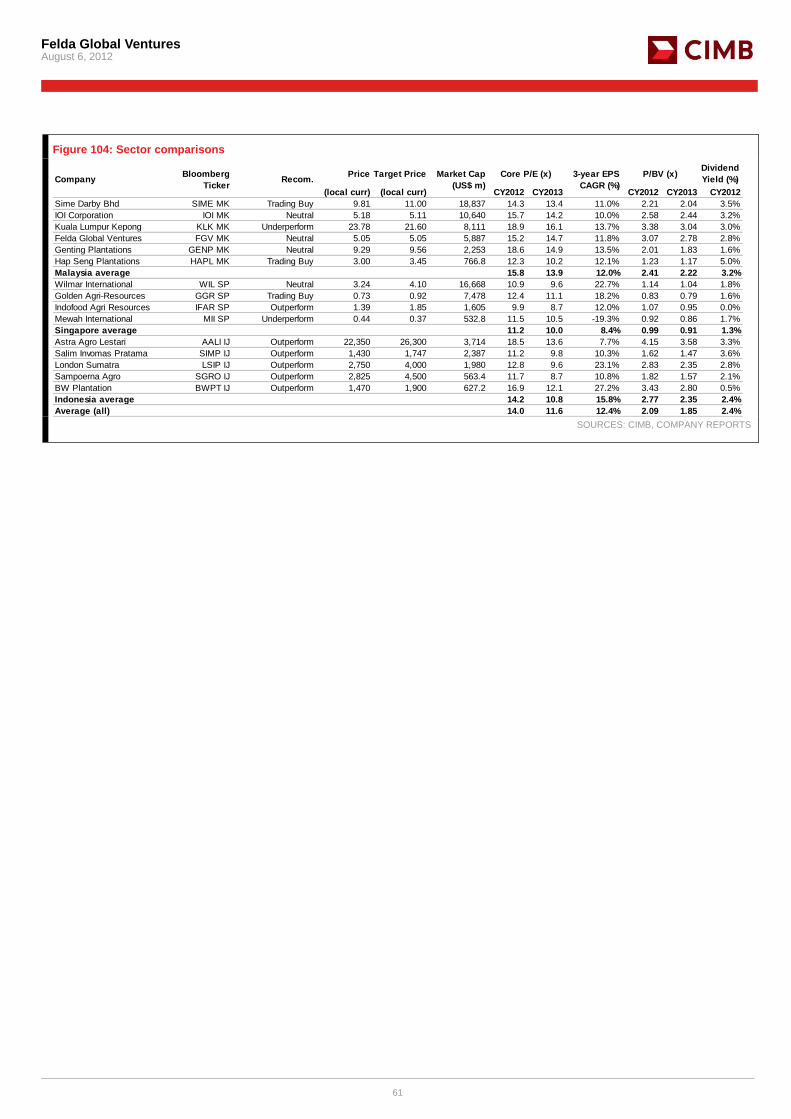
Felda Global Ventures August 6, 2012
61
Figure 104: Sector comparisons
Price Target Price
(local curr) (local curr) CY2012 CY2013 CY2012 CY2013 CY2012
Sime Darby Bhd SIME MK Trading Buy 9.81 11.00 18,837 14.3 13.4 11.0% 2.21 2.04 3.5%
IOI Corporation IOI MK Neutral 5.18 5.11 10,640 15.7 14.2 10.0% 2.58 2.44 3.2%
Kuala Lumpur Kepong KLK MK Underperform 23.78 21.60 8,111 18.9 16.1 13.7% 3.38 3.04 3.0%
Felda Global Ventures FGV MK Neutral 5.05 5.05 5,887 15.2 14.7 11.8% 3.07 2.78 2.8%
Genting Plantations GENP MK Neutral 9.29 9.56 2,253 18.6 14.9 13.5% 2.01 1.83 1.6%
Hap Seng Plantations HAPL MK Trading Buy 3.00 3.45 766.8 12.3 10.2 12.1% 1.23 1.17 5.0%
Malaysia average 15.8 13.9 12.0% 2.41 2.22 3.2%
Wilmar International WIL SP Neutral 3.24 4.10 16,668 10.9 9.6 22.7% 1.14 1.04 1.8%
Golden Agri-Resources GGR SP Trading Buy 0.73 0.92 7,478 12.4 11.1 18.2% 0.83 0.79 1.6%
Indofood Agri Resources IFAR SP Outperform 1.39 1.85 1,605 9.9 8.7 12.0% 1.07 0.95 0.0%
Mewah International MII SP Underperform 0.44 0.37 532.8 11.5 10.5 -19.3% 0.92 0.86 1.7%
Singapore average 11.2 10.0 8.4% 0.99 0.91 1.3%
Astra Agro Lestari AALI IJ Outperform 22,350 26,300 3,714 18.5 13.6 7.7% 4.15 3.58 3.3%
Salim Invomas Pratama SIMP IJ Outperform 1,430 1,747 2,387 11.2 9.8 10.3% 1.62 1.47 3.6%
London Sumatra LSIP IJ Outperform 2,750 4,000 1,980 12.8 9.6 23.1% 2.83 2.35 2.8%
Sampoerna Agro SGRO IJ Outperform 2,825 4,500 563.4 11.7 8.7 10.8% 1.82 1.57 2.1%
BW Plantation BWPT IJ Outperform 1,470 1,900 627.2 16.9 12.1 27.2% 3.43 2.80 0.5%
Indonesia average 14.2 10.8 15.8% 2.77 2.35 2.4%
Average (all) 14.0 11.6 12.4% 2.09 1.85 2.4%
CompanyBloomberg
TickerRecom.
Market Cap
(US$ m)
Core P/E (x) 3-year EPS
CAGR (%)
P/BV (x)Dividend
Yield (%)
SOURCES: CIMB, COMPANY REPORTS

Felda Global Ventures August 6, 2012
62
APPENDIX 1: COMPARISON WITH LISTED PLANTERS
Glossary
AALI: PT Astra-Agro Lestari Tbk
BAL: Bumitama Gunajaya Agro Group Ltd
BWPT: PT BW Plantation
FGVH: Felda Global Ventures Holdings Bhd
FR: First Resources Ltd
GENP: Genting Plantations Bhd
GGR: Golden-Agri Resources Ltd
HAPL: Hap Seng Plantations Bhd
IFAR/SIMP: Indofood Agri/ Salim Invomas Pratama
IOI: IOI Corporation Bhd
KAGR: Kencana Agri Ltd
KLK: Kuala Lumpur Kepong Bhd
LSIP: PT London Sumatra Indonesia
SGRO: PT Sampoerna Agro
SIME: Sime Darby Bhd
TWB: Tradewinds Plantation Bhd
WIL: Wilmar International Ltd

Felda Global Ventures August 6, 2012
63
Breakdown of land ownership in Malaysia
Malaysia’s planted oil palm area totaled 5m ha in 2011, according to Malaysian Palm Oil Board (MPOB). We estimate that FGVH is the largest palm oil operator in Malaysia as it operates 6.5% of total planted oil palm area in the country. Sime Darby is a close second, controlling 6.3% of the total oil palm estates in Malaysia based on its 314,035ha of planted estates as at 30 June 2011. IOI Corp ranked third among the listed players under our coverage with 3% share, followed by KL Kepong. Most of the big-cap plantation companies are listed in Malaysia or Singapore.
Figure 105: Market share of planted oil palm area in Malaysia Figure 106: 2011 oil palm planted area by category
FGVH; 6.5%
SIME; 6.3%
IOI; 3.0%
KLK; 2.2%
GENP; 1.2%
HAPL; 0.8%
TWB; 1.8%
Others; 78.2%
Total plantedarea: 5.0m ha
Title:
Source:
Please fill in the values above to have them entered in your report
Private estate60.7%
FELDA14.1%
FELCRA3.2%
RISDA1.6%
Govt. agency6.4%
Independent smallholders
14.0%
Total plantedarea: 5.0m ha
SOURCES: CIMB, ,MPOB, COMPANY REPORTS SOURCES: CIMB, MPOB
Market capitalisation of the regional planters
With US$18.8bn market capitalisation as at 2 Aug 2012, Sime Darby is the largest regional planter. Wilmar’s US$16.5bn market cap makes it the second largest regional planter in our coverage by market cap. In Malaysia, IOI Corp is the second largest with a market value of US$10.6bn while KL Kepong is the third largest at US$8.1bn.
Figure 107: Comparing the market cap of regional planters (as of 2 Aug 2012)
Title:
Source:
Please fill in the values above to have them entered in your report
0
2,000
4,000
6,000
8,000
10,000
12,000
14,000
16,000
18,000
20,000
SIME WIL IOI KLK GGR FGVH KUL AALI FR SIMP GENP TWI LSIP IFAR BAL TWPB HAPL BWPT SGRO KAGR
(US$ m)
SOURCES: CIMB, COMPANY REPORTS

Felda Global Ventures August 6, 2012
64
Comparison of planted oil palm areas
Sime Darby has the largest planted oil palm area among the listed players in the region. Golden Agri is the largest palm oil operator in Indonesia with 361,060ha of planted nucleus estates. We estimate that FGVH is the third largest regional palm oil operator in the world and the largest operator in Malaysia. Compared to its peers, FGVH has not been as aggressive in expanding its planted estates locally or in Indonesia over the past 10-20 years.
Figure 108: Comparison of planted oil palm area of planters as at 31 Dec 2011
Title:
Source:
Please fill in the values above to have them entered in your report
0
100
200
300
400
500
600
SIME GGR FGVH WIL IFAR/SIMP KLK** AALI IOI* FR KUL GENP TWB# BAL LSIP SGRO BWPT KAGR HAPL
*As of June 2011 #As of Dec 2010**As of Sept 2011
('000 ha)
SOURCES: CIMB, COMPANY REPORTS
Comparing mature areas
The top three owners of mature oil palm estates in the region are broadly the same as the top three in terms of planted area. Sime is the largest, followed by Golden Agri and FGVH. 60% of Sime’s planted estates are located in Malaysia and the remaining 40% in Indonesia. All of Golden Agri’s estates are in Indonesia while FGVH’s planted estates (excluding JV-owned estates) are located in Malaysia.
Figure 109: Mature planted oil palm area of selected oil palm players as at 31 Dec 2011
Title:
Source:
Please fill in the values above to have them entered in your report
0
50
100
150
200
250
300
350
400
450
500
SIME GGR FGVH WIL IFAR/SIMP AALI KLK IOI FR** TWB# LSIP GENP BAL SRGO* HAPL KAGR
('000 ha)
*As of June 2011 #As of Dec 2010**As of Sept 2011
SOURCES: CIMB, COMPANY REPORTS

Felda Global Ventures August 6, 2012
65
Comparing average FFB yields in 2011
FGVH is ranked 11th among the listed regional planters in terms of average FFB yield achieved. Its FFB yield is lower than most of its big-cap peers in Malaysia as a higher proportion of its planted oil palm estates are over 20 years old. We estimate the average age of its oil palm estates to be 17 years, which is the highest among the regional planters we track. On top of that, 53% of its estates are above 21 years, which is when theoretical FFB yields start trending lower.
Figure 110: FFB yield comparison among regional planters in 2011
12
14
16
18
20
22
24
26
IOI GENP SIME (MAL)
BWPT HAPL FR KLK* AALI GGR SGRO** FGVH WIL SIME (IND) LSIP IFAR/SIMP
BAL KAGR
(MT/ha)
SOURCES: CIMB, COMPANY REPORTS
Figure 111: Regional planters' age profiles as of FY11
FGVH SIME IOI* GENP**
0-3 yr 17% Immature 10% Immature 11% Immature 12%
4-9 yr 13% 4-8 yr 12% Young 8% 3-7 yr 33%
10-14 yr 7% 9-18 yr 62% Prime 72% 7-15 yr 25%
15-20 yr 10% 19-25 yr 14% Past Prime 9% 15-20 yr 14%
21-25 yr 36% >25 yr 2% Due 20-25 yr 16%
>25 yr 17% >25 yr 10
Average age 17 Average age 13 Average age 12 Average age 10
HAPL KLK** GGR IFAR/SIMP
Immature 10% Immature 21% Immature 15% Immature 27%
30 months - 7yr 9% 4-9 yr 27% 4-6 yr 24% 4-6 yr 16%
7-16 yr 45% 10-18 yr 42% 7-18 yr 38% 7-20 yr 34%
≥17 yr 36% >19 yr 11% 19-25 yr 20% >20 yr 24%
>25 yr 3%
Average 13 Average age 10 Average age 12 Average age 12
Wilmar AALI LSIP SGRO
Immature 12% Immature 14% Immature 13% Immature 28%
4-6 yr 33% <4 yr 14% 4-6 yr 18% 4-7 yr 10%
7-14 yr 25% 4-5 yr 11% 7-20 yr 62% 8-11 yr 7%
15-18 yr 14% 6-9 yr 10% >20 yr 7% 12-15 yr 18%
>18 yr 16% 10-14 yr 4% 16-19 yr 30%
>15 yr 47% 20-25 yr 7%
Average age 10 Average age 14 Average age 12 Average age 11
BWPT BAL FR KAGR
Immature 67% Immature 41% Immature 35% Immature 50%
4-7 yr 11% 4-6 yr 35% 4-7 yr 21% 4-6 yr 30%
8-14 yr 22% 7-18 yr 23% 8-17 yr 41% 7-20 yr 20%
>18 yr 3%
Average age 4 Average age 5 Average age 8 Average age 6
*Age profile for FGVH as at 31 Mar 2011.
**Age profile for other planters as at 31 Dec, except GENP(as at 31 Mar 2012), IOI (as at 30 June 2011) and KLK (as at 30 Sept 2011) SOURCES: CIMB, COMPANY REPORTS

Felda Global Ventures August 6, 2012
66
Comparing FFB production of regional planters
In terms of FFB production volume, the group is ranked third in the region (after Sime and Golden Agri), thanks to its sizeable mature palm oil estates.
Figure 112: FFB production of regional planters in 2011
Title:
Source:
Please fill in the values above to have them entered in your report
0
2,000
4,000
6,000
8,000
10,000
12,000
SIME GGR FGVH AALI WIL IOI KLK IFAR/SIMP
FR SGRO GENP TWB LSIP BAL HAPL BWPT KAGR
('000 MT)
SOURCES: CIMB, COMPANY REPORTS
CPO production
FGVH, through its associate FHB, is the largest CPO producer in the world and Malaysia. This is because the group’s milling operations under 49% associate FHB have a secure source of FFB from settlers and the estates leased from FELDA. On top of that, it purchases 33% of its FFB from third parties to enhance the utilisation rate of its mills.
Figure 113: CPO production of regional planters in 2011
Title:
Source:
Please fill in the values above to have them entered in your report
-
500
1,000
1,500
2,000
2,500
3,000
3,500
FGVH Sime GGR WIL AALI IFAR/SIMP KLK IOI FR LSIP BAL TWB SGRO HAPL KAGR BWPT
('000 MT)
SOURCES: CIMB, COMPANY REPORTS

Felda Global Ventures August 6, 2012
67
Figure 114: FFB sources for FHB’s CPO mills Total Sources of FFB
FYE Dec 31
('000 MT) % ('000 MT) % ('000 MT) %
Plantation estates on the FELDA-leased and
managed land 5,213 34.4% 4,744 32.8% 5,128 31.9%
FELDA Settlers 4,794 31.6% 4,774 33.0% 5,307 33.0%
Third parties 4,896 32.3% 4,693 32.5% 5,381 33.4%
F Agricultural. 260 1.7% 248 1.7% 272 1.7%
Total 15,163 100% 14,459 100% 16,088 100%
2009 2010 2011
SOURCES: CIMB, COMPANY REPORTS
OER achieved by the group’s mills is the second lowest among the regional planters. This could be due to their inability to control the quality of FFB crops that are processed by the mills as 33.4% of the FFB crops processed in 2011 came from third-party estates and another 33% of FFBs processed are sourced from settlers.
Figure 115: Oil extraction rate (2011)
Title:
Source:
Please fill in the values above to have them entered in your report
18%
19%
20%
21%
22%
23%
24%
25%
BAL FR GGR LSIP AALI IFAR/SIMP
SIME (IND) KLK** SIME (MAL) HAPL IOI* KAGR WIL FGVH GENP
**FYE Sept 2011 SOURCES: CIMB, COMPANY REPORTS
In 2011, FGVH’s estates produced the second lowest EBIT per ha (before lease payment to FELDA). We believe that this is largely because the group’s estates achieved lower FFB yields than its peers. Secondly, the group’s estates and milling operations are run by two separate entities. As such, the profitability of the estates does not capture the added value of processing FFB into CPO as well as profit earned from processing third parties’ fruits at the mills.

Felda Global Ventures August 6, 2012
68
Figure 116: EBIT/mature hectare (2011)
Title:
Source:
Please fill in the values above to have them entered in your report
0
1,000
2,000
3,000
4,000
5,000
BAL FR** KLK IOI WIL HAPL GENP SRGO* GGR IFAR/SIMP LSIP SIME TWB# AALI FGVH KAGR
*EBIT before SG&A/ mature hectarage #Profit before tax/ mature hectarage**EBITDA/ mature hectarage
(US$/ ha)
SOURCES: CIMB, COMPANY REPORTS
We estimate that Sime has the largest landbank among the listed players due to its venture into Liberia. Wilmar’s landbank is mostly in Indonesia. FGVH does not have significant unplanted landbank and is keen to explore acquisitions.
Figure 117: Landbank as at 31 Dec 2011
0
100
200
300
400
500
600
700
800
900
1,000
SIME WIL* GGR FGVH IFAR/SIMP KLK** SGRO AALI LSIP FR IOI* BAL*** KAGR GENP BWPT HAPL
('000 ha)
SOURCES: CIMB, COMPANY REPORTS
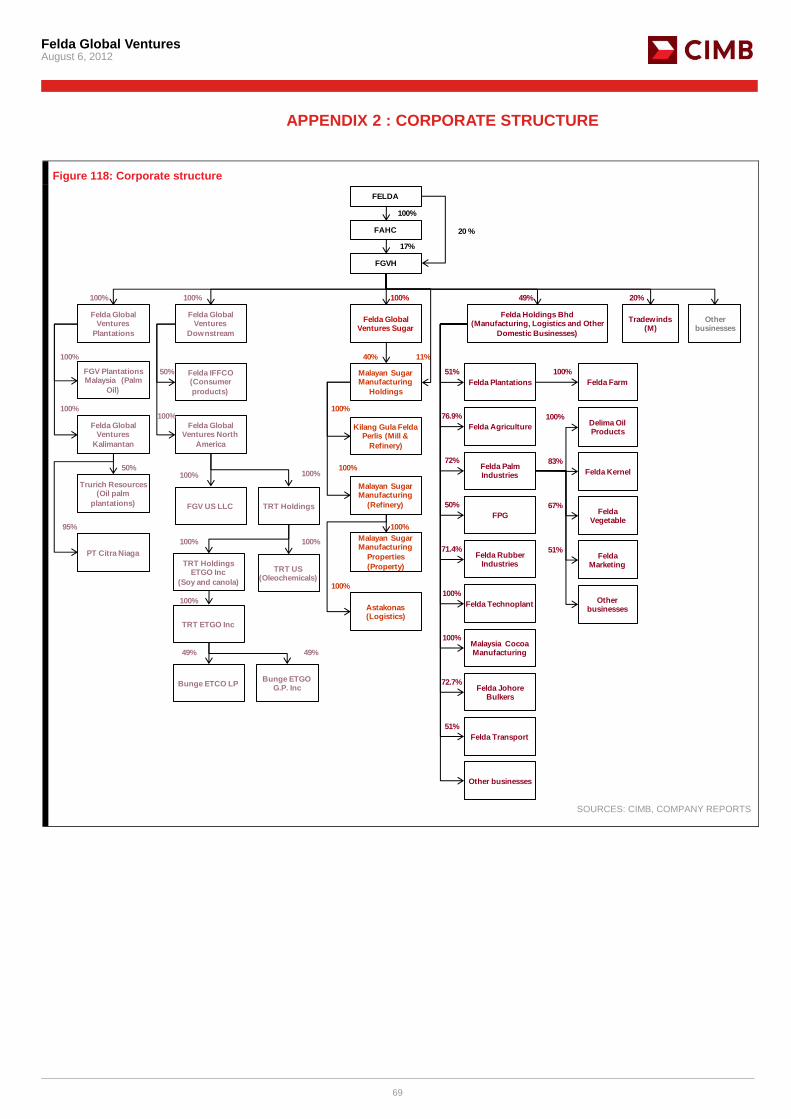
Felda Global Ventures August 6, 2012
69
APPENDIX 2 : CORPORATE STRUCTURE
Figure 118: Corporate structure
Felda Global Ventures
Plantations
Felda Global Ventures
Downstream
Felda Global Ventures Sugar
Felda Holdings Bhd(Manufacturing, Logistics and Other
Domestic Businesses)
FGV Plantations Malaysia (Palm
Oil)
Felda Global Ventures
Kalimantan
Felda IFFCO (Consumer
products)
Felda Global Ventures North
America
FGV US LLC
Malayan Sugar Manufacturing
Holdings
Kilang Gula FeldaPerlis (Mill &
Refinery)
Malayan Sugar Manufacturing
(Refinery)
Malayan Sugar Manufacturing
Properties
(Property)
Tradewinds(M)
Other businesses
Felda Plantations
Felda Agriculture
Felda Palm Industries
FPG
Felda Rubber Industries
Felda Technoplant
Felda JohoreBulkers
Malaysia Cocoa Manufacturing
Felda Farm
Delima Oil Products
Felda Kernel
FeldaVegetable
FeldaMarketing
Astakonas(Logistics)
TRT Holdings
TRT US(Oleochemicals)
TRT ETGO Inc
TRT Holdings ETGO Inc
(Soy and canola)
Felda Transport
Other businesses
Trurich Resources(Oil palm
plantations)
PT Citra Niaga
Bunge ETCO LPBunge ETGO
G.P. Inc
FGVH
FAHC
FELDA
100%
17%
49%100%100%100%
51%
76.9%
72%
50%
71.4%
100%
100%
72.7%
51%
100%
100%
83%
67%
51%
50%
100%
100%
11%100%
100%
100% 100%
100%
49% 49%
100%
20%
100%
50%
95%
100%
40%
100%
100%
20 %
Other businesses
SOURCES: CIMB, COMPANY REPORTS
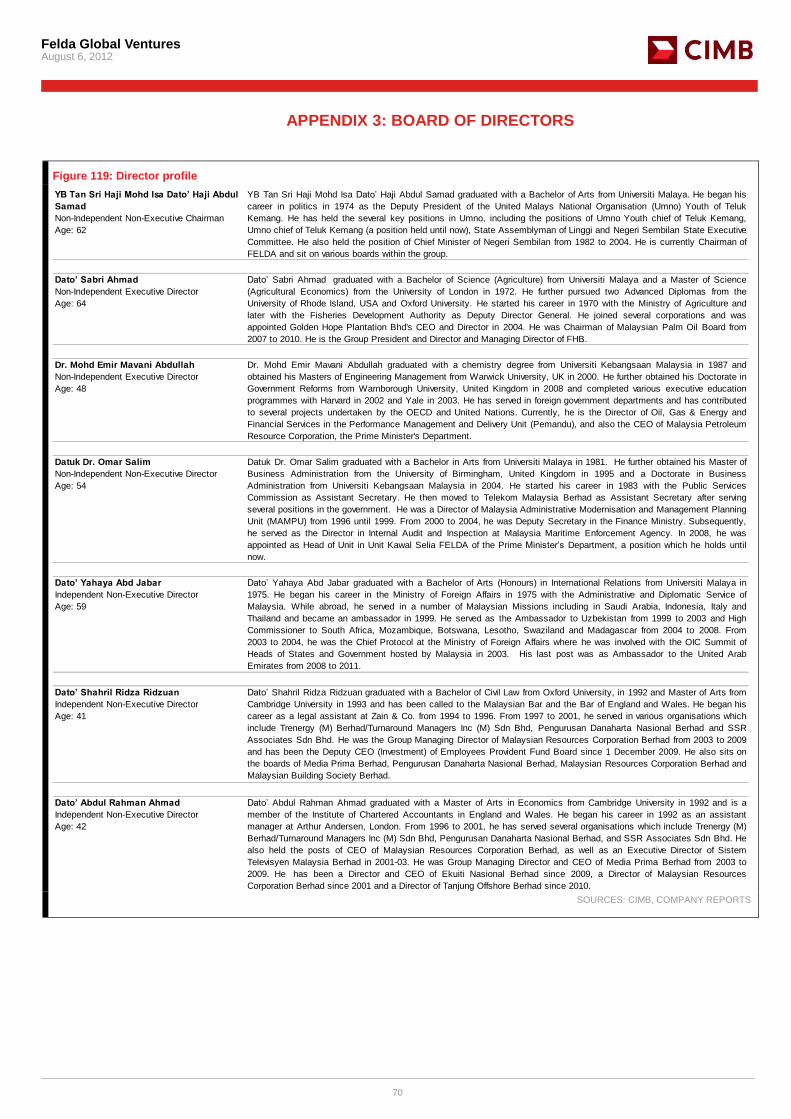
Felda Global Ventures August 6, 2012
70
APPENDIX 3: BOARD OF DIRECTORS
Figure 119: Director profile
YB Tan Sri Haji Mohd Isa Dato’ Haji Abdul
Samad
Non-Independent Non-Executive Chairman
Age: 62
YB Tan Sri Haji Mohd Isa Dato’ Haji Abdul Samad graduated with a Bachelor of Arts from Universiti Malaya. He began his
career in politics in 1974 as the Deputy President of the United Malays National Organisation (Umno) Youth of Teluk
Kemang. He has held the several key positions in Umno, including the positions of Umno Youth chief of Teluk Kemang,
Umno chief of Teluk Kemang (a position held until now), State Assemblyman of Linggi and Negeri Sembilan State Executive
Committee. He also held the position of Chief Minister of Negeri Sembilan from 1982 to 2004. He is currently Chairman of
FELDA and sit on various boards within the group.
Dato’ Sabri Ahmad
Non-Independent Executive Director
Age: 64
Dato’ Sabri Ahmad graduated with a Bachelor of Science (Agriculture) from Universiti Malaya and a Master of Science
(Agricultural Economics) from the University of London in 1972. He further pursued two Advanced Diplomas from the
University of Rhode Island, USA and Oxford University. He started his career in 1970 with the Ministry of Agriculture and
later with the Fisheries Development Authority as Deputy Director General. He joined several corporations and was
appointed Golden Hope Plantation Bhd's CEO and Director in 2004. He was Chairman of Malaysian Palm Oil Board from
2007 to 2010. He is the Group President and Director and Managing Director of FHB.
Dr. Mohd Emir Mavani Abdullah
Non-Independent Executive Director
Age: 48
Dr. Mohd Emir Mavani Abdullah graduated with a chemistry degree from Universiti Kebangsaan Malaysia in 1987 and
obtained his Masters of Engineering Management from Warwick University, UK in 2000. He further obtained his Doctorate in
Government Reforms from Warnborough University, United Kingdom in 2008 and completed various executive education
programmes with Harvard in 2002 and Yale in 2003. He has served in foreign government departments and has contributed
to several projects undertaken by the OECD and United Nations. Currently, he is the Director of Oil, Gas & Energy and
Financial Services in the Performance Management and Delivery Unit (Pemandu), and also the CEO of Malaysia Petroleum
Resource Corporation, the Prime Minister's Department.
Datuk Dr. Omar Salim
Non-Independent Non-Executive Director
Age: 54
Datuk Dr. Omar Salim graduated with a Bachelor in Arts from Universiti Malaya in 1981. He further obtained his Master of
Business Administration from the University of Birmingham, United Kingdom in 1995 and a Doctorate in Business
Administration from Universiti Kebangsaan Malaysia in 2004. He started his career in 1983 with the Public Services
Commission as Assistant Secretary. He then moved to Telekom Malaysia Berhad as Assistant Secretary after serving
several positions in the government. He was a Director of Malaysia Administrative Modernisation and Management Planning
Unit (MAMPU) from 1996 until 1999. From 2000 to 2004, he was Deputy Secretary in the Finance Ministry. Subsequently,
he served as the Director in Internal Audit and Inspection at Malaysia Maritime Enforcement Agency. In 2008, he was
appointed as Head of Unit in Unit Kawal Selia FELDA of the Prime Minister’s Department, a position which he holds until
now.
Dato’ Yahaya Abd Jabar
Independent Non-Executive Director
Age: 59
Dato’ Yahaya Abd Jabar graduated with a Bachelor of Arts (Honours) in International Relations from Universiti Malaya in
1975. He began his career in the Ministry of Foreign Affairs in 1975 with the Administrative and Diplomatic Service of
Malaysia. While abroad, he served in a number of Malaysian Missions including in Saudi Arabia, Indonesia, Italy and
Thailand and became an ambassador in 1999. He served as the Ambassador to Uzbekistan from 1999 to 2003 and High
Commissioner to South Africa, Mozambique, Botswana, Lesotho, Swaziland and Madagascar from 2004 to 2008. From
2003 to 2004, he was the Chief Protocol at the Ministry of Foreign Affairs where he was involved with the OIC Summit of
Heads of States and Government hosted by Malaysia in 2003. His last post was as Ambassador to the United Arab
Emirates from 2008 to 2011.
Dato’ Shahril Ridza Ridzuan
Independent Non-Executive Director
Age: 41
Dato’ Shahril Ridza Ridzuan graduated with a Bachelor of Civil Law from Oxford University, in 1992 and Master of Arts from
Cambridge University in 1993 and has been called to the Malaysian Bar and the Bar of England and Wales. He began his
career as a legal assistant at Zain & Co. from 1994 to 1996. From 1997 to 2001, he served in various organisations which
include Trenergy (M) Berhad/Turnaround Managers Inc (M) Sdn Bhd, Pengurusan Danaharta Nasional Berhad and SSR
Associates Sdn Bhd. He was the Group Managing Director of Malaysian Resources Corporation Berhad from 2003 to 2009
and has been the Deputy CEO (Investment) of Employees Provident Fund Board since 1 December 2009. He also sits on
the boards of Media Prima Berhad, Pengurusan Danaharta Nasional Berhad, Malaysian Resources Corporation Berhad and
Malaysian Building Society Berhad.
Dato’ Abdul Rahman Ahmad
Independent Non-Executive Director
Age: 42
Dato’ Abdul Rahman Ahmad graduated with a Master of Arts in Economics from Cambridge University in 1992 and is a
member of the Institute of Chartered Accountants in England and Wales. He began his career in 1992 as an assistant
manager at Arthur Andersen, London. From 1996 to 2001, he has served several organisations which include Trenergy (M)
Berhad/Turnaround Managers Inc (M) Sdn Bhd, Pengurusan Danaharta Nasional Berhad, and SSR Associates Sdn Bhd. He
also held the posts of CEO of Malaysian Resources Corporation Berhad, as well as an Executive Director of Sistem
Televisyen Malaysia Berhad in 2001-03. He was Group Managing Director and CEO of Media Prima Berhad from 2003 to
2009. He has been a Director and CEO of Ekuiti Nasional Berhad since 2009, a Director of Malaysian Resources
Corporation Berhad since 2001 and a Director of Tanjung Offshore Berhad since 2010. SOURCES: CIMB, COMPANY REPORTS

Felda Global Ventures August 6, 2012
71
APPENDIX 4: KEY MANAGEMENT TEAM
Figure 120: Management profile
Dato’ Sabri Ahmad
Group President and CEO
Age: 64
Dato’ Sabri Ahmad graduated with a Bachelor of Science (Agriculture) from Universiti Malaya and a Master of Science
(Agricultural Economics) from the University of London in 1972. He further pursued two Advanced Diplomas from the
University of Rhode Island, USA and Oxford University. He started his career in 1970 with the Ministry of Agriculture and
later with the Fisheries Development Authority as Deputy Director General. He joined several corporations and was
appointed Golden Hope Plantation Bhd's CEO and Director in 2004. He was Chairman of Malaysian Palm Oil Board from
2007 to 2010. He is the Group President and Director and Managing Director of FHB.
Ramli Putih
Head of Management Advisory
Age: 58
Ramli Putih graduated with a Diploma of Agriculture and a Bachelor of Science from Universiti Putra Malaysia in 1974 and
1988, respectively. He started his career as a Manager for several of FELDA’s estates. In the 1988, he was appointed as
Senior General Manager of F Rubber Industries. In 2002, he was promoted as the CEO of MCM. He held this position for
two years before moving to Felda Trading Sdn Bhd also as a CEO in 2004. In 2006, he was appointed as the Deputy
Managing Director of FHB. In 2010, he joined FGVH as Executive Vice President, Head of Multicrop.
Dr. Suzana Idayu Wati Osman
Chief Strategy Officer
Age: 43
Dr. Suzana Idayu Wati Osman obtained her BA (Hons) in Business Studies from the University of Huddersfield, England in
1992, and MBA (Finance) and Doctorate in Finance from Universiti Putra Malaysia in 2004 and 2011, respectively. She has
also attended the Advanced Management Program at Harvard Business School, Harvard University. She started as an Audit
and Accounting Assistant for the London Borough of Barking and Dagenham, United Kingdom. In 1993, she worked as
Sales Administration Officer with Metroplex Berhad and then as a Finance and Administration Manager in a manufacturing
company. She joined Bank of Tokyo-Mitsubishi in 1994 and Sime Bank in 1998. She joined FELDA in 1998 and
progressed to the position of Head of Investment. In 2008, she became Deputy Group CEO. After the reorganisation
exercises, she was promoted to the post of Executive Vice President and assumed her current position.
Abdul Halim Ahmad
Head of Manufacturing, Logistics and Others
Age: 56
Abdul Halim Ahmad obtained his Diploma in Mechanical Engineering from Universiti Teknologi Malaysia in 1977. He has
been a Certified Steam Engineer since 1986 and has also attended various courses at the Asian Institute of Management,
Manila, Philippines and Harvard University. He started his career with FELDA in 1977 as an Assistant Manager and rose
through the ranks to become Executive Director of F Vegetable and later Senior Executive Director of F Palm Industries in
2007. In 2010, he joined the company as Senior Vice President holding the position of Head of Oleochemicals. He is also
involved in various committees including the Main Research and Development Committee of Malaysian Palm Oil
Association. He is the former Chairman of Technical Committee of Malaysian Palm Oil Association (MPOA) and currently a
member of Program Advisory Counsel to MPOB.
Chua Say Sin
Head of Sugar Business
Age: 65
Chua Say Sin graduated with a Bachelor in Electrical Engineering from the University of New South Wales, Australia and a
Master of Engineering Science from the University of Sydney, Australia. He is currently a registered Professional Engineer
(PE). He is also a member of the Institution of Engineer (MIEM). He started his career in the container port of the Port of
Singapore Authority, Singapore in 1973. He joined MSM in 1974 and was appointed the Factory Manager in 1988 before he
was seconded to another subsidiary of PBB group, ChemQuest Sdn Bhd, as Managing Director. Since 1999, he has been
the Managing Director of MSM. He has over 30 years of experience in the sugar industry. He is currently the CEO of MSM
Holdings.
Palaniappan Swaminathan
Head of Research and Development
Age: 57
Palaniappan Swaminathan obtained his Bachelor of Science (Honours) and Master of Science both from Universiti Malaya in
1978 and 1982, respectively. In 1993, he obtained his ACCA Certified Diploma in Accounting and Finance. He also has a
certificate in plant breeding from the International Agricultural Centre, Wageningen, Netherlands. He joined F Agricultural in
1978 as a Research Officer. He was appointed as the General Manager of Research and Development in 2004 and CEO of F
Agricultural in 2006. He was also a member of the Advisory Committee for Biotechnology and Molecular Science, Universiti
Putra Malaysia and a member of the board of advisors for the proposed Kulliyyah of Agricultural Science and National
Resources, International Islamic University Malaysia. In 2012, he was appointed Senior Vice President, Head of Research
and Development. SOURCES: CIMB, COMPANY REPORTS

Felda Global Ventures August 6, 2012
72
Figure 121: Management profile (continued)
Martin Rushworth
Head of Downstream Business
Age: 59
Martin Rushworth obtained his Bachelor of Engineering Science from Durham University, England in 1974. He also received
his Manufacturing Technology Diploma from Colchester Technical College and attended Business Education Programmes at
London Business School and Bradford Business School, United Kingdom in 1977. He started his career in 1974 as a
Management Trainee with Unilever UK. During his tenure with Unilever, he served at different regions which included places
such as Zimbabwe, Congo, Malawi and Cote d’Ivoire. He was Chairman and Managing Director of Unilever’s oil palm
business in Malaysia from 2001 to 2004. In 2004, he set up his own palm oil consulting business, Clearwind Sdn Bhd,
where he was the Chairman and Managing Director. Rushworth sold his business in 2011. He joined FGVH in the same
year as Senior Vice President, Head of Oil and Fats.
Fairuz Ismail
Head of Global Plantations
Age: 49
Fairuz Ismail has a Diploma in Planting and Industry Management from the Universiti Technologi MARA in 1984. He is an
Exco member of Malaysian Palm Oil Association (MPOA) and also a member of professional bodies namely Asian Institute
of Management (AIM) and Incorporated Society of Planters (ISP). He started his career in 1985 at Golden Hope Plantations
Berhad and where he served within the group for 22 years. After the merger between Golden Hope Plantations Berhad,
Kumpulan Guthrie Berhad and Sime Darby Berhad in 2007, he was appointed as Region Head of Estates Operations in
East Malaysia in the new entity, Sime Darby Plantations Sdn Bhd. He then continued his service as Head of New Projects
in Liberia, Sabah and Sarawak. In 2010, he joined the Company as Senior Vice President, Head of Transformation and
Management Office.
Ahmad Tifli Dato’ Hj Mohd Talha
Chief Financial Officer
Age: 46
Ahmad Tifli Dato’ Haji Mohd Talha is a member of the Institute of Chartered Accountants in England and Wales (ICAEW) in
1989. He started his career in 1985 in Hobson Phillips & Sharpe Chartered Accountants, Nottingham, England. In 1991, he
joined Price Waterhouse Kuala Lumpur as an audit senior. Prior to joining FGVH, he served multiple positions in
corporations such as Accountant in Perbadanan Usahawan Nasional Berhad, Financial Controller in Boustead Trading Sdn
Bhd, Group Financial Controller and Chief Operating Officer of Kumpulan Mofaz Sdn Bhd, Deputy General Manager in
Strategy and Head of International Sales & Services Division of Proton Berhad, CEO of a subsidiary of PROTON Berhad,
and Chief Operating Officer of Motorsports Knights (M)Sdn Bhd before he moved to Scomi Group as a Head of Scomi Coach
in 2008. In 2011, he joined the Company as Senior Vice President and assumed his current position.
Norzaimah Maarof
Chief Counsel
Age: 42
Norzaimah Maarof graduated with a Bachelor of Laws from the University of Southampton and was called to the Bar of
England and Wales in 1993. She started her career as a Legal Researcher in 1990 with Messrs. SK Tay & Co. From the
period of 1994 until 2000, she was an Assistant Manager at General Lumber Fabricators & Builders Sdn Bhd. She then
moved to Phillips Malaysia Sdn Bhd as Senior Legal Counsel from 2000 to 2003. She joined Pfizer Malaysia Sdn Bhd in
2003 where she was first appointed as Legal Director for Malaysia, Singapore and Brunei and then seconded to Pfizer
Headquarters in New York in 2006. She was later appointed as Legal Director for Asia Research and Development where
she provided core research and development legal support and counsel for Pfizer Global research and development activities
in Asia and support and counsel for international clinical trials. In 2009, she joined the company as Vice President and
assumed her current position. SOURCES: CIMB, COMPANY REPORTS

Felda Global Ventures August 6, 2012
73
APPENDIX 5: FHB’S PROCESSING FACILITIES
FHB sources FFB from (1) FELDA-leased estates, (2) FELDA settlers, (3) third parties, and (4) F Agricultural. Its palm oil mills process the FFB into crude palm oil (CPO) and PK. The group’s operates 70 palm oil mills in Malaysia, 58 of which are in Peninsular Malaysia and 12 are in Sabah and Sarawak.
The group’s annual milling capacity of approximately 20.4m tonnes of FFB means that the group operates around 20.5% of the total milling capacity in Malaysia. In 2011, FHB’s CPO production of 3.3m tonnes accounted for 17.4% of Malaysia’s CPO production.
Figure 122: FGVH’s production of CPO and PK Figure 123: Breakdown of sources of FFB for its mils in 2011
FYE Dec 31 2009 2010 2011
CPO ('000 MT) ('000 MT) ('000 MT)
Peninsular Malaysia 2,542 2,445 2,699
Sabah 535 508 551
Sarawak 36 37 44
Total 3,112 2,989 3,293
PK
Peninsular Malaysia 688 648 704
Sabah 123 112 126
Sarawak 9 9 10
Total 819 770 841
FYE Dec 31
('000 MT) % ('000 MT) % ('000 MT) %
Plantation estates on
the FELDA-leased and
managed Land
5,213 34.4% 4,744 32.8% 5,128 31.9%
FELDA Settlers 4,794 31.6% 4,774 33.0% 5,307 33.0%
Third parties 4,896 32.3% 4,693 32.5% 5,381 33.4%
F Agricultural. 260 1.7% 248 1.7% 272 1.7%
Total 15,163 100% 14,459 100% 16,088 100%
2009 2010 2011
SOURCES: CIMB, COMPANY REPORTS SOURCES: CIMB, COMPANY REPORTS
The oil extraction rates achieved by the group’s mills are similar to the relevant MPOB’s industry average figures by location.
Figure 124: Performance metrics for palm oil mills
FYE 31 Dec 2009 2010 2011
CPO extraction rate
Peninsular Malaysia – actual 20.4% 20.6% 20.5%
MPOB Benchmark 19.9% 19.9% 20.1%
Sabah – actual 21.2% 21.2% 20.5%
MPOB Benchmark 21.4% 21.3% 20.7%
Sarawak – actual 21.3% 21.4% 22.0%
MPOB Benchmark 21.2% 20.9% 20.6%
Average CPO extraction rate – actual 20.5% 20.7% 20.5%
MPOB Benchmark 20.5% 20.5% 20.4%
PK extraction rate
Peninsular Malaysia – actual 5.5% 5.5% 5.3%
MPOB Benchmark 5.6% 5.5% 5.5%
Sabah – actual 4.9% 4.7% 4.7%
MPOB Benchmark 4.8% 4.8% 4.7%
Sarawak – actual 5.4% 5.4% 5.3%
MPOB Benchmark 4.5% 4.4% 4.4%
Average PK extraction rate – actual 5.4% 5.3% 5.2%
MPOB Benchmark 5.3% 5.2% 5.1% SOURCES: CIMB, COMPANY REPORTS
The group owns and operates four PK crushing plants, three of which are located in Peninsular Malaysia and one in Sabah. FHB’s PK crushing plants have an aggregate annual crushing capacity of 1.03m tonnes, which represents 14.5% of Malaysian PK crushing capacity in 2010.

Felda Global Ventures August 6, 2012
74
Figure 125: PK crushing plants
Production Facility Maximum PK processing
capacity per hour (MT)
Maximum PK processing
capacity per annum (MT)*
PK processed
in 2011 (MT)
Approximate
utilisation rate**
Pasir Gudang, Johor. 35.42 302,000 273,593 90.6%
Semambu, Pahang 50.00 426,000 321,484 75.5%
Pandamaran, Selangor 16.67 142,000 136,628 96.2%
Sahabat, Sabah 18.75 160,000 125,298 78.3%
**Calculated by dividing processed volume per annum by maximum processing capacity per annum.
*FHB's annual processing capacity is based on the optimum processing capacity of PK crushing plants operating 12 months in a calendar year
for 29.6 days a month and 24 hours a day.
SOURCES: CIMB, COMPANY REPORTS
The group owns 10 biogas plants that are co-located with certain of its palm oil mills. These facilities capture methane gas from palm oil mill operations. In addition, it operates its own power plant and three mini-gasifiers, all of which convert empty fruit bunches (EFB) into fuel for palm oil mills. It also uses biomass to produce fertiliser.
Figure 126: Biomass facilities
Type of Biomass Source Estimated volume
('000 MT per annum)
Current use
EFB Mill 3,000 Compost fertilizer, pellet, long fibre and renewable energy
Palm Kernel Shells Mill 700 Co-generation
Mesocarp Fibre Mill 1,700 Co-generation
Palm Oil Mill Effluent Mill 9,000 Methane gas capture (biogas) SOURCES: CIMB, COMPANY REPORTS
FHB operates five palm oil refineries with a total capacity of approximately 2.5m tonnes, representing 11% of Malaysian palm oil refining capacity. In 2011, FHB’s palm oil refineries had capacity utilisation rates of approximately 62% for refining, 71% for fractionation and 74% for packed product production.
Figure 127: Palm oil refineries’ annual capacity
Location Refining capacity Fractionation capacity Packed products capacity
(MT)
Pasir Gudang, Johor 336,000 302,400 134,400
Kuantan, Pahang 1,260,000 806,400 -
Tawau, Sabah 151,200 201,600 -
Lahad Datu, Sabah 336,000 268,800 -
Sahabat, Sabah 403,200 369,600 -
Total 2,486,400 1,948,800 134,400*Annual processing capacity is based on the optimum processing capacity of palm oil refineries operating 336 days per year and 24 hours a day.
SOURCES: CIMB, COMPANY REPORTS
FHB has eight processing facilities located throughout Peninsular Malaysia, two in Thailand and one in Indonesia. Its two processing plants in Thailand are operated by a joint venture company, Feltex, which it established in 1994 with Teck Bee Hang Company, one of the largest rubber processors of natural rubber in Thailand that was subsequently acquired by GMG Global Ltd. FHB has 51% stake in the plant. PT Felda Indo Rubber, its 90%-owned subsidiary, produces SIR 10 and SIR 20 or block rubber.
The group sources two types of rubber, field latex and cup lumps from estates on FELDA-leased land, FELDA settlers and third parties.

Felda Global Ventures August 6, 2012
75
Figure 128: Key sources of field latex Figure 129: Key sources of cup lumps
FYE Dec 31 2009 2010 2011
Rubber plantation estates on the FELDA-leased Land - - -
FELDA Settlers 14% 8% 4%
Third parties 86% 92% 96%
Total 100% 100% 100%
FYE Dec 31 2009 2010 2011
Rubber plantation estates on the FELDA-leased Land 8% 5% 6%
FELDA Settlers 54% 39% 32%
Third parties 38% 56% 62%
Total 100% 100% 100% SOURCES: CIMB, COMPANY REPORTS SOURCES: CIMB, COMPANY REPORTS
Figure 130: FHB’s production by rubber products Figure 131: Rubber production facilities
FYE Dec 31 2009 2010 2011
Production (MT) (MT) (MT)
SMR and SIR 10/20/Compound Rubber 117,929 115,402 123,903
Latex concentrates 19,788 14,322 13,516
SMR CV 50/60 1,459 1,219 1,322
Skim block 1,645 1,110 1,206
Others (crepe rubber/skimp lump) 18 - 3
Total 140,839 132,053 139,950
Location Maximum processing
capacity per annum
(MT)*
Processed in 2011
(MT)
Approximate
utilisation rate**
Malaysia 220,000 109,079 49.6%
Thailand 26,400 15,714 59.5%
Indonesia 24,000 15,157 63.2%
*Annual processing capacity is based on what FHB believes to be the optimum processing
capacity based on 25 days a month and 16 hours a day of operations.
**Calculated by dividing processed volume per annum by maximum processing capacity per
annum. SOURCES: CIMB, COMPANY REPORTS SOURCES: CIMB, COMPANY REPORTS
The group grinds cocoa beans in its processing facility in Seremban, which has a grinding capacity of 30,000 tonnes of cocoa beans per annum. FHB’s primary cocoa products are (1) cocoa powder, (2) cocoa butter, and (3) cocoa liquor. The group sold to Nestle Malaysia 64% of its cocoa products in 2009, 54% in 2010 and 45% in 2011 under short-term contracts. The group obtains a substantial portion of its beans from Indonesia.
FHB operates three fertiliser manufacturing facilities in Malaysia. Its Johor facility has annual production capacity of 300,000 tonnes. It also has two fertiliser mixing plants. The one in Kuantan has an annual production capacity of 250,000 tonnes while the other in Lahad Datu boasts a capacity of 80,000 tonnes. It manufactures urea and ammonium sulphate based compound fertiliser.
Figure 132: FHB’s production by cocoa products Figure 133: Fertiliser production facilities
FYE Dec 31 (in MT) 2009 2010 2011
Cocoa powder 9,631 11,470 10,295
Cocoa butter 7,481 8,538 7,813
Cocoa liquor 5 - -
FYE Dec 31 (in MT) 2009 2010 2011
Compound fertilizer 265,937 268,012 267,807
Mixture fertilizer 172,102 239,117 280,381
Straight fertilizer 114,338 85,678 81,620 SOURCES: CIMB, COMPANY REPORTS SOURCES: CIMB, COMPANY REPORTS
The group also owns seven bulking installations in Malaysia which have 486 storage tanks with capacity of 752,250 tonnes. These bulking installations provide annual storage of approximately 8m tonnes, 40% of which for CPO, 50% for processed palm oil and 10% for oleochemicals, biodiesel and others. The group also provides land transportation services. It operates a fleet of 251 palm oil tanker vehicles.

Felda Global Ventures August 6, 2012
76
APPENDIX 6: KEY ASSETS HELD BY THE GROUP
Figure 134: Assets AssetsBusiness Location Asset ownership Effective
stake
Key Assets
Assets owned by Felda Global Ventures Holdings
Upstream - Oil Palm
Plantations Malaysia FGVPM leases the land from Felda 100% 335,241 ha of estates in Malaysia
Plantations Indonesia PT Citra Niaga Perkasa 95% 14,385 ha of estates in Indonesia
Plantations Indonesia Trurich [50% JV with Lembaga Tabung Haji] 50% 42,000 ha of estates in Indonesia
Upstream - Rubber
Plantations Malaysia FGVPM leases the land from Felda 100% 10,308 ha of estates in Malaysia
Upstream - Timber
Plantations Malaysia FGVPM leases the land from Felda 100% 2,035 ha of estates in Malaysia
Downstream - oil products
Soybean and Canola Canada Twin River Technologies Entreprises de
Transformation de Graines Oleagineuses du
Quebec Inc (TRT-ETGO Inc)
100% Seed crushing: 1.05m tpa
Oil refining: 0.40m tpa
Meal production: 0.72m tpa
Oleochemicals United States Twin River Technologies US Inc (TRT US) 100% Fatty acid: 150k tpa
Glycerin: 25k tpa
Sugar
Refinery Penang, M'sia Malayan Sugar Manufacturing Company Bhd 51% Production: 960k tpa
Refinery Perlis, M'sia Kilang Gula Felda Perlis Sdn Bhd 51% Production: 150k tpa
Sugar mill Perlis, M'sia Kilang Gula Felda Perlis Sdn Bhd 51% Crushing: 5,500 tonne/day
Plantations Perlis, M'sia Kilang Gula Felda Perlis Sdn Bhd 51% 4,454 ha of estate in Malaysia
Assets owned through Felda IFFCO Sdn Bhd [50%-owned jointly-controlled entity]
Downstream
Refinery Selangor, M'sia Felda IFFCO Sdn Bhd (Felda IFFCO) 50% Refining: 350k tpa; Fractionation: 262.5k tpa
Packed product: 653.1k tpa
Refinery Johor, M'sia Felda iffco Oil Products Sdn Bhd 38% Refining: 490k tpa; Fractionation: 455k tpa
Packed product: 108.5k tpa
Refinery Indonesia PT Synergy Oil Nusantara 25% Refining: 525k tpa; Fractionation: 525k tpa
Packed product: 87.5k tpa
2 Refineries China Felda IFFCO South China Ltd 49% Refining: 630k tpa; Fractionation: 930k tpa
Packed product: 152k tpa
Refinery Turkey Felda IFFCO Gida Sayani Ve Ticaret A.S. 50% Refining: 52.5k tpa; Packed product: 82.25k tpa
Speciality fat production United States Felda IFFCO Sdn Bhd (Felda IFFCO) 50% Interesterified fats: 90k tpa;
omega-3 tryglyceride: 4.5k tpa
Sucrose polyesters: 90k tpa; Biodiesel: 204k tpa
Speciality fat production South Africa Felda IFFCO Bridge Industries (Pty) Ltd 50% Blending and deodarising: 42k tpa
Specialty fats production: 23.5k tpa
Packing of frying oil: 13.5k tpa
Assets owned through Felda Holdings Bhd [49%-owned associate]
Upstream
Plantations Malaysia Felda Agricultural Services Sdn Bhd 38% 12,746 ha of estates in Malaysia
70 Palm oil mills Malaysia Felda Palm Industries Sdn Bhd 35% Milling: 20.4m tonne/yr
4 PK Crushing plants Malaysia Felda Kernel Products Sdn Bhd 29% Crushing: 1.03m tonne/yr
SOURCES: CIMB, COMPANY REPORTS

Felda Global Ventures August 6, 2012
77
Figure 135: Assets AssetsBusiness Location Asset ownership Effective
stake
Capacity
Assets owned through Felda Holdings Bhd [49%-owned associate] (Continued)
Downstream - palm oil
Refinery Johor, M'sia Delima Oil Products Sdn Bhd 35% Refining: 336k tpa; Fractionation: 302k tpa
Packed product: 134.6k tpa
Refinery Pahang, M'sia Felda Vegetable Oil Products Sdn Bhd 24% Refining: 1.26m tpa; Fractionation: 806k tpa
Refinery Sabah, M'sia Felda Vegetable Oil Products Sdn Bhd 24% Refining: 151k tpa; Fractionation: 202k tpa
Refinery Sabah, M'sia Felda Vegetable Oil Products Sdn Bhd 24% Refining: 336k tpa; Fractionation: 269k tpa
Refinery Sabah, M'sia Felda Vegetable Oil Products Sdn Bhd 24% Refining: 403k tpa; Fractionation: 370k tpa
Oleochemicals plant Pahang, M'sia FPG Oleochemicals Sdn Bhd 25% Methyl ester: 280k tpa; Fatty alcohol: 80k tpa
Refined glycerin: 35k tpa; Detergent: 60k tpa
Refinery Pakistan Mapak Edible Oils (Private) Ltd 18% Oil refining: 360k tpa
Refinery China Voray Holdings 13% Oil refining: 100tpa
Rubber
8 processing plants Malaysia Felda Rubber Industries Sdn Bhd 35% Production: 220k tpa
2 processing plants Thailand Feltex Co Ltd 18% Production: 26.4k tpa
1 processing plant Indonesia PT Felda Indo Rubber 31% Production: 24.0k tpa
Other businesses
Cocoa production Malaysia Malaysia Cocoa Manufacturing Sdn Bhd 49% Grinding: 30k tpa
Oil palm nursery Malaysia Felda Agricultural Services Sdn Bhd 38% Seed: 30m/yr; Seedling: 1.5m/yr
Tissue culture production Malaysia Felda Agricultural Services Sdn Bhd 38% Oil palm ramets:2.5m/yr; Banana ramets: 2.5m/yr
7 Bulking installations Malaysia Felda Johore Bulkers Sdn Bhd 36% Storage: 752k tonnes
Land transportation services Malaysia Felda Transport Services Sdn Bhd 25% Transport: 16.1k tonnes/day
Fertilizer production plant Johor, M'sia FPM Sdn Bhd 49% Compound type: 250k tpa;
Mixture type: 50k tpa
2 Fertilizer mixing plants Malaysia FPM Sdn Bhd 49% Production: 330k tpa SOURCES: CIMB, COMPANY REPORTS

Felda Global Ventures August 6, 2012
78
APPENDIX 7: LIST OF SUBSIDIARIES IN FGVH
Figure 136: Subsidiaries of FGVH
Entity Equity interest
held
Principal activities
Subsidiary of Felda Global Ventures Holdings
Direct Subsidiary
Felda Global Ventures Plantations Sdn Bhd 100% Investment holding
Felda Global Ventures Downstream Sdn Bhd 100% Investment holding
MSM Holdings Bhd* 51%* Investment holding
Felda Global Ventures Sugar Sdn Bhd 100% Investment holding
Felda Global Ventures India Sdn Bhd 100% Investment holding
Felda Global Ventures USA Properties Inc 100% Owner of residential real estate located in Massachusetts, US
Felda Global Ventures Livestock Sdn Bhd (FGV Livestock) 100% Investment holding
Felda Global Ventures Indonesia Sdn Bhd 100% Investment holding
Felda Global Ventures Perlis Sdn Bhd 100% Sugar cane plantation
Felda Global Ventures Shared Services Centre Sdn Bhd 100% To operate as a shared services hub for FGVH Group and other affiated entities
*40% held directly by FGVH and 11% held indirectly through Felda
Global Ventures Sugar Sdn Bhd
Subsidiaries held through Felda Global Ventures Plantations
Felda Global Ventures Plantations (Malaysia) Sdn Bhd 100% Investment holding. -The entity that has land-leasing agreement with Felda and
supply and delivery agreement with Felda Palm Industries.
Felda Global Ventures Kalimantan Sdn Bhd 100% Investment holding
Subsidiary held through Felda Global Ventures Kalimantan
PT Citra Niaga Perkasa 95% Plantation business
Subsidiaries held through Felda Global Ventures Downstream
Felda Global Ventures North America Sdn Bhd 100% Investment holding
Twin Rivers Technologies Holdings Inc (TRT Holdings)
Subsidiary held through Felda Global Ventures North America
Felda Global Ventures North America US LLC 100% Holds debt in TRT US
Subsidiaries held through TRT Holdings
Twin River Technologies Holdings Entreprises de Transformation de
Graines Oleagineuses du Quebec Inc (TRT Holdings ETGO Inc)
100% Investment holding
Twin River Technologies US Inc (TRT US) 100% Investment holding
Subsidiary held through TRT Holdings ETGO Inc
Twin River Technologies Entreprises de Transformation de Graines
Oleagineuses du Quebec Inc (TRT-ETGO Inc)
100% Oilseed crushing and refining facility in Quebac, Canada
Subsidiary held through TRT US
Twin River Technologies Manufacturing Corporation (TRTMC) 100% Owner and operator of fatty acids and glycerine production and distribution facility in
the US.
Subsidiary held through TRTMC
Fore River Transporation Corp 100% Operation and management of shortline freight railroad
Subsidiaries held through MSM Holdings Bhd
Malayan Sugar Manufacturing Company Bhd 100% Sugar refinery in Prai, Penang.
Kilang Gula Felda Perlis Sdn Bhd 100% Sugar refinery in Chuping, Perlis.
MSM Properties Sdn Bhd 100% The company has not commenced business / dormant
Astakonas Sdn Bhd 100% Lorry transport SOURCES: CIMB, COMPANY REPORTS

Felda Global Ventures August 6, 2012
79
APPENDIX 8: LIST OF ASSOCIATES AND JOINT VENTURES
Figure 137: Associates and jointly-controlled entities of FGVH
Entity Equity interest
held
Principal activities
Associates of Felda Global Ventures Holdings
Felda Holdings Bhd 49% Investment holding
Tradewinds (M) Bhd 20% Management services and investment holding
Jointly-controlled entities of Felda Global Ventures Holdings
Felda IFFCO Sdn Bhd (Felda IFFCO) 50% Refining and packing of palm-based products and investment holding.
Trurich Resources Sdn Bhd (Trurich) 50% Investment Holding
Jointly-controlled entities held through Felda IFFCO
Felda IFFCO South China Ltd 97% Manufacture and sale of palm oil and palm related products and warehousing
business of edible oil
Felda IFFCO Africa (Pty) Ltd (Felda IFFCO Africa) 99% Traders, distributors, wholesalers and retailers of agricultural and manufactured
products
IFFCO Poultry Co Sdn Bhd 100% Investment company
Felda iffco Trading Sdn Bhd 100% Trading of vegetable oil
Felda IFFCO Gida Sayani Ve Ticaret A.S. 99% Processing, refining and packing different types of edible soft oils
Felda IFFCO Inc (FI Inc) 100% Investment holding
Felda IFFCO France S.A. 100% Brokerage and intermediation of palm oil trades
Felda iffco Oil Products Sdn Bhd 75% Refining of oil palm and marketing of palm oil and by-products
PT Synergy Oil Nusantara 50% Vegetable oil processing, filtering, manufacturing, packing, selling and marketing of
oils and fats
Jointly-controlled entity held through Felda IFFCO Africa
Felda IFFCO Bridge Industries (Pty) Ltd 100% Oil Refinery
Jointly-controlled entity held through FGV Livestock
Felda iffcoallana Malaysia Sdn Bhd 50% Breeding and trading of biological asset, animal food production, fresh meat and farm
related activities
Jointly-controlled entity held through FI Inc
Felda IFFCO LLC 100% Manufacturer of high-functioning natural fats and oils based on oleo technologies
Jointly-controlled entities held through TRT-ETGO Inc
Bunge ETGO G.P. Inc / Commandité ETGO Inc. 49% Sole general partner of Bunge ETGO L.P.
Bunge ETGO L.P. 49% Oilseeds originating, sales and marketing arm for TRT-ETGO Inc.
Jointly-controlled entities held through Trurich
PT Teknik Utama Mandiri 93% Oil palm plantation
PT Satria Hupasarana 93% Oil palm plantation
PT Gemareksa Mekarsari 93% Oil palm plantation
PT TH Felda Nusantara 93% Business management consultation services
PT Usaha Kaltim Mandiri 93% Oil palm plantation
PT Anugerah Kembang Sawit Sejahtera 93% Oil palm plantation SOURCES: CIMB, COMPANY REPORTS

Felda Global Ventures August 6, 2012
80
APPENDIX 9: LIST OF SUBSIDIARIES HELD BY FELDA HOLDINGS BHD
Figure 138: Subsidiaries of Felda Holdings Bhd
Entity Equity interest
held
Principal activities
Subsidiaries of Felda Holdings Bhd
Felda Technoplant Sdn Bhd 100% Administration and management services to the settlers.
Felda Enterprises Sdn Bhd 100% Investment holding and investment management
Malaysia Cocoa Manufacturing Sdn Bhd 100% Manufacturing and selling of cocoa powder and cocoa butter
Felda Security Services Sdn Bhd 51% Security services, pest control and training services
FWQ Enterprises (Pvt.) Ltd 65% Storage services for liquid cargoes of non-petroleum products and handling, loading
and un-loading of bulk liquid cargoes at any port of Pakistan
Felda Prodata Systems Sdn Bhd 80% Provision of information technology solutions
Felda Travel Sdn Bhd 100% Procvision of travelling services and act as tour agent and management of resorts
Felda Plantations Sdn Bhd 51% Assisting, planning, controlling and providing field management
Felda Palm Industries Sdn Bhd 72% Investment holding and purchase of FFB, processing and sale of its finished products
Felda Agricultural Services Sdn Bhd 77% Oil palm plantations, production of rat bait, fertilizer and palm oil seeds and the
provision of foliar and soil analysis and agricultural services
Felda Johore Bulkers Sdn Bhd 73% Storing and handling of vegetable oil
Felda Transport Services Sdn Bhd 51% Transporting liquid and general cargo, courier, forwarding and jetty operations
Felda Rubber Industries Sdn Bhd 71% Processing of raw latex to concentrated latex and SMR, manufacturing and
distributing rubber related products
FPM Sdn Bhd 100% Manufacturing of fertilizer, manufacturing of medicines and remedies for fruit
agriculture and vegetable cultivation
Felda Engineering Services Sdn Bhd 51% Providing engineering services including project management, selling of industrial
equipment and property management
Subsidiary of Felda Plantations Sdn Bhd
Felda Farm Products Sdn Bhd 100% Breeding and trading of biological assets, animal food production, fresh meat and
farm related activities
Subsidiaries of Felda Palm Industries Sdn Bhd
FNI Biofuel Sdn Bhd 59% Manufacturing of biomass fuel palm oil from empty fruit bunches
Sutrajaya Shipping Sdn Bhd 100% Dormant
Felda Marketing Services Sdn Bhd 51% Marketing of FHB Group of Companies’ commodity products and physical trading of
CPO and CPKO
Felda Kernel Products Sdn Bhd 83% Buying and processing oil palm kernels and selling its products
Delima Oil Products Sdn Bhd 100% Processing and packing of palm oil based products
Felda Vegetable Oil Products Sdn Bhd 67% Processing and sale of refined palm oil products
Subsidiary of Felda Vegetable Oil Products Sdn Bhd
FS Oils Sdn Bhd 100% Ceased operation
Subsidiary of Felda Agricultural Services Sdn Bhd
Plantation Resorts Sdn Bhd 100% Management of FELDA Resorts
Subsidiaries of Felda Rubber Industries Sdn Bhd
Felda Rubber Products Sdn Bhd 100% Ceased operation
Feltex Co Ltd 51% Manufacturing of concentrate latex for domestic sale and export
PT Felda Indo Rubber 90% SIR 10/20 processing
Subsidiaries of Felda Johore Bulkers Sdn Bhd
Felda Bulkers Sdn Bhd 51% Provision of installation services for storage and export of palm oil, oleochemical
products, PKO and PKE, tank and warehouse rentals
PT Patisindo Sawit 100% Bulk storage tanks and handling CPO
Langsat Bulkers Sdn Bhd 100% Bulking installation for business by handling, storing and transhipping bio diesel,
biofuel, palm oil products, oleochemicals, soft oils and other vegetables oils
Subsidiary of Felda Bulkers Sdn Bhd
Felda Grains Terminal Sdn Bhd 51% Handling, storing, transporting, mixing and blending palm kernel meal and grains
Subsidiaries of Felda Engineering Services Sdn Bhd
Felda Construction Sdn Bhd 100% Construction services
Felda Properties Sdn Bhd 100% Property development and management, and project management for logging
activities
Allied Engineering Consultancy Services Sdn Bhd Provide engineering consultancy services SOURCES: CIMB, COMPANY REPORTS
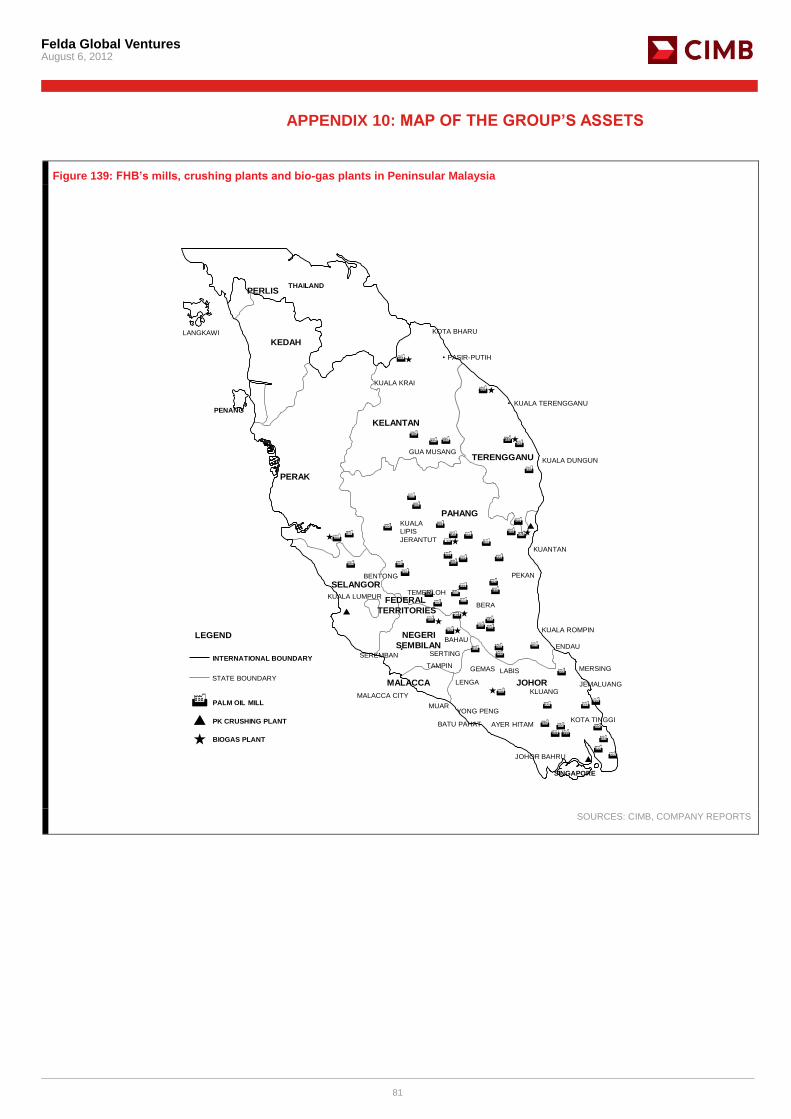
Felda Global Ventures August 6, 2012
81
APPENDIX 10: MAP OF THE GROUP’S ASSETS
Figure 139: FHB’s mills, crushing plants and bio-gas plants in Peninsular Malaysia
THAILAND
KEDAH
KELANTAN
TERENGGANU
PERAK
PERLIS
PAHANG
SELANGOR
NEGERI
SEMBILAN
MALACCA JOHOR
SINGAPORE
PENANG
JOHOR BAHRU
KOTA TINGGIBATU PAHAT AYER HITAM
YONG PENG
KLUANGJEMALUANG
MERSING
ENDAU
KUALA ROMPIN
LABISGEMAS
LENGA
MUAR
MALACCA CITY
TAMPIN
SEREMBAN
BAHAU
SERTING
BERA
PEKAN
KUANTAN
KUALA DUNGUN
KUALA TERENGGANU
PASIR-PUTIH
KOTA BHARU
KUALA KRAI
GUA MUSANG
KUALA
LIPIS
JERANTUT
BENTONG
KUALA LUMPUR
LANGKAWI
LEGEND
INTERNATIONAL BOUNDARY
PALM OIL MILL
BIOGAS PLANT
PK CRUSHING PLANT
FEDERAL
TERRITORIES
TEMERLOH
STATE BOUNDARY
SOURCES: CIMB, COMPANY REPORTS

Felda Global Ventures August 6, 2012
82
Figure 140: FHB’s mills, crushing plants and power plants in East Malaysia
SAHABAT COMPLEX
TANGUSU BAY
CELEBES SEA
1
2
9 15
16 6
5
7
48
1011
13 12
25
20
18
19
22
21
34
2331
3738
45
KG.L4649
50
52
54 53
5143
4035 34
3326
2432
323944
47
2842
44 3029 27
SAMPADI COMPLEX
KUCHING
SULU SEA
SOUTH CHINA SEA
INDONESIA
CELEBES SEAINDONESIA
SABAH
KOTA KINABALU
LAHAD DATU
SAHABAT
COMPLEX
SEMPORNA
TAWAU
BRUNEI
DARULSALAM
SARAWAK
SAMPADI
COMPLEX
PALM OIL MILL
STATE BOUNDARY
POWER PLANT
PK CRUSHING PLANT
INTERNATIONAL BOUNDARY
MAIN ROAD
SOURCES: CIMB, COMPANY REPORTS

Felda Global Ventures August 6, 2012
83
Figure 141: FGVH’s estates (Peninsular Malaysia)
SOURCES: CIMB, COMPANY REPORTS

Felda Global Ventures August 6, 2012
84
Figure 142: FGVH’s estates (East Malaysia)
SOURCES: CIMB, COMPANY REPORTS
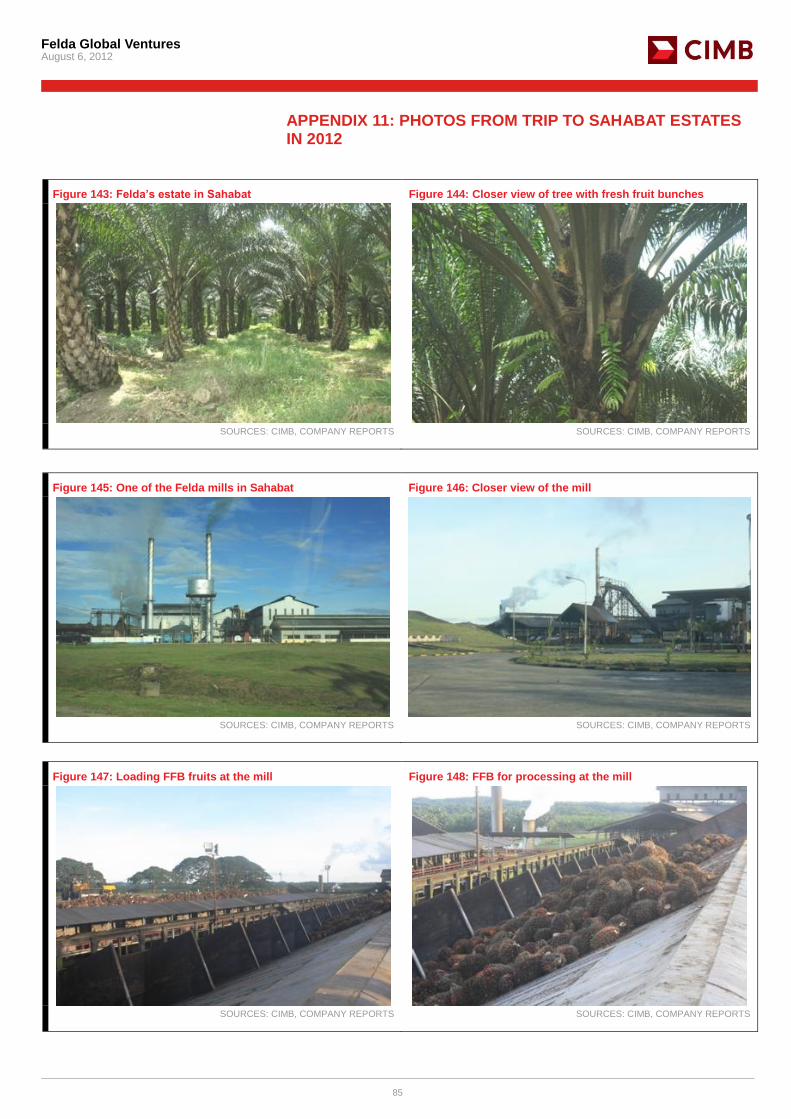
Felda Global Ventures August 6, 2012
85
APPENDIX 11: PHOTOS FROM TRIP TO SAHABAT ESTATES IN 2012
Figure 143: Felda’s estate in Sahabat Figure 144: Closer view of tree with fresh fruit bunches
SOURCES: CIMB, COMPANY REPORTS SOURCES: CIMB, COMPANY REPORTS
Figure 145: One of the Felda mills in Sahabat Figure 146: Closer view of the mill
SOURCES: CIMB, COMPANY REPORTS SOURCES: CIMB, COMPANY REPORTS
Figure 147: Loading FFB fruits at the mill Figure 148: FFB for processing at the mill
SOURCES: CIMB, COMPANY REPORTS SOURCES: CIMB, COMPANY REPORTS

Felda Global Ventures August 6, 2012
86
Figure 149: Collection of empty fruit bunches (EFB) as biomass Figure 150: Storage tanks for CPO
SOURCES: CIMB, COMPANY REPORTS SOURCES: CIMB, COMPANY REPORTS
Figure 151: Unloading palm kernels for processing Figure 152: Kernel crushing facility
SOURCES: CIMB, COMPANY REPORTS SOURCES: CIMB, COMPANY REPORTS
Figure 153: Refinery at Sahabat estate Figure 154: Storage tank next to refinery facilities
SOURCES: CIMB, COMPANY REPORTS SOURCES: CIMB, COMPANY REPORTS

Felda Global Ventures August 6, 2012
87
Figure 155: Sahabat biomass power plant Figure 156: Biomass plant in Sahabat to generate electricity
SOURCES: CIMB, COMPANY REPORTS SOURCES: CIMB, COMPANY REPORTS
Figure 157: Collection of EFB as feedstock for biomass plant Figure 158: Storage tank facility located next to jetty
SOURCES: CIMB, COMPANY REPORTS SOURCES: CIMB, COMPANY REPORTS
Figure 159: Loading palm oil into tanker at the jetty Figure 160: Pipes to load palm oil into the tanker
SOURCES: CIMB, COMPANY REPORTS SOURCES: CIMB, COMPANY REPORTS

Felda Global Ventures August 6, 2012
88
Figure 161: Jetty at Sahabat next to the estate Figure 162: Jetty at Sahabat next to the estate
SOURCES: CIMB, COMPANY REPORTS SOURCES: CIMB, COMPANY REPORTS

Felda Global Ventures August 6, 2012
89
APPENDIX 12: PHOTO FROM OUR TRIP TO MSM IN 2Q11
Figure 163: Sugarcane estate Figure 164: Chopped sugarcane
SOURCES: CIMB, COMPANY REPORTS SOURCES: CIMB, COMPANY REPORTS
Figure 165: Manual harvesting Figure 166: Mechanical harvesting
SOURCES: CIMB, COMPANY REPORTS SOURCES: CIMB, COMPANY REPORTS
Figure 167: Raw sugar Figure 168: Bagasse
SOURCES: CIMB, COMPANY REPORTS SOURCES: CIMB, COMPANY REPORTS

Felda Global Ventures August 6, 2012
90
Figure 169: Port and conveyor Figure 170: Raw sugar warehouse
SOURCES: CIMB, COMPANY REPORTS SOURCES: CIMB, COMPANY REPORTS
Figure 171: Vacuum pan Figure 172: Vertical continuous crystalliser – MSM only
SOURCES: CIMB, COMPANY REPORTS SOURCES: CIMB, COMPANY REPORTS
Figure 173: Sugar crystallising Figure 174: Railway in MSM facility
SOURCES: CIMB, COMPANY REPORTS SOURCES: CIMB, COMPANY REPORTS

Felda Global Ventures August 6, 2012
91
DISCLAIMER
This report is not directed to, or intended for distribution to or use by, any person or entity who is a citizen or resident of or located in any locality, state, country or other jurisdiction where such distribution, publication, availability or use would be contrary to law or regulation.
By accepting this report, the recipient hereof represents and warrants that he is entitled to receive such report in accordance with the restrictions set forth below and agrees to be bound by the limitations contained herein (including the “Restrictions on Distributions” set out below). Any failure to comply with these limitations may constitute a violation of law. This publication is being supplied to you strictly on the basis that it will remain confidential. No part of this report may be (i) copied, photocopied, duplicated, stored or reproduced in any form by any means or (ii) redistributed or passed on, directly or indirectly, to any other person in whole or in part, for any purpose without the prior written consent of CIMB.
CIMB, its affiliates and related companies, their directors, associates, connected parties and/or employees may own or have positions in securities of the company(ies) covered in this research report or any securities related thereto and may from time to time add to or dispose of, or may be materially interested in, any such securities. Further, CIMB, its affiliates and its related companies do and seek to do business with the company(ies) covered in this research report and may from time to time act as market maker or have assumed an underwriting commitment in securities of such company(ies), may sell them to or buy them from customers on a principal basis and may also perform or seek to perform significant investment banking, advisory or underwriting services for or relating to such company(ies) as well as solicit such investment, advisory or other services from any entity mentioned in this report. The views expressed in this report accurately reflect the personal views of the analyst(s) about the subject securities or issuers and no part of the compensation of the analyst(s) was, is, or will be directly or indirectly related to the inclusion of specific recommendations(s) or view(s) in this report. CIMB prohibits the analyst(s) who prepared this research report from receiving any compensation, incentive or bonus based on specific investment banking transactions or for providing a specific recommendation for, or view of, a particular company. However, the analyst(s) may receive compensation that is based on his/their coverage of company(ies) in the performance of his/their duties or the performance of his/their recommendations and the research personnel involved in the preparation of this report may also participate in the solicitation of the businesses as described above. In reviewing this research report, an investor should be aware that any or all of the foregoing, among other things, may give rise to real or potential conflicts of interest. Additional information is, subject to the duties of confidentiality, available on request.
The term “CIMB” shall denote where applicable the relevant entity distributing the report in that particular jurisdiction where mentioned specifically below shall be a CIMB Group Sdn Bhd’s affiliates, subsidiaries and related companies.
(i) As of August 3, 2012, CIMB has a proprietary position in the securities (which may include but not limited to shares, warrants, call warrants and/or any other derivatives) in the following company or companies covered or recommended in this report:
(a) Genting Plantations, Indofood Agri Resources, IOI Corporation, Kuala Lumpur Kepong, Sime Darby Bhd, Wilmar International
(ii) As of August 6, 2012, the analyst(s) who prepared this report, has / have an interest in the securities (which may include but not limited to shares, warrants, call warrants and/or any other derivatives) in the following company or companies covered or recommended in this report:
(a) -
The information contained in this research report is prepared from data believed to be correct and reliable at the time of issue of this report. This report does not purport to contain all the information that a prospective investor may require. CIMB or any of its affiliates does not make any guarantee, representation or warranty, express or implied, as to the adequacy, accuracy, completeness, reliability or fairness of any such information and opinion contained in this report and accordingly, neither CIMB nor any of its affiliates nor its related persons shall be liable in any manner whatsoever for any consequences (including but not limited to any direct, indirect or consequential losses, loss of profits and damages) of any reliance thereon or usage thereof.
This report is general in nature and has been prepared for information purposes only. It is intended for circulation amongst CIMB and its affiliates’ clients generally and does not have regard to the specific investment objectives, financial situation and the particular needs of any specific person who may receive this report. The information and opinions in this report are not and should not be construed or considered as an offer, recommendation or solicitation to buy or sell the subject securities, related investments or other financial instruments thereof.
Investors are advised to make their own independent evaluation of the information contained in this research report, consider their own individual investment objectives, financial situation and particular needs and consult their own professional and financial advisers as to the legal, business, financial, tax and other aspects before participating in any transaction in respect of the securities of company(ies) covered in this research report. The securities of such company(ies) may not be eligible for sale in all jurisdictions or to all categories of investors.
Australia: Despite anything in this report to the contrary, this research is provided in Australia by CIMB Research Pte. Ltd. (“CIMBR”) and CIMBR notifies each recipient and each recipient acknowledges that CIMBR is exempt from the requirement to hold an Australian financial services licence under the Corporations Act 2001 (Cth) in respect of financial services provided to the recipient. CIMBR is regulated by the Monetary Authority of Singapore under the laws of Singapore, which differ from Australian laws. This research is only available in Australia to persons who are “wholesale clients” (within the meaning of the Corporations Act 2001 (Cth)) and is supplied solely for the use of such wholesale clients and shall not be distributed or passed on to any other person. This research has been prepared without taking into account the objectives, financial situation or needs of the individual recipient.
France: Only qualified investors within the meaning of French law shall have access to this report. This report shall not be considered as an offer to subscribe to, or used in connection with, any offer for subscription or sale or marketing or direct or indirect distribution of financial instruments and it is not intended as a solicitation for the purchase of any financial instrument.
Hong Kong: This report is issued and distributed in Hong Kong by CIMB Securities Limited (“CHK”) which is licensed in Hong Kong by the Securities and Futures Commission for Type 1 (dealing in securities), Type 4 (advising on securities) and Type 6 (advising on corporate finance) activities. Any investors wishing to purchase or otherwise deal in the securities covered in this report should contact the Head of Sales at CIMB Securities Limited. The views and opinions in this research report are our own as of the date hereof and are subject to change. If the Financial Services and Markets Act of the United Kingdom or the rules of the Financial Services Authority apply to a recipient, our obligations owed to such recipient therein are unaffected. CHK has no obligation to update its opinion or the information in this research report.
This publication is strictly confidential and is for private circulation only to clients of CHK. This publication is being supplied to you strictly on the basis that it will remain confidential. No part of this material may be (i) copied, photocopied, duplicated, stored or reproduced in any form by any means or (ii) redistributed or passed on, directly or indirectly, to any other person in whole or in part, for any purpose without the prior written consent of CHK. Unless permitted to do so by the securities laws of Hong Kong, no person may issue or have in its possession for the purposes of issue, whether in Hong Kong or elsewhere, any advertisement, invitation or document relating to the securities covered in this report, which is directed at, or the contents of which are likely to be accessed or read by, the public in Hong Kong (except if permitted to do so under the securities laws of Hong Kong).
Indonesia: This report is issued and distributed by PT CIMB Securities Indonesia (“CIMBI”). The views and opinions in this research report are our own as of the date hereof and are subject to change. If the Financial Services and Markets Act of the United Kingdom or the rules of the Financial Services Authority apply to a recipient, our obligations owed to such recipient therein are unaffected. CIMBI has no obligation to update its opinion or the information in this research report.
This publication is strictly confidential and is for private circulation only to clients of CIMBI. This publication is being supplied to you strictly on the basis that it will remain confidential. No part of this material may be (i) copied, photocopied, duplicated, stored or reproduced in any form by any means or (ii) redistributed or passed on, directly or indirectly, to any other person in whole or in part, for any purpose without the prior written consent of CIMBI. Neither this report nor any copy hereof may be distributed in Indonesia or to any Indonesian citizens wherever they are domiciled or to Indonesia residents except in compliance with applicable Indonesian capital market laws and regulations.
Malaysia: This report is issued and distributed by CIMB Investment Bank Berhad (“CIMB”). The views and opinions in this research report are our own as of the date hereof and are subject to change. If the Financial Services and Markets Act of the United Kingdom or the rules of the Financial Services Authority apply to a recipient, our obligations owed to such recipient therein are unaffected. CIMB has no obligation to update its opinion or the information in this research report.
This publication is strictly confidential and is for private circulation only to clients of CIMB. This publication is being supplied to you strictly on the basis that it will remain confidential. No part of this material may be (i) copied, photocopied, duplicated, stored or reproduced in any form by any means or (ii) redistributed or passed on, directly or indirectly, to any other person in whole or in part, for any purpose without the prior written consent of CIMB.
New Zealand: In New Zealand, this report is for distribution only to persons whose principal business is the investment of money or who, in the course of, and for the purposes of their business, habitually invest money pursuant to Section 3(2)(a)(ii) of the Securities Act 1978.
Singapore: This report is issued and distributed by CIMB Research Pte Ltd (“CIMBR”). Recipients of this report are to contact CIMBR in Singapore in respect of any matters arising from, or in connection with, this report. The views and opinions in this research report are our own as of the date hereof and are subject to change. If the Financial Services and Markets Act of the United Kingdom or the rules of the Financial Services Authority apply to a recipient, our obligations owed to such recipient therein are unaffected. CIMBR has no obligation to update its opinion or the information in this research report.

Felda Global Ventures August 6, 2012
92
This publication is strictly confidential and is for private circulation only. If the recipient of this research report is not an accredited investor, expert investor or institutional investor, CIMBR accepts legal responsibility for the contents of the report without any disclaimer limiting or otherwise curtailing such legal responsibility. This publication is being supplied to you strictly on the basis that it will remain confidential. No part of this material may be (i) copied, photocopied, duplicated, stored or reproduced in any form by any means or (ii) redistributed or passed on, directly or indirectly, to any other person in whole or in part, for any purpose without the prior written consent of CIMBR.
As of August 3, 2012, CIMBR does not have a proprietary position in the recommended securities in this report.
Sweden: This report contains only marketing information and has not been approved by the Swedish Financial Supervisory Authority. The distribution of this report is not an offer to sell to any person in Sweden or a solicitation to any person in Sweden to buy any instruments described herein and may not be forwarded to the public in Sweden.
Taiwan: This research report is not an offer or marketing of foreign securities in Taiwan. The securities as referred to in this research report have not been and will not be registered with the Financial Supervisory Commission of the Republic of China pursuant to relevant securities laws and regulations and may not be offered or sold within the Republic of China through a public offering or in circumstances which constitutes an offer within the meaning of the Securities and Exchange Law of the Republic of China that requires a registration or approval of the Financial Supervisory Commission of the Republic of China.
Thailand: This report is issued and distributed by CIMB Securities (Thailand) Company Limited (CIMBS). The views and opinions in this research report are our own as of the date hereof and are subject to change. If the Financial Services and Markets Act of the United Kingdom or the rules of the Financial Services Authority apply to a recipient, our obligations owed to such recipient therein are unaffected. CIMBS has no obligation to update its opinion or the information in this research report.
This publication is strictly confidential and is for private circulation only to clients of CIMBS. This publication is being supplied to you strictly on the basis that it will remain confidential. No part of this material may be (i) copied, photocopied, duplicated, stored or reproduced in any form by any means or (ii) redistributed or passed on, directly or indirectly, to any other person in whole or in part, for any purpose without the prior written consent of CIMBS.
Corporate Governance Report:
The disclosure of the survey result of the Thai Institute of Directors Association (“IOD”) regarding corporate governance is made pursuant to the policy of the Office of the Securities and Exchange Commission. The survey of the IOD is based on the information of a company listed on the Stock Exchange of Thailand and the Market for Alternative Investment disclosed to the public and able to be accessed by a general public investor. The result, therefore, is from the perspective of a third party. It is not an evaluation of operation and is not based on inside information.
The survey result is as of the date appearing in the Corporate Governance Report of Thai Listed Companies. As a result, the survey result may be changed after that date. CIMBS does not confirm nor certify the accuracy of such survey result.
Score Range 90 – 100 80 – 89 70 – 79 Below 70 or No Survey Result
Description Excellent Very Good Good N/A
United Arab Emirates: The distributor of this report has not been approved or licensed by the UAE Central Bank or any other relevant licensing authorities or governmental agencies in the United Arab Emirates. This report is strictly private and confidential and has not been reviewed by, deposited or registered with UAE Central Bank or any other licensing authority or governmental agencies in the United Arab Emirates. This report is being issued outside the United Arab Emirates to a limited number of institutional investors and must not be provided to any person other than the original recipient and may not be reproduced or used for any other purpose. Further, the information contained in this report is not intended to lead to the sale of investments under any subscription agreement or the conclusion of any other contract of whatsoever nature within the territory of the United Arab Emirates.
United Kingdom: This report is being distributed by CIMB Securities (UK) Limited only to, and is directed at selected persons on the basis that those persons are (a) persons falling within Article 19 of the Financial Services and Markets Act 2000 (Financial Promotions) Order 2005 (the “Order”) who have professional experience in investments of this type or (b) high net worth entities, and other persons to whom it may otherwise lawfully be communicated, falling within Article 49(1) of the Order, (all such persons together being referred to as “relevant persons”). A high net worth entity includes a body corporate which has (or is a member of a group which has) a called-up share capital or net assets of not less than (a) if it has (or is a subsidiary of an undertaking which has) more than 20 members, £500,000, (b) otherwise, £5 million, the trustee of a high value trust or an unincorporated association or partnership with assets of no less than £5 million. Directors, officers and employees of such entities are also included provided their responsibilities regarding those entities involve engaging in investment activity. Persons who do not have professional experience relating to investments should not rely on this document.
United States: This research report is distributed in the United States of America by CIMB Securities (USA) Inc, a U.S.-registered broker-dealer and a related company of CIMB Research Pte Ltd solely to persons who qualify as "Major U.S. Institutional Investors" as defined in Rule 15a-6 under the Securities and Exchange Act of 1934. This communication is only for Institutional Investors and investment professionals whose ordinary business activities involve investing in shares, bonds and associated securities and/or derivative securities and who have professional experience in such investments. Any person who is not an Institutional Investor must not rely on this communication. However, the delivery of this research report to any person in the United States of America shall not be deemed a recommendation to effect any transactions in the securities discussed herein or an endorsement of any opinion expressed herein. For further information or to place an order in any of the above-mentioned securities please contact a registered representative of CIMB Securities (USA) Inc.
Other jurisdictions: In any other jurisdictions, except if otherwise restricted by laws or regulations, this report is only for distribtion to professional, institutional or sophisticated investors as defined in the laws and regulations of such jurisdictions.
Recommendation Framework #1 *
Stock Sector
OUTPERFORM: The stock's total return is expected to exceed a relevant benchmark's total return by 5% or more over the next 12 months.
OVERWEIGHT: The industry, as defined by the analyst's coverage universe, is expected to outperform the relevant primary market index over the next 12 months.
NEUTRAL: The stock's total return is expected to be within +/-5% of a relevant benchmark's total return.
NEUTRAL: The industry, as defined by the analyst's coverage universe, is expected to perform in line with the relevant primary market index over the next 12 months.
UNDERPERFORM: The stock's total return is expected to be below a relevant benchmark's total return by 5% or more over the next 12 months.
UNDERWEIGHT: The industry, as defined by the analyst's coverage universe, is expected to underperform the relevant primary market index over the next 12 months.
TRADING BUY: The stock's total return is expected to exceed a relevant benchmark's total return by 5% or more over the next 3 months.
TRADING BUY: The industry, as defined by the analyst's coverage universe, is expected to outperform the relevant primary market index over the next 3 months.
TRADING SELL: The stock's total return is expected to be below a relevant benchmark's total return by 5% or more over the next 3 months.
TRADING SELL: The industry, as defined by the analyst's coverage universe, is expected to underperform the relevant primary market index over the next 3 months.
* This framework only applies to stocks listed on the Singapore Stock Exchange, Bursa Malaysia, Stock Exchange of Thailand and Jakarta Stock Exchange. Occasionally, it is permitted for the total expected
returns to be temporarily outside the prescribed ranges due to extreme market volatility or other justifiable company or industry-specific reasons.
CIMB Research Pte Ltd (Co. Reg. No. 198701620M)
Felda Global Ventures August 6, 2012
93
Recommendation Framework #2 **
Stock Sector
OUTPERFORM: Expected positive total returns of 10% or more over the next 12 months.
OVERWEIGHT: The industry, as defined by the analyst's coverage universe, has a high number of stocks that are expected to have total returns of +10% or better over the next 12 months.
NEUTRAL: Expected total returns of between -10% and +10% over the next 12 months.
NEUTRAL: The industry, as defined by the analyst's coverage universe, has either (i) an equal number of stocks that are expected to have total returns of +10% (or better) or -10% (or worse), or (ii) stocks that are predominantly expected to have total returns that will range from +10% to -10%; both over the next 12 months.
UNDERPERFORM: Expected negative total returns of 10% or more over the next 12 months.
UNDERWEIGHT: The industry, as defined by the analyst's coverage universe, has a high number of stocks that are expected to have total returns of -10% or worse over the next 12 months.
TRADING BUY: Expected positive total returns of 10% or more over the next 3 months.
TRADING BUY: The industry, as defined by the analyst's coverage universe, has a high number of stocks that are expected to have total returns of +10% or better over the next 3 months.
TRADING SELL: Expected negative total returns of 10% or more over the next 3 months.
TRADING SELL: The industry, as defined by the analyst's coverage universe, has a high number of stocks that are expected to have total returns of -10% or worse over the next 3 months.
** This framework only applies to stocks listed on the Hong Kong Stock Exchange and China listings on the Singapore Stock Exchange. Occasionally, it is permitted for the total expected returns to be temporarily
outside the prescribed ranges due to extreme market volatility or other justifiable company or industry-specific reasons.
Corporate Governance Report of Thai Listed Companies (CGR). CG Rating by the Thai Institute of Directors Association (IOD) in 2011.
ADVANC - Excellent, AMATA - Very Good, AOT - Excellent, AP - Very Good, BANPU - Excellent , BAY - Excellent , BBL - Excellent, BCP - Excellent, BEC - Very Good, BECL - Very Good, BGH - not available, BH - Very Good, BIGC - Very Good, BTS - Very Good, CCET - Good, CK - Very Good, CPALL - Very Good, CPF - Very Good, CPN - Excellent, DELTA - Very Good, DTAC - Very Good, GLOBAL - not available, GLOW - Very Good, GRAMMY – Excellent, HANA - Very Good, HEMRAJ - Excellent, HMPRO - Very Good, INTUCH – Very Good, ITD - Good, IVL - Very Good, JAS – Very Good, KBANK - Excellent, KTB - Excellent, LH - Very Good, LPN - Excellent, MAJOR - Very Good, MCOT - Excellent, MINT - Very Good, PS - Excellent, PSL - Excellent, PTT - Excellent, PTTGC - not available, PTTEP - Excellent, QH - Excellent, RATCH - Excellent, ROBINS - Excellent, SC – Excellent, SCB - Excellent, SCC - Excellent, SCCC - Very Good, SIRI - Very Good, SPALI - Very Good, STA - Very Good, STEC - Very Good, TCAP - Very Good, THAI - Very Good, THCOM – Very Good, TISCO - Excellent, TMB - Excellent, TOP - Excellent, TRUE - Very Good, TUF - Very Good.


![20060503 Felda Bungalow[1]](https://static.fdocuments.net/doc/165x107/577dad1c1a28ab223f8ed13a/20060503-felda-bungalow1.jpg)