Fehrenbach SETAC 2015 Hemeroby
38
Horst Fehrenbach (IFEU), Birgit Grahl (INTEGRAHL) and Mirjam Busch (IFEU) SETAC Europe 25th Annual Meeting 5 May 2015 Hemeroby as an impact category metric for the integration of land use and biodiversity into the Life Cycle (Impact) Assessment INTEGRAHL
-
Upload
horst-fehrenbach -
Category
Documents
-
view
206 -
download
1
Transcript of Fehrenbach SETAC 2015 Hemeroby
Horst Fehrenbach (IFEU), Birgit Grahl (INTEGRAHL) and Mirjam Busch (IFEU) SETAC Europe 25th Annual Meeting 5 May 2015
Hemeroby as an impact category metric for the integration of land use and biodiversity into the Life Cycle (Impact) Assessment
INTEGRAHL
Horst Fehrenbach | Birgit Grahl | Mirjam Busch 2 05.05.2015
Conceptual and Methodical Basics in a Nutshell
• Naturalness is the safeguard subject capturing also information on biodiversity and ecosystem services
• The negative impact = loss of naturalness.
• It’s a midpoint metric, close to the level of LCI results.
• Only occupation impact.
• Ordinal scale of seven hemeroby classes,
• with the option to apply Characterization Factors
• It’s applicable for every land-use type.
Horst Fehrenbach | Birgit Grahl | Mirjam Busch 3 05.05.2015
Overview
1. The Hemeroby Approach
2. Scheme for forest area
3. Scheme for agricultural area
4. Examples
5. Characterization factors
6. Outlook
Horst Fehrenbach | Birgit Grahl | Mirjam Busch 4 05.05.2015
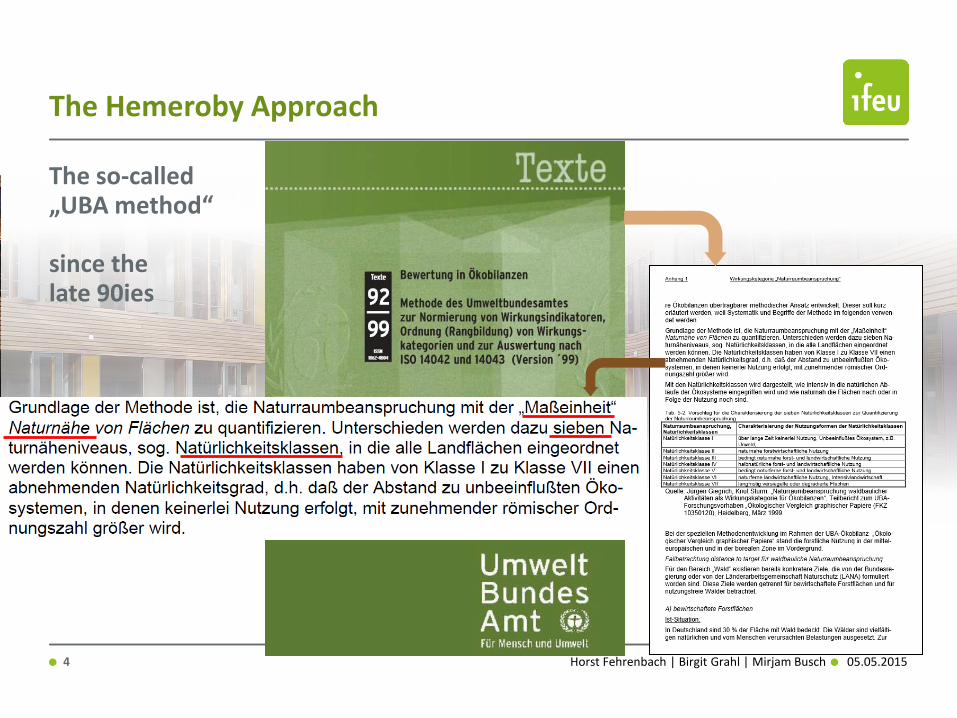
The Hemeroby Approach
The so-called „UBA method“ since the late 90ies
Horst Fehrenbach | Birgit Grahl | Mirjam Busch 5 05.05.2015
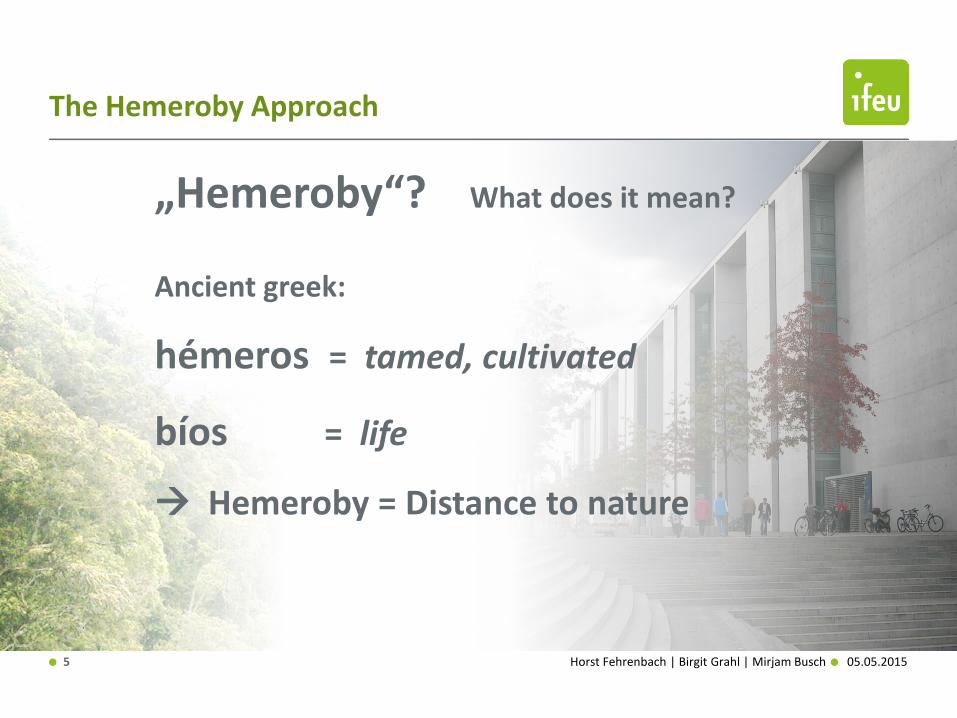
The Hemeroby Approach
„Hemeroby“? What does it mean?
Ancient greek:
hémeros = tamed, cultivated
bíos = life
Hemeroby = Distance to nature
Horst Fehrenbach | Birgit Grahl | Mirjam Busch 6 05.05.2015
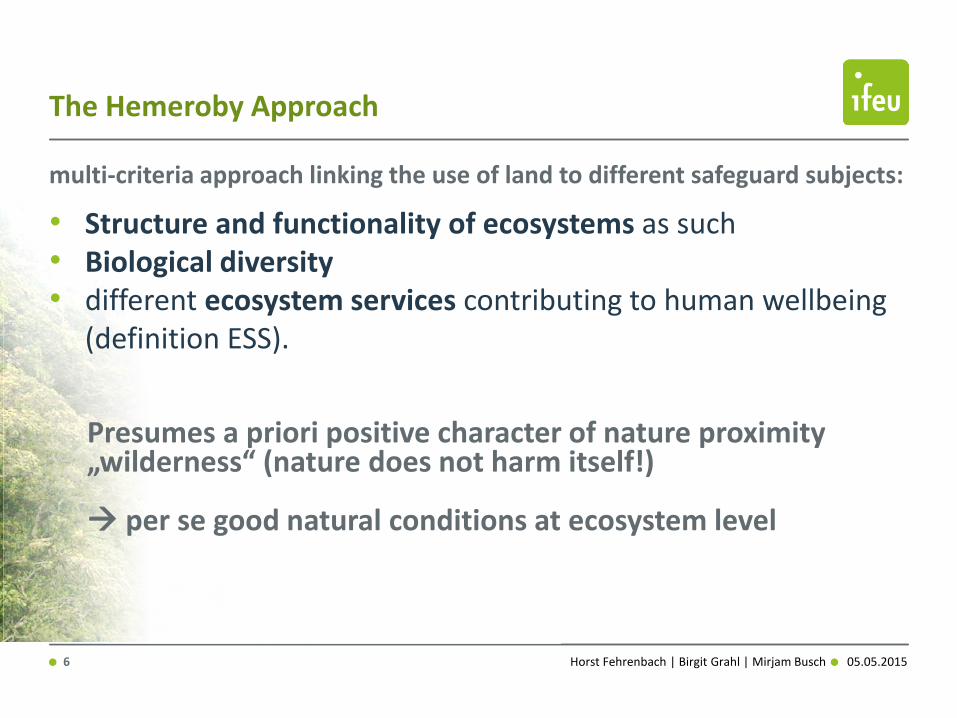
The Hemeroby Approach
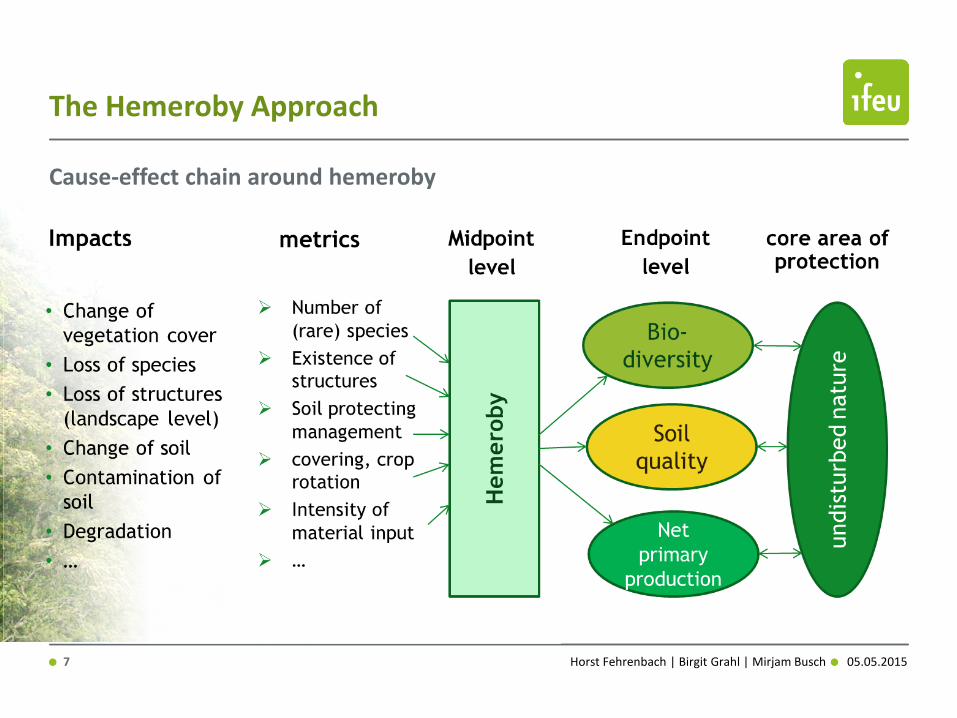
multi-criteria approach linking the use of land to different safeguard subjects:
• Structure and functionality of ecosystems as such • Biological diversity • different ecosystem services contributing to human wellbeing
(definition ESS).
Presumes a priori positive character of nature proximity „wilderness“ (nature does not harm itself!) per se good natural conditions at ecosystem level
Horst Fehrenbach | Birgit Grahl | Mirjam Busch 7 05.05.2015
The Hemeroby Approach
Cause-effect chain around hemeroby
Horst Fehrenbach | Birgit Grahl | Mirjam Busch 8 05.05.2015
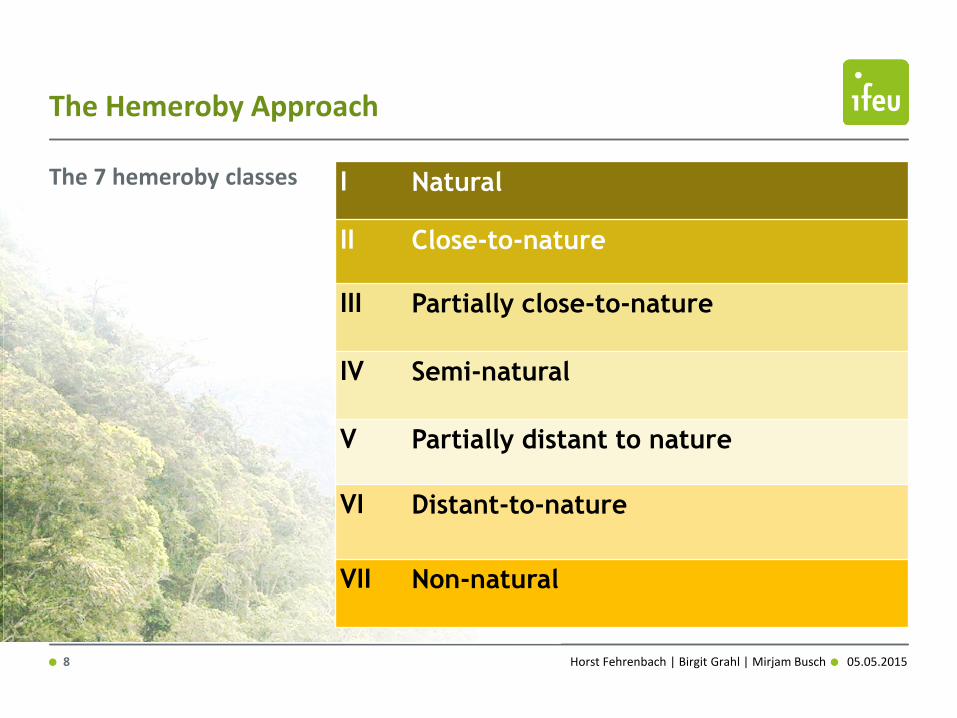
The Hemeroby Approach
The 7 hemeroby classes I Natural
II Close-to-nature
III Partially close-to-nature
IV Semi-natural
V Partially distant to nature
VI Distant-to-nature
VII Non-natural
Horst Fehrenbach | Birgit Grahl | Mirjam Busch 9 05.05.2015
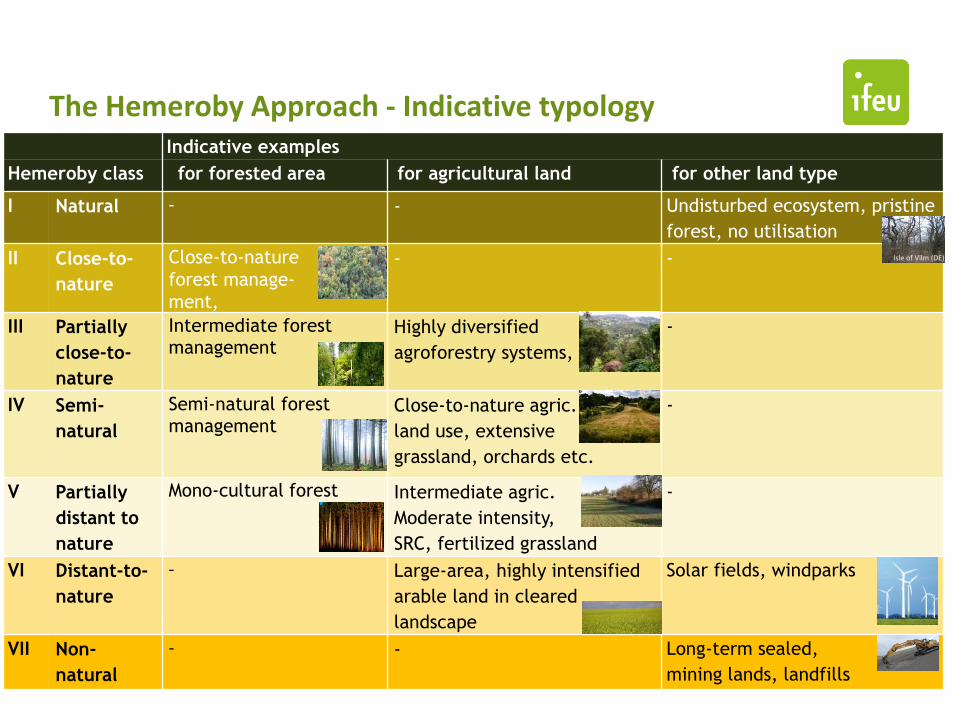
The Hemeroby Approach - Indicative typology Indicative examples
Hemeroby class for forested area for agricultural land for other land type
I Natural - - Undisturbed ecosystem, pristine
forest, no utilisation
II Close-to-
nature
Close-to-nature
forest manage-
ment,
- -
III Partially
close-to-
nature
Intermediate forest management
Highly diversified
agroforestry systems,
-
IV Semi-
natural
Semi-natural forest management
Close-to-nature agric.
land use, extensive
grassland, orchards etc.
-
V Partially
distant to
nature
Mono-cultural forest Intermediate agric.
Moderate intensity,
SRC, fertilized grassland
-
VI Distant-to-
nature
- Large-area, highly intensified
arable land in cleared
landscape
Solar fields, windparks
VII Non-
natural
- - Long-term sealed,
mining lands, landfills
Isle of Vilm (DE)
Horst Fehrenbach | Birgit Grahl | Mirjam Busch 10 05.05.2015
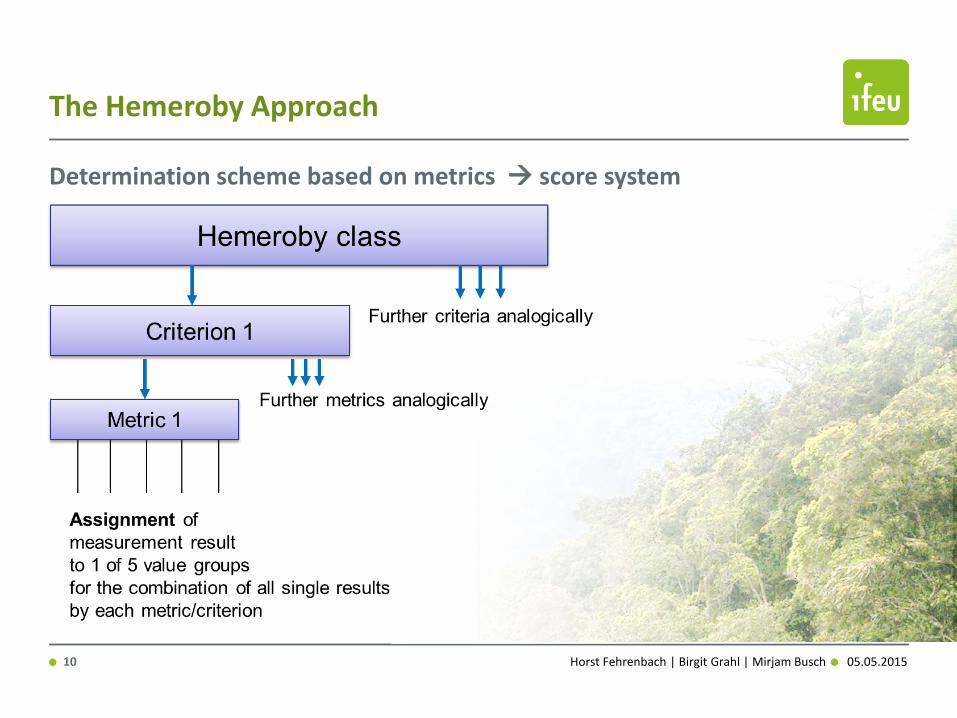
The Hemeroby Approach
Determination scheme based on metrics score system
Horst Fehrenbach | Birgit Grahl | Mirjam Busch 11 05.05.2015
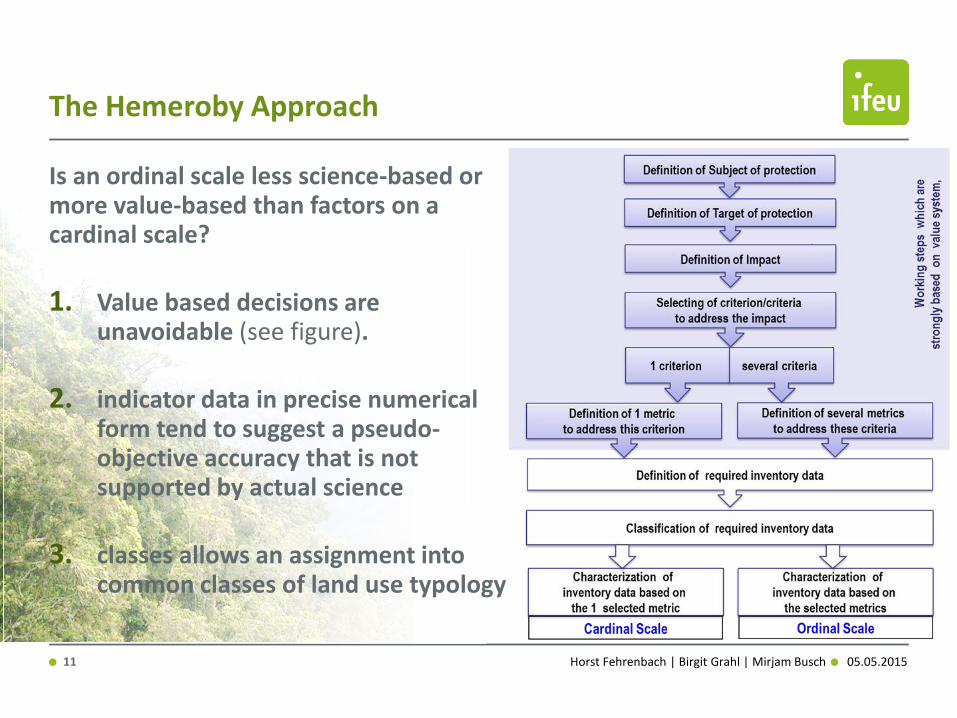
The Hemeroby Approach
Is an ordinal scale less science-based or more value-based than factors on a cardinal scale?
1. Value based decisions are unavoidable (see figure).
2. indicator data in precise numerical form tend to suggest a pseudo-objective accuracy that is not supported by actual science
3. classes allows an assignment into common classes of land use typology
Horst Fehrenbach | Birgit Grahl | Mirjam Busch 12 05.05.2015
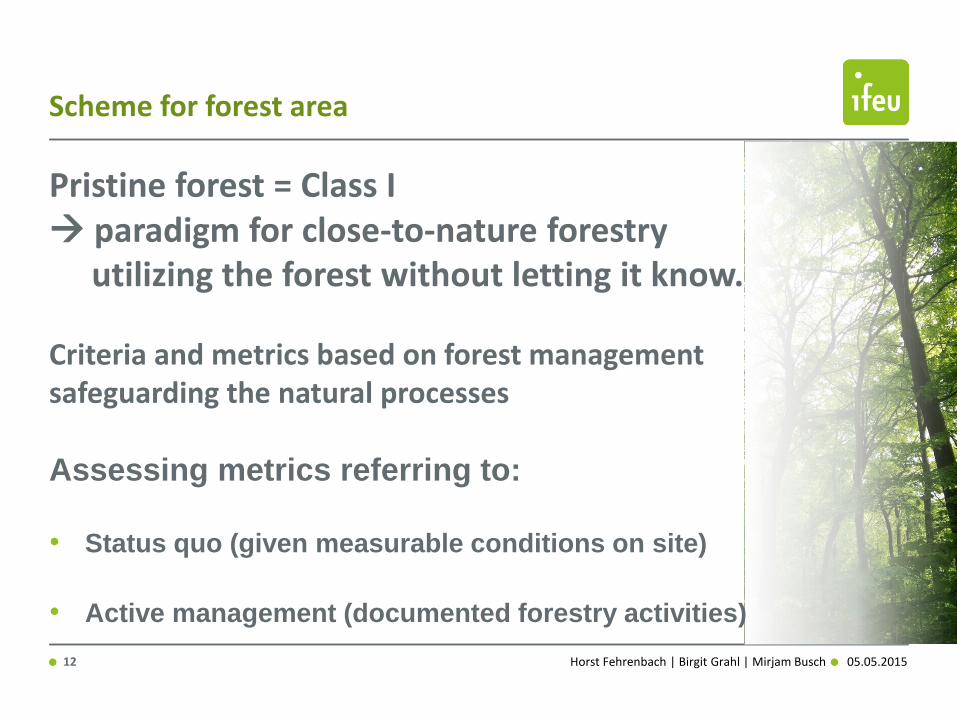
Scheme for forest area
Pristine forest = Class I paradigm for close-to-nature forestry utilizing the forest without letting it know.
Criteria and metrics based on forest management safeguarding the natural processes Assessing metrics referring to:
• Status quo (given measurable conditions on site)
• Active management (documented forestry activities)
Horst Fehrenbach | Birgit Grahl | Mirjam Busch 13 05.05.2015
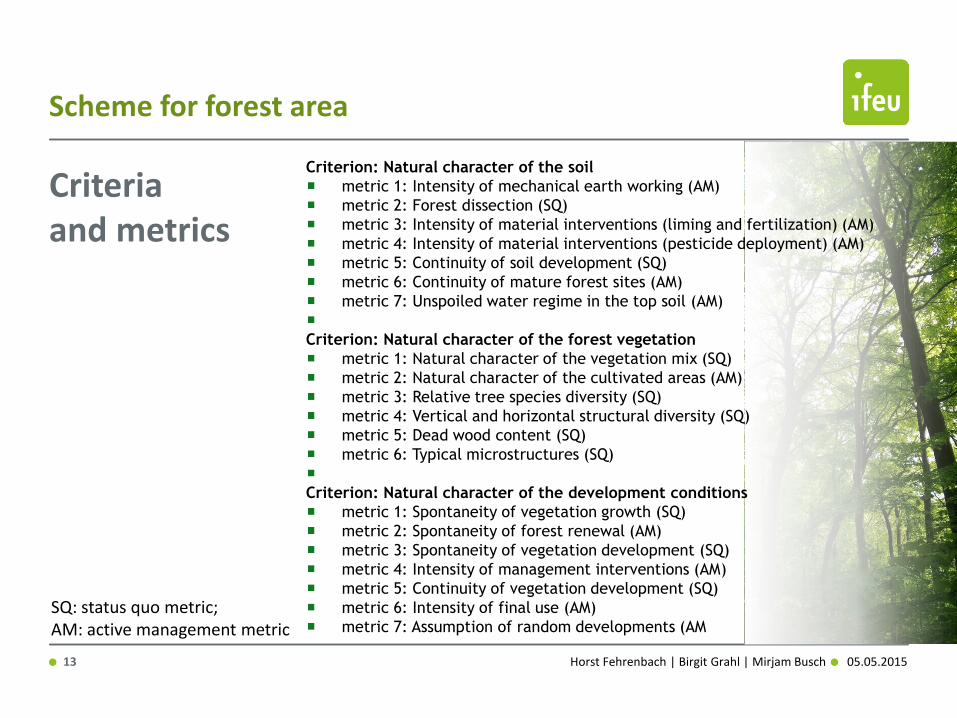
Scheme for forest area
Criteria and metrics
Criterion: Natural character of the soil
metric 1: Intensity of mechanical earth working (AM)
metric 2: Forest dissection (SQ)
metric 3: Intensity of material interventions (liming and fertilization) (AM)
metric 4: Intensity of material interventions (pesticide deployment) (AM)
metric 5: Continuity of soil development (SQ)
metric 6: Continuity of mature forest sites (AM)
metric 7: Unspoiled water regime in the top soil (AM)
Criterion: Natural character of the forest vegetation
metric 1: Natural character of the vegetation mix (SQ)
metric 2: Natural character of the cultivated areas (AM)
metric 3: Relative tree species diversity (SQ)
metric 4: Vertical and horizontal structural diversity (SQ)
metric 5: Dead wood content (SQ)
metric 6: Typical microstructures (SQ)
Criterion: Natural character of the development conditions
metric 1: Spontaneity of vegetation growth (SQ)
metric 2: Spontaneity of forest renewal (AM)
metric 3: Spontaneity of vegetation development (SQ)
metric 4: Intensity of management interventions (AM)
metric 5: Continuity of vegetation development (SQ)
metric 6: Intensity of final use (AM)
metric 7: Assumption of random developments (AM
SQ: status quo metric; AM: active management metric
Horst Fehrenbach | Birgit Grahl | Mirjam Busch 14 05.05.2015
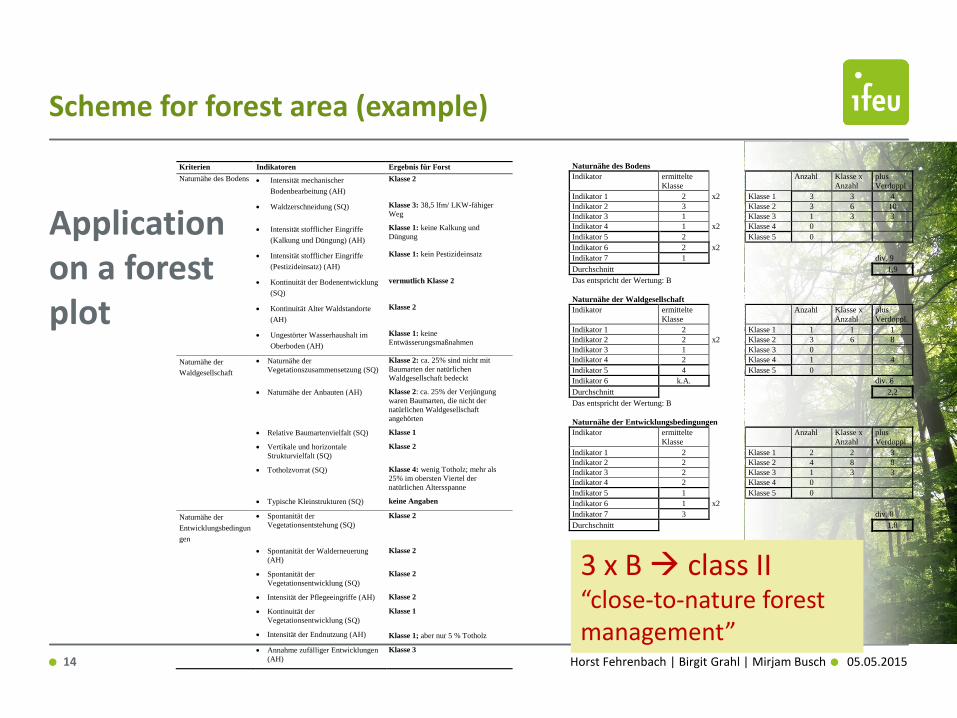
Scheme for forest area (example)
Application on a forest plot
Kriterien Indikatoren Ergebnis für Forst
Naturnähe des Bodens Intensität mechanischer
Bodenbearbeitung (AH)
Klasse 2
Waldzerschneidung (SQ) Klasse 3: 38,5 lfm/ LKW-fähiger
Weg
Intensität stofflicher Eingriffe
(Kalkung und Düngung) (AH)
Klasse 1: keine Kalkung und
Düngung
Intensität stofflicher Eingriffe
(Pestizideinsatz) (AH)
Klasse 1: kein Pestizideinsatz
Kontinuität der Bodenentwicklung
(SQ)
vermutlich Klasse 2
Kontinuität Alter Waldstandorte
(AH)
Klasse 2
Ungestörter Wasserhaushalt im
Oberboden (AH)
Klasse 1: keine
Entwässerungsmaßnahmen
Naturnähe der
Waldgesellschaft
Naturnähe der
Vegetationszusammensetzung (SQ)
Klasse 2: ca. 25% sind nicht mit
Baumarten der natürlichen
Waldgesellschaft bedeckt
Naturnähe der Anbauten (AH) Klasse 2: ca. 25% der Verjüngung
waren Baumarten, die nicht der
natürlichen Waldgesellschaft
angehörten
Relative Baumartenvielfalt (SQ) Klasse 1
Vertikale und horizontale
Strukturvielfalt (SQ)
Klasse 2
Totholzvorrat (SQ) Klasse 4: wenig Totholz; mehr als
25% im obersten Viertel der
natürlichen Altersspanne
Typische Kleinstrukturen (SQ) keine Angaben
Naturnähe der
Entwicklungsbedingun
gen
Spontanität der
Vegetationsentstehung (SQ)
Klasse 2
Spontanität der Walderneuerung
(AH)
Klasse 2
Spontanität der
Vegetationsentwicklung (SQ)
Klasse 2
Intensität der Pflegeeingriffe (AH) Klasse 2
Kontinuität der
Vegetationsentwicklung (SQ)
Klasse 1
Intensität der Endnutzung (AH) Klasse 1; aber nur 5 % Totholz
Annahme zufälliger Entwicklungen
(AH)
Klasse 3
Naturnähe des Bodens
Indikator ermittelte
Klasse
Anzahl Klasse x
Anzahl
plus
Verdoppl.
Indikator 1 2 x2 Klasse 1 3 3 4
Indikator 2 3 Klasse 2 3 6 10
Indikator 3 1 Klasse 3 1 3 3
Indikator 4 1 x2 Klasse 4 0
Indikator 5 2 Klasse 5 0
Indikator 6 2 x2
Indikator 7 1 div. 9
Durchschnitt 1,9
Das entspricht der Wertung: B
Naturnähe der Waldgesellschaft
Indikator ermittelte
Klasse
Anzahl Klasse x
Anzahl
plus
Verdoppl.
Indikator 1 2 Klasse 1 1 1 1
Indikator 2 2 x2 Klasse 2 3 6 8
Indikator 3 1 Klasse 3 0
Indikator 4 2 Klasse 4 1 4
Indikator 5 4 Klasse 5 0
Indikator 6 k.A. div. 6
Durchschnitt 2,2
Das entspricht der Wertung: B
Naturnähe der Entwicklungsbedingungen
Indikator ermittelte
Klasse
Anzahl Klasse x
Anzahl
plus
Verdoppl.
Indikator 1 2 Klasse 1 2 2 3
Indikator 2 2 Klasse 2 4 8 8
Indikator 3 2 Klasse 3 1 3 3
Indikator 4 2 Klasse 4 0
Indikator 5 1 Klasse 5 0
Indikator 6 1 x2
Indikator 7 3 div. 8
Durchschnitt 1,8
3 x B class II “close-to-nature forest management”
Horst Fehrenbach | Birgit Grahl | Mirjam Busch 15 05.05.2015
Scheme for agricultural area
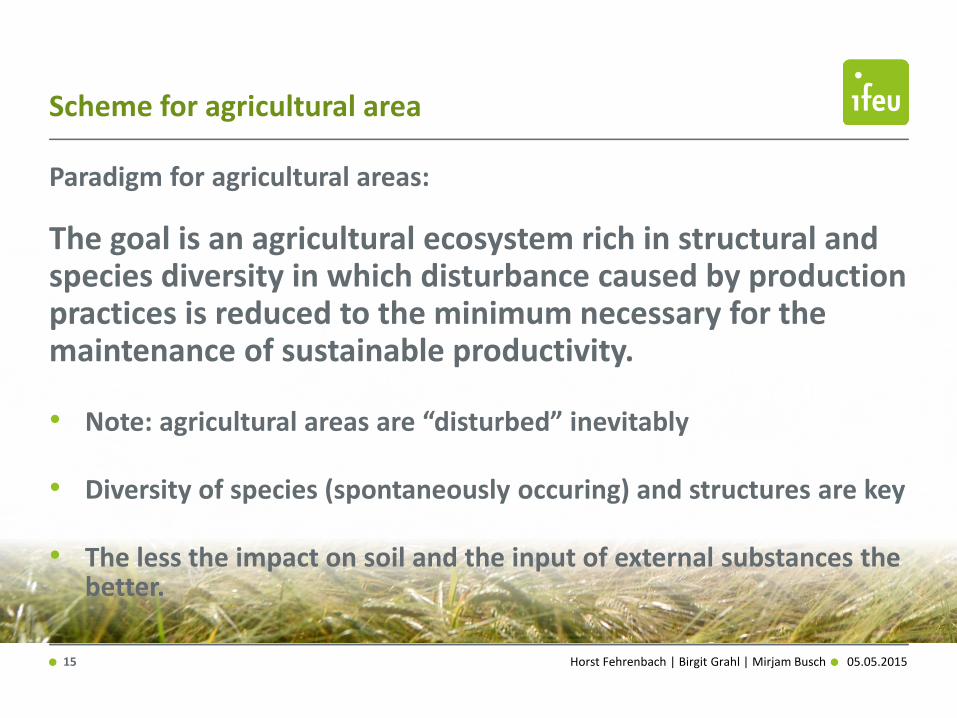
Paradigm for agricultural areas:
The goal is an agricultural ecosystem rich in structural and species diversity in which disturbance caused by production practices is reduced to the minimum necessary for the maintenance of sustainable productivity.
• Note: agricultural areas are “disturbed” inevitably
• Diversity of species (spontaneously occuring) and structures are key
• The less the impact on soil and the input of external substances the better.
Horst Fehrenbach | Birgit Grahl | Mirjam Busch 16 05.05.2015
Scheme for agricultural area
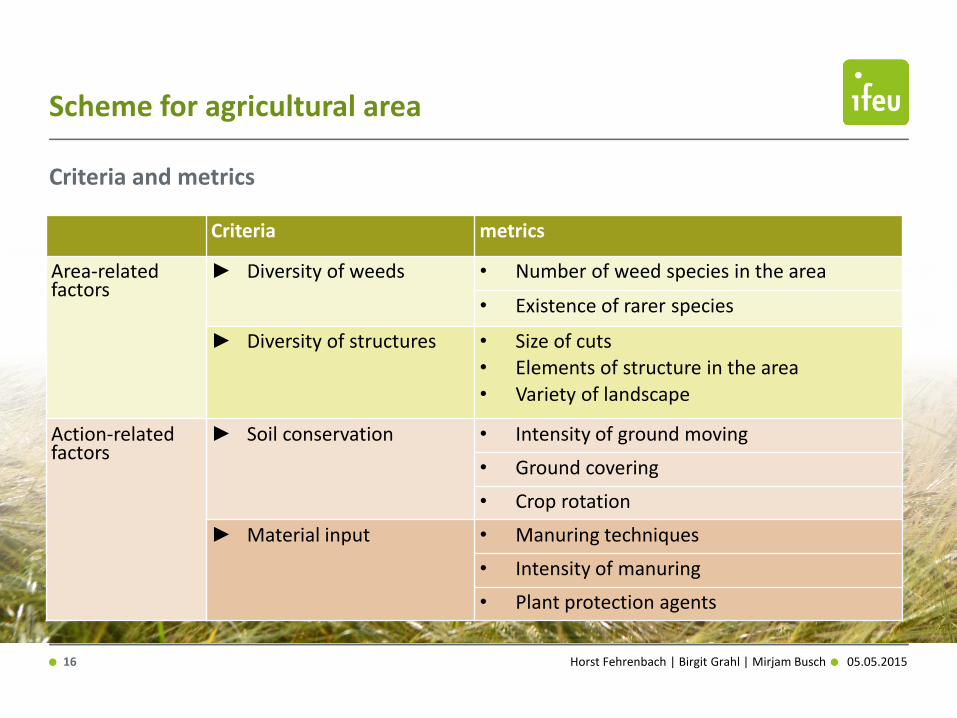
Criteria and metrics
Criteria metrics
Area-related factors
► Diversity of weeds
• Number of weed species in the area
• Existence of rarer species
► Diversity of structures • Size of cuts • Elements of structure in the area
• Variety of landscape
Action-related factors
► Soil conservation
• Intensity of ground moving
• Ground covering
• Crop rotation
► Material input
• Manuring techniques
• Intensity of manuring
• Plant protection agents
Horst Fehrenbach | Birgit Grahl | Mirjam Busch 17 05.05.2015
Scheme for agricultural area
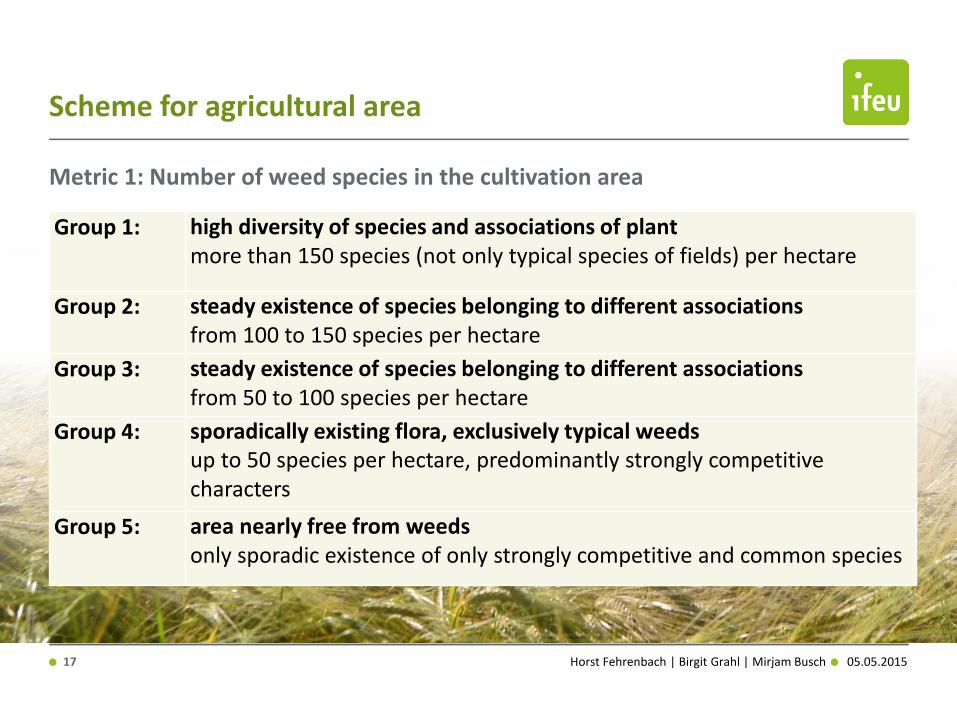
Metric 1: Number of weed species in the cultivation area
Group 1: high diversity of species and associations of plant more than 150 species (not only typical species of fields) per hectare
Group 2: steady existence of species belonging to different associations from 100 to 150 species per hectare
Group 3: steady existence of species belonging to different associations from 50 to 100 species per hectare
Group 4: sporadically existing flora, exclusively typical weeds up to 50 species per hectare, predominantly strongly competitive characters
Group 5: area nearly free from weeds only sporadic existence of only strongly competitive and common species
Horst Fehrenbach | Birgit Grahl | Mirjam Busch 18 05.05.2015
Scheme for agricultural area
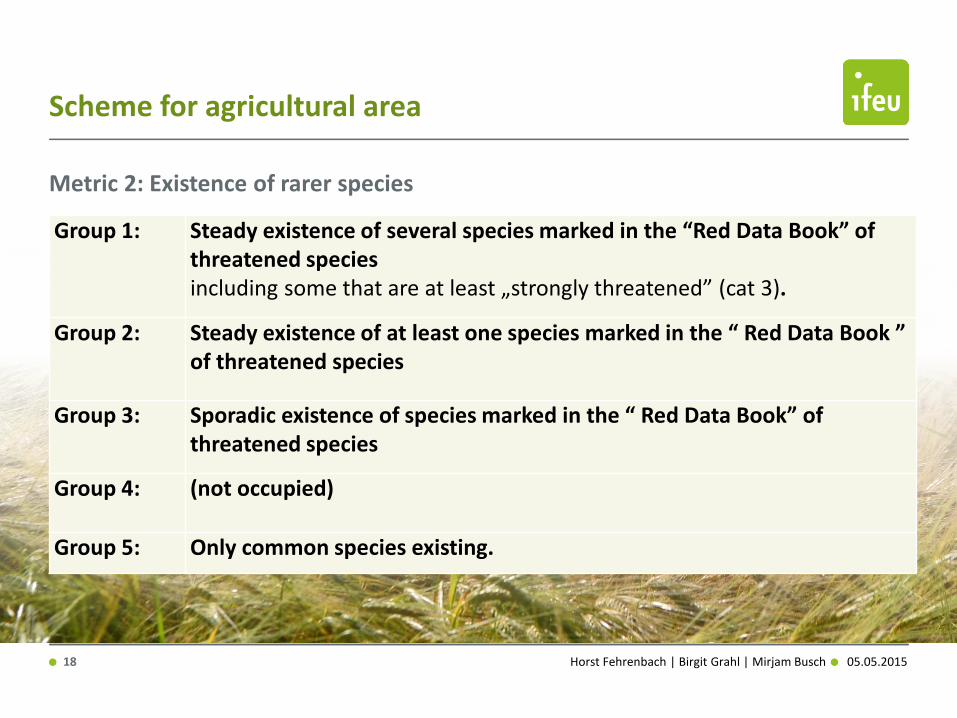
Metric 2: Existence of rarer species
Group 1: Steady existence of several species marked in the “Red Data Book” of threatened species including some that are at least „strongly threatened” (cat 3).
Group 2: Steady existence of at least one species marked in the “ Red Data Book ” of threatened species
Group 3: Sporadic existence of species marked in the “ Red Data Book” of threatened species
Group 4: (not occupied)
Group 5: Only common species existing.
Horst Fehrenbach | Birgit Grahl | Mirjam Busch 19 05.05.2015
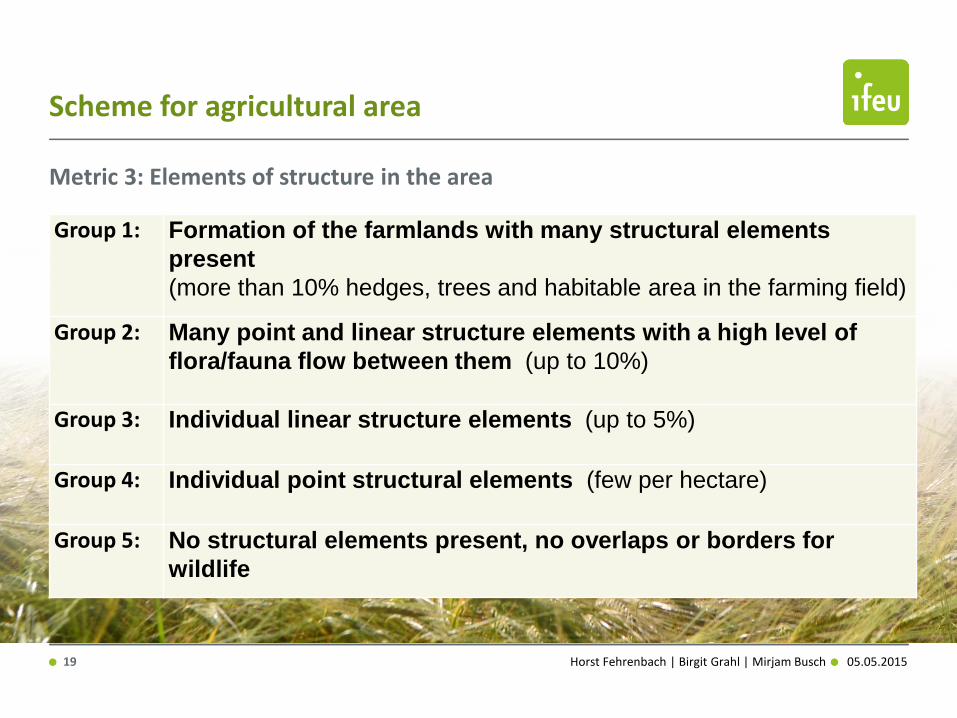
Scheme for agricultural area
Metric 3: Elements of structure in the area
Group 1: Formation of the farmlands with many structural elements
present
(more than 10% hedges, trees and habitable area in the farming field)
Group 2: Many point and linear structure elements with a high level of
flora/fauna flow between them (up to 10%)
Group 3: Individual linear structure elements (up to 5%)
Group 4: Individual point structural elements (few per hectare)
Group 5: No structural elements present, no overlaps or borders for
wildlife
Horst Fehrenbach | Birgit Grahl | Mirjam Busch 20 05.05.2015
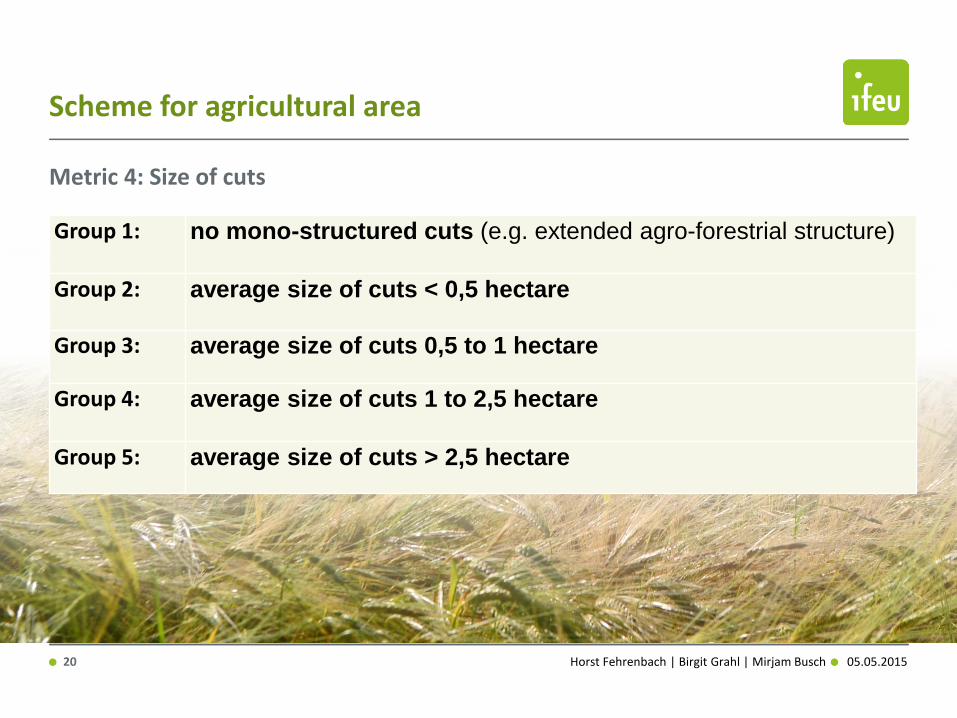
Scheme for agricultural area
Metric 4: Size of cuts
Group 1: no mono-structured cuts (e.g. extended agro-forestrial structure)
Group 2: average size of cuts < 0,5 hectare
Group 3: average size of cuts 0,5 to 1 hectare
Group 4: average size of cuts 1 to 2,5 hectare
Group 5: average size of cuts > 2,5 hectare
Horst Fehrenbach | Birgit Grahl | Mirjam Busch 21 05.05.2015
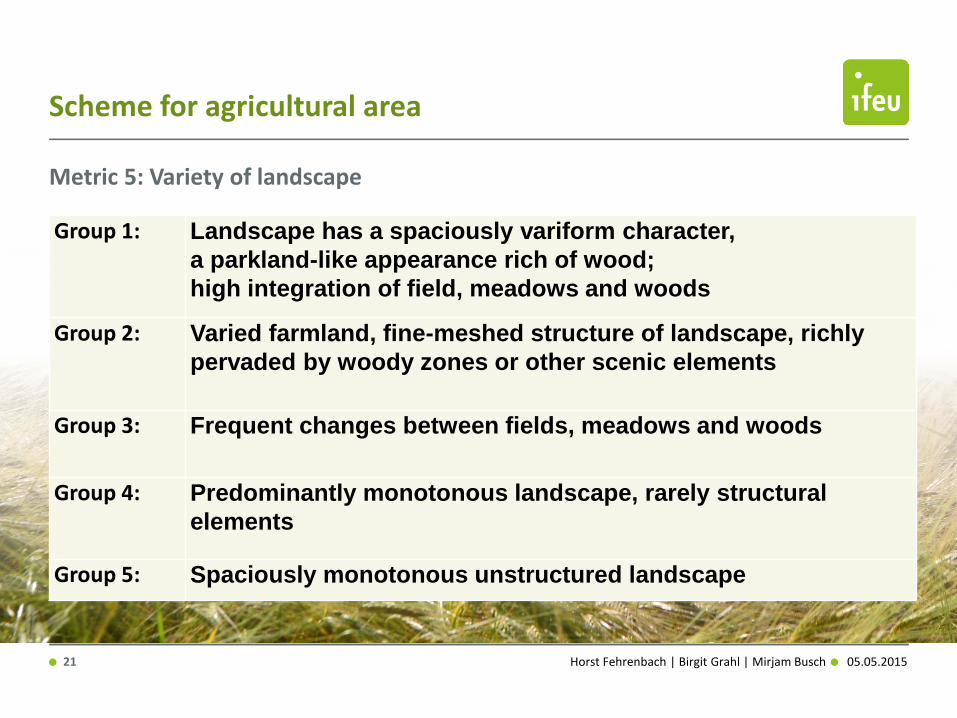
Scheme for agricultural area
Metric 5: Variety of landscape
Group 1: Landscape has a spaciously variform character,
a parkland-like appearance rich of wood;
high integration of field, meadows and woods
Group 2: Varied farmland, fine-meshed structure of landscape, richly
pervaded by woody zones or other scenic elements
Group 3: Frequent changes between fields, meadows and woods
Group 4: Predominantly monotonous landscape, rarely structural
elements
Group 5: Spaciously monotonous unstructured landscape
Horst Fehrenbach | Birgit Grahl | Mirjam Busch 22 05.05.2015
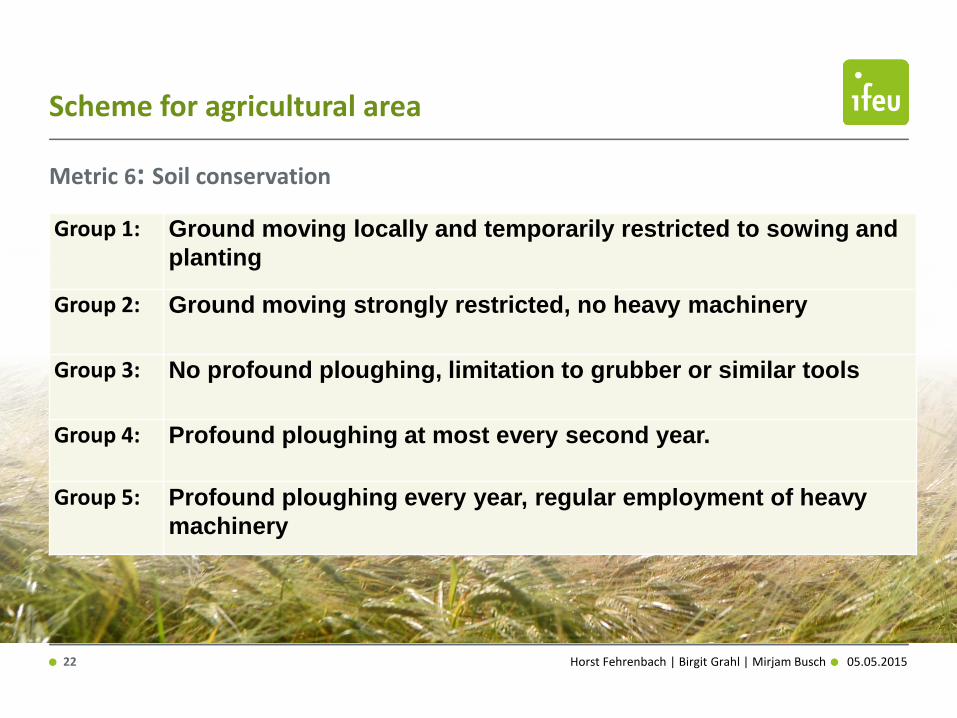
Scheme for agricultural area
Metric 6: Soil conservation
Group 1: Ground moving locally and temporarily restricted to sowing and
planting
Group 2: Ground moving strongly restricted, no heavy machinery
Group 3: No profound ploughing, limitation to grubber or similar tools
Group 4: Profound ploughing at most every second year.
Group 5: Profound ploughing every year, regular employment of heavy
machinery
Horst Fehrenbach | Birgit Grahl | Mirjam Busch 23 05.05.2015
Scheme for agricultural area
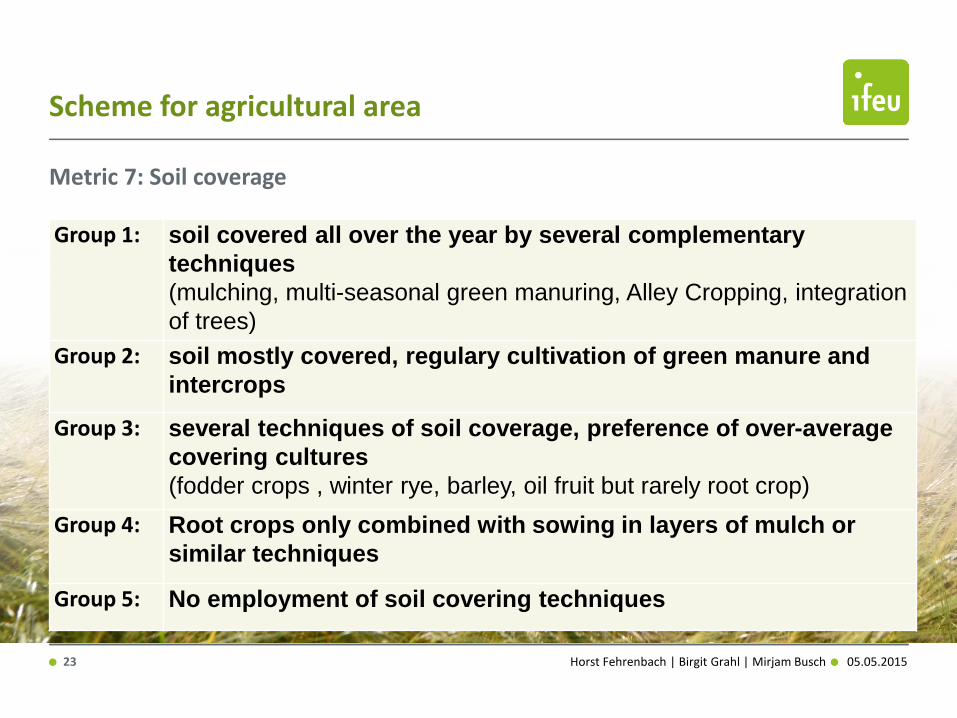
Metric 7: Soil coverage
Group 1: soil covered all over the year by several complementary
techniques
(mulching, multi-seasonal green manuring, Alley Cropping, integration
of trees)
Group 2: soil mostly covered, regulary cultivation of green manure and
intercrops
Group 3: several techniques of soil coverage, preference of over-average
covering cultures
(fodder crops , winter rye, barley, oil fruit but rarely root crop)
Group 4: Root crops only combined with sowing in layers of mulch or
similar techniques
Group 5: No employment of soil covering techniques
Horst Fehrenbach | Birgit Grahl | Mirjam Busch 24 05.05.2015
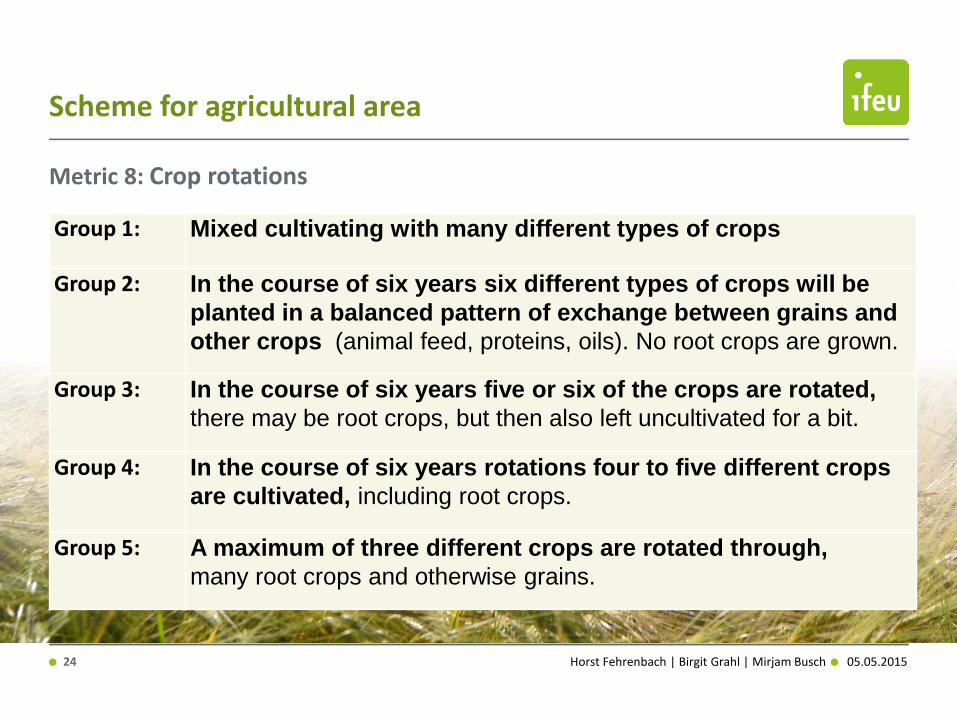
Scheme for agricultural area
Metric 8: Crop rotations
Group 1: Mixed cultivating with many different types of crops
Group 2: In the course of six years six different types of crops will be
planted in a balanced pattern of exchange between grains and
other crops (animal feed, proteins, oils). No root crops are grown.
Group 3: In the course of six years five or six of the crops are rotated,
there may be root crops, but then also left uncultivated for a bit.
Group 4: In the course of six years rotations four to five different crops
are cultivated, including root crops.
Group 5: A maximum of three different crops are rotated through,
many root crops and otherwise grains.
Horst Fehrenbach | Birgit Grahl | Mirjam Busch 25 05.05.2015
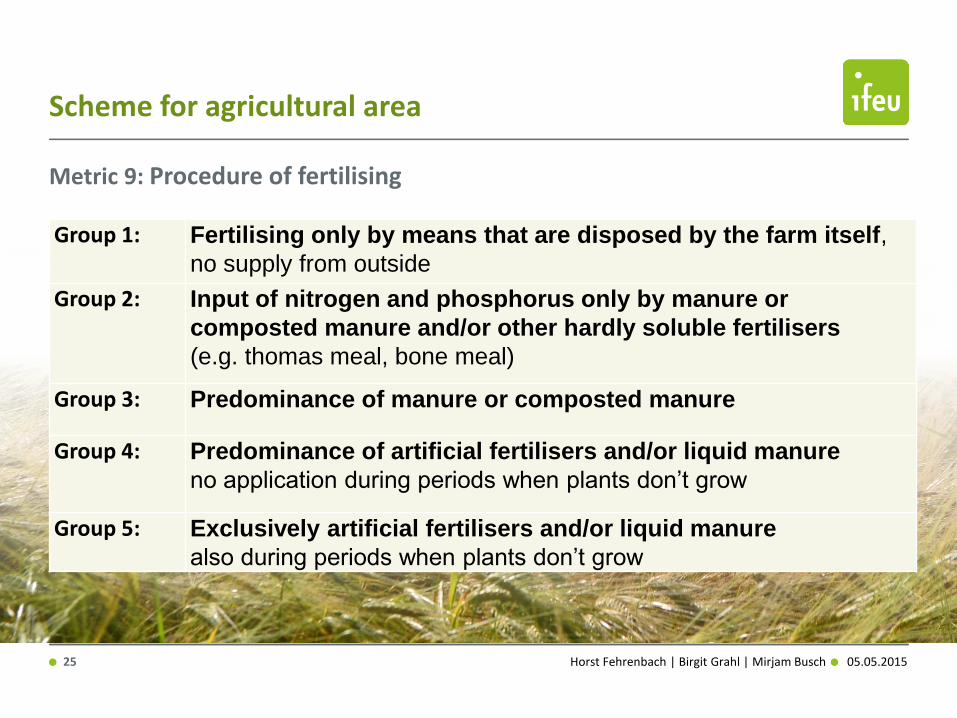
Scheme for agricultural area
Metric 9: Procedure of fertilising
Group 1: Fertilising only by means that are disposed by the farm itself,
no supply from outside
Group 2: Input of nitrogen and phosphorus only by manure or
composted manure and/or other hardly soluble fertilisers
(e.g. thomas meal, bone meal)
Group 3: Predominance of manure or composted manure
Group 4: Predominance of artificial fertilisers and/or liquid manure
no application during periods when plants don’t grow
Group 5: Exclusively artificial fertilisers and/or liquid manure
also during periods when plants don’t grow
Horst Fehrenbach | Birgit Grahl | Mirjam Busch 26 05.05.2015
Scheme for agricultural area
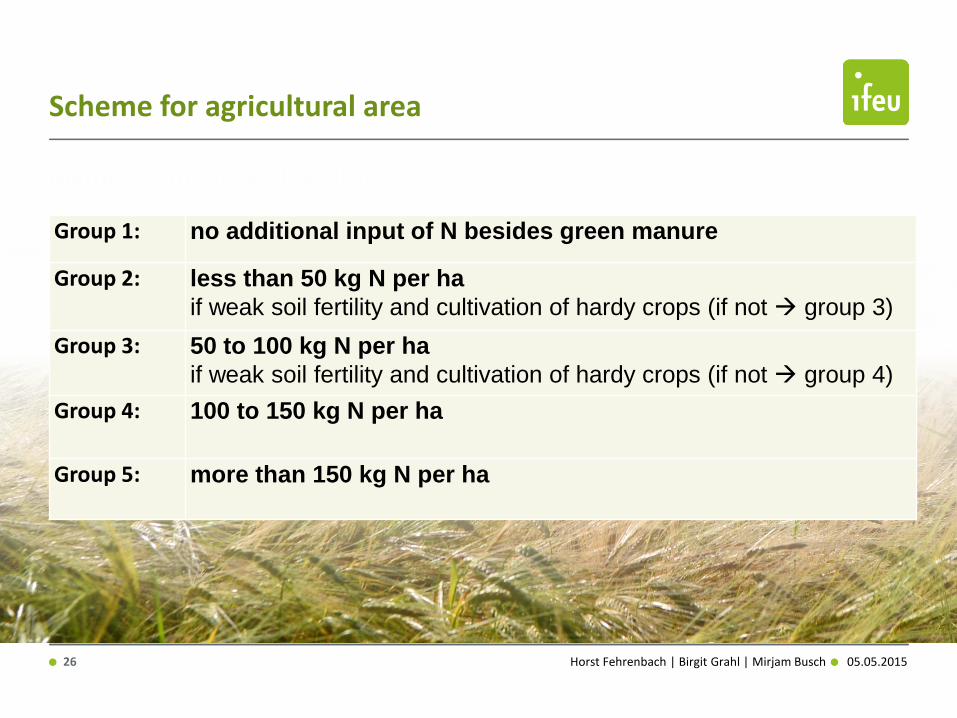
Metric 10: Intensity of fertilising
Group 1: no additional input of N besides green manure
Group 2: less than 50 kg N per ha
if weak soil fertility and cultivation of hardy crops (if not group 3)
Group 3: 50 to 100 kg N per ha
if weak soil fertility and cultivation of hardy crops (if not group 4)
Group 4: 100 to 150 kg N per ha
Group 5: more than 150 kg N per ha
Horst Fehrenbach | Birgit Grahl | Mirjam Busch 27 05.05.2015
Scheme for agricultural area
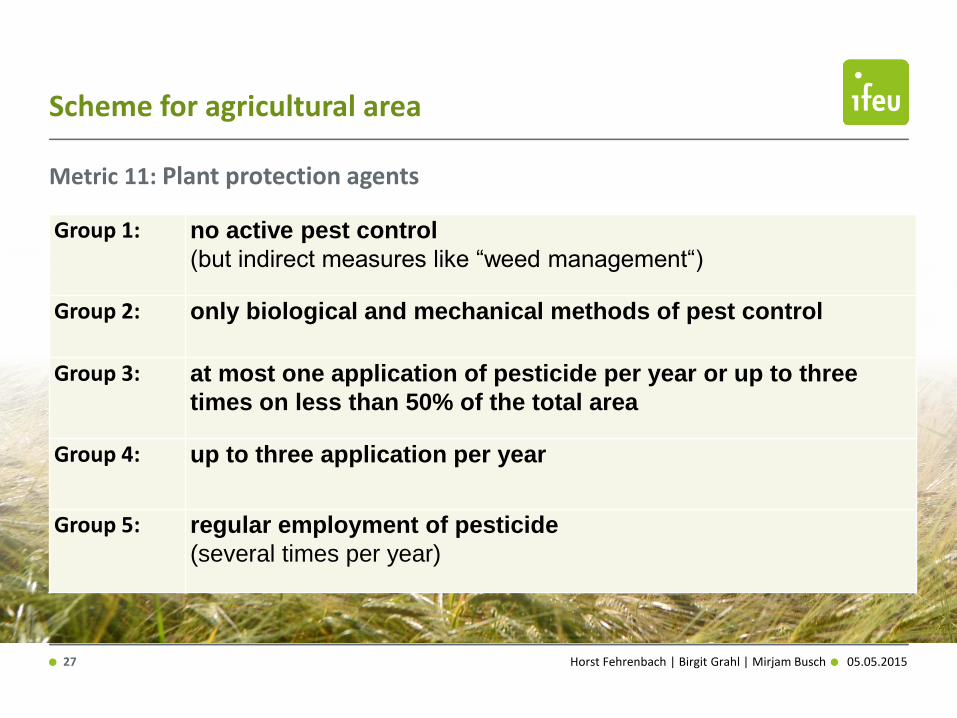
Metric 11: Plant protection agents
Group 1: no active pest control
(but indirect measures like “weed management“)
Group 2: only biological and mechanical methods of pest control
Group 3: at most one application of pesticide per year or up to three
times on less than 50% of the total area
Group 4: up to three application per year
Group 5: regular employment of pesticide
(several times per year)
Horst Fehrenbach | Birgit Grahl | Mirjam Busch 28 05.05.2015
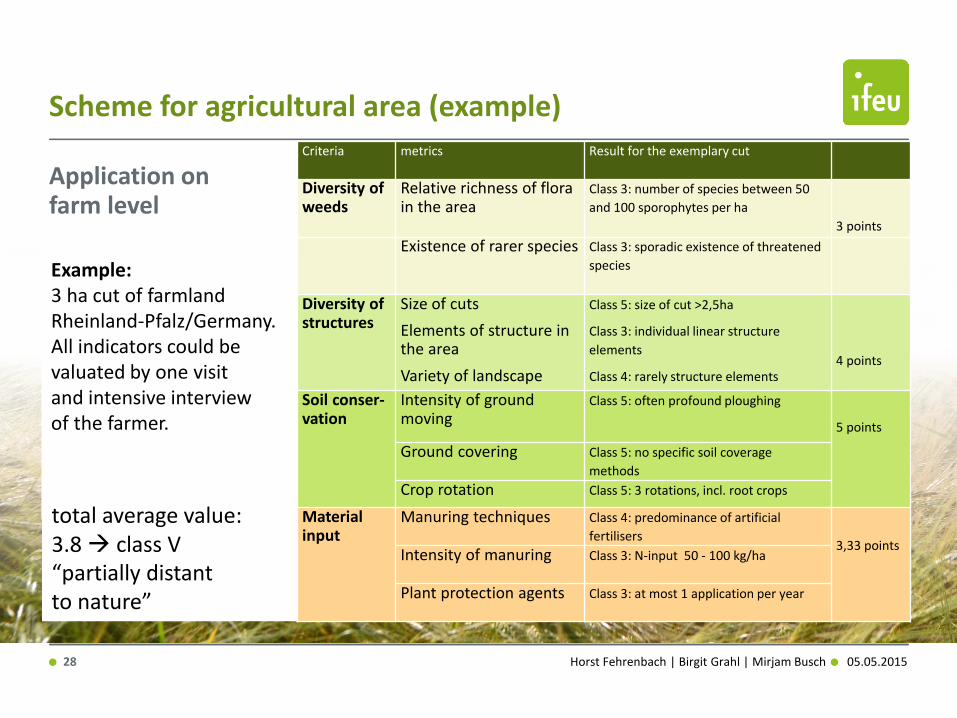
Scheme for agricultural area (example)
Application on farm level
Example: 3 ha cut of farmland Rheinland-Pfalz/Germany. All indicators could be valuated by one visit and intensive interview of the farmer. total average value: 3.8 class V “partially distant to nature”
Criteria metrics Result for the exemplary cut
Diversity of weeds
Relative richness of flora in the area
Class 3: number of species between 50
and 100 sporophytes per ha
3 points
Existence of rarer species Class 3: sporadic existence of threatened
species
Diversity of structures
Size of cuts
Elements of structure in the area
Variety of landscape
Class 5: size of cut >2,5ha
Class 3: individual linear structure
elements
Class 4: rarely structure elements
4 points
Soil conser-vation
Intensity of ground moving
Class 5: often profound ploughing
5 points
Ground covering Class 5: no specific soil coverage
methods
Crop rotation Class 5: 3 rotations, incl. root crops
Material input
Manuring techniques Class 4: predominance of artificial
fertilisers
3,33 points
Intensity of manuring Class 3: N-input 50 - 100 kg/ha
Plant protection agents Class 3: at most 1 application per year
Horst Fehrenbach | Birgit Grahl | Mirjam Busch 29 05.05.2015
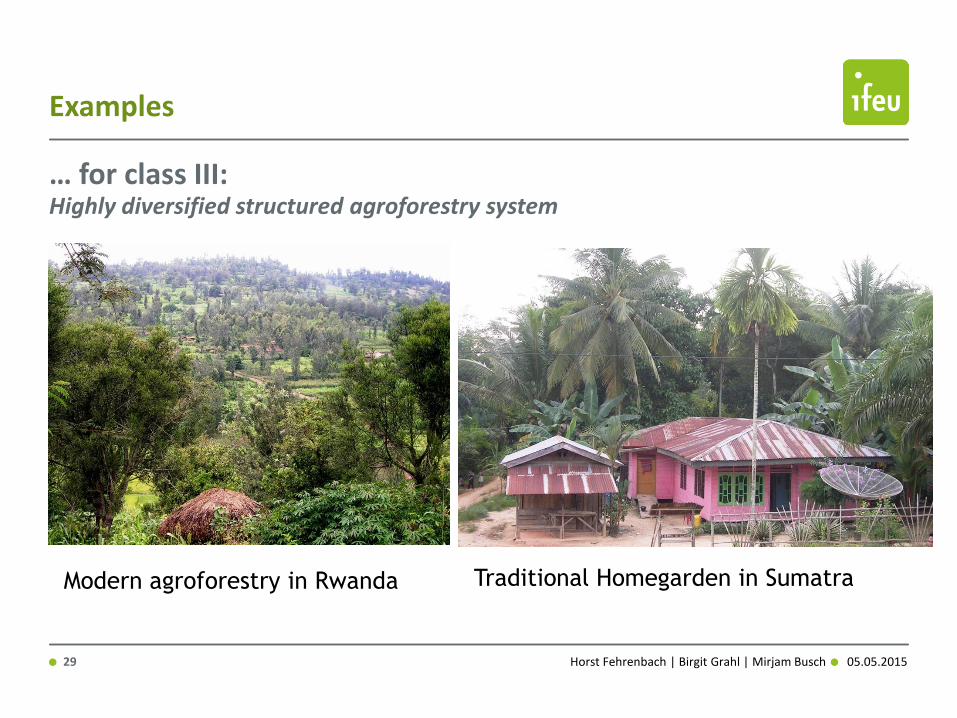
Examples
… for class III: Highly diversified structured agroforestry system
Modern agroforestry in Rwanda Traditional Homegarden in Sumatra
Horst Fehrenbach | Birgit Grahl | Mirjam Busch 30 05.05.2015
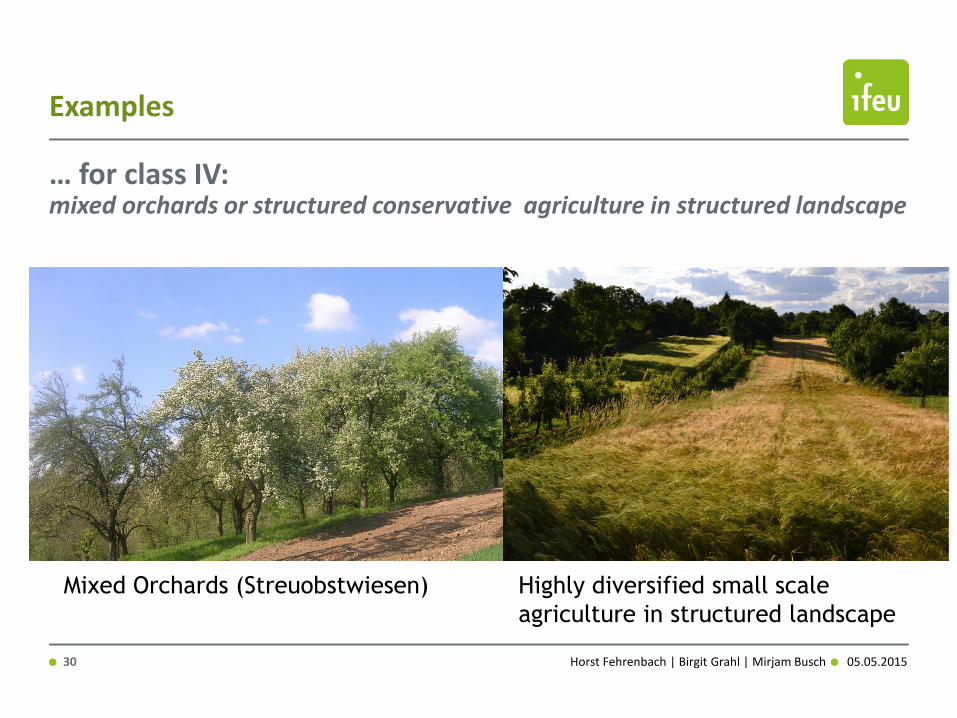
Examples
… for class IV: mixed orchards or structured conservative agriculture in structured landscape
Mixed Orchards (Streuobstwiesen) Highly diversified small scale
agriculture in structured landscape
Horst Fehrenbach | Birgit Grahl | Mirjam Busch 31 05.05.2015
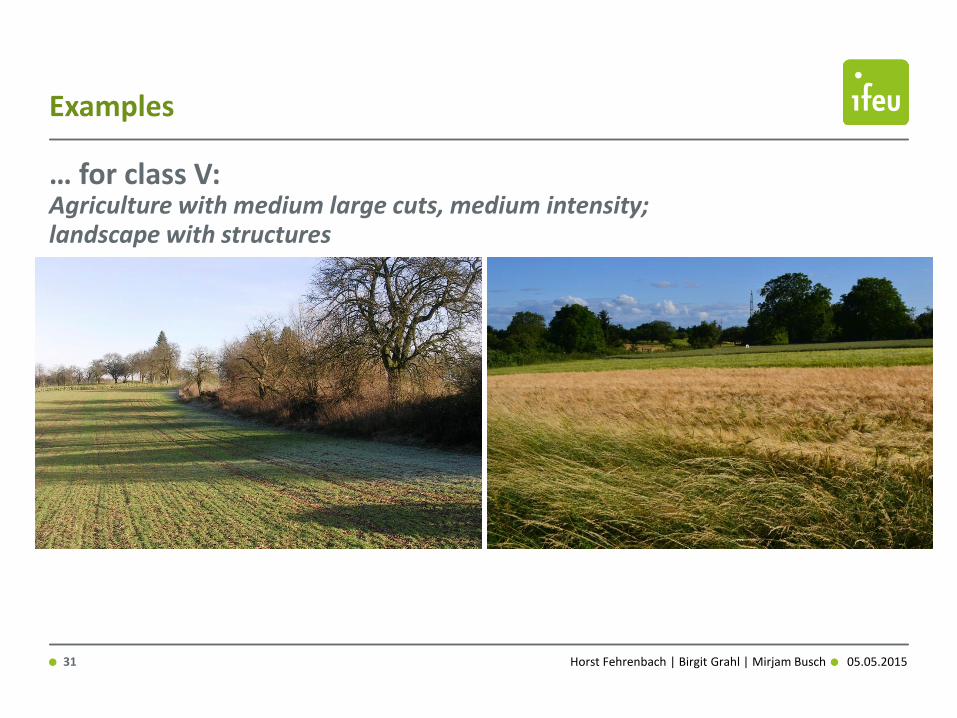
Examples
… for class V: Agriculture with medium large cuts, medium intensity; landscape with structures
Horst Fehrenbach | Birgit Grahl | Mirjam Busch 32 05.05.2015
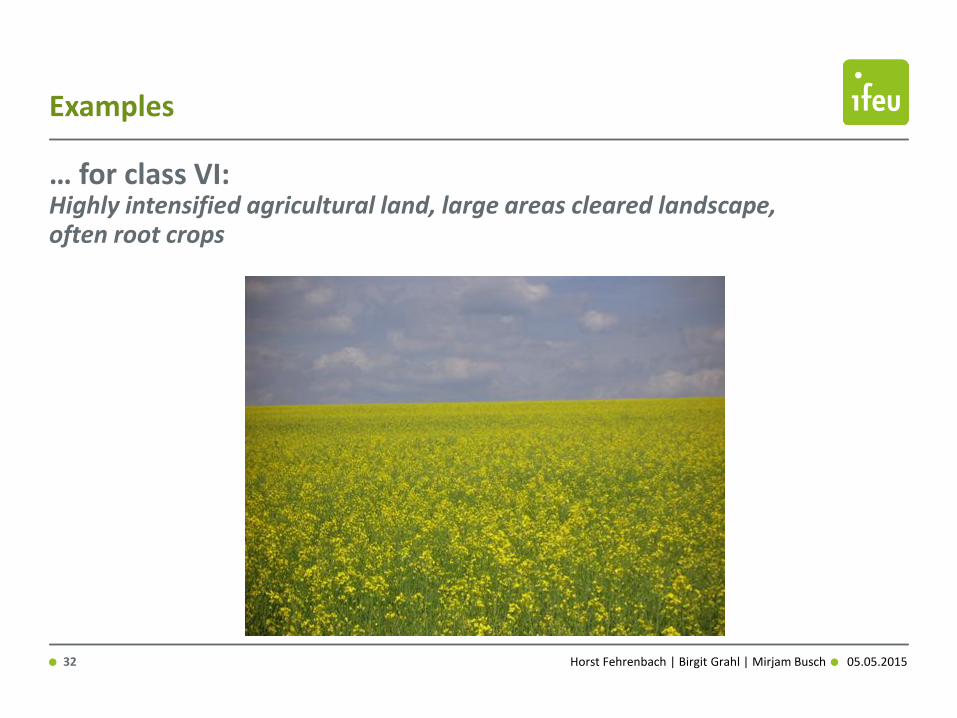
Examples
… for class VI: Highly intensified agricultural land, large areas cleared landscape, often root crops
Horst Fehrenbach | Birgit Grahl | Mirjam Busch 33 05.05.2015
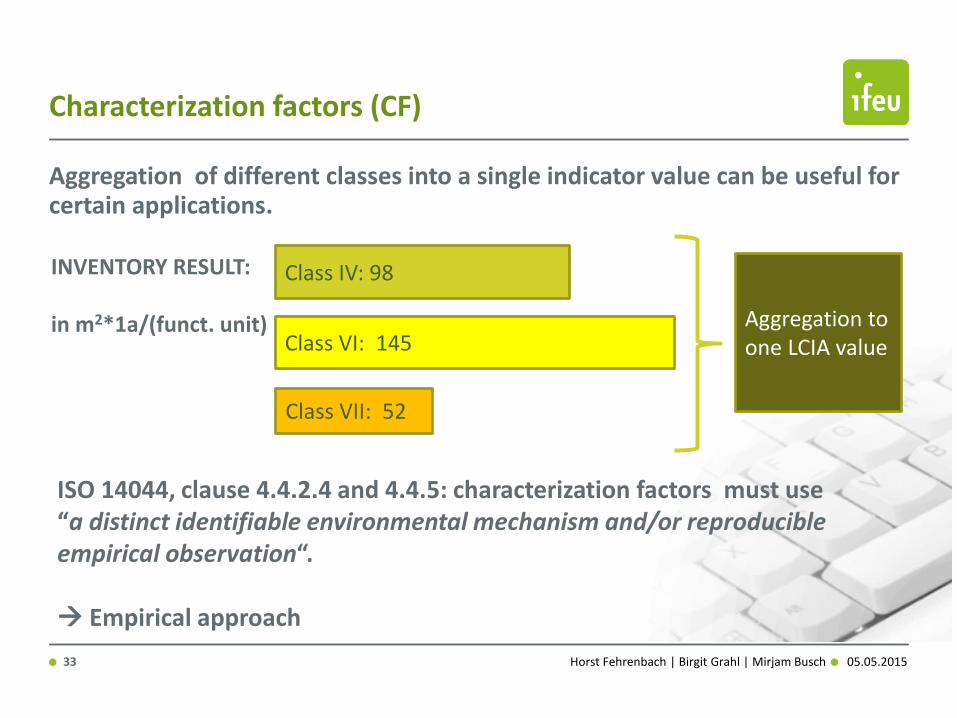
Characterization factors (CF)
Aggregation of different classes into a single indicator value can be useful for certain applications.
Class IV: 98
Class VI: 145
Class VII: 52
ISO 14044, clause 4.4.2.4 and 4.4.5: characterization factors must use “a distinct identifiable environmental mechanism and/or reproducible empirical observation“. Empirical approach
INVENTORY RESULT: in m2*1a/(funct. unit) Aggregation to
one LCIA value
Horst Fehrenbach | Birgit Grahl | Mirjam Busch 34 05.05.2015
Characterization factors (CF)
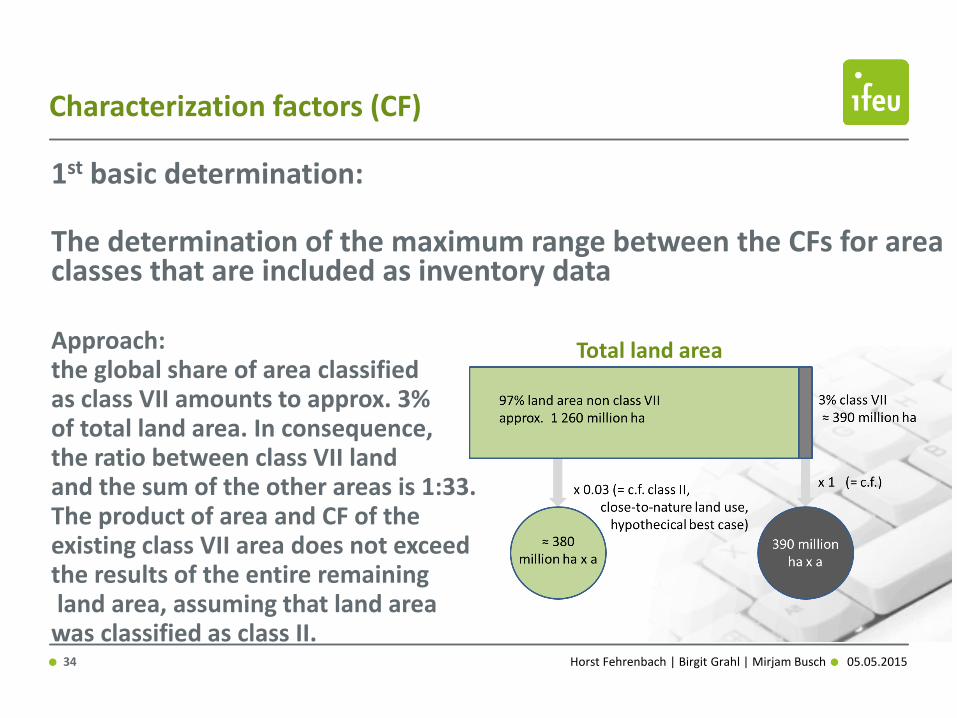
1st basic determination:
The determination of the maximum range between the CFs for area classes that are included as inventory data
Approach: the global share of area classified as class VII amounts to approx. 3% of total land area. In consequence, the ratio between class VII land and the sum of the other areas is 1:33. The product of area and CF of the existing class VII area does not exceed the results of the entire remaining land area, assuming that land area was classified as class II.
Total land area

Horst Fehrenbach | Birgit Grahl | Mirjam Busch 35 05.05.2015
Characterization factors (CF)
2nd basic determination:
The determination of the numerical intervals (factors, spans) between the classes
Linear? (blue)
Linear with leaps? (green)
exponential (x2) (red)
class VII => factor 1 class VI => factor 0.5 … halving factor from class to class maximum span: 1 : 32 corresponds with share of class VII area of entire area (see previous slide)
Total land area
Horst Fehrenbach | Birgit Grahl | Mirjam Busch 36 05.05.2015
Characterization factors (CF)
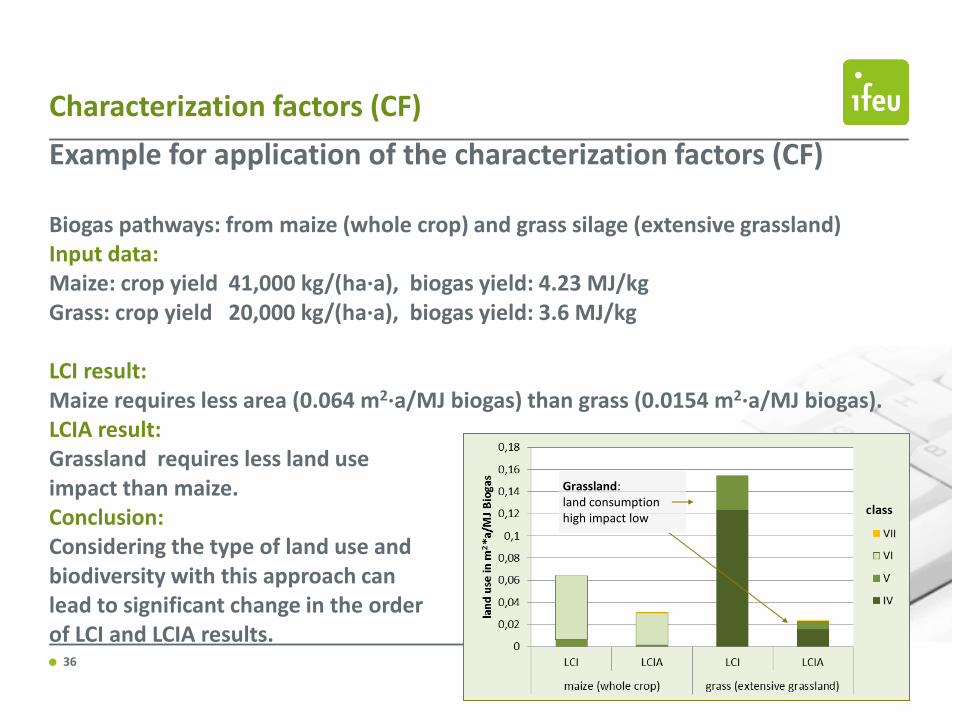
Example for application of the characterization factors (CF)
Biogas pathways: from maize (whole crop) and grass silage (extensive grassland) Input data: Maize: crop yield 41,000 kg/(ha·a), biogas yield: 4.23 MJ/kg Grass: crop yield 20,000 kg/(ha·a), biogas yield: 3.6 MJ/kg
LCI result: Maize requires less area (0.064 m2·a/MJ biogas) than grass (0.0154 m2·a/MJ biogas). LCIA result: Grassland requires less land use impact than maize. Conclusion: Considering the type of land use and biodiversity with this approach can lead to significant change in the order of LCI and LCIA results.
Grassland: land consumption high impact low
Horst Fehrenbach | Birgit Grahl | Mirjam Busch 37 05.05.2015
Outlook
The concept is ready for application to almost any form of land use in central and northern Europe. However solutions for other regions around the globe need to be advanced.
Data need to be enhanced to provide generic default values for the most common products with land-use relevance.
We deem joint research comparing this approach with other land-use-related LCIA approaches by case studies extremely promising .
Wilckensstraße 3 69120 Heidelberg Telefon +49 (0)6 221. 47 67 - 0 Telefax +49 (0)6 221. 47 67 - 19 www.ifeu.de Wilckensstraße 3 69120 Heidelberg Telefon +49 (0)6 221. 47 67 - 0 Telefax +49 (0)6 221. 47 67 - 19 www.ifeu.de
Thank you [email protected]
INTEGRAHL