Feeding Lupins to Fish: A review of the nutritional and ... · Feeding lupins to fish : A review of...
126
Feeding lupins to fish : A review of the nutritional and biological value of lupins in aquaculture feeds Brett D. Glencross BSc(Hons) MSc PhD Department of Fisheries – Research Division Government of Western Australia PO Box 20 North Beach, WA 6160, Australia
Transcript of Feeding Lupins to Fish: A review of the nutritional and ... · Feeding lupins to fish : A review of...

Feeding lupins to fish : A review of the nutritional and biological value of lupins in
aquaculture feeds
Brett D. Glencross BSc(Hons) MSc PhD
Department of Fisheries – Research Division
Government of Western Australia
PO Box 20
North Beach,
WA 6160, Australia

ii
The recommendations given in this publication are based on the best available information
at the time of writing. The Department of Fisheries, Government of Western Australia
(DFWA) makes no warranty of any kind, expressed or implied, concerning the use of
technology mentioned in this publication.
© DFWA 2001. This work is copyright. Apart from use as permitted under the Copyright Act
1968, no part may be reproduced by any process without prior written permission from the
publisher or author.
This document will be updated as a Fisheries Research Report. The present version is part
of the Final Contract Report Series – Grains Research Council (GRC) of WA Project,
“Assessment of the nutritional variability of W.A. lupins as an aquaculture feed ingredient.”

iii
Contents
i. Common abbreviations used v ii. Definitions of standard terms used vi iii Summary viii
iii.i Generic nutritional value viii iii.i.i Dry matter utilisation viii iii.i.ii Nitrogen/Protein utilisation viii iii.i.iii Energy utilisation x iii.i.iv Phosphorus utilisation x
iii.ii Generic biological value x iii.ii.i Inclusion levels x iii.ii.ii Nitrogen retention xi iii.ii.iii Energy retention xi iii.ii.iv Phosphorus retention xi
iii.iii Generic processing value xii 1.1 Introduction 1 1.2 Lupins as a feed ingredient 2 2.1 Lupin composition 3 2.2 Protein and amino acids 3
2.2.1 Crude protein 3 2.2.2 Protein classes 5 2.2.3 Amino acids 5
2.3 Carbohydrates 6 2.3.1 Starch and free sugars 6 2.3.2 Non-starch polysaccharides 6
2.4 Lipids 7 2.4.1 Crude lipid 7 2.4.2 Fatty acids 8 2.4.3 Sterols and wax esters 8 2.4.4 Carotenoids 8
2.5 Mineral content 8 2.6 Vitamin content 9 2.7 Anti-nutritional content 9
2.7.1 Alkaloids 9 2.7.2 Oligosaccharides 10 2.7.3 Phytate 11 2.7.4 Saponins 11 2.7.5 Tannins 12 2.7.6 Protease inhibitors 12

iv
3.1 Use of lupins in diets for aquaculture species 13 3.2 Defining the value of lupins to aquaculture species 14
3.2.1 Assessment of nutritional value 14 3.2.2 Assessment of biological value 15
4.1 Salmonids 17
4.1.1 Rainbow trout 17 4.1.2 Atlantic salmon 39
4.2 Seabreams 46 4.2.1 Gilthead seabream 46 4.2.2 Red seabream 53
4.3 Silver perch 59 4.4 Barramundi 67 4.5 Carp 71 4.6 Tilapia 73 4.7 Milkfish 75 4.8 Turbot 76 4.9 Shrimp 79 4.10 Freshwater crayfish 90 4.10.1 Yabbies 90 4.10.2 Marron 93 4.11 Abalone 94 5.1 Lupins and aquaculture feed processing 101 6.1 Acknowledgements 110 7.1 References 110

v
Common abbreviations used
ABV Apparent Biological Value
ADC Apparent Digestibility Coefficient
ADN / E / P Apparent Digestible Nitrogen / Energy / Phosphorus
AF As Fed
d Day
CF Crude Fat
CP Crude Protein
cv. Cultivar
DE Digestible Energy
DGC Daily Growth Coefficient
DM Dry Matter
ERV Energy Retention Value
FCR Food Conversion Ratio
g Gram
kg Kilogram
mg Milligram
LYS Lysine
MET Methionine
MJ MegaJoule
NFE Nitrogen Free Extractives
NSP Non Starch Polysaccharide
PER Protein Efficiency Ratio
PPV Productive Protein Value

vi
Definitions of standard terms used
Apparent Biological Value (ABV) The proportion of digestible nutrient intake that is retained as growth. This parameter
is a derivation of nitrogen retention and nitrogen digestibility.
Apparent Digestibility Coefficient (ADC) A coefficient used to describe the amount of food absorbed by an animal when fed a
specific diet or ingredient. Usually presented on a percentage basis. Determined by
comparison of relative concentration between feed and faeces of an indigestible
component (marker) of a given diet. Is calculated as:
Apparent Digestibile Nitrogen / Energy / Phosphorus (ADN / E / P) A coefficient used to describe the amount of a specific nutrient (usually
nitrogen/protein, energy or phosphorus) absorbed by an animal when fed a specific
diet or ingredient. Usually presented on a percentage basis. Determined by
comparison of relative concentration between feed and faeces of an indigestible
component (marker) and nutrients of a given diet. Is calculated as:
As Fed (AF) That content of a substance as provided in its usual state, i.e. not corrected for
moisture content.
Daily Growth Coefficient (DGC) A growth coefficient based on the one-third exponent of an animals weight gain. For
specific validation and comparison of measures of growth in fishes see; Kaushik
(1998a). DGC is calculated as:
Where Wt represents the animal’s weight at time period t, and Wi represents the
animal’s weight at the beginning of the time period.
ADC = − ×���
���100 100
marker content of feedmarker content of faeces
ADN / E / P 100 100 marker content of feed
marker content of faecesnutrient content of faecesnutrient content of feed
= − × ×���
���
DGC Wt Wi
t 100
1/3 1/3
=−
�
���
�
���
vii
Dry Matter (DM) That content of a substance when the substance is devoid of water.
Energy Retention Value (ERV) See Nitrogen/Energy/Phosphorus Retention.
Food Conversion Ratio (FCR) The amount of food consumed to produce one kilogram of live-weight gain of the
animal. Usually this value is determined on an As Fed basis of the feed to live-weight
gain, but in some circumstances a Dry Matter value of the feed is used (FCRDM).
Nitrogen Free Extractives (NFE) The content of a diet, minus the water, protein, fat and ash contents. Represents a
crude assessment of the carbohydrate content of a substance.
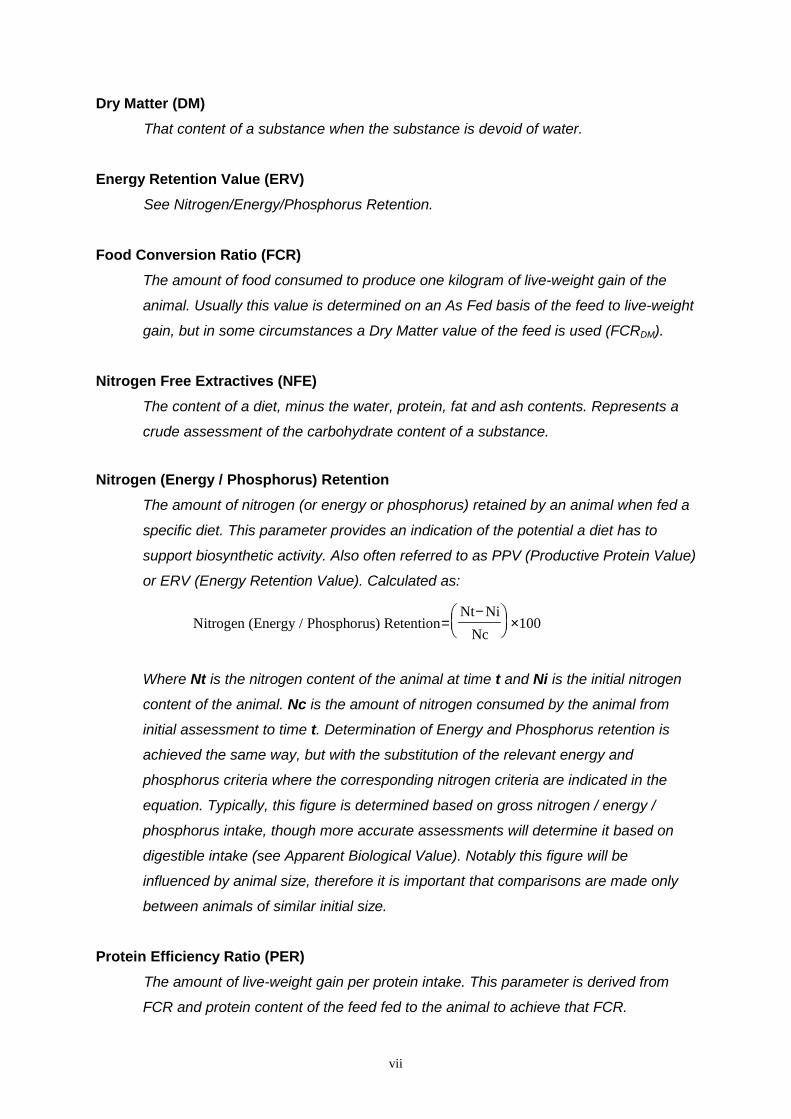
Nitrogen (Energy / Phosphorus) Retention The amount of nitrogen (or energy or phosphorus) retained by an animal when fed a
specific diet. This parameter provides an indication of the potential a diet has to
support biosynthetic activity. Also often referred to as PPV (Productive Protein Value)
or ERV (Energy Retention Value). Calculated as:
Where Nt is the nitrogen content of the animal at time t and Ni is the initial nitrogen
content of the animal. Nc is the amount of nitrogen consumed by the animal from
initial assessment to time t. Determination of Energy and Phosphorus retention is
achieved the same way, but with the substitution of the relevant energy and
phosphorus criteria where the corresponding nitrogen criteria are indicated in the
equation. Typically, this figure is determined based on gross nitrogen / energy /
phosphorus intake, though more accurate assessments will determine it based on
digestible intake (see Apparent Biological Value). Notably this figure will be
influenced by animal size, therefore it is important that comparisons are made only
between animals of similar initial size.
Protein Efficiency Ratio (PER) The amount of live-weight gain per protein intake. This parameter is derived from
FCR and protein content of the feed fed to the animal to achieve that FCR.
Nitrogen (Energy / Phosphorus) Retention Nt Ni
Nc 100=
−×
���
���

viii
iii. Summary iii.i. Generic nutritional value In all aquaculture species for which a
nutritional assessment has been made on the
value of lupins, they have been shown to be a
well-accepted and nutritionally useful
ingredient. The extent of this value varies
between species and also between studies.
iii.i.i. Dry matter utilisation
The amount of solid waste output from fish fed
lupin meals is consistent with that observed of
most other plant protein resources. The dry
matter digestibilities of lupin meals are strongly
influenced by the high levels of non-starch
polysaccharides (NSP) within the grain
(Morales et al., 1994; Gomes et al., 1995;
McMeniman, 1998; Allan et al., 1998a; Burel
et al., 2000a; Smith et al., 2000). The high
reliance on protein metabolism in most
aquaculture species and a lack of capacity by
most fish species to deal with dietary NSP
means that essentially the entire NSP
component of lupins is defaecated. At high
levels, it is also likely that NSP may act as an
anti-nutrient, effectively acting like fibre and
inhibiting the digestive process for other
nutritionally valuable components of the feed.
Accordingly, substantial improvements are
made in the level of dry matter digestibility with
the removal of the lupin seed coat, which is
concomitant with a reduction in the levels of
NSP within the meals (Allan et al., 1998a;
Smith et al., 2000).
iii.i.ii. Nitrogen/Protein utilisation
High levels of nitrogen/protein digestion have
been reported from essentially all species in
which lupins have been evaluated (Morales et
al., 1994; Gomes et al., 1995; McMeniman
1998; Allan et al., 1999a; Burel et al., 2000a;
Smith et al., 2000). In many instances the
digestibility of lupin protein has been
significantly superior to that of many other
plant protein and/or animal protein resources
(Hughes, 1988; Gomes et al., 1995;
McMeniman 1998; Burel et al., 2000a; Smith
et al., 2000; Booth et al., 2001). Little
difference in protein digestibility has been
reported between the key lupin species.
Notably though, the lupin kernel meals have
protein digestibilities substantially greater than
that of the whole-seed meals in most species
studied (Robaina et al., 1995; McMeniman
1998; Allan et al., 1998a). As with many other
protein resources, cooking or autoclaving of
lupin meals reduces the nutritional value of
their protein content (De la Higuera et al.,
1988; Vandepeer et al., 1999).
Figure 1. Lupin kernels, kernel meal and seed

ix
Table i.i Summary of the nutritive value (Digestibility%) and Available nutrient content of lupin whole-seed and kernel meals and defatted soybean meals in various
aquaculture species as determined on an ingredient specific basis
Digestibilities (%) Available Nutrients
Species and Ingredient Dry Matter Nitrogen Energy Phosphorus Protein (g/kg) Energy (MJ/kg) Phosphorus (g/kg)
Rainbow trout (Oncorhynchus mykiss)
L. angustofolius (whole seed meal) - 85.5 61.2 - 275 11.1 -
L. albus (kernel meal) 69.7 96.2 77.0 61.9 385 15.7 2.2
Defatted soyabean meal 71.2 90.1 56.0 22.0 439 9.9 1.5
Silver Perch (Bidyanus bidyanus)
L. angustofolius (whole seed meal) 57.0 91.8 51.0 - 296 9.2 -
L. angustofolius (kernel meal) 68.0 93.3 61.9 - 364 11.7 -
L. albus (whole seed meal) 64.7 96.1 72.7 77.5 344 14.2 2.8
L. albus (kernel meal) 77.8 101.4 85.2 73.8 406 17.4 3.7
Defatted soyabean meal 73.0 95.0 82.0 - 463 14.4 -
Tiger Prawn (Penaeus monodon)
L. angustofolius (whole seed meal) 67.0 94.0 68.0 - 303 12.3 -
Defatted soyabean meal 67.0 92.0 71.0 - 448 12.5 -
Greenlip Abalone (Haliotis laevigata)
L. angustofolius (whole seed meal) - 91.0 80.0 - 293 14.5 -
L. luteus (whole-seed meal) 61.0 91.0 83.0 84.0 349 16.3 3.6
Defatted soyabean meal 57.0 87.0 84.0 86.0 424 14.8 6.0
Indicated values within species are not necessarily derived from the same study. See main text of review for specific details and appropriate references.

x
iii.i.iii. Energy utilisation
The highly digestible protein and lipid
components of lupin meals constitute almost
the entire digestible energy value of this grain
resource (Allan et al., 1998a; Burel et al.,
2000a; Kissil and Lupatsch, 2000).
Accordingly, slight differences in the energetic
value have been identified between L. albus
and L. angustifolius, primarily in response to
the higher protein and fat levels in L. albus.
Calculated assumptions of energy utilisation
from protein and energy digestibilities support
that little digestible energy contribution of the
NFE component is occurring when
aquaculture species are fed any of the lupin
grain commodities (Morales et al., 1994).
Similar to the dry matter digestibility
characteristics, substantial improvements are
made in the level of energy digestibility with
the removal of the lupin seed coat (Allan et al.,
1998a; Smith et al., 2000).
iii.i.iv. Phosphorus utilisation
The assessment of phosphorus utilisation is
increasingly becoming a more important
nutritional parameter in accordance with an
increasing imperative towards environmental
best-management practice from aquaculture.
From the data available on phosphorus
utilisation, the digestibility of phosphorus from
lupins is considerably better than that seen for
essentially any other protein resource (Allan et
al., 1998a; Burel et al., 2000a). Phosphorus
digestibilities almost twice those reported in
the same species fed many other plant protein
meals have been reported (Carter and Hauler
1999).
iii.ii. Generic biological value Assessment of the biological value of a range
of species and processing forms of lupins,
across a range of aquaculture species, also
clearly shows a good capacity by fish and
crustaceans to use this ingredient in
compound feeds.
iii.ii.i. Inclusion levels
There is considerable variability in the
maximum reported inclusion level of lupin
meals in diets for aquaculture species with
values ranging from 20% to 70% (De la
Higuera et al., 1988; Robaina et al., 1995;
Burel et al., 1998; Williams, 1998; Sarac et al.,
1998). As with other protein resources, the
maximum inclusion is likely to be a function of
the protein content of resource used, the
protein requirements of the animal and the
level of feed attractants and ingestants
included in the diet. On this basis, L. luteus
has potentially more value than both L. albus
and L. angustifolius. Regardless of lupin
species though, their kernel meals have
considerably more potential than their
respective whole-seed meals for most species.
Any restrictions on the use of high levels of
inclusion of any lupin product can easily be
circumvented by blending with other protein
resources or the use of crystalline methionine
(Rodehutschord et al., 2000). However, in
practical terms, as with most other plant
protein resources, the limitation on the
inclusion level is more likely to be one based
on level of risk aversion, faecal waste output
and diet processing characteristics.

xi
iii.ii.ii. Nitrogen retention
The level of nitrogen retention that has been
observed from lupins fed to a range of
aquaculture species also provides good
evidence for the nutritional quality of this
protein resource (Robaina et al., 1995; Burel
et al., 1998; Carter and Hauler, 1999).
Generally, nitrogen retention was equal to that
observed from the range of other ingredients
examined. For most species, the level of
retention in iso-nitrogenous diets was
improved relative to control diets with
moderate inclusion of lupin meals in the diet,
though with higher inclusion level the nitrogen
retention often deteriorated. Based on the
work of Williams (1998), this deterioration may
be consistent with the selective catabolism by
these species of the relatively high levels of
non-essential amino acids present in diets with
high levels of lupin meals.
iii.ii.iii. Energy retention
The level of energy retention observed from
lupins fed to a range of aquaculture species is
highly consistent of the level of crude protein
in the grain (Kissil and Lupatsch, 2000). While
it is presumed that some benefit is derived
from the fat content of lupins, the low levels of
this nutrient (56 to 114 g/kg) in the range of
lupin resources available mean that in most
cases it is unlikely to be the key parameter in
influencing the energetic value of lupins to an
aquaculture species. In essentially all species,
the carbohydrate content of lupins has been
observed to have negligible digestible
energetic value (Morales et al., 1994). Notably,
lupins contain negligible starch content.
iii.ii.iv. Phosphorus retention
Similar to observations of nitrogen retention,
phosphorus retention by aquaculture species
fed lupins was also improved with the inclusion
of lupins, though unlike nitrogen retention, as
inclusion levels of lupin resources increased
beyond moderate inclusion levels, so to did
the level of phosphorus retention (Burel et al.,
1998; Burel et al., 2000b). This aspect of lupin
use has considerable implications for the use
of lupins in the diets of fin-fish in regard to
reduction of phosphorus output of aquaculture
(Ballestrazzi et al., 1994; 1998; Bedford, 1996;
Ervik et al., 1997; Medale et al., 1998).
Coupled with the already low levels of
phosphorus in lupin meals (3.0 to 9.7 g/kg),
the relatively high levels of phosphorus
digestibility and the high levels of phosphorus
retention mean that the total soluble outputs of
phosphorus by fish fed lupins will be
substantially lower than that of fish fed other
plant ingredients, and particularly other animal
derived ingredients.
Figure 2. Shrimp and lupins

xii
iii.iii. Generic processing value
Processing of diets, for fin-fish, that contain
lupins has shown that lupin meals can be
easily used as an ingredient in diets made
using extrusion technology. Resulting diets
have a range of characteristics, depending on
the processing conditions used. Diets extruded
with a lupin component tend to have less
expansion and oil absorption than that
achieved with some other plant meals, though
they have higher bulk density and faster sink
rates. Notably the pellets are also usually
stronger and more durable (Gleeson et al.,
1998a).
Diets made using pellet press technology have
shown relatively poor pellet stability after
extended immersion in water. Considerable
differences were found between the
processing form of the lupins (ie. whole-seed
meal, kernel meal or protein concentrate).
However, it is likely that the effects of the
processing form on pellet stability are also
related to protein content and consequently
the amount of wheat flour filler that has been
used in the relevant diets (Sudaryono et al.,
1999a; 1999b)
Figure 3. Red seabream with lupin kernels, lupin kernel meal and lupin (L. angustifolius cv. Gungarru) seeds

1
1.1 Introduction
Lupins are the harvested seed of species from
the Lupinus genus, a group within the
leguminous bean and pea family Fabaceae.
Legumes are particularly valuable agricultural
crops because of their capacity to provide a
grain crop and also fix and return nitrogen to
soils and improve the soil value for further
cropping. The oilseeds, soybeans and peanuts
are also leguminous plants, though
traditionally they have been cropped for their
oil value, whereas lupins, are cropped for both
their protein and nitrogen fixing value
(Gladstones, 1998; Perry et al., 1998).
The three key commercial species of lupins
are L. angustifolius (Narrow-leafed Sweet
Lupin), L. albus (White or Albus Lupin) and L.
luteus (Yellow Lupin). L. angustifolius
dominates world lupin production, with the bulk
of the grain (77% of world production), being
produced in the mediterranean climate of
south-western Australia (Perry et al., 1998).
The primary cultivars of L. angustifolius grown
are the Gungurru and Merrit varieties. Recent
development has seen the release of the
Myallie, Belara and Tallerack varieties, which
were developed to suit different environmental
and production criteria (GPWA, 2000). Both L.
albus and L. luteus are also grown in this
region and in several other regions in
Australia, but at much lower quantities (Perry
et al., 1998; Petterson et al., 1998).
Production of lupins in other countries focuses
primarily on L. albus, with significant tonnages
being produced in Chile, Egypt, South Africa
and Eastern Europe (primarily former USSR,
Germany and Poland) (Perry et al., 1998) and
L. luteus in Poland. Other species with
commercial potential include L. atlanticus, L.
cosentini and L. mutabilus. None of these
species are cultivated in large quantities and
their practical value as a feed resource is not
considered overly viable at present (Perry et
al., 1998).
Lupin grain has been used as a key feed
ingredient in diet formulations for terrestrial
species; indeed this is the primary use of the
grain (Gdala et al., 1996; Edwards and van
Barneveld, 1998; Petterson, 2000). The
capacity to use lupins as either a whole-feed
or feed ingredient have been well studied in
most terrestrial domestic animal species, as
have the nutritional requirements and the
physiological and biochemical processes
associated with nutrition in these species
(reviewed in: Edwards and van Barneveld,
1998; van Barneveld, 1999 and Petterson,
2000).
Figure 5. L. angustifolius (cv. Gungarru) seed with
kernels

2
1.2 Lupins as a feed ingredient
In comparison to most terrestrial species, the
nutritional knowledge of aquaculture species,
including their nutritional requirements, the
associated physiological and biochemical
processes, and the capacity of various
ingredients to be used in these processes, is
limited (Edwards and van Barneveld, 1998). A
notable difference, however, that has been
identified in many fin-fish species in particular,
is a relatively higher dietary protein
requirement than for terrestrial domestic
species (NRC, 1993). This high need for
dietary protein is to satisfy two primary
nutritional needs, amino acids and energy.
As a consequence of the limited capacity of
most aquaculture species to utilise dietary
carbohydrates for energy (NRC, 1993),
aquaculture nutritionists are usually forced to
rely on the use of either dietary fat or protein to
satisfy energetic requirements of the fish being
fed. Accordingly, dietary protein is usually over
specified on an amino acid requirement basis
in order to maximise the dietary energy
content. As a consequence of this oversupply
of dietary protein, the importance of the amino
acid profile of the protein is less important than
that required in diets for terrestrial monogastric
species, such as pigs and poultry (Edwards
and van Barneveld, 1998).
To date, this need for protein has been
provided in most fin-fish and crustacean diets
through the inclusion of fish meal in the diet.
However, with the continuing expansion of the
aquaculture industry the need for alternative
protein resources to fishmeal is an increasing
imperative (New and Csavas, 1993; Tacon,
1996). To date there has been considerable
research to examine the use of plant-based
alternative protein resources (Arnesen et al.,
1989; Gomes et al., 1995; Booth et al., 2000).
Soybean meal has been widely used, with
considerable success (Arnesen et al., 1989;
Medale et al., 1998; Refstie et al., 1998;
Storebakken et al., 1998b; Vielma et al.,
2000). Comparison of the composition of lupin
and soybean meals suggests that there could
also be considerable potential for the use of
lupin meal in aquaculture diets. Several
studies have confirmed this potential (see
Section 4 in this review). Notably, it has been
pointed out by van Barneveld (1999) that feed
formulators and nutritionists are seldom
looking for the “perfect” ingredient from which
to make diets, but rather a suite of
complementary ingredients of consistent and
reliable quality that can be blended together to
provide nutritionally complete diets. In this
sense, while lupins or any other plant protein
resource are not an ideal complete feed, they
do provide an option as a highly consistent,
nutritionally valuable ingredient.
This review examines several facets of the use
of lupins in diets for aquaculture species. First,
a comprehensive examination of the
composition of lupins is presented, detailing
the physical chemistry of this grain and the
variations that occur between species and
processing forms. Second, is a review of the
work published to date where lupins have
been fed, either as an ingredient in a
compound feed, or as a whole-feed, to an
aquaculture species. Third, is a review of the
influences of lupins on feed processing
characteristics that have been identified in the
aquaculture feeds sector.

3
2.1 Lupin composition
2.2 Protein and amino acids 2.2.1 Crude protein
Lupin seeds are typified by a higher protein
content (310 to 420 g/kg DM) than most other
grain legumes (pulses). There is considerable
variation in the protein content between the
various species and between cultivars and
even within cultivars as a result of the
characteristics of the growing season and soil
type (Petterson et al., 1997).
Yellow lupin (L. luteus) is generally regarded
as having the highest protein content of the
lupin species, with whole seeds typically
having protein levels of 400 to 450 g/kg DM.
The seed kernel typically has a protein content
around 530 g/kg DM, though this has been
reported to exceed 570 g/kg DM (Petterson et
al., 1997, Table 2.1). Albus/White lupins (L.
albus) are also high in protein with the whole
seed having protein levels of 320 to 440 g/kg
DM and the kernel yielding about 460 g/kg
DM. Albus lupins also tend to have a thinner
seed coat and as a consequence removing the
seed coat of this variety does not increase the
protein content of the resulting kernel meal to
the same degree as is observed in Yellow and
Australian Sweet varieties (Evans, 1998).
Australian sweet lupins (L. angustifolius) are
the predominant variety produced
commercially in Australia, and form an
important ingredient in the rations of many pig
and poultry formulations. L. angustifolius has a
whole seed protein content of about 300 to
410 g/kg DM, with a kernel protein content of
about 440 g/kg DM, though this typically closer
to 420 g/kg DM under industrial dehulling
conditions. Some specimens have had protein
levels of up to 540 g/kg DM (Petterson et al.,
1997).
Figure 6. Seeds, kernels and meals of (L to R) Soybeans, L. angustifolius, L. luteus and L. albus,

4
Table 2.1 Chemical composition (g/kg) of lupin seed and kernel meals and soybean meal on an as received basis
Nutrient Whole seed meals Kernel meals Solvent-extract
L. angustifolius L. albus L. luteus L. angustifolius L. albus L. luteus Soybean meal
Dry matter 911 914 915 900 905 917 890
Crude protein 322 358 383 390 400 525 487
Crude fat 58 95 56 70 114 72 11
Nitrogen Free Extract 504 428 441 408 358 277 329
Total calcium 2.2 2.0 2.2 1.0 - 1.2 4.0
Total phosphorus 3.0 3.6 4.3 5.1 5.0 5.5 7.0
Crude fibre 149 103 162 87 18 17 -
Acid detergent fibre 197 143 249 70 - 31 110
Neutral detergent fibre 227 172 343 71 - 48 130
Ash 27 33 35 27 33 43 68
Gross energy (MJ) 18.1 19.6 19.6 18.9 20.4 20.0 17.6
Values based on data from “The chemical composition and nutritive value of Australian pulses”. GRDC Final Report. Petterso et al. (1997), GPWA
(2000), Petterson (2000) and Glencross (unpublished).

5
2.2.2 Protein classes
The protein composition of lupin grains is
regarded highly as a nutritional source for
terrestrial domestic animals, considered
comparable to that of soybeans (van
Barneveld, 1999). Three of the key protein
fractions found in lupins, the albumins, the
globulins and the prolamines, are all, rich in
glutamic acid, aspartic acid, arginine and
leucine. The predominant proteins are a class
of globulins referred to as the conglutins,
which comprise about 85% of the total protein
content (Blagrove and Gillespie, 1975). There
are three classes of conglutins in lupin protein,
all of which are similar sized molecules and
have similar properties to other storage
proteins found in field peas, soybean and
other legumes. The albumin fractions of the
lupin protein contain a more favorably
comparable amino acid composition, relative
to the amino acid composition of fish meals
(Todorov et al., 1996). Overall, there is a high
degree of homology in protein classes
between lupins and soybeans, with both grains
containing high levels (>80%) of globulins,
moderate levels of albumins (10 to 20%) and
essentially no glutelins (Gueguen, 1983).
2.2.3 Amino acids
The amino acid profile of the protein content of
lupin meals compares favorably with that of
soybean meal, being high in arginine, lysine,
leucine and phenylalanine (Table 2.2). The
notable limitation of lupin meals is the
comparative deficiency of methionine and
cysteine. Recent breeding efforts have been
Table 2.2 Amino acid composition (g amino acid / 16 g N) of lupin and soybean protein
Amino acid L. angustifolius L. albus L. luteus Soybean
Arginine 11.62 12.20 11.30 5.42
Cysteine 1.36 1.34 2.28 n/a
Histidine 2.57 1.86 3.30 2.46
Isoleucine 3.91 3.80 2.70 4.51
Leucine 6.61 6.90 7.89 6.81
Lysine 4.66 4.75 5.35 5.66
Methionine 0.72 0.66 0.70 1.28
Phenylalanine 3.65 3.85 4.04 3.60
Threonine 3.54 3.29 3.51 3.56
Tryptophan 1.00 0.97 n/a 1.35
Tyrosine 3.66 4.26 3.10 1.67
Data derived from Tacon (1990); Petterson et al. (1998); van Barneveld (1999).
6
directed towards improving the levels of
methionine in L. angustifolius. Of note though,
are the higher total levels of methionine,
cysteine and lysine in the seed of L. luteus,
concomitant with a higher level of protein. The
level of methionine in L. albus is between that
observed in the other two key lupin species.
When examined on a basis proportional to the
protein content the levels of methionine and
threonine compare more favorably, though
notably lysine levels are still quite low.
Considerable variability has also been
observed in the relative availabilities of each of
the amino acids from lupin protein when fed to
pigs (van Barneveld, 1999).
2.3 Carbohydrates The carbohydrate content of lupin seed is
quite different to that of most legumes (van
Barneveld, 1999). The seed is charactersied
by possessing high levels of both soluble and
non-soluble non-starch polysaccharides
(NSP). This group of carbohydrates forms
primarily the structural polysaccharides of the
seed, though some are considered as non-
structural. In addition, starch is essentially
non-existent in contrast to most other legume
seeds (Petterson, 2000).
2.3.1 Starch and free sugars
Lupins are typically low in starch, with most
species containing less than 15 g/kg DM in the
seed. Little variability appears to exist in the
levels of starch between the species and
cultivars.
The free sugar content of both L. angustifolius
and L. albus whole-seed meals is dominated
by both glucose and galactose, each at about
30 to 40 g/kg DM. Smaller quantities (8 to 10
g/kg DM) of mannose are also present in the
whole seed. While these free sugars are found
in both the seed coat and kernel, the bulk of
them are found in the kernel (van Barneveld,
1999).
2.3.2 Non-starch polysaccharides
The non-starch polysaccharides (NSP)
constitute the major portion of the
carbohydrate fraction of all lupin species. The
seed coats (hulls) in particular are high in
cellulose, hemicellulose and pectins (Brillouet
and Riochet, 1983). The actual composition of
NSP differs between the species and cultivars,
though their structures are conserved
(Cheung, 1990). Total NSP levels of lupin
seeds are typically about 400 g/kg DM,
essentially double that of soybean meal (217
g/kg DM), peas (Pisum sp.) (180 g/kg DM) and
faba beans (Vicia sp.) (190 g/kg DM) (van
Barneveld, 1999).
The hemicellulose content of the crude fibre
was shown to be proportionally greater in
lupins than in other legumes such as peas,
faba beans and soybeans in which the
cellulose content comprised a greater
proportion of the fibre. Notably, a greater
proportion of the hemicellulose is present in
the kernel, with the majority of the cellulose in
the seed coat (van Barneveld, 1999).
A further group of polysaccharides, the pectins
are comprised primarily of β-(1,4)-galactan,
which itself is comprised of sub-units of L-
rhamnose, L-arabinose, D-galactose and
galacturonic acid (Carre et al., 1985).

7
The polysaccharide group of the lignins is
comparatively low in lupins compared to
legumes such as soybeans and faba beans,
though at a similar level to that of peas (12
g/kg DM) (van Barneveld, 1999).
2.4 Lipids
2.4.1 Crude lipid
The fat content of lupins varies considerably
between the different species and even
cultivars. Typically lowest in crude fat level is
L. atlanticus (as low as 14 g/kg DM) and
highest is L. mutabilis (up to 230 g/kg DM). Of
the three key species, L. luteus generally has
the lowest fat levels (62 to 83 g/kg DM) and L.
albus the highest fat levels (83 to 145 g/kg
DM) (Petterson et al., 1997; Petterson, 2000)
(Table 2.1).
Analysis of the crude lipid composition
identified that triacylglycerides made up
71.1%, phospholipids 14.9%, free sterols
5.2%, glycolipids 3.5%, sterol and wax esters
0.5%, free fatty acids 0.4%, with hydrocarbons
and unidentified waxy material each
contributing about 0.4% (van Barneveld, 1999;
Petterson, 2000).
Table 2.3 Fatty acid composition (% of total fatty acids) of lupin and soybean
Fatty acid L. angustifolius L. albus L. luteus Soyabean
16:0 11.0 7.8 4.8 10.3
18:0 3.8 1.6 2.5 4.5
18:1n-9 38.2 53 21 23.9
18:2n-6 37.1 17.2 47.3 51.8
18:3n-3 5.3 9.5 7.5 6.5
20:0 0.9 1.2 2.7 -
20:1n-9 0.3 4.3 1.8 -
22:0 1.9 3.9 7.1 -
22:1n-11 - 1.9 0.8 -
Total saturates 17.6 14.5 17.1 14.8
Total monounsaturates 38.5 59.2 23.6 23.9
Total polyunsaturates 42.4 26.7 54.8 58.3
n-3 (omega-3) 5.3 9.5 7.5 6.5
n-6 (omega-6) 37.1 17.2 47.3 51.8
All other fatty acids had levels less than 0.5% in all species presented. Data derived from Tacon (1990); Petterson et al. (1998); and van Barneveld (1999).

8
2.4.2 Fatty acids
The general fatty acid content of the lipid in
lupins is typical of that of most legumes, being
high in mono-unsaturated and poly-
unsaturated fatty acids (PUFA). Notable fatty
acids include high levels of both oleic (18:1n-
9) and linoleic (18:2n-6) acids. (Table 2.3).
Palmitic and linolenic acids also form a
substantial component of the total fatty acids
(> 5%). Essentially there are no other PUFA in
lupin fatty acids other than that provided by
either both linoleic and linolenic acids.
L. luteus has the highest levels of the PUFA,
approaching the composition seen in soybean
oil. The composition of L. albus has the lowest
PUFA levels, being typically higher in oleic
acid that either L. angustifolius or L. luteus but
lower in linoleic acid. However, highest levels
of n-3 (omega-3) fatty acids are found in L.
albus (9.5%) followed by L. luteus (7.5%), both
of which were higher than that observed in
soyabean oil (6.5%). The highest level of n-6
fatty acids was in L. luteus (47.3%) followed by
L. angustifolius (37.1%), with the lowest levels
in L. albus (17.2%).
2.4.3 Sterols and wax esters
Low levels of both sterols and wax esters have
been identified in lupin lipids. Free sterols
have been identified to comprise 5.2% of the
total lipids in the seed. Acylated sterols and
wax esters have also been identified, though
at one-tenth the level of that of free sterols
(0.5%). Further unidentified waxes made up
0.4% of the total lipid (Petterson, 2000).
2.4.4 Carotenoids
A range of carotenoids have also been
identified in lupin seed and kernel meals with
total carotenoid levels varying from 9 mg/kg
DM in L. luteus whole-seed to 35 mg/kg DM in
L. angustifolius (cv. Gungarru) (Howieson and
Potts, 2001). While the primary carotenoid
required by most aquaculture species,
astaxanthin, is absent from lupins, several
other carotenoids species are present. The
majority of these are hydroxycarotenoids of
the lutein family, comprising about 66% of all
carotenoids found in L. angustifolius whole-
seed. About a third of all carotenoids in L.
angustifolius are β-carotene, though in L.
luteus this is reduced to about 20%.
2.5 Mineral content Key minerals in lupin seeds include calcium,
magnesium, phosphorus, potassium, sodium
and sulphur. Calcium levels in whole-seeds
range from an average of 2.2 g/kg DM in L.
albus to 2.4 g/kg DM in both L. angustifolius
and L. luteus. Phosphorus ranges from an
average of 3.3 g/kg DM in L. angustifolius to
5.7 g/kg DM in L. luteus. Potassium levels
range from 8.9 g/kg DM in L. angustifolius to
10.8 g/kg DM in L. luteus. Levels of sulphur
range relatively more so from levels of 2.5 g/kg
DM in L. angustifolius to 5.1 g/kg DM in L.
luteus. All of the mineral levels are quite
variable and are reportedly quite dependent on
the soil type on which the plant was grown
(Petterson, 2000).

9
2.6 Vitamin content A range of endogenous vitamins have been
reported within lupins. Reported in L.
angustifolius whole-seed meal have been β-
carotene (3.9 mg/kg DM), thiamin (5.9 mg/kg
DM), riboflavin (3.1 mg/kg DM), biotin (0.04
mg/kg DM), folate (0.4 mg/kg DM), choline
(3.4 g/kg DM), niacin (40 mg/kg DM),
pantothenate (1.8 mg/kg DM) and α-
tocopherol (2.4 mg/kg DM) (Petterson, 2000).
However, recent evaluations of L. angustifolius
(cv. Gungarru) have reported that higher levels
of α-tocopherol have been found, in some
instances exceeding 4.4 mg/kg DM (Petterson,
2000).
2.7 Anti-nutritional content Lupins are typically low in anti-nutritional
factors, though a range of various substances
have been reported. Traditionally, lupins were
not considered a viable feed grain because of
inherently high alkaloid levels in the grain.
However, selective breeding over the last forty
years has resulted in the development of low
alkaloid varieties that now contain less than
0.6 g/kg DM of alkaloids, with the cultivars of
some species having levels consistently less
than 0.1 g/kg DM. Other potential anti-
nutritionals present in lupins include
oligosaccharides, phytate, saponins, tannins
and protease inhibitors, though notably most
of these are usually at levels not considered
influential (Table 2.4). Notably, lectins have
not been detected in lupins.
Table 2.4 Anti-nutrient levels of various lupin species and soy meal per kilogram (as received)
Anti-nutrient (g/kg) L. angustifolius
(whole seed)
L. luteus
(whole seed)
L. albus
(whole seed)
L. angustifolius
(Kernel meal)
Soybean meal
(Defatted)
Trypsin inhibitor 0.12 0.16 0.08 n/r 3.11
Alkaloids < 0.20 < 0.50 < 0.10 < 0.12 n.d.
Oligosaccharides * 41 89 66 77 52
Phytate 5.0 9.3 5.7 n/r 15.9
Saponins 0.57 - n.d. n/r n/r
Tannins 0.10 0.30 0.20 n/r n/r
*sum of raffinose, stachyose and verbascose. n.d. : not detected. n/r : not reported. Data derived from Petterson et al. (1997).
2.7.1 Alkaloids
Present levels of alkaloids in L. angustifolius
are usually less than 200 mg/kg. Wild-type
varieties, still found in their countries of origin,
may contain from 5,000 to 40,000 mg/kg of
alkaloids (Harris and Jago, 1984). These
alkaloids are generally bicyclic, tricyclic or
tetracyclic derivatives on the molecule
quinolizidine (Petterson 2000). Composition of
the alkaloids in L. angustifolius is dominated
by lupinine (42-59%), 13-hydroxylupanine (24-

10
45%), and angustifoline (7-15%). Other
alkaloids comprise less than 2% of the total
(Petterson, 2000).
Though there are no reports of problems
directly attributed to alkaloids in the diets of
fish, levels of alkaloids >1000 mg/kg have
been reported to cause palatability problems
with pig diets.
2.7.2 Oligosaccharides
The oligosaccharides of lupins are generally α-
galactosyl homologues of sucrose. Of these
oligosaccharides, lupins contain significant
amounts of the raffinose, stachyose,
verbascose and sucrose families. Raffinose
has a single galactose moiety linked to a
sucrose molecule, while stachyose has two
and verbascose three (Petterson, 2000). The
reported levels of each of the oligosaccharides
in lupins varies, not only between species and
cultivar, but also depending on methods of
analysis (Petterson, 2000) (Table 2.4 and 2.5).
For some animal species the oligosaccharides
are regarded as anti-nutritionals. Recent
enzyme-supplementation technology is
addressing aspects of this in both pig and
poultry nutrition (Castañón et al., 1997; Gdala
et al., 1997). Though the utilisation of these
nutrients has not been well defined in fish,
studies with pigs and poultry have shown that
oligosaccharides are indigestible in the
stomach or small intestine, primarily due to a
lack of the enzyme α-galactosidase (EC
3.2.1.23) (Gdala et al., 1997). The level of α -
galactosides in lupins ranges from 70 to 120
g/kg DM (Trugo and Almeida, 1988). High
levels of raffinose oligosaccharides have been
reported to present some negative nutritional
effects, some of which may be applicable to
fish. These include; (a) interference with the
digestion of other nutrients, (b) osmotic effects
of oligosaccharides in the intestine and (c)
anaerobic fermentation of the sugars resulting
in increased gas production (van Barneveld,
1999).
Table 2.5 Oligosaccharide content and composition of defatted soybean and lupin meals. Data derived
from van Barneveld (1999), Petterson (2000)
L. albus L.angustifolius L. luteus Soybean meal
Oligosaccharides (g/kg DM) 66 41 89 52
Raffinose (g/kg DM) 2 – 8 4 – 9 8 – 9 8
Stachyose (g/kg DM) 35 – 46 35 – 38 56 – 59 46
Sucrose (g/kg DM) 12 – 19 12 – 26 7 – 13 74
Verbascose (g/kg DM) 3 – 5 12 – 19 28 –31 Trace

11
Extraction of oligosaccharides using an
ethanol extraction process was reported to
remove around 70% of the oligosaccharides in
both L. angustifolius and L. albus (Coon et al.,
1990). Later work, reviewed by van Barneveld
(1999), also showed that ethanol extraction
significantly improved the digestion of all
amino acids from both L. angustifolius and L.
albus by pigs. This supported the hypothesis
that oligosaccharides could interfere with
digestion of other nutrients when fed to pigs,
and suggests that the oligosaccharide content
of lupins may also be influencing the nutritional
value of its own protein. In contrast to work
with pigs, little influence on the nutritional
value of lupins by the raffinose
oligosaccharides has been observed with
poultry. Studies by Hughes et al. (1998)
demonstrated that the ethanol extraction the
oligosaccharides from L. angustifolius actually
reduced the nutritional value to poultry. Similar
results were also reported by Irish et al. (1995)
when soybean meal was ethanol extracted to
remove the α-galactosides of sucrose. So in
contrast to that observed with pigs, it appears
that lupin oligosaccharides have little anti-
nutritional effect in poultry.
Ultimately the influence of the
oligosaccharides on the nutritional value of
lupins appears to vary on a species specific
basis. What influence the lupin
oligosaccharides are likely to have on fish is
presently unknown though studies examining
ethanol soluble carbohydrates (most likely to
be oligosaccharides) from soybean meals on
Atlantic salmon, have shown some
antagonistic effects (Arnesen et al., 1989).
2.7.3 Phytate
The molecule inositol hexaphosphate and salt
ions of this molecule are commonly referred to
as phytate. These molecules tend to form
insoluble complexes with calcium and /or zinc
ions, which make them less available for
absorption and utilisation (Petterson, 2000).
Lupins typically have low levels (~5 g/kg DM)
of phytate, similar to the levels found in peas
and soybean meal, and considerably less than
that in rapeseed/canola meal. The commercial
use of exogenous enzyme supplements has
made considerable improvements to the
utilisation of phytates by both pigs and poultry.
The key to this is the use of the enzyme
phytase (EC 3.1.3.8) which cleaves the
phosphate units from the inositol base. Recent
work has indicated that there may be potential
for phytase use with fish diets (Carter and
Hauler, 1999; Storebakken et al., 1998b).
Interestingly, improved feed intakes have also
been observed of Atlantic salmon when fed
diets containing phytase (Carter and Hauler,
1999).
2.7.4 Saponins
Saponins are plant glycosides with a steroid or
triterpenoid structure as part of the molecule.
Similar to alkaloids, saponins are also a bitter
tasting molecule. This means that their primary
anti-nutritional basis is as a feeding deterrent.
An additional effect attributable to saponins is
an increase in the permeability of the small
intestine mucosal cells. Trace levels of
saponins have been identified in L. albus
seeds, with slightly higher levels (500 to 800
mg/kg DM) observed in L. angustifolius seeds

12
(Ruiz et al., 1996; Frokiaer et al., 1998).
Saponin levels reported in L. luteus are about
one tenth that of L. angustifolius, at 55 mg/kg
(Cuadrado et al., 1995). The levels of
saponins in lupins are generally about one-
tenth the amount of that of soyabeans, and
about half that observed in field peas (Fenwick
et al., 1991).
2.7.5 Tannins
Tannins are a group of polyphenolic
compounds that bind to proteins to either
inhibit their activity in the case of digestive
enzymes or to prevent their digestion, in the
case of most other proteins. There are two
tannin sub-groups, those being either the
hydrolysable or condensed (non-hydrolysable)
forms. The condensed tannins have been
reported to be able to precipitate proteins,
particularly the digestive enzymes. Tannins
can also form cross-linkages between proteins
and other macro-molecules and render them
unavailable for digestion (Griffiths, 1991).
These inhibitory facets, in conjunction with an
astringent taste constitute the anti-nutritional
characteristics of tannins (Petterson, 2000).
The tannin content of lupins is contained
primarily in the seed coat of the grain.
However, the condensed tannin content of the
seeds are generally considered so low (~ 100
mg/kg DM) that they are unlikely to cause any
anti-nutritional effect (Petterson 2000).
Considerably higher levels of tannins are
generally found in some varieties of soybeans,
field peas and faba beans (Petterson, 2000).
2.7.6 Protease inhibitors
Protease inhibitor activity, notably that of
trypsin inhibitors (TI) has been reported at less
than 0.3 mg/kg in L. angustifolius seed.
Chymotrypsin inhibitor (CI) activity was
reportedly higher at 0.6 mg/kg in L.
angustifolius, L. luteus and L. albus seed
(Petterson et al., 1997). These levels of
protease inhibitors are very low in comparison
to some other plant protein meals, particularly
other legume seeds such as soybean, which
has TI levels of about 60,000 mg/kg DM in
unprocessed seed and about 3,400 mg/kg DM
in soybean meal (White et al., 2000).
Figure 7. L. angustifolius (cv. Gungurru) seed,
kernels and kernel meal (bottom to top)

13
3.1 Use of lupins in diets for aquaculture species
The identification and development of
alternatives to fishmeal use in aquaculture
diets is a high priority for improving the
sustainability of aquaculture. Presently,
modern intensive aquaculture is still a net fish
user rather than producer (New and Csavas,
1993; Tacon, 1996). This practice questions
both the reliability of aquaculture as a food
provider, and also the long-term sustainability
of these industries. To improve reliability, one
option has been to increase the use of
alternative terrestrially derived, non-food grade
protein resources in intensive aquaculture
diets.
A range of alternative protein resources from
various sources have been identified and
evaluated. While many of these resources are
good, viable options for reducing fishmeal use
in aquaculture diets, there are some concerns
over the risks associated with using some
resources, such as the potential for
transmission of disease, the use of genetically
modified organisms as feed ingredients and
the environmental impacts associated with the
use of particular ingredients.
Lupins are one of several plant protein
resources that have been shown to provide
sound nutritional value to a range of
aquaculture species. As with many
ingredients, these feed resources have their
strengths and weaknesses. In comparison to
other plant protein resources, the potential of
lupins is equaled perhaps only by soybean
meals, which are presently widely accepted
and used in the aquaculture feeds sector.
While there are many similarities in the way
that aquaculture species deal with lupins,
when they have been included in their diet,
there are specific nuances with each
aquaculture species and each lupin variety
that influence the relative value of lupins as a
feed ingredient in the aquaculture sector. The
remainder of this review examines these
differences on a species by species basis.
Figure 8. Red seabream have shown good capacity to use lupin meals in their diet.

14
3.2 Defining the value of lupins to aquaculture species
There are several key facets to determining or
placing a nutritional or biological value on a
feed ingredient. Principal to this is defining the
amount of nutrients that an animal can obtain
from a particular substance through its
digestive processes. For an animal to obtain
value from any particular substance or
ingredient, the level of protein and energy
derivation from that ingredient needs to be
defined. Only when these key parameters
have been defined can the true value of an
ingredient to an animal be determined.
3.2.1 Assessment of nutritional value
As previously mentioned, the key to the
assessment of any new feed meal is the
determination of its relative nutritional value.
Typically this has been determined through
digestibility studies, particularly those adopting
either ingredient substitution or reference diet
substitution methods (Cho, 1991; Aksnes et
al., 1996; 1998; Sugiura et al., 1998; Kaushik,
1998b). In this style of study an ingredient is
substituted into a reference diet either as a
replacement of a proportional part of the total
composition of the diet (diet substitution
method), or where it replaces the inclusion of a
specific, well calibrated, homogeneous
ingredient such as vitamin-free casein or
enzymatically hydrolysed casein, which is also
included in a reference diet. The diets are then
fed to the test animals and faeces collected.
The method of faecal collection varies
considerably, and there is some debate on the
most valid method (Aksnes et al., 1996; 1998;
Allan et al., 2000).
A secondary way by which many feed
ingredients and/or diets are now being
evaluated is by in vitro assessment methods
(Robaina et al., 1995; Carter et al., 1999;
Alarcon et al., 1999). In vitro assessment
provides opportunities for increasing the range
and number of samples examined, by
significantly reducing the cost of assessment
relative to the in vivo techniques. The key to
the in vitro analysis techniques has been the
assessment of protease activity or inhibition
thereof, in a controlled simulated digestive
environment. A range of methods has been
developed, with a similar range of efficacies.
The specific relevance of such assays is also
open to conjecture, with mixed conclusions on
the comparison of in vitro with in vivo data
(Robaina et al., 1995; Carter et al., 1999;
Alarcon et al., 1999).
An increasing amount of modern aquaculture
feeds are now being formulated on a digestible
protein and energy basis (Kaushik, 1998a;
Burel et al., 1998; Williams, 1998). This trend
is consistent with the manner in which most
pig diet rations are formulated, but is still not
as technically advanced as modern poultry
rations which are usually formulated based on
the precise requirements for specific amino
acids and the metabolisable energy value of
each of the feed ingredients (Hughes, 1988;
Edwards and van Barneveld, 1998).
The advantages presented by development of
diets on a digestible or metabolisable nutrient
basis are numerous. Not only could there be a
potential cost reduction, but there is also a
potential reduction of waste outputs from
aquaculture (Cho, 1991; Azevedo et al., 1998;
Vielma et al., 2000).
15
In accordance with the importance of defining
the nutritional value of an ingredient on its
value to a particular species, where this
information has been available, it has been
presented preliminary to the remainder of the
information available for each species
examined in this review. This approach has
been undertaken to allow a more objective
assessment by the reader of the relative
merits and meaning of the remaining studies
reported.
3.2.2 Assessment of biological value
Assessment of the biological value of a feed
ingredient differs from that of the nutritional
value in that it also encompasses any
influence an ingredient may have on feed
intake and it also may examine the metabolic
cost of an ingredient for tissue accretion.
There is considerable debate over the most
valuable way in which to determine biological
value of an ingredient, though most involve the
serial inclusion of increasing amounts of the
test ingredient into the animal’s diet. Key
parameters to the assessment of the biological
value focus on growth, often best measured as
a function of either nitrogen or energy
retention by the animal (Kaushik, 1998a;
Medale et al., 1998; Williams, 1998).
One such style of studies are the summit-
dilution style experiments (Allan and Rowland,
1998; Sarac et al., 1998; Williams, 1998). In
these studies, the test ingredients are serially
substituted into a basal reference diet, with a
concomitant series of diets also being
provided, where an inert filler of no nutritional
value is also substituted into diets at similar
inclusion levels. These inert filler diets being
provided as relative negative control
treatments. None of the diets are balanced for
either nitrogen or energy. To avoid dietary
intake compensation for nutritional
inadequacies, the diets in this style of study
are usually fed on a pair-fed restricted basis.
This style of study has merits in that it allows
an objective assessment of the relative value
of the ingredient at a particular inclusion level,
and information on how well that animal
metabolically deals with that ingredient.
Information on how well the ingredient is
assimilated can also be objectively
determined. For studies of this design to be
useful, concomitant trials with another, well
standardised ingredient are also important as
a positive control. Effectively this also allows
referencing of the test ingredient against a
standard of some description. In studies where
this experiment design has been used,
fishmeal has often been used as the reference
ingredient (Allan and Rowland, 1998; Sarac et
al., 1998; Williams, 1998). However, the
summit-dilution methods weakness is that it
does not allow the determination of the
ingredients influence on feed intake, nor the
practical considerations of the influence of the
ingredient in diets of equal nutritional content.
In other studies, the serial inclusion of an
ingredient has been undertaken where the
diets have also been balanced on an iso-
nitrogenous and iso-energetic basis (Robaina
et al., 1995; Burel et al., 1998). Typically, the
diets in these studies have been fed to
apparent satiety or to an approximated daily
ration, thereby allowing the determination of
influences of the ingredients on feed intake
parameters. While this style of study has
potentially more practical value, the inclusion
of a negative control is important to
16
demonstrate that the relative inclusion of a
specific ingredient is actually contributing to
the value of the diet, rather than acting as a
filler in an over specified diet. Unfortunately,
the use of appropriate controls in such studies
has been frequently lacking, in many instances
making interpretation of the ingredient value
from such trials a little more ambiguous.
Despite the limitations to many of the
biological value studies reported, the
published data have in most instances
provided some important information, on the
usefulness of lupins in the diets of aquaculture
species. As such, this has allowed the
assessment of the speculated value of the
included ingredients. Accordingly, information
of this type has been included within this
section on biological value, though the
limitations are discussed where appropriate.
To allow an objective assessment of the
biological value of a diet or ingredient there
are several key parameters that need to be
defined, essential are the nitrogen and energy
retention efficiencies. These two parameters
are often referred to as protein productivity
value (PPV) and energy retention value (ERV)
and are usually expressed as a percentage.
Essentially these parameters define the
relative amount of each nutrient/energy that is
actively derived from a particular diet or
ingredient. The greater the efficiency, the
greater the value being derived. Similarly, the
determination of these parameters from serial
inclusion diets also allows a critical
appreciation of the influence that a particular
ingredient has on the biological value of a diet
(Kaushik 1998a; Medale et al., 1998). Some
recent studies are now also reporting
phosphorus retention efficiencies (Burel et al.,
1998).
A derivation of the nitrogen and energy
retention efficiency parameters is the Apparent
Biological Value (ABV) term. ABV is
determined by expressing the retention
efficiency parameter as a function of the
amount of ingested digestible nutrient or
energy. In the case of nitrogen/protein, this
would therefore be determined by calculating
the retention of nitrogen as a function of total
digestible nitrogen consumed. The ABV value
in this essence is a more technically accurate
way of assessing the true biological value of
an ingredient to the growth of an animal.
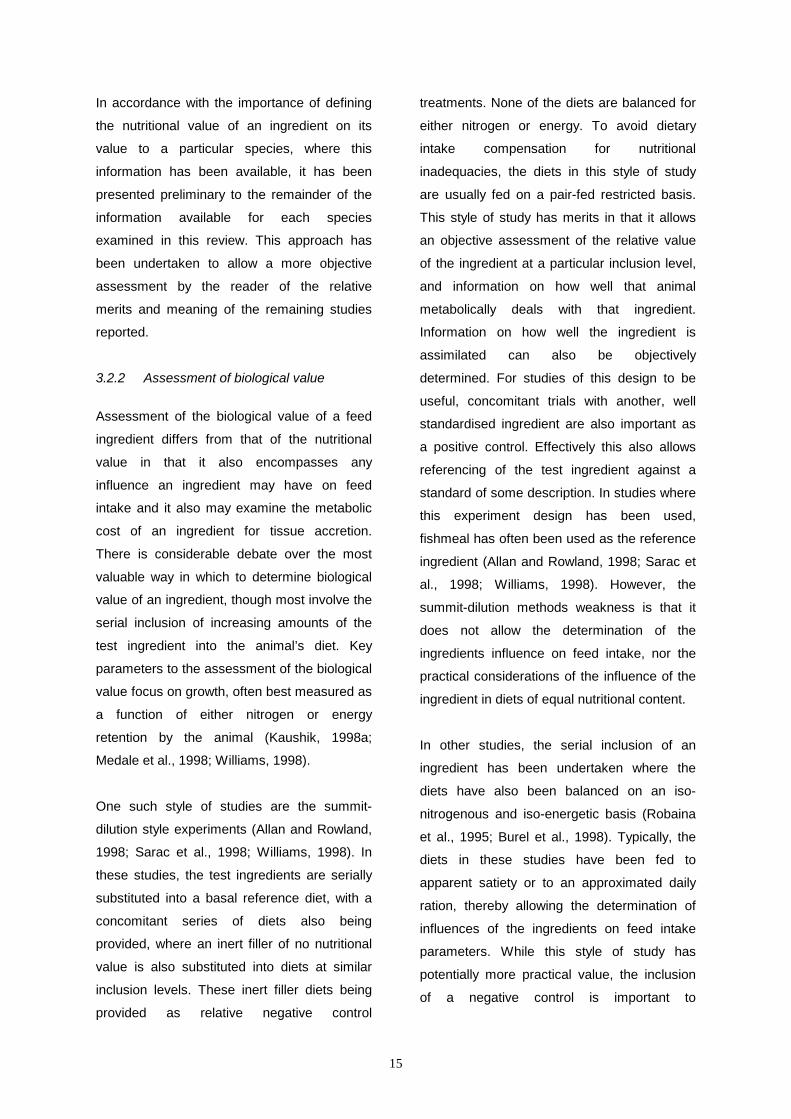
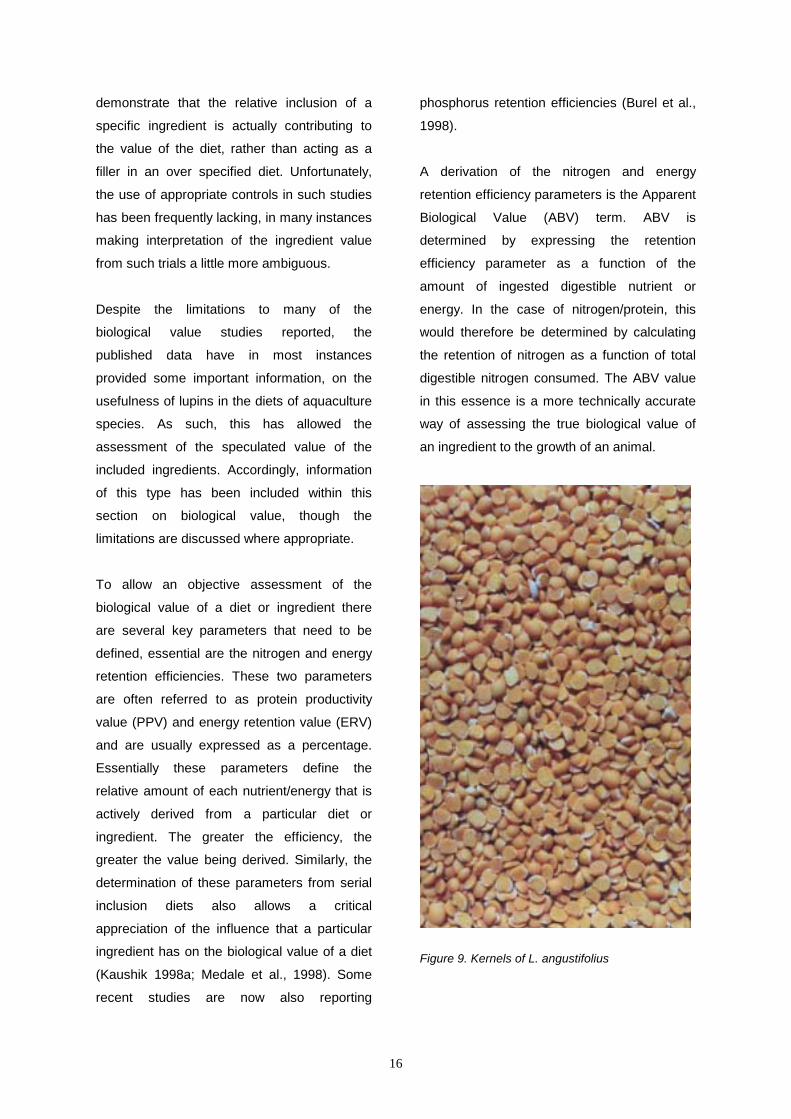
Figure 9. Kernels of L. angustifolius

17
4.1 Salmonids
Salmonids have been the most extensively
studied aquaculture species for both nutritional
research in general and the usefulness of
lupins to an aquaculture species. Generally,
the rainbow trout (Oncorhynchus mykiss) has
been the primary species studied, though a
growing volume of work has also been
reported with the Atlantic salmon (Salmo
salar).
4.1.1 Rainbow trout There are few studies that have implicitly
studied the nutritional value of lupins to
rainbow trout. The earliest reported study, was
that by Hughes (1988) who examined the
nutritional value of L. albus whole-seed meal.
In this study the apparent digestibility of
protein was reported at 85.2%, and was
reportedly higher than that of full-fat soybean
meal (79.5%). Apparent energy digestibility of
the L. albus whole-seed meal was 64.0% and
was reportedly lower than that of the full-fat
soybean meal (74.7%). The differences in
digestible energy were attributed to the 61
g/kg DM higher level of lipid in the full-fat
soybean meal. Similarly the metabolisable
energy of the full-fat soybean meal (3998
kcal/kg DM) was also higher than that of the L.
albus whole-seed meal (2981 ± 135 kcal/kg
DM), though this too is probably reflective of
the considerably higher lipid levels of the full-
fat soybean meal.
A subsequent, and more thorough study by
Morales et al. (1994) examined the apparent
digestibility characteristics of a range of
ingredients when fed to rainbow trout. The
diets in this study were formulated to include
L. albus meal (cultivar or processing state not
identified), corn gluten meal, casein and
cottonseed meal at 40% of the total dietary
protein as partial replacements for the
fishmeal portion of iso-nitrogenous and iso-
energetic diets. Additional diets in this study
included a reference diet with fishmeal as the
only protein resource, and another reference
diet with casein as the only protein resource.
The inclusion of fishmeal as the only protein
resource in the reference diet allows specific
assessment of the nutritional value of the
protein content of each of the test diets and
their ingredients as used in this study. The key
importance of the 100% casein diet is that it
should allow identification of endogenous
protein losses by the trout fed this diet.
Furthermore, the evaluation of the digestibility
of the diet where casein was included as 40%
of the total protein also allows some relative
estimates of the true protein digestibilities of
each of the test ingredients.
Assessment of the apparent digestible
characteristics of each of the diets revealed
that the apparent digestible dry matter of the
lupin diet was lowest, as was the apparent
digestibility of its organic matter and energy
content. It is suspected that these
observations are reflective of the relatively
high levels of non-starch polysaccharides in
the L. albus meal. Indeed evaluation of the
digestibilities of the NFE and carbohydrate
contents of the diet clearly support this, with
the lupins having the lowest NFE and
carbohydrate apparent digestibilites of all the
ingredients evaluated in this study, by a
considerable margin.

18
The apparent protein digestibility of the lupin
diet was higher than that of the cottonseed
meal diet, but not as high as that of the corn
gluten meal diet. It was though very
comparable to the apparent protein digestibility
of the fishmeal based reference diet (Table
4.1). The diet with the highest apparent protein
digestibility was the 100% casein diet (~97%).
The 40% casein diet also had a high apparent
protein digestibility, though notably it was
about the same as that of the corn gluten meal
diet (Table 4.1). Based on the determined
digestibility value of the fishmeal protein it was
calculated that the casein and corn gluten had
apparent protein digestibilties of about 97%
with the next highest being the L. albus meal
(85%), which was slightly higher than that of
the fishmeal (84%).
Table 4.1 Apparent digestibility (%) of key dietary nutrients from diets based on a range of protein
resources fed to rainbow trout. Data derived from Morales et al. (1994). Full details of diet
composition and growth performance detailed in subsequent sections.
Fishmeal CA100% CA40% CO LU CG
Dry matter digestibility (%) 66.9 71.3 68.5 58.9 53.1 67.6
Organic matter digestibility (%) 73.2 72.8 74.4 64.7 56.3 71.8
Protein digestibility (%) 83.6 97.2 88.3 81.2 85.2 88.9
Energy digestibility (%) 74.3 77.8 77.4 68.7 62.7 75.6
Fat digestibility (%) 88.0 93.6 93.6 93.4 88.7 91.4
NFE digestibility (%) 54.5 41.4 53.9 35.5 11.7 44.8
Carbohydrate digestibility (%) 65.0 64.9 65.0 53.3 15.8 60.5
CA100%: Casein 100% of total protein diet, CA40%: Casein 40% of total protein diet, CO: Cottonseed meal diet, LU: Lupin meal diet, CG: Corn gluten meal diet
Gomes et al. (1995) also evaluated the
nutritional value of a suite of plant protein
meals in rainbow trout. Included in this study
were a range of plant legume meals, including
L. angustifolius whole-seed meal, pea (Pisum
sativum) seed meal, faba bean (Vicia faba)
meal, full-fat toasted soybean meal and full-fat
micronised soybean meal (Table 4.2). A range
of other cereal, marine and animal meals were
also included. Of the plant legume protein
meals, full-fat micronised soybean meal had
the highest apparent dry matter digestibility
(86.4%) and L. angustifolius seed meal the
lowest (63.3%). The apparent dry matter
digestibility values of pea seed meal (66.6%)
and faba bean meal (66.1%), were similar to
that of and L. angustifolius seed meal.
Apparent protein digestibility of the legume
meals was also highest in full-fat micronised
soybean meal (96.3%) and the lowest faba
bean meal (80.2%). The apparent protein
digestibility of L. angustifolius seed meal was
the highest of the unprocessed whole-seed
meals (85.5%). No significant differences were
evident between the three whole-seed legume
meals, though the soybean meals had
significantly higher protein digestibilities.

22
The apparent energy digestibilities of the plant
legume meals ranged from 59.2% to 90.7%.
The highest was that of the full-fat micronised
soybean meal (90.7%) and the lowest that of
the pea seed meal (59.2%). The apparent
energy digestibility of the L. angustifolius seed
meal was similar to the other whole-seed
legume meals (61.2%). No significant
differences were evident between the three
whole-seed legume meals, though the
soybean meals had significantly higher
apparent energy digestibilities. The marked
difference between the soybean meals and
that of the other legume meals clearly
demonstrates the value of processing the
seeds from these plants to improve their
nutritive value to fish. Though notably the
cooking (toasting) of the meals significantly
reduces the protein value of the meal (Table
4.2).
This study in particular is interesting in that it is
one of the few accounts where the nutritive
value of the protein in a lupin (notably the
whole-seed meal in this case) has been shown
to be less than that of the soybean meals also
used in the same study.
Table 4.2 Digestibility values of a range of protein resources, including L. angustifolius whole-seed meal,
fed to rainbow trout. Data derived from Gomes et al. (1995).
Dry matter digestibility (%)
Protein digestibility (%)
Energy digestibility (%)
Fishmeal 78.0 86.6 69.7
L. angustifolius whole seed meal 63.3 85.5 61.2
Full-fat toasted soybean meal 75.4 86.4 80.2
Full-fat micronised soybean meal 86.6 96.3 90.7
Faba bean meal 66.1 80.2 60.2
Pea seed meal 66.6 80.4 59.2
Maize gluten 90.7 95.3 91.8
Co-extruded pea and canola meal 89.6 94.5 87.2
Meat meal 94.1 90.8 92.1
The most comprehensive account examining
the nutritive value of a lupin meal to rainbow
trout would be that reported by Burel et al.
(2000a) who examined the value of extruded
L. albus kernels, extruded peas and both
solvent and heat-treated rapeseed (Brassica
sp.) meals. The apparent digestible dry matter,
protein (as N x 6.25), energy and phosphorus
of these ingredients were studied using the
diet substitution assessment method (Aksnes
et al., 1996). Key findings from the work of
Burel et al. (2000a) was the significantly higher
protein digestibility of L. albus kernel meal in
comparison to the pea and rapeseed meals. In
addition, the energy digestibility of the L. albus
kernel meal was also significantly higher than

23
that of pea meal, though not that of either of
the rapeseed meals. In most cases, the
relative digestibility of the energy of each of
the ingredients was a direct response to the
protein content of the ingredient and the
relative protein digestibility of that ingredient.
Low levels of starch in both the L. albus kernel
and rapeseed meals support that limited
dietary energy would be obtained from
carbohydrates in these ingredients, with the
majority of the energetic value being derived
from their protein content. However the 100
g/kg level of lipid in the L. albus kernel meal
probably also provided considerable digestible
energetic value.
Also of note was the significantly higher
phosphorus digestibility of the L. albus kernel
meal in comparison to both the pea and
rapeseed meals (Table 4.3). The higher
phosphorus digestibilities are of particular note
in this species, given the predominance of its
culture in freshwater systems where
phosphorus is often perceived as a
undesirable waste nutrient (Ervik et al., 1997;
Elberizon and Kelly, 1998). While the data of
Burel et al. (2000) provides a good foundation
for the further assessment of the phosphorus
output reduction potential of some meal types,
the determination of retention values for both
phosphorus and nitrogen would have added to
the value of these findings. This would have
allowed the subsequent capacity to determine
nutrient waste budgets on an ingredient
specific basis.
There were no significant differences in the dry
matter digestibilities of any of the ingredients
in this study (Table 4.3).
Table 4.3 Proximal composition and nutritional value of various plant meals to fed rainbow trout. Data derived
from Burel et al. (2000).
Extruded peas Extruded L. albus SE-Rapeseed HT-Rapeseed
Ingredient Proximate Composition
Dry matter (g/kg) 909 928 937 915
Crude protein (g/kg DM) 260 434 431 433
Crude fat (g/kg DM) 4.5 100 48 9
Ash (g/kg DM) 33 46 79 82
NFE (g/kg DM) 612 348 379 391
Phosphorus (g/kg DM) 4.4 5.4 14.9 15.6
Nutrient Apparent Digestibility
Dry matter (%) 66.3 69.7 70.8 66.6
Protein (%) 87.9 96.2 90.9 88.5
Energy (%) 68.9 77.0 76.4 70.0
Phosphorus (%) 42.6 61.9 26.4 41.8
SE-Rapeseed: Solvent Extracted Rapeseed meal. HT-Rapeseed: Heat Treated Rapeseed meal.

24
In the initial work on lupins by Hughes (1988),
the biological value of whole-seed L. albus
meal (CP: 380 g/kg DM, CF: 131 g/kg DM;
cultivar not stated) was also compared against
full-fat soybean meal as a feed ingredient for
rainbow trout (Table 4.4). The study used
either of two basal diet formulations, with the
first experimental diet based primarily on
fishmeal, with some soybean meal and the
second primarily on full-fat soybean meal.
In the first experiment, utilising the fishmeal
based diet, L. albus whole-seed meal was
substituted for the full-fat soybean meal
included in the formulation at 85 g/kg (level of
diet DM not defined). After a 14-week feeding
study, fish increased from 2.4 g initial weight to
18.9 g final weight in both treatments. Feed
conversion in both cases was 1.18:1 and
1.20:1 for full-fat soybean meal and L. albus
whole-seed meal respectively (Table 4.4).
In the second experiment, the diet based
primarily on full-fat soybean meal was altered
with the substitution of L. albus whole-seed
meal, for all of the 400 g/kg inclusion level of
full-fat soybean meal. In this experiment, the
fish increased in weight from 2.4 g to 16.6 ±
0.2 g when fed the full-fat soybean meal diet,
and 17.4 ± 0.9 g when fed the L. albus whole-
seed meal diet. Differences in growth were not
significantly different. However, feed
conversion by fish fed the L. albus whole-seed
meal diet was slightly better than that reported
for the full-fat soybean meal diet (Table 4.4).
The results from this study supported either
equal nutritional value of both grain resources
at either inclusion level, or gross over-
specification of the original basal diet. No
indication was given of the gross nutritional
specifications of any of the experimental diets,
nor were there any negative controls in this
study, these limitations preventing any further
critical evaluation of the outcomes of this work.
In a subsequent study, Hughes (1991) also
reported the influence of removing the seed
coat of L. albus grain (L. albus CP: estimated
at 39%, cultivar not defined). In this second
study, a diet based on full-fat soybean meal
was compared against four other diets, two
each containing either L. albus whole-seed or
the kernel meal (Table 4.5). In this study
Hughes (1991) also added soybean oil to one
each of the treatments examining either L.
albus whole-seed or kernel meal, in an attempt
to balance the dietary energy content between
the diets. Diets were formulated to be
approximately iso-nitrogenous though marked
energetic differences were present between
those diets with and without the supplemented
soybean oil. The full-fat soybean meal diet
was of an equivalent energetic value to the L.
albus whole-seed and kernel meal diets with
the supplemental soybean oil.
Growth data provided good support for the
value of removing the seed coat of lupins to
improve their biological value. Fish fed either
of the L. albus kernel meal diets outperformed
all other treatments, including the full-fat
soybean meal diet fed trout, with both superior
growth rates and FCR values (Table 4.5).
Retrospectively, this result is not surprising
given that the diets were formulated to be iso-
nitrogenous on a gross basis only. Digestibility
data from Hughes’ (1988) earlier study

25
supported that a markedly higher apparent
digestibility for protein from the L. albus whole-
seed meal over that of soybean meal, would
have meant that a greater amount of protein
would have been available to the fish from
those diets. This observation may also
possibly indicate that the diets for these fish
may have been under-specified for protein
and/or energy. As with this researcher’s earlier
work (Hughes 1988), this problem could have
been averted by the inclusion of single
negative control treatment.
Table 4.4 Utilisation of L. albus whole-seed meal by rainbow trout, when substituted for full-fat soybean
meal in two separate experiments. Data derived from Hughes (1988).
Reference 1 Lupin 1 Reference 2 Lupin 2
Experiment 1 Experiment 2
Ingredients
Fishmeal 340 340 80 80
Soybean meal (full fat) 85 - 400
L. albus whole-seed meal - 85 - 400
Corn gluten 80 80 120 120
Blood meal 55 55 50 50
Brewers yeast 55 55 100 100
Cottonseed meal 112 112 - -
Fish oil 35 35 40 40
Soybean oil 68 79 - 52
Molasses 120 120 - -
Wheat middlings 22 11 122 70
Dried whey - - 60 60
Remains (uniform across treatments) 28 28 28 28
Diet proximate specifications
NOT PROVIDED NOT PROVIDED
Fish performance criteria
Initial weight (g) 2.4 2.5 2.4 2.4
Final weight (g) 18.9 18.9 16.6 17.4
DGC (%/d) 4.42 4.36 4.04 4.17
FCR (g fed / g gain) 1.18 1.20 1.36 1.25

26
Table 4.5 Utilisation of soybean and L. albus whole-seed and kernel meals by rainbow trout. Data derived
from Hughes (1991).
FFSM L35 L35SO L39 L39SO
Diet ingredients (g/kg)
Full-fat soybean meal 400 - - - -
L. albus meal (35% protien) - 400 400 - -
L. albus meal (39% protein) - - - 400 400
Soy oil - - 52 - 52
Wheat middlings 96 96 44 96 44
Remains (uniform across treatments) 504 504 504 504 504
Diet proximate specifications
Crude protein (g/kg DM) 436 415 408 436 424
Crude fat (g/kg DM) 159 101 157 106 154
Gross ash (g/kg DM) 84 79 73 82 75
Gross energy (MJ/kg DM) 22.12 20.79 22.09 20.98 22.09
Fish performance criteria
Initial weight (g) 13.3 13.3 13.3 13.3 13.3
Final weight (g) 36.8 36.1 36.1 37.7 38.6
DGC (%/d) 1.14 1.11 1.11 1.17 1.20
FCR (g fed / g gain) 1.45 1.45 1.46 1.39 1.36
FFSM: full-fat soybean meal diet, L35: L. albus (35% protein, suspected whole-seed meal) diet, L35SO: L. albus (35% protein) meal diet with added soybean-oil, L39: L. albus (39% protein, suspected kernel meal) diet, L39SO: L. albus (39% protein) diet with added soybean-oil
De la Higuera et al. (1988) was also one of the
first to have evaluated the biological value of
L. albus whole-seed meal (cv. Multolupa). In
this study the L. albus whole-seed meal was
either cooked or uncooked before being
included at several inclusion levels in diets fed
to rainbow trout. Each of the diets was
formulated to be iso-nitrogenous and iso-
energetic, though on a gross basis only.
Fish from all of the treatments in which lupins
were included, grew considerably poorer than
those fed the reference diet in this study
(Table 4.6). Relationships between growth and
the inclusion level of either the cooked or
uncooked L. albus whole-seed meal were
poor. Stronger relationships were observed
between growth and gross dietary energy
content. Re-evaluation of the data from this
study based on digestible energy and protein
values would probably clarify the observations
considerably. Nitrogen retention of fish fed to
satiety was uniform (32.2% - 34.5%) from diets
containing uncooked L. albus whole-seed
meal, except at the 40% inclusion level were it
dropped to only 25.1%. Nitrogen retention
from diets including the cooked L. albus
whole-seed meal was generally poorer (26.1%

27
- 28.5%) than that of the uncooked L. albus
whole-seed meal, consistent with possible
heat damage of the protein content (van
Barneveld, 1993). A more uniform allocation
of fish, based on equal initial weights, to
treatments would have also improved this
study.
A notable influence on feed intake by fish fed
the diets containing lupins was observed
relative to the fishmeal based reference diet
(Table 4.6). The response did not appear
proportional to the relative inclusion level of
uncooked L. albus whole-seed meal, though it
was partially related to the inclusion level of
the cooked L. albus whole-seed meal. De la
Higuera et al. (1988) suggested that the
palatability issues may have been influenced
by endogenous alkaloids within the L. albus
whole-seed meal, which were reported at a
concentration of 0.25 g/kg in this paper.
However, a definitive explanation of why the
magnitude of feed intake varied as such was
not given. The variability of feed intake had
considerable impact on the FCR values
observed in this study (Table 4.6).
The apparent digestibilities of each of the diets
were also examined in this study. There were
essentially no differences in apparent protein
digestibility between the reference diet and
any of the diets containing the uncooked L.
albus whole-seed meal (ADN: 81.4% - 82.9%).
Cooking of the L. albus whole-seed meal
reduced the apparent protein digestibility of
the diets, with the apparent protein
digestibilities of the 10% and 20% cooked L.
albus whole-seed meal diets at 75.9% and
73.0% respectively. However, the reduction in
the apparent protein digestibility of the diets
was not consistent with the inclusion level of
cooked L. albus whole-seed meal, with the diet
that containing 30% cooked L. albus whole-
seed meal having an ADN of 84.4%. It was
suggested that these aberrations might have
been influenced by poor fish health, though no
other explanation for the differences was
offered.
Figure 10. Lupins have shown good promise when fed to rainbow trout

28
Table 4.6 Performance of rainbow trout when fed diets including L. albus whole-seed meal. Data derived from De la Higuera et al. (1988).
Uncooked L. albus whole-seed meal Pre-cooked L. albus whole-seed meal
Reference 10% 20% 30% 40% 10% 20% 30% 40%
Diet proximate specifications
Crude protein (g/kg DM) 460 457 455 447 457 453 439 455 445
Crude fat (g/kg DM) 100 99 95 98 87 98 105 91 97
Gross ash (g/kg DM) 126 140 134 127 125 147 140 130 124
Nitrogen Free Extract (g/kg DM) 314 304 316 328 331 302 316 324 334
Gross energy (MJ/kg DM) 20.24 19.95 19.96 20.09 19.95 19.79 19.97 19.94 20.11
Fish performance criteria
Initial weght (g) 46.6 41.9 36.7 43.7 42.9 43.7 50.5 46.2 44.2
Final weight (g) 87.8 76.3 65.7 79.2 66.0 79.6 71.9 66.3 66.6
DGC (%/d) 2.82 2.56 2.37 2.58 1.80 2.60 1.54 1.53 1.72
Feed intake (g/fish/d) 1.73 1.49 1.22 1.47 1.27 1.75 1.36 1.34 1.26
FCR (g fed/g gain) 1.26 1.29 1.26 1.24 1.64 1.46 1.90 2.00 1.68
Nitrogen retention (%) 34.5 34.3 32.2 33.4 24.1 27.8 28.5 26.4 26.1
Protein digestibility (%) 81.6 82.9 81.9 81.4 81.8 75.9 73.0 84.4 81.0

29
A fishmeal replacement study was undertaken
by Moyano et al. (1992), where the fishmeal in
the diet was replaced on a 50%, 70% or 100%
basis, by a range of plant protein resources,
including a lupin meal. The diets in this study
were balanced to maintain the diets on an iso-
energetic and iso-nitrogenous basis. No
negative controls were included to
substantiate the effect of alternative inclusions
on the diets with less than 100% fishmeal
replacement (Table 4.7). No specific details
were given to the lupin species, variety or
even processing form used in the study,
though the ingredient composition data of the
provided suggest that it was probably L. albus
kernel meal.
Growth performance of the fish fed the 50%
fishmeal replacement diets supported that
lupin meal had high-potential as a protein
resource for trout. It could also be implied that
the lupin meal was marginally superior to corn
gluten meal, based on the performance of
trout fed a diet where the 50% replacement of
fishmeal was shared between both lupin meal
and corn gluten meal, relative to the diet
where corn gluten meal was the sole
alternative protein resource (Table 4.7).
The performance of fish fed the diet where a
70% replacement of fishmeal was shared
between both lupin meal and corn gluten meal
suggested that the capacity of these two
protein resources to fully sustain growth was
slightly reduced compared to the diet with
slightly lower lupin and corn gluten meal levels
and with higher fish meal levels. Notably
though, this reduced growth performance was
primarily through a lower feed intake, as a
decline in nutritive value of the diet was not
observed.
Fish fed the 100% fishmeal replacement diets
had considerably poorer performance than the
50% fishmeal replacement diets when fed to
trout. In these diets the performance of trout
was poorest when fed the diet containing lupin
and corn gluten as the sole protein sources.
Though interestingly, the growth data were
inconsistent with the nitrogen retention, protein
efficiency and feed conversion data,
suggesting some aberration in feed
management with the fish in this treatment.
Despite the slightly lower growth of this
treatment, the difference was not significant
from that of any of the other 100% fishmeal
replacement diets, suggesting high levels of
variability within the data.
It was suggested that the poorer performance
of the 100% fishmeal replacement diets was
indicative of anti-nutritive factors present in the
plant protein resources used. Notably, trypsin-
inhibitors and oligosaccharides present in the
soybean meal were suggested, though it was
also noted that the same oligosaccharides
were likely to be present in the lupin meals,
and that physiologically they should be
considered as fibre when fed to these animals.
It was also noted in the study by Moyano et al.
(1992) that the protein digestibility values of
soybean meal and lupin meal differed
considerably, with soybean having a lower
protein digestibility of compared to that of L.
albus kernel meal. It was suggested that this
difference in protein digestibility perhaps
explained the differences in growth observed
between the 50% fishmeal replacement diets
in this study.

30
Table 4.7 Nutritive value of diets with a high inclusion of plant proteins when fed to rainbow trout. Derived
from Moyano et al. (1992).
Reference 50-1 50-2 70 100-1 100-2 100-3
Diet ingredients (g/kg)
Fishmeal 627 314 314 191 - - -
L. albus kernel meal - - 326 266 272 326 -
Soybean meal - - - - 188 - 282
Corn gluten meal - 237 119 208 237 327 327
L-Methionine - - - - 7 6 4
Potato concentrate - 55 - 55 82 82 82
Fish oil - 36 36 45 60 60 60
Corn oil 60 57 15 21 15 12 48
Cellulose 163 164 53 85 - 51 59
Remains (uniform across treatments) 138 138 138 138 138 138 138
Diet proximate specifications
Crude protein (g/kg DM) 480 469 468 467 473 471 469
Crude fat (g/kg DM) 118 119 119 121 117 119 122
Fish performance criteria
Initial weght (g) 30.5 32.8 30.9 31.8 30.3 32.9 30.1
Final weight (g) 49.3 50.5 52.7 51.4 42.6 42.5 42.8
DGC (%/d) 1.81 1.65 2.04 1.83 1.25 0.95 1.29
Feed intake (g/fish/d) 0.45 0.45 0.47 0.44 0.40 0.44 0.39
FCR (g fed/g gain) 1.43 1.47 1.28 1.23 1.72 1.37 1.64
Nitrogen retention (%) 35.8 35.7 30.7 39.3 28.2 35.7 31.0
Protein efficiency ratio (g/g) 1.42 1.45 1.67 1.74 1.22 1.55 1.29

31
The influence of extrusion of L. albus meal
was examined by Bangoula et al. (1993) in
rainbow trout as a means of improving the
nutritional value of the grain. These workers
reported an improvement in the utilisation of
the nitrogen-free extractives (NFE) by rainbow
trout, and suggested that this response was
related to a higher breakdown of cell walls,
potentially allowing better access by digestive
enzymes to nutritionally valuable cell
components. It was also suggested that partial
degradation of the α-galactosides could have
taken place, potentially providing additional
nutritional value. It has been reported that
partial hydrolysis of the α-galactosides does
occur during extrusion at high temperatures
(Melcion, 1987). Though how the extrusion of
lupin meal improved NFE utilisation, but did
not inhibit the protein utilisation was not
discussed.
Morales et al. (1994) evaluated L. albus
(cultivar and processing form not stated) with
comparison to corn gluten, cottonseed meal
and a fishmeal reference diet (Table 4.8). The
diets in this study were generally formulated to
include about half of the dietary protein from
the plant protein resource, with the remainder
being provided by fishmeal. One diet was
formulated where all of the dietary protein was
provided by casein. No negative controls were
included in the trial to substantiate the effects
of alternative inclusions on the diets.
The best growth was observed from fish fed
the L. albus meal-based diet (Table 4.8).
Poorest growth was observed from fish fed the
diet with 100% of the protein provided by
casein. Good growth of fish fed the L. albus
meal diet was attributed to the combined effect
of both superior feed intake and superior feed
conversion, with the highest feed intake
observed with this diet, as well as the lowest
feed conversion ratio. Similarly, the protein
efficiency ratios were also best by fish fed the
L. albus meal -based diet.
The retention of nitrogen by fish fed the L.
albus meal-based diet was, however, the
lowest of all the experimental treatments, as
was the apparent biological value of the diets.
This is interesting given that it contrasts so
markedly with the other performance criteria
(Table 4.8).
Morales et al. (1994) considered that the
better growth of fish fed the L. albus meal-
based diet and the higher content of body fat
on these animals was consistent with highly
efficient energy retention by the fish fed the L.
albus meal-based diets.
Figure 11. Lupins typically have high protein
digestibilities when fed to salmonids.

32
Table 4.8 Replacement of fishmeal by alternative protein resources in diets for rainbow trout. Data derived
from Morales et al. (1994).
Fishmeal CA100% CA40% CO LU CG
Diet ingredients (g/kg)
Fishmeal 593.3 - 356 356 356 356
L. albus kernel meal - - - - 432.1 -
Casein - 454.4 181.8 - - -
Cottonseed meal - - - 316.6 - -
Corn gluten meal - - - - - 234.1
Pregelled starch 200 200 200 109.5 63.8 151
Fish oil 3.2 51.6 22.5 26 26 26
Corn oil 60 60 60 47.3 13 46.2
Cellulose 48.5 139 84.7 49.6 14.1 91.7
Remains (uniform across treatments) 95 95 95 95 95 95
Diet proximate specifications
Crude protein (g/kg DM) 419.1 424.6 426.6 419.6 423.2 425.2
Crude fat (g/kg DM) 108.5 111.6 96 107.1 103.9 113.4
Gross ash (g/kg DM) 151.6 57.5 111.6 131 124.8 110.6
Nitrogen Free Extract (g/kg DM) 261.9 256.1 270.5 232.8 224.9 256.7
Gross energy (MJ/kg DM) 19.55 21.58 20.30 20.05 20.01 20.70
Fish performance criteria
Initial weght (g) 38.53 40.53 40.1 40.48 37.48 38.17
Final weight (g) 88.26 84.59 90.82 94.16 95.12 84.03
DGC (%/d) 3.58 3.18 3.57 3.72 4.06 3.38
Feed intake (g/fish/d) 0.72 0.58 0.69 0.82 0.85 0.65
FCR (g fed/g gain) 1.00 1.17 1.06 0.93 0.92 1.05
Nitrogen retention (%) 42.7 55.2 48.9 44.2 41.8 46.4
Apparent biological value (%) 51.0 56.8 55.3 54.4 49.1 52.1
Protein efficiency ratio (g/g) 2.39 2.75 2.49 2.23 2.16 2.47
CA100%: Casein 100% of total protein diet, CA40%: Casein 40% of total protein diet, CO: Cottonseed meal diet, LU: Lupin meal diet, CG: Corn gluten meal diet

33
Table 4.9 Diet specifications and associated trout performance criteria from fishmeal replacement diets
including L. angustifolius whole-seed meal. Data derived from Gomes et al. (1995).
Reference 33% 66% 100%
Ingredient
Fishmeal 528 405 200 -
L. angustifolius whole seed meal - - 30 25
Full-fat soybean meal - 83 224 324
Faba bean meal - 27 54 69
Pea seed meal - 40 - -
Maize gluten - 132 250 380
Co-extruded pea and canola meal - 9 - -
Meat meal 94 - - -
Dextrin 308 234 172 132
L-Lysine - - 5 10
L-Methionine - - 2 2.5
Remains (uniform across treatments) 70 70 70 70
Proximate composition
Dry matter (g/kg) 925 917 910 907
Crude Protein (g/kg DM) 431 427 447 452
Crude Fat (g/kg DM) 85 89 111 127
Gross Energy (MJ/kg DM) 21.6 22.1 22.7 23.1
Gross Ash (g/kg DM) 124 100 80 47
Digestible protien (g/kg DM) 395 385 387 385
Digestible energy (MJ/kg DM) 19.3 19.0 19.0 19.0
Fish performance
Initial weight (g) 53.5 54.8 55.5 53.9
Final weight (g) 196.5 197.3 197.3 175
DGC (%/d) 3.65 3.61 3.58 3.24
FCR (g fed/g gain) 1.04 1.09 1.01 1.06
Feed intake (g/fish/d) 2.60 2.69 2.40 2.01
Protein efficiency ratio (g/g) 2.24 2.15 2.25 2.18

34
Gomes et al. (1995) also evaluated the
biological value of a range of protein resources
in the diet of rainbow trout. Of key comparative
interest were the values of pea seed meal,
faba bean meal, full-fat toasted soybean meal,
full-fat micronised soybean meal and L.
angustifolius whole-seed meal (cultivar not
identified) (Table 4.9). Although these workers
examined the digestibilities of each of these
grains individually (see earlier sections, Table
4.3) no individual assessments were made of
the ingredients on a biological value basis.
Instead these workers adopted a practical
approach of using a range of resources in
each of the diets in an effort to replace their
fishmeal portions. Three alternative diets, with
progressively reduced amounts of fishmeal
were tested against a reference diet (Table
4.9). Each of the diets was formulated to be
iso-nitrogenous and iso-energetic on a
digestible basis. There were no significant
differences between the reference diet and the
first two diets with 33% and 66% replacement
of the total fishmeal. The L. angustifolius seed
meal comprised only a small component of
each of the 66 and 100% fishmeal
replacement diets.
So although this study does not provide any
direct evidence for the biological value of L.
angustifolius seed meal, it does support the
potential for the use of this ingredient in diets
for rainbow trout. However, the results of this
study did indicate that the fishmeal component
could be replaced using a suite of ingredients,
but that feed intake problems were
encountered with the complete replacement of
the fishmeal.
The most comprehensive work published to
date evaluating lupins with rainbow trout, has
been that by Burel et al. (1998) who conducted
a series of studies examining the inclusion of
L. albus kernel meal in diets for rainbow trout.
The first of these studies evaluated the
inclusion of L. albus kernel meal at 300 g/kg,
500 g/kg and 700 g/kg in diets that were
designed to be iso-nitrogenous and iso-
energetic. Another of the diets evaluated was
a control diet in which no L. albus kernel meal
was added (Table 4.10). The results of this
study identified that L. albus kernel meal could
be included in the diet of rainbow trout to a
level of 500 g/kg with no loss in growth rate
and significantly superior phosphorus
retention. The inclusion of L. albus kernel meal
to 700 g/kg however, resulted in poorer
growth, feed efficiency and nitrogen and
energy retention. Interestingly though,
phosphorus retention improved further still with
the higher inclusion level of L. albus kernel
meal (Table 4.10). The loss in growth
performance of fish fed the diets containing
700 g/kg of L. albus kernel meal was attributed
to low feed intakes of this diet. It was
suggested that high levels of L. albus kernel
meal inclusion resulted in a loss of palatability
of the diet
In a second experiment conducted by Burel et
al. (1998) a further series of diets were
formulated and prepared to examine the high
inclusion levels of L. albus kernel meal. In this
second study three diets contained 700 g/kg of
the L. albus kernel meal, but with some of the
diets also containing either a dietary ingestion
stimulant (Finnstim ) or dietary iodine (Table
4.11). These two additional diets containing
the dietary supplements were included to more

35
clearly define whether the poor growth
observed of the trout fed the 700 g/kg diet in
the first study were the result of poor feed
intake, or metabolic suppression. It was
suggested that the poor growth of fish fed the
700 g/kg diet was possibly a consequence of
suppressed metabolic rate induced by anti-
thyroidal anti-nutritional factors present in the
L. albus kernel meal.
The results of the second study however,
showed no benefit of the inclusion of the
iodine or the feed stimulant, with fish fed any
of the three diets containing 700 g/kg of L.
albus kernel meal having the same level of
growth, feed efficiency and nutrient retention
characteristics (Table 4.11). Of note though,
fish fed any of the three 700 g/kg L. albus
kernel meal diets had significantly poorer
performance attributes (growth, feed utilisation
efficiency and nitrogen retention) than those
fish fed the control diet. This suggested that
the problem encountered in the first study with
poor performance with high inclusion levels of
L. albus kernel meal had still not been
overcome or identified. A third experiment
examined trout fed the control diet, the 500
g/kg and 700 g/kg diets, and a 700 g/kg diet
containing Finnstim . In this study the fish
were allowed to self-regulate their own feed
intake (Table 4.12). However, in this study
considerably different results were obtained to
those observed in the second study.
In the third study no significant differences in
the growth performance of fish fed each of the
treatments was observed, though feed
efficiency deteriorated with increasing
inclusion of L. albus kernel meal, and
deteriorated further again with the inclusion of
Finnstim . Examination of feed intake of the
two 700 g/kg diets showed no benefit from the
inclusion of the Finnstim . However, despite
the deteriorating feed efficiency and energy
retention with increased inclusion of L. albus
kernel meal, considerable improvements in
phosphorus retention of fish fed the diets were
observed.
Figure 12. Both Atlantic salmon and Rainbow trout have been shown to accept lupin meals as a diet ingredient

36
Table 4.10 Influence of inclusion levels of extruded L. albus kernel meals fed to rainbow trout. Data derived
from Burel et al. (1998).
Reference 30% Lupin 50% Lupin 70% Lupin
Diet ingredients (g/kg)
L. albus kernel meal - 300 500 700
Fishmeal 530 350 205 65
Flaked corn 320 205 135 75
Fish oil 90 85 100 100
L-Methionine - - - 2
Remains (uniform across treatments) 60 60 60 60
Diet proximate specifications
Dry matter (g/kg) 940 954 941 943
Crude protein (g/kg DM) 400 409 400 393
Crude fat (g/kg DM) 161 163 185 191
Gross phosphorus (g/kg DM) 15.4 11.8 9 6.4
Gross ash (g/kg DM) 104 84 66 50
Gross energy (MJ/kg DM) 21.4 21.7 22.3 22.6
Fish performance criteria
Initial weight (g) 23.1 23.1 23.1 23.1
Final weight (g) 90.6 108.1 94.2 53.8
DGC (%/d) 2.7 3.1 2.7 1.5
Feed intake (g/d/fish) 1.07 1.33 1.13 0.62
FCR (g fed/ g gain) 1.01 1.01 1.02 1.31
Nitrogen retention (%) 36.0 39.1 37.3 31.6
Phosphorus retention (%) 28.8 37.7 39.9 69.0

37
Table 4.11 Influence of attractants and iodine supplements on high inclusion levels of extruded L. albus
kernel meals fed to rainbow trout. Data derived from Burel et al. (1998).
Reference Control Attractant Iodine
Diet ingredients (g/kg)
L. albus kernel meal - 700 700 700
Fishmeal 480 120 125 115
Pea meal 200 28 13 33
Pregelled starch 150 - - -
Fish oil 110 90 90 90
L-Methionine - 2 2 2
Attractant - - 10 -
Potassium Iodide - - - 65 x 10-5
Remains (uniform across treatments) 60 60 60 60
Diet proximate specifications
Dry matter (g/kg) 866 902 877 871
Crude protein (g/kg DM) 444 449 456 459
Crude fat (g/kg DM) 170 187 185 186
Gross phosphorus (g/kg DM) 14.4 8.7 8.5 8.6
Gross ash (g/kg DM) 101 61 62 61
Gross energy (MJ/kg DM) 21.9 22.8 22.6 22.7
Fish performance criteria
Initial weight (g) 34.0 34.0 34.0 34.0
Final weight (g) 104.2 86.4 89.5 85.3
DGC (%/d) 2.7 2.1 2.3 2.1
Feed intake (g/d/fish) 1.22 1.07 1.09 1.14
FCR (g fed/g gain) 0.86 1.03 1.11 1.25
Nitrogen retention (%) 40.0 29.9 31.0 25.9
Phosphorus retention (%) 22.5 29.5 39.1 43.7

38
Table 4.12 Influence of high inclusion levels of extruded L. albus kernel meals fed to rainbow trout. Data
derived from Burel et al. (1998).
Reference 50% Lupin 70% Lupin 70% + Attractant
Diet ingredients (g/kg)
L. albus kernel meal - 500 700 700
Fishmeal 480 230 120 125
Pea meal 200 60 28 13
Pregelled starch 150 60 - -
Fish oil 110 90 90 90
L-Methionine - - 2 2
Attractant - - - 10
Remains (uniform across treatments) 60 60 60 60
Diet proximate specifications
Dry matter (g/kg) 866 863 902 877
Crude protein (g/kg DM) 444 431 449 456
Crude fat (g/kg DM) 170 175 187 185
Gross phosphorus (g/kg DM) 14.4 10.3 8.7 8.5
Gross ash (g/kg DM) 101 69 61 62
Gross energy (MJ/kg DM) 21.9 22.3 22.8 22.6
Fish performance criteria
Initial weight (g) 27.0 27.0 27.0 27.0
Final weight (g) 79.0 80.0 87.7 84.0
DGC (%/d) 2.2 2.3 2.5 2.4
Feed intake (g/d/fish) 0.72 0.87 1.02 1.02
FCR (g fed/ g gain) 0.87 1.00 1.03 1.11
Nitrogen retention (%) 41.3 37.5 35.8 32.8
Phosphorus retention (%) 22.5 29.5 39.1 43.7

39
An additional aspect to the studies conducted
by Burel et al. (1998) was the examination of
plasma levels of the thyroxine (T4) and tri-
iodothyronine (T3). From the first of the studies
a negative correlation (r2 = 0.85) was observed
between the levels of T4 and the level of L.
albus kernel meal inclusion, suggesting the
presence of goitrogenic compounds. The
influence of L. albus kernel meal inclusion on
T4 though did not extend to T3, with
deiodonase activities demonstrated to have
been sufficient to maintain adequate T3 levels.
In the later studies however, this same effect
was not as evident, with variable levels of T4
observed and growth not directly responsive to
the inclusion level of L. albus kernel meal. It
was subsequently proposed that these
differences were a result of different crop
characteristics, with the first study suspected
to have had problems with low L. albus kernel
meal iodine levels. These were unfortunately
not able to be verified.
4.1.2 Atlantic salmon (Salmo salar)
Carter (1999) undertook a series of studies
evaluating the potential of some plant meals to
replace fishmeal in diets for the Atlantic
salmon as part of Australia’s Fisheries
Research and Development Corporations
Fishmeal Replacement Subprogram. Carter
adopted a slightly different approach to
addressing the use of plant proteins than that
undertaken by other researchers in the
Fishmeal Replacement Subprogram. The
studies from Carter’s project reviewed here
examine primarily the use of supplemental
enzymes, protein concentrates and the
development of in vitro assays.
Carter et al. (1999) developed a series of in
vitro assays to determine the protein/nitrogen
digestibilities of a range of ingredients. These
in vitro assays focussed on the use of either a
commercial enzyme preparation or an enzyme
preparation derived from Atlantic salmon
pyloric caeci. A further assay method based
on the measurement of a pH change was also
investigated. Some of the ingredients were
also evaluated under in vivo conditions,
though the only ingredient of relevance to this
review was the defatted soybean meal.
Several assessments of four plant protein
resources; L. angustifolius whole-seed and
kernel meals and soybean full-fat and defatted
meals, were made using these three assay
systems (Table 4.13). The commercial
enzyme preparation consistently gave the
highest digestibility values, where as the
salmon enzyme preparation consistently gave
the lowest values. The commercial enzyme
preparation also had a slightly stronger
correlation with the in vivo digestibilities than
the other assays used in this study.
Based on the results of the commercial
enzyme assay, the protein digestibility of the
defatted soybean meal was slightly higher
than that of the whole-seed L. angustifolius.
Notably both the full-fat soybean meal and the
L. angustifolius kernel meal had lower
digestibility values again. The implications of
these findings were not discussed.
From the salmon enzyme preparation assay,
most digestibility values were less than 60%,
with the exception of that of the L.
angustifolius kernel meal which had a
digestibility value of 80.2% Notably, the

40
digestibility of the defatted soybean meal was
the lowest at 48.5% contrasting the results
from the commercial enzyme preparation
assay (Table 4.13).
The multi-enzyme pH change assay gave
results in a similar pattern to the salmon
enzyme preparation assay, though the level of
digestibility was generally higher. With this
assay the highest digestibility was observed
with the L. angustifolius kernel meal (85.7%),
similar to that of the salmon enzyme
preparation assay. Protein digestibilities of the
L. angustifolius whole-seed and full-fat
soybean meals were, as with the salmon
enzyme preparation assay, very similar. The
defatted soybean meal again had the lowest
protein digestibility (75.4%).
On average, across all assay methods
employed in this study, the lupin meals had
higher protein digestibility values than both the
soybean and pea meals evaluated (Table
4.13). This higher digestibility of lupin protein
is consistent with other studies on other
species of salmonids (Hughes, 1988; Burel et
al., 1998).
Despite the potential cost-efficiency of
progressing such in vitro assays, the
considerable variation depending on the assay
system used still supports that the use of in
vivo assays is paramount. In this regard,
further evaluation of the nutritional value of
lupin meals in this species, particularly with
reference to soybean meals is clearly needed.
Table 4.13 In vitro digestible value of L. angustifolius and soybean meals fed to Atlantic salmon. Data derived from
Carter et al. (1999).
L. angustifolius Soybean
Whole-seed Kernel meal Full-fat Defatted
Ingredient Proximate Composition
Dry matter (g/kg) - 941 - 942
Crude protein (g/kg DM) - 424 - 496
Apparent Protein Digestibility
Commercial preparation - (%) 91.0 87.3 88.3 93.3
Salmon preparation - (%) 58.2 80.2 57.4 48.5
Multi-enzyme pH change assay - (%) 81.4 85.7 79.2 75.4
In vivo assay – (%) - - - 92.8

41
In a study undertaken by Carter and Hauler
(1999), the biological value of L. angustifolius
(cv. Gungurru) kernel meal was compared
against that of soybean meal and pea protein
concentrate when fed to atlantic salmon. Each
ingredient was included in the diet to constitute
40% of the total dietary protein. Digestibility of
each of the diets was measured following the
collection of faeces using the settlement
collection method of Cho et al. (1982) after
being fed the diets for at least four days.
From this study the highest apparent nitrogen
digestibilities were those observed from the
diets in which pea meal (93.8%) constituted
40% of the dietary protein. Second highest
nitrogen apparent digestibility was of the diet
in which soybean (92.0%) constituted 40% of
the dietary protein. It should be noted though
that the nitrogen apparent digestibility of L.
angustifolius kernel meal (91.3%) was not
significantly lower than either pea meal or
soybean. Apparent energy digestibilties were
highest from salmon fed the soybean diet
(86.4%). Second highest was the pea meal
diet (83.1%) in which the pea meal constituted
40% of the dietary protein. While the diet
containing L. angustifolius kernel meal had the
lowest apparent energy digestibility (80.5%).
This was consistent with the lower protein and
fat levels of this protein resource and the
higher levels of indigestible non-starch
polysaccharides. Of particular note though
were the phosphorus digestibilities. Highest in
this regard was the diet containing the L.
angustifolius kernel meal (46.7%), next highest
was the diet containing the pea meal protein
(41.6%). The diet containing soybean meal
(27.5%) had considerably poorer phosphorus
digestibility than the L. angustifolius kernel
meal, pea meal and even the reference diet
(39.8%).
In this study, paired treatments, in which the
supplemental enzyme phytase was added,
were also examined. In both the soybean meal
(93.4%) and the L. angustifolius diet (94.0%)
treatments with added phytase, significant
improvements in the nitrogen apparent
digestibility were observed over those without
the supplemental enzyme. Similar
observations were not observed with the pea
meal (94.1%). Most notable though was the
influence on the apparent digestibility of
dietary phosphorus. The addition of
supplemental phytase improved the
phosphorus apparent digestibility in all cases,
with the highest phosphorus apparent
digestibility observed in the pea meal diet with
added phytase (57.2%). This was not
significantly higher than that of the lupin meal
diet with added phytase though (55.9%) or
soybean meal diet (49.7%) with added
phytase. In each case, the addition of phytase
significantly improved phosphorus apparent
digestibility of the diet, compared to that of the
unsupplemented diet.
Carter and Hauler (1999) also examined the
biological value of inclusion of the soybean
meal, pea meal and L. angustifolius kernel
meals in the diets. Notable were the higher
nitrogen retention values of fish fed the L.
angustifolius kernel meal diets (52.7%), which
were significantly higher than both that of the
soybean (44.2%) and pea seed meal (46.2%)
diets.

42
Table 4.14 Utilisation of soybean, L. angustifolius kernel meal and pea meal by Atlantic salmon (Salmo
salar). Data derived from Carter and Hauler (1999).
Fishmeal Soybean Lupin Lupin+ phytase
Pea
Diet ingredients
Fishmeal 615.0 369.0 369.0 369.0 369.0
Soybean meal - 357.0 - - -
L. angustifolius kernel meal - - 424.0 424.0 -
Pea meal - - - - 449.0
DL-methionine - 8.5 10.0 10.0 4.0
Fish oil 138.0 154.8 154.8 154.8 154.8
Bentonite 123.3 87.5 19.0 19.9 -
Phytase (IU/kg) - - - 1000.0 -
Remains (uniform across treatments) 23.2 23.2 23.2 22.3 23.2
Diet proximate specifications
Dry matter (g/kg) 940 950 947 945 935
Crude protein (g/kg DM) 429 441 431 433 447
Crude fat (g/kg DM) 217 216 236 236 221
Gross ash (g/kg DM) 229.7 180 109.9 110.7 100.3
Gross energy (MJ/kg DM) 19.03 20.14 21.77 21.71 21.69
Fish performance criteria
Initial weight (g) 34.7 34.7 34.8 35.2 34.8
Final weight (g) 78.9 75.9 78.6 76.2 75.1
DGC (%/d) 1.63 1.54 1.62 1.53 1.52
FCR (g fed / g gain) 1.7 1.7 1.4 1.4 1.6
Feed intake (g / fish / d) 1.11 1.07 0.96 0.87 0.99
Nitrogen retention (%) 44.5 44.2 52.7 55.8 46.2
Apparent Protein Digestibility (%) 90.5 92.0 91.3 94.0 93.8
Apparent Phosphorus Digestibility (%) 39.8 27.5 46.7 55.9 41.6
Apparent Energy Digestibility (%) 91.9 86.4 80.5 81.9 83.1

43
Carter and Hauler (2000) also evaluated the
nutritional value of diets containing a L.
angustifolius (cv. Gungurru) protein
concentrate and compared the nutritional
value of this processed form of the grain
relative to that of defatted soybean meal and a
pea protein concentrate. The three protein
resources were included in diets at either 25%
or 33% replacement of the fishmeal protein
content of the diet (Table 4.15). Apparent
digestibility of each of the diets was measured
following the collection of faeces using the
settlement collection method of Cho et al.
(1982) after being fed the diets for at least four
days.
The highest apparent nitrogen digestibilities
were those observed from the diets in which
the L. angustifolius protein concentrate
replaced 33% of the fishmeal (Table 4.15).
Second highest was the diet in which soybean
replaced 33% of the fishmeal. Pea protein
concentrate had the least influence on the
nitrogen digestibility of the feeds. Apparent
energy digestibilities were also highest with
the diet in which the L. angustifolius protein
concentrate replaced 33% and 25% of the
fishmeal respectively. As with the apparent
nitrogen digestibility, the pea protein
concentrate also had the least influence on the
apparent energy digestibility of the feeds.
Assessment of the biological value of the diets
fed to the juvenile atlantic salmon in Carter
and Hauler’s (2000) study supported that each
diet maintained growth equal to that of the
control/reference diet (Table 4.15). Food
consumption was significantly higher by fish
fed the diet in which 33% of the fishmeal was
replaced by L. angustifolius protein
concentrate. As a consequence of this, the
food conversion of fish fed this treatment was
also significantly poorer than the other
treatments in the study. The 33% replacement
L. angustifolius protein concentrate treatment
also had a significantly poorer nitrogen
retention, at only 30.2%, compared with 41.2%
and 45.1% by fish when fed the soybean meal
and pea protein concentrate respectively.
Interestingly, both the soybean meal and pea
protein concentrate treatments also had
nitrogen retention values slightly higher than
that of the fishmeal control, though only
significantly so for the pea protein concentrate
treatment at 33% replacement of the fishmeal.
The poorer utilisation characteristics of the L.
angustifolius protein concentrate observed in
this study contrasted those from earlier work
by this group (Carter and Hauler, 1999), These
differences were not fully explained, though it
was suggested that the comparatively higher
levels of non-starch polysaccharides in the L.
angustifolius protein concentrate may have
had an influence on its nutritional value.
However, if this was the case then it could also
be reasoned that addition of cellulose to some
of the test diets should have had a similar
effect (Table 4.15). Furthermore, if the levels
of NSP were the key reason for the relative
deterioration in biological value of the diet,
then this should have been more apparent in
the earlier study by this group (Carter and
Hauler, 1999) where a kernel meal, with higher
NSP levels than the concentrate was used.
Notably, in this earlier work, the reverse was
observed, with greater biological value being
attributed to the L. angustifolius kernel meal
than that of either the soybean or pea protein
resources. Also of note from this earlier study

44
was the observation that fish fed diets
containing L. angustifolius kernel meal had
growth and feed conversion parameters equal
to that of both the soybean and pea seed
meals. Also in contrast were the influences of
the L. angustifolius kernel meal on feed intake,
with the protein concentrate inducing greater
feed intakes at its higher inclusion level. The
disparities between the results obtained with
the kernel meal in the earlier study and the
protein concentrate in the later study question
the value of the concentration process to this
commodity when fed to atlantic salmon, or
raise questions on variability in grain quality
attributes.
Based on the results from this study, Carter
and Hauler (2000) supported that extruded
Atlantic salmon feeds could reasonably
contain in excess of 220 g/kg of L.
angustifolius protein concentrate and 270 g/kg
of pea protein concentrate. It was also
suggested that it would be more likely that
such plant protein resources be used in
combinations, rather than as single protein
meals.
Though not studying lupins per se, a notable
study by Arnesen et al. (1989) found that
ethanol-soluble carbohydrates present in
soybean meals had a significant influence on
the utilisation of dietary nutrients by Atlantic
salmon. This work is notable in the context of
lupins in that it presents one of the few
accounts that examines the specific effects to
fish of ethanol-soluble carbohydrates, which
are analogous to oligosaccharides, on the
nutritive value of a plant protein resource. This
study also examined the influence of ethanol-
soluble carbohydrates on rainbow trout, but
found no significant effects on nutrient
utilisation, other than a slightly increased level
of faecal matter output. The contrasting
difference between rainbow trout and atlantic
salmon was not fully explained and it is
unclear as to whether this is a species
difference or a factor attributable to either the
freshwater (rainbow trout) or seawater (atlantic
salmon) mediums used for the study of each
species. However, despite no direct evidence
to suggest so, it is likely that similar such
influences of ethanol-soluble carbohydrates
(oligosaccharides) from lupins may also have
an influence on the utilisation of dietary
nutrients by atlantic salmon and rainbow trout,
particularly at high inclusion levels. This study
highlights the need to examine the specific
nutritional constraints to the use of these
protein resources in the diets of salmonids.
Figure 13. Atlantic salmon, rainbow trout and lupin
seeds, kernels, meals and diets.

45
Table 4.15 Utilisation of soybean, L. angustifolius protein concentrate and pea protein concentrate by Atlantic
salmon (Salmo salar). Data derived from Carter and Hauler (2000).
Control S25 S33 LC25 LC33 PC25 PC33
Diet ingredients
Fishmeal 601 451 400 451 400 451 400
Soybean meal - 204 273 - - - -
L. angustifolius protein concentrate - - - 218 292 - -
Pea protein concentrate - - - - - 206 276
DL-methionine - 3 5 4 6 5 6
Fish oil 155 160 159 157 156 167 169
Bentonite 48 - - - - - -
Cellulose 50 36 17 24 - 43 27
Remains (uniform across treatments) 146 146 146 146 146 128 122
Diet proximate specifications
Dry matter (g/kg) 941 948 943 925 910 927 933
Crude protein (g/kg DM) 419 413 413 425 425 413 406
Crude fat (g/kg DM) 263 258 268 272 260 260 258
Gross ash (g/kg DM) 130 80 80 80 70 70 60
Gross energy (MJ/kg DM) 21.86 22.66 22.94 22.81 22.65 22.76 22.90
Fish performance criteria
Initial weight (g) 46.7 46.4 46.8 46.3 46.4 46.8 46.6
Final weight (g) 113.1 120.7 116.9 114.0 113.9 123.4 118.4
DGC (%/d) 1.96 2.14 2.04 2.00 1.99 2.18 2.08
FCR (g fed / g gain) 1.10 0.96 1.02 1.03 1.28 0.99 0.99
Feed intake (mg DM / g fish / d) 14.6 13.6 13.8 13.8 17.1 14.1 13.6
Nitrogen retention (%) 38.0 41.5 41.2 38.9 30.2 40.9 45.1
Apparent Protein Digestibility (%) 92.7 95.3 95.9 95.6 95.9 95.2 95.5
Apparent Energy Digestibility (%) 87.9 89.0 89.7 91.3 91.8 88.8 89.2
S25 and S33: soybean meal diets with 25% or 33% replacement of fishmeal protein; LC25 and LC33: lupin (L. angustifolius cv. Gungarru) protein concentrate diets with 25% or 33% replacement of fishmeal protein; PC25 and PC33: pea protein concentrate diets with 25% or 33% replacement of fishmeal protein

46
4.2 Seabreams
Perhaps the second best studied of the
aquacultured fish that have been fed lupins,
are the seabreams (including both Sparus
aurata and Pagrus auratus). The results from
the studies reviewed, in which lupins were fed
to seabream, shows that lupin meals and
particularly lupin kernel meals, are a valuable
potential feed ingredient to these animals.
4.2.1 Gilthead seabream Kissil and Lupatsch (2000) made an
assessment of the apparent digestibilities of
protein and energy of L. angustifolius (cv.
Warrah) kernel meal and also a specially bred
line of L. angustifolius (cv. Warrah) kernel
meal (WT) with higher levels of methionine.
Fishmeal was also evaluated for reference
basis. Diets were prepared and fed to 300 g to
400 g gilthead seabream (Sparus auratus).
Faeces were collected using stripping
techniques.
These workers found that protein from both
sources was highly available (>91%). Energy
digestibilities of the kernel meals differed
considerably, with the WT L. angustifolius
kernel meal (61.7%) showing an energy
digestibility substantially higher than that of the
Warrah kernel meal (53.6%) (Table 4.16).
Table 4.16 Digestibility of a cultivar of L. angustifolius kernel meal and new experimental line, high in
methionine, when fed to the gilthead seabream. Data from Kissil and Lupatsch (2000).
L. angustifolius kernel meal Fishmeal
cv. Warrah line WT
Ingredient proximate specifications
Dry matter (g/kg) 948 942 930
Crude protein (g/kg DM) 367 431 652
Crude fat (g/kg DM) 78 99 112
Ash (g/kg DM) 37 36 200
Nitrogen-free extractives (g/kg DM) 247 254 0
Methionine (g/kg DM) 2.5 5.1 19.5
Gross energy (MJ/kg DM) 18 19 20
Nutrient Apparent Digestibility Coefficients
Protein (%) 91.9 93.9 82.1
Energy (%) 53.6 61.7 80.4

47
The earliest of the studies examining the value
of lupins to a seabream species was that by
Robaina et al. (1995). Though not studying
specifically the nutritional value of the
ingredients per se, these workers reported the
digestible protein and lipid values of diets fed
to juvenile (72 g initial weight) sea bream
(Sparus auratus). The diets in the study
contained incremented levels (10%, 20% or
30%) of either soybean meal or L.
angustifolius whole-seed meal (cultivar used
not detailed) (Table 4.17). Proximate
specifications for either ingredient were not
detailed. However, based on the comparative
levels of oils added to the soybean test diets, it
is likely that defatted-soybean meal was used.
Prior to incorporation of the grain meals, these
workers also examined the solubility and
trypsin inhibitor activity of the soybean meal to
ensure it had been heat-treated and soaked
the lupin seeds in water for 24 h in an attempt
to remove excess alkaloids.
Assessment of the nutritional value of the diets
was made on a comparative basis only, as
diets were not designed to directly determine
the discrete nutritional value of the ingredients.
The diets containing 30% of either meal had
apparent protein digestibilities of 87.6% and
93.0% for soybean meal and L. angustifolius
whole-seed meal respectively (it was
suggested that this would approximate to a
difference in ingredient apparent protein
digestibilities close to 10% in favour of the L.
angustifolius whole-seed meal).
As part of the same study, Robaina et al.
(1995) examined the trypsin activity of fish
from each of the treatments and interestingly
observed higher levels of trypsin activity from
fish fed the soybean meal diets than those fed
the L. angustifolius whole-seed meal. It was
also noted that a trend was consistent with the
inclusion level of the L. angustifolius whole-
seed meal and the trypsin activity.
Furthermore, these workers also commented
on the observation that the trypsin activity
levels were not consistent with the levels of in
vivo digestion determined for each of the diets.
These workers (Robaina et al., 1995) also
studied the comparative biological value of
both L. angustifolius whole-seed meal and
soybean meal when fed to the sea bream
(Table 4.17). As detailed earlier, the diets were
formulated to contain incremented levels
(10%, 20% or 30% of the diet) of either the
soybean or L. angustifolius whole-seed meals.
Diets were also formulated to approximately
iso-nitrogenous and iso-lipidic on an as-fed
basis. The diets were fed four times daily to
juvenile (~ 40 g mean initial weight) sea bream
for a ten week period.
After ten weeks, sea bream fed the 10%
soybean meal diet had gained the most
weight, being significantly greater than all
other treatments excepting the 30% L.
angustifolius whole-seed meal diet and the
20% soybean meal diet (Table 4.17). When
growth performance was examined as a daily
growth coefficient, a trend was observed in
both groups of treatments, with decreasing
growth performance seen with increasing
levels of inclusion of either protein resource.
Notably though, performance of fish fed
corresponding diets of 10% lupin or soybean
meal, 20% lupin or soybean meal or 30% lupin
or soybean meal were not significantly
different, suggesting similar biological value of
both meals.

48
Table 4.17 Utilisation of soybean and L. angustifolius whole-seed meals by the gilthead sea bream
(Sparus auratus). Data derived from Robaina et al. (1995).
Control S10 S20 S30 L10 L20 L30
Diet ingredients
Fishmeal 766 690 613 536 690 613 536
Soybean meal - 101 202 302 - - -
L. angustifolius whole seed meal - - - - 115 231 346
Fish oil 60 66 72 78 41 23 4
EPA 42 (enriched fish oils) - - - - 9 17 25
Cellulose 91 60 30 - 62 33 4
Remains (uniform across treatments) 83 83 83 83 83 83 83
Diet proximate specifications
Dry matter (g/kg) 940 941 913 906 937 922 898
Crude protein (g/kg DM) 593 607 606 612 601 606 589
Crude fat (g/kg DM) 141 135 145 152 134 128 127
Gross ash (g/kg DM) 159 146 131 134 128 130 127
Gross energy (MJ/kg DM) 19.28 20.13 20.22 18.70 17.97 18.19 20.12
Fish performance criteria
Initial weight (g) 38.3 40.3 39.4 37.0 38.5 38.7 39.6
Final weight (g) 60.1 64.5 62.0 56.5 60.3 59.1 61.5
DGC (%/d) 0.91 0.97 0.93 0.84 0.91 0.85 0.90
FCR (g fed / g gain) 1.64 1.59 1.64 1.82 1.59 1.89 1.79
Nitrogen retention (%) 24.9 22.4 19.7 21.9 19.0 24.9 27.7
Apparent Protein Digestibility (%) 92.9 93.6 86.2 87.4 95.5 94.5 93.0
Apparent Lipid Digestibility (%) 92.6 93.2 95.9 97.5 97.2 93.9 95.3
Trypsin activity (mUnits/mg protein) 0.12 0.09 0.15 0.02 0.04 0.01 0.01
S10, S20, S30: Diets containing 10%, 20% or 30% soybean meal respectively. L10, L20, L30: Diets containing 10%, 20% or
30% L. angustifolius whole-seed meal respectively

49
Histological examination of the influence of
each of the diets on glycogen and lipid
deposition showed that fish fed the soybean
meal based diets had an increased amount of
lipid droplets around their pancreatic tissue in
the liver. Eccentrically located cell nuclei were
also observed in the hepatocytes from fish fed
diets containing 20% or 30% of soybean meal.
High levels of hepatocyte vacuolisation and
disorganisation were observed from fish fed
the diet containing 30% soybean meal. It was
suggested that this may have been a symptom
of phosphorus deficiency, with the level of diet
phosphorus availability decreasing with
increasing levels of soybean meal. Soybean
phosphorus is predominant in the form of
phytate and probably, unavailable to the fish.
Minor histological differences were also
observed between fish fed the control diet and
the diets containing the L. angustifolius whole-
seed meal. Some small increases in liver lipid
droplets and some reduction in the amount of
glycogen deposits were observed in fish fed
diets containing the higher inclusion levels of
L. angustifolius whole-seed meal. However, in
comparison to the effects seen with the
inclusion of soybean meal, those from fish fed
the L. angustifolius whole-seed meal diets
were considered minor.
Robaina et al. (1995) also examined the
nitrogen excretion characteristics of fish fed
each of the diets. Most notable were the
differences between the ammonia excretion
characteristics of fish fed the fishmeal based
diet and all of the test diets containing the two
plant protein resources and their respective
incremental inclusion levels. Ammonia
excretion peaked at 6 h post-feeding with fish
fed the plant-protein meal diets, and at 4 h
post-feeding with the control fishmeal based
diet. Total ammonia excretion was also lower
from fish fed the control fishmeal based diet. A
significant negative correlation was also
observed between the amount of ammonia
excreted and the protein digestibility in each of
the diets used in this study. These
observations are consistent with an increased
level of protein metabolism for energy
derivation from the plant-protein meal diets.
One further notable observation was the trend
of an increasing rate of nitrogen retention with
increasing inclusion level of lupin in the diet
(Table 4.17). This observation is also in
accordance with the higher nitrogen/protein
digestibility of these diets.
These workers advocated the high value of L.
angustifolius whole-seed meal as an
ingredient for sea bream, based on the good
acceptance and high protein digestibilities of
the protein resource, and considered the
ingredient at least equal to, if not superior to
soybean meal.
An in vitro examination of a range of protein
resources was also undertaken by Alarcon et
al. (1999) who studied the influence of
endogenous protease inhibition by the various
protein resources. In this study, the stomach
and pyloric caeci of juvenile sea bream
(Sparus auratus) were used to produce
enzyme extracts for in vitro evaluation of each
of the protein resources. Samples were
incubated at 25°C for fixed time intervals with
a standardised amount of protease. At the end
of the time interval the reaction was stopped
and the remaining protein measured. The first
experiment by these workers identified
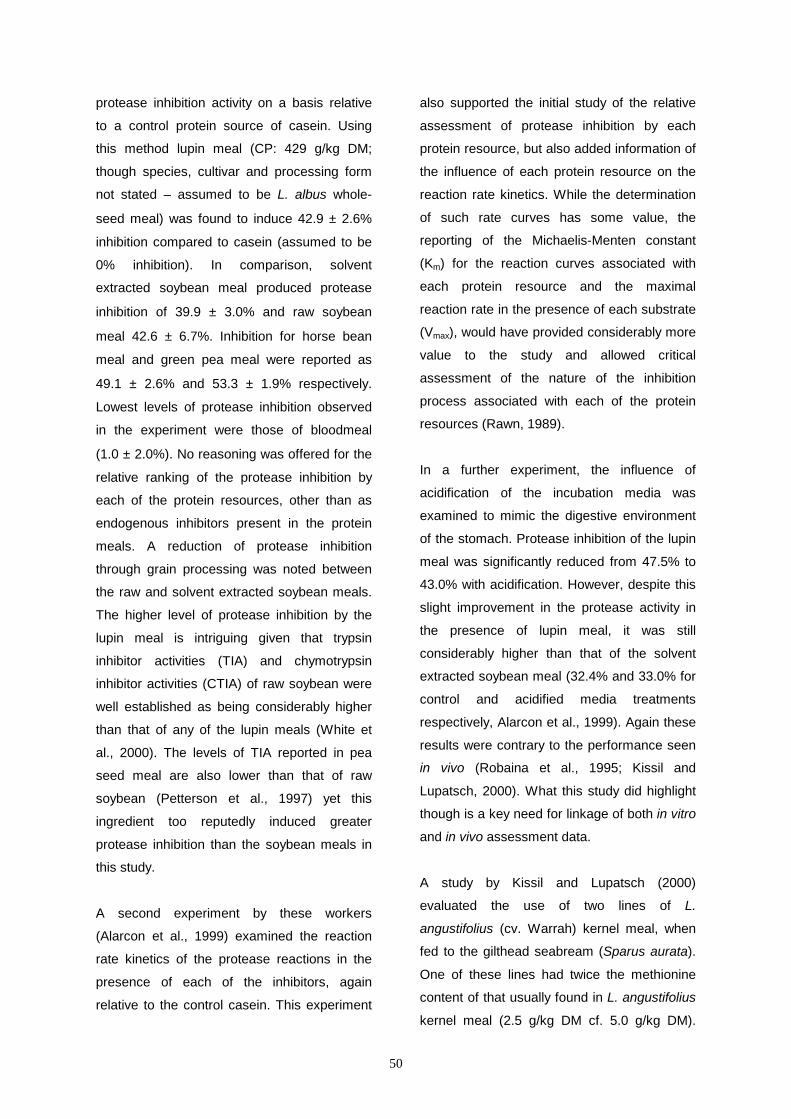
50
protease inhibition activity on a basis relative
to a control protein source of casein. Using
this method lupin meal (CP: 429 g/kg DM;
though species, cultivar and processing form
not stated – assumed to be L. albus whole-
seed meal) was found to induce 42.9 ± 2.6%
inhibition compared to casein (assumed to be
0% inhibition). In comparison, solvent
extracted soybean meal produced protease
inhibition of 39.9 ± 3.0% and raw soybean
meal 42.6 ± 6.7%. Inhibition for horse bean
meal and green pea meal were reported as
49.1 ± 2.6% and 53.3 ± 1.9% respectively.
Lowest levels of protease inhibition observed
in the experiment were those of bloodmeal
(1.0 ± 2.0%). No reasoning was offered for the
relative ranking of the protease inhibition by
each of the protein resources, other than as
endogenous inhibitors present in the protein
meals. A reduction of protease inhibition
through grain processing was noted between
the raw and solvent extracted soybean meals.
The higher level of protease inhibition by the
lupin meal is intriguing given that trypsin
inhibitor activities (TIA) and chymotrypsin
inhibitor activities (CTIA) of raw soybean were
well established as being considerably higher
than that of any of the lupin meals (White et
al., 2000). The levels of TIA reported in pea
seed meal are also lower than that of raw
soybean (Petterson et al., 1997) yet this
ingredient too reputedly induced greater
protease inhibition than the soybean meals in
this study.
A second experiment by these workers
(Alarcon et al., 1999) examined the reaction
rate kinetics of the protease reactions in the
presence of each of the inhibitors, again
relative to the control casein. This experiment
also supported the initial study of the relative
assessment of protease inhibition by each
protein resource, but also added information of
the influence of each protein resource on the
reaction rate kinetics. While the determination
of such rate curves has some value, the
reporting of the Michaelis-Menten constant
(Km) for the reaction curves associated with
each protein resource and the maximal
reaction rate in the presence of each substrate
(Vmax), would have provided considerably more
value to the study and allowed critical
assessment of the nature of the inhibition
process associated with each of the protein
resources (Rawn, 1989).
In a further experiment, the influence of
acidification of the incubation media was
examined to mimic the digestive environment
of the stomach. Protease inhibition of the lupin
meal was significantly reduced from 47.5% to
43.0% with acidification. However, despite this
slight improvement in the protease activity in
the presence of lupin meal, it was still
considerably higher than that of the solvent
extracted soybean meal (32.4% and 33.0% for
control and acidified media treatments
respectively, Alarcon et al., 1999). Again these
results were contrary to the performance seen
in vivo (Robaina et al., 1995; Kissil and
Lupatsch, 2000). What this study did highlight
though is a key need for linkage of both in vitro
and in vivo assessment data.
A study by Kissil and Lupatsch (2000)
evaluated the use of two lines of L.
angustifolius (cv. Warrah) kernel meal, when
fed to the gilthead seabream (Sparus aurata).
One of these lines had twice the methionine
content of that usually found in L. angustifolius
kernel meal (2.5 g/kg DM cf. 5.0 g/kg DM).

51
The high methionine line of L. angustifolius
kernel meal was the result of the transgenic
introduction of a sunflower protein gene being
expressed within the lupin seed (Molvig et al.,
1997). The study was designed primarily to
determine the value and potential of this
methionine enriched line of L. angustifolius
(cv. Warrah). Diets were formulated to contain
equal quantities of L. angustifolius kernel meal
and fishmeal. Additional diets were fortified
with crystalline DL-methionine to balance total
dietary methionine content between
treatments. A reference diet based on fishmeal
was also included. All diets were iso-energetic
and iso-nitrogenous on a digestible basis
(Table 4.18).
Growth by gilthead seabream fed the diets
supported that both lines of L. angustifolius
kernel meal had considerable potential to be
used as a protein meal replacing fishmeal in
the diets of this species. However, the addition
of DL-methionine or the use of the methionine
enriched line of L. angustifolius kernel meal
provided no apparent additional benefit (Table
4.18). Feed intakes of fish fed these diets were
also comparable to those observed of fish fed
the reference diet. The observation of these
consistently comparable feed intakes was a
noted benefit of the L. angustifolius kernel
meal diets in reflect to earlier experiences of
the workers with canola and soybean protein
concentrate studies. The nitrogen and energy
retention values observed from fish fed the
diets showed significantly lower nitrogen
retention with the L. angustifolius kernel meal
diets, but slightly higher energy retention.
That no differences were observed between
the L. angustifolius kernel meal diets and the
fishmeal based reference provides good
account of the viability of L. angustifolius
kernel meals in diets for this species.
However, that no differences were observed
between the L. angustifolius kernel meal diets
and those fortified with DL-methionine also
indicates that it is unlikely that this amino acid
was limiting growth in this instance. For
specific value of the additional methionine to
be determined, either in the diets or the L.
angustifolius kernel meals the dietary
methionine must be made to be the first
limiting nutrient in the diets being examined. It
would be of value to determine the responses
of gilthead seabream to diets formulated to
contain slightly less than the optimal level of
digestible protein whilst optimising dietary
digestible energy intake, thereby enforcing
potential amino acid limitations on the growth
of these fish.
Figure 14. Red seabream with L. angustifolius
seeds, kernels and meal

52
Table 4.18 Substitution of L. angustifolius kernel meals for fishmeal in diets for the gilthead sea bream
(Sparus auratus). Data derived from Kissil and Lupatsch, 2000.
Diet 1 Diet 2 Diet 3 Diet 4 Diet 5
Diet ingredients
Fishmeal 700 445 445 445 445
L. angustifolius kernel meal (cv. Warrah) - 445 445 - -
L. angustifolius kernel meal (ln. TG) - - - 445 445
DL-methionine - - 1.5 - 3.0
Wheat meal 190 - - - -
Remains (uniform across treatments) 110 110 110 110 110
Diet proximate specifications
Dry matter (g/kg) 900 893 911 909 909
Crude protein (g/kg DM) 502 502 495 491 459
Crude fat (g/kg DM) 189 197 196 205 186
Nitrogen-free extractives (g/kg DM) 123 137 141 122 115
Gross ash (g/kg DM) 142 110 104 105 95
Gross energy (MJ/kg DM) 22.28 23.29 22.54 22.79 21.24
Total methionine (g/kg DM) 14.6 10.2 11.6 11.2 13.1
Fish performance criteria
Initial weight (g) 27.0 27.4 27.4 27.5 27.3
Final weight (g) 94.8 100.4 96.7 99.0 99.0
DGC (%/d) 2.60 2.72 2.63 2.68 2.69
Feed intake (g/fish/d) 1.11 1.21 1.23 1.23 1.22
FCR (g fed / g gain) 1.41 1.42 1.52 1.48 1.5
Nitrogen retention (%) 33.2 31.9 30.1 29.8 29.8
Energy retention (%) 44.0 48.4 47.1 45.0 44.7

53
4.2.2 Red seabream / Pink Snapper
Another species of the Sparidae family that
has been used to study the nutritional and
biological value of lupins is the red seabream
(Pagrus auratus). The species has previously
been reported using a number of synonyms;
Chrysophrys auratus and C. unicolour in
Australasia; and Pagrus major and C. major in
Indo-China-Japan, and is commonly referred
to as the pink snapper in Australiasia (Paulin,
1990). Independent and reproductively
isolated populations are recognised between
Australasia and Japan, but are now interpreted
as the same species, Pagrus auratus (Paulin,
1990). This species has been used for detailed
examination of the potential for dietary lupin
incorporation in Australia since 1994 (Jenkins
et al., 1994).
Glencross et al. (2002) made an assessment
of the apparent digestibilities of protein (as N x
6.25) and energy of L. angustifolius (cv.
Warrah) kernel meal and also a specially bred
line of L. angustifolius (cv. Warrah) kernel
meal (WT) with higher levels of methionine.
Additional ingredients evaluated included
wheat gluten, and fishmeal (Table 4.19). All
ingredients were evaluated using the diet
substitution assessment method and faeces
collected based on the faecal settlement
method described by Allan et al. (1999).
Table 4.19 Digestibility of a cultivar of L. angustifolius kernel meal and a new line, high in methionine,
when fed to red seabream. Data from Glencross et al. (2002).
L. angustifolius kernel meal Wheat gluten Fishmeal
cv. Warrah line WT
Ingredient proximate specifications
Dry matter (g/kg) 883 897 910 908
Crude protein (g/kg DM) 465 484 838 716
Crude fat (g/kg DM) 55 74 9 96
Ash (g/kg DM) 37 37 8 151
Nitrogen-free extractives (g/kg DM) 452 405 145 38
Methionine (g/kg DM) 3.7 6.1 12.0 20.5
Gross energy (MJ/kg DM) 20.6 21.3 22.6 21.3
Nutrient Apparent Digestibility
Protein 98.7 99.8 102.0 81.3
Energy 56.3 64.0 84.3 87.8

54
These workers found that protein from both L.
angustifolius (cv. Warrah) lines was highly
available (>98%), similar to that of wheat
gluten (100%) and significantly higher than
from fishmeal (87%). Energy digestibilities of
these ingredients for P. auratus differed
considerably, with the high-MET L.
angustifolius kernel meal (64%) showing
energy digestibilities significantly higher than
that of the low-MET L. angustifolius kernel
meal (56%). In comparison wheat gluten and
fishmeal had energy digestibilities of 84% and
88% respectively (Table 4.19).
The higher energy digestibilities of the high
methionine variety of lupin were attributed to
the higher levels of both protein and lipid in
this line of the L. angustifolius Warrah cultivar.
The earliest work examining the use of lupins
in diets for red seabream is that of Jenkins et
al. (1994). In this study whole-seed L.
angustifolius (cv. Gungurru) meal was
substituted into a diet at the expense of
soybean meal. Diets were formulated to be
approximately iso-nitrogenous and iso-
energetic on a crude basis, though no
formulations or proximate details of the diets
were provided. Diets were fed to an equal
approximated ration based on fish size.
Growth of fish in each of the treatments was
essentially the same. Similarly the feed
conversion ratios, though very high, were also
not significantly different. What this trial
suggests is that there was some capacity for
whole-seed L. angustifolius meal to replace
either part or all of the soybean component in
the diets formulated for this trial. However, the
data are of relatively limited value in that an
objective assessment cannot be made of
whether the diets were nutrient limiting, and
therefore whether the growth responses can
really be attributed to the changes to the diet.
Table 4.20 Substitution of L. angustifolius whole-seed meal for soybean meal in the diet for the red sea
bream (Pagrus auratus). Data derived from Jenkins et al. (1994).
Diet 1 Diet 2 Diet 3
Ingredients
L. angustifolius whole-seed meal 280 150 -
Soybean meal (defatted) - 130 200
Fish performance criteria
Initial weight (g) 77.7 77.7 77.6
Final weight (g) 140.8 143.1 141.7
DGC (%/d) 1.67 1.72 1.69
FCR (g fed / g gain) 1.76 1.73 1.81

55
Subsequent work undertaken by Petterson et
al. (1995; 1997; 2000 and unpublished)
evaluated the biological value of a range of
lupin species and cultivars when fed to the red
seabream. Using primarily growth trials as a
means of performance evaluation, these
workers have examined a range of issues from
inclusion rates to processing variables.
One of these reported studies (Petterson et
al., 1999) based the diets for the red
seabream on the reference diet developed in
Australia for this species by Quartararo et al.
(1992). In this study incremented amounts of
whole-seed L. angustifolius (cv. Gungarru)
meal were substituted into the reference diet
at levels from 10% to 50%, at 10% increments
(Table 4.21).
Growth and food conversion by fish fed the
experimental diets was essentially uniform up
to an inclusion level of 40% of whole-seed L.
angustifolius. At 50% inclusion of whole-seed
L. angustifolius both growth and food
conversion deteriorated. Differences in feed
intake were only notable at an inclusion level
of 50% of whole-seed L. angustifolius,
suggesting that the diets were still well
accepted by the fish up to these higher
inclusion levels.
Limiting to the full interpretation of the data
from this study though, is either the balancing
of protein and energy in all of the experimental
diets and/or the inclusion of additional
negative control treatment(s). Without these
controls full assessment on the biological
value of the inclusion of whole-seed L.
angustifolius from this study cannot be made,
other then to assess the influence on feed
intake.
Table 4.21 Substitution of L. angustifolius whole-seed meal into a reference diet for the red sea bream (Pagrus
auratus). Data derived from Petterson et al. (1999). Formulations not provided.
Reference 10% 20% 30% 40% 50%
Diet proximate specifications
Crude protein (g/kg DM) 490 457 443 424 412 388
Crude fat (g/kg DM) 103 108 114 117 123 119
Lysine (g/kg DM) 32 29 27 25 24 22
Methionine + Cystine (g/kg DM) 13 14 13 12 11 9
Fish performance criteria
Initial weight (g) 30.4 30.4 29.9 30.0 29.8 30.5
Final weight (g) 78.3 78.6 77.7 77.6 76.9 73.9
DGC (%/d) 2.41 2.43 2.43 2.41 2.40 2.23
FCR (g fed / g gain) 1.24 1.23 1.24 1.25 1.26 1.37

56
A later study by Petterson et al., (Petterson,
Jenkins and Evans, reviewed in Petterson,
2000) examined the variability of two different
cultivars of L. angustifolius whole-seed meal
(cv. Gungurru and cv. Warrah) and also
compared these meals against kernel meals
and a protein concentrate. The diets were
generally formulated to be iso-nitrogenous and
iso-energetic, with the exception of two
treatments (Table 4.22). These diets were fed
to red seabream to apparent satiety twice daily
for a period of eight weeks.
The results of this study demonstrated that
there was some variability between the
nutritional value of the different cultivars of L.
angustifolius (Table 4.22). While not readily
apparent it is suggested that this difference
may be attributable to differences in digestible
protein and/or energy between the different
cultivars. Evaluation of the kernel meal and
protein concentrate suggested that when
included in the diet on an iso-nitrogenous
basis, then they were at least of equivalent
nutritional value to that observed for the
whole-seed meal.
Figure 15. Red seabream (Pagrus auratus) with (L to R) L. luteus seed, L. angustifolius kernels, L. angustifolius kernel meal and L. angustifolius seeds
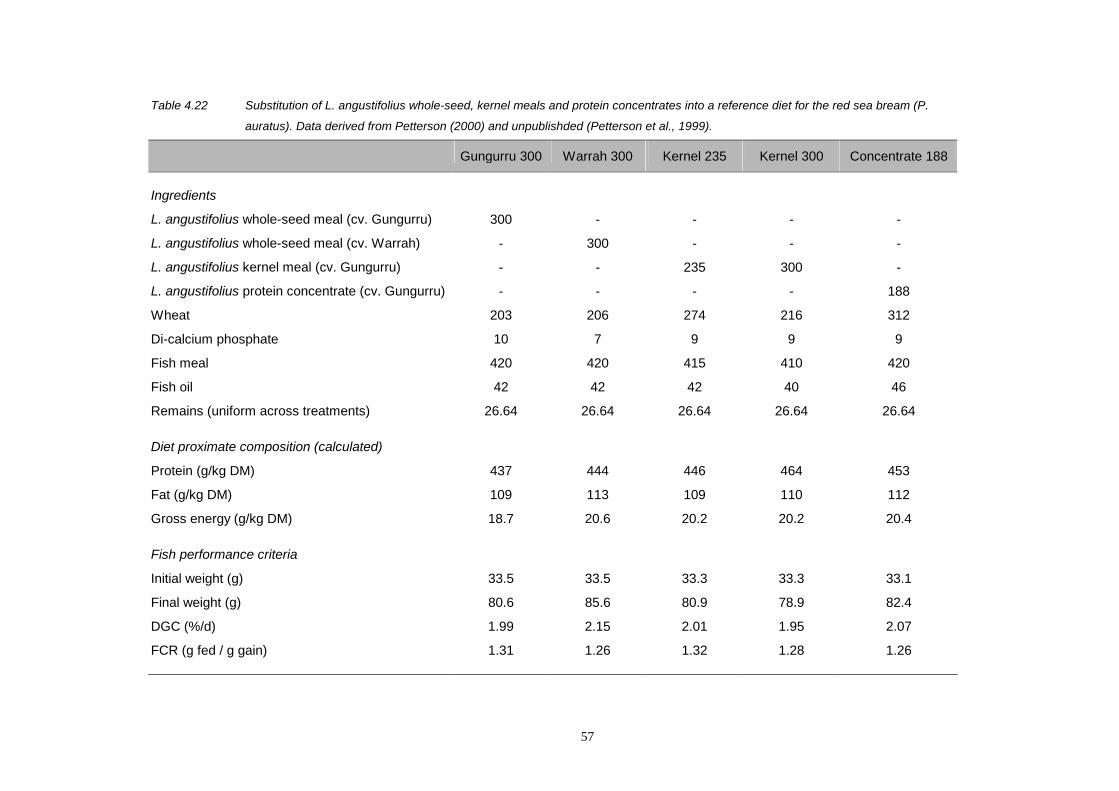
57
Table 4.22 Substitution of L. angustifolius whole-seed, kernel meals and protein concentrates into a reference diet for the red sea bream (P.
auratus). Data derived from Petterson (2000) and unpublishded (Petterson et al., 1999).
Gungurru 300 Warrah 300 Kernel 235 Kernel 300 Concentrate 188
Ingredients
L. angustifolius whole-seed meal (cv. Gungurru) 300 - - - -
L. angustifolius whole-seed meal (cv. Warrah) - 300 - - -
L. angustifolius kernel meal (cv. Gungurru) - - 235 300 -
L. angustifolius protein concentrate (cv. Gungurru) - - - - 188
Wheat 203 206 274 216 312
Di-calcium phosphate 10 7 9 9 9
Fish meal 420 420 415 410 420
Fish oil 42 42 42 40 46
Remains (uniform across treatments) 26.64 26.64 26.64 26.64 26.64
Diet proximate composition (calculated)
Protein (g/kg DM) 437 444 446 464 453
Fat (g/kg DM) 109 113 109 110 112
Gross energy (g/kg DM) 18.7 20.6 20.2 20.2 20.4
Fish performance criteria
Initial weight (g) 33.5 33.5 33.3 33.3 33.1
Final weight (g) 80.6 85.6 80.9 78.9 82.4
DGC (%/d) 1.99 2.15 2.01 1.95 2.07
FCR (g fed / g gain) 1.31 1.26 1.32 1.28 1.26

58
Table 4.23 Evaluation of extrusion processing and L. luteus whole-seed meal inclusion on the performance
of red seabream (P. auratus). Data from Petterson et al. (1998).
Reference 1 Reference 2 Diet 1 Diet 2 Diet 3
Diet processing method Pressed Extruded Pressed Extruded Extruded
Ingredients
L. angustifolius whole-seed meal - - 300 300 -
L. luteus whole-seed meal - - - - 23.5
Diet proximate specifications
Crude protein (g/kg) 485 485 387 387 387
Crude fat (g/kg) 102 102 100 100 102
Methionine (g/kg) 14 14 11 11 11
Fish performance criteria
Initial weight (g) 27.7 27.4 27.6 27.4 27.4
Final weight (g) 64.6 64.5 62.9 66.4 68.2
DGC (%/d) 1.79 1.81 1.74 1.88 1.95
FCR (g fed / g gain) 1.46 1.35 1.66 1.45 1.37
A further study by Petterson et al. (1998)
examined the use of L. luteus whole-seed
meal and also the influence of extrusion
processing, over the use of pellet pressing
(Table 4.23). In this study, the L. angustifolius
whole-seed meal diet was based on the 30%
inclusion diet that was previously identified as
a reasonable inclusion level of this meal. The
L. luteus whole-seed meal diet was formulated
to the same crude protein level as the L.
angustifolius whole-seed meal diets.
Growth and feed conversion by fish fed these
diets demonstrated that extrusion processing
of the feeds improved their utilisation by red
seabream. This influence of processing was
observed on both the reference and L.
angustifolius whole-seed meal diets. This
observation suggests that the improvement
was not related to lupin inclusion per se, but
probably some other common factor to both
diets. It is likely that the extrusion processing
may have promoted the gelatinisation of starch
components of the wheat components
included in the diet, and that this may be
providing additional value to the diets.
The inclusion of L. luteus whole-seed meal in
the diet at a level iso-nitrogenous with that of
the L. angustifolius whole-seed meal diet,
suggested that the protein of the L. luteus
whole-seed meal has at least equal, if not
slightly superior nutritional value to that of L.
angustifolius whole-seed meal. Whether this
facet of the nutritional value of L. luteus is
related to its protein digestibility or just its total
protein content is unknown. However, further
research on L. luteus is certainly warranted.

59
4.3 Silver perch As part of Australia’s Fisheries Research and
Development Corporation’s Fishmeal
Replacement Subprogram, Allan and Rowland
(1998), studying the Australian native
freshwater fish the silver perch (Bidyanus
bidyanus), reported a highly comprehensive
series of studies on the nutritive value of lupins
to this species. In this compendium of work
Allan et al. (1998a; b) examined in detail the
nutritional value of L. angustifolius (cv.
Gungurru) whole-seed and kernel meals and
also that of L. albus (cultivar not defined)
whole-seed and kernel meals.
Initial evaluation of the apparent digestibility
values of whole-seed meals of both L.
angustifolius and L. albus, in conjunction with
a suite of other ingredients, identified that both
of these lupin species have considerable
nutritional potential (Allan et al., 1999). Other
ingredients evaluated included a range of
soybean meals and pea meal (Table 4.24).
This study demonstrated that the whole-seed
meals of both L. angustifolius and L. albus had
substantially lower dry matter and energy
apparent digestibilities than that of the
soybean meals, but that they had equivalent
protein digestibility. In comparison to the pea
meal, L. albus whole-seed meal had
equivalent or superior nutritional attributes and
L. angustifolius whole-seed meal had inferior
dry matter and energy apparent digestibilities,
but superior apparent protein digestibility. The
apparent digestibilities of the two key amino
acids; lysine and methionine differed slightly.
Lysine apparent digestibility in both lupin
species was similar to that observed from the
range of soybean meals, though it was
substantially better than that of the pea meal.
The methionine apparent digestibility, critically
important given the paucity of this amino acid
in lupin meals, was marginally poorer in L.
albus than the soybean meals, but the
methionine apparent digestibility of the L.
angustifolius whole-seed was even poorer still
(Table 4.24).
These results contrast some of the findings
from other species, such as salmonids and
seabreams (see section 4.1 and 4.2), where
the protein digestibility of the lupin whole-seed
meals was substantially higher than that
observed for soybean meals. It is suspected
that the differences may be accounted for by
the different trophic status of the species in
concern, with salmonids and seabreams being
recognised carnivores and silver perch a
recognised omnivore.
In a second, more comprehensive study on
lupin nutritive value, both the whole-seed and
kernel meals of both L. angustifolius and L.
albus were evaluated (Allan et al., 1998a).
Each ingredient was included in test diets at
both 27.7% and 49.5% of the total diet. These
inclusion levels were chosen to represent 30%
and 50% inclusion of the ingredient in the diet
respectively.
The apparent digestibility of protein (measured
as nitrogen x 6.25) was not significantly
influenced by the variety of lupin used in this
study. Similarly, the inclusion level of lupin
also, did not influence the apparent digestibility

60
of protein. The removal of the seed coat
however, did significantly improve the
apparent digestibility of protein of both
varieties of lupins. Although the increase was
significant, the magnitude of the improvement
in apparent protein digestibility was less that
5% in both cases (Table 4.25). These
observations were consistent with very high
levels of apparent protein digestibility in both
lupin species overall.
Both dry matter and energy apparent
digestibilities were significantly affected by the
species of lupin used, whether it was in kernel
meal or whole-seed meal forms and also
whether it was included at 30% or 50% in the
diet (Table 4.25). It was suggested that these
differences were a direct reflection in the
changes of NSP between the whole-seed and
kernel meals, between L. angustifolius and L.
albus species, and that with the increasing
inclusion level of each in the diet, that the NSP
were having a compounded effect on the
nutritive value of the diet.
The apparent digestibility of phosphorus
differed significantly between the L.
angustifolius and L. albus, meals and inclusion
level, but was not affected by processing form
(ie. kernel meal or whole-seed meal forms)
(Table 4.25). This has considerable
implications for development of phosphorus
limiting diets, particularly so given the
observations of Burel et al. (2000a), who
reported the phosphorus digestibility of L.
albus to be considerably superior to many
other plant protein resources. In the study of
Allan et al. (1998a) though, the data clearly
shows the phosphorus utilisation from L.
angustifolius to be significantly superior to that
L. albus (Table 4.25).
Figure 16. Kernels of L. albus and L. angustifolius and L. albus kernel meal.

61
Table 4.24 Digestibility of L. angustifolius and L. albus whole-seed meals, Pea meal and several varieties of soybean meals fed to the silver perch. Data derived from
Allan et al. (1999).
Nutrient L. angustifolius L. albus Field pea (Dunn) Soybean
whole-seed whole-seed whole-seed solvent extr. expeller extr. full-fat
Ingredient Proximate Composition
Protein (g/kg DM) 341 376 255 478 475 358
Fat (g/kg DM) 57 62 11 37 64 195
Ash (g/kg DM) 28 37 34 80 63 55
Nitrogen-free extractives (g/kg DM) 574 525 700 405 398 392
Gross energy (MJ/kg DM) 17.9 20.9 17.0 17.0 20.9 23.3
Lysine (g/kg DM) 14 15 17 33 30 23
Methionine (g/kg DM) 2 3 3 7 8 6
Nutrient Apparent Digestibility
Dry matter 50.3 64.7 62.0 73.1 81.4 74.9
Nitrogen 96.6 96.1 83.3 95.3 97.2 92.1
Energy 59.4 72.7 67.0 81.5 85.2 78.7
Lysine 98.1 96.6 86.3 98.1 97.3 95.3
Methionine 83.9 92.2 87.5 96.4 97.6 95.5

62
Table 4.25 Digestibility of L. angustifolius and L. albus whole and kernel meals at fed at variable inclusion levels to the silver perch. Data derived from Allan et al. (1998a).
Nutrient L.angustifolius L. albus
Whole-seed 30% Whole-seed 50% Kernel 30% Kernel 50% Whole-seed 30% Whole-seed 50% Kernel 30% Kernel 50%
Dry matter 50.3 50.8 67.6 68.9 64.7 59.4 77.8 68.2
Nitrogen 96.6 95.8 100.3 99.9 96.1 97.0 101.4 97.3
Energy 59.4 58.4 74.0 75.0 72.7 67.1 85.2 74.7
Phosphorus 71.8 72.0 80.1 78.0 77.5 67.0 73.8 61.0
Lysine 98.1 96.8 99.5 99.7 96.6 98.4 102.5 98.5
Methionine 83.9 95.5 91.7 96.4 92.2 94.5 97.3 97.3
Proximate compositions of the ingredients is provided in Table 4.24.
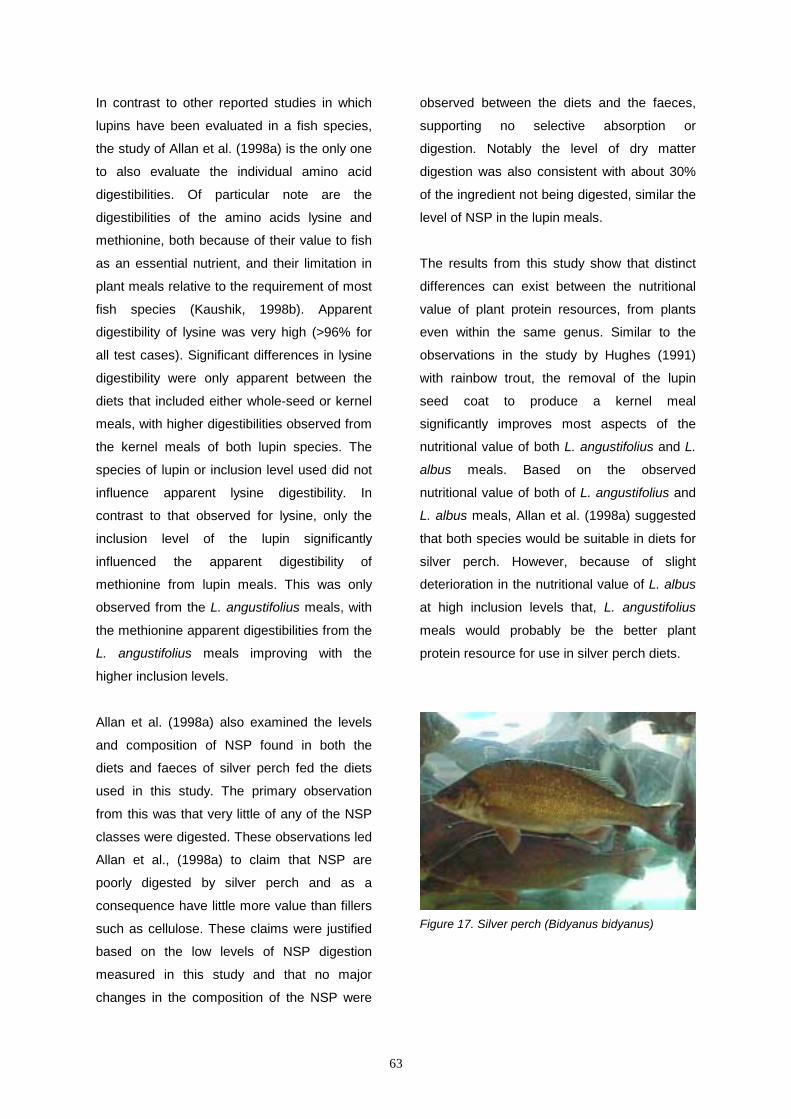
63
In contrast to other reported studies in which
lupins have been evaluated in a fish species,
the study of Allan et al. (1998a) is the only one
to also evaluate the individual amino acid
digestibilities. Of particular note are the
digestibilities of the amino acids lysine and
methionine, both because of their value to fish
as an essential nutrient, and their limitation in
plant meals relative to the requirement of most
fish species (Kaushik, 1998b). Apparent
digestibility of lysine was very high (>96% for
all test cases). Significant differences in lysine
digestibility were only apparent between the
diets that included either whole-seed or kernel
meals, with higher digestibilities observed from
the kernel meals of both lupin species. The
species of lupin or inclusion level used did not
influence apparent lysine digestibility. In
contrast to that observed for lysine, only the
inclusion level of the lupin significantly
influenced the apparent digestibility of
methionine from lupin meals. This was only
observed from the L. angustifolius meals, with
the methionine apparent digestibilities from the
L. angustifolius meals improving with the
higher inclusion levels.
Allan et al. (1998a) also examined the levels
and composition of NSP found in both the
diets and faeces of silver perch fed the diets
used in this study. The primary observation
from this was that very little of any of the NSP
classes were digested. These observations led
Allan et al., (1998a) to claim that NSP are
poorly digested by silver perch and as a
consequence have little more value than fillers
such as cellulose. These claims were justified
based on the low levels of NSP digestion
measured in this study and that no major
changes in the composition of the NSP were
observed between the diets and the faeces,
supporting no selective absorption or
digestion. Notably the level of dry matter
digestion was also consistent with about 30%
of the ingredient not being digested, similar the
level of NSP in the lupin meals.
The results from this study show that distinct
differences can exist between the nutritional
value of plant protein resources, from plants
even within the same genus. Similar to the
observations in the study by Hughes (1991)
with rainbow trout, the removal of the lupin
seed coat to produce a kernel meal
significantly improves most aspects of the
nutritional value of both L. angustifolius and L.
albus meals. Based on the observed
nutritional value of both of L. angustifolius and
L. albus meals, Allan et al. (1998a) suggested
that both species would be suitable in diets for
silver perch. However, because of slight
deterioration in the nutritional value of L. albus
at high inclusion levels that, L. angustifolius
meals would probably be the better plant
protein resource for use in silver perch diets.
Figure 17. Silver perch (Bidyanus bidyanus)

64
In another study by the same group of
workers, Booth et al. (2001) examined the
nutritional value of a range of other plant
legumes, including field peas, faba beans,
chick peas and vetch, but not any of the lupin
species (Table 4.26). In this study each of the
grains was also evaluated in whole-seed meal
and kernel meal forms. Though no direct
comparisons can be made from this study with
the results from that of Allan et al. (1998a),
generalisations on the relative values of the
plant protein resources can be made. Notable
between the two studies where the
substantially higher level of apparent protein
digestibility of the lupin meals. The only
exception to this was the faba beans, which
had a comparable level of apparent protein
digestibility. Apparent energy digestibilities of
each of the plant legumes in this study were
comparable with that of both L. angustifolius
and L. albus meals, though the lupin meals
typically had slightly higher apparent energy
digestibilities. Apparent dry matter
digestibilities were also very comparable
between each of the plant legume meals in the
study by Booth et al. (2001) and both L.
angustifolius and L. albus meals from the
study by Allan et al. (1998a).
In a subsequent study, Allan et al. (1998b)
evaluated the biological value of L.
angustifolius (cv. Gungurru) kernel meal
against dietary fillers of cellulose and
diatomaceous earth in a summit-dilution study
(Table 4.27). In this study, Allan et al. (1999b)
included incremented amounts of L.
angustifolius kernel meal (10%, 20%, 30%,
40%, 50%, 60%, 70% and 80% of the diet)
with diatomaceous earth, also at various
inclusion levels, being the appropriate
negative control. The fish were fed on a pair-
fed, restricted basis to remove feed intake
variables as a confounding issue.
In this study Allan et al. (1998b) found that
diets for silver perch could accommodate up to
600 g/kg of L. angustifolius kernel meal,
without loss in biological performance, based
on fish weight gain, protein deposition and
nitrogen retention efficiency. It was however,
observed that the efficiency of protein use
began to decline when fish were fed diets with
greater than 50% of L. angustifolius kernel
meal. The decline in nitrogen retention
efficiency when fish were fed diets containing
70% and 80% of L. angustifolius kernel meal,
was not related to a decline in digestible
protein or energy content of the diets. It was
suggested that possible causes for this
deterioration in performance were deficiencies
in available amino acids and/or the presence
of an anti-nutrient(s) that inhibited the dietary
protein utilisation by this species. Subsequent
analysis of the digestible amino acid content of
the diets suggested that the requirements for
dietary lysine were greater than that provided,
though the total digestible sulfur amino acids
were close to limiting. Retrospectively, it may
have been valuable to have further detailed
the assessment of the digestible methionine
value specifically, as it is this amino acid that
is usually first limiting in formulations with high
L. angustifolius kernel meal contents (van
Barneveld, 1999).

65
Table 4.26 Nutritional value of various plant legume meals to fed silver perch. Data derived from Booth et al. (2001)
Ingredient Proximate Specifications (g/kg) Ingredient Digestibilities
Protein Fibre* Energy(MJ) Fat Dry matter (%) Protein (%) Energy (%)
L.angustifolius whole-seed 341 - 17.9 57 50.3 96.6 59.4
L.angustifolius kernel meal 436 - 20.7 6.6 67.6 100.3 74.0
Field pea whole-seed 255 87 17.0 11 48.9 83.3 54.5
Field pea kernel-meal 277 28 17.3 10 62.0 88.1 67.0
Faba bean whole-seed 277 120 17.3 13 55.9 91.6 62.2
Faba bean kernel meal 313 33 17.6 13 58.2 96.6 58.8
Chickpea whole-seed 208 134 19.4 47 48.7 84.8 53.6
Chickpea kernel meal 242 25 19.3 50 58.4 81.2 60.2
Vetch whole-seed 309 72 17.9 9 41.5 74.9 55.5
Vetch kernel meal 323 41 18.6 9 78.3 87.7 81.8
* Fibre is acid detergent fibre (ADF).

66
Table 4.27 Performance characteristics of silver perch fed summit-diets evaluating L. angustifolius kernal meal. Data derived from Allan et al. (1998b).
L. angustifolius kernel meal substitution Diatomaceous earth substitution
Parameter Reference 10% 20% 30% 40% 50% 60% 70% 80% 10% 20% 30% 40%
Diet specifications (g/kg)
Crude protein 369 341 360 351 364 376 386 385 427 331 n/s n/s 215
Crude fat 50 49 51 55 57 59 57 47 50 40 n/s n/s 24
Energy (MJ/kg) 19.5 18.9 19.1 19.3 19.3 19.2 19.7 19.5 19.8 16.1 n/s n/s 11.3
Digestible protein (g/kg) 323 331 340 348 356 365 373 381 390 290 258 226 194
Digestible energy (MJ/kg) 14.5 14.6 14.7 14.7 14.8 14.9 15.0 15.0 15.1 13.1 11.6 10.2 8.7
Fish performance
Initial weight (g) 1.82 1.82 1.82 1.82 1.82 1.82 1.82 1.82 1.82 n/s n/s n/s n/s
Final weight (g) 16.72 16.62 18.02 16.72 15.22 15.62 15.02 13.02 12.52 n/s n/s n/s n/s
DGC (%/d) 1.78 1.77 1.87 1.78 1.68 1.71 1.66 1.51 1.47 n/s n/s n/s n/s
FCR (g fed / g gain) 1.5 1.6 1.5 1.6 1.6 1.7 1.7 1.8 1.9 n/s n/s n/s n/s
Nitrogen retention (%) 26.2 28.7 29.7 27.2 24.4 24.7 24.1 22.1 19.2 n/s n/s n/s n/s
All values are on an as-fed basis. n/s: not stated.

67
4.4 Asian seabass / Barramundi
The work of Williams (1998) presents another
comprehensive evaluation of both the
nutritional and the biological value of some key
feed ingredients with potential for the Asian
seabass, Lates calcarifer. Using both
digestibility and summit-dilution studies the
relative value of a range of protein meals,
including L. angustifolius (cv. Gungarru) kernel
and defatted and full-fat soybean meals was
demonstrated. To date, the work reported by
these researchers is the only account of lupin
meals being fed to this species.
Evaluation of the digestibility of L. angustifolius
(cv. Gungurru) kernel meal in L. calcarifer,
using faecal stripping collection methods,
supported that the nutritive value of this grain
resource was similar to that observed of this
grain in other carnivorous fish species (Table
4.28). Protein digestibility of the L.
angustifolius kernel meal was very high at
98%. However, in accordance with the high
levels of NSP in the kernel meal, the dry
matter and energy digestibilities were
considerably lower (McMeniman, 1998). The
protein digestibility values of L. angustifolius
kernel compared very favorably to that of
defatted soybean meal which had dry matter,
protein and energy digestibilties of 56%, 86%
and 69% respectively (Table 4.28). Dry matter
and energy digestibilities of the full-fat
soybean meal were considerably higher than
that of the defatted soybean meal, though the
protein digestibility was essentially unchanged.
The full-fat soybean meal had dry matter,
protein and energy digestibilities of 69%, 85%
and 76% respectively.
Table 4.28 Digestibilities of L. angustifolius kernel and two types of soybean meals when fed to Asian
seabass. Data derived from McMeniman (1998).
L. angustifolius Soybean
Kernel meal Defatted Full-fat
Ingredient proximate composition
Dry matter (g/kg) 895 910 910
Crude protein (g/kg DM) 441 529 448
Crude fat (g/kg DM) 88 16 183
Ash (g/kg DM) 27 72 53
NFE (g/kg DM) 444 383 316
Gross Energy (MJ/kg DM) 19.1 19.9 21.7
Nutrient Apparent Digestibility Coefficients
Dry matter (%) 60.6 55.8 69.0
Protein (%) 98.1 86.0 84.8
Energy (%) 61.5 69.4 75.9

68
Williams (1998) undertook a series of studies
to determine the biological value of several
alternative protein resources including kernel
meal of the lupin L. angustifolius (var.
Gungurru). Using a summit-dilution approach
the kernel meals were incorporated into a fish
meal based summit diet at incremented levels
from 100 g/kg to 700 g/kg of diet, at 100 g/kg
increments. A series of control diets, where
diatomaceous earth was added into the
summit diets at 100, 200, 300 and 400 g/kg of
diet were also included as treatments in the
study (Table 4.29). A similar experiment
evaluating defatted soybean meal was also
undertaken (Table 4.30). In both experiments
all the diets were fed at a pair-fed restricted
level, determined by the fish’s weight, though
some significant food refusals occurred that
complicated some of the outcomes of this
study.
The inclusion of L. angustifolius kernel meal
into the summit diet demonstrated that this
form of lupin had considerable biological value
when fed to L. calcarifer (Table 4.29). In
comparison to the negative controls, a diet
containing 40% of L. angustifolius kernel meal
had a DGC of 1.65%/d, whereas the negative
control diet with 40% of filler had a DGC of
1.02%/d, effectively showing a 62% advantage
over filler at that inclusion level. The relative
advantage of the L. angustifolius kernel meal
increased with increasing inclusion levels,
rising from a 30% advantage at 10% inclusion,
to the 62% advantage at 40% inclusion.
In a separate trial, using larger fish, a diet
containing 40% soybean meal had a DGC of
1.44%/d, whereas the negative control with
40% filler in that experiment had a DGC of
only 0.49%/d. Effectively, this showed a
massive 193% advantage of the soybean meal
over the filler at that inclusion level. However,
the growth attributable to the 40% filler
treatment in this study was unusual when
compared to that achieved from the same diet
in other experiments and therefore casts
doubts of the relative value observation of the
soybean meal at the 40% inclusion level.
(Table 4.30). Notably, the nutritional
advantage of soybean meal was not as
prominent at lower inclusion levels, with a
negative biological value recorded at the 10%
inclusion levels relative to the corresponding
negative controls and the 20% and 30%
inclusion levels showing only 14% and 22%
advantages respectively (Table 4.30).
Many of the aberrations in both the L.
angustifolius kernel meal experiment and also
the soybean meal experiment were reportedly
due to significant differences in the observed
feed intake. Marked declines in the observed
feed intake by fish fed the L. angustifolius
kernel meal diets were not observed until 70%
inclusion of the meal. Notably, the palatability
of the soybean meal diets was reduced with
the inclusion of the meal at 60% or more of the
diet. It was also identified that 78% of the
variance in growth rate associated within both
experiments was attributable to feed intake
variation.
Assessment of the nitrogen retention values
observed in each of the two experiments also
showed similarities in the biological value of
the two ingredients. With both ingredients,
declines in the retention of nitrogen were

69
observed with as little as 30% inclusion of
either ingredient into the reference diet (Table
4.29 and Table 4.30). When these retention
characteristics were compared against those
observed from the negative control diets in
each experiment, marked differences between
experiments were seen. However, the
attribution of the observed nitrogen retention
effects becomes difficult given the disparity
between responses by animals in each
experiment to common diets. For example, in
the L. angustifolius kernel meal experiment the
fish fed the 40% filler diet had a nitrogen
retention value of 36% compared with one of
24% observed for the same diet in the
soybean meal experiment.
Williams (1998) also evaluated the retention of
specific amino acids from the two ingredients.
From this evaluation it was concluded that
there was considerable preferential catabolism
of specific amino acids in the diet. Notable was
the retention of arginine, methionine and
lysine. In most cases these three amino acids
where observed to be retained at higher
efficiencies than that of total dietary nitrogen.
Retention of both methionine and lysine from
diets with incremental inclusion of L.
angustifolius kernel meal occurred at a rate
greater than that observed from soybean
meal. In contrast, arginine retention from L.
angustifolius kernel meal was slightly lower
than that observed from soybean meal.
Evaluation of the levels of retention of these
same amino acids from the filler diets
supported that retention efficiency of these
amino acids improved to about 108% that of
the reference diet with minor reduction in total
dietary protein content, but beyond 20%
inclusion of filler that they too began to decline
in efficiency to about 80% of that observed in
the reference diet.
The retention of methionine from the L.
angustifolius kernel meal diets was different
from both soybean and the filler diets.
Methionine retention efficiency improved to
147% of that of the reference diet at 50%
inclusion of the L. angustifolius kernel meal,
then declined to 134% efficiency at 70%
inclusion. It was suggested that this response
pattern of methionine indicated that this amino
acid was the most limiting of the essential
amino acids in these diets, and accordingly
this ingredient.
Though the growth observations of the fish in
these two experiments were considerably
different, a comparative assessment of the L.
angustifolius kernel meal and soybean meal
experiments, based on the standardised
assessment of the DGC of a common
treatments, in this instance the reference diet,
actually supported a high level of similarity in
the biological value of the two protein meals.
Each protein meal showing advantage or
disadvantage relative to the other after
standardisation, though generally the L.
angustifolius kernel meal was marginally
superior to the soybean meal.
It should be noted though, that considerable
differences were observed between the two
trials, even for common diets. In this regard it
would be worthwhile to revisit this study to
evaluate the comparative value of L.
angustifolius kernel meal and soybean meal to
this species.
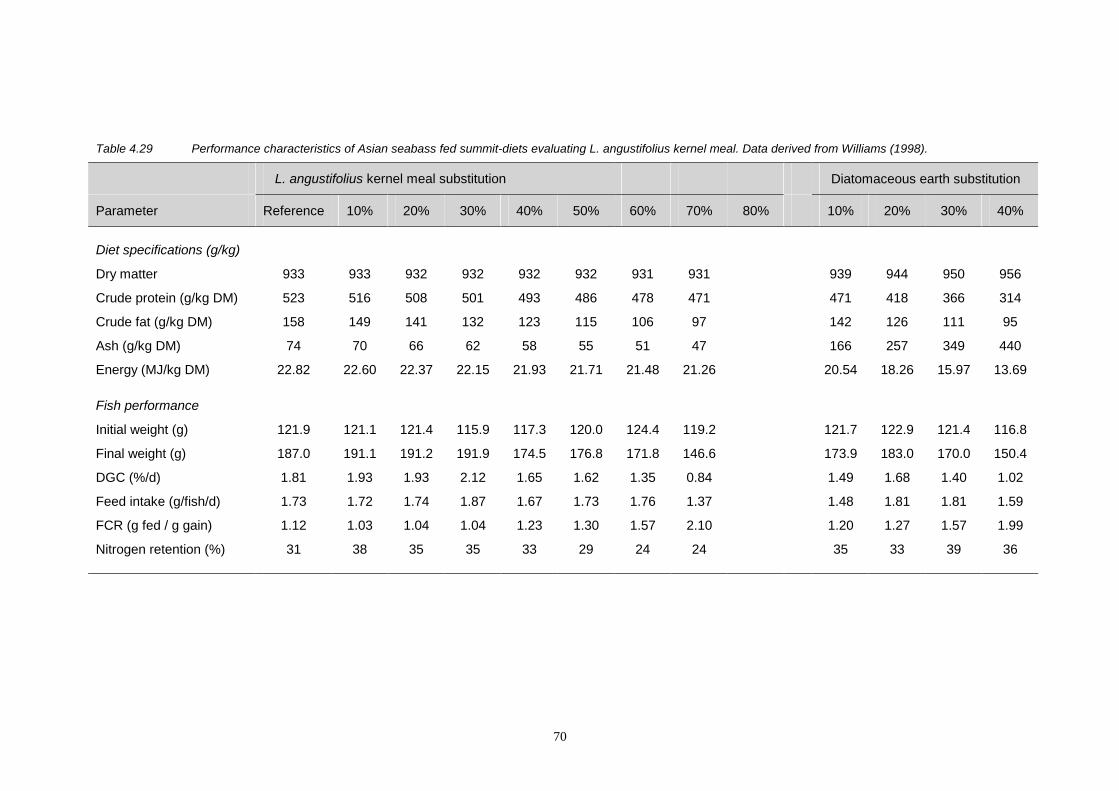
70
Table 4.29 Performance characteristics of Asian seabass fed summit-diets evaluating L. angustifolius kernel meal. Data derived from Williams (1998).
L. angustifolius kernel meal substitution Diatomaceous earth substitution
Parameter Reference 10% 20% 30% 40% 50% 60% 70% 80% 10% 20% 30% 40%
Diet specifications (g/kg)
Dry matter 933 933 932 932 932 932 931 931 939 944 950 956
Crude protein (g/kg DM) 523 516 508 501 493 486 478 471 471 418 366 314
Crude fat (g/kg DM) 158 149 141 132 123 115 106 97 142 126 111 95
Ash (g/kg DM) 74 70 66 62 58 55 51 47 166 257 349 440
Energy (MJ/kg DM) 22.82 22.60 22.37 22.15 21.93 21.71 21.48 21.26 20.54 18.26 15.97 13.69
Fish performance
Initial weight (g) 121.9 121.1 121.4 115.9 117.3 120.0 124.4 119.2 121.7 122.9 121.4 116.8
Final weight (g) 187.0 191.1 191.2 191.9 174.5 176.8 171.8 146.6 173.9 183.0 170.0 150.4
DGC (%/d) 1.81 1.93 1.93 2.12 1.65 1.62 1.35 0.84 1.49 1.68 1.40 1.02
Feed intake (g/fish/d) 1.73 1.72 1.74 1.87 1.67 1.73 1.76 1.37 1.48 1.81 1.81 1.59
FCR (g fed / g gain) 1.12 1.03 1.04 1.04 1.23 1.30 1.57 2.10 1.20 1.27 1.57 1.99
Nitrogen retention (%) 31 38 35 35 33 29 24 24 35 33 39 36

71
Table 4.30 Performance characteristics of Asian seabass fed summit-diets evaluating soybean meal (defatted). Data derived from Williams (1998).
Soybean meal (defatted) substitution Diatomaceous earth substitution
Parameter Reference 10% 20% 30% 40% 50% 60% 70% 80% 10% 20% 30% 40%
Diet specifications (g/kg)
Dry matter 927 925 923 921 919 918 916 914 933 940 946 952
Crude protein (g/kg DM) 521 521 520 520 519 519 518 518 469 417 365 313
Crude fat (g/kg DM) 151 137 124 110 96 83 69 55 136 121 106 91
Ash (g/kg DM) 78 77 77 76 76 75 74 74 169 260 352 443
Energy (MJ/kg DM) 22.18 22 22 21 21 21 21 20 20 18 16 13
Fish performance
Initial weight (g) 151.5 152.3 159.2 149.1 153.9 153.1 150.2 148.5 155.0 152.3 147.9 154.6
Final weight (g) 219.0 223.5 231.8 209.6 212.1 206.4 191.0 182.3 229.6 213.0 196.6 173.2
DGC (%/d) 1.66 1.73 1.72 1.52 1.44 1.33 1.06 0.89 1.79 1.50 1.25 0.49
Feed intake (g/fish/d) 1.53 1.67 1.83 1.65 1.61 1.66 1.46 1.45 1.88 1.76 1.83 1.59
FCR (g : g) 0.95 0.99 1.06 1.16 1.16 1.32 1.50 1.80 1.06 1.22 1.58 3.60
Nitrogen retention (%) 41 42 43 34 36 32 29 19 42 42 36 24

71
4.5 Carp (Cyprinus spp.)
A limited amount of work has been reported on
the use of lupins in diets for carp (Cyprinus
sp.). A study by Viola et al. (1988) examined
the use of whole-seed L. angustifolius (CP:
327 g/kg DM, CF: 60 g/kg DM; cultivar not
stated) in diets for the common carp (Cyprinus
carpio). In a series of two experiments, whole-
seed L. angustifolius meal was added to a
reference diet, first at a 30% inclusion level,
then in a second experiment at a 45%
inclusion level.
In the first experiment the lupin was included
at the expense of both soybean meal (CP: 517
g/kg DM, CF: 11 g/kg DM) and sorghum (CP:
106 g/kg DM, CF: 31 g/kg DM). In the second
experiment lupin was included at the expense
of both fishmeal and sorghum, no soybean
meal was included in either of the diets in the
second experiment. In each case the diets
were formulated to be iso-nitrogenous and iso-
energetic on a gross basis, though notably the
diet proximate specifications differed in each
experiment (Table 4.31).
In the first experiment, 300 g carp fed the diets
for 44 days showed significantly better growth
when fed the 30% lupin diet (171.3 g gain) as
opposed to those fed the reference diet (133.5
g gain) (Table 4.31). Feed conversion was
also significantly better with the lupin diet (3.2 :
1 vs 4.1 : 1). No significant difference was
observed in the composition characteristics of
fish fed either of the diets. Similarly, both
nitrogen and energy retention were also
unaffected by diet in this experiment. While
reasons for the superiority of the lupin based
diet in this experiment were not clear, it was
suggested that differences in the utilisation of
the carbohydrate fraction of the diets may
have been a factor. It is more likely that the
better performance may have been related to
higher digestible protein content of the lupin
based diet, and that the reference diet was
limiting in protein to start with. Reports of
superior protein digestibility of lupin meal
compared to soybean meal have been
reported in many species (Hughes, 1988;
Burel et al., 1998; McMeniman, 1998; Allan et
al., 1998a)
In the second experiment, 225 g carp were fed
the two experimental diets, a reference diet
and a diet with 45% lupin inclusion, for 41
days. In this experiment there were no
significant differences in either growth or food
utilisation parameters (Table 4.31). Fish fed
the reference diet had slightly higher levels of
body fat at the end of the study than those fish
fed the 45% lupin diet, but other composition
parameters remained unchanged.
Corresponding to the higher fat levels in the
control diet fed fish, was also a higher level of
energy retention.
No other data was reported for the nutritive
value of any lupin products when fed to Carp.

72
Table 4.31 Incorporation of L. angustifolius whole-seed into practical diets for carp. Data derived from Viola
et al. (1988).
Experiment 1 Experiment 2
Lupin Reference Lupin Reference
Diet ingredients (g/kg)
Herring meal (70% protein) 150 150 200 350
Lupin whole seed meal (29.8% protein) 300 - 450 -
Defatted soybean meal (45.0% protein) - 180 - -
Sorghum (9.3% protein) 395 515 80 380
Wheat 100 100 200 200
Dicalcium phosphate 25 25 50 50
Poultry oil 30 30 20 20
Diet proximate specifications
Crude protein (g/kg DM) 282 280 321 333
Crude fat (g/kg DM) 88 70 66 60
Gross ash (g/kg DM) 67 68 102 125
Gross energy (MJ/kg DM) 19.87 19.45 19.02 18.56
Fish performance criteria
Initial weight (g) 300 300 225 225
Final weight (g) 471.3 433.5 339.5 342
DGC (%/d) 2.47 1.99 2.18 2.22
FCR (g fed / g gain) 3.2 4.1 3.25 3.20
Nitrogen retention (%) 16.2 14.5 17.6 16.50
Energy retention (%) 12.4 11.6 14.0 16.30

73
4.6 Tilapia (Oreochromis spp.)
Some recent studies, largely as yet
unpublished, have evaluated L. angustifolius
whole-seed and kernel meals in diets for
tilapia (O. niloticus). The data provided so far
is essentially quite rudimentary, evaluating
only crude biological value of the lupin in
comparison to other more routinely used
dietary ingredients. The majority of diets used
for this species tend to be under specified for
performance, often making interpretation of
the results difficult
A study was conducted based on the use of a
commercially used diet formulation for the red
tilapia (O. niloticus, Stirling strain) (Petterson
et al., 1998). Experimental diets were made in
which 50% replacement of either the fishmeal
or soybean meal components by L.
angustifolius kernel meal was undertaken. An
additional diet in which 25% replacement of
both the soybean and fishmeal components
was also included. The diets were formulated
on an iso-nitrogenous and iso-energetic basis
(Table 4.32).
Table 4.32 Performance of red tilapia fed practical diets with L. angustifolius kernel meal substitution for
fishmeal and soybean meals. Data derived from Petterson et al. (1998).
Reference A B C
Diet ingredients
Fishmeal 200 120 200 120
Soybean meal 200 240 100 120
L. angustifolius kernel meal - 120 100 240
Wheat pollard 370 290 370 290
Remains (uniform across treatments) 230 230 230 230
Diet proximate specifications
Crude protein (g/kg) 301 293 273 300
Crude fat (g/kg DM) 43 47 41 54
Fish performance criteria
Initial weight (g) 55.3 55.0 55.0 55.3
Final weight (g) 231.7 226.9 237.4 238.3
DGC (%/d) 4.86 4.78 4.98 4.98
FCR (g fed / g gain) 1.53 1.54 1.46 1.48
Reference: commercial based diet. A: 50% replacement of fishmeal content of reference diet with L. angustifolius kernel meal. B: 50% replacement of soybean meal content of reference diet with L. angustifolius kernel meal.. C: 25% replacement of both the fishmeal and soybean meal content of reference diet with L. angustifolius kernel meal.

74
Table 4.33 Performance of large tilapia fed diets with L. angustifolius replacing either soybean meal or
fishmeal. Data derived from Petterson et al. (1998).
Reference A B
Diet ingredients
Fishmeal 150 150 85
Soybean meal 150 75 85
L. angustifolius kernel meal - 75 170
Rice bran 327 327 327
Corn meal 320 320 320
Remains (undefined) 53 53 13
Diet proximate specifications
Crude protein (g/kg) 243 242 253
Crude fat (g/kg DM) 96 117 103
Fish performance criteria
Initial weight (g) 239.3 239.7 238.7
Final weight (g) 527.6 531.7 527.4
DGC (%/d) 3.90 3.94 3.91
FCR (g fed / g gain) 2.30 2.30 2.30
Protein efficiency ratio 1.65 1.68 1.59
Sensory evaluation
Colour 3.37 3.23 2.56
Flavour 3.66 3.40 2.30
Texture 3.33 3.30 2.33
Acceptability 3.46 3.23 2.20
Reference: commercial based diet. A: 50% replacement of soybean meal content of reference diet with L. angustifolius kernel meal. B: 43% replacement of both the fishmeal and soybean meal content of reference diet with L. angustifolius kernel meal.

75
The diets were fed to the tilapia for 60 days.
After this period similar growth and conversion
performance were observed from all
treatments (Table 4.32). This trial
demonstrated that in low-specification diets for
tilapia, the partial replacement of fishmeal
and/or soybean could be effectively achieved
with L. angustifolius kernel meal.
A second study by these same workers
examined the use of L. angustifolius kernel
meal with larger red tilapia (O. niloticus,
Stirling strain) (Petterson et al., 1998). In this
second study L. angustifolius kernel meal was
used to replace 50% of the soybean meal in
another reputed commercial diet formulation,
with a third treatment consisting of 43%
replacement of the soybean meal and 43%
replacement of the fishmeal components. As
with the previous trial by these researchers,
the diets were again formulated on an iso-
nitrogenous and iso-energetic basis, though
actual diet energy levels were not detailed
(Table 4.33).
The results of this second trial confirmed those
of the earlier one, by demonstrating the
capacity of L. angustifolius kernel meal to
effectively replace 50% of the soybean meal in
diets for red tilapia. However, in the diet were
43% of the fishmeal was replaced by L.
angustifolius kernel meal, a decline in the
protein efficiency ratio was observed. In
addition, sensory evaluation of the fish fed
these diets is was deemed that the
replacement of fishmeal by L. angustifolius
kernel meal reduced the overall sensory value
of the fish. However, whether this effect is
actually attributable to the increased L.
angustifolius kernel meal content or the
reduction in fishmeal content cannot be
ascertained from this study.
4.7 Milkfish
Petterson (2000) reported some otherwise
unpublished data (J.H. Hutabarat, unpubl.) on
the substitution of L. angustifolius kernel meal
into diets for the milkfish (Chanos chanos). In
these studies, L. angustifolius kernel meal was
substituted for soybean meal at incremented
levels from 0% to 100%, in a diet with a total
protein content of 330 g/kg. The size of the
increments was not defined.
Performance of the fish fed the diets
apparently improved with increasing inclusion
of the of L. angustifolius kernel meal. The best
performance of milkfish fed the experimental
diets was observed from those fed the 100%
L. angustifolius kernel meal diet, where the
fish had an FCR of 3.5:1and a specific growth
rate 2.0 %/d. Digestible protein and energy
content of this diet were reported as 63% and
72% respectively. A second trial, in which the
diets were made to a 350 g/kg crude protein
level, was also undertaken on a similar basis
with apparently similar results to those
observed in the first study, with the L.
angustifolius kernel meal diets outperforming
those based on either soybean meal or L.
angustifolius whole-seed meal. No specific
details of this study were provided.

76
4.8 Turbot Work reported by Burel et al. (2000a)
examined the nutritional value of extruded L.
albus kernels, extruded peas and both solvent-
extracted and heat-treated rapeseed (Brassica
rapus) meals in rainbow trout. These same
workers also reported in that study, additional
work examining the same test ingredients
when fed to the marine flatfish, turbot (Psetta
maxima). As with the rainbow trout study, the
apparent digestible dry matter, protein (as N x
6.25), energy and phosphorus of these
ingredients were also studied relative to a
fishmeal reference (Table 4.34).
The studies with turbot by Burel et al. (2000a)
found significantly higher apparent protein
digestibility of L. albus kernel meal, pea and
heat treated-rapeseed meals in comparison to
the solvent extracted rapeseed meal. In
addition, apparent energy digestibility of the L.
albus kernel meal was also significantly higher
than that of pea meal and the solvent-
extracted rapeseed meal treatments, though
not the heat-treated rapeseed meal. The
phosphorus digestibility was essentially 100%
in both the L. albus kernel meal and the pea
meal, being significantly higher than both the
rapeseed meals, in which the phosphorus
content was only about as half as efficiently
digested. It was suggested, however, that the
Table 4.34 Proximal composition and nutritional value of various plant meals to fed turbot. Data derieved from
Burel et al. (2000a)
Extruded peas Extruded lupin SE-Rapeseed HT-Rapeseed
Ingredient Proximate Composition
Dry matter (g/kg) 909 928 937 915
Crude protein (g/kg DM) 260 434 431 433
Crude fat (g/kg DM) 4.5 100 48 9
Ash (g/kg DM) 33 46 79 82
NFE (g/kg DM) 612 348 379 391
Phosphorus (g/kg) DM) 4.4 5.4 14.9 15.6
Nutrient Apparent Digestibility
Dry matter (%) 71.5 80.5 57.1 64.6
Protein (%) 92.9 97.8 82.9 91.9
Energy (%) 77.7 85.1 69.3 80.9
Phosphorus (%) 100 100 49.3 64.7
SE-Rapeseed: Solvent Extracted Rapeseed meal. HT-Rapeseed: Heat Treated Rapeseed meal.

77
high phosphorus apparent digestibilities in the
pea and L. albus kernel meals were probably
over-estimates, a consequence of leaching
from faeces collected in a settlement column.
Regardless, the data supported that
phosphorus from both pea and L. albus kernel
meals, were considerably better absorbed
than that from rapeseed meals. In contrast to
the results obtained by these workers with
rainbow trout (Burel et al., 2000a), there were
also significant differences in the dry matter
apparent digestibilities obtained from turbot,
with L. albus kernel meal being significantly
more digested than both rapeseed meal
treatments, but not more so than the pea meal
(Table 4.34).
In concluding their study these workers
supported that of the four meal types (pea, L.
albus kernel and rapeseed: solvent-extracted
or heat-treated), that L. albus kernel meal had
the most promise as a valuable feed ingredient
for turbot. While pea meal was used well, its
use would be limited by its lower protein
content.
In a follow up study to the nutritional
assessment work undertaken by Burel et al.
(2000a) with turbot and rainbow trout, these
workers also examined the biological value of
L. albus kernel and rapeseed meal as fed to
turbot (Burel et al., 2000b).
In this second study (Burel et al., 2000b)
included extruded L. albus kernel meal into
two separate iso-nitrogenous and iso-
energetic diets at 300 g/kg and 500 g/kg
(Table 4.35). The performance of juvenile
turbot when fed these diets was compared
against a fish meal based reference diet of
similar nutrient composition, with further
additional diets examining the value of
rapeseed meal to this species.
Growth by the turbot was best on the diet
containing 300 g/kg of L. albus kernel meal,
which was significantly better than that
achieved with either of the rapeseed meal
diets, but only numerically higher than the
reference diet. Notably, both of the L. albus
kernel meal diets had better food conversion
than the reference diet, though only the diet
with a L. albus kernel meal at a level of 300
g/kg had significantly better conversion (Table
4.35).
The turbot fed the L. albus kernel meal diets
also had significantly higher nitrogen and
phosphorus retention than that observed from
turbot fed either of the rapeseed meal diets or
the fishmeal based reference diet. These
observations were highly consistent with the
earlier work by these researchers who
observed similar effects with rainbow trout
(Burel et al., 1998) and were also consistent
with observations from their digestibility
studies (Burel et al., 2000a). There are
considerable implications of these
observations of the higher levels of both
digestibility and nutrient retention in terms of
the total potential environmental impact from
intensive aquaculture.
In addition to the more common parameters of
nutritional and biological evaluation reported
by these researchers, further work on the
plasma levels of triiodothyronine (T3) and
thyroxin (T4) and the activities of some of the
deiodinases, were also reported (Burel et al.,
2000b).

78
What the outcomes of this additional work
demonstrated was that although rapeseed
meal had defined influences on the
metabolism of both T3 and T4 and the
deiodination pathways, similar effects were not
observed with the use of L. albus kernel meal
in the diet of turbot. Indeed the T3 and T4
levels and the deiodination pathways were
comparable to those observed from fish fed
the fishmeal based reference diet, although
slightly higher T3 levels were observed from
fish fed the diet containing 300 g/kg of L. albus
kernel meal. The specific implications of these
observations were not discussed other than
their general relation between increased
metabolic rates and growth rates of the fish.
Table 4.35 Performance of turbot (Psetta maxima) fed L. albus kernel meal or canola meal
Reference L. albus 300
L. albus 500
Rapeseed 300
Rapeseed 460
Ingredients
Extruded L. albus kernel meal - 300 500 - -
Rapeseed meal - - - 300 460
Fish meal 590 440 345 460 370
Extruded peas 230 93 - 50 -
Fish oil 100 87 75 110 90
Remains 80 80 80 80 80
Diet proximate specifications
Dry matter (g/kg) 885 894 893 888 892
Crude protein (g/kg DM) 530 526 525 522 516
Crude fat (g/kg DM) 170 173 172 184 146
Nitrogen-free extractives (g/kg DM) 85 158 206 168 228
Gross phosphorus (g/kg DM) 18 15 14 19 18
Gross ash (g/kg DM) 121 104 93 119 109
Gross energy (MJ/kg DM) 22 22.3 22.4 22.3 21.9
Fish performance criteria
Initial weight (g) 48.6 47.2 50.2 49.6 48.7
Final weight (g) 122.9 127.5 122.5 113.5 102.2
DGC (%/d) 2.13 2.29 2.06 1.88 1.65
Feed intake (g/d/fish) 1.17 1.11 1.05 1.02 0.93
FCR (g/g) 0.98 0.85 0.91 0.99 1.08
N retention (%) 30.4 35.7 32.8 30.9 28.3
P retention (%) 32.9 45.2 44.4 31.9 35.7

79
4.9 Shrimp (Penaeid sp.)
Several published studies have examined the
use of lupins in diets for shrimp, but only for a
single species, Penaeus monodon, the giant
tiger prawn. However, a range of approaches
for evaluating the nutritional and biological
value of lupins when fed to shrimp have been
adopted.
The nutritional value of lupins to
shrimp/prawns has been shown to be similar
to that of most fish species (Table 4.36; Smith
et al., 2000). As has been observed from most
other fish species, the apparent digestibility
values of dry matter, protein and energy were
all higher in L. angustifolius kernel meal
relative to that of the whole-seed meal. The
nutritional value of the L. angustifolius kernel
meal was generally similar to that of soybean
meal, with marginally higher apparent protein
digestibilities (94% vs 92%), though marginally
lower apparent energy digestibilities (68% vs
71%). Similar in nutritional value to both L.
angustifolius kernel meal and soybean meal
was field pea meal, which had slightly higher
apparent energy digestibilities still (83%),
consistent with the effective digestion of the
higher starch content of this protein resource.
Table 4.36 Proximal composition and nutritional value of various plant meals to fed the prawn, Penaeus
monodon (based on data from Smith et al., 2000)
L. angustifoliusa Soybeanb Canolac Field pead Fishmeal
Whole-seed Kernel meal
Ingredient proximate composition
Crude protein (g/kg DM) 341 448 478 366 255 732
Crude fat (g/kg DM) 57 71 37 26 11 99
Ash (g/kg DM) 28 35 80 80 34 142
NFE (g/kg DM) 574 446 405 528 700 27
Gross energy (MJ/kg DM) 17.9 20.6 17.0 19.9 17.0 21.3
Nutrient Apparent Digestibility
Dry matter (%) 39 67 67 49 72 86
Protein (%) 88 94 92 79 89 93
Energy (%) 45 68 71 53 83 89
aL. angustifolius cv. Gungarru ; bSolvent extracted soybean meal; cSolvent extracted canola meal; dPisum sativum cv. Dunn

80
Sarac et al. (1998) undertook a series of
studies to determine the biological value of
several forms of the lupin L. angustifolius (cv.
Gungurru). Using a summit-dilution approach,
whole-seed and kernel meals and a protein
concentrate were incorporated into a summit
diet at incremented levels from 10% to 70%, at
10% increments. A series of control diets,
were diatomaceous earth was added into the
summit diets at 10%, 20%, 30% and 40%
were also included as treatments in the study
(Table 4.37 to 4.39).
The inclusion of L. angustifolius kernel meal
into the summit diet showed that this form of
lupin has considerable biological value (Table
4.37). In comparison to the negative controls
shrimp fed a diet containing 40% of L.
angustifolius kernel meal had a growth rate
(DGC) of 0.90%/d, whereas shrimp fed the
negative control with 40% filler had a DGC of
0.52%/d. The difference between these two
treatments effectively showing a 73%
advantage of the L. angustifolius kernel meal
over the filler at that same inclusion level.
Using this comparison to the relative negative
control, the relative advantage of the L.
angustifolius kernel meal was observed to
increase with increasing inclusion levels, rising
from a 9% advantage at 10% inclusion, to a
73% advantage at 40% inclusion. In
comparison, shrimp fed a diet containing 40%
soybean meal had a DGC of 1.02%/d,
whereas those fed the negative control with
40% filler in that experiment had a DGC of
0.81%/d, thus effectively only showing a 26%
advantage over those shrimp fed the diet with
filler at that same inclusion level (Table 4.40).
The nutritional advantage of soybean meal
was not evident at lower inclusion levels, with
a negative comparative biological value of the
diets recorded at 10%, 20% and 30% soybean
meal inclusion levels relative to the
corresponding negative (filler) control diets.
Though the growth rates (DGC) of shrimp fed
each of the 40% filler diets were considerably
different, comparative assessment was made
based on the standardised assessment of
common treatments, such as the 40% filler
diet. Notable from the soybean inclusion
treatments were the relatively high feed
conversion ratios, substantially more so than
those observed even for the diets with
corresponding levels of dietary filler. It was
suggested that this unexpectedly poor
performance of the soybean meal may have
been attributable to contamination of the
soybean meal with aflotoxin or pesticides.
Other contributing factors such as high levels
of phytate and lipoxidases were also
suggested (Sarac et al., 1998).
Figure 18. Several studies have identified good potential for lupins in shrimp diets.
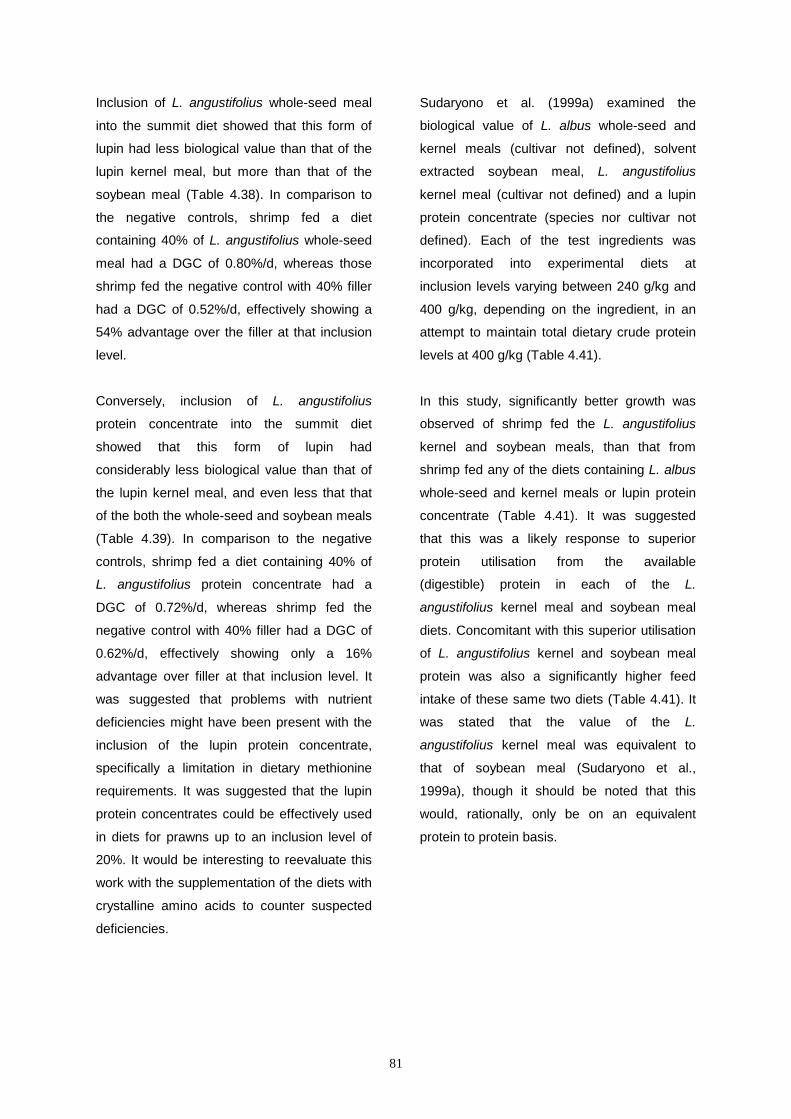
81
Inclusion of L. angustifolius whole-seed meal
into the summit diet showed that this form of
lupin had less biological value than that of the
lupin kernel meal, but more than that of the
soybean meal (Table 4.38). In comparison to
the negative controls, shrimp fed a diet
containing 40% of L. angustifolius whole-seed
meal had a DGC of 0.80%/d, whereas those
shrimp fed the negative control with 40% filler
had a DGC of 0.52%/d, effectively showing a
54% advantage over the filler at that inclusion
level.
Conversely, inclusion of L. angustifolius
protein concentrate into the summit diet
showed that this form of lupin had
considerably less biological value than that of
the lupin kernel meal, and even less that that
of the both the whole-seed and soybean meals
(Table 4.39). In comparison to the negative
controls, shrimp fed a diet containing 40% of
L. angustifolius protein concentrate had a
DGC of 0.72%/d, whereas shrimp fed the
negative control with 40% filler had a DGC of
0.62%/d, effectively showing only a 16%
advantage over filler at that inclusion level. It
was suggested that problems with nutrient
deficiencies might have been present with the
inclusion of the lupin protein concentrate,
specifically a limitation in dietary methionine
requirements. It was suggested that the lupin
protein concentrates could be effectively used
in diets for prawns up to an inclusion level of
20%. It would be interesting to reevaluate this
work with the supplementation of the diets with
crystalline amino acids to counter suspected
deficiencies.
Sudaryono et al. (1999a) examined the
biological value of L. albus whole-seed and
kernel meals (cultivar not defined), solvent
extracted soybean meal, L. angustifolius
kernel meal (cultivar not defined) and a lupin
protein concentrate (species nor cultivar not
defined). Each of the test ingredients was
incorporated into experimental diets at
inclusion levels varying between 240 g/kg and
400 g/kg, depending on the ingredient, in an
attempt to maintain total dietary crude protein
levels at 400 g/kg (Table 4.41).
In this study, significantly better growth was
observed of shrimp fed the L. angustifolius
kernel and soybean meals, than that from
shrimp fed any of the diets containing L. albus
whole-seed and kernel meals or lupin protein
concentrate (Table 4.41). It was suggested
that this was a likely response to superior
protein utilisation from the available
(digestible) protein in each of the L.
angustifolius kernel meal and soybean meal
diets. Concomitant with this superior utilisation
of L. angustifolius kernel and soybean meal
protein was also a significantly higher feed
intake of these same two diets (Table 4.41). It
was stated that the value of the L.
angustifolius kernel meal was equivalent to
that of soybean meal (Sudaryono et al.,
1999a), though it should be noted that this
would, rationally, only be on an equivalent
protein to protein basis.

82
Table 4.37 Performance characteristics of the prawn, Penaeus monodon fed summit-diets evaluating L. angustifolius kernel meal. Data derived from Sarac et al. (1998).
L. angustifolius kernel meal substitution Diatomaceous earth substitution
Reference 10% 20% 30% 40% 50% 60% 70% 10% 20% 30% 40%
Diet specifications
Dry matter (g/kg) 917 917 924 921 915 916 920 919 925 931 934 934
Crude protein (g/kg DM) 487 481 473 467 468 461 451 444 426 377 323 279
Crude fat (g/kg DM) 114 115 117 120 123 123 125 131 103 95 96 90
Gross ash (g/kg DM) 112 114 102 96 86 80 73 66 98 96 84 77
Nitrogen-free extract (g/kg DM) 286 290 308 317 323 336 351 360 373 432 498 554
Energy (MJ/kg DM) 22.60 22.54 22.32 22.49 22.95 22.98 22.91 23.09 21.76 n/s 21.23 20.92
Prawn performance criteria
Initial weight (g) 2.48 2.48 2.48 2.48 2.48 2.48 2.48 2.48 2.48 2.48 2.48 2.48
Final weight (g) 6.55 6.20 5.89 5.44 5.21 5.03 4.81 4.79 5.79 5.34 4.52 3.87
DGC (%/d) 1.23 1.15 1.08 0.96 0.90 0.86 0.80 0.79 1.05 0.94 0.71 0.52
FCR (g fed / g gain) 1.71 1.83 1.78 2.02 2.24 2.67 3.48 7.91 2.10 1.83 2.61 3.49
Feed intake (g/prawn/d) 0.128 0.134 0.158 0.153 0.149 0.144 0.132 0.112 0.142 0.176 0.161 0.160
Survival (%) 83 83 92 83 92 92 100 83 67 92 83 100
n/s: not stated.

83
Table 4.38 Performance characteristics of Penaeus monodon fed summit-diets evaluating L. angustifolius whole-seed meal. Data derived from Sarac et al. (1998).
L. angustifolius whole-seed meal substitution Diatomaceous earth substitution
Reference 10% 20% 30% 40% 50% 60% 70% 10% 20% 30% 40%
Diet specifications
Dry matter (g/kg) 917 936 931 931 928 927 933 934 925 931 934 934
Crude protein (g/kg DM) 487 424 432 419 411 393 374 355 426 377 323 279
Crude fat (g/kg DM) 114 109 110 112 114 114 115 116 103 95 96 90
Gross ash (g/kg DM) 112 109 101 94 89 82 71 64 98 96 84 77
Nitrogen-free extract (g/kg DM) 286 357 357 374 386 411 441 464 373 432 498 554
Energy (MJ/kg DM) 22.60 21.47 21.72 21.75 22.05 22.05 21.53 21.97 21.76 n/s 21.23 20.92
Prawn performance criteria
Initial weight (g) 2.48 2.48 2.48 2.48 2.48 2.48 2.48 2.48 2.48 2.48 2.48 2.48
Final weight (g) 6.55 6.21 6.26 5.61 4.83 4.85 4.28 4.58 5.79 5.34 4.52 3.87
DGC (%/d) 1.23 1.15 1.17 1.01 0.80 0.81 0.64 0.73 1.05 0.94 0.71 0.52
FCR (g fed / g gain) 1.71 1.6 1.55 1.85 2.2 2.79 4.12 5.07 2.10 1.83 2.61 3.49
Feed intake (g/prawn/d) 0.128 0.161 0.161 0.160 0.169 0.144 0.139 0.119 0.142 0.176 0.161 0.160
Survival (%) 83 92 91 67 100 92 67 83 67 92 83 100
n/s: not stated.
84
Table 4.39 Performance characteristics of Penaeus monodon fed summit-diets evaluating L. angustifolius protein concentrate. Data derived from Sarac et
al. (1998).
L. angustifolius protein concentrate substitution Diatomaceous earth substitution
10% 20% 30% 40% 50% 60% Reference (0%) 10% 20% 30%
Diet specifications
Dry matter (g/kg) 915 909 908 922 915 919 914 910 933 930
Crude protein (g/kg DM) 502 503 507 496 499 498 486 437 367 314
Crude fat (g/kg DM) 120 128 133 133 133 133 123 110 107 95
Gross ash (g/kg DM) 110 102 95 88 81 72 119 211 271 374
Nitrogen-free extract (g/kg DM) 268 266 266 283 287 296 273 242 255 217
Energy (MJ/kg DM) 22.80 23.11 23.19 22.84 23.19 23.32 22.62 20.16 16.79 14.62
Prawn performance criteria
Initial weight (g) 4.30 4.30 4.30 4.30 4.30 4.30 4.30 4.30 4.30 4.30
Final weight (g) 8.39 8.57 7.67 7.19 6.64 5.01 8.24 7.80 7.59 6.72
DGC (%/d) 0.97 1.00 0.82 0.72 0.60 0.20 0.94 0.85 0.81 0.62
FCR (g fed / g gain) 2.11 1.94 2.43 2.87 2.87 4.05 1.97 1.93 2.18 2.35
Feed intake (g/prawn/d) 0.144 0.143 0.156 0.159 0.182 0.213 0.160 0.190 0.180 0.208

85
Table 4.40 Performance characteristics of the prawn, Penaeus monodon fed summit-diets evaluating soybean meal. Data derived from Sarac et al. (1998).
Soybean meal substitution Diatomaceous earth substitution
Reference 10% 20% 30% 40% 50% 60% 70% 10% 20% 30% 40%
Diet specifications
Dry matter (g/kg) 923 940 902 916 929 921 927 919 941 956 960 962
Crude protein (g/kg DM) 502 485 509 522 489 489 485 489 431 365 305 252
Gross ash (g/kg DM) 119 116 120 115 110 110 106 104 205 298 345 425
Prawn performance criteria
Initial weight (g) 2.49 2.49 2.49 2.49 2.49 2.49 2.49 2.49 2.49 2.49 2.49 2.49
Final weight (g) 7.28 6.38 5.75 5.54 5.66 5.55 5.35 5.34 7.92 6.67 6.35 4.89
DGC (%/d) 1.39 1.19 1.04 0.99 1.02 0.99 0.94 0.93 1.52 1.25 1.18 0.81
FCR (g fed / g gain) 1.85 2.59 2.32 2.55 1.67 2.23 2.43 2.94 1.36 1.77 1.81 1.53
Feed intake (g/prawn/d) 0.211 0.240 0.180 0.185 0.126 0.163 0.165 0.200 0.176 0.176 0.166 0.088
Survival (%) 83 42 58 42 66 58 66 75 75 66 92 66

86
The poor utilisation of the lupin protein
concentrate was attributed to the influence of
the protein extraction process on the quality of
the protein content (Table 4.41). It has been
reported that changes to the chemical
structure of some of the protein fractions (eg.
globulins and albumins) due to the extraction
process, does occur (Petterson, 2000), and
that these may have influenced the value of
the protein content in the lupin protein
concentrate used in this study. It may have
been of value, in this essence to have also
evaluated some soybean protein concentrates
in the study, for comparative purposes.
Similarly a comparative nutritional evaluation
of the lupin protein concentrate against other
plant protein resources is warranted.
Sudaryono et al. (1999a) also suggested that
the poorer performance of shrimp fed the L.
albus kernel meal relative to that of L.
angustifolius kernel meal was reflective of the
differences in feed intake of the two diets
(Table 4.41). No explanations were offered as
to why differences in intake were observed
between these two treatments, though similar
observations have been reported from studies
comparing the inclusion of L. albus meals to
that of L. angustifolius meals in diets fed to
pigs (Kemm et al., 1987). These studies also
did not identify the causative agent for reduced
feed intake by the pigs.
The L. albus kernel meal did not support
significantly better performance of prawns,
than that of prawns fed the L. albus whole-
seed diet (Table 4.41). Though in all
parameters the performance was numerically
higher. It would be of value to reconsider this
work with an increase in experimental power in
the design (Searcy-Bernal, 1994). Other
studies have identified that four or more
replicates, each with at least five animals are
required in nutritional studies with this species
to have reasonable confidence in detecting
significant effects (Glencross et al., 1999).
A reduction in the digestibility of the dry matter
of the diet was observed with the inclusion of
L. albus whole-seed meal, relative to the other
experimental diets (Table 4.41). It was
suggested that this could have been a
response to increased levels of fibre present in
the diet (Table 4.41). Other workers have also
reported deterioration in the dry matter
apparent digestible value of diets, concomitant
with increased levels of fibre in the diet
(Akiyama et al., 1989; Catacutan, 1991). No
significant differences were observed of the
apparent digestibility of protein between any of
the diets. This observation was inconsistent
with the observations of the dry matter
digestibilities (Table 4.41).
That no growth effects were evident from the
differences in digestible values observed in
this study confirms that most of the diets were
probably over specified for protein, thereby
reducing the possibility of observing growth
effects attributable to inclusion of specific
ingredients.
In a second study by these same authors
(Sudaryono et al., 1999b), the incremental
inclusion of L. albus kernel meal into a
reference diet in place of soybean meal was
reported (Table 4.42). The test diets
represented a 25%, 50%, 75% and 100%
replacement of the dietary soybean meal. In
this study, the diets were formulated to be iso-

87
Table 4.41 Utilisation of soybean, L. albus whole-seed and kernel meals and L. angustfolius kernel meal
and lupin protein concentrate by the tiger prawn, Penaeus monodon. Data derived from
Sudaryono et al. (1999a).
Soybean L. albus L. angustifolius
whole- kernel kernel concentrate
Diet ingredients (g/kg)
Soybean meal 300 - - - -
L. albus whole-seed meal - 400 - - -
L. albus kernel meal - - 350 - -
L. angustofolius kernel meal - - - 360 -
L. angustofolius protein concentrate - - - - 240
Wheat flour 215 185 235 225 285
Rice bran 50 - - - 50
Fish oil 20 - - - 10
Remains (uniform across treatments) 415 415 415 415 415
Diet proximate specifications
Crude protein (g/kg DM) 415 410 429 417 425
Crude fat (g/kg DM) 79 86 96 82 107
Gross ash (g/kg DM) 79 86 96 82 107
Crude Fibre 43 66 45 45 33
NFE 366 355 390 383 340
Gross Energy 19.28 19.23 20.64 19.71 20.12
Lysine (g/ 160 g N) 58.7 46.8 43.2 53.6 33.8
Methionine (g/ 160 g N) 21.0 17.1 17.1 19.2 17.8
Prawn performance criteria
Initial weight (g) 4.08 4.13 4.03 4.03 4.07
Final weight (g) 7.62 6.51 6.46 7.52 6.99
DGC (%/d) 0.88 0.63 0.64 0.87 0.75
FCR (g fed / g gain) 2.3 2.9 2.8 2.3 2.7
Feed intake (g/prawn/d) 0.196 0.165 0.164 0.190 0.186
N retention 23.7 20.0 20.5 24.5 20.7
Apparent Protein Digestibility (%) 87.5 87.1 87.7 89.1 87.9

88
Table 4.42 Replacement of soybean meal with L. albus kernel meal in diets fed to the prawn, Penaeus
monodon. Data derived from Sudaryono et al. (1999b).
Soybean meal replacements level (%)
0 25 50 75 100
Diet ingredients (g/kg)
Soybean meal 300 225 150 75 0
L. albus kernel meal 0 90 170 260 350
Wheat flour 185 200 225 230 225
Rice bran 90 60 30 10 0
Remains (uniform across treatments) 425 425 425 425 425
Diet proximate specifications
Crude protein (g/kg DM) 404 401 394 397 387
Crude fat (g/kg DM) 75 77 79 87 95
Gross ash (g/kg DM) 144 135 129 126 120
Crude Fibre (g/kg DM) 44 42 41 40 41
NFE (g/kg DM) 333 345 357 350 357
Gross Energy (MJ/kg DM) 18.26 18.47 18.60 18.86 19.06
Lysine (g/ 160 g N) 67 65 63 62 61
Methionine (g/ 160 g N) 20 20 19 19 18
Prawn performance criteria
Initial weight (g) 4.40 4.32 4.38 4.41 4.27
Final weight (g) 8.22 8.02 7.84 7.49 6.73
DGC (%/d) 0.90 0.89 0.83 0.75 0.63
FCR (g fed / g gain) 2.30 2.26 2.54 2.72 2.97
Feed intake (g/prawn/d) 0.207 0.199 0.209 0.199 0.173
Survival (%) 87 87 87 87 87
N retention (%) 20.3 20.9 20.8 16.6 15.6

89
nitrogenous and iso-energetic, though notably
only on a gross basis. Interestingly, the dietary
lysine and methionine levels remained
relatively constant, despite large levels of
substitution of soybean meal for L. albus
kernel meal, without the use of supplemental
crystaline amino acids. These inconsistencies
were not explained.
Growth performance of prawns fed the
experimental diets supported that L. albus
kernel meal could only effectively replace up to
50% of the soybean meal in the diet (Table
4.42). These observations were consistent
with what was reported by these workers in an
earlier study (Sudaryono et al., 1999a), where
they observed the nutritional and biological
value of L. albus kernel meal to be less than
that of soybean meal. In light of the findings of
this earlier study it was interesting that these
workers chose to use L. albus kernel meal in
the second study, when L. angustifolius kernel
meal had been shown to be superior to not
only L. albus kernel meal, but also soybean
meal. Consistent with what was reported in the
earlier study, the food conversion ratios and
nitrogen retention values also deteriorated with
increased inclusion of L. albus kernel meal in
the diet. Whilst there was some correlation of
the deterioration in these performance criteria
with a declining feed intake, this too was not
conclusive.
Figure 19. Meals, particularly those of the kernels, of both L. angustifolius and soybean have been shown to
provide good nutritional value in shrimp diets

90
4.10 Freshwater crayfish
Considerable development of freshwater
crayfish culture has taken place in Australia in
recent years (Morrissy et al., 1995; Lawrence
1998). The largest industry sector is for
production of the yabby, Cherax albidus,
although other species such as C. destructor,
C. tenuimanus and C. quadricarinatus are also
produced. Typically, the production systems
and feeds used with these species are low
intensity and trophic demands are also not
high. Feeds are considerably less specified
than those used in the prawn farming sector
and accordingly cost efficiency of feed use has
been more paramount than production
efficiency. Comparatively limited work has
been undertaken examining the development
of specific feeds for any of the Cherax spp., let
alone the use of lupins in their diets. The
greatest use of lupins in this sector has been
within that of the yabby industries, notably in
the diets of C. albidus.
4.10.1 Yabbies
Considerable work has been undertaken by
Lawrence et al. (1998; 2000) in which the use
of L. albus as a feed for C. albidus has been
reported. In these studies L. albus whole seed,
rolled and cracked, was used as a whole feed,
fed at a range of provision rates and was also
compared against a range of other
commodities and compound feeds. Of
particular note in these studies is that they
were conducted in replicated (n=3) pond
studies, thereby maintaining particular
relevance to industry practices.
Initial studies (Lawrence et al., 1998),
examined the use of L. albus whole seed,
rolled and cracked and fed at 2.5 g / m2/ week
and was compared to an unfed control (Table
4.43). Growth by yabbies in this treatment was
significantly faster than that of those from the
unfed treatment, though there were no
significant differences in survival between the
two treatments. These findings support that
the use of L. albus whole seed, rolled and
cracked, supports production of yabbies to a
higher production rate than that obtained from
natural productivity within the ponds. The
comparatively high level of growth seen in the
unfed control gives strong indication of the
level of natural productivity available within the
pond systems used in these studies.
Table 4.43 Growth and survival of yabbies (Cherax albidus) fed either L. albus rolled whole-seed (2.5
g/ m2/ week) or unfed. Data derived from Lawrence et al. (1998).
Unfed L. albus whole-seed rolled
Initial weight (g) 19.4 19.4
Final weight (g) 32.8 38.9
DGC (%/d) 0.49 0.67
Survival (%) 69 68

91
A second study (Lawrence et al., 1998), also
in pond systems, examined the comparative
value of L. albus whole seed, rolled and
cracked, and fed at two rates (2.5 g / m2/ week
and 5.0 g / m2/ week) and was compared to
the use of a Crayfish Reference Diet (CRD)
designed for freshwater crayfish research
(Morrissy, 1992; Lawrence et al., 1998). The
CRD was fed at 2.5 g / m2/ week.
Growth by yabbies fed the CRD was
significantly faster than that of yabbies fed L.
albus whole seed, rolled and cracked, and fed
at the same feed rate (2.5 g / m2/ week).
However, the growth was not significantly
faster than that of the yabbies fed the lupins at
5.0 g / m2/ week (Table 4.44). This suggests
that the CRD was more efficient on a weight
for weight basis. However, that the CRD
contains 18% lupins supports that
considerable potential still exists for lupins as
as an ingredient of formulated crayfish diets
(Lawrence et al., 1998). It would have been of
value if this study had further quantified both
total nitrogen and energy flows within the
pond ecosystem to ascertain if the
predominant factor driving production was
nitrogen or energy. Similarly, studies to assess
whether the yabbies were actually eating the
lupins,or whether the lupins were actually
supporting improved productivity through
increasing the natural productivity would also
be of value.
Notably, survival of both of the two lupin fed
treatments was not significantly different than
that obtained from yabbies fed the compound,
crustacean reference diet (Table 4.44).
Economic analyses (C. Lawrence,
unpublished data) confirm that feeding yabbies
the crayfish reference diet is more profitable
than providing lupins. It should be noted that
successful formulated feeds for yabbies in
dams may contain about 20% lupin meal
(Lawrence and Morrissy, 2000).
Table 4.44 Growth and survival of yabbies (Cherax albidus) fed either of two feed rates of L. albus rolled
whole-seed or a practical crustacean reference diet.
Treatment 1 Treatment 2 Treatment 3
Diet feed rates (g/m2/week)
Crayfish reference diet 2.5 - -
L. albus whole-seed rolled - 2.5 5
Performance criteria
Initial weight (g) 19.5 19.5 19.5
Final weight (g) 53.4 47.7 51.6
DGC (%/d) 0.61 0.53 0.59
Survival (%) 56 79 75
FCR (g fed / g gain) 2.63 3.31 4.99

92
While these three studies provide a very basic
account for the value of L. albus to yabbies
when fed in an extensive pond system, they
provide few meaningful data on the intrinsic
nutritional value of lupins to these animals per
se. The differences in technical approach
between this series of studies and the style
undertaken with prawns clearly show the level
of nutritional understanding of either species.
However, the practical relevance of either
approach could easily be argued in favour of
the style of work done with the yabbies, given
the highly complex trophic systems involved
with pond aquaculture, and the potential
irrelevance of tank based data.
4.10.2 Marron
The amount of nutritional work that has been
undertaken on marron (Cherax tenuimanus) is
considerably greater than that that has been
undertaken on yabbies (Morrissy, 1982; 1992).
However, this does not extend to the amount
of information available on the use of feed
ingredients when fed to this species. To date
the only available literature where lupins had
been fed to marron is an abstract reviewed in
Morrissy (1992).
A study (abstract by; Bennison and Morrissy,
1990) where lupin (assumed to be L.
angustifolius whole-seed) meal was included
in a standard reference diet at either or two
inclusion levels was undertaken. Lupins were
included in a pelleted reference diet at either
18% or 73% at the expense of a wheat
component. The increase in lupin content of
the marron feed was also noted to have
increased the diet protein content from 225
g/kg AF, to 329 g/kg AF. The diets were used
on a commercial marron farm being fed to
pond reared marron. Details of the feeding
regime were not supplied. Specific
performance details of the marron fed the diets
were not supplied, but it was stated that mean
size, total biomass and survival for the two
feed groups were essentially identical.
Few other studies involving marron being fed
lupins have been reported.
Figure 20. Marron

94
4.11 Abalone (Haliotis spp.)
Abalone culture is a relatively new aquaculture
industry that has relied heavily on seaweeds
however, the use of compound diets has
become more commercially acceptable,
particularly in Australia (Fleming et al., 1996).
Several studies have been published
examining the nutritional value of several
commonly used ingredients, including lupins,
when fed to the greenlip abalone (Haliotis
laevigata). No studies were identified where
the biological value of lupins was reported.
Fleming et al. (1998), studying the greenlip
abalone (Haliotis laevigata), reported the
digestibility values of a diet in which L.
angustifolius kernel meal (cv. Gungurru)
represented 100% of the dietary protein and
also several compounded diets in which this
meal represented significant proportions of the
total diet (Table 4.46). Key aspects of this
study included the determination of nitrogen
and energy digestibilities by this species, but
also the digestibilities of key amino acids.
Assessment of the specific digestible value of
the lupin kernel meal was made based on
known characteristics of other potentially
confounding ingredients, such as pregelled
starch or casein. Nitrogen digestibility of the
diet in which the lupin kernel meal represented
all of the dietary nitrogen was 91%. Energy
digestibility of this diet was 80%. Amino acid
digestibilities were consistently high ranging
from 86% for isoleucine to 95% for arginine.
Lysine digestibility was 91%, methionine
digestibility, surprisingly given the importance
of this amino acid in diets formulated with lupin
kernel meal, was not reported (Table 4.46). In
comparison, a diet, in which all protein was
provided by fishmeal, which notably had a
much higher protein level, had substantially
lower nitrogen (43%) and energy (51%)
digestibilities. All amino acid digestibilities of
the fishmeal diet were also substantially lower
than that of lupin kernel meal diet (Table 4.46).
No reasons were given for the low nutritional
value of fish meal for this species. Though
notably the total protein content of this diet
was substantially higher than that reported to
be optimal for this species (Coote et al., 2001).
Digestibilities of the assessed, compounded
diets varied depending on the composition of
the diets evaluated. Though each of the diets
contained lupin kernel meal at the same
inclusion level (300 g/kg), the addition of
semolina, barley or both combined, along with
casein had variable effects on the digestibility
values observed. Dietary nitrogen digestibility
substantially diminished (84%) with 400 g/kg
inclusion of semolina and 158 g/kg inclusion of
casein. Energy digestibility of this diet was
also substantially reduced (64%) compared to
the diet in which the lupin kernel meal
represented the only protein source. In
comparison, the diet with 400 g/kg inclusion of
barley and 149 g/kg inclusion of casein had a
nitrogen digestibility of 86%, marginally higher
than that of the semolina compounded diet. In
contrast though the energy digestibility was
marginally lower at 57%. The diet in which 200
g/kg of each of semolina and barley and 153
g/kg of casein were added to 300 g/kg of lupin
kernel meal had digestibility values
intermediate of those in which just one of
either semolina or barley was included with the
lupin kernel meal. These findings support that
lupin kernel meals have substantial nutritional
value to abalone, considerably superior to that
of other meals such as fishmeal.

95
Table 4.46 Utilisation of L. angustifolius kernel meal and fishmeal by the greenlip abalone (Haliotis
laevigata). Data derived from Fleming et al. (1998).
Lupin Fishmeal Diet A Diet B Diet C
Diet ingredients (g/kg)
L. angustifolius kernel meal 700 - 300 300 300
Semolina - - 400 - 200
Barley - - - 400 200
Fishmeal - 700 - - -
Casein - - 158 149 153.5
Pregelled starch 264.2 264.2 106.2 115.2 110.7
Remains (uniform across treatments) 35.8 35.8 35.8 35.8 35.8
Diet proximate specifications
Dry matter (g/kg) 907 936 932 913 910
Crude protein (g/kg DM) 261 496 302 297 302
Crude fat (g/kg DM) 73 91 31 28 30
Gross ash (g/kg DM) 32 123 30 21 27
Gross energy (MJ/kg DM) 19.32 19.88 19.41 19.34 19.36
Abalone digestibility criteria
Nitrogen (%) 91 43 84 86 85
Energy (%) 80 51 61 57 60
Lysine (%) 91 42 87 88 86
Threonine (%) 89 36 83 85 83
Methionine (%) n/d n/d n/d n/d n/d
Isoleucine (%) 86 33 83 84 80
Leucine (%) 88 36 84 86 83
Tryptophan (%) n/d n/d n/d n/d n/d
Valine (%) 88 33 85 86 84
Phenylalanine (%) 89 34 84 86 83
Histidine (%) 91 48 88 89 87
Arginine (%) 95 37 87 90 85
n/d : not determined.

96
Fleming et al. (1998) in discussing the
implications of their findings suggested that,
unlike many other monogastric animals,
abalone did not have problems with dealing
with dietary NSP. It was stated that this was
consistent with this species natural diet and
that it reputedly had substantial levels of
endogenous carbohydrases (Fleming et al.,
1996). Little comment was made on the
relative values of each of the protein resources
evaluated by these workers.
Vandepeer et al. (1999), evaluated the
nutritional value of a range of legume meals to
the greenlip abalone and also examined the
effects of autoclaving of the meals to mimic
the influence of extrusion processing. Each of
the legume meals was also included in
another series of treatments, where each was
supplemented with the exogenous enzyme
phytase. The data on the phytase
supplementation to the meals is not presented
in Table 4.47. Legume meals included in the
study were, L. luteus whole-seed meal,
defatted soybean meal, Field pea meal, Vetch
meal and Faba bean meal (Table 4.47). As
with the study by Fleming et al. (1998), key
aspects of this study also included the
determination of nitrogen and energy
digestibilities by this species. The digestibilities
of key amino acids were also determined,
though only those of lysine and methionine are
presented here.
Assessment of the nitrogen digestibility of
each of the ingredients clearly identified the L.
luteus whole-seed meal as having the most
digestible dietary nitrogen (91%). The level of
nitrogen digestibility of the L. luteus whole-
seed meal was significantly better than that of
the soybean meal (87%), faba bean meal
(85%) and the vetch and pea meals (both
75%). Energy digetibilities of the soybean
meal and the L. luteus whole-seed meal were
not significantly different from each other (84%
and 83% respectively), though were
considerably better that those of all the other
meal types (Table 4.47). Dry matter
digestibilties of the diets were best for the L.
luteus whole-seed meal diet (61%), which was
marginally better than that of the soybean
meal diet (57%). Dry matter digestibilities of all
the other diets were poor, typically being lower
than 50%, with some as low as 25%.
Digestibilities of lysine and methionine were
consistently high ranging from 76% for to 92%
for lysine. Highest lysine digestibility was
observed from the L. luteus whole-seed meal,
though this was not significantly better than
that of the soybean meal. Lysine digestibilties
of the other three meals were lower than that
of both the soybean and the L. luteus whole-
seed meals (Table 4.47). Methionine
digestibility, was slightly better in the soybean
meal than that of the L. luteus whole-seed
meal (92% cf. 87%). Digestibilities of
methionine in the other meals were generally
lower, with faba bean meal being the
exception (89%) (Table 4.47). Phosphorus
digestibility was clearly best in the pea and
faba bean meals (94% and 93% respectively),
with each of the other meals, including the L.
luteus whole-seed meal, having lower
phosphorus digestibilities (84% to 86%) (Table
4.47).
Autoclaving of the meals had appreciable
effects on the nutritive value of all of the meals
examined in this study. Nitrogen digestibilties,
along with those of the amino acids, were the

97
most significantly affected, with consistent
decreases in digestibility values across all
meals (Table 4.47). It was suggested that this
may have been the result of Maillard reactions
rendering much of the protein unavailable
though the formation of amino-sugar
complexes (van Barneveld 1993) occuring with
the autoclaving of the meals. Contrasting this
was the influence on energy digestibilities.
Energy digestibilities of both the soybean and
the L. luteus whole-seed meals decrease with
autoclaving, though the digestibilties of the
other three meals substantially improved
(Table 4.47). It is suspected that this effect is
attributable to the low starch levels in both the
soybean and the L. luteus whole-seed meals,
but appreciable levels in the vetch, faba bean
and pea meals. Phosphorus digestibilities
were unaffected by autoclaving (Table 4.47).
Though not presented in Table 4.47, it was
noted that for the phytase supplemented
treatments, only the level of phosphorus
digestibility was improved in the L. luteus
whole-seed meal. Improvements in the dry
matter digestibilities of faba bean meal, vetch
meal were also observed, as were some
improvements in the digestibility of the
nitrogen content of vetch meal, and some
amino acids in pea meal, faba bean meal and
vetch meal.
Vandepeer et al. (1999) in discussing the
implications of their findings suggested that L.
luteus whole-seed meal was a suitable
feedstuff for use in artificial diets for abalone.
These workers also suggested that future
studies on legume use in the diets of abalone
needed to address issues associated with
inclusion levels and processing time and
temperatures.
An accessory study to that of Vandepeer et al.
(1999) was reported by Kemp et al. (1999).
The same treatments as used by Vandepeer
et al. (1999) were sampled to assess small
intestine brush border membrane vesicles
(BBMV) function. These vesicles were used to
assay the activities of a range of enzymes
from the small intestine of these animals
(Table 4.48).
Activities of the enzymes assayed in this study
were used as an indication of the relative
enrichment in enzymatic activity and the
influence of a particular diet and/or ingredient
on the biochemical processes associated with
nutrient uptake and digestion.
Activities of alkaline phosphatase in the BBMV
were higher in the soybean and vetch meal fed
abalone, though notably the activity of alkaline
phosphatase from the L. luteus whole-seed
meal fed abalone were not as low as those fed
either pea or faba bean meals (Table 4.48).
Similarly, activities of the BBMV acid
phosphatases were also highest in the vetch
and soybean meal fed abalone, though activity
of the acid phosphatase from the L. luteus
whole-seed meal fed abalone BBMV was the
lowest of all treatments.
Activities of the carbohydrase enzymes
(maltase and β-galactosidase) in the BBMV
from each of the treatments were only partially
consistent with the observations of the
phosphatase enzymes (Table 4.48). Maltase
activity from BBMV was highest in abalone fed
the soybean meal, though these activities
were similar to those observed from abalone
fed either the L. luteus whole-seed meal or
pea meal (Table 4.48). The activities of β-
galactosidase from BBMV were highest in

98
soybean meal and lowest in the L. luteus
whole-seed meal. The β-galactosidase
activities were generally consistent with the
pattern observed from both the phosphatase
enzymes (Table 4.48).
The autoclaving of the protein meals had
some affects on the activities of the enzymes
assayed in this study. Autoclaving of soybean
meal reduced the activity of both phosphatase
enzymes. Activity of the maltases, from BBMV
of abalone fed the soybean meal diet was not
influenced by the autoclaving of the meal,
though β-galactosidase were considerably
reduced. In contrast, the autoclaving of the L.
luteus whole-seed meal increased the activity
of alkaline phosphatases, but reduced the
activity of the acid phosphatase. Activities of
both carbohydrase enzymes were increased
with the autoclaving of the L. luteus whole-
seed meal (Table 4.48). Autoclaving of the pea
meal improved the activities of both
phosphatases and the β-galactosidase, though
not the maltase (Table 4.48). Autoclaving of
both the vetch and the faba bean meal had
little effect on the alkaline phosphatases,
though responses of the acid phosphatases
were more variable. Maltase activitie were
increase in both meals with autoclaving,
though the β-galactosidase activities increased
in the faba bean meal, but decreased in the
vetch (Table 4.48).
In discussing the implications of this study,
Kemp et al. (1999) suggested that the
elevated enzyme activities were most likely a
response aimed at obtaining more nutrients
from each respective diet. Few specific
comments were made by the authors on what
the differences in enzyme activities between
the different diets implied. However, these
workers did add that they supported the
observations of Vandepeer et al. (1999) in
suggesting that L. luteus whole-seed meal was
a suitable ingredient for use in diets for
greenlip abalone. Kemp et al. (1999) also
suggested that defatted soybean meal was
also a useful ingredient in abalone diets. Little
support was offered for the use of either vetch
or beans as a feed ingredient in the diets of
abalone, though suggestions were made that
they might be viable options at lower inclusion
levels and that this needed further
investigation. These workers also suggested
that the complementarity between the
membrane vesicle studies and the digestibility
studies provided good support for use of
membrane vesicle as an alternative method of
ingredient and diet evaluation. It would have
been of value to conduct a more defined
comparison of the complementarily between
the membrane vesicle studies and the
digestibility studies than that presented in the
study by Kemp et al. (1999). Determination of
correlations between the two study methods
would allow a more objective assessment on
the value of membrane vesicle studies as a
means of assessing ingredients.
Figure 21. Greenlip abalone (Haliotis laevigata)

99
Table 4.47 Utilisation of legume meals by the greenlip abalone (Haliotis laevigata). Data derived from
Vandepeer et al. (1999).
1 2 3 4 5 6 7 8 9 10
Raw grains Autoclaved grains
Diet ingredients (g/kg)
Defatted soybean meal 333 - - - - 333 - - - -
L. luteus whole-seed meal - 390 - - - - 390 - - -
Field pea meal - - 743 - - - - 743 - -
Vetch meal - - - 638 - - - - 638 -
Faba bean meal - - - - 664 - - - - 664
Kaolin 200 200 200 200 200 200 200 200 200 200
Pregelled starch 432 375 222 127 101 432 375 222 127 101
Remains 35 35 35 35 35 35 35 35 35 35
Diet proximate composition
Crude protein (g/kg DM) 179 175 183 180 175 173 171 184 174 174
Crude fat (g/kg DM) 10 20 20 10 13 12 28 31 21 29
Ash (g/kg DM) 235 218 227 231 227 225 219 312 223 218
Crude fibre (g/kg DM) 17 68 60 42 59 3 65 43 39 64
Lysine (g/kg DM) 99 72 111 93 92 83 59 105 88 94
Methionine (g/kg DM) 32 11 13 11 18 25 13 18 21 13
Gross energy (MJ/kg DM) 14.61 14.91 14.84 14.70 14.88 14.59 15.02 18.56 14.69 14.72
Apparent Digestibilities
Nitrogen / Protein 87 91 75 75 85 66 68 69 69 71
Energy 84 83 49 45 65 68 63 60 56 60
Dry matter 57 61 25 29 42 58 54 57 34 44
Lysine 91 92 80 76 88 63 56 70 68 71
Methionine 92 87 68 55 89 76 59 53 75 68
Phosphorus 86 84 94 85 93 84 78 88 73 77

100
Table 4.48 Utilisation of legume meals by the greenlip abalone (Haliotis laevigata). Data derived from Kemp et al. (1999).
1 2 3 4 5 6 7 8 9 10
Raw grains Autoclaved grains
Diet ingredients (g/kg)
Defatted soybean meal 333 - - - - 333 - - - -
L. luteus whole-seed meal - 390 - - - - 390 - - -
Field pea meal - - 743 - - - - 743 - -
Vetch meal - - - 638 - - - - 638 -
Faba bean meal - - - - 664 - - - - 664
Kaolin 200 200 200 200 200 200 200 200 200 200
Pregelled starch 432 375 222 127 101 432 375 222 127 101
Remains (unform across treatments) 35 35 35 35 35 35 35 35 35 35
Diet proximate composition See table 4.47
Enzyme activities*
Alkaline phosphatase (µmol / mg protein / h) 6.7 5.0 4.5 6.5 4.6 4.6 6.0 6.1 6.7 6.5
Acid phosphatase (µmol / mg protein / h) 2.7 0.6 1.0 3.4 1.2 1.0 0.4 2.5 0.7 3.0
Maltase 5.0 4.8 4.8 3.6 2.8 5.0 6.1 4.6 4.8 3.7
β-Galactosidase 1.5 0 0.6 2.0 0.6 0.3 0.6 2.0 0.4 2.2
* Figures are approximations only, determined from interpretation of graphical data.

101
5.1 Lupins in aquafeed processing In practical considerations, the nutritional
value of lupins plays only part of the
importance in whether they are used in
commercial diets, and to what extent. The
influence that lupins play in the physical
characteristics of aquaculture diets is also an
important feature though it has not been a
prominent feature of research to date. There
are, however, some studies where the effects
on the physical characteristics of pellets have
been examined using both pellet press and
extrusion technology.
Traditionally fish and crustacean feeds were
made using either screw or pellet press
machines. In some instances this included the
addition of steam. Generally with these
processing technologies, inclusion of fat levels
greater that 15% of the diet were not practical.
Similarly, the loss of fines and rates of
leaching losses from such pellets were often
high (Tacon, 1990).
Modern feeds, particularly those fed in
intensive fin-fish culture, are usually an
extruded product. These feeds typically have a
high degree of starch gelatinisation, can hold
fat levels greater than 30% of the diet, have
fines losses usually less than 1% and similar
low levels of leaching losses. However, the
processes involved in the preparation of such
feeds are typically more costly and
complicated.
A study on the nutritional value of several
varieties and processing forms of lupins in
diets for the giant tiger prawn, P. monodon, by
Sudaryono et al. (1999a) also examined the
pelleting characteristics and water stability of
the diets. The treatments evaluated included
L. albus whole-seed and kernel meals,
soybean meal, L. angustifolius kernel meal
and a lupin protein concentrate (see Table
4.41 and section 4.9 for details on the
nutritional and biological performance of these
diets).
In this experiment, the most stable pellet, with
the least dry matter loss, was observed from
the diet with the inclusion of lupin protein
concentrate, followed by that using the
soybean meal and the two lupin kernel meals.
The least stable diet was that which included
the L. albus whole-seed meal. There were no
significant differences in leaching losses
between L. angustifolius and L. albus kernel
(Table 5.1).
Complicating the interpretation of these
observations though is the concomitant
change in the inclusion levels of other
ingredients in the diets. Notably, changes in
the levels of wheat flour, rice bran and fish oil
were made to allow nutrient balancing of the
diets in addition to the use of the various lupin
and soybean meals.
This study provided a basic account of the
potential differences obtained in the water
stability of the pellets encountered with the
dehulling of the L. albus seeds. This
observation is of note, in that the same
process has also reported an improvement to
the nutritional attributes of lupins to most
species where the whole-seed and kernel
meals have been compared. Of interest
though is that the lupin protein concentrate
gave the best water stability characteristics. It

102
would be of value to further define the binding
characteristics of lupin meals in diets for
prawns, to more fully understand why the
removal of the NSP component of the meal
improves these properties.
In a second study by the same workers
(Sudaryono et al., 1999b), the influence of the
serial dilution of the soybean component of
prawn diets with L. albus kernel meal was
evaluated (see Table 4.42 and section 4.9 for
details on the nutritional and biological
performance of these diets). In this study, a
minor improvement in the water stability
characteristics of the pellets was observed
with the inclusion of L. albus kernel meal up to
a 75% replacement of the soybean meal
component of the diet. With 100%
replacement of the soybean meal in the diet
with L. albus kernel meal a substantial
deterioration in the water stability of the pellets
was observed (Table 5.2).
As with the earlier study by this group
(Sudaryono et al., 1999a) the addition of other
key ingredients to the diet when lupins were
used to replace the soybean meal complicates
the interpretation of this study. Notably, details
on particle sizes of each of the meals were
also not indicated. Although clear evidence on
the influence of particle size on pellet stability
is lacking, anecdotal observations (B.
Glencross, unpublished) have suggested that
this may also be an important factor in pellet
stability of pellet-pressed shrimp diets. Other
notable points include that changes with
increasing L. albus kernel meal content were
concomitant with an increase in wheat flour
content and a decrease in rice bran content of
the experimental diets in this study.
Few studies have been conducted where
lupins have been examined as a component of
extruded aquaculture diets. As part of
Australia’s Fisheries Research and
Development Corporations Fishmeal
Replacement Subprogram, a series of studies
were undertaken by Gleeson et al. (1998a).
These studies compared the properties of
soybean meal, a L. angustifolius (cv.
Gungurru) protein concentrate, and a field pea
(Pisum sativum, cv. Dun) protein concentrate
to a fishmeal reference diet (Table 5.3), when
processed as Atlantic salmon feeds through a
twin-screw extrusion system (Pilot scale - APV
MFP40, APV-Baker, Peterborough, England),
(see Table 4.15 and section 4.1.2 for details
on the nutritional and biological performance
of these diets). To minimise complications
associated through the different inclusion
levels of ingredients in the diets and variable
nutrient levels, the diets were formulated to
each provide about 400 g/kg of crude protein
and 220 g/kg of crude fat, whilst including
each of the plant protein resources at about
280 g/kg (273 to 292 g/kg). Starch levels
present in the diets were also kept constant at
about 23.2 g/kg.

103
Table 5.1 Water stability characteristics of diets formulated for by the prawn, Penaeus monodon, containing
substantial levels of soybean, L. albus whole-seed and kernel meals and L. angustfolius kernel
meal and lupin protein concentrate. For corresponding nutritional performance of prawns fed the
diets see section 4.9, and Table 4.41. Data derived from Sudaryono et al. (1999a).
Soybean L. albus L. angustifolius
whole- kernel kernel concentrate
Diet ingredients (g/kg)
Soybean meal 300 - - - -
L. albus whole-seed meal - 400 - - -
L. albus kernel meal - - 350 - -
L. angustifolius kernel meal - - - 360 -
Lupin protein concentrate - - - - 240
Wheat flour 215 185 235 225 285
Rice bran 50 - - - 50
Fish oil 20 - - - 10
Fish meal 240 240 240 240 240
Squid meal 50 50 50 50 50
Shrimp meal 70 70 70 70 70
Dicalcium phosphate 10 10 10 10 10
Vitamin premix 10 10 10 10 10
Carboxymethylcellulose 20 20 20 20 20
Soy lecithin 10 10 10 10 10
Chromic oxide 5 5 5 5 5
Period of water immersion Percent of dry matter retained
1 hour 86.4 78.5 83.2 83.5 88.7
2 hours 83.4 76.2 80.0 79.9 86.2
4 hours 82.0 75.4 78.9 78.3 84.3
8 hours 80.4 73.8 77.3 76.7 83.4

104
Table 5.2 Water stability characteristics of diets formulated for the prawn, Penaues monodon examining
replacement of soybean meal with L. albus kernel meal. For the corresponding nutritional
performance of prawns fed the diets see section 4.9, and Table 4.42. Data derived from
Sudaryono et al. (1999b).
Soybean meal replacements level (%)
0 25 50 75 100
Diet ingredients (g/kg)
Soybean meal 300 225 150 75 0
L. albus kernel meal 0 90 170 260 350
Wheat flour 185 200 225 230 225
Rice bran 90 60 30 10 0
Fishmeal 240 240 240 240 240
Squid meal 50 50 50 50 50
Shrimp meal 70 70 70 70 70
Fish oil 10 10 10 10 10
Dicalcium phosphate 10 10 10 10 10
Soy lecithin 10 10 10 10 10
Vitamin and mineral premix 10 10 10 10 10
Carboxymethylcellulose 20 20 20 20 20
Chromic oxide 5 5 5 5 5
Period of water immersion Percent of dry matter retained
1 hour 81.6 82.1 84.6 82.3 79.1
2 hours 79.4 80.0 82.7 81.5 76.2
4 hours 78.2 78.6 82.0 81.1 75.7
8 hours 76.3 76.6 79.7 79.5 74.1

105
Table 5.3 Formulations and proximate composition of test diets, processed through feed extrusion, evaluating the
processing influences of plant protein resource inclusion. Data derived from Gleeson et al. (1998a).
Reference Soybean L. angustifolius PC Pea PC
Ingredients
Fishmeal 601.5 400.0 400.0 400.0
Soybean meal (defatted) - 272.9 - -
L. angustifolius protein concentrate - - 291.9 -
Pea protein concentrate - - - 275.7
Methionine - 5.0 6.0 6.0
Fish oil 154.6 159.2 156.4 168.9
Vitamin and mineral premix 7.5 7.5 7.5 7.5
Bentonite 48.2 - - -
Cellulose 50.0 17.2 - 26.7
Wheat flour 115.0 115.0 115.0 115.0
Wheat starch 23.2 23.2 23.2 0.2
Diet proximate composition
Crude Protein (g/kg DM) 410 410 410 410
Crude Fat (g/kg DM) 220 220 220 220
Spray on oil (g/kg DM) 154.6 159.2 156.4 168.9
Total starch (g/kg DM) 105 105 105 105

106
Table 5.4 Pellet characteristics of Atlantic salmon diets including plant protein resources, extruded at
variable temperatures and screw speeds. Data derived from Gleeson et al. (1998a).
Pellet characteristics Reference Soybean L. angustifolius PC Pea PC
Temperature: 66°C-82°C, Screw Speed: 200 rpm
Radial expansion (%) 15.7 28.4 7.7 19.2
Oil absorption (%) 33.2 27.0 15.4 25.2
Bulk density (g/L) 556.6 622.1 735.3 638.2
Sinking rate (cm/s) 0.0 0.5 8.2 4.6
Durability (% loss) 0.5 0.3 0.9 3.0
Shear strength (N/mm2) 1.6 1.2 1.5 1.2
Hardness (N/mm2) 9.7 13.5 17.3 19.0
Starch gelatinisation (%) 89.4 97.4 40.1 71.5
Temperature: 88°C-93°C, Screw Speed: 250 rpm
Radial expansion (%) 21.4 29.3 25.7 29.6
Oil absorption (%) 39.1 28.8 21.6 24.1
Bulk density (g/L) 520.2 611.3 704.9 646.8
Sinking rate (cm/s) 0.0 1.7 4.4 4.5
Durability (% loss) 0.5 0.6 0.6 0.4
Shear strength (N/mm2) 1.0 1.3 1.3 1.2
Hardness (N/mm2) 8.3 17.7 16.7 15.5
Starch gelatinisation (%) 90.6 89.0 96.7 91.3
Temperature: 137°C-149°C, Screw Speed: 350 rpm
Radial expansion (%) 19.5 30.6 30.1 28.9
Oil absorption (%) 38.2 28.9 22.0 27.5
Bulk density (g/L) 496.2 596.7 678.2 582.2
Sinking rate (cm/s) 2.5 4.5 4.4 1.3
Durability (% loss) 3.3 2.8 0.8 1.5
Shear strength (N/mm2) 0.9 1.4 1.5 1.5
Hardness (N/mm2) 9.4 23.5 22.8 22.4
Starch gelatinisation (%) 83.6 87.3 91.5 84.8

107
A range of pellet characteristics of these feeds
was modeled using response-surface
methodologies, under a range of processing
variables. The key processing variables
included screw speed and product
temperature, though notably residence time of
the mash in the extrusion barrel also varies as
a function of these two key parameters. The
pellet characteristics examined included radial
expansion, bulk density, oil absorption, sinking
rates, durability, shear strength, hardness and
also the degree of starch gelatinisation (Table
5.4).
Each of the pellet characteristics were
assessed in specific tests (Evans, 1998).
Radial expansion was assessed by the relative
change in pellet diameter observed between
the die pore diameter and the final pellet
diameter. Bulk density was determined on a
weight by volume basis. The oil absorption
capacity of the pellets was assessed by
measuring the weight of oil uptake before and
after excess oil addition. The total capacity
then being expressed as a sum of the uptake
and original oil present in the pellets. The sink
rates of the pellets were determined by the
time taken for a pellet to sink a defined
distance through water. The durability of the
pellets was assessed by measuring the losses
obtained from tumbling a defined weight of
pellets in a dust tight barrel at 50 rpm, for ten
minutes, after which the fines were removed
with a further sieving for two minutes and re-
weighing. The lateral shear strength and
hardness of the pellets were determined by
measuring compressional force required to
either split or crush the pellet, according to
specific blades used on a TA-XT2 texture
analyser (Arrow Scientific Pty., Ltd.,
Leichhardt, NSW, Australia). Shear strength of
the pellets was defined as the peak force at
breaking. Hardness of the pellet was defined
as the peak force at breaking, divided by the
distance the blade had to move from point of
first contact with the pellet till it broke. The
degree of starch gelatinisation achieved within
the pellets following the extrusion process was
assessed using enzymatic methods as
described by Evans (1998).
The three plant protein resources tested in this
study had quite different attributes in the way
they responded to processing as key
ingredients in extruded Atlantic salmon feeds.
The greatest degree of radial expansion was
observed with the use of soybean meal,
though this was not substantially different from
that observed of the pea PC. Greater
expansion was observed at higher
temperatures and with faster screw speeds.
Minimal radial expansion was observed of the
L. angustifolius PC diet at low temperatures
and slow screw speeds, though at higher
temperatures and faster screw speeds the
amount of radial expansion of the pellets was
similar to that of the other plant protien
treatments and considerably more than that of
the reference fishmeal based diet (Table 5.4).
Oil absorption was influenced both by
processing conditions and ingredient use
(Table 5.4). Generally, oil absorption of the
soybean meal diets was influenced by
production temperature, but not screw speed.
In contrast the oil absorption of the L.
angustifolius PC diets was influenced by both
production temperature and screw speed. The
greatest degree of oil absorption was

108
observed with the use of soybean meal,
though this was similar to the level of oil
absorption observed of the pea PC (Table
5.4). Greater oil absorption was also observed
at higher temperatures and faster screw
speeds (Table 5.4). Similar to the observations
with radial expansion, minimal oil absorption
was observed of the L. angustifolius PC diet at
low temperatures and slow screw speeds.
Although at higher temperatures and faster
screw speeds, the amount of oil absorbed by
the pellets was similar to that of the other plant
protein treatments. Notably, all three plant
protein resources has oil absorption levels
considerably less than that of the reference
fishmeal based diet (Table 5.4).
Bulk density was highest in pellets that were
made at the lower temperatures and screw
speeds. Typically, the L. angustifolius PC diets
had a higher bulk density that that of both the
soybean and pea PC based diets (Table 5.4).
The lowest bulk density, under any of the
processing conditions, was that with the
reference fishmeal based diet.
Sinking rates of the pellets were influenced
primarily by bulk density, with the densest
pellets also being those with the fastest
sinking rates. However, those pellets with the
lowest bulk density (high temperature and
screw speed produced reference fishmeal
based diet), were not necessarily the pellets
with the slowest sink rates (Table 5.4). Pellets
of the reference fishmeal based diet, made at
low temperatures and screw speeds produced
floating pellets. None of the plant protein
resource diets resulted in floating pellets,
under any of the processing conditions
reported. However, the soybean meal based
diets produced consistently slower sinking
pellets than either pea PC, or the L.
angustifolius PC diets which were consistently
faster sinking.
Pellets made of the L. angustifolius PC diet
overall had the best durability of the three
plant protein resources and reference diets
tested (Table 5.4). The greatest variability in
the durability of the pellets across the
processing conditions was observed from the
reference fishmeal based diet. Generally, at
the lower temperature and slower screw speed
processing conditions, pellets had better
durability (Table 5.4). Pea PC diets contrasted
this trend though with an improvement in pellet
durability with temperature and screw speed
increases, with peak performance observed in
the mid-range of processing conditions
examined.
Pellet shear strength was generally unaffected
by either processing conditions or ingredient
use. Shear strength of the pellets was
however, greatest in pellets of the reference
fishmeal based diet processed at the lowest
temperature and screw speeds. Pellets made
of the L. angustifolius PC diets had
consistently higher shear strength across the
range of processing conditions examined,
marginally better than that observed of both
the soybean meal and pea PC based diets
(Table 5.4).
Pellet hardness was more influenced by
processing conditions than ingredient use
(Table 5.4). However, little change in pellet
hardness was observed in the reference
fishmeal based diet with variable processing
conditions (8.3 to 9.7 N/mm2). The greatest

109
change in pellet hardness with increased
processing temperature and screw speed was
observed of the soybean meal based diet,
though this was not much different from those
effects observed in both the L. angustifolius
PC and pea PC diets (Table 5.4).
Starch gelatinisation was influenced by both
processing and ingredient use. Poorest
gelatinisation was observed in the L.
angustifolius PC diet when processed at the
lower temperatures and screw speeds (Table
5.4). The highest degree of gelatinisation was
observed of the soybean meal diet when also
processed at the lower temperatures and
screw speeds, though this was not much
different from the degree of gelatinisation
observed of the L. angustifolius PC diet when
processed in the mid range of processing
conditions examined. In most diets,
improvements in the degree of starch
gelatinisation where observed with moderate
use of temperature (88°C to 93°C) and
moderate screw speeds.
A series of correlation matrices were also
determined for each of the diets, under the
variable processing conditions. The key finding
for the soybean meal based diets only, was
the high level of correlation (r2 > 0.8) between
oil absorption and bulk density. Few other
relationships were evident between the
various physical characteristics of the soybean
meal based diets.
The L. angustifolius PC diet had considerably
more correlations among the pellet
characteristics than that observed for the
soybean meal based diets. Key correlations of
note (r2 > 0.8) were observed between, radial
expansion and starch gelatinisation, oil
absorption and starch gelatinisation, sinking
rate and bulk density, durability and starch
gelatinisation and the shear strength and
hardness of the pellet.
This study presents a valuable account of the
influence of three plant protein resources on
the characteristics of pellets produced through
extrusion pelleting. Clearly the value of this
study is the identification of the flexibility of the
feed producer to be able to tailor diets of a
defined nutrient composition to a range of
desired physical attributes. This study in this
essence demonstrating that this can be
achieved through control of both ingredient
choice and processing conditions.
An additional study by these same workers
(Gleeson et al., 1998b), also examined the
extrusion processing characteristics of diets
for silver perch, based on the formulations by
Allan et al. (2000). In two of the formulations
included in this processing study, L.
angustifolius kernel meals were included. One
diet containing L. angustifolius kernel meal at
255 g/kg and the other at 73 g/kg. All diets
were formulated to the same digestible protein
and energy contents. However, in comparison
to the study examining the processing
characteristics of the diets for Atlantic salmon
(Gleeson et al., 1998a), the processing
characteristics of the diets formulated for the
silver perch were more difficult to attribute to
specific ingredients, because of the wide
range of ingredients used in each diet, and the
lack of a standardised control. Accordingly, the
specific details of this study are not reviewed
here, despite the use of L. angustifolius kernel
meal in the diets.

110
6.1 Acknowledgements I acknowledge the technical and editorial support of Dr Geoff Allan, Mr Justin Bellanger, Dr Chris
Carter, Dr Sagiv Kolkovski, Dr Craig Lawrence, Dr Greg Maguire, Mr Robert Nelson, Mr David
Petterson, Ms Sandra Seidel, Ms Sofie Sipsas, Mr David Smith, Mr Mark Tucek, Dr Robert van
Barneveld and Dr Kevin Williams. This review was supported by a Grains Research Committee of
W.A. grant.
7.1 References 1. Aksnes, A., Hjertnes, T., Opstvedt, J. (1996) Comparison of two assay methods for
determination of nutrient and energy digestibility in fish. Aquaculture, 140, 343-359. 2. Aksnes, A., Opstvedt, J. (1998) Content of digestible energy in fish feed ingredients determined
by the ingredient-substitution method. Aquaculture, 161, 45-53. 3. Akiyama, D.M.,Coelho, S.R., Lawrence, A.L., Robinson, E.H (1989) Apparent digestibility of
feedstuffs by the marine shrimp Penaeus vannamei Boone. Bulletin of the Japanese Society for Scientific Fisheries 55, 91-98.
4. Alarcon, F.J., Moyano, F.J. and Diaz, M. (1999) Effect of inhibitors present in protein sources on
digestive proteases of juvenile sea bream (Sparus aurata). Aquatic Living Resources 12(4) 233-238.
5. Allan, G.L. and Rowland, S.J. (1998) Fishmeal Replacement in Aquaculture Diets for Silver Perch
Final Report of Project 93/120-01 to the Fisheries Research and Development Corporation,Canberra, Australia, pp 235.
6. Allan, G.L., Gleeson, V.P., Evans, A.J. and Stone, D.A.J. (1998a) Replacement of fishmeal in
diets of silver perch: II. Digestibility of Australian lupins. In: (G.L. Allan and S.J. Rowland, editors), Fishmeal Replacement in Aquaculture Diets for Silver Perch Final Report of Project 93/120-01 to the Fisheries Research and Development Corporation,Canberra, Australia, p 53-71.
7. Allan, G.L., Frances, J. and Booth, M. (1998b) Replacement of fishmeal in diets of silver perch:
IV. Effects of increasing dehulled lupins Lupinus angustifolius (var. Gungurru) on growth and body composition. In: (G.L. Allan and S.J. Rowland, editors), Fishmeal Replacement in Aquaculture Diets for Silver Perch Final Report of Project 93/120-01 to the Fisheries Research and Development Corporation,Canberra, Australia, p 165-180.
8. Allan, G.L., Rowland, S.J., Parkinson, S., Stone, D.A.J., Jantrarotai, W. (1999) Nutrient
digestibility for silver perch Bidyanus bidyanus: development of methods. Aquaculture, 170, 131-145.
9. Allan, G.L., Parkinson, S., Booth, M.J., Stone, D.A.J., Jantrarotai, W. (2000) Replacement of
fish meal in diets for Australian silver perch Bidyanus bidyanus: Digestibility of alternative ingredients. Aquaculture, 186, 293-310.
10. Arnesen, P., Brattas, L.E., Olli, J. and Krogdahl, A. (1989) Soybean carbohydrates appear to
restrict the utilization of nutrients by Atlantic salmon (Salmo salar L.). In: Takeda, M, Watanabe, T. (Eds), The Current Status of Fish Nutrition in Aquaculture. The Proceedings of the Third International Symposium on Nutrition and Feeding in Fish. Tokyo University of Fisheries, Toba, Japan, pp. 273-280.

111
11. Aufrere, J., Graviou, D., Demarquilly, C., Perez, J.M. and Andrieu, J. (1996) Near infrared reflectance spectroscopy to predict energy value of compound feeds for swine and ruminants. Animal Feed Science and Technology 62, 77-90.
12. Azevedo, P.A., Cho, C.Y., Leeson, S. and Bureau, D.F. (1998) Effects of feeding level and
water temperature on growth, nutrient and energy utilisation and waste outputs of rainbow trout (Oncorhynchus mykiss). Aquatic Living Resources 11, 227-238.
13. Bangoula, D., Parent, J.P., Vellas, F. (1993) Nutritive value of white lupin (Lupinus albus var
Lutop) fed to rainbow trout (Oncorhynchus mykiss). Effects of extrusion cooking. Reproduction and Nutrition Developments 33, 325-334.
14. Bennison, S. and Morrissy, N.M. (1990) Lupin substitution for the wheat component of the
Western Australian Crayfish Reference Pond Diet (No. 1) –Report on a growout experiment on marron, Cherax tenuimanus, at the farm of Commercial Freshwater Lobsters, Capel, during 1989/90. Marron Growers Association of Western Australia Bulletin 13(1), 13-14. (Abstract only)
15. Blagrove, R.J. and Gillespie, J.M. (1975) Isolation, purification and characterisation of the seed
globulins of L. angustifolius. Australian Journal of Plant Physiology, 2, 13-27. 16. Booth, M., Allan, G.L., Frances, J. and Parkinson, S. (2001) Replacement of fishmeal in diets of
silver perch: VI. Effects of dehulling and protein concentration on the digestibility of four Australian grain legumes in diets for silver perch (Bidyanus bidyanus). Aquaculture 196: 67-85.
17. Booth, M.A., Allan, G.L. and Warner-Smith, R. (2000) Effects of grinding, steam conditioning
and extrusion of a practical diet on digestibility and weight gain of silver perch, Bidyanus bidyanus. Aquaculture 182, 287-299.
18. Burel, C., Boujard, T., Corraze, G., Kaushik, S.J., Boeuf, G., Mol, K.A., Van der Geyten, S. and
Kuhn, E.R. (1998) Incorporation of high levels of extruded lupin in diets for rainbow trout (Oncorhynchus mykiss): nutritional value and effect on thyroid status. Aquaculture 163, 325-345.
19. Burel, C., Boujard, T., Tulli, F. and Kaushik, S. (2000a) Digestibility of extruded peas, extruded
lupin, and rapeseed meal in rainbow trout (Oncorhynchus mykiss) and turbot (Psetta maxima). Aquaculture 188, 285-298.
20. Burel, C., Boujard, T., Kaushik, S., Boeuf, G., Van Der Geyten, S., Mol, K.A., Kuhn, E.R.,
Quinsac, A., Krouti, M. and Ribailler, D. (2000b) Potential of plant-protein sources as fishmeal substitutes for turbot (Psetta maxima): growth, nutrient utilisation and thyroid status. Aquaculture 188, 285-298.
21. Carre, B., Brillouet, J.M. and Thibault, J.T. (1985) Characterisation of polysaccharides from
white lupin (Lupinus albus L.) cotyledons. Journal of Agricultural and Food Chemistry, 33, 285-292.
22. Carter, C.G. (1999) Fishmeal replacement in Aquaculture Feeds for Atlantic salmon. Project
93/120. Fisheries Research and Development Corporation, Canberra, Australia. pp 136. 23. Carter, C.G. and Hauler, R.C. (1999) Evaluation of phytase in Atlantic salmon, Salmo salar L.,
feeds containing fishmeal and different plant meals. In: Fishmeal replacement in Aquaculture Feeds for Atlantic salmon. Project 93/120. Fisheries Research and Development Corporation, Canberra, Australia. pp 34-45.
24. Carter, C.G., M. Bransden and Hauler, R.C. (1999) Prediction of in vivo digestibility and growth
performance of Atlantic salmon, Salmo salar L., using in vitro digestibility. In: Fishmeal replacement in Aquaculture Feeds for Atlantic salmon. Project 93/120. Fisheries Research and Development Corporation, Canberra, Australia. pp 34-45.
112
25. Carter, C.G. and Hauler, R.C. (2000) Fish meal replacement by plant meals in extruded feeds for Atlantic salmon, Salmo salar L. Aquaculture 185, 299-311.
26. Castañón, J.I.R., Flores, M.P. and Petterson, D. (1997) Mode of degradation of non-starch
polysaccharides by feed enzyme preparations, Animal Feed Science and Technology 68(3-4): 163-167.
27. Catacutan, M. (1991) Apparent digestibility of diets with various carbohydrate levels and growth
response of Penaeus monodon. Aquaculture 95, 89-96. 28. Cheung, P.C.K. (1990) The carbohydrates of Lupinus angustifolius. A composite study of the
seeds and structural elucidation of the kernel cell wall polysaccharides of Lupinus angustifolius. PhD Thesis, University of New South Wales.
29. Cho , C.Y., Slinger, S.J. and Bayley, H.S. (1982) Bioenergetics of salmonid fishes: energy
intake, expenditure and productivity. Comparative Biochemistry and Physiology. 73B, 25-41. 30. Cho, C.Y. (1991) Digestibility of feedstuffs as a major factor in aquaculture waste management.
Fish Nutrition in Practice, INRA (Eds) June 24-27, Paris, 365-374. 31. Coon, C.N., Leske, K.L., Akavanichan, O. and Cheng, T.K. (1990) effect of oligosaccharide-free
soybean meal on true metabolizable energy and fibre digestion in adult roosters. Poultry Science, 69, 787-793.
32. Coote, T.A., Hone, P.W., van Barneveld, R.J. and Maguire, G.B. (2001) Optimal protein level in
a semipurified diet for juvenile greenlip abalone Haliotis laevigata. Aquaculture Nutrition, 6, 213-220.
33. Cuadrado, C., Ayet, G., Burbano, C., Muzquiz, M., Comacho, L., Cavieres, E., Lonvon, M., Osagie, A. and Price, K.R. (1995) Occurrence of saponins and sapogenols in Andean crops. Journal of Scientific Food and Agriculture, 67, 169-172.
34. De la Higuera, M., Garcia-Gallegro, M., Sanz, A., Cardenete, G., Suarez, M.D. and Moyano,
F.J. (1988) Evaluation of lupin seed meal as an alternative protein source in feeding of rainbow trout (Salmo gairdneri). Aquaculture, 71: 37-50.
35. Edwards, A.C. and van Barneveld, R.J. (1998). Lupins for Livestock and Fish. In: Lupins and
Crop Plants: Biology, Production, and Utilisation (J.S. Gladstones, C.A. Atkins and J. Hamblin Eds.) CABI Publishing, Cambridge, UK. pp 475.
36. Elberizon, I.R. and Kelly, L.A. (1998) Emperical measurements of parameters critical to
modelling benthic impacts of freshwater salmonid cage aquaculture. Aquaculture Research 29, 669-677.
37. Ervik, A., Hansen, P.K., Aure, J., Stigebrandt, A., Johannessen, P. and Jahnsen, T. (1997)
Regulating the local environmental impact of intensive marine fish farming I. The concept of the MOM system (Modelling-Ongrowing fish farms-Monitoring). Aquaculture 158, 85-94.
38. Evans, A. (1998) Fishmeal Replacement in Aquaculture Diets – Feed Processing. Final Report
of Project 93/120-06 to the Fisheries Research and Development Corporation, Canberra, Australia, pp 118.
39. Fenwick, G.R., Price, K.R., Tsukamato, C. and Okubo, K. (1991) Saponins. In: Toxic
Substances in Crop Plants (Ed. J.P.F. Dmello, C.M. Duffus and J.H. Duffus). The Royal Society of Chemistry. Cambridge. pp. 285-328.
40. Fleming, A.E., Hone, P.W. and van Barneveld, R.J. (1996) The development of artificial diets
for abalone: A review and future directions. Aquaculture, 140:5-53.

113
41. Fleming, A.E., van Barneveld, R.J., Hone, P.W., Vandepeer, M.E. and Kruk, J.A. (1998) Complementary additivity of the digestibility coefficients of feed ingredients fed to juvenile greenlip abalone (Haliotis laevigata). Journal of Shellfish Research, 17(3): 641-647.
42. Frokiaer, H., Nielsen, D., Sorensen, H., Sorensen, J.C. and Sorensen, S. (1998) Determination
of soyasaponins in grain legumes by enzyme-linked immunosorbent assay based on monoclonal antibodies. Proceedings of the 3rd European Grain Legumes Conference. pp. 334-335. AEP, Valladolid.
43. Gdala, J., Jansman, A.J.M., van Leeuwen, P., Huisman, J. and Verstegen, M.W.A. (1996)
Lupins (L. luteus, L. albus, L. angustifolius) as a protein source for young pigs. Animal Feed Science and Technology 62(2-4): 239-249.
44. Gdala, J., Jansman, A.J.M., Buraczewska, L., Huisman, J. and van Leeuwen, P. (1997) The
influence of α-galactosidase supplementation on the ileal digestibility of lupin seed carbohydrates and dietary protein in young pigs, Animal Feed Science and Technology 67(2-3): 115-125.
45. Gladstones, J.S. (1998). Distribution, Origin, Taxonomy, History and Importance. In: Lupins and
Crop Plants: Biology, Production, and Utilisation (J.S. Gladstones, C.A. Atkins and J. Hamblin Eds.) CABI Publishing, Cambridge, UK. pp 475.
46. Gleeson, V., O’Sullivan, M. and Evans, A. (1998a) Optimisation of the physical quality of
aquaculture feeds processed by twin screw extrusion. An empirical modelling approach using response surface methodology. II. Partial replacement of fishmeal by grain legume protein concentrates in feeds for Atlantic salmon (Salmo salar). In: (A. Evans, editor), Fishmeal Replacement in Aquaculture Diets – Feed Processing. Final Report of Project 93/120-06 to the Fisheries Research and Development Corporation, Canberra, Australia, pp 46-80.
47. Gleeson, V., O’Sullivan, M. and Evans, A. (1998b) Optimisation of the physical quality of
aquaculture feeds processed by twin screw extrusion. An empirical modelling approach using response surface methodology. I. Replacement of fish meal by meat meal and grain legumes in feeds for silver perch (Bidyanus bidyanus). In: (A. Evans, editor), Fishmeal Replacement in Aquaculture Diets – Feed Processing. Final Report of Project 93/120-06 to the Fisheries Research and Development Corporation, Canberra, Australia, pp 81-106.
48. Glencross, B.D. (2000) Essential fatty acid and lipid requirements of farmed aquatic animals –
sourcing the good oils. Proc. Nutr. Soc. Aust. (J. Brand-Miller, Ed.) 24: 216-224. 49. Glencross, B.D., Smith, D.M., Tonks, M.L., Tabrett, S.J. and Williams, K.C. (1999) A reference
diet for nutritional studies of the giant tiger prawn, Penaeus monodon. Aquaculture Nutrition 51, 33-40.
50. Glencross, B.D. Curnow, J.C., Hawkins, W.E., Kissil, G.Wm. and Petterson, D.S., (2002).
Evaluation of the nutritional value of the enhanced methionine content of a transgenic line of Lupinus angustifolius (cv. Warrah) fed to a marine fish. Aquaculture. SUBMITTED
51. Gomes, E.F., Rema, P. and Kaushik, S.J. (1995) Replacement of fish meal by plant proteins in
the diet of Rainbow Trout (Oncorhynchus mykiss): digestibility and growth performance. Aquaculture 130, 177-186.
52. GPWA (2000) Internet site; http//:www.gpwa.com.wa/ 53. Griffiths, D.W. (1991) Condensed tannins. In: Toxic Substances in Crop Plants (Ed. J.P.F.
Dmello, C.M. Duffus and J.H. Duffus). The Royal Society of Chemistry. Cambridge. pp. 180-201.
54. Gueguen, J. (1983) Legume seed protein extraction, processing and end product
characteristics. Quality Plant and Plant Foods in Human Nutrition, 32, 267.

114
55. Harris, D.J. and Jago, J. (1984) Report on chemical composition of sweet lupin seed from Western Australia. Government Chemical Laboratories. Perth. pp 12.
56. Howieson, J. and Potts, W.T. (2001) Prawn Feed Nutrition: Analysis and Assessment of
Western Australian Raw Ingredients. Science and Technology Innovation Strategy. Final Report. Perth, Western Australia: pp 60..
57. Hughes, R.J., van Barneveld, R.J. and Choct, M. (1998) Factors influencing the nutritive value
of lupins for broiler chickens. Chicken Meat Research and Development Committee Final Report, Project No. DAS10CM. Canberra: Rural Industries Research and Development Corporation.
58. Hughes, S.G. (1988) Assessment of lupin flour as a diet ingredient for rainbow trout (Salmo
gairdneri). Aquaculture 71, 379-385. 59. Hughes, S.G. (1991) Use of lupin flour as a replacement for full-fat soy in diets for rainbow trout
(Oncorhynchus mykiss). Aquaculture 93, 57-62. 60. Irish, G., Barbour, G.W., Classen, H.L., Tyler, R.T. and Bedford, M.R. (1995) Removal of the α-
galactosides of sucrose from soybean meal using either ethanol extraction of exogenous α-galactosidase and broiler performance. Poultry Science, 74: 1484-1494.
61. Jenkins, G.I., Waters, S.P., Hoxey, M.J. and Petterson, D.S. (1994) Lupin seed (Lupinus
angustifolius) as an alternative to soybean meal in the diet of juvenile snapper (Pagrus auratus). The nutritive value of lupins for pigs and poultry. In: Proceedings of the First Australian Lupin Technical Symposium, pp. 64-67. Sydney, New South Wales: University of Sydney.
62. Kaushik, S.J. (1998a) Nutritional bioenergetics and estimation of waste production in non-
salmonids. Aquatic Living Resources 11, 311-318. 63. Kaushik, S.J. (1998b) Whole body amino acid composition of European seabass
(Dicentrarchus labrax), gilthead seabream (Sparus aurata) and turbot (Psetta maxima) with an estimation of the IAA requirement profiles. Aquatic Living Resources 11, 355-358.
64. Kemm, E.H., Minnaar, J.P., Ras, M.N. and Davie, S.J. (1987) Lupin seed meal (Lupinus albus
cv. Buttercup) as a source of protein for early weaned piglets. South African Journal of Animal Science 17: 37-42.
65. Kemp, R.C., van Barneveld, R.J., and Tivey, D.R. (1999) Utilization of small intestine brush
border membrane vesicles from abalone, Haliotis laevigata, for the assessment of grain legumes. Proceedings of the 6th Annual Abalone Aquaculture Workshop, April 1999, World AquacultureSociety Conference, Sydney, New South Wales. Fisheries Research and Development Corporation, Canberra, pp 38-51.
66. Kissil, G. Wm. and Lupatsch, I. (2000) Growth performance and nutrient utilization of Gilthead
seabream (Sparus auratus) fed a transgenic lupin (Lupinus angustifolius L.) with enhanced methionine content. In: The Ninth International Symposium on Nutrition and Feeding in Fish. 21-25 May 2000, Miyazaki, Japan.
67. Lawrence, C.S. (1998) Yabbies. In: The new rural industries – A handbook for farmers and
investors (K. Hyde, Ed). pp 147-152. 68. Lawrence, C.S., Morrissy, N., Bellanger, J. and Cheng, Y.W. (1998) Enhancement of yabby
production from Western Australian farm dams. Final Report of Project 94/075 to the Fisheries Research and Development Corporation, Canberra, Australia, pp 134.
69. Lawrence, C.S. Cheng, Y.W., Morrissy, N.M. and Williams, I.H. (2000) A comparison of mixed-
sex vs. monosex growout and different diets on the growth rate of freshwater crayfish (Cherax albidus). Aquaculture 185(3-4), 281-289

115
70. McMeniman, N. (1998) Digestibility of feed ingredients in barramundi. In: (K.C. Williams, editor),
Fishmeal Replacement in Aquaculture Feeds for Barramundi. Final Report of Project 93/120-03 to the Fisheries Research and Development Corporation, Canberra, Australia, pp 108.
71. Medale, F., Boujard, T., Vallee, F., Blanc, D., Mambrini, M., Roem, A. and Kaushik, S.J. (1998)
Voluntary feed intake, nitrogen and phosphorus losses in rainbow trout (Oncorhynchus mykiss) fed increasing dietary levels of soy protein concentrate. Aquatic Living Resources 11, 239-246.
72. Melicion, J.P., Zerniki, W. and Conan, L. (1987) L’aliment extrude colza-pois: une nouvelle
matiere premiere? Rev. Aliment. Anim. 2, 129-136. 73. Molvig, L., Tabe, L.M., Eggum, B.O., Moore, A.E., Craig, S., Spencer, D. and Higgins, T.J.
(1997) Enhanced methionine levels and increased nutritive value of seeds of the transgenic lupins (Lupinus angustifolius L.) expressing a sunflower seed albumin gene. Proc. Natl. Acad. Sci. USA 94: 8393-8398.
74. Morales, A.E., Cardenete, G., De la Higuera, M. and Sanz, A. (1994) Effects of dietary protein
source on growth, feed conversion and energy utilisation in rainbow trout, Oncorhynchus mykiss. Aquaculture 124: 117-126.
75. Morrissy, N.M. (1982) A standard reference diet for crustacean nutrition research. IV: Growth of
freshwater crayfish, Cherax tenuimanus. Journal of the World Aquaculture Society 20(3): 114-117.
76. Morrissy, N.M. (1992) Feed development for marron, Cherax tenuimanus, in Western Australia.
In: Proc. Aquaculture Nutrition Workshop, (G. Allan and W. Dall, Eds). Salamander Bay, 15-17 April 1991. NSW Fisheries, pp. 72-76.
77. Morrissy, N.M., Walker, P. and Moore, W. (1995) Predictive equations for managing semi-
intensive grow-out of a freshwater crayfish (marron), Cherax tenuimanus (Smith 1912) (Decapoda: Parastacidae), on a commercial farm. Aquaculture Research 26: 71-80.
78. Moyano, F.J., Cardenete, G., De la Higuera, M. (1992) Nutritive value of diets containing a high
percentage of vegetable proteins for trout, Oncorhynchus mykiss. Aquat. Living Resour. 5:23-29.
79. New, M.B. and Csavas, I. (1993) A summary of information on aquafeed production in eleveln
Asian countries, p. 397-419. In: Farm-made aquafeeds (M.B. New, A.G.J. Tacon and I. Csavas Eds). Proceedings of the FAO/AADCP Regional Expert Consultative on Farm-Made Aquafeeds, 14-18 December 1992, Bangkok, Thailand. FAO-RAPA/AADCP, Bangkok, Thailand, 434 p.
80. NRC (1993) Nutrient Requirements of Fish. National Academy Press, Washington, DC. 81. Paulin, C.D. (1990) Pagrus auratus, a new combination for the species known as “snapper” in
Australasian waters (Pisces: Sparidae). New Zealand Journal of Marine and Freshwater Research, 24: 259-265.
82. Perry, M.W., Dracup, M., Nelson, P., Jarvis, R., Rowland, I. and French, R.J. (1998). Agronomy
and Farming Systems. In: Lupins and Crop Plants: Biology, Production, and Utilisation (J.S. Gladstones, C.A. Atkins and J. Hamblin Eds.) CABI Publishing, Cambridge, UK. pp 475.
83. Petterson, D.S. (2000) The use of Lupins in Feeding Systems – Review. Asian Australian
Journal of Animal Science, 13 (6): 861-882. 84. Petterson, D.S., Jenkins, G.I., Walters, S.P., Gilbey, R. and Hoxey, M.J. (1995) Incorporation of
lupin into diets of farmed marine finfish. Proc. 2nd AEP Conference, Copenhagen, Denmark. pp. 266-67.

116
85. Petterson, D.S., Sipsa, S. and Mackintosh, J.B. (1997). The Chemical Composition and Nutritive Value of Australian Pulses. Grains Research and Development Corporation, Canberra, Australia. pp 65.
86. Petterson, D.S., Jenkins, G.I., and Hutabarat, J. (1998) The use of lupins in aquaculture. Proc.
3rd AEP Conf. Valladolid, Spain, pp. 456-7. 87. Petterson, D.S., Jenkins, G.I., Frankish, K., Cooper, J. and Beilby, J. (1999) The use of lupin (L.
angustifolius) grain in the diet of red seabream (Pagrus auratus). In: Proc. 8th Int. Lupin Conf., Lincoln. Ed. G.D. Hill. Pp. 149-155
88. Rawn, J.D. (1989) Biochemistry. Neil Patterson Publishers, Burlington, NC, USA. pp 1105. 89. Refstie, S., Storebakken, T. and Roem, A.J. (1998) Feed consumption and conversion in
Atlantic salmon (Salmo salar) fed diets with fish meal, extracted soybean meal or soybean meal with reduced content of oligosaccharides, trypsin inhibitors, lectins and soya antigens. Aquaculture 162, 301-312.
90. Robaina, L., Izquierdo, M.S., Moyano, F.J., Socorro, J., Vergara, J.M., Montero, D. and
Fernandez-Palacios, H. (1995) Soybean and lupin seed meals as protein sources in diets for gilthead seabream (Sparus aurata): nutitional and histological implications. Aquaculture 130, 219-233.
91. Rodehutscord, M., Borchert, F., Gregus, Z. and Pfeffer, E. (2000) Availability and utilisation of
free lysine in rainbow trout (Oncorhynchus mykiss) 2. Comparison of L-Lysine.HCl and L-Lysine sulphate. Aquaculture 187: 177-183.
92. Ruiz, R.G., Proce, K.R., Rose, M.E., Arthur, A.E., Petterson, D.S. and Fenwick, G.R. (1996)
The effect of cultivar and environment on saponin content Australian sweet lupin seed. Journal of Scientific Food and Agriculture, 69, 347-351.
93. Saraç, H.Z., Thaggard, H.B., Rose, J., Kelly, B.J. and Gravel, M.R. (1998) Utilisation of Plant
Protein Sources. In: (D.M. Smith, editor), Fishmeal Replacement in Aquaculture Diets for Prawns. Final Report of Project 93/120-02 to the Fisheries Research and Development Corporation,Canberra, Australia, pp 168.
94. Searcy-Bernal, R. (1994) Statistical power and aquacultural research. Aquaculture, 127, 371-
388. 95. Smith D.M., Allan G.L., Williams K.C., Barlow C.G. (2000) Fishmeal replacement research for
shrimp feed in Australia. In: Proceedings of V International Symposium on Aquatic Nutrition. 19-22 November 2000, Merida Yutacan, Mexico.
96. Storebakken, T., Shearer, K.D. and Roem, A.J. (1998b) Availability of protein, phosphorus and
other elements in fish meal, soy-protein concentrate and phytase-treated soy-protein-concentrate-based diets to Atlantic salmon, Salmo salar. Aquaculture 161, 365-379.
97. Sudaryono, A., Tsvetnenko, E., Hutabarat, J., Supriharyono and Evans, L.H. (1999a) Lupin
ingredients in shrimp (Penaeus monodon) diets: influence of lupin species and types of meals. Aquaculture 171, 121-133.
98. Sudaryono, A., Tsvetnenko, E. and Evans, L.H. (1999b) Replacement of soybean meal by lupin
meal in practical diets for juvenile Penaeus monodon. Journal of the World Aquaculture Society 30(1), 46-57.
99. Sugiura, S.H., Dong, F.M., Rathbone, C.K. and Hardy, R.W. (1998) Apparent protein
digestibility and mineral availabilities in various feed ingredients for salmonid feeds. Aquaculture 159, 177-202.

117
100. Tacon, A.G.J. (1990) Standard Methods : For the Nutrition and Feeding of Farmed Fish and Shrimp. Argent Laboratories Press. Redmond, Washington, USA.
101. Tacon, A.G.J. (1996) Global Trends in Aquaculture and Aquafeed Production. Globefish/FAO 102. Todorov, N.A., Pavlov, D.C. and Kostov, K.D. (1996) Lupin (Lupinus sp.). In: Legumes and
Oilseeds in Nutrition (E. Nkwolo and J. Smart Eds.) Chapman and Hall, London. pp 113-123. 103. Trugo, L.C. and Almeida, D.C.F. (1988) Oligosaccharide contents in the seeds of cultivated
lupins. Journal of Sci. Food Agric. 45:21-24. 104. van Barneveld, R.J. (1993). Effect of heating proteins on the digestibility, availability and
utilisation of lysine by growing pigs. PhD Thesis, The University of Queensland, Brisbane, Australia.
105. van Barneveld, R.J. (1999) Understanding the nutritional chemistry of lupin (Lupinus spp.) seed
to improve livestock production efficiency. Nutrition Research Reviews 12: 203-230. 106. van Barneveld, R.J., Olsen, L.E. and Choct, M. (1996) Effect of lupin oligosaccharides on
energy digestion in growing pigs. Proceedings of the Nutrition Society of Australia 20: 114. 107. van Barneveld, R.J., Olsen, L.E. and Choct, M. (1997) Lupin oligosaccharides depress the
apparent ileal digestion of amino acids by growing pigs. In: Manipulating Pig Production V. Proceedings of the Fifth Biennial Conference of the Australasian Pig Science Association (APSA), p. 30 [DP Hennessy and PD Cranwell, Eds]. Canberra, Australasian Pig Science Association.
108. Vandepeer, M.E., van Barneveld, R.J., Hone, P.W. and Havenhand, J.N. (1999) The
digestibility of raw, autoclaved and phytase treated legumes in greenlip abalone, Haliotis laevigata. Proceedings of the 6th Annual Abalone Aquaculture Workshop, April 1999, World AquacultureSociety Conference, Sydney, New South Wales. Fisheries Research and Development Corporation, Canberra, pp 17-37.
109. Vielma, J., Makinen, T., Ekholm, P. and Koskela, J. (2000) Influence of dietary soy and phytase
levels on performance and body composition of large rainbow trout (Oncorhynchus mykiss) and algal availability of phosphorus load. Aquaculture 183, 349-362.
110. Viola, S., Arieli, Y. and Zohar, G. (1988) Unusual feedstuffs (tapioca and lupin) as ingredients
for carp and tilapia feeds in intensive culture. Israeli Journal of Aquaculture – Bamidgeh 40, 29-34.
111. Watanabe, T. (1984) Lipid nutrition in fish. Comparative Biochemistry and Physiology;73B: 3-
15. 112. Williams, K.C. (1998) Efficacy of utilisation of different feed sources as measured by summit
dilution. In: (K.C. Williams, editor), Fishmeal Replacement in Aquaculture Feeds for Barramundi. Final Report of Project 93/120-03 to the Fisheries Research and Development Corporation, Canberra, Australia, pp 108.
113. White, C.E., Campbell, D.R. and McDowell, L.R. (2000) Effects of dry matter content on trypsin
inhibitors and urease activity in heat treated soya beans fed to weaned piglets. Animal Feed Science and Technology 87, 105-115.