Federica Ceriani Tutor: Prof. Francesco Arioli ...
173
1 UNIVERSITÀ DEGLI STUDI DI MILANO School of Veterinary Medicine PhD course in Veterinary and Animal Sciences Class XXXII A survey on environmental pollutants, drug and metal residues in different foods of animal origin and the related risk. Federica Ceriani Tutor: Prof. Francesco Arioli. Coordinator: Prof. Valeria Grieco. ACADEMIC YEAR 2018/2019
Transcript of Federica Ceriani Tutor: Prof. Francesco Arioli ...

1
UNIVERSITÀ DEGLI STUDI DI MILANO
School of Veterinary Medicine
PhD course in Veterinary and Animal Sciences
Class XXXII
A survey on environmental pollutants, drug and metal residues in different
foods of animal origin and the related risk.
Federica Ceriani
Tutor: Prof. Francesco Arioli.
Coordinator: Prof. Valeria Grieco.
ACADEMIC YEAR 2018/2019

2
“Nothing in life is to be feared, it is only to be understood.
Now is the time to understand more, so that we may fear less”
Marie Curie

3
ABSTRACT
The presence of xenobiotic residues, both drugs and environmental contaminants, in food is a cause
for concern and therefore the European Authorities issue reports or laws in order to propose
monitoring plans, Health-based Guidance Values (HBGV) and maximum residue levels or
maximum levels (MRLs and MLs).
Based on these considerations, this doctoral thesis studies the presence of residues in different foods
of animal origin, aimed at a characterization of the risk for the consumer.
Firstly, we studied seafood, which is an excellent source of nutrients, with important human health
benefits. We focused on mussels and clams, filter feeders animals, suitable bio indicator organisms
due to their bioaccumulation ability of a wide range of environmental pollutants. In the first
research study, we evaluated the Italian consumer risk related to metal exposition through molluscs,
on the basis on the MLs stated by the European Union, where available, or, otherwise, based on the
HBGV stated by EFSA. About our results, regarding the human metal exposure, we conclude that
there is a low risk for the average consumer; however, high percentile consumers, may be subjected
to skin lesions, and lung, skin and bladder cancer due to high intake of As, while Ni sensitive
individuals can undergo allergic dermatitis due to constant Ni presence in the studied molluscs.
Subsequently, we focused on most consumed fish like salmon, tuna which consumption has
consistently risen. In the second study about salmon, the aim was to investigate the presence of
persistent organic pollutants (POPs) and antimicrobials in wild and farmed salmons from different
geographic areas. Farmed salmons showed slightly higher presence of environmental contaminants
than wild ones, likely due to the decreased possibility of a constant exposition. Antibiotics were
seldom found only in farmed salmon. Risk related to organophosphate compounds (Ops),
polycyclic aromatic hydrocarbons (PAHs), polychlorobiphenyls (PCBs) and organochlorine
pesticides (OCPs) deriving from salmon intake were of is very low concern, while the presence of
polybromodiphenyl ether (PBDE99) and perfluorooctanoic acid (PFOA), is a cause for a bit higher
concern. The substantial lack of data about the detected antibiotics in salmon did not allow an
extrapolation from MRLs of terrestrial animals and a risk characterization
In the third work on tuna, a long-living fish with high biomagnification ability, we studied the
presence of metals with high toxicological importance for public health (Hg, Pb, Cd, As, Cr, Ni).

4
One hundred thirty-one samples were analysed. One red tuna from the Adriatic Sea and 11 yellow
tunas exceeded Pb maximum levels (MLs); three red tunas from different Mediterranean sub-areas
exceeded Hg MLs. The evaluation of cumulative effects indicated that only a negligible health
hazard could derive from the ingestion of tuna, for both average and high consumers. The risk of
carcinogenicity from Cr is still under debate at the concentrations detectable in food.
In these two works, we confirm a low risk, related to the studied compounds, for average consumer
health due to fish consumption.
The regular consumption of meat and meat products provides a significant intake of proteins and
essential micronutrients. Pork meat, for example, is used in many countries to produce derivative
products (hams and cured meats) with high qualitative value. Also, game animal meat consumption,
though being a niche product, is constantly increasing and hunters, their families and persons
closely associated with them can be regarded as a high consumption subpopulation. Furthermore,
game animals are a suitable indicator about environmental pollutant such as PCBs, PBDEs, PAHs
and brominated flame retardants (BFRs). In the fourth work we studied the occurrence of PBDEs
and perfluoroalkyl substances (PFASs) from eight EU Member States (Austria, Denmark, French,
Germany, Holland, Italy, Poland and Spain). The European Commission has not stated maximum
limits (MLs) for some environmental pollutants such as polybrominated diphenyl ether PBDEs and
PFASs; no perfluoroalkyl substances were detected, except PFOA, in only one Austrian sample.
PBDEs were detected in three out of 77 samples: the one coming from Germany showed the
presence of all congeners analyzed the ones from Netherland and Italy, respectively PBDE 153 and
PBDE 100. The results show that the analyzed samples do not pose a risk for human beings about
PFASs and PBDEs. A following report from EFSA, requires a new attention on PFAS, with HBGV
being drastically reduced. In the fifth work we studied four different animal species (chamois, roe
deer, red deer and wild boar) that have different nutrition habits. Game animals are a suitable
sentinel species to have a picture of the environment. Muscle samples from seventy-nine animals
were collected during the hunting season in a Northern Italy mountain area. No PBDEs were found
in the samples. OCPs, OPs and PCBs were detected in almost all samples at different concentration
ranges, showing higher frequency in ungulate species than in wild boar. PFAs were found only in
wild boar. Anthracene and benzopyrene, among PAHs, were found only in chamois at low
concentrations. A low risk for consumers can be indicated due to the frequent detection of

5
contaminants at trace levels, to the scarce prevalence of high concentrations of some contaminants
and to the low consumption of game animal meat.
An important topic in the researches carried out in my doctorate was the investigation of POPs in
organic honey. However, even if organic beekeeping excludes (or restrictively allows) the use drugs
or pesticides many pollutants may contaminate bee matrices, comprising bee, honey and pollen.
Therefore, the focus was the investigation of a broad spectrum of analytes, pesticides, persistent
organic pollutants and antibiotics in organic honeys collected in different productive areas with
different agricultural, zootechnical or anthropic impact to verify the potential transfer of xenobiotics
into supply chain from different sources than beekeeping practices. The presence of several
compounds, such as PCBs, PBDE and PAHs was confirmed, not only in proximity to highly
urbanised centres, where the concentrations were higher, but in all environment contexts,
confirming the theory that these are ubiquitous contaminants. No antibiotics were found in samples
analysed suggesting that presence of antibiotics is from beekeeping practices.
The analytes in the different matrices required different approaches for sample pretreatment,
extraction, clean up and fractionation before the analysis with liquid chromatography–tandem mass
spectrometry (LC-MS/MS) or – gas mass spectrometry (GC-MS/MS). The approach of analytical-
instrumental nature has provided for the optimisation of instrumental performances as well as of the
steps of sample pretreatment, in order to achieve good levels of sensitivity, specificity and
robustness of the method to then make considerations of qualitative, quantitative and statistical
nature. The trials planning, optimisation and validation of the methods were performed according to
Commission SANTE/10553/2018 (SANTE 2018).
The results of this manuscript suggest that there is a low risk for the average consumer health.
Environmental concentrations of persistent organochlorine compounds have been decreasing over
the past two decades, and this correlates with remarkable advances in the detection of exceedingly
low levels of these compounds in human populations and the improvement of European control.
PCBs still are present in environment due to their industrial source even if their use was banned in
many industries application. Regarding emerging compounds, PFAs still need to be concern due to
their wide use and their possible toxicological role. Recently European commission decreased the
HBGVs for these classes to safeguard human health. Antibiotics still are a matter of concern and
need a close control to ensure human safety and decrease antimicrobial resistance.

6
RIASSUNTO
La presenza di residui chimici negli alimenti, costituiti sia da composti farmaceutici che da
contaminati ambientali, è un argomento di crescente interesse e preoccupazione per la sanità
pubblica.
L’Unione Europea periodicamente sancisce leggi e rapporti aggiornati, con lo scopo di condurre
piani di monitoraggio e linee guida sull’impiego di tali composti a livello industriale, agricolo e
terapeutico e livelli massimi residuali (LMR e ML) negli alimenti, al fine di prevenire il rischio per
il consumatore.
Sulla base di queste considerazioni, il presente elaborato ha lo scopo di studiare la presenza di
residui chimici in diversi alimenti di origine animale, al fine di caratterizzare il rischio per il
consumatore.
In primo luogo, ci siamo focalizzati sullo studio di alimenti provenienti dal settore ittico, che è
un'ottima fonte di nutrienti, con importanti benefici per la salute umana.
Ci siamo concentrati su cozze e vongole, animali filtratori e bioindicatori adatti per le loro
caratteristiche a bioaccumulare un'ampia gamma di inquinanti ambientali.
Lo scopo del primo elaborato è stato quello di valutare il rischio per il consumatore dei principali
metalli (Hg, Cd, Pb, Ni, Cre As), attraverso il consumo di molluschi sulla base dei limiti massimi
dichiarati dall’Unione Europea o, ove disponibili, sulla base dei valori soglia dichiarati dall’EFSA.
Dal primo lavoro è emerso che vi è un basso rischio per il consumatore medio; tuttavia, i
consumatori ai percentili superiori, possono essere soggetti a lesioni cutane e/o neoplasie
polmonari, cutanee e vescicali per l’elevata assunzione di As. Soggetti Ni sensibili, possono invece
essere soggetti a dermatiti allergiche.
Il secondo lavoro di ricerca si è invece concentrato sulla ricerca dei medesimi metalli nel tonno, il
cui consumo è in aumento secondo i dati della commissione europea, per le sue capacità di
bioaccumulo. Sono stati, così, analizzati 131 campioni provenienti da diverse zone FAO. Dai
risultati, è emerso che solo un tonno rosso, proveniente dal mare Adriatico e 11 tonni gialli hanno
superato i livelli massimi residuali di Pb; tre tonni rossi provenienti da diverse sottozone del

7
Mediterraneo hanno superato i livelli massimi consentiti per il mercurio. La valutazione degli effetti
tossicologici cumulativi ha indicato un rischio trascurabile sia per i medi che alti consumatori.
L’obiettivo del terzo studio è stato quello di studiare la presenza di inquinanti organici persistenti e
di antimicrobici nei salmoni selvatici e di allevamento di diverse aree geografiche. I salmoni
d'allevamento hanno mostrato una presenza di contaminanti ambientali superiore a quelli selvatici,
probabilmente a causa di un maggiore impatto demografico. Il rischio legato ai composti
organofosforati, agli idrocarburi policiclici aromatici, ai policlorobifenili e ai pesticidi
organoclorurati derivanti dall'assunzione di salmone si è rilevato molto basso, mentre la presenza di
polobromodifenilietere congenere 99 (PBDE99) e acido perfluoroottanoico (PFOA) suscita
maggiore preoccupazione. Gli antibiotici sono stati riscontrati con bassa frequenza solo nel salmone
allevato.
Da questi lavori, sulla base dei dati ottenuti, possiamo confermare che vi è basso rischio per il
consumatore medio
Il consumo regolare di carne e prodotti a base di carne fornisce un significativo apporto di proteine
e micronutrienti essenziali. La carne suina, ad esempio, è impiegata in molti paesi per produrre
prodotti derivati (prosciutti e salumi) ad alto valore qualitativo. Anche il consumo di carne di
selvaggina, pur essendo un prodotto di nicchia, è in costante aumento e i cacciatori, le loro famiglie
e le persone a loro strettamente legate possono essere considerati una sottopopolazione ad alto
consumo. Nel quarto lavoro abbiamo cosi studiato la presenza di polibromodifenilietere e sostanze
perfluoroalchiliche provenienti da otto Stati membri dell'UE (Austria, Danimarca, Francia,
Germania, Olanda, Italia, Polonia e Spagna). La commissione Europea non ha definito limiti
massimi per tali composti e dai nostri risultati non sono state rilevate sostanze perfluoroalchiliche
ad eccezione dell’acido perfluoroottanoico in un solo campione austriaco. I polibromodifenilietere
sono stati rilevati solo in 3 dei 77 campioni investigati. I risultati mostrano che i campioni analizzati
non rappresentano un rischio per il consumatore. Recentemente una successiva relazione EFSA ha
richiesto di porre maggiore attenzione sulla presenza dei perfluoroalchilici, i cui valori soglia sono
stati ridotti drasticamente per il loro rischio tossicologico.
Nel quinto lavoro ci siamo focalizzati su quattro diverse specie selvatiche (camoscio, capriolo,
capriolo, cervo e cinghiale) con abitudini alimentari differenti. Gli animali selvatici sono considerati

8
specie sentinelle e quindi ottimi indicatori ambientali. Campioni muscolari di settantanove animali
sono stati raccolti durante la stagione venatoria in una zona montana dell'Italia settentrionale. Nei
campioni non sono stati trovati polibromodifenilieteri. Al contrario i pesticidi organoclorurati e
organofosforati e i policlorobifenili sono stati rilevati in quasi tutti i campioni a diversi intervalli di
concentrazione, mostrando una frequenza maggiore nelle specie di ungulati rispetto al cinghiale. I
PFA ,invece, sono stati riscontrati solo nei cinghiali. Tra gli idrocarburi, antracene e benzopirene,
sono stati trovati solo nel camoscio a basse concentrazioni. Possiamo nuovamente concludere che
per il frequente ritrovamento a basse concentrazioni dei contaminati, ad eccezione di singoli
composti riscontrati ad alte concentrazioni, e del basso consumo di carne di selvaggina rapportata
ad altre tipologie di carne, vi è un basso rischio per il consumatore italiano.
Un ulteriore tema di crescente interesse per la sanità pubblica è stato lo studio dei contaminati
ambientali persistenti nel miele, in particolare il miele biologico. Infatti, nonostante l'apicoltura
biologica escluda (o consenta in modo restrittivo) l'impiego di farmaci o pesticidi, molti inquinanti
possono contaminare api, miele e polline. Pertanto, l'attenzione si è concentrata sullo studio di un
ampio spettro di analiti quali, pesticidi, inquinanti organici persistenti e antibiotici in mieli organici
raccolti in diverse aree produttive con diverso impatto agricolo, zootecnico o antropico per
verificare il potenziale trasferimento di xenobiotici nella catena di approvvigionamento da fonti
diverse rispetto alle pratiche apistiche. È stata confermata la presenza di diversi composti, come
policlorobifenili, i polibromodifenilietere e gli idrocarburi policiclici aromatici non solo nelle arnie
in prossimità di centri altamente urbanizzati, dove le concentrazioni erano più elevate, ma in tutti i
contesti ambientali, confermando la possibilità di trasferimento da fonti ambientali e l’ubiquità di
tali composti. Il mancato ritrovamento di antibiotici nei campioni analizzati esclude la possibilità di
trasferimento accidentale delle molecole dall’ambiente in cui sono posizionate le arnie.
Per ottenere una così ampia e diversificata ricerca, ogni lavoro è stato approciato in modo differente
per il pretrattamento dei campioni, l’ottimizzazione del metodo analitico, l’estrazione degli analiti e
il loro successivo clean up prima dell’analisi con cromatografia liquida in spettrometria di massa
tandem (LC-MS/MS) o gas spettrometria (GC-MS/MS). L'approccio di natura analitico-
strumentale ha richiesto per ogni ricerca un’accurata e ampia ricerca per ottenere l'ottimizzazione
delle prestazioni strumentali e delle fasi di pretrattamento dei campioni, al fine di raggiungere buoni
livelli di sensibilità, specificità e robustezza dei metodi analitici impiegati per poi fare

9
considerazioni di natura qualitativa, quantitativa e statistica. La pianificazione delle prove,
l'ottimizzazione e la convalida dei metodi sono state eseguite secondo la Commissione
SANTE/10553/2018 (SANTE 2018).
I risultati di questo lavoro suggeriscono che il rischio per la salute media dei consumatori è basso.
Le concentrazioni ambientali dei composti organoclorurati persistenti sembrano diminuite negli
ultimi due decenni, probabilmente grazie ai progressi nella rilevazione analitica e al miglioramento
dei controlli europei. I PCB sono ancora presenti nell'ambiente a causa del loro ampio impiego a
livello industriale nel secolo scorso e delle loro peculiarità chimico fisiche, anche se il loro uso,
oggi, è stato vietato in molte applicazioni. Per quanto riguarda i composti emergenti, i PFAs destano
preoccupazione a causa del loro ampio uso e del loro possibile ruolo tossicologico. Recentemente la
Commissione Europea ha infatti drasticamente diminuito i livelli soglia per queste classi per
salvaguardare la salute umana. Gli antibiotici sono ancora motivo di preoccupazione e necessitano
di uno stretto controllo per garantire la sicurezza umana e ridurre le resistenze, tema tuttora più che
attuale.

10
TABLE OF CONTENTS:
CHAPTER 1
Introduction 12
1.1 Food safety and toxicological risk 13
1.2 Environmental behaviour and toxicological properties 15
1.3 Polychlorinated Biphenyls 17
1.4 Organochlorine and organophoshorate insecticides 21
1.5 Polycyclic aromatic hydrocarbon 25
2.1 Emerging contaminants 26
2.1.1 Perfluoroalkyl substances 26
2.1.2 Polybrominated diphenyl ethers 28
3.1 Metals and metalloids 30
3.1.2 Arsenic 30
3.1.3 Cadmium 31
3.1.4 Chromium 32
3.1.5 Mercury 32
3.1.6 Lead 33
3.1.7 Nickel 34
4.1 Antibiotics 35
References 37
CHAPTER 2 46
Aim 47
CHAPTER 3 48
Research Papers 49
3.1. Mussels and clams from the Italian fish market is there a human
exposition risk to metals and arsenic?
49
3.2. Exposition to metals and arsenic from yellow and red tuna
consumption
66

11
3.3. Risk characterization from the presence of environmental
contaminats and antibiotics residues in wild and farmed salmon from
different FAO zones.
81
3.4. Levels and distribution of PBDEs and PFAs in pork from different
European countries.
100
3.5. Presence of organic halogenated compounds, organophosphorus
insecticide and polycyclic aromatic hydrocarbons in meat of different
game animal species from an Italian subalpine area
120
3.6. Distribution of POPs, pesticides and antibiotic residues in organic
honeys from different production areas.
138
CHAPTER 4 169
Summury & Conclusion 170
Aknowledgements 173

12
CHAPTER 1
Introduction

13
1. INTRODUCTION
1.1. Food safety and toxicological risk
At the beginning of this century, the scientific community began to consider life sciences, both
regarding human and animals, and environmental sciences under the general concept of "One
Health". This approach, however, was not completly new: infact already in 1821, the term
“zoonosis” had been coined to define a contagious pathology transferable from animals to human
and vice versa. Nevertheless, human medicine and veterinary medicine were considered two
separate disciplines in the whole 20th century (CDC, 2016) even if, meantime, their interaction grew
until, in recent years, many factors changed the global view of the public health, and the scientific
word understood that it is impossible to deal separately human health, animal health and
environment.
In this new global view, the scientific world became conscious that, the close interactions among
humans, animals and environment may cause damages to biota or to abiota resulting in e.g.
infectious illnesses or environmental impairments and exposition to different sustances dangerous
for human health. In other words, a sustainable development depends on the health and well-being
between humans, animals and the ecosystems in which they coexist (Rapport et al., 1998).
In the period after the Second World War the rapid industrialization and economic improvement,
deeply changed the world and life style, and in different industrial and agricultural sectors, several
chemicals were indiscriminately used to improve the final product. The massive production of
chemical compounds like e.g. plasticisers, pesticides, diatermic and dieletric substances and
petrochemicals caused their wide distribution in the ecosystem, worsening the quality of soil, air,
water and food (El-Shahawi et al., 2010). The resultant toxicological risk was realized in the
following decades.
For a better comprehension a few cases are below reported as examples: in 1960 in the lake
Michigan district the wide use of polychlorinated biphenyls (PCBs) caused the infertility of mink
females due to the increasing industrialization and 1970 in the same area Polybrominated biphenyls
(PBBs), manufactured as flame retardants, entered in food chain through livestock feed
(Longnecker et al., 1997) in 1990 in Mediterrean sea a viral epidemic caused the mortality of more

14
than eleven hundred dolphins: researcher studied their tissues and observed the presence of PCBs at
concentrations two or three times higher than healthy dolphins.
Polychlorinated dibenzo-p-dioxins and dibenzofurans (PCDDs, PCDFs) and PCBs were detected, in
the United States at the last of the eighties of the last century, in blood samples of people
professionally exposed; in the sixties and seventies, organclhorine compunds were already detected
in blood samples of population in United States and the occurrence of kidney cancer was correlated
to the high presence of PCBs (Schecter et al., 1995; Shalat et al., 1989).
The exposure to chemical compounds is usually caused by mixtures of different substances or
congeners that can share some toxicological modes of action and effects, evocking dose addition.
The Total Dose must be so considered, i.e. the sum of the doses of each toxic agent with similar
effects in humans and animals exposed for long time and at high levels.
Foodstuff contamination remains one of the main sources of exposure and could pose a threat for
human health and for the environment (Vogt et al., 2012).
Consumer’s food safety awareness is rising both in developed and developing countries, buf if the
microbiological risk has higher importance in developing countries, due to the poor hygiene and
lack of knowledge on food trail safety, the risk regarding chemical compounds is still a problem
also for developed country (Odeyemi et al., 2019).
In the European Union (EU), consumer protection is a matter of extreme importance and European
Commission and European Food Safety Authority (EFSA) safeguard against the harmful effects of
chemical residue establishing safe levels by making Official Controls on food and asking to
indipendent researchers to monitor the presence of this compounds in food and in environment to
characterize the risk. The chemical compounds can occur in food as residues, defined, according
Codex Alimentarius Commission, as “Residues of veterinary drugs include the parent compounds
and/or their metabolites in any edible portion of the animal product and include residues of
associated impurities of the veterinary drug concerned” (FAO, 2010). A generic and clearer
definition could be: “small amounts of a xenobiotic or its metabolites present in animal tissues or
found in their products, capable of determining toxicological effects against the consumer” (De
Brabander et al., 2007). One of the main purposes of the global health organisations is to manage
and reduce the risk deriving from exposure to residues (Zinsstag et al., 2011).
According to Food and Agriculture Organization (FAO) of the United Nations (UN), Food Security
exist when: “all people, always, have physical, social and economic access to sufficient, safe and

15
nutritious food which meets their dietary needs and food preferences for an active and healthy life.
Household food security is the application of this concept to the family level, with individuals within
households as the focus of concern" (FAO, 2003). The base of this concept is that food security
must include the very important aspect of food safety and ultimately “Risk assessment, Risk
management and Risk communication” (WHO, 2010). To improve the knowledge regarding
chemical compounds in environment and the human exposure, one challenge for the scientists is to
improve their knowledge on the occurrence of chemical compounds in food in order to evaluate
toxicological risk. This manuscript aims to give a contribution on the presence of different
categories of chemical compounds eventually present in the most consumed foods and collect
usuful data to improve the global information regarding chemical compounds in food.
1.2 Environmental behaviour and toxicological properties.
The last period of the twentieth century showed a global flow in awakening against the problem of
environmental pollution, that is any physical, chemical and biological alteration of the quality of the
environment (Wasi et al., 2013). Chemical pollutants are compounds present in environment at
higher concentrations than natural ones. From the environment, most compounds are transferred to
food, inducing oral exposure in the consumers and eventually evoking toxicological effects (Chen et
al., 2019) In table 1 a survey of these compounds is reported.
Table 1: Molecules that can occurr as residues in products of animal origin
• Drugs Antibiotics, hormones and others
• Insecticides, Fungicides Organochlorine and organophosphorate insecticides
• Packaging material Plastics
• Environmental pollutants Halogenated compounds (Polychlorinated biphenyl,
Polychlorinated dibenzofurans, Polychlorinated dibenzodioxins)
Micotoxins
Metals
Not Halogenetic compounds (polyfluoroalkyl substances)
• Food additives e.g. nitrate and nitrite compounds

16
One important aspect is their environmental fate: most of these compounds are known in literature
as persistent organic pollutant (POPs), i.e. contaminants that, due to their chemical and physical
properties persist for long time in the environment and pose major and increasing threats to human
health and the environment itself. This definition, stated by the Stockolm Convention, was adopted
by a Conference of Plenipotentiaries held from 22 to 23 May 2001 in Stockholm and entered into
force on 17 May 2004. The Convention covers 23 priority pollutants that are produced intentionally
and unintentionally (for example from sources such as waste incinerators). The purpose of the
Convention is to minimise and eliminate the production, import and exportation of persistent
pollutants. Signatory Countries should develop action plans to reach this aim and use alternative
materials (European Commission 2006/507). POPs can enter in the air phase; both by evaporation
or bound to particulate matter, and through atmosphere they can reach very long distance from their
original source before being re-deposited (Galiulin et al., 2002) (Figure 1).
Figure 1: POPs environmental fate
Moreover, the combination of resistance to metabolism and lipophilicity properties lead to
accumulation and biomagnification in tissues of animals at the highest trophic level, including
humans. The most important classes of halogenated aromatics compounds include PCBs,

17
polychlorinated dibenzo-p-dioxins and-furans (PCDD/Fs), polybrominated diphenyl ethers
(PBDEs) and organochlorine pesticides (OCs) (e.g. Dyphenylaliphatic compounds like DDT and its
metabolites, aryl hydrocarbons like lindane and cyclodienes like chlordane), most of brominated
flame retardants and some perfluoroalkil substances (PFAs).
POPs are introduced in air, soil and sediment of surface water, from agricultural sewage sludge,
petroleum refining, chemical and synthetic industries, textile processing source (Gupta and Ahmad,
2012; Pi et al., 2018).Therefore, farm and grazing animals are exposed to POPs throught feed, water
and soil contamination.
Many of these compounds can interfere with the endocrine system in human and animals, causing
toxic effects and thereby are called “endocrine disruptors”. Their toxicity regards e.g. reproductive
system dysfunction, suppression of the immune system, damage to the thyroid, cancer and several
other effects (Chen et al., 2019). They can behave like the hormones or influence the hormone
levels of the organism and thus have effects on human health and on organisms present in the
environment, especially in the critical stages of development. Perhaps the most familiar and well-
characterised example of such an interaction is binding of a substance to a hormone receptor, e.g.
the oestrogen receptor (ER). Such substances may exhibit agonist or antagonist activity in relation
to the receptor, depending on the nature of its interaction with the ligand-binding site of the receptor
but there are several ways with these substances can interact with the organism. In March 2013
EFSA asked to scientific community to collect information to provide the risk linked with these
substances and in May 2018, EFSA elaborated an opinion on the hazard of endocrine disruptors
(EFSA, 2013) that, according to World Health Organization (WHO) International Programme on
Chemical Safety (IPCS) (WHO/IPCS), are so defined: “An endocrine distruptor is an exogenous
substance or mixture that alters function(s) of the endocrine system and consequently causes
adverse health effects in an intact organism, or its progeny, or (sub)populations” (WHO,2002).
1.3 Polychlorinated Biphenyls
Polychlorinated biphenyls (PCB) are synthesised by catalysed chlorination of biphenyl. Depending
on the number of chlorine atoms (1-10) and their position at the two rings, 209 different
compounds, PCB congeners, are possible (Figure 2).

18
Figure 2: Structural formula of PCBs.
PCBs production started in the 1920s and they were largely used world-wide in industry and
commercial applications (repellents, carbonless copy paper, plasticizers in paints, sealants, plastics
and rubber products etc), due to their physical and chemical properties, such as non-flammability,
chemical stability, high boiling point, low heat conductivity and high dielectric constants. They
were identified as environmental contaminants at the end of the 1960s. It is estimated that more
than 1 million tons of technical PCBs mixture were used in to the industry until the 1980s, when the
manifacture, processing and distribution of PCB has been prohibited in almost all industrial
countries (EFSA, 2005). However, they are still released in environment due to the incorrect
discarding of waste, the illicit use and their application in old electrical equipment and hydraulic
system.
Polychlorinated biphenyls can be divided into two groups according to their toxicological
properties. One group, consisting of 12 congeners, shows toxicological properties like dioxins
(effects on liver, thyroid, immune function, reproduction and behaviour), therefore named “dioxin-
like PCB” (DL-PCB). They are able to bind to the AH receptor (Aryl Hydrocarbon Receptor)
located in the cytoplasm, thus causing hepatotoxicity, in particular hyperplasia, vacuolization and
increased triglyceride contents and enzyme activity, thyrotoxicity through the bound to the hormone
receptor, affecting thyroid hormone status by inhibiting the binding of T4 to transthyretin which is
an important transport protein for both T4 and T3 (Chauhan et al., 2000), immunodepression as well
as alteration of reproduction and behaviour. Moreover, they can increase the transcription of genes
that encode for different biotransformative enzymes such as cytochrome P450.
The second group, mentioned to as “non-dioxin-like PCB” (NDL-PCB), have a partially different
toxicological profile, with effects on the developing nervous system and neurotransmitter function,
infact they can interfere with intracellular sequestration of calcium and increased activation of
protein kinase C (PKC), thereby altering intracellular signal transduction pathways (Kodavanti and

19
Tilson, 1997). Morover, NDL-PCBs can induce cellular apoptosis, increase in reactive oxygen
species, and alterations of the levels of dopamine and acetylcholine. NDL-PCBs may also interfere
with the binding of testosterone with the androgen receptor (Schrader and Cooke, 2003).
Furthermore, NDL-PCB can induce a UDP-glucuronosyltransferase which can enhance the
elimination of T4 from the circulation via glucuronidation (Hood and Klaassen, 2000). PCBs are
able to cause immunological effects, as morphological changes in organs related to the immune
system, as well as functional impairment of humoral- and cell-mediated immune responses immune
defects included decreases in thymic weight, reduced B cell numbers, reduced cytotoxic T-
lymphocyte response, and reductions in plaque forming cell response and IgM. PCB 153 can
produce modification on DNA bases. Infact Robertson and Gupta (2000) showed that metabolism
of PCB, generates electrophilic metabolites and reactive oxygen species that can damage DNA.
However, it is difficult to characterize the different toxicological profiles of NDL-PCBs and DL-
PCBs, which are always present together and in different proportions in mixtures, as the first ones
have a very low toxicity compared to the second ones and this difference does not permit to
describe an exact picture of the toxicity, in qualitative and quantitative terms, of NDL-PCBs
(EFSA, 2018); however they were classified by IARC (1987, 2016) in Group 2A (probably
carcinogenic to humans), based on limited evidence in humans and adequate in animals. No
published peer reviewed data are available on the carcinogenic potency of single congeners and it is
difficult to carachterize this non-dioxin like congener toxicity because mixtures contain both, as
described above. Inhibition of cellular communication, inhibition of apoptosis together with
induction of oxidative stress, are mechanisms which may be of relevance for PCB-related tumour
promotion (Worner and Schrenk, 1996; Bohnenberger et al., 2001).
The kinetics behaviour of the PCB congeners in the organism is influenced by their lipophilic
nature and the number of chlorine atoms. PCBs with highly chlorinated atoms have longest half
lives and therefore the greatest accumulation (PCB 138, PCB 153, PCB 170, and PCB 180). They
are usually adsorbed from gastrointestinal tract (Aoky, 2001), but also inhalations represent a
source of exposure (Currado and Harrad, 1997; Alcock 1998). In humans, PCBs are well absorbed
and subsequently distributed to liver and fat tissues, in which there is the major accumulation. The
structure of PCBs and the chlorination degree defines the rates of PCB elimination that is via urine,
faeces and milk. Breast milk represents a source of exposure for infants (EFSA, 2005).

20
The PCB-AhR binding causes the release of the inhibitory regulatory protein Hsp90 from AhR. At
this point the complex constituted by PCB-AhR migrates in the nucleus, where it binds to the factor
ARNT (Ah Receptor Nuclear Translocator) and induces the transcription of specific genes called
DRE (Dioxin Responsive Elements), which are involved in the mechanisms of differentiation and
cell division, in the metabolism of some hormones such as thyroid and some growth factors. The
AhR receptor has an important role in the nervous, reproductive and immune system (Figure 3)
Figure 3: PCB-AhR binding causes the release of the inhibitory regulatory protein.
NDL-PCBs can alterate the calcium (Ca++) homeostasis and induce cellular apoptosis and thyroid
hormone (TH) homeostasis (Th levels and transport). They are similar in agonist interaction with
the hepatic nuclear receptors. Morover, they can alterate reproductive system (Dingemans et al.,
2016).
To easily describe the PCB presence in a food matrix, EFSA selected six individual congeners,
called “indicator-PCBs” (PCB 28, PCB 52, PCB 101, PCB 118, PCB 138, PCB153) as they
represent about 50% of the total PCBs in mixtures (EFSA, 2005). Clearly speaking, the analysis of
a matrix can be previously made for the presence of NDL-PCBs, that, for their abundancy are more
easily detectable than DL-PCBs. Their eventual presence in a food matrix is therefore the indicator
of a presence of the DL-PCBs that, due to the high toxicity, requires at this stage a specific analysis.
The Control Organs simultaneously carry out the analysis of NDL-PCBs, DL-PCBs and dioxins,
PCB

21
because European regulations stated Maximum Levels (MLs) in food for all these categories of
substances (European Commission 1881/2006; European Commission 1259/2011).
Occurrence and exposure assessment
On the request made by the European Union, in accordance with Regulation (EC) No. 178/2002
(European Commission, 178/2002), EFSA elaborated a scientific opinion concerning the risk for
animal and human health related to the presence of dioxins and DL-PCBs in feed and food. So, in
1997 started a program to monitor the occurrence of dioxins and PCBs in food and in environment.
In almost all cases, the determinations of PCBs were limited to the indicator PCBs.
Based on toxicity studies and available datas found in literature, EFSA 2018 reported that the main
critical effect was on semen quality, following pre- and postnatal exposure. Therefore, it was
estimated that daily exposure in adolescents and adults should be below 0.25 pg TEQ/kg bw/day.
The CONTAM Panel established a Tolerable weekly intake (TWI) of 2 pg TEQ/kg bw/week.
1.4. Organoclhorine and organophoshorate insecticides
Insecticides (figure 4, figure 5) are a wide group of subtances, very different each other in their
chemical structure and physical charachteristic.
Figure 4: Structural formula of DDT (Organoclhorine compounds)

22
Figure 5: Structural formula of phorate (organophoshorate compounds)
They were introduced into the agriculture in the first half of the last century to destroy or control
any harmful organism (including micro-organisms and weeds), or to prevent their damage during
production, processing, storage, transport and marketing of crops and food (for humans and
animals). They include different classes depending on their structure and target, but, in this
manuscript, we focus on two classes of insecticides: organochlorine and organophosphorus
compounds (OPs). Organochlorine (OC) (figure 5) are an heteregoneous group of compounds that
belong to three chemical classes with structures related to dichlorodiphenylethane (DDT), to
cyclohexane, the most important compound being hexachlorocyclohexane (HCH), a mixture of
various isomers (α, β, lindane) and the cyclodiens (aldrin, dieldrin, endrin). The most well-known
and widely used compound was DDT, which is a mixture of various isomers (e.g. pp’-DDT; op’-
DDT, etc), still present in environment. Organochlorines are compounds with low volatility,
lipophilic and high chemical stability as well as slow biodegradation rate that makes them persistent
in the environment. Morover, by evaporation they can pass into the atmosphere and reach long
distance from the place of release, as well as through soil erosion they can spread into the aquatic
environment contaminating it (Naso et al., 2005; Muccio et al., 2002; Binelli et al., 2004).
Organochlorine insecticides were widley used from the fourties and the seventies of the last
century, when their use was prohibited, and they were replaced by organophosphorus compounds
and carbamates. Unfortunately, the restrictions and bans have not prevented the occurrence of
pollution events as for example in 1996 in Piedmont, where there was a serious environmental
pollution from DDT due to the accidental discharge of waste in the river Toce, reported also by
national press (La Repubblica, 1996). Morover in 2006, the World Health Organization and the
U.S. Agency for International Development endorsed indoor DDT spraying to control malaria, and
therefore DDT continues to be used for malaria control in several African and Asian countries
(Sougoufara et al., 2017).

23
The toxic action of insecticides should be directed exclusively towards the target species, but most
of these compounds do not have a high specificity, so toxicity can occur in many living beings
(Nebbia, 2009). Morover, as for non-insecticide organochlorine, they are often a mixture of
congeners of the same group. So, it is hard to distinguish the specific health effects. However, it is
possible to confirm that the main toxicological effect of OCs is on nervous system. It has been
observed that long OCs (DDT) exposure at high doses causes human ataxia, paraestesia, dizziness,
nausea, vomiting, tremors and lethargy. They can cause a decrease in rest potential with a
consequent increase in nervus excitability; inhibit ATP-ases and inhibit the release of
neuotransmitters. Many organochlorines are endocrine disruptors and they are associated with
reproductive effects, embriotoxicity and immunological problem (Longnecker et al., 1997).
In 1991, the International Agency for Research on Cancer (IARC) rated OCs and DDT as “possibly
carcinogenic to humans (Group 2B)” (IARC 1991).
This rating was largely based on the induction of liver tumors in experimental animal studies that
reported significant increases in hepatomas (neoplastic liver cell tumors) and researcher observed an
association between OCs and tumors like breast cancer, non-Hodgkin's lymphoma, pancreatic
cancer or leukemia and Hodgkin's disease but the datas are still inconclusive (Eskenazi et al., 2009)
(Longnecker et al., 1997).
The organochlorines, infact, are quickley absorbed into the organism and after binding to serum
lipoproteins, are transported to lipid-rich tissues such as liver, kidney and nerve tissue. In the body,
they are slowly biotransformed and in humans the half-life can be up to 3 years for DDT.
The organophosphorus (figure 6) and carbamate insecticides are represented by a wide variety of
chemical structures having different chemical and physical properties. The group includes esters of
phosphoric, phosphonic, phosphamidic, phosphorotionic, and other phosphorous-based acids. They
are acetylcholinesterase inhibitors (AChE) that is a neurotrasmettitor involved in the transmission of
nerve impulses to effector cells at cholinergic, synaptic, and neuromuscular junctions.
Their acute toxicity is caused by the inhibition of acetylcholinesterase in the synaptic space of both
muscaric and nicotinic receptors in the parasympatic system, and in the neromusclar junction and
have a role also in the central nervous system: muscarinic effects appear firstly and include: myosis,
sweating, scialorrhea, increase in peristalsis, abdominal pain, vomiting and diarrhea,
bronchoconstriction and increase in bronchial secretions; nicotinic effects are tachycardia, muscle
fasciculations, tremors and muscle paralysis; central effects are restlessness, excitement, asthenia,

24
respiratory center depression, convulsions. Exitus can be lethal and occurs for respiratory failure
due to bronchoconstriction and hypersecretion (muscarinic), paralysis of respiratory muscles
(nicotinic), and depression of respiratory centers (central). In several epidemiological studies, the
association between OP exposure and neurobehavioral effects and delayed neurologic diseases such
as Parkinson's disease has been observed (Colosio et al., 2003), (Manthripragada et al., 2010),
(Rohlman et al., 2011). In addition, OPs may contribute to birth deficits, childhood brain tumors,
leukemia and lymphomas and may also act as liver and respiratory system toxicants (Koureas et al.,
2012).
Acetylcholinesterase inhibitors are not persistent in environments and do not cause significant
bioaccumulation phenomena. They may persist for a few hours or weeks depending on their
specific and soil characteristics. This results in minimal contamination of water resources and soils.
Regulatory status
Pesticide residues resulting from the use of plant protection products on crops or food products that
are used for food or feed production may pose a risk factor for public health. For this reason,
European Commission defines rules for the active substances used in agriculture. To ensure the
consumer protection, EC defined the Maximum Levels (MLs) that are the highest concentration of a
pesticide tolerated in food or feed when pesticides are applied correctly (Good Agricultural
Practice). They are established with Regulation (EC) No 396/2005 (EC, 2005). European
Commission set Maximum Residues Levels (MRLs) for more than 500 pesticides in over 370 food
products and a default MRL of 0.01 mg kg-1, a level equal to the limit of quantification (LOQ)
achievable with analytical methods, is applicable for pesticides not explicitly mentioned in the ML
legislation. Regulation (EC) No 396/2005 imposes on Member States the obligation to carry out
controls to ensure that food on the market is compliant with the legal limits.
Occurrence and exposure
About organochlorine insecticides, being POPs and therefore banned in developed Countries, the
risk for biota comes from the environmental pollution occurred in the last century.
The major problem, for acetylcholinesterase inihibitors, regards the misuse of insectidices for plant
protection, for wich agriculture ministry fixed planned checks on fruit and vegetables to avoid
consumer risk. Studies conducted from 1985 until now, showed the high occurrence of diazinion,

25
demeton, chlorpyrifos, phorate that are among the most employed and for wich, EC defined a
directive on the consumer risk (European Commission 1107/2009). Lastly, even non-food crops,
like floriculture, indirectly contribute to the exposure of animals and humans to organophosphorous
insecticides, which through the soil and therefore water can be transferred to them.
1.5. Polycyclic aromatic hydrocarbon
Polycyclic aromatic hydrocarbons (PAHs) constitute a wide class of chemical compounds. The
structure of these compounds is the presence of two or more benzene rings joined together (Figure
6).
Figure 6: Chemical structure of benzopyrene.
The term PAH identifies compounds containing only carbon and hydrogen atoms and their
chemical properties are different on the base on the number of rings and molecular wheight. PAHs
are stable compounds, although after photodecomposition in the presence of air and light give rise
to many oxidation products, especially quinones and endoperoxides. They are produced from
combustion processes, industrial processes like production of alluminum, iron, and steel, electricity
generation systems, petroleum products, pyrolysis of organic material containing carbon, such as
coal, wood, waste, forest fires, tobacco smoke, and volcanoes which can be a natural source with an
impact on the environment. Due to the several sources, they are ubiquitous compounds. PAHs are
always present in complex mixtures of different compounds and so they are found in different
environment compartments (air, water, soil.). Due to their structure, the major route of exposure is

26
air, infact their presence as air pollutants represents an important health problem because many of
them have proved to be carcinogens in laboratory animals. PAHs can contaminate food through
environment and during production process. In unprocessed foods, the presence of PAHs is
essentially due to environmental contamination: deposition of particulate matter atmospheric (e.g.
on wheat, fruit and vegetables), absorption from contaminated soil (e.g. potatoes), uptake by
contaminated river and sea water (e.g. shellfish, fish and crustaceans). Common sources of PAHs in
processed food are heat treatments (grilling, baking and frying) and some manufacturing processes
as drying through the combustion fumes (e.g. in the case of vegetable oils) and the food smoking
processes with the traditional methods. Regards their toxicological profile, their cancerogenity
properties is correlated to their chemical structure, infact they must have at least four condensed
rings. The condensation of the rings decreases, in fact, their aromaticity and makes metabolic
reactions of epoxydation easier with formation of compounds with carcinogenicity properties. It
must be underlining that dihydrodiolepoxides of PAHs are the actual carcinogenetic agents (EFSA,
2008a).
2.1. Emerging contaminants
2.1.1 Perfluoroalkyl substances
Figure 7 Structural formula of perfluorooctane sulfonate as an example of perfluoroalkyl
susbtances
Perfluoroalkyl substances (PFAS) are a group of fluorinated compounds, with high thermal and
chemical inertness due to their structure which consist of an anionic site bound to a lipophylic
chain: they therefore are generally hydrophobic but also lipophobic and consequently do not
bioaccumulate in fatty tissues differently from other persistent halogenated compounds (Figure 7).

27
Perfluoroalkyloctan sulphonic acid (PFOS) and perfluoroctanoic acid (PFOA), the two usually
investigated PFAS, and other “perfluorinated compounds have been widely used in industrial and
consumer applications including stain- and water-resistant coatings for fabrics and carpets, oil-
resistant coatings for paper products approved for food contact, fire-fighting foams, mining and oil
well surfactants, floor polishes, and insecticide formulations” (EFSA 2008b). Because of their
extensive use they are widely found in the environment and, although their production dates to the
the fifties, they are commonly considered emerging contaminants. In fact, in the last years, the
threshod doses have been reviewed regarding the “end points” subsequently considered.
In 2008 EFSA CONTAM Panel established a Tolerable daily intake (TDI) for PFOS of 150 ng/kg
b.w. derived from a subchronic study in Cynomolgus monkeys.
In subacute and chronic studies toxicity liver developmental toxicity was observed. Other sensitive
effects were changes in thyroid hormones and high-density lipoprotein (HDL) levels in rats and
monkeys. PFOS moreover induced liver tumours in rats, probably due to a non-genotoxic mode of
action. For PFOA, the CONTAM Panel established a TDI of 1.5 μg/kg b.w.
However, the epidemiological studies on human, made on professional exposure, were ambiguous
and often did not agree with animal studies.
In the years 2005-2013, the joint “C8 Science Panel” between Du Pont (E.I. du Pont de Nemours
and Company) and plaintiffs regarding releases of C8 from the Washington Works plant in
Parkersburg, West Virginia carried out exposure and health studies in the Mid-Ohio Valley
communities, which had been potentially affected by the releases of PFOA (or C8) emitted since the
1950s. Many articles have been published and for six disease categories, the Science Panel
concluded that there was a Probable Link to C8 exposure: diagnosed high cholesterol, ulcerative
colitis, thyroid disease, testicular cancer, kidney cancer, and pregnancy-induced hypertension.
Based on the collected data, in 2016 the US Agency for the register of toxic substances and diseases
(ATSDR) indicated guide values of 30 (PFOS) and 20 (PFOA) ng kg-1 b.w./day as ‘Reference
Dose’ (RFD), for the whole population included most vulnerable groups. These values were
supported by experimental data with fetal developmental toxicity in laboratory animals exposed
during pregnancy (preterm and underweight births, ossification defects) and with a reduced
seroconversion in following vaccination.
In 2016, the Netherlands National Institute for Public Health and the Environment extrapolated,
from liver toxicity observed in studies in laboratory animals, a PFOA TDI of 12.5 ng kg-1 b. w. /
28
day. In 2018, EFSA elaborated a new opinion, on European Commission request, on the risk to
human health related to the presence of PFOS and PFOA in food. For PFOS, the increase in serum
total cholesterol in adults, and the decrease in antibody response at vaccination in children were
identified as the critical effects. For PFOA, the increase in serum total cholesterol was the critical
effect. CONTAM Panel established a tolerable weekly intake (TWI) of 13 ng kg-1 body weight
(b.w.) per week for PFOS and 6 ng kg-1 b.w. per week for PFOA. For both compounds, exposure of
a considerable proportion of the population exceeds the proposed TWIs (EFSA 2018).
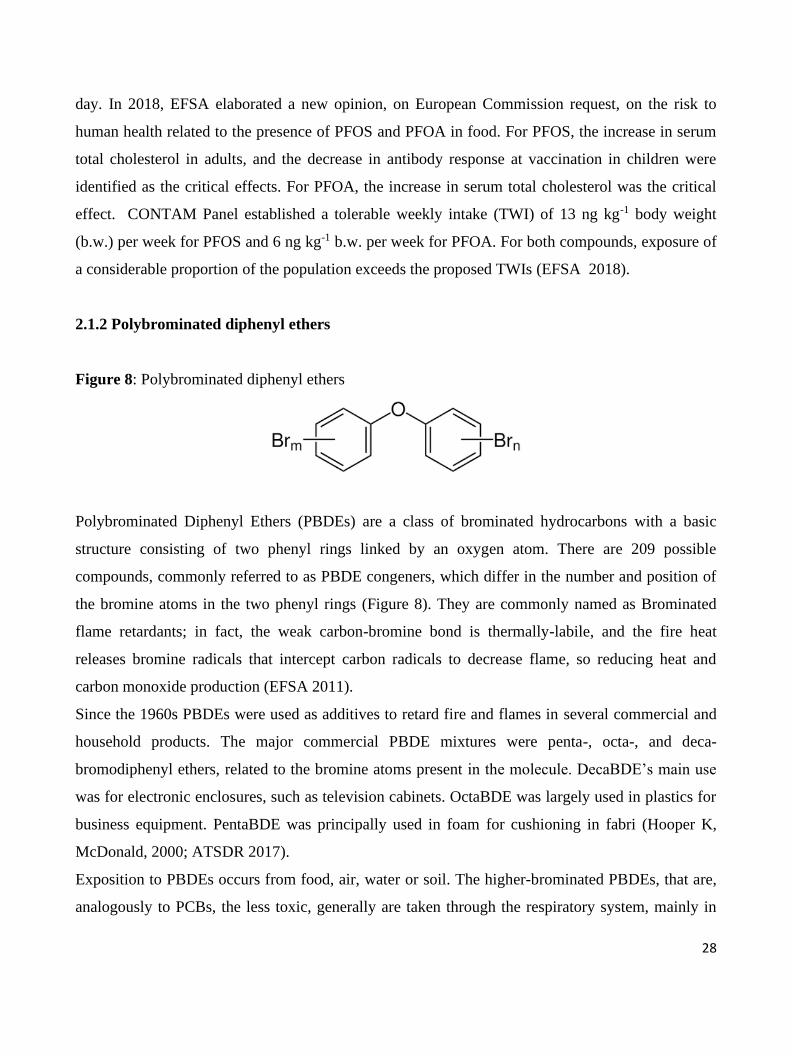
2.1.2 Polybrominated diphenyl ethers
Figure 8: Polybrominated diphenyl ethers
Polybrominated Diphenyl Ethers (PBDEs) are a class of brominated hydrocarbons with a basic
structure consisting of two phenyl rings linked by an oxygen atom. There are 209 possible
compounds, commonly referred to as PBDE congeners, which differ in the number and position of
the bromine atoms in the two phenyl rings (Figure 8). They are commonly named as Brominated
flame retardants; in fact, the weak carbon-bromine bond is thermally-labile, and the fire heat
releases bromine radicals that intercept carbon radicals to decrease flame, so reducing heat and
carbon monoxide production (EFSA 2011).
Since the 1960s PBDEs were used as additives to retard fire and flames in several commercial and
household products. The major commercial PBDE mixtures were penta-, octa-, and deca-
bromodiphenyl ethers, related to the bromine atoms present in the molecule. DecaBDE’s main use
was for electronic enclosures, such as television cabinets. OctaBDE was largely used in plastics for
business equipment. PentaBDE was principally used in foam for cushioning in fabri (Hooper K,
McDonald, 2000; ATSDR 2017).
Exposition to PBDEs occurs from food, air, water or soil. The higher-brominated PBDEs, that are,
analogously to PCBs, the less toxic, generally are taken through the respiratory system, mainly in

29
the form of house dust while the lower-brominated congeners penta- and tetra- PBDEs exposure is
mainly oral, i.e. through food. Toxicity of PBDEs is also affected by their kinetics: decaBDE has an
apparent half-time of 15 days, while lower-brominated PBDEs have apparent half-times as high as
94 days. Thus, lower brominated PBDEs accumulate and persist in body fat o a very higher degree
than decaPBDE also accumulates in body fat, but to a lesser degree (ATSDR 2017; EFSA 2011).
Litlle is known about the health effects of PBDEs in human, as most of the information regards
their toxicity in studies on laboratory animals even if recent studies have evaluated associated
PBDE concentrations in human tissues like blood or breast milk and health effects. Neurobehavioral
changes and damage to the reproductive systems of adult rats and mice orally exposed to small
amounts of lower-brominated PBDEs during early development was observed. Altered
neurobehavior was also observed in rats and mice that ingested higher doses of decaBDE during
early development. Subchronic studies on adult rats and mice demonstrated thyroid and liver effects
for ingestion o moderate doses of lower-brominated PBDEs. Some PBDEs might impair the
immune system. Evidence from human studies suggest a possible association between PBDE
exposure and altered neurodevelopment. DecaBDE chronic assumption evoked toxic effects in the
pancreas (diabetes), nervous system, immune system, and reproductive system (ATSDR 2017).
Epidemiological studies on humans did not demostate association between PBDEs and an
augmented risk ofnon-Hodgkin lymphoma, pancreatic testicular and breast cancer (EFSA 2011).
The International Agency for Research on Cancer (IARC) classifies PBDE as a Group 3 carcinogen
(not classifiable as to its carcinogenicity to humans) based on inadequate evidence of
carcinogenicity in humans and inadequate or limited evidence in experimental animals (IARC
2018a).
To protect health and the environment, EU has adopted legislation aimed at reducing or ending the
sale and use of some BFRs. Directive 2003/11/EC (European Commission 2003) of the European
Parliament and of the Council Council Directive 76/769/EEC (European Commission 1976)
relating to restrictions on the marketing and use of certain dangerous substances and preparations
prohibits the sale of two commercial mixtures of PBDEs, known as pentaBDE and octaBDE, in
concentrations above 0.1% by mass.
From July 2006, in accordance with Directive 2002/95/EC (European Commission 2002) of the
European Parliament and of the Council on the restriction of the use of certain hazardous substances
in electrical and electronic equipment, all electrical and electronic equipment can no longer contain

30
PBDE, in any concentration. In July 2008 also a third PBDE mixture, the decaBDE, which had
originally been exempted from the restrictions, was banned by the European Court of Justice
(EFSA, 2008).
The critical endpoint identified by EFSA Contam Panel is the effect on neurodevelopment. The
Panel provided the related benchmark doses (BMDs), based on animal experiments, and their
corresponding lower 95 % confidence limit for a benchmark response of 10 %, BMDL10s, for some
PBDE congeners: PBDE-47 (309 μg/kg b.w.); PBDE-99 (12 μg/kg b.w.); PBDE-153 (83 μg/kg
b.w.) and PBDE-209 (1,700 μg/kg b.w). However, the kinetics of PBDE congeners in animals and
humans differ considerably and cause severe uncertainties, therefore it was considered inappropriate
to establish health-based guidance values. The Panel used a margin of exposure (MOE) approach
for the health risk assessment using the estimated body burden in animals as starting point (EFSA,
2011). The risk charachterization on PBDEs exposure with food in the following presented papers
is similarly approached.
3.1 Metals and metalloids
Metals and metalloids are ubiquitous and non-biodegradable environmental chemicals.
Due to anthropogenic activities, their concentration in the environment is generally increasing and
the biomagnification in the food chain is a major issue (Wu et al., 2016; Alloway B.J. 2013).
The presence of these chemicals in the environment and in food can cause, on exposed humans and
animals, several toxic effects such as cancers, birth and immune system defects, mental retardation,
behavioral abnormalities, immunotoxicity, low fertility, altered sex hormone balance, altered
metabolism and specific organ dysfunctions (Wu et al., 2016). It is now widely aknowledged that
environmental contaminats toxicity must be considered not only as single chemicals but as mixtures
(Wang and Fowler, 2008). The cumulative toxicity of metals and metalloids, below described and
then considered in the works presented in Chapter 3, is therefore always accounted.
3.1.2 Arsenic
Arsenic is a metalloid with two oxidation states: As3+ up to ten times more toxic than As5+. It is
abundant in the soil and is present in almost all plant and animal tissues. A large amount of As,
equal to an estimated quantity of 40000 tons, is introduced in the environment every year both for

31
rock erosion and anthropic activities, like electronic, varnish or heavy industry and carbon
combustion. In water and soil, bacteria can oxidate, reduce methylate and demethylate As, that is
found in food in its organic or inorganic form.
Organic arsenic species, particularly arsenobetaine, are the most common forms in seafood, while in
foods of terrestrial origin the predominant arsenic forms are iAs, both As5+ and As3+, through
grain-based processed products, and single methylated arsenic species (methylarsonate,
methylarsenite and dimethylarsinate (DMA). Arsenic enters the food chain mainly through
contaminated water and soil (Francesconi, 2010). Due to its fast toxicokinetics, organic arsenic has
a very low toxicity. As3+ binds to sulphydril grup of enzymes of the tricarboxylic acid cycle and
therefore tissues with high oxidative requirements such as intestinal epithelium, kidney, liver skin
and lung are the most affected. As 5+ can substitute for phosphate, decoupling the oxidative
phosphorylation in oxidative phosphorylation. Among products of animal origin, the most
significant contribution is provided by the consumption of seafood, in which over 90% of As is in
organic form, therefore not very toxic. In molluscs and shellfish, the accumulation is higher than
other seafood. Currently no maximum limits have been set for As in food, however the relatively
high concentrations of the metalloid in molluscs and crustaceans have contributed to raise the
attention in the EU. In 2009, in fact, EFSA (EFSA 2009a) re-evaluated the provisional tolerable
weekly intake (PTWI) of As of 15 mg kg-1 body weight, and based on epidemiological studies
suggested a range, for a 0.1% increased incidence (BMDL01) of skin lesions and cancer of the lung,
skin and bladder, between 0.3 and 8 mg kg-1 b.w. day-1 (EFSA 2009a).
3.1.3 Cadmium
Cadmium contaminates the environment through natural occurrence and anthropic, both industrial
and agricultural, activities. Cadmium is poorly absorbed by humans and animals after dietary
exposure (less than 10%) but is concentrated in the kidney tubules and to a lesser degree in the
liver, with a very long biological half-life ranging in the humans 10 to 30 years. Cadmium induces
the synthesis of metallothionein, to which binds in many tissues and in the form of complex
methallothionein-cadmium, accumulates in the kidney. In this organ, especially to the proximal
tubular cells, after metabolism it is released in its free form and explicates its major action and is
therefore nephrotoxic (Osweiler G.D.1996). Bone demineralisation, both through adirect effect or
indirectly caused by renal dysfunction, is another important effect. If the exposure is chronic and at

32
high levels the tubular damage can worsen to renal failure. The International Agency for Research
on Cancer (1993) have classified cadmium in Group 1 (human carcinogen) (IARC 1993).
Epidemiological studies associate with cadmium the increase of risk of cancer to the lung,
endometrium, bladder, and breast (EFSA 2009b).
3.1.4 Chromium
Chromium is a trace element found in nature in different states of oxidation; the most interesting
forms under toxicological aspects are the trivalent form Cr (III) and the hexavalent Cr (VI) form.
The second form is scarcely present in food, due to the reduction activty of most foods, and is
reduced in gastrointestinal tract, but is largley persent in soil and water. The sources of Cr mainly
occur in environment from industrial processes, use of fossil fuels, metal refining, textile and
cement industries. In respect to other metals, Cr have an important role in glucose and lipid
metabolism, and even if high concentrations are toxic for human health. Its mode of action is not
well known.
In human hepatic, renal alterations and haemolytic anemia have been described due to chronic
exposure to trivalent chromium; Cr (VI) is almost exclusively present in drinking water and is
classified by the International Agency for Research on Cancer (IARC 2018b) as carcinogenic to
humans (Group 1). EFSA suggested a tolerable daily intake (TDI) for Cr (III) of 300 mg kg-1 body
weight (EFSA 2014).
3.1.5 Mercury
Mercury is a metal immitted into the environment from both natural and anthropogenic sources
(electrical installations, industry and chemical factory). Natural sources are degassing of the earth’s
crust, emissions from volcanoes and evaporation from water. Once released, mercury undergoes
different transformations in atmosphere, ocean and land (figure 9). The three chemical forms of
mercury are elemental mercury (Hg0), inorganic mercury and organic mercury. The most frequent
form of organic mercury in food chain is methylmercury. The critical target for toxicity of inorganic
mercury is the kidney. Other targets include liver, nervous system, and immune system,
reproductive and developmental systems.
The EFSA Contam Panel established a tolerable weekly intake (TWI) for methylmercury of 1.3
μg/kg b.w., expressed as mercury (EFSA 2012). Unborn children are the most vulnerable group for

33
developmental effects of methylmercury exposure, and pregnant women can be present in the group
of high and frequent fish consumers. The most important critical effect of Hg are nervous system
dysfunctions like tremors, irritability, memory problems, changes in vision and hearing. EU has set
maximum levels (MLs) for Hg (EC 1881/2006) in foods.
Figure 9: Mercury cycle
Sources: Mason, Robert P, W.F. Fitzgerald, and François MM Morel. 1994 .François M. M. Morel Albert G. Blanke,
Professor of Geosciences Department of Geosciences, Princeton
University.https://morel.princeton.edu/research/mercury-cycling-and-methylation.
3.1.6 Lead
Lead is present in the earth's crust and enters in the composition of over 200 minerals that are
naturally present in the soil (figure 10). Its concentration varies greatly depending on areas, whether
they are urban or rural, due to some human activities such as foundries, pigments for paints,
metalmeccahinche industries, and production of ammunitions and glazes for ceramics (Nebbia,
2008). The water systems favour its diffusion in the soil where it tends to be located mostly at the
level of the roots of the plants. Aquatic and terrestrial fauna has the same ability to bioconcentrate
lead at different levels and, among the terrestrial animals, the most exposed are herbivores due to
their grazing behaviours. Human exposure is mainly via food and water, as well as air, dust and
soil. Cereal and cereal products are the products responsible of most of the dietary lead exposure. In
the organism lead tend to bioaccumulate in bones and children are more exposed than adults, for
wich house dust and soil can be an important source of exposure (EFSA 2010).

34
Figure 10: Lead comtamination
Sources: Lead sources in the environment (adapted from Sharma and Dubey 2005)
The critical effects of lead are developmental neurotoxicity in young children and cardiovascular
effects and nephrotoxicity in adult. In fact, the 95th percentile lower confidence limit of the
benchmark dose (BMD) of 1 % extra risk (BMDL01) for developmental neurotoxicity is 0.50 μg/kg
b.w. per day, for systolic blood pressure (SBP) is 1.50 μg/kg b.w. per day, while, accounting for an
extra risk of 10% the BMDL for chronic kidney disease (CKD) is 0.63 μg/kg b.w. per day. Based
on these data EFSA considers no longer appropriate the current PTWI of 25 μg/kg b.w. The
International Agency for Research on Cancer classified inorganic lead as probably carcinogenic to
humans (Group 2A) in 2006. Maximum levels (MLs) for Pb in food are set in the Commission
Regulation (EC) No 1881/2006 (EFSA, 2010).
3.1.7 Nickel
Ni is a widespread component of Earth’s surface. Its presence in food chain and drinking water is
determined by both natural and anthropogenic factors. There are no MLs for Ni in food. A tolerable
daily intake of 2.8 μg Ni/kg body weight (b.w.) per day was choosen as health-based exposure
level. The critical effects reported after Ni exposures are respectively dermatitis (SDC) in Ni
sensitive individuals and reproductive and developmental toxicity after chronic exposure.

35
Ni and Ni compounds have been classified by IARC (2012) as human carcinogens causing cancers
of the lung, nasal cavity and paranasal sinuses after inhalation. Moreover, it is reported that
individuals sensitised to nickel, after dermal contanct or oral ingestion, may develop eczematous
flare-up reactions in the skin (systemic contact dermatitis, SCD (EFSA, 2015).
4.1. Antibiotics
Antimicrobials, like antibiotics, are substances able to kill micro-organisms or to hamper their
growth and proliferation. The term “antibiotic” was invented by Selman Waksman, who discovered
the antibiotic streptomycin, but the era of antibiotics began in the 1940s, with the introduction of
penicillin that has been recognised as one of the greatest advances in therapeutic medicine,
discovered by Alexander Fleming, Professor of Bacteriology at St. Mary's Hospital in London, in
1928. Antibiotics are compounds produced by bacteria and fungi which can kill, or inhibiting,
competing microbial species. In 1945, Fleming, Florey and Chain were awarded the Nobel Prize for
“the discovery of penicillin and its curative effect in various infectious diseases” (the Nobel Prize in
Physiology or Medicine, 1945).
Unfortunatley, the influence of antibiotics is now declining due to the progressive rise of resistance,
and this phenomenon is observed among for all antimicrobial drugs. The wide use and misuse of
antibiotics, infact, were the causes of the growth and spread of micro-organisms that are resistant to
their action, resulting in loss of treatment efficacy and serious risks to public health (Lobanovska et
al., 2017). In literature there are increase reports of bacterial species which are resistant to all know
antibiotics and a well-known example of a bacterium that has developed the ability to resist
multiple antibiotics is Meticillin-resistant Staphylococcus aureus (MRSA). Resistant bacteria can
spread through many pathways. When antimicrobial resistance occurs in zoonotic bacteria in
animals and food, it can also compromise the effectiveness of the treatment of infectious diseases in
humans. In the field of food safety, policy makers must protect consumers from risks related to the
food chain and implement the best control measures to reduce those risks. Data released today by
the European Centre for Disease Prevention and Control (ECDC) and the European Food Safety
Authority (EFSA) reveal that antimicrobials used to treat diseases that can be transmitted between
animals and humans, such as campylobacteriosis and salmonellosis, are losing their effectiveness.
Vytenis Andriukaitis, European Commissioner for Health and Food Safety, said: “The report

36
released today should ring – again – alarm bells. It shows that we are entering a world where more
and more common infections become difficult – or even sometimes impossible – to treat. Let’s make
sure that we increasingly act all together, in every country and across the public health, animal
health and environment sectors under the One Health approach.” The joint report, which presents
the data collected from 28 EU Member States from humans, pigs and calves under one year of age,
confirms the rise in antibiotic resistance already identified in previous years. The EU has strictly
regulated controls on the use of antibiotics and other veterinary drugs, particularly in food animal
species, by issuing several Regulations and Directives. Council Regulation 2377/90/EEC (EC
2377/90), established maximum residue limits (MRLs) of veterinary medicinal products in
foodstuffs of animal origin and Council Directive 96/23/EC (EC 96/23) contains guidelines for
controlling veterinary drug residues in animals and their products with detailed procedures for EU
Member States to set up national monitoring plans, including details on sampling procedures. In the
specific case, the Criteria to define the performance of analytical methods and the interpretation of
results have been established in the Commission Decision 2002/657/CE (CE 2002/657).
Antimicrobial Resistance (AMR) is a global health security threat that requires intensive cross-
sectional action by governments and society. Surveillance that generates reliable data is the
essential basis of sound global strategies and public health actions to contain AMR and is urgently
needed around the world. In June 2017, the European Commission adopted a unified EU Health
Action Plan against Antimicrobial Resistance, calling for effective action and recognising that it
must be addressed in terms of both human health and animal health and the environment. The
prudent use of antimicrobials is essential to limit the emergence and spread of antibiotic-resistant
bacteria in humans and animals.

37
References:
• Alloway, B.J. 2013. Bioavailability of elements in soil. Springer Dordrecht. Essentials of
medical geology, 351-373.
• Alcock, R. E., Behnisch, P. A., Jones, K. C., & Hagenmaier, H. (1998). Dioxin-like PCBs in
the environment-human exposure and the significance of sources. Chemosphere, 37(8),
1457-1472.
• Aoki, Y. 2001. Polychlorinated biphenyls, polychloronated dibenzo-p-dioxins, and
polychlorinated dibenzofurans as endocrine disrupters—what we have learned from Yusho
disease. Environmental research, 86, 2-11.
• Agency for Toxic Substances and Disease Registry (ATSDR) 2017. Toxicological profile
for polybrominated diphenyl ethers (PBDEs). U.S. Department of Health and Human
Services, 1-592. https://www.atsdr.cdc.gov/ToxProfiles/tp.asp?id=901&tid=183 (Accessed
19/08/2019).
• Binelli, A., Bacchetta, R., Mantecca, P., Ricciardi, F., Provini, A., Vailati, G. 2004. DDT in
zebra mussels from Lake Maggiore (N. Italy): level of contamination and endocrine
disruptions. Aquatic Toxicology, 69, 175–188.
• Bohnenberger, S., Wagner, B., Schmitz, H. J., Schrenk, D. 2001. Inhibition of apoptosis in
rat hepatocytes treated withnon-dioxin-like'polychlorinated biphenyls. Carcinogenesis, 22,
1601-1606.
• Centers for Disease Control and Prevention, National Center for Emerging and Zoonotic
Infectious Diseases (NCEZID) 2016. Saving lives protecting peopletm.
http://www.cdc.gov/onehealth/people-events.html. (Accessed 19/08/2019).
• Chauhan, K. R., Kodavanti, P. R. S., McKinney, J. D. 2000. Assessing the role of ortho-
substitution on polychlorinated biphenyl binding to transthyretin, a thyroxine transport
protein. Toxicology and applied pharmacology, 162, 10-21.
• Chen, H., Wang, C., Li, H., Ma, R., Yu, Z., Li, L., Xiang, M., Chen, X., Hua, X., Yu, Y.,
2019. A review of toxicity induced by persistent organic pollutants (POPs) and endocrine-
disrupting chemicals (EDCs) in the nematode Caenorhabditis elegans. Journal of
Environmental Management 237, 519–525.

38
• Colosio, C., Tiramani, M., Maroni, M. 2003. Neurobehavioral Effects of Pesticides: State of
the Art. NeuroToxicology, 24, 577–591.
• Councile Directive (EC) No 76/769 of 27 july 1976 on the approximation of the laws,
regulations and administrative provisions of the Member States relating to restrictions on the
marketing and use of certain dangerous substances and preparations. Official Journal of the
European Union, L 262/201.
• Commission Regulation (EC) No 2377/90 of 26 june 1990 laying down a Community
procedure for the establishment of maximum residue limits of veterinary medicinal products
in foodstuffs of animal origin. Official Journal of the European Union, L 224/1.
• Commission Regulation (EC) No 96/23 of 29 april 1996 on measures to monitor certain
substances and residues thereof in live animals and animal products and repealing Directives
85/358/EEC and 86/469/EEC and Decisions 89/187/EEC and 91/664/EEC. Official Journal
of the European Union, L 125/10.
• Commission Regulation (EC) No 2002/657 of 12 August 2002 implementing Council
Directive 96/23/EC concerning the performance of analytical methods and the interpretation
of results. Official Journal of the European Union, L 221/8.
• Commission Regulation (EC) No 178/2002 of 28 January 2002 laying down the general
principles and requirements of food law, establishing the European Food
SafetyAuthorityand laying down procedures in matters of food safety. Official Journal of the
European Union, L 31/1.
• Council Dirctive (EC) No 2002/95/EC of 27 january 2003 on the restriction of the use of
certain hazardous substances in electrical and electronic equipment. Official Journal of the
European Union, L37/19.
• Council Directive (EC) No 2003/11/EC of 6 february 2003 amending for the 24th time
Council Directive 76/769/EEC relating to restrictions on the marketing and use of certain
dangerous substances and preparations (pentabromodiphenyl ether, octabromodiphenyl
ether). Official Journal of the European Union, L 42/45.
• Commission Regulation (EC) No 396/2005 of 23 February 2005 on maximum residue levels
of pesticides in or on food and feed of plant and animal origin and amending Council
Directive 91/414/EEC. Official Journal of the European Union, L 70/1.

39
• Commission Decision (EC) No 2006/507 of 31 July 2006 on Persistent organic pollutants
(POPs) harm human health and the environment, tackling threats posed by chemicals
(Stockholm Convention). Official Journal of the European Union, L 209,1-2.
• Commission Regulation (EC) No 1881/2006 of 19 December 2006. On maximum levels for
certain contaminants in foodstuffs. Official Journal of the European Union, L 364/5.
• Commission Regulation (EU) No 1107/2009 of 21 October 2009 concerning the placing of
plant protection products on the market and repealing Council Directives 79/117/EEC and
91/414/EEC. Official Journal of the European Union, L 309/1.
• Commission Regulation (EU) No 1259/2011 of 2 December 2011 amending Regulation
(EC) No 1881/2006 as regards maximum levels for dioxins, dioxin-like PCBs and non-
dioxin-like PCBs in foodstuffs. Official Journal of the European Union, L 320/18.
• Currado, G. and Harrad, S. 1997. The significance of indoor air inhalation as a pathway of
human exposure to PCB. Organohalogen Compds. 33,377-381.
• De Brabander, H.F., Le Bizec, B., Pinel, G., Antignac, J.P., Verheyden, K., Mortier, V.D.,
Courtheyn, D., Noppe, H. 2007. Past, present and future of mass spectrometry in the
analysis of residues of banned substances in meat‐producing animals. Journal of mass
spectrometry, 42, 983-998.
• Dingemans, M.M., Kock, M., Van den Berg, M. 2016. Mechanisms of action point towards
combined PBDE/NDL-PCB risk assessment. Toxicological Sciences, 153, 215-224.
• El-Shahawi, M.S., Hamza, A., Bashammakh, A.S., Al-Saggaf, W.T. 2010. An overview on
the accumulation, distribution, transformations, toxicity and analytical methods for the
monitoring of persistent organic pollutants. Talanta, 80,1587-1597.
• European Food Safety Authority (EFSA), 2005. Opinion of the scientific panel on
contaminants in the food chain on a request from the commission related to the presence of
non dioxin-like polychlorinated biphenyls (PCB) in feed and food. The EFSA Journal 284, 1
– 137.
• European Food Safety Authority (EFSA), 2008a. Polycyclic Aromatic Hydrocarbons in
Food1Scientific Opinion of the Panel on Contaminants in the Food Chain. The EFSA
Journal 724, 1-114.

40
• European Food Safety Authority (EFSA), 2008. Perfluorooctane sulfonate (PFOS),
perfluorooctanoic acid (PFOA) and their salts Scientific Opinion of the Panel on
Contaminants in the Food chain. The EFSA Journal 653, 1-131.
• European Food Safety Authority (EFSA), 2009a. Scientific Opinion on Arsenic in Food:
Arsenic in Food. The EFSA Journal 7(10), 1351-1550.
• European Food Safety Authority (EFSA), 2009b. Cadmium in food ‐ Scientific opinion of
the Panel on Contaminants in the Food Chain. The EFSA Journal 980, 1-139.
• European Food Safety Authority (EFSA), 2010. Scientific Opinion on Lead in Food. The
EFSA Journal 8, 1570-1721.
• European Food Safety Authority (EFSA), 2011. Scientific Opinion on Polybrominated
Diphenyl Ethers (PBDEs) in Food1EFSA Panel on Contaminants in the Food Chain
(CONTAM). The EFSA Journal 9(5), 2156-2430.
• European Food Safety Authority (EFSA), 2012. Scientific Opinion on the risk for public
health related to the presence of mercury and methylmercury in food. The EFSA Journal
2012, 1-2985.
• European Food Safety Authority (EFSA), 2013. Scientific Opinion on the hazard
assessment of endocrine disruptors: Scientific criteria for identification of endocrine
disruptors and appropriateness of existing test methods for assessing effects mediated by
these substances on human health and the environment. The EFSA Journal, 11, 1-3132.
• European Food Safety Authority (EFSA), 2014. Scientific Opinion on the risks to public
health related to the presence of chromium in food and drinking water. The EFSA Journal,
12(3), 3845-3870.
• European Food Safety Authority (EFSA), 2015. Scientific Opinion on the risks to public
health related to the presence of nickel in food and drinking water.The EFSA Journal 13 (2),
4002-4204.
• European Food Safety Authority (EFSA), 2017. The European Union summary report on
antimicrobial resistance in zoonotic and indicator bacteria from humans, animals and food in
2017. EFSA Journal 17(2):5598-5876.

41
• European Food Safety Authority (EFSA), 2018. Risk for animal and human health related
to the presence of dioxins and dioxin-like PCBs in feed and food. The EFSA Journal,
16(11), 5333-5664.
• Eskenazi, B., Chevrier, J., Rosas, L.G., Anderson, H.A., Bornman, M.S., Bouwman, H.,
Chen, A., Cohn, B.A., de Jager, C., Henshel, D.S., Leipzig, F., Leipzig, J.S., Lorenz, E.C.,
Snedeker, S.M., Stapleton, D., 2009. The Pine River Statement: Human Health
Consequences of DDT Use. Environmental Health Perspectives 117, 1359–1367.
• Food Agriculture Organisation (FAO), 2003. Trade reforms and food security. Rome, 1-315.
• Food Agriculture Organization (FAO), 2010. Codex Alimentarius Commission, procedural
manual. Joint FAO/WHO, 1-214. http://www.fao.org/3/a-i3243e. (Accessed 19/08/2019).
• Fleming Alexander 1945. The Nobel Prize in Physiology or Medicine 1945. Nobelprize.org.
Available http://www.nobelprize.org/nobel_prizes/medicine/laureates/1945/. (Accessed
19/08/2019)
• Francesconi, K. A. (2010). Arsenic species in seafood: origin and human health
implications. Pure and Applied Chemistry, 82(2), 373-381
• Galiulin, R. V., Bashkin, V. N., Galiulina, R. A. (2002). Behavior of persistent organic
pollutants in the air-plant-soil system. Water, Air, and Soil Pollution, 137(1-4), 179-191.
• Gupta, A.K., Ahmad, M. 2012. Assessment of cytotoxic and genotoxic potential of refinery
waste effluent using plant, animal and bacterial systems. Journal of Hazardous Materials
201, 92–99.
• Hooper, K., McDonald, T.A. 2000. The PBDEs: an emerging environmental challenge and
another reason for breast milk monitoring programs. Environmental health perspectives,
108(5), 387-392;
• Hood, A., Klaassen, C. D. 2000. Differential effects of microsomal enzyme inducers on in
vitro thyroxine (T4) and triiodothyronine (T3) glucuronidation. Toxicological Sciences,
55(1), 78-84.
• International Agency for Research on Cancer (IARC), 1987. Polychlorinated biphenyls
(PCBs). IARC Monogrhaps, 166-183.
• International Agency for Research on Cancer (IARC), 1991. DDT, LINDANE, AND 2,4-
D). IARC Monogrhaps, 1-513.

42
• International Agency for Research on Cancer (IARC), 1993. Beryllium, Cadmium, Mercury
and Exposures in the Glass Manufacturing Industry. IARC Monographs on the Evaluation
Cadmium in food, 58, 1-453.
• International Agency for Research on Cancer (IARC), 2012.Nickel and Nickel compounds.
IARC Monographs 100C-10, 1-50.
• International Agency for Research on Cancer (IARC), 2016. Polychlorinated biphenyls
(PCBs). IARC monographs on the evaluation of carcinogenic risks to humans. IARC
MONOGRAPHS – 107, Lyon, France, 1-510.
• International Agency for Research on Cancer (IARC), 2018a. Polybrominated Biphenyls.
IARC monographs, 107, 1-510.
• International Agency for Research on Cancer (IARC), 2018b.Chromium (VI) compounds.
IARC Monogrhaps-100C, 147-169.
• Koureas, M., Tsakalof, A., Tsatsakis, A., Hadjichristodoulou, C. 2012. Systematic review of
biomonitoring studies to determine the association between exposure to organophosphorus
and pyrethroid insecticides and human health outcomes. Toxicology Letters 210, 155–168.
• Lobanovska, M., Pilla, G. 2017. Penicillin's Discovery and Antibiotic Resistance: Lessons
for the Future?. The Yale journal of biology and medicine, 90(1), 135–145.
• Longenecker, M.P., Rogan, W.J. and Lucier, G. 1997. The human health effects of DDT
(dichlorodiphenyltrichloroethane) and PCBS (polychlorinated biphenyls) and an overview
of organochlorines in public health. Annual review of public health, 18(1), 211-244.
• Manthripragada, A.D., Costello, S., Cockburn, M.G., Bronstein, J.M., Ritz, B. 2010.
Paraoxonase 1, Agricultural Organophosphate Exposure, and Parkinson Disease:
Epidemiology 21, 87–94.
• Mason, Robert P, W.F. Fitzgerald, and François MM Morel. 1994. “The Biogeochemical
Cycling Of Elemental Mercury: Anthropogenic Influences” 58 (15): 3191 - 3198.
doi:10.1016/0016-7037(94)90046-9. http://dx.doi.org/10.1016/0016-7037(94)90046-9.
• Muccio, A. Di., Stefanelli, P., Funari, E., Barbini, D.A., Generali, T., Pelosi, P., Girolimetti,
S., Amendola, G., Vanni, F., Muccio, S. D. 2002. Organochlorine pesticides and
polychlorinated biphenyls in 12 edible marine organisms from the Adriatic Sea, Italy, Spring
1997. Food Additives and Contaminants 19, 1148–1161.
43
• Naso, B., Perrone, D., Ferrante, M.C., Bilancione, M., Lucisano, A. 2005. Persistent
organic pollutants in edible marine species from the Gulf of Naples, Southern Italy. Science
of the Total Environment 343, 83–95.
• Nebbia, 2009. Residui di farmaci e contaminanti nelle produzioni animali. EDISES s.r.l.
Napoli.
• Odeyemi, O.A., Sani, N.A., Obadina, A.O., Saba, C.K.S., Bamidele, F.A., Abughoush, M.,
Asghar, A., Dongmo, F.F.D., Macer, D. and Aberoumand, A. 2019. Food safety knowledge,
attitudes and practices among consumers in developing countries: An international survey.
Food Research International, 116, 1386-1390.
• Osweiler G.D.1996. Toxicology, Chapter 17: Metals and Minerals, Lippincott Williams &
Wilkins, Media PA USA.
• Pi, Y., Li, X., Xia, Q., Wu, J., Li, Y., Xiao, J., Li, Z., 2018. Adsorptive and photocatalytic
removal of Persistent Organic Pollutants (POPs) in water by metal-organic frameworks
(MOFs). Chemical Engineering Journal 337, 351–371.
• Rapport, D., Costanza, R., Epstein, P.R., Gaudet, C., Levins, R. 1998.Ecosystem health:
principles and practice. John Wiley & Sons. Eds.
• Repubblica, 1996.
https://ricerca.repubblica.it/repubblica/archivio/repubblica/1996/06/16/lago-maggiore-
allarme-ddt.html?refresh_ce (Accessed 20/08/2019).
• Robertson, L. W., Gupta, R. C. 2000. Metabolism of polychlorinated biphenyls (PCBs)
generates electrophiles and reactive oxygen species that damage DNA. Molecular Drug
Metabolism and Toxicology. Williams GM, Aruoma OI, eds. OICA International, 1-19.
• Rohlman, D.S., Anger, W.K., Lein, P.J., 2011. Correlating neurobehavioral performance
with biomarkers of organophosphorous pesticide exposure. NeuroToxicology 32, 268–276.
• Sharma, P., Dubey, R. S. 2005. Lead toxicity in plants. Brazilian journal of plant
physiology, 17(1), 35-52.
• Schecter, A., Päpke, O., Ball, M., Lis, A., Brandt-Rauf, P. 1995. Dioxin concentrations in
the blood of workers at municipal waste incinerators. Occupational and environmental
medicine, 52(6), 385-387.

44
• Schrader, T. J., Cooke, G. M. 2003. Effects of Aroclors and individual PCB congeners on
activation of the human androgen receptor in vitro. Reproductive Toxicology, 17(1), 15-23.
• Shalat, S. L., True, L. D., Fleming, L. E., Pace, P. E. 1989. Kidney cancer in utility workers
exposed to polychlorinated biphenyls (PCBs). British journal of industrial medicine, 46(11),
823.
• Sougoufara, S., Doucouré, S., Sembéne, P. M. B., Harry, M., Sokhna, C. 2017. Challenges
for malaria vector control in sub-Saharan Africa: resistance and behavioral adaptations in
Anopheles populations. Journal of vector borne diseases, 54(1), 4.
• Kodavanti, P. R., Tilson, H. A. 1997. Structure-activity relationships of potentially
neurotoxic PCB congeners in the rat. Neurotoxicology, 18(2), 425-441.
• Vogt, R., Bennett, D., Cassady, D., Frost, J., Ritz, B., & Hertz-Picciotto, I. (2012). Cancer
and non-cancer health effects from food contaminant exposures for children and adults in
California: a risk assessment. Environmental Health, 11(1), 1-83.
• Wang, G., Fowler, B.A. 2008. Roles of biomarkers in evaluating interactions among
mixtures of lead, cadmium and arsenic. Toxicology and Applied Pharmacology 233, 92–99.
• Wasi, S., Tabrez, S., Ahmad, M. 2013. Toxicological effects of major environmental
pollutants: an overview. Environmental Monitoring and Assessment 185, 2585–2593.
• Wu, X., Cobbina, S.J., Mao, G., Xu, H., Zhang, Z., Yang, L. 2016. A review of toxicity and
mechanisms of individual and mixtures of heavy metals in the environment. Environmental
Science and Pollution Research 23, 8244–8259.
• Wasi S., Tabrez S., Wasi M.A. 2013. Toxicological effects of major environmental
pollutants: an overview. Environ Monit Assess 185: 2585–2593.
• World Health Organization (WHO), 2002. International Programme on Chemical Safety
(ICPS). https://www.who.int/ipcs/en/. (Accessed 19/08/2019)
• World Health Organization (WHO), 2010. About Risk Analysis in Food. Food Safety and
Zoonoses. https://www.who.int/foodsafety/risk-analysis/en/(Accessed 19/08/2019)
• Wörner, W., Schrenk, D. 1996. Influence of liver tumor promoters on apoptosis in rat
hepatocytes induced by 2-acetylaminofluorene, ultraviolet light, or transforming growth
factor β1. Cancer research, 56, 1272-1278.

45
• Zinsstag, J., Schelling, E., Waltner-Toews, D. and Tanner, M. 2011. From “one medicine”
to “one health” and systemic approaches to health and well-being. Preventive veterinary
medicine, 101,148-156.

46
CHAPTER 2
Aims

47
The increasing globalization, begun in the last century, has been associated with a growing release
of chemical pollutants, as widley described above, whose toxicological effects are often not fully
defined. The European Union and European Safe Authority defined safe levels and recommended to
monitor their occurrence in food asking to collect more information in order to safeguard human
health against their toxicological effects. On the light of the different topics discuss in the
introduction, the specific aim of this research study was to focus the attention on the presence of
categories of chemical compounds considered of emerging interest for public health (e.g.
environmental pollutants like, PBDEs, PAHs, perfluoroalkyl substances (PFASs) and categories
with better-known toxicity (e.g. metals, PCBs, dioxins) in most consumed foods (fish and meat) or
in niche foods (meat from game animals) in order to improve information in literature and
characterize the risk.
In this view the estimate of human exposure and the improvement of information regarding the
occurrence of chemical compounds in environment and consequently in food were done.

48
CHAPTER 3
Research papers
All papers were reported keeping the reference style indicated by the guidelines of each Journal.

49
3.1. Mussels and clams from the italian fish market is there a human
Exposition risk to metals and arsenic?
Published in: Chemosphere. Volume 194, 2018, Pages 644-649
L.M. Chiesa a, F. Ceriani a, M. Caligara b, D. Di Candia c, R. Malandra d, S. Panseri a, *, F. Arioli a
a Department of Health, Animal Science and Food Safety, University of Milan, Via Celoria, 10,
20133 Milan, Italy
b Department of Biomedical Sciences for Health, University of Milan, Via L. Mangiagalli, 37, 20133
Milan, Italy
c Department of Biomedical, Surgical and Dental Sciences, University of Milan, Via L.
Mangiagalli, 37, 20133, Milan, Italy.
Keywords: Arsenic, ICP-MS, Mussels, Clams, Health risk.
ABSTRACT:
Seafood is associated with many beneficial effects on human health. However, the overall level of
con- taminants in biota has increased over the last two centuries and seafood is one of the sources of
oral exposition to contaminants. Therefore, this work aimed to evaluate cadmium, lead, mercury,
arsenic, chromium and nickel presence in mussels and clams, from the Italian market, and the
associated risk. The samples were from five different FAO areas. Analyses were carried out using
inductively-coupled plasms-mass spectrometry. The sample concentrations were below the
maximum levels stated by Commission Regulation (EC) 1881/2006, except one mussel sample,
which was non-compliant for cad- mium (2.13 ± 0.20 mg kg-1). For arsenic, nickel and chromium,
maximum levels are not stated by the European Union. In this study, arsenic ranged from 1.29 to
13.35 mg kg-1 and nickel ranged from <LOQ 3.98 mg kg-1, except one sample, whose nickel
concentration was 21.70 mg kg-1. Chromium was found only in 15 samples, with a maximum
concentration of 2.81 ± 0.27 mg kg-1, in one clam sample. Our results indicate that the average
Italian consumption of molluscs, does not pose a risk for consumers, except nickel, which can cause
allergic dermatitis in nickel-sensitive individuals. However a particular concern is caused by the
exposition to As of the 95th percentile consumers: the Hazard Index for skin lesions, was >1, and

50
BMDL10 for lung bladder and skin cancer in all mussel samples was overcome, in the 100% and
25% of mussel and clam samples, respectively.
1. Introduction
Seafood is an excellent source of nutrients including proteins, vitamins (A, D and B12), minerals
and fatty acids, with important human health benefits. Epidemiological and clinical evidence
suggests that consumption of high levels of n-3 fatty acids eicosa- pentaenoic acid and
docosahexaenoic acid, from one or two fish- based meals per week, induces protective effects
against coronary heart disease, with a 36% decrease in the risk of coronary death and 17% decrease
in total mortality. Seafood is also associated with beneficial effects on neurologic development in
toddlers and chil- dren, such as improved visual acuity, raised mental processing scores and
language comprehension (Mozaffarian and Rimm, 2006; EFSA, 2014a). However, over the last two
centuries, the level of contaminants, heavy metals and chemical compounds, has increased in the
environment and, subsequently, in biota, due to anthropogenic activity, such as industrial activities,
mining and agriculture. Some metals, such as lead (Pb) and mercury (Hg) have no biological roles
(Sarmiento et al., 2011) and their presence needs to be monitored to prevent and minimise the
potential health risks associated with seafood consumption. In many instances, animals near the top
of the food chain, such as carnivorous fish species, are most affected by biomagnification of
xenobiotics, building up greater and or more dangerous amounts of toxic materials than animals
lower down the food chain. Herbivorous species, like mussels and clams, are filter-feeders,
bioaccumulating a wide range of environmental pollutants in their tissues and, thus, can be used as
suitable bioindicator organisms to monitor trace metal pollution in marine environments (Langston
and Spence, 1995). In the Eu- ropean Union (EU), the breeding of bivalves provides the laying of
juvenile bivalves in the open sea and their permanence for about 2 years until adult stage (Baylon,
1990). After collection, the animals are microbiologically controlled, before their marketing. If they
do not meet the microbiological criteria after collecting, they must stay in a depuration place,
provided with periodically replaced clean water, in order to reduce the microbial load (EU, 2004).
In this context, it could be supposed that they can release several chem- icals, comprising metals.
One fundamental feature of metals is their ability to persist in the environment (Scientific
Committee of Problems of the Environment (SCOPE, 1987). Consequently, they can be taken up by

51
marine organisms due to their presence in water and sediments and they can be biomagnified in
superior trophic animals including humans (Kim and Lee, 2010). The metal contamination of
seafood is a globally recognised public health risk (Lozano et al., 2010; Squadrone et al., 2016).
Long-term exposure and/or high concen- trations of metals, can cause adverse effects on human
health, such as skin diseases, acute and chronic intoxication, nervous system, blood and
gastrointestinal dysfunctions, respiratory problems, as well as mutagenic and cancerogenic effects
(Martin and Griswold, 2009).
In particular, Pb can cause severe brain and kidney damage, and in pregnant women, may cause
miscarriage. Hg can cause nervous system dysfunctions like tremors, irritability, memory problems,
changes in vision and hearing. Cadmium (Cd) can cause kidney diseases and respiratory problems.
Inorganic arsenic (As) has been linked to cancer of the skin, lungs and bladder. Chromium (Cr) can
cause breathing problems, cough, asthma, allergic reactions and chronic exposure could cause liver
and kidney cancer, particularly linked to Cr (VI) (Martin and Griswold, 2009). Nickel (Ni) could
cause allergic reactions and long-term exposure could result in reproductive diseases. Moreover, it
is genotoxic, with cancerogenic, immunotoxic, hepatotoxic, neurotoxic, and nephrotoxic effects
only after inhalation (EFSA, 2015; Das et al., 2008). The EC has set maximum levels (MLs) for Cd
(1 mg kg-1) and Pb (1.5 mg kg-1) in bivalve molluscs, and for Hg (0.5 mg kg-1) in seafood (EU,
2006). No MLs have yet been established for As, Ni, and Cr by the EU. In 2009, however, the
European Food Safety Agency (EFSA, 2009a) concluded that the provisional tolerable weekly
intake (PTWI) of As at 15 mg kg-1 body weight, recommended by the Joint Food and Agricultural
Organisation/World Health Orga- nisation (FAO/WHO) Expert Committee on Food Additives
(JECFA) was no more applicable. Instead, based on epidemiological studies on exposure to As
through water and food, the EFSA suggested a range, rather than a single reference point that
included the benchmark dose lower confidence limit for a 0.1% increased inci- dence (BMDL01) of
skin lesions and cancer of the lung, skin and bladder, between 0.3 and 8 mg kg-1body weight day-1
(EFSA, 2009a,b).
Although Cr has no defined MRLs, in 2014, the EFSA suggested a tolerable daily intake (TDI) for
Cr(III) of 300 mg kg-1body weight, which was based on the lack of adverse effects and
carcinogenicity in mice and rats, and for the inadequate information about repro- ductive and
developmental toxicity. Cr(VI) is classified by the In- ternational Agency for Research on Cancer

52
(IARC) as carcinogenic to humans (Group 1). However, it is scarcely present in food, which is
mostly a reductive medium and is largely reduced in the gastro-
intestinal tract. Therefore, the EFSA concluded that the oral expo- sure to Cr(VI), for the European
population is of low concern for health of all age groups but of potential concern only for high
consumers of drinking or bottled water, for the oxidising agents present, in the groups “Infants”,
“Toddlers” and “Other children” (EFSA , 2014b). In 2015, the EFSA set a TDI for Ni at 2.8 mg kg-
1 body weight, obtained from studies on the dose response curve of the incidence of litters with a
post-implantation loss in rats. EFSA, also, consid- ered, the possibility of eczematous and allergic
reactions elicited by acute oral exposure and reported a BMDL10 of 1.1 mg Ni kg-1 body weight,
with a margin of exposure (MOE) of 10 or higher, ac- counting for the variability of immune
response in nickel-sensitised individuals (EFSA, 2015).
According to the 2016 European Market Observatory for Fish- eries and Aquaculture Products
(EUMOFA) report, the consumption of seafood products has been constantly increasing in the last
few years, with mussels among the major species. In 2014, 1.27 kg mussels per person per year and
0.33 kg clams per person per year, was recorded. In the same year, the EU production of bivalves
increased 14%, reaching 609,600 tons, mainly due to an increase in mussels farmed in Spain, the
major producer, followed by France and Italy, where bivalve production represents 70% of all
fishery national production (EUMOFA, 2016).
In the current study, inductively coupled plasma-mass spec- trometry (ICP-MS) was used to
quantitate the six mentioned metal contaminants (As, Cd, Cr, Hg, Pb and Ni), in mussels and clams
obtained from the Italian fish market, and evaluate the Italian consumer's risk, on the basis on the
MRLs stated by the EC, where available, or, otherwise, based on the tolerable intakes recom-
mended by the EFSA.
2. Materials and methods
2.1. Chemicals and reagents
Nitric acid (HNO3, 69% Hiperpur Solution) and hydrogen peroxide (H2O2, 30% Hiperpur
Solution) were from Panreac Qui- mica SLU (Castellar del Valle´s, Barcelona, Spain). Purified
water was obtained through a Milli-Q system (Millipore, Merck KGaA, Darm- stadt, Germany).

53
2.2. Standards
Pb, 1000 mg mL-1 (0.10% w/v), (Pb metal in 2% HNO3); Hg, 1000 mg mL-1 (0.10% w/v), (Hg
metal in 2% HNO3); Cd, 1000 mg mL-1 (0.10% w/v), (Cd metal in 2% HNO3); As, 1000 mg
mL-1 (As metal in 2% HNO3); Ni, 1000 mg mL-1 (0.10% w/v), (Ni metal in 2% HNO3); Cr, 1000
mg mL-1 (0.10% w/v), (Cr metal in 2% HNO3), and the internal standard Yttrium (Y), at 1000 mg
mL-1 (0.10% w/v), (Y metal in 2% HNO3), were all Baker Instra-Analysed® Reagents (JT Baker,
Deventer, Holland).
2.3. Sample collection
A total of 50 mussel (Mytilus galloprovincialis, Mytilus edulis, Mytilus chilensis) and 40 clam
(Venerupis philippinarum, Perna canaliculus, Tapes decussatus, Tapes semidecussatus, Meretrix
mere- trix, Meretrix lyrata) samples were collected from June 2016 until February 2017, at the
wholesale Milan fish market, which supplies the whole country. Their origin was randomly chosen,
in order to simulate the mollusc meal consumption of an Italian consumer. The samples were from
five different FAO areas (Chile; Thailand and Vietnam; New Zealand; North Spain, North France
and Portugal; and the Mediterranean Sea). Each sample was prepared from 50 or more molluscs,
aged approximately 2 years and with sizes ranging from 35 to 60 mm for mussels and 22e25 mm
for clams. The edible part was finely dispersed with an Ultraturrax (IKA®-Werke GmbH and Co.
KG, Staufen, Germany) at 13500 rpm for 2 min. All samples were stored at —20 ○C, until analysis.
2.4. Sample preparation
A 0.5 ± 0.05 g part of each pooled sample was digested with 5 mL HNO3 (65% aqueous solution)
and 0.5 mL H2O2 (30% aqueous solution), in closed Teflon vessels. For the mineralisation, the
samples were placed in 3M-TFM® vessels and microwave-digested (Milestone Inc., Shelton, CT,
USA), at high temperature (200 ○C) for
30 min. A blank solution was prepared, adding only the HNO3/H2O2 (5 mL/0.5 mL) mixture, in
one vessel. After mineralisation, the samples and the blank solution, were brought to a volume of 50
mL, with ultrapure water. Then, 1 mL of each solution was placed in a 15-mL vial and brought to
10 mL with ultrapure water

54
2.5. ICP-MS analyses
The inductively coupled plasma mass spectrometer (Agilent 7500ce, Agilent Technologies, Santa
Clara, CA, USA) used, was equipped with a Cetac ASX-510 auto-sampler (Thermo Fisher Sci-
entific, San Jose, CA, USA). Argon and helium were used pure, at 99.999%.
2.6. Quality control
Quality control, expressed as trueness, was performed by ana- lysing the Certificated Reference
Material ERM-CE278k mussel tissue (European Commission's Joint Research Centre, Institute for
Reference Materials and Measurements, Geel, Belgium) digested with the same protocol of the
samples. The following parameters were also considered, based on Commission Regulation (EC)
No 333/2007 (EU, 2007): limit of detection (LOD), defined as three times the standard deviation
(SD) of the noise from six different sample blanks; limit of quantification (LOQ), defined as ten
times the SD of the noise from six different sample blanks; repeatability, in terms of relative
standard deviation (RSD) of measurements made on twelve blank samples spiked with 1 mg kg-1 of
each metal, respectively. Uncertainty, expressed as expanded measurement uncertainty (U) was
evaluated on repeatability data: unless other- wise stated, results are reported as concentration ± U.
Recovery was not calculated, due to the lack of extraction procedures, as stated by the above-
mentioned Regulation (EU, 2007).
2.7. Statistical analysis
The descriptive statistics was performed using Microsoft Excel® 2013.
Results and discussion
Mussel and clam samples were analysed for the presence of Cd, Pb and Hg, for which the EU set
MLs (EU, 2006), and As, Cr and Ni, for which only the EFSA tolerable intakes or threshold doses
are reported (EFSA, 2009a, 2014a, 2015). Tables 1 and 2 summarise the data (mg kg-1 wet weight)
as the mean ± SD, as well as the 25th, 50th (median), 75th and 100th (maximum concentration) per-

55
centiles in mussels and clams, respectively. Trueness ranged from 102.3 to 105.3%. The LODs
were 0.001 mg kg-1, for Cd and Hg, and 0.005 mg kg-1 for the remaining metals. The LOQ was 0.01
mg kg-1, for all metals. These analytical limits allowed us to assess the risk based on the MLs and
threshold doses. Repeatability, expressed as RSDs, ranged from 2.5 to 6.2%. Uncertainty, related to
a 1.0 mg kg-1 spike of each metal in 12 blank samples, was between 0.05 and 0.12 mg kg-1.
3.1. Metals with MLs: Cd, Hg and Pb
Cd was detected in all samples analysed, except one. The Cd concentration ranged between 0.08
and 2.13 mg kg-1in mussels and < LOQ-0.90 mg kg-1in clams. All concentrations were lower than
the ML set by EC 1881/2006, of 1 mg kg-11, except one mussel sample from North Spain (2.13 ±
0.10 mg kg-1).
Hg was detected in all samples analysed but was always detected below the ML (0.5 mg kg-1). An
overview of mercury studies performed in the Mediterranean Sea region, found that although
atmospheric concentrations of Hg species at several coastal sites in the Mediterranean Sea Basin
were significantly higher than those recorded at several other coastal sites distributed across North
Europe, Hg water levels were comparable to other oceans, reported to represent a geological source
for Hg (Kotnik et al., 2014).
Due to its unique chemical-physical properties, Pb persists in the environment for a long time
(Orescanin et al., 2006). The con- centrations of this metal were, however, lower than the ML
statedby the EU (1.5 mg kg-1), both in mussels (<LOQ-0.79 mg kg-1) and in clams (<LOQ- 0.93 mg
kg-1).

56
Table 1: Concentrations (mg kg-1), expressed as means±SDs and percentiles of the six analysed
metals in mussel samples; n ¼ number of positive samples. Means and SDs are calculated only
on positive samples.
Pb Hg Cd As Ni Cr
n
48
50
50
50
50
6
Mean±SD 0.23±21 0.05±0.07 0.29±0.27 5.04±2.34 0.96±0.88 0.051±0.14
25th percentile
0.09
0.02
0.14
3.45
0.32
0.00
Median
0.17
0.04
0.23
4.76
0.57
0.00
75th percentile 0.31 0.06 0.38 5.94 1.54 0.00
Maximum
concentration 0.79 0.16 2.13 13.36 3.98 0.64
Table 2: Concentrations (mg kg-1), expressed as means±SDs and percentiles of the six analysed
metals in clam samples; n ¼ number of positive samples. Means and SDs are calculated only on
positive samples.
Pb Hg Cd As Ni Cr
n 40
39
36
39
39
9
Mean ±SD 1.23±2.35 0.05±0.07 0.31±0.27 4.86±2.33 1.23±2.35 0.16±0.48
25th percentile
0.09
0.019
0.14
3.278
0.33
0.000
Median
0.17
0.03
0.24
4.68
0.62
0.000
75th percentile
0.31
0.04
0.41
5.81
1.64
0.000
Maximum
Concentration
0.93 0.53 0.90 12.65 21.70 2.82

57
3.2. Metals without MLs: As, Cr and Ni
The toxic effects of As, are produced mostly by its inorganic forms. This study analysed the total
As i.e. the sum of organic and inorganic As. The concentration ranged from <LOQ 13.36 mg kg-1 in
mussels and from <LOQ 12.65 mg kg-1 in clams. The highest concentrations were found in one
mussel sample from the Italian coast of the South Adriatic Sea and in one clam sample from
Portugal. Even if the EU has not stated MRLs for As, the report titled “Dietary exposure to
inorganic As in the European population” (EFSA, 2014a), provides some interesting observations.
After withdrawing the PTWI of 15 mg kg-1 body weight, in 2011, the JECFA indicated “a BMDL
for a 0.5% increased incidence of lung cancer, of 3.0 mg kg-1 body weight per day” (JECFA, 2011).
Previ- ously, the EFSA (2009a) had indicated “a BMDL01 between 0.3 and 8 mg kg-1 body weight
per day for an increased risk of 1% of cancer of the lung, skin and bladder, as well as skin lesions”.
In the report, the EFSA cared to recommend the speciation of As present in food samples. Yet,
although As was detected in 97.4% of almost 104,000 food samples, the data collected to calculate
human exposition, only reported the total As concentration (EFSA, 2009a). Moreover, the data from
the scientific literature do not allow to accurately calculate the amount of inorganic As from total As
in seafood (Francesconi, 2010). This is because the relationship is variable between species and the
content of inorganic As is inversely pro- portional to the total As content. For instance, in 175
Norwegian blue mussel samples, Sloth and Julshamn (2008), found that the inorganic/organic As
ratio was usually less than 10%, except in a few mussels, in which inorganic As represented up to
42% of the total. Thus, to assess the risk associated with As present in the analysed molluscs, the
current study applied a very conservative approach, by supposing that the normal amount of
inorganic As in mussels and clams is the 42% of the total and considering the maximum
concentrations detected in mussels and clams, as if they were usual concentrations. The inorganic
As concentration should, therefore, be 5.61 mg kg-1 in mussels and 5.31 mg kg-1 in clams.
Accounting for the abovementioned annual consumption of molluscs, an adult consumer, with a
body weight of 70 kg, should, therefore, consume (5.61 X 1.27) (365 X 70) -1= 0.28 µg (kg body
weight day) -1 of As from mussels and (5.31 X 0.33) X (365 X 70) -1 = 0.07 µg (kg body weight day-
1 As from clams, which are below the BMDL10 value of 0.3 mg kg body weight-1. Cr was found in
12% of the mussel samples and 22% of the clam samples, with maximum concentrations of
0.64 ± 0.03 and 2.82 ± 0.13 mg kg-1, respectively. When based on a 300-g fish meal day-1,

58
which, according to the European Agency for the Evaluation of Medicinal Products (EMEA), is an
“arbitrarily high consumption value to ensure the protection of the majority of the consumers”
(EMEA, 2001), these concentrations of edible tissue of mussels or clams, would provide a Cr intake
of 0.19 and 0.85 mg day-1, respectively. These values are significantly lower (110 and 25 times,
respectively) than 21 mg day-1. Cr intake for an adult person of 70 kg, calculated from the TDI
value of 300 mg Cr (III) kg-1 body weight per day. As stated by EFSA the toxic relevance of
CR(VI) is negligible in food, therefore was not considered (EFSA, 2014b).
Ni was detected in all samples analysed. The concentration range was 0.12- 3.98 and 0.097 - 21.70
mg kg-1 in mussels and clams, respectively. Thus, a consumer, eating the more contaminated
mussels or clams, would potentially be exposed to (3.98X 1.27) (70X 365)-1= 0.2 µg (kg body
weight day)-1 or (21.70 X0.33)X(70 365)-1 = 0.27 µg (kg body weight day)-1, respectively,
amounts of Ni, which are lower than the TDI of 2.8 µg kg-1 body weight. The acute toxicity of Ni
is, however, important, as the most frequent adverse effect in the population is allergic
dermatitis. Systemic contact dermatitis, elicited by Ni oral ingestion via food and drugs in nickel-
sensitive individuals, consists of generalised eczematous flare-up reactions. A single meal (0.3 kg)
of the most contaminated mussels and clams, should provide to a consumer weighing 70 kg, (3.98
× 0.3/ 70) ¼ = 17 and (21.70 × 0.3/70) ¼ = 93 µg kg-1 body weight, respectively, an amount
much higher than the BMDL10 of 1.1 mg kg-1 body weight. It is of concern, however, that
the MOE, when the less contaminated mussels and clams are considered, is lower than the
minimum recommended value of 10: a meal should supply 0.51 and 0.42 mg Ni kg-1 body
weight, providing MOE values of 2.2 and 2.6 (Yoshihisa and Shimizu, 2012; EFSA, 2015).
3.3. Evaluation of the Hazard Index
The studied elements in mussels and clams are actually a mixture of chemicals that can share some
common toxicological effects, so evoking a dose addition: the Total Dose, i.e. the dose of each toxic
agent with similar effects. As far as the cancer risk, oral intake with food has a major role only for
arsenic on lung, skin and bladder. Lung cancer is a toxicological effect of exposition only through
inhalation of Cd and Ni, similarly to bladder cancer for Cd (EFSA, 2009a, b, 2015). As the cancer
risk by mollusc intake is induced only by As, just the non-carcinogenic effects where considered.
The Hazard Index (HI) was therefore calculated as

59
HI=Σn1=6 Estimated Intakei/ RfVi, where, RfVi is the Reference Value, representing the human
daily intake of the chemical i [e.g., TDI or BMDL] and the Estimated Intake, evaluated from the
above mentioned annual consumptions, is in same units as the RfVi (Teuschler, 2013) The
considered RfVi where the reference doses indicated by EFSA (2009a,b, 2010a,b, 2014b, 2015),
eventually recalculated on a daily basis. To maintain a very conservative approach, only the highest
concentrations of each element in mussels and clams were accounted for. The Target Hazard Quo-
tients (THQ), i.e. the ratio of the potential exposure to the sub- stance and the level at which no
adverse effects are expected were then evaluated as THQ daily intake/RfV for each com- pound,
for the different end points indicated by EFSA. The results are shown in Table 3.
Table 3: Hypothetic target hazard quotients and hazard indexes for the estimated daily exposure to
the studied elements via mussels and clams at the highest concentrations detected. All the
reference values are by EFSA. TWIs are recalculated and expressed on a daily basis. As is
reported as inorganic Arsenic and only Cr(III) is considered
RfV Element Mussels
Clams
Target hazard quotients: MUSSELS-CLAMS (reference values - mg kg—1
day—1)
Daily
exposure
(mg kg—1)
Skin Reproduction/Development Developmental
neurotoxicity Blood pressure
Kidney
BMDL10 Pb 0.04 0.01 0.08-0.02 (0.5) 0.03-0.007 (1.5)
0.06-0.016
(0.63)
TWI Hg 0.01 0.01 0.06-0.06 (0.18)
TWI Cd 0.11 0.01 0.29-0.03
(0.38)
BMDL10 As 0.28 0.07 0.93-0.23
TDI Ni 0.20 0.28 0.07-0.10 (2.8)
TDI Cr 0.03 0.04 0.0001-0.0001 (300)
HAZARD
INDEX
0.93-0.23 0.0701-0.1001 0.14-0.08 0.35-0.046

60
All the HIs were lower than one, indicating that a negligible health hazard could derive from the
ingestion of mussels. A study conducted by Leclercq et al. (2009), shows that in 2005e2006 the
mean individual daily consumption for Italian adult population was about 40 g day-1 of fish and, for
the group belonging to the 95th percentile about 145 g day-1.. Assuming that the variation
between groups in mollusc consumption is similar, the THQ values should be multiplied by
(145/40) 3.65. Accounting for this consumption, all mussel samples and the 25% of clam samples
showed a HI > 1 for skin lesions in high per- centiles consumers while all samples (except one)
showed a HI value < 0.1 for Cd and Pb merged dose (Table 4).
Table 4: Hazard indexes for the estimated daily exposure to the studied elements via mussels and
clams of the 95 percentile fish consumers
Hazard index for 95○
percentile consumers
SKIN Reproduction/development Developmental
neurotoxicity
Blood
pressure
Kidney
As Ni+ Cr Pb + Hg Pb Pb + Cd
MUSSELS Minimum 1.24 0 0.01 0.00 0.06
Median 2.86 0.03 0.05 0.03 0.02
Maximum 8.08 0.26 0.34 0.10 1.14
Percent of values> 100% - - - 2%
CLAMS Minimum 0.00 0.00 0.00 0.00 0.00
Median 0.07 0.03 0.02 0.004 0.05
Maximum 1.98 0.36 0.17 0.29 0.13
Percent of values > 1 25% - - - -

61
Discussion
Metal contamination in mussels and clams that are currently present in the Italian market, provide
reasons for low concern for average consumers. According to the EU MLs or the EFSA threshold
doses, Pb and As do not pose a risk to public health (EU, 2006; EFSA, 2014a). Cr showed
concentrations that elicit oral exposure sub- stantially lower than the TDI. (EFSA, 2014b). Hg was
present in only one clam sample, at a concentration higher than the maximum level, but compliant
accounting for the uncertainty (0.53 ± 0.04 mg kg-1). Considering that the chronic toxicity was
evaluated in establishing the MRL, this concentration could not be considered a risk for the consumer.
A similar consid- eration could be made for Cd, detected in one mussel sample, at a concentration of
about twice the MRL. In this case, too, because the chronic toxicity studies were accounted for in
establishing an MRL, the risk can be considered very low (EU, 2006). High percentiles consumers are
a cause of concern due to chronic oral exposition to As: in fact all mussel samples and 10 clam sam-
ples showed a HI > 1 for skin lesions. It must be highlighted that this consumer group is furthermore
subject to lung, skin and bladder cancer risk, as the BMDL10 value of 0.3 mg kg-1 is overcame in all
the samples (EFSA, 2009a). Ni demands particular consideration, too. No chronic toxicity risk was
indicated by our study. Systemic contact dermatitis, a manifestation of acute Ni toxicity, is the most
prevalent effect in the population. Based on our results, the Ni content of all the mollusc samples
analysed, could cause the allergic reaction in Ni-sensitive individuals, thus, representing a concern.
5. Conclusion
Finally, this survey on the metal contents in mussels and clams from the Italian market, shows a very
low risk for the average consumer health, when the chronic toxicity is considered. High percentile
consumers, however, are subject to risk skin lesions, and lung, skin and bladder cancer due to high
intake of As. The occur- rence of acute toxicity, in the form of allergic dermatitis in sensitive subjects,
due to constant Ni presence in the studied molluscs, must, however, be highlighted. Further studies are
ongoing to widen the sample number, in order to compare adequate numbers of samples from the
different FAO areas.

62
Funding
This research did not receive any specific grant from funding agencies in the public, commercial, or
not-for-profit sectors.
Acknowledgement
This work is dedicated to our good friend and colleague Marina Caligara, who passed away before its
publication. Federica Ceriani is the recipient of a Ph.D. fellowship in Veterinary and Animal Science in
the Laboratory of Veterinary Toxicology at the University of Milan.
References
Baylon, C.B., 1990. Selected Papers on Mollusc Culture. Culture of Bivalve Molluscs. UNDP/FAO
Regional Seafarming Development and Demonstration Project (RAS/ 90/002). National Inland
Fisheries Institute, Kasetsart University Campus Bangkhen, Bangkok.
http://www.fao.org/docrep/field/003/AB737E/AB737E02. htm#ch2.
Commission Regulation (EC), 2004. pp No 853/2004 of the European Parliament and of the
council of 29 April 2004 laying down specific hygiene rules for food of animal origin. Annex
III. Section VII. Off. J. Eur. Union L 226, 22e82.
Commission Regulation (EC), 2007. pp No 333/2007 laying down the methods of sampling and
analysis for the official control of the levels of lead, cadmium, mercury, inorganic tin, 3-MCPD and
benzo(a)pyrene in foodstuffs. Off. J. Eur. Union L 88, 29e38.
Commission Regulation (EC), 2006. pp No 1881/2006 Setting maximum levels for certain
contaminants in foodstuffs. Off. J. Eur. Union L 364, 5e24.
Das, K.K., Das, N.N., Dhundasi, S.A., 2008. Nickel, its adverse health effects & oxidative stress.
Indian J. Med. Res. 128, 412e425.
EFSA (European Food Safety Authority), 2009a. Scientific opinion on arsenic in food. EFSA J. 7,
199e1351.
EFSA (European Food Safety Authority), 2009b. Cadmium in food. EFSA J. 980, 1-139.

63
EFSA (European Food Safety Authority), 2010a. Scientific opinion on lead in food. EFSA J. 8,
1570e1720.
EFSA (European Food Safety Authority), 2010b. Scientific opinion on the risk for public health related
to the presence of mercury and methylmercury in food. EFSA J. 10, 2985-3225.
EFSA (European Food Safety Authority), 2014a. Dietary exposure to inorganic arsenic in the European
population. EFSA J. 12, 3597-3658.
EFSA (European Food Safety Authority), 2014b. Scientific opinion on the risks to public health related
to the presence of chromium in food and drinking water. EFSA J. 9, 11-25.
EFSA (European Food Safety Authority), 2015. Scientific opinion on the risks to public health related
to the presence of nickel in food and drinking water. EFSA J. 13, 4002-4203.
EMEA (The European Agency for the Evaluation of Medicinal Products), 2001. Note for Guidance on
the Risk Analysis Approach for Residues of Veterinary Me- dicinal Products in Food of Animal Origin.
EMEA/CVMP/187/00-FINAL, pp. 1e11. EUMOFA (European Market Observatory for fisheries and
Aquaculture products), 2016. The EU Fish Market. https://www.eumofa.eu/documents/20178/77960/.
The EU fish market - 2016 Edition.pdf/ca1e7801-c4da-4799-aa00- f3d1784a3021.
Francesconi, K.A., 2010. Arsenic species in seafood: origin and human health im- plications. Pure
Appl. Chem. 82, 373e381.
JECFA (The Joint FAO/WHO Expert Committee on Food Additives), 2011. Evaluation of Certain
Contaminants in Food: seventy-Second Report of the Joint FAO/WHO Expert Committee on Food
Additives. World Health Organization, Geneva, Switzerland. WHO Technical Report Series 959.
http://whqlibdoc.who.int/trs/ WHO_TRS_959_eng.pdf.
Kim, N.S., Lee, B.K., 2010. Blood total mercury and fish consumption in the Korean general
population in KNHANES III, 2005. Sci. Total. Environ. 408, 4841e4847.
Kotnik, J.1, Sprovieri, F., Ogrinc, N., Horvat, M., Pirrone, N., 2014. Mercury in the Mediterranean,
part I: spatial and temporal trends. Environ. Sci. Pollut. Res. Int. 21, 4063e4080.

64
Langston, W.J., Spence, S.K., 1995. Metal speciation and bioavailability in aquatic systems. In:
Tessier, A., Turner, D.R. (Eds.), Biological Factors Involved in Metal Concentrations Observed. John
Wiley & Sons, New York, pp. 407e478.
Leclercq, C., Arcella, D., Piccinelli, R., Sette, S., Le Donne, C., Turrini, A., 2009. The Italian National
Food consumption Survey INRAN-SCAI. Public Health Nutr. 12, 2504e2532.
Lozano, G., Herraiz, E., Hardisson, A., Gutie´rrez, A.J., Gonz´alez-Weller, D., Rubio, C.,
2010. Heavy and trace metal concentrations in three rockpool shrimp species (Palaemon elegans,
Palaemon adspersus and Palaemon serratus) from Tenerife (Canary Islands). Environ. Monit. Assess.
168, 451e460.
Martin, S., Griswold, W., 2009. Human health effects of heavy metals. In: Environ. Sci. Technol.
Briefs Citizens, vol. 15. Center for Hazardous Substance Research, Manhattan, Kansas, pp. 1e6.
Mozaffarian, D., Rimm, E.B., 2006. Fish intake, contaminants, and human health: evaluating the risks
and the benefits. JAMA 296, 1885e1899.
Orescanin, V., Lovrencic, I., Mikelic, L., Barisic, D., Matasin, Z., Lulic, S., Pezelj, D., 2006.
Biomonitoring of heavy metals and arsenic on the east coast of the Middle Adriatic Sea using
Mytilus galloprovincialis. Nuc. Instrum. Meth. Phys. Res., Sect. B 245, 495e500.
Sarmiento, A.M., DelValls, A., Nieto, J.M., Salamanca, M.J., Caraballo, M.A., 2011. Toxicity and
potential risk assessment of a river polluted by acid mine drainage in the Iberian Pyrite Belt (SW
Spain). Sci. Total Environ. 409, 4763e4771.
SCOPE, 1987. In: Hutchinson, T.C., Meema, K.M. (Eds.), SCOPE 31. Lead, Mercury, Cadmium and
ARSENIC IN THE Environment. John Wiley & Sons, Chichester, pp. 3e48.
https://dge.carnegiescience.edu/SCOPE/SCOPE_31/SCOPE_31.html.
Sloth, J.J., Julshamn, K., 2008. Survey of total and inorganic arsenic content in blue mussels (Mytilus
edulis L.) from Norwegian fiords: revelation of unusual high levels of inorganic arsenic. J. Agric. Food
Chem. 56, 1269e1273.

65
Squadrone, S., Brizio, P., Stella, C., Prearo, M., Pastorino, P., Serracca, L., Ercolini, C., Abete, M.C.,
2016. Presence of trace metals in aquaculture marine ecosystems of the Northwestern Mediterranean
Sea (Italy). Environ. Pollut. 215, 77e83.
Teuschler, L., 2013. Chemical Mixture Risk Assessment Additivity-based Ap- proaches. Presented at
Current Methods of Assessing Cumulative Risk of Phthalates. Ottawa, Canada, October 01, 2013.
Yoshihisa, Y., Shimizu, T., 2012. Metal allergy and systemic contact dermatitis: an overview.
Dermatol Res Pract. 5. https://doi.org/10.1155/2012/749561.

66
3.2. Exposition to metals and arsenic from yellow and red tuna consumption.
Published in: Food Additives & Contaminants Part A, Volume 36, 2019, Pages 1228-1235.
Luca Maria Chiesa1, Federica Ceriani1, Antonio Procopio2, Sonia Bonacci2, Renato Malandra3, Sara
Panseri1*, Francesco Arioli1.
1 Department of Health, Animal Science and Food Safety, University of Milan, Milan, Italy
2 Dipartimento di Scienze della Salute, Università Magna Græcia, Germaneto, Catanzaro, Italy
2 ATS Milano-Città Metropolitana, Director of Veterinary Unit, Milan, Italy
* Corresponding author: Dr. Sara Panseri, Phone: 0250317931; Fax: 00390250317941. E-mail:
[email protected]. Address: Department of Health, Animal Science and Food Safety, University of
Milan, Via Celoria 10, 20133 Milan, Italy.
KEYWORDS Tuna; arsenic; metals; risk; hazard index.
ABSTRACT
Tuna is one of the most frequently consumed fish and, as a predator, can biomagnify pollutants. Metal
and other elements pollution is an important worldwide concern. Based on these considerations, the
aim of this work was to investigate the occurrence of As, Cd, Cr, Ni, Hg and Pb in tuna coming from
different FAO areas to evaluate human exposure. The analysis was performed on muscle tissues
through a quadrupole inductively coupled mass spectrometry. One hundred thirty-one samples were
analysed. One red tuna from the Adriatic Sea and 11 yellow tunas exceeded Pb maximum levels (MLs)
with a concentration ranging 0.31–0.86 mg kg−1; three red tunas from different Mediterranean sub-
areas exceeded Hg MLs, with a concentration range 1.19 to 1.80 mg kg−1. All the Hazard Indexes (HIs)
were lower than one, indicating that only a negligible health hazard could derive from the ingestion of
tuna, for both average and high consumers. The risk of carcinogenicity from Cr is still under debate at
the concentrations detectable in food.
1. Introduction
Fish is an excellent source of high-value protein rich in essential amino acids and micro and macro
elements, and has an advantageous fatty acid profile, resulting from the content of essential

67
polyunsaturated fatty acids, known to support good health (Usydus et al. 2009). Tuna is one of the most
frequently consumed and commercially attractive fish worldwide (Ikem and Egiebor 2005). Tuna, as a
predator, is a high-performance fish with very high metabolism rates; thus, having high food intake
rates, it increases the accumulation of pollutants (Voegborlo et al. 1999). Pollution by metal and other
elements in fish is an important word wide concern due to the health risk associated with fish
consumption and diet is the main route of exposure. Many metals naturally occurring in the
environment, including copper, iron, manganese, nickel, and zinc have important biological roles.
However, a significant number of metals, like cadmium, lead, and mercury have no biological roles,
but have highly toxic properties when consumed by animals, including humans, and are classified as
toxic metals (Chen et al. 2016). The World Health Organization lists cadmium, lead, and mercury in its
list of top ten chemicals of major public health concern (WHO 2016) and exposure to these metals has
been linked to numerous neurodevelopmental and neurodegenerative disorders in humans (Von
Stackelberg et al. 2015). Inorganic arsenic (As) has been linked to increased risk of cancer of the skin,
lungs and bladder, and skin lesions. Other symptoms associated with chronic arsenic exposure are
peripheral neuropathy, encephalopathy, hepatomegaly, bone marrow depression, diabetes and renal
function impairment (EFSA 2009a). Inorganic arsenic was the first element to be identified as a human
carcinogen and the IARC allocated it to Group 1 (IARC 2012a). Cadmium (Cd) can damage kidneys
and cause poor reproductive capacity, hypertension, and hepatic dysfunction (Abou-Arab et al. 1996).
The kidney is the critical target organ for dietary exposure to cadmium and renal damage is
characterised by cadmium accumulation in convoluted proximal tubules (EFSA 2009b). Data on
exposure to Cd have also been associated with an increased risk of lung cancer through inhalation by
workers or smokers, and bladder, endometrium, testicular, pancreatic and gall bladder cancer (Huff et
al. 2007; EFSA 2009b). No sure causal association between Cd oral exposition and cancer is currently
available (European Commission (EC) 2007) even if some recent data seem to indicate an association
with cancer at low dietary exposures (Åkesson et al. 2014). However, studies on dietary exposure to Cd
did not show an increase of incidence of total or specific cancers in 90,000 Japanese of both sexes
(Sawada et al. 2012), and of breast cancer in 30,000 U.S. postmenopausal women (Adams et al. 2012).
Consequently, even if IARC (IARC 2012b) allocates Cd in Group 1, information regarding the
carcinogenetic effect of Cd is still incomplete for risk assessment by oral intake. Mercury (Hg) has
been associated with neurotoxicity, ototoxicity, tremors, irritability, memory problems, changes in

68
vision and hearing. Moreover, it has been associated with developmental toxicity and cardiovascular
disease (EFSA 2012). The critical target for acute toxicity of mercury is the kidney followed by the
liver, nervous system, immune system, reproductive and developmental systems. Nickel (Ni) is
classified by IARC (IARC 2012a) as a human carcinogen causing cancers of the lung, nasal cavity and
paranasal sinuses only after inhalation and studies on animals did not give any evidence of oral
carcinogenicity. Oral absorption of Ni can elicit eczematous flare-up reactions in the skin in Ni-
sensitised individuals (EFSA 2015). Some other metals (e.g. chromium) cause nephropathy, anuria,
neurotoxicity and embryotoxicity (EFSA 2014b). Lead (Pb) causes nervous dysfunction, kidney
damage and chronic toxicity, poor reproductive capacity, hypertension, tumours, hepatic dysfunction
and may cause miscarriage in pregnant women (EFSA 2010). The risk from exposure to As and metals
requires further comment. The European Commission (European Commission (EC) No 1881/2006
2006) set maximum levels (MLs) for Cd (0.10 mg kg−1), Pb (0.30 mg kg−1) and for Hg (0.1 mg kg−1) in
tuna. No MLs have yet been established by the European Union for As, Cr and Ni (EU). EFSA
established a BMDL01 for As between 0.3 and 8 µg/kg b.w. day−1 for an increased risk of cancer to
lung, skin and bladder, and skin lesions (EFSA 2009a). Cd is a primary toxic on the kidney and may
cause renal dysfunction (EFSA 2009b). The CONTAM panel defined a tolerable weekly intake (TWI)
of 2.5 μg kg−1 b.w. In 2014, EFSA suggested a tolerable daily intake (TDI) for Cr (III) of 300 μg kg−1
body weight, which was based on reproduction and developmental toxicity reported in some studies
and from a long-term study on rats of the US National Toxicology Programme (NTP) (NTP 2010). Cr
(VI), classified by the International Agency for Research on Cancer (IARC) as carcinogenic to humans
(Group 1), is not present in food, considered a strong reducing medium (EFSA 2014b). Hg TWI (1.3
µg g−1) expressed as total Hg is derived from neurodevelopmental toxicity (EFSA 2012). The TDI for
Ni is 2.8 μg kg−1 body weight, a value derived from studies about the incidence of litters with post-
implantation loss in rats. Considered the possibility of eczematous and allergic reactions elicited by
acute oral exposure a BMDL10 of 1.1 μg Ni kg−1 body weight, with a margin of exposure (MOE) of
10 or higher, accounting for the variability of the immune response in nickel-sensitised individuals is
also stated (EFSA 2015). The critical effects of Pb are developmental neurotoxicity in infants and
children (BMDL01 = 0.50 µg kg-1 day-1), cardiovascular effects and prevalence of chronic kidney
disease (CKD) in adults (BMDL01 = 1.50 µg kg-1day-1and BMDL10 = 0.63 µg kg-1 day-1, respectively)
(EFSA 2010). Infants (aged 0–3 years) are more exposed than children (5–10 years) and adults since

69
Pb is better absorbed in growth plates than bone tissues. The International Agency for Research on
Cancer classified inorganic lead as probably carcinogenic to humans (Group 2A) in 2006, for limited
evidence of carcinogenicity in humans and sufficient evidence in animals (NTP 2004; IARC 2006).
However, since the doses used to induce tumours in rats are very high compared to human intake,
EFSA considered human exposure to lead through food unlikely to represent a significant cancer risk
(EFSA 2010). Several studies are present in the literature on the presence of metals in fish (Table 1).
The aim of this work is to investigate the occurrence of As, Cd, Cr, Ni, Hg, Pb in tuna coming from
different Fishing Areas (FAO) to evaluate human intake.
Table 1: Concentration of As and metals in tuna from literature analysed by ICP-MS. (a: average
concentration; b: median concentration)
Reference Element Area Concentration range
(μg g−1w.w.)
Voegborlo et al. 1999
Hg
Cd
Pb
Libya
0.20-0.66
0.09-0.32
0.18-0.40
Storelli and Marcotrigiano, 2001 Hg Mediterranean
Area 0.07-4.26
Storelli et al. 2005
As
Cd
Hg
Pb
Mediterranean
Area
1.62-5.01
0.01-0.04
0.13-0.35
0.07-0.18
Licata et al. 2005
Cd
Hg
Pb
Sicily
n.d.-0.26
2.45-4.21
n.d.-0.24
Storelli et al. 2010
Cd
Hg
Pb
Mediterranean
Area
n.d.-0.03
0.07-1.76
n.d.-0.33
Guérin et al. 2011
Cr
Ni
Pb
France
0.22a
0.34a
0.011a
Mol 2011
Cd
Hg
Pb
Turkey
0.01-0.02
0.06-0.30
0.09-0.45
Olmedo et al., 2013
As
Cd
Hg
Pb
Spain
0.033b
0.008b
0.00b
0.004b

70
2. Materials and methods
2.1. Chemicals and reagents
Nitric acid (HNO3, ≥69.0%, Trace SELECT) and hydrogen peroxide (H2O2 ≥ 30% Trace SELECT
Ultra) were purchased from Fluka analytical (Germany). Hydrochloric acid Superpure was purchased
from Carlo Erba. Purified water was obtained through a Milli-Q Integral 5 system (Millipore, Merck
KGaA, Darmstadt, Germany).
2.2. Standards
Two multielement standards solution: IV-ICPMS -71A containing 10 μg ml−1 of arsenic (As),
aluminium (Al), cadmium (Cd), chromium (Cr), manganese (Mg), nickel (Ni), lead (Pb), zinc (Zn), and
CMS-1 containing 10 μg ml−1 of yttrium (Y), were purchased from Inorganic Ventures (Christiansburg,
Virginia, USA). Mercury standard solution containing 1000 mg L−1 was purchased from Fluka. IV-
ICPMS-71A and mercury standard solutions were used daily to prepare calibration standards in 2%
HNO3/HCl (1:1). Standard 100 μg L−1 yttrium solution was prepared daily and added to all samples as
internal standard, to verify changes in instrumental sensitivity.
2.3. Sample collection
A total of 131 of red tuna (Thunnus thynnus) and yellow tuna (Thunnus albacares) samples were
collected from March 2017 until October 2017, at the wholesale Milan fish market, which supplies the
whole country. Their origin was chosen randomly with the aim of simulating the tuna consumption of
an Italian consumer. The FAO areas are shown in Table 2. The edible part was finely dispersed with an
Ultraturrax (IKA®-Werke GmbH and Co. KG, Staufen, Germany) at 13500 rpm for 2 min. All samples
were stored at −20°C, until analysis.

71
Table 2. Tuna sample details: number of samples, species, FAO area, country of origin
2.4. Sample preparation
The sample preparation was carried out using an Anton Paar Multiwave 3000 digestion system
equipped with a XF100 rotor. To decontaminate PTFE vessels, a cleaning procedure was carried out by
adding 4 ml of HNO3 and 4 ml of H2O in each vessel, in the following conditions: 1100 W for 15 min.
After cleaning, vessels were rinsed with ultrapure water and dried. Aliquots of 0.5 g of each
homogenised sample were weighted directly into the PTFE vessel of the microwave system. The
digestion was performed by adding 1 ml of H2O, 4 ml of HNO3, 0.5 ml of HCl and 0.5 ml of H2O2.
The operating conditions used for the microwave digestion were 800 W over 15 min and held at this
power for 30 min. After digestion, samples were quantitatively transferred to a graduated
polypropylene test tube and diluted with ultrapure water to 50 ml. The analytical batch consisted of a
set of calibration standard, samples, and a minimum of three procedural blanks. A midrange calibration
standard was analysed after each batch of 15 samples to verify instrumental drift throughout the run.
Seven-point calibration curves covering the range 0.01–100 μg L−1 were used for quantitative analysis.
Standard solutions were prepared by diluting the multielement solutions.
2.5. ICP-MS analyses
The analysis was performed by a quadrupole inductively coupled mass spectrometry, X Series 2
(Thermo Scientific, Waltham, MA, USA), equipped with a collision cell incorporating kinetic energy
Species FAO Area Country Total
Red Tuna
(Thunnus thynnus) 27
Spain VIIIC- 3
North Spain 2
37 Sicily-
Adriatic Sea
8
4
Yellow Tuna
(Thunnus albacares) 51
Maldive-
Indian Ocean 15
57
Maldive-Sri
Lanka-Indian
Ocean
47
71 Pacific Ocean 52
Total 131

72
discrimination which efficiently eliminates matrix, argon and based spectral interferences using
reaction gases He/H2 (97:3). The sample solutions were pumped by a peristaltic pump from tubes
arranged on CETAC ASX-520 auto-sampler (Thermo Scientific, Omaha, NE, USA). Argon and He/H2
(9:7) mixture were used pure, at 99.999%. Instrument sensitivity, resolution and mass calibration were
optimised daily with the tuning solution (Multielement Tune A, containing 10 μg L-1 of Ba, Be, Bi, Ce,
Co, In, Li, Ni, Pb, U in 2% HNO3, to maximise ion signals and to minimise interferences effects due to
high oxide levels (CeO+ /Ce+ < 2%) and doubly charged ions (Ba2+/Ba+ < 3%). In order to verify the
robustness of the analytical method, Yttrium was added as internal standard and analysed with the run.
Sample data were qualified following the Internal Standard Recovery method, and required to be
within a 80–120% limit.
2.6. Statistical analysis
Statistical analysis was performed using GraphPad InStat version 3.00, GraphPad Software, San Diego
California USA. The comparison between FAO areas was made through the Kruskal–Wallis Test
(Nonparametric ANOVA) for samples with nonGaussian distribution and Dunn’s Multiple
Comparisons Test when a significant difference was found. P was set at 0.05.
3. Results and discussion
Table 3 shows the data relative to metal concentration in tuna tissues and the differences between the
various sampling areas. The Mediterranean Sea samples show the maximum concentrations for As
(5.53 mg kg-1), Cd (0.034 mg kg-1), Cr (0.216 mg kg-1), Hg (1.80 mg kg-1) and Ni (0.319 mg kg-1).
Based on the results reported in Table 3 the estimated daily intakes (EDI) with tuna of an average
European consumer, for any considered element, were calculated as: EDI = [(highest value between
mean and median concentration in tuna) x annual tuna intake]/ (365 days x 60 kg body weight). The
estimated per capita consumption in the EU in 2015 was 2.77 kg tuna (EUMOFA 2017). Arsenic is
present predominantly in the organic forms of arsenobetaine, arsenocholine, monomethylarsonic acid
and dimethylarsinic acid.

73
Table 3: Mean ± SD, Minimum, Median and Maximum concentration of each metal and comparison
from different FAO zones. Concentrations expressed as mg kg-1 muscle
FAO 27 FAO 37 FAO 51 FAO 57 FAO 71 TOTAL
N=5 N=12 N=15 N=47 N=52 N=133
As
Mean±SD 0.93±0.30 2.29±1.63 1.06±0.48 1.28±0.53 1.02±0.39 1.23±0.73
Minimum 0.55 0.34 0.37 0.44 0.56 0.34
Median 0.85 2.41 0.90 1.15 1.00 1.06
Maximum 1.33 5.52 2.01 3.11 1.72 5.52
Cd
Mean±SD 0.017±0.003 0.018±0.007 0.017±0.005 0.013±0.005 0.014±0.004 0.014±0.005
Minimum 0.015 0.008 0.008 0.007 0.006 0.006
Median 0.016 0.017 0.017 0.011 0.014 0.014
Maximum 0.023 0.034 0.026 0.025 0.028 0.034
Cr
Mean±SD 0.039±0.027 0.037±0.024 0.050±0.045 0.042±0.033 (a) 0.053±0.029 0.047±0.03
Minimum 0.010 0.014 0.016 0.012 0.015 0.010
Median 0.038 0.032 0.030 0.031 0.045 0.037
Maximum 0.083 0.101 0.167 0.216 0.150 0.216
Hg
Mean±SD 0.36±0.08 0.72±0.49 0.25±0.09 0.12±0.10 (b) 0.07±0.02 (c) 0.18±0.24
Minimum 0.24 0.091 0.033 0.041 0.053 0.033
Median 0.37 0.55 0.27 0.083 0.065 0.086
Maximum 0.45 1.80 0.43 0.41 0.11 1.80
Ni
Mean±SD 0.014±0.011 0.056±0.092 0.020±0.014 0.030±0.043 0.040±0.043 0.035±0.047
Minimum 0.007 0.004 0.005 0.004 0.006 0.004
Median 0.011 0.015 0.015 0.018 0.024 0.018
Maximum 0.033 0.31 0.049 0.29 0.23 0.31
Pb
Mean±SD 0.048±0.014 0.087±0.099 0.094±0.090 0.089±0.098 (d) 0.18±0.14 0.12±0.12
Minimum 0.034 0.034 0.030 0.008 0.017 0.008
Median 0.044 0.056 0.059 0.059 0.18 0.07
Maximum 0.070 0.39 0.39 0.44 0.86 0.86
The toxicity of As compounds depends on the chemical form: inorganic As is much more toxic than
the organic form (Hindmarsh and McCurdy 1986; Sirot et al. 2009). According to EFSA (2014a), fish
and other seafood represent a problem when trying to derive the amount of inorganic arsenic from total
arsenic because the ratio may depend on the seafood type (Cullen and Reimer 1989; EFSA 2009a), and
the relative proportion of inorganic arsenic tends to decrease as the total arsenic content increases. In
tuna, arsenobetaine is the dominating arsenic compound (Larsen et al. 1993) while toxic inorganic
arsenic is present at lower concentrations. The CONTAM panel considered the average amount of
inorganic arsenic in fish to be 0.1–3.5%. With a conservative approach, we decided to consider
inorganic arsenic as 10% of the total arsenic and the highest of the mean and median values, 1.24 and
1.06 mg kg-1, respectively, of total arsenic in tuna. Applying the above formula, the EDI of As is 0.016
µg kg-1 day-1 which is 19 times lower than EFSA BMDL05 related to cancer of the skin, lungs and
bladder, and skin lesions (0.3 µg kg-1) (EFSA 2014a). Cd was detected in all samples analysed, with a
concentration range 0.006–0.034 mg kg-1, always lower than MLs set by European Commission

74
1881/2006. Median and mean had the same value of 0.014 mg kg-1, and EDI of Cd calculated as above
would be 0.0017 µg kg−1 b.w. This value is 210 times lower than TWI of 2.5 μg kg-1 b.w., considered
on a daily base (i.e. divided by seven). Cr was in almost all samples investigated with a concentration
range 0.01–0.22 mg kg-1. The EDI calculated on the mean (0.047 µg g-1), would provide a Cr intake of
0.0089 µg kg-1 day-1, about 33700 times lower than TDI (300 µg kg-1 day-1). Cr VI has not been
evaluated due to its very low presence in the food (EFSA 2014b). The presence of mercury in tuna
requires further comment. Areas 57 and 71 show significantly lower concentrations than other zones;
the Mediterranean Sea (Area 37), however, while not showing differences between zones 27 and 51,
provided the highest concentration by far of Hg and the highest median. This fact is likely to be due to
the different number of samples from different areas. Three red tuna samples from the Mediterranean
Sea, respectively, from Sicily (1.29 mg kg-1), the Adriatic Sea (1.19 mg kg-1) and Cyprus (1.80 mg kg-
1), exceeded the MLs set by the EU at 1 mg kg−1. Our results agree with other studies conducted on
tuna in the Mediterranean region where the concentrations of Hg were 0.12–3.23 mg kg-1 (Storelli and
Marcotrigiano 2001) and 0.49–1.81 mg kg-1 (Srebocan et al. 2007). In tuna muscle tissues organic Hg
is between 75%-100% of total Hg (Storelli et al. 2005). Based on the worst hypothesis, i.e. Hg was
totally methylmercury, the EDI calculated on the mean (0.18 µg g-1) content, would provide a Hg
intake of 0.0021 µg kg-1day-1, about 88 times lower than TWI (1.3 µg g-1) expressed as total Hg. Ni
was detected in all tuna samples. The concentration range was 0.008–0.86 mg kg-1. Considering the
mean value, an average consumer would be exposed to 0.0042 µg kg−1 day-1that is about 670 times
lower than the TDI value of 2.8 µg kg-1body weight, calculated by EFSA (2015). The acute toxicity of
Ni plays a major role, as systemic contact dermatitis is a frequent adverse effect in nickel-sensitive
individuals exposed to this metal through food. A 300 g serving of the most contaminated tuna would
supply (0.31 x 0.3/60) = 1.6 µg kg−1 body weight to a 60 kg consumer, that is an amount higher than
the BMDL10 of 1.1 µg kg-1body weight. Considering the recommended minimum value of 10 for the
margin of exposure (MOE), the value considered of no concern would be 0.11 µg kg-1body weight. The
calculated concentration of Ni in tuna in a single meal that should not lead to the limit being exceeded
is 0.022 mg kg-1muscle; 85% of our samples had a Ni concentration higher than this calculated value
(EFSA 2015). A risk of contact dermatitis through tuna intake is therefore present, even if lower than
that observed in mussel and clams (Chiesa et al. 2018). Food is the main route of exposure of humans
to Pb and cereal products contribute most to dietary exposure. Eleven analysed samples exceeded the

75
MLs (0.30 mg kg -1) with a range concentration 0.30–0.86 mg kg-1. Ten of them were yellow tunas
from Pacific FAO areas 57 and 71, while the one presenting the lower concentration was a red tuna
from Sicily. The comparison between zones showed a significant difference between FAO areas 57 and
71, which has a statistical significance due to similar numbers in the groups (Tables 1 and 3). The mean
Pb concentration found in tuna samples was 0.12 mg kg-1. An average consumer would, therefore, take
in 0.014 µg kg-1 day-1, an amount 45 times lower than the lower reference point referred to adults
(BMDL10 = 0.63 µg kg-1day-1). A study (Teuschler 2013) on Italian food consumption patterns in the
‘90s reported that fish consumption by children is about 65% that of adult consumers. If the weight of
16 kg for a 4-year-old child and the above-reported intake are accounted for, daily intake results in
0.037 µg kg-1 day-1, a value 13 times lower than the BMDL01 value of 0.50 µg kg-1day-1for
developmental neurotoxicity in infants and children. This value could pose some concern if lower ages,
and the intake of other foods are considered. In fact, cereals and cereal-based products, potatoes, leafy
vegetables and tap water are the main contributors to Pb exposition (EFSA 2010) and tuna seems to
contribute significantly to the health-based guidance value.
3.1. Evaluation of the hazard index
Metals and As in tuna can share some toxicological effects and evoke a dose addition that results in a
Total Dose, i.e. the dose of each toxic agent with similar effects. Therefore, we calculated the Hazard
Index (HI), i.e. the sum of more than one Target Hazard Quotients (THQ) shared by the different
chemicals studied. Firstly, the THQ, i.e. the ratio of the estimated exposure to each substance and the
level with no adverse effects, were evaluated as THQ = daily intake/RfV for each compound, for the
different critical effects specified by EFSA. To calculate the HI, the following equation was used: HI =
Σi=6 Estimated intakei /RFVi, where, RfVi is the Reference Value, that is the human daily intake of the
substance i [TDI, TWI or BMDL] and the Estimated Intake, evaluated from annual consumption, is in
the same units as the RfVi (Teuschler 2013). The RfVi were the reference doses indicated by EFSA
(2009a, 2009b, 2010, 2012, 2015), reconsidered on a daily base when necessary. All the HIs were
much lower than one, indicating that only a negligible health hazard could derive from the ingestion of
tuna, at least for the chemicals studied (Table 4).

76
Table 4 Hypothetic target hazard quotient (THQ) and hazard index (HI) values for estimated daily
exposure to the studied elements via tuna at mean concentrations detected. All the reference values
(RfV) are by EFSA. TWIs are recalculated and expressed on a daily base. As is reported as inorganic
Arsenic and only Cr(III) is considered. EDI is the estimated daily intake.
RfV BMDL TWI TDI TWI TDI BMDL
Element As Cd Cr Hg Ni Pb HI HI
EDI
(µg kg-1) 0.016 0.0017 0.0089 0.0021 0.0042 0.014
Average
consumers
95%
consumers
THQ
(RfV µg kg-1
day-1)
Skin/lung/bladder
cancer;
skin lesions
0.053
(0.3) 0.053 0.19
Reproduction/
Development
0.000030
(300)
0.0015
(2.8) 0.0015 0.0055
Developmental
neurotoxicity
0.011
(0.19)
0.028
(0.5) 0.039 0.14
Blood pressure 0.011
(0.19)
0.0093
(1.5) 0.020 0.073
Kidney 0.0048
(0.36)
0.022
(0.63) 0.027 0.099
The HI for the 95th percentile consumers was also calculated based on previous studies (Leclercq et al.
2009; Chiesa et al. 2018), that indicated an estimated fish intake ratio of 3.65 for higher versus average
consumers. Accounting for this value an EDI for the higher consumers was calculated and shown in
Table 4. For this group of population, too, tuna is a negligible source of exposure for the chemicals
studied. Finally, this work shows low risks for the health of average consumers. All the HIs were much
lower than one, indicating that only a negligible health risk could derive with the intake of tuna from
the chemicals studied. There is some concern about a cancer risk evoked by Pb and Cd. The evidence
for the carcinogenicity of Pb in humans, and human exposure through food are not however considered
sufficient to represent a risk (EFSA 2015). IARC (2012a) states that the evidence of Cd as a human
carcinogen is sufficient, based on professional exposure and lung cancer but not all recent data
associate Cd and cancer at low dietary intakes (Åkesson et al. 2014). The health risk assessment
should, therefore, consider Cd for this toxic effect, if more unambiguous data become available.

77
References
Abou-Arab AAK, Ayesh AM, Amra HA, Naguib K. 1996.Characteristic levels of some pesticides and
heavy metalsin imported fish. Food Chem. 57(4):487–492.
Adams SV, Newcomb PA, White E. 2012. Dietary cadmiumand risk of invasive postmenopausal breast
cancer in theVITAL cohort. Cancer Cause Control. 23(6):845854.
Åkesson A, Barregard L, Bergdahl IA, Nordberg GF,Nordberg M, Skerfving S. 2014.Non-renal effects
andthe risk assessment of environmental cadmium exposure.Environ Health Perspect. 122(5):431–439.
Chen P, Miah MR, Aschner M. 2016. Metals andneurodegeneration. F1000 FacRev366-Res.
5:366.doi:10.12688/f1000research.7431.1.
Chiesa LM, Ceriani F, Caligara M, Di Candia D, Malandra R,Panseri S, Arioli F. 2018.Mussels and
clams from theitalian fish market. Is there a human exposition risk tometals and arsenic? Chemosphere.
194:644–649.
Cullen WR, Reimer KJ. 1989. Arsenic speciation in theenvironment. Chem Rev. 89:713–764.[EFSA]
European Food Safety Authority. 2009a. Scientificopinion on arsenic in food. EFSA panel
onContaminants in the Food Chain (CONTAM). Efsa J.7:1351–1550.
[EFSA] European Food Safety Authority. 2009b. Scientific opinion on cadmium in food. EFSA panel
on Contaminants in theFood Chain (CONTAM). Efsa J. 980:1–139.
[EFSA] European Food Safety Authority. 2010. Scientificopinion on lead in food. EFSA panel on
Contaminantsin the Food Chain (CONTAM). Efsa J. 8:1570–1721.
[EFSA] European Food Safety Authority. 2012. Scientificopinion on the risk for public health related
to the presence of mercury and methylmercury in food. Efsa J.10:2985–3225.
[EFSA] European Food Safety Authority. 2014a. Dietaryexposure to inorganic arsenic in the
Europeanpopulation. Efsa J. 12:3597–3658.
[EFSA] European Food Safety Authority. 2014b. Scientificopinion on the risks to public health related
to the presence of chromium in food and drinking water. Efsa J.9:11–25.

78
[EFSA] European Food Safety Authority. 2015. Scientificopinion on the risks to public health related
to the presence of nickel in food and drinking water. Efsa J.13:4002–4203.
[EUMOFA]. European Market Observatory for Fisheries andAquaculture Products. 2017. accessed
2018 Dec 21. https://www.eumofa.eu/documents/20178/108446/.
[EC] European Commission. European Union risk assessmentreport. Cadmium metal and oxide. 2007.
accessed 2018 Dec21. https://ec.europa.eu/jrc/en/publication/eur-scientific-andtechnical-research-
reports/european-union-summary-riskassessment-report-cadmium-metal-and-cadmium-oxide.
[EC] European Commission No 1881/2006. 2006.Commission regulation of 19 December 2006 setting
maximum levels for certain contaminants in foodstuffs. OffJ Eur Union L. 364:5.
Guérin T, Chekri R, Vastel C, Sirot V, Volatier JL,Leblanc JC, Noël L. 2001. Determination of 20
trace elements in fish and other seafood from the French market.Food Chem. 127(3):934–942.
Hindmarsh JT, McCurdy RF. 1986. Clinical and environmental aspects of arsenic toxicity. Crit Rev Cl
Lab Sci. 23(4):315–347.
Huff J, Lunn RM, Waalke M, Tomatis L, Infante PF. 2007.Cadmium-induced cancers in animals and in
humans.
Int J Occ Environ Health. 13(2):202–212.[IARC] International Agency for Research on Cancer.
2006.Inorganic and organic lead compounds. IARC Mon EvalCarcin Risks Hum. 87:519–1048
.accessed 2018 Dec 21.https://monographs.iarc.fr/wp-content/uploads/2018/06/mono87.
[IARC] International Agency for Research on Cancer. 2012a.Arsenic, metals, fibres and dusts: nickel
and nickelcompounds. IARC Mon Eval Carcin Risks Hum. 100. accessed2018 Dec 21.
https://monographs.iarc.fr/iarc-monographs-on-the-evaluation-of-carcinogenic-risks-to-humans-19/.
[IARC] International Agency for Research on Cancer. 2012b.Cadmium and cadmiumcompounds.
IARC Mon EvalCarcin Risks Hum. 100:121–145C .accessed 2018 Dec
21.https://monographs.iarc.fr/iarc-monographs-volume-100c-cadmium-and-cadmium-
compounds/.Ikem A, Egiebor NO. 2005. Assessment of trace elements incanned fishes (mackerel, tuna,
salmon, sardines and herrings) marketed in Georgia and Alabama (United States ofAmerica). J Food
Compos Anal. 18(8):771–787.

79
Larsen EH, Pritzl G, Honoré Hansen S. 1993. Arsenic speciation in seafood samples with emphasis on
minor constituents: an investigation using high-performance liquid
chromatography with detection by inductively coupledplasma mass spectrometry. J Anal Atomic Spec.
8(8):1075–1084.
Leclercq C, Arcella D, Piccinelli R, Sette S, Le Donne C,Turrini A. 2009. The Italian National Food
consumptionsurvey INRAN-SCAI. Public Health Nutr. 12(12):2504–2532.
Licata P, Trombetta D, Cristani M, Naccari C, Martino D,Caló M, Naccari F. 2005. Heavy metals in
liver and muscleof bluefin tuna (Thunnus thynnus) caught in the straits ofMessina (Sicily, Italy).
Environ Monit Assess. 107(1–3):239–248.
Mol S. 2011. Levels of selected trace metals in canned tunafish produced in Turkey. J Food Comp
Anal. 24(1):66–69.[NTP] Network Time Protocol. 2004. Lead and lead compounds. In: Report on
carcinogens. 11th ed. Jefferson
(AR): Research Triangle Park: US Dep. of Health andHuman Service. accessed 2018 Dec 21.
https://ntp.niehs.nih.gov/ntp/roc/content/profiles/lead.pdf.
[NTP] Network Time Protocol. 2010. NTP technical reporton the toxicology and carcinogenesis studies
of chromiumpicolinate monohydrate in F344/N Rats and B6C3F1 Mice(Feed Studies). Res Trian Park
(North Carolina):Department of Health and Human Services. NTP
Technical Report Series, No. 556. accessed 2018 Dec
21.http://ntp.niehs.nih.gov/ntp/htdocs/LT_rpts/TR556.
Olmedo P, Pla A, Hernández AF, Barbier F, Ayouni L, Gil F.2013. Determination of toxic elements
(mercury, cadmium, lead, tin and arsenic) in fish and shellfish samples.
Risk assessment for the consumers. Environ Int. 59:63–72.Sawada N, Iwasaki M, Inoue M, Takachi R,
Sasazuki S,Yamaji T, Shimazu T, Endo Y, Tsugane S. 2012. Longterm dietary cadmium intake and
cancer incidence.
Epidemiology. 23:368–376.Sirot V, Guérin T, Volatier JL, Leblanc JC. 2009. Dietary exposure and
biomarkers of arsenic in consumers of fish andshellfish from France. Sci Total Environ. 407(6):1875–
1885.

80
Srebocan E, Pompe-Gotal J, Prevendar-Crnic A, Ofner E.2007. Mercury concentrations of captive
Atlantic bluefintuna (Thunnus thynnus) farmed in the Adriatic Sea. Vet
Med. 52(4):175–177.
Storelli MM, Barone G, Cuttone G, Giungato D, Garofalo R.2010. Occurrence of toxic metals (Hg, Cd
and Pb) in fresh and canned tuna: public health implications. Food Chem Toxicol. 48(11):3167–3170.
Storelli MM, Giacominelli Stuffler R, Storelli A, Marcotrigiano GO. 2005. Accumulation of mercury,
cadmium, lead and arsenic in swordfish and bluefin tunafrom the Mediterranean sea: a comparative
study. MarPollut Bull. 50:1004–1007.
Storelli MM, Marcotrigiano GO. 2001. Total mercury levels in muscle tissue of swordfish (Xiphias
gladius) and bluefin tuna (Thunnus thynnus) from the Mediterranean Sea
(Italy). J Food Protec. 64(7):1058–1061.
Teuschler L 2013. Chemical mixture risk assessment additivity-based approaches. presented at Current
Methods of Assessing Cumulative Risk of Phthalates; October 01; Ottawa, Canada.
Usydus Z, Szlinder-Richert J, Polak-Juszczak L, Komar K, Adamczyk M, Malesa-Ciecwierz M,
Ruczynska W. 2009.
Fish products available in polish market – assessment of the nutritive value and human exposure to
dioxins and other contaminants. Chemosphere. 74(11):1420–1428.
Voegborlo RB, El-Methnani AM, Abedin MZ. 1999. Mercury, cadmium and lead content of canned
tuna fish. Food Chem. 67(4):341–345.
Von Stackelberg K, Guzy E, Chu T, Claus Henn B. 2015. Exposure to mixtures of metals and
neurodevelopmental outcomes: a multidisciplinary review using an adverse
outcome pathway framework. Risk Anal. 35(6):971–1016.
Word Health Organization (WHO). 2016. accessed 2018 Dec 21.
http://www.who.int/ipcs/assessment/public_health/chemicals_phc/en/

81
3.3 Risk characterisation from the presence of environmental contaminants and antibiotic
residues in wild and farmed salmon from different FAO zones
Published in: Food Additives & Contaminants Part A, Volume36 (1), 2019, Pages 152-162.
Luca Maria Chiesa a, Maria Nobile a, Federica Ceriani a, Renato Malandra b, Francesco Arioli a Sara
Panseri a*. a Department of Health, Animal Science and Food Safety, University of Milan, Via Celoria 10, 20133
Milan, Italy b ATS Milano-Città metropolitana, Director of Veterinary Unit, Via Celoria 10, 20133 Milan, Italy
* Corresponding author: Sara Panseri, Department of Health, Animal Science and Food Safety,
University of Milan, Via Celoria 10, 20133 Milan, Italy. Phone: 0250317931; Fax: 00390250317941;
E-mail: [email protected]
Abstract
Salmon consumption is increasing year by year. Salmon aquaculture is the fastest growing food
production system in the world, and often uses feed mixed with antibiotics or other drugs. Feed can be
also contaminated by environmental contaminants like persistent organic pollutants and
organophosphorus pesticides that usually accumulate in fatty tissue, or emerging contaminants such as
perfluoroalkyl substances (PFASs), that instead bioaccumulate in protein tissues. Therefore, there is the
need to investigate the presence of antibiotics and environmental contaminants, with multi-class and
multi-residue liquid chromatography-high resolution mass spectrometry and gas chromatography
tandem mass spectrometry methods to monitor a broad spectrum of residues comparing between wild
and farmed salmons. The presence of residues was encountered at a concentration range of 0.35–51.52
ng g−1 for antibiotics only in farmed salmon, 0.19–34.51 ng g−1 for PFASs and 0.26–9.01 ng g−1 for
(polybrominated diphenyl ethers) PBDEs, and 0.19–5.91 ng g−1 for organochlorine pesticides with
higher frequencies and concentrations in farmed fish. Finally, the risk deriving from salmon intake is
low, being of minor concern only for PBDE 99 and perfluorooctanoic acid.
Keywords: POPs, PFASs, organophosphorus pesticides, antibiotics, salmon, toxicological risk.

82
1. Introduction
The consumption of salmon has risen consistently at global level. The global salmon supply covers
both wild and farmed species. The intensive practices of aquaculture, adopted to meet the growing
demand for fish (especially salmon, sea bream and sea bass), have already shown for some years the
evidence of treatments with feed mixed with antibiotics or other veterinary drugs to prevent the spread
of infections (Dickson 2014). In this context, one of the main sources of consumer exposure to
pesticides and antibiotics is representing by food route. These molecules enter into the food chain as
they are used for therapeutic, prophylactic or illicit purposes or for their accumulation in the
environment especially in breeding contexts and in this specific case in aquaculture. In Europe,
maximum residue limits (MRLs) have been established for various classes of antibiotics (European
Commission 1990) and they were banned as growth promoters since the 1990s, due to the possibilities
of transmission of antibiotic resistance to human pathogens. On the other hand, food and particularly
fish, can be also contaminated by environmental contaminants like persistent organic pollutants
(POPs), that usually accumulate in fatty tissue, or new environmental contaminants, as well as PFASs,
that instead prevail in protein fraction as also highlighted by previous researches conducted on eels and
mussels (Chiesa et al. 2018c, 2018d).
The attention must be focalized toward flame retardants (BFRs) because from 1980 their use rapidly
increased in industrial field. These compounds tend to persistent in air, soil and water compartments for
long time. Their potential to bioaccumulate, allows them to partition in the fatty tissues of living
organisms, bioconcentrate, and finally biomagnify in the animals at the higher trophic levels, including
humans, possibly causing, through chronic exposition, endocrine disruption and cancer (Wania and
Mackay 1995). In 2003 European Commission (EC) fixed limits on the use of these compounds in the
industry due to their toxicological risks. The legislation about their residue in food has not been enacted
yet, due to the low data present in literature and so EC, in 2014, indicated to conduct more studies in
order to collect further data about their presence in foods to better delucidate the consumer exposure
risks (European Commission 2014). Bioaccumulation can occur through two forms: long-term, low-
level contamination resulting from gradual diffusion of persistent chemicals through the environment,
and relatively shorter term, higher level contamination caused by industrial accidents and waste
disposal. The sources that lead to the presence of xenobiotics in food are numerous and difficult to

83
identify or exclude from our daily environment.
PFASs have aroused in these last year’s great scientific interest especially concern the public health
implications. Moreover, as stated by European Food Safety Authority (EFSA) the importance to
monitorate these chemicals is crucial not only for food safety but great effort must be paid requests to
set up and validate adequate and sensible analytical methods. Fish seems to be an important source of
human exposure to PFASs, although the data might be influenced by results of studies in relatively
polluted areas, which is likely to over-estimate exposure from commonly consumed fish (EFSA 2008).
In addition, very few and partial research are present in literature about contaminants and antibiotics
residues in both farmed and wild fish species. These works furnished only a partial overview since they
are focused on the detection of one antibiotic or a few classes of antibiotics and contaminants,
considering as target fish different types of seafood, with no particular focus on salmon. Table 1 is a
summary of the state of art about literature works regarding the analytes of interest in the edible salmon
matrix. Based on the above-mentioned considerations, the aim of the present work is to investigate the
presence of antibiotics and POPs, implementing the control framework on salmon, by developing
multiclass and multiresidual HPLC-HRMS and GC-MS/MS methods to monitor a broad spectrum of
residues then evaluating xenobiotic distribution in wild and farmed salmons from different geographic
areas. This could add knowledge toward consumer’s food safety and the possible exposure to
contaminants via fish consumption.

84
Table 1. Summary of the state of art about the analytes of interest in the edible salmon matrix.
Reference Investigated
Compounds Matrix Analytical technique
LOD-
LOQ
CCβ-CCα
(ng g-1)
Min and Max
concentration range
(ng g-1)
Antibiotics
Pleasance et al. (1992) Macrolides Salmon HPLC-ESI-MS/MS 0.5-1
(LOD) No application
Rambla-Alegre et al (2010) Quinolones
Gilthead
Salmon
Trout
Sea bass
Mussel
Prawn
Turbot
MLC
1-7 (LOD)
5-30
(LOQ)
Not found
Dickson et al. (2014) Macrolides
Lincosamides
Salmon
Shrimp
Tilapia
HPLC-MS/MS
0.5-3
(LOQ)
0.5-5
(LOD)
No application
Fedorova et al. (2014)
Tetracyclines
β-lactams
Quinolones
Sulfonamides
Phenicols
Macrolides
Lincosamides
Diaminopyrimidines
Salmon
Squid
Sea
bream
Mussels
Pangasius
Mackerel
Seawolf
Sprat
Carp
Tuna
Trout
Herring
Char
Cod
Tilapia
Shark
Crayfish
Perch
Shrimp
HPLC-MS/MS 0.062-4.6
(LOQ) 2.9-25
Done et al. (2015)
Tetracyclines
Quinolones
Sulfonamides
Macrolides
Cephalosporins
Diaminopyrimidines
Shrimp
Tilapia
Trout
Salmon
Catfish
Swai
HPLC-MS/MS 0.1-25.5
fw (LOD) 0.3- 112.5
Kim et al. (2017)
Quinolones
Sulfonamides
Macrolides
Lincosamides
Diaminopyrimidines
Rockfish
Mullet
Sea
bream
HPLC-ESI-MS/MS 0.209-0.53
(MDL)
nd-3.16
(muscle)
Jia et.al. (2018) Sulfonamides Salmon UHPLC/ESI Q-Orbitrap
0.07-2.33
(CCα)
0.04-1.34
(CCβ)
1.39-31.2

85
PFASs
Kannan et al. (2005)
PFOS
PFHS
PFOA
PFOSA
Salmon
Whitefish
Carp
Trout
HPLC-ESI/MS/MS 7.5-75
(LOQ) 32-173
Berger et al. (2009)
PFHxS
PFOS
PFOSA
PFOA
PFNA
PFDcA
PFUnA
PFDoA
PFTriA
PFTeA
PFPeDA
Perch
Salmon
Trout
Burbot
Whitefish
HPLC/HRMS 0.02-0.30
(LOD) 0.05-10.1
Chang et al. (2012)
PFHxA
PFOA
PFNA
PFDA
PFUndA
PFDoDA
PFHxS
PFOS
PFOSA
N-MeFOSA
Water
Milk
Salmon
Beef
Liver
UHPLC-MS/MS
0.12-26.3
(LOD)
0.54-65.6
(LOQ)
0.05-23.5
Rasmussen et al. (2017)
Element
BFR
PCB
PFOS
PFOA
PFNA
PFOSA
Salmon
Halibut
Prawns
HPLC-MS/MS
0.4-0.5
(LOD)
0.2-0.6
(PFC analysed only in halibut)
PCBs, PBDEs, OCPs
Jacobs et al. (2002)
PCBs
PBDEs
DDT
Salmon
Aquafeed
Fish oil
GC/MS 0.1-0.5 lipid
(LOD) 1-460 lipid
Johnson et al. (2007)
PAHs
PCBs
DDT
Salmon GC/MS 0.16-4.2
lipid (LOD) 1300-27000 lipid
Kelly et al. (2008)
PCBs
PCDDs
PCDFs
OCPs
Salmon
Aquafeed GC/MS
0.00015-
0.030 lipid
(LOD)
0.002-756 lipid
Shaw et al. (2008) PBDEs Salmon GC-MS 0.001-0.010
ww (LOD) 0.4-1.4 ww
Cullon et al. (2009)
PCBs
PCDDs
PCDFs
DDT
Salmon GC/MS - 9.07-56.09 ww
Montory et al. (2010) PCBs
PBDEs Salmon GC-MS
0.010 ww
(LOD) 0.27-78 ww
Norli et al. (2011) OCPs
PCBs
Salmon
Tilapia
Carp
Catfish
GC-MS 1-10 ww
(LOQ) 0.7-149.9 ww
Vuorinen et al. (2014)
PCBs
PBDEs
PCDDs
Salmon GC-MS 0.01–0.6
(LOQ) 0.001-110 ww

86
1. Material and methods
1.1. Chemicals and reagents
All solvents, formic acid (98–100%), acetic acid (99.9%), sodium acetate, 25% ammonia solution,
ammonium formate, trichloroacetic acid (TCA), and disodium hydrogen phosphate dihydrate, citric
acid monohydrate and EDTA, to prepare EDTA-McIlvaine buffer solution, pH 4, were purchased from
Merck KGaA, Darmstadt, Germany. Water was purified by a Milli-Q system (Millipore, Merck KGaA,
Darmstadt, Germany). The extraction cartridges Oasis WAX 3 mL, 60 mg for PFASs and Oasis HLB 3
mL, 60 mg for antibiotics were provided by Waters (Milford, MA, USA). SupelTM QuE Citrate (EN)
tubes for POP extraction and SupelTM QuE-ZSEP (EN) tubes for the clean-up step were from Supelco
(Sigma Aldrich, St.Louis, MO, USA).
Mixtures of non dioxin like-polychlorinated biphenyl (ndl-PCB) congeners (PCB 28; 52; 101;
138; 153 and 180) and PBDE congeners (PBDE 28; 33; 47; 99; 100; 153 and 154), PCB 209, internal
standard (IS) for PCBs, and 3-fluoro-2,2,4,4,6- pentabromodiphenyl ether (FBDE), IS for flame
retardants, were from AccuStandard (New Haven, USA). A mixture of 19 organochlorine pesticides
(OCs) (aldrin, α-1,2,3,4,5,6-Hexachlorocyclohexane (α-HCH); hexachlorobenzene; β-1,2,3,4,5,6-
Hexachlorocyclohexane (β-BHC); 1,1-Dichloro-2,2-bis(4-chlorophenyl)ethene (DDE), 1,1-Dichloro-
2,2-bis(4-chlorophenyl)ethene, 4,4′-DDE; 1,1,1-Trichloro-2,2-bis[4-chlorophenyl]ethane 2,40-DDT;
1,1-Dichloro-2,2-bis(4-chlorophenyl)ethane 4,40-DDD; 1,1-Dichloro-2,2-bis(4-chlorophenyl)ethan
4,40-DDT; endosulphan I; endosulphan II; endosulphan sulphate; endrin; heptachlor; heptachlor
epoxide; lindane and trans chlordane) was purchased from Restek (Bellefonte, PA, USA).
Organophosphorous pesticide (OP) standards of chlorpyriphos diazinon, disulphoton, ethoprophos,
fenthion, mevinphos, methyl parathion and phorate were purchased from Sigma-Aldrich, St Louis, Mo,
USA. Florisil (100e200 96 mesh) was provided by Promochem (Wesel, Germany). 4-nonylphenol (IS
for OCs and OPs) was purchased from Merck (Sigma-Aldrich, Merck KGaA, Darmstadt, Germany).
PCDFs
n.d: not detected

87
PFASs analysed by HPLC-HRMS system were both sulphonates and carboxylates:
perfluorobutanoic acid (PFBA), perfluoropentanoic acid (PFPeA), perfluorohexanoic acid (PFHxA),
perfluorobutane sulphonic acid (PFBS), perfluoroheptanoic acid (PFHpA), PFOA, perfluorohexane
sulphonate (PFHxS), perfluorononanoic acid (PFNA), perfluorodecanoic acid (PFDA), PFOS,
perfluorododecanoic acid (PFDoA), perfluoroundecanoic acid (PFUnDA), perfluorotridecanoic acid
(PFTrDA), perfluorotetradecanoic acid (PFTeDA), perfluorohexadecanoic acid (PFHxDA), and
perfluorooctadecanoic acid (PFODA). All these compounds and the two 13C-labeled internal standards
(ISs) perfluoro-[1,2,3,4,5-13C5]nonanoic acid (MPFNA) and perfluoro-[1,2,3,4-13C4]octanesulfonic
acid (MPFOS) were purchased from Chemical Research 2000 Srl (Rome, Italy).
Antimicrobial agents analised by HPLC-HRMS system: amoxicillin, ampicillin,
benzylpenicillin, cefquinome, ceftiofur, cefalexin, ciprofloxacin, chloramfenicol, chlortetracycline,
cloxacillin, danofloxacin, dicloxacillin, dimetridazole, doxycycline, enrofloxacin, florfenicol,
florfenicol amine, flumequine, furaltadone, furazolidone, lincomycin, lomefloxacin, marbofloxacin,
nalidixic acid, nitrofurazone, oxolinic acid, oxytetracycline, ronidazole, spyramicin, sulfadiazine,
sulfathiazole, sulfadimethoxine, sulfadimidine, sulfamerazine, tetracycline, thiamphenicol, tiamulin,
tilmicosine, tinidazole, trimethoprim, tylosin and enrofloxacin-d5 as the internal standards (IS) were
purchased from Merck.
2.2 Standard solutions
The working solutions of POPs were prepared daily in hexane from stock solutions (10 µg mL-1) stored
at -20 °C. The working solutions of antibiotics and PFASs were prepared daily in methanol from stock
solutions (1 µg mL-1).
2.3. Sample collection
To carry out a survey that is representative of the situation of contamination by emerging contaminants,
it has been decided to evaluate and examine several samples in relation to the species and types
available on the market. We collected 66 samples of wild and farmed salmon from five geographical
areas and three different FAO zones (Table 2): 25 farmed Salmo salar from Norway (FAO 27), 17
farmed Salmo salar from Scotland and 2 wild Salmo salar from Scotland- North East Atlantic (FAO
27), 14 wild Oncorhynchus nerka or Sockeye salmon from Canada (FAO 67), 5 wild Oncorhynchus

88
kisutch and 2 wild Oncorhynchus keta from USA- Pacific Ocean (FAO 77). In particular both medium
(average weight 5.20 ± 0.57 Kg) and small size (average weight 3.11 ± 0.34 Kg) were considered. All
samples were collected at the fish market of Milan (Italy) and the dead fish were transported to the
laboratory where it was taken the abdominal (rich in deposit fat) and the dorsal part (part more
muscular).
Table 2. Salmon sample details: number of samples, species, FAO area, country of origin and type.
Species FAO Area Country Farmed Wild Total
Salmo salar 27 Norway 25 - 25
Scotland 17 2 19
Red salmon
(Oncorhynchus nerka) 67 Canada - 15 15
Silver salmon
(Oncorhynchus kisutch) 67 USA - Pacific - 5 5
Keta salmon
(Oncorhynchus keta) 77 USA - Pacific - 2 2
Total 42 24 66
2.4. Sample extraction and purification protocol for antibiotics
The sample extraction and clean-up procedure carried out for antibiotics in 1 g samples of salmon
muscle is the same reported in our previous works (Chiesa et al. 2017, 2018a and 2018b).
2.5. Sample extraction and purification protocol for PFASs
The pretreatment and extraction of 2 g sample for PFASs was the same described in our previous
works (Chiesa et al. 2018c, 2018d).
2.6. Sample extraction for pesticides
The extraction of pesticides and contaminants was performed on 1 g samples using the QuEChERS
method described in Chiesa et al. (2018d).

89
2.7. LC-HRMS Orbitrap analyses
HPLC- Q-Exactive Orbitrap equipped with a heated electrospray ionisation (HESI) source was used for
detection and quantification of antibiotics and PFASs. HPLC analysis was performed by an HPLC
system (Surveyor MS quaternary pump, Thermo Fisher Scientific, San Jose, CA, USA). A Synergi
Hydro-RP reverse-phase HPLC column (150 × 2.0 mm, i.d. 4 µm), with a C18 guard column (4 × 3.0
mm; Phenomenex, Torrance, CA, USA) was used. The mobile phase used for the antibiotics separation
consisted of a binary mixture of solvents A (aqueous HCOOH 0.1%) and B (MeOH), instead for
PFASs were used C (aqueous NH4COOH 20 mM) and B (MeOH). The two gradients and MS
parameters were described in our previous works (Chiesa et al. 2018a, 2018c).
The full scan (FS) acquisition was combined with a data-independent acquisition (DIA)
strategy, providing the MS2 spectra for a confirmatory response.
Detection of the analytes was based on the calculated exact mass of the protonated/deprotonated
molecular ions, and at least one specific and typical fragment. Xcalibur 3.0 software (Thermo Fisher
Scientific, San Jose, CA, USA) was used to acquire and elaborate data.
2.8. GC-MS/MS analyses
A GC Trace 1310 chromatograph coupled to a TSQ8000 triple quadrupole mass detector (Thermo
Fisher Scientific, Palo Alto, CA, USA) in electron ionization (EI) mode was used for the detection and
quantification of pesticides and POPs in salmon samples. A fused-silica capillary column Rt-5MS
Crossbond-5% diphenyl 95% dimethylpolysiloxane (35 m x 0.25 mm i.d., 0.25 μm film thickness,
Restek, Bellefonte, PA, USA) was used. The oven temperature program and all operation parameters
were the same of our previous work (Chiesa et al. 2018d). The QqQ mass spectrometer was operated in
selected reaction monitoring mode (SRM) detecting two-three transitions per analyte. The Xcalibur
processing and instrument control software program and Trace Finder 3.0 for data analysis and
reporting (Thermo Fisher Scientific) were used.
2.9. Validation on the basis of the different residues
Antibiotic validation was carried out following the Commission Decision guidelines 657/2002/CE
(European Commission 2002). For POPs, including PFASs, validation was performed following the

90
European Commission (2015) SANTE/2015 guidelines. All the validation parameters and the
assessment of validation protocols are already described in our previous works (Chiesa et al. 2018a,
2018d).
3. Results and discussion
3.1. Validation parameters
The methods showed high specificity and selectivity. The mean recoveries ranged between 70 and
120%, indicating the efficiency of the three extraction protocols, as reported in our previous works
(Chiesa et al., 2018a, 2018d). Matrix validation curves demonstrated a good linearity with a good fit
(R2 > 0.99) for all compounds. Repeatability expressed as coefficient of variation (CV %), was lower
or equal to 20 % for all analytes. Our satisfactory results showed high method sensitivity for the
selected compounds both for LC-HRMS and GC-MS/MS analyses, with CCα (from 0.51 to 5.76 ng g-1
wet weight) and CCβ (from 0.65 to 5.93 ng g-1 wet weight) for antibiotics and LOQs (from 5.00 to
20.00 pg g-1 wet weight for PFASs and from 0.50 to 5.00 ng g- wet weight for all contaminants and
pesticides) well lower than the MRLs, where they are set.
3.2. Application of the methods
Table 3 shows the compounds detected in the collected salmon samples. About pesticides, the most
have been found in farmed salmon than wild salmon (Table 3).
Table 3. Detected antibiotic and contaminant residues in farmed and wild salmon samples.
Concentrations expressed as median, 1st and 3rd quartiles, median, minimum and maximum values are
in ng g-1; % = prevalence of detected compound.
Detected
compound
Farmed
N=42
Wild
N=24
% 1st quartile median
3rd
quartile
min –
max % 1st quartile median
3rd
quartile
min –
max
PCB (ICES-6)
PCB101 2 0 0 0 0.58 4 0 0 0 0.38
OCPs
Aldrin 40 0 0 1.75 1.36-3.12 29 0 0 1.70 1.69-3.01
Endosulfan II 5 0 0 0 0.19-0.29 8 0 0 0 0.54-1.03

91
Endosulfan
sulfate
45 0 0 1.80 0.30-2.31 1330 0 0 0 1.29-1.88
HCB 79 0.72 0.44 1.17 0.27-5.91 17 0 0 0 0.14-4.41
PBDEs
PBDE 28
PBDE 33
PBDE 47
PBDE 99
PBDE 100
PBDE 153
PBDE 154
11 0 0 0 0.54-1.12 4 0 0 0 1.71
PBDE 33 4 0 0 0 0.71 8 0 0 0 1.44-1.65
PBDE 47 7 0 0 0 0.70-8.31 n.d.
0
0
0
0
PBDE 99 29 0 0 0 0.41-6.01 29 0 0 0.68 0.65-9.01
PBDE 100 n.d.
0
0
0
0
4 0 0 0 0.76
PBDE 153 11 0 0 0 0.26-1.72 n.d.
0
0
0
0
PBDE 154 11 0 0 0 0.62-0.77 8 0 0 0 0.56-0.83
PFASs
PFBA 29 0 0 1.25
0.62-
19.22
29 0 0 0.28 0.19-
34.51
PFOA 48 0 0 2.30 0.83-8.52 13 0 0 0 0.86-2.91
PFOS n.d. 4 0 0 0 1.77
Antibiotics
Fenbendazole 26 0 0 2.64 1.06-
51.52
n.d.
Doxycycline 5 0 0 0 0.35-0.63 n.d.
Nalidixic acid 5 0 0 0 0.57-0.87 n.d.
n.d. =not detected
No OPs and polycyclic aromatic hydrocarbons (PAHs) were found although OPs are the most
frequently used group of insecticides all over the world (Lavado and Schlenk 2011). They are one of
the most common classes involved in poisoning because of the inhibition of acetyl-cholinesterase and
even if, they are less persistent in the environment than organochlorine pesticides, they can also reach
the food chain and may represent risk to human health (Lavado and Schlen 2011).
The same consideration must to be done about PAHs. Food can be contaminated by environmental
PAHs that are present in air, soil or water, by industrial food processing methods (e.g. heating, drying
and smoking processes) and by home food preparation. Few works in literature reported their presence
in salmon (Table 1).

92
About PCBs, only PCB 101 has been detected in one farmed sample coming from Norway (0.58 ng g-
1). These results appear different from other studies present in literature (Jiacobs, Covaci, and Schepens
2002; Hites et al. 2004) where PCBs were detected with higher frequencies (Table 1). Regarding OCs,
only 4 congeners were found out of all investigated compounds (Aldrin, Endosulfan II, Endosulfan
sulfate, Hexachlorbenzene) (Table 3). Even if no MRLs are stated by EU for these pesticides, the
conservative concentration of 0.01 mg kg-1 is set by Regulation (EC) 396/2005 (European Parliament
2005) as a default value in the absence of MRLs. The salmon samples never exceeded this limit;
however, some consideration could be done about this result. Farmed salmon results more
contaminated than wild salmon (Table 3). No DDD was found in this work and this result is different
than literature where DDD and its congeners were the most common compounds detected (Table 1).
The wild salmon migrates between freshwater and seawater during its life cycle. The spawning and
juvenile rearing takes place in rivers and streams, and the main growth takes place in the sea. The
juveniles spend 1–4 years in freshwater, migrate to the sea where they spend 1–3 winters and then
return to their natal (parent) rivers or streams to spawn (Mills 1989). This makes them great swimmers
and less exposed to a constant source of environmental pollutants. Farmed salmon, instead, lives in
aquaculture under human control, closer to the coast and more exposed to pollution. It is to be
underlined that farmed salmon has higher lipid content than wild salmon, making it more subjected to
bioaccumulation to POPs, as it has been reported in a study by Hamilton et al. (2004) due to total lipid
levels of 16.6% versus 6.6%. The highest detection has been found in European Countries (Norway and
Scotland) then Pacific Countries. This result only partially agree with Hites et al. (2004), which
concluded that levels of contaminants are higher in farmed salmon than wild and higher in European
country than America.
In this study, PBDEs were detected more frequently in farmed than wild salmons; the most recurrent
congeners was PBDE 99, whose presence was however equal in farmed and wild salmons (Table 3).
PBDEs are associated with liver, thyroid, reproductive and nervous system toxicity, (EFSA 2011).
Based on the composition of PBDE mixtures, occurrence in the environment and in food, EFSA
considers eight PBDE congeners of primary interest for dietary exposure and, among these, only -47, -
99, and -153 show significant toxicity data derived from epidemiological data on human exposition and
studies on behavior in mice. Due to the different kinetics between human and mice and to the body
burden of these bioaccumulabile compounds, an approach based on the margin of exposure (MOE) was

93
used, concluding that a MOE larger than 2.5 between animal and human could indicate the absence of
health concern. The mean chronic dietary exposure for average European consumers is 1.91 ng kg-1
b.w. day-1 (maximum upper bound) for BDE-47, 0.65 ng kg-1 b.w. day-1 for PBDE-99 and 0.42 ng kg-1
b.w. day-1 for PBDE-153. All the MOEs are larger than 2.5 so not representing a risk concern (EFSA
2011). The annual per capita salmon consumption reported by EUMOFA (European Commission
2017), is 2.17 kg corresponding to a daily intake of 5.95 g. The median concentrations we detected
were always zero, so the mean values found in salmon are here considered: 140 ng kg-1 w.w., 440 ng
kg-1 w.w. and 40 ng kg-1 w.w. for PBDE 47, 99 and 153 respectively, calculated both on farmed and
wild. Under these considerations, an average consumer of 70 kg should be exposed to the three PBDE
through salmon intake to: 140 x 0.00595/70=0.012 ng kg-1 day-1, 440 x 0.00595/70= 0.037 ng kg-1 day-1
and 40 x 0.00595/70= 0.0034 ng kg-1 day-1, respectively. The contribution of fish to alimentary
exposition of PBDE-47 is about 80%, while 30% is the contribution of PBDE-99, while it is not
specified the contribution for PBDE-153 (EFSA 2011). As salmon represents about the 9% of the
annual consumption of fish (European Commision, 2017), the values considered safe by EFSA are to
be recalculated on salmon contribution, i.e. 0.8 x 0.09= 0.07 for PBDE 47, 0.3 x 0.09 = 0.03 for PBDE
99, that are 7% and 3%, respectively of the total safe value. The recalculated safe values will be 1.91 x
0.07= 0.13 ng kg-1 day-1 (PBDE 47), and 0.65 x 0.03=0.02 ng kg-1 day-1 (PBDE 99). The safe value for
PBDE 47 is still higher of salmon contribution while PBDE 99 presents a matter of concern.
As regards PFASs, only PFBA, PFOA and PFOS were detected. In particular PFBA was
detected both in farmed and wild salmons (Figure 1), with a same incidence and similar concentrations
detected in the second and third quartiles (Table 3). The highest concentration (34.51 ng g-1) was
related to one wild sample of Canada of little size (3.3 kg). The presence of the short-chain PFASs was
already verified also in eels of Lake Garda (Chiesa et al., 2018c) and mussels and clams of different
FAO zones (Chiesa et al. 2018d) due to the ineffectiveness of wastewater treatment and drinking water
treatment plants at removing smallest PFASs.
PFOA was the compound found with the highest frequency in the farmed samples, at concentrations
slightly higher than the wild ones (Figure 1).
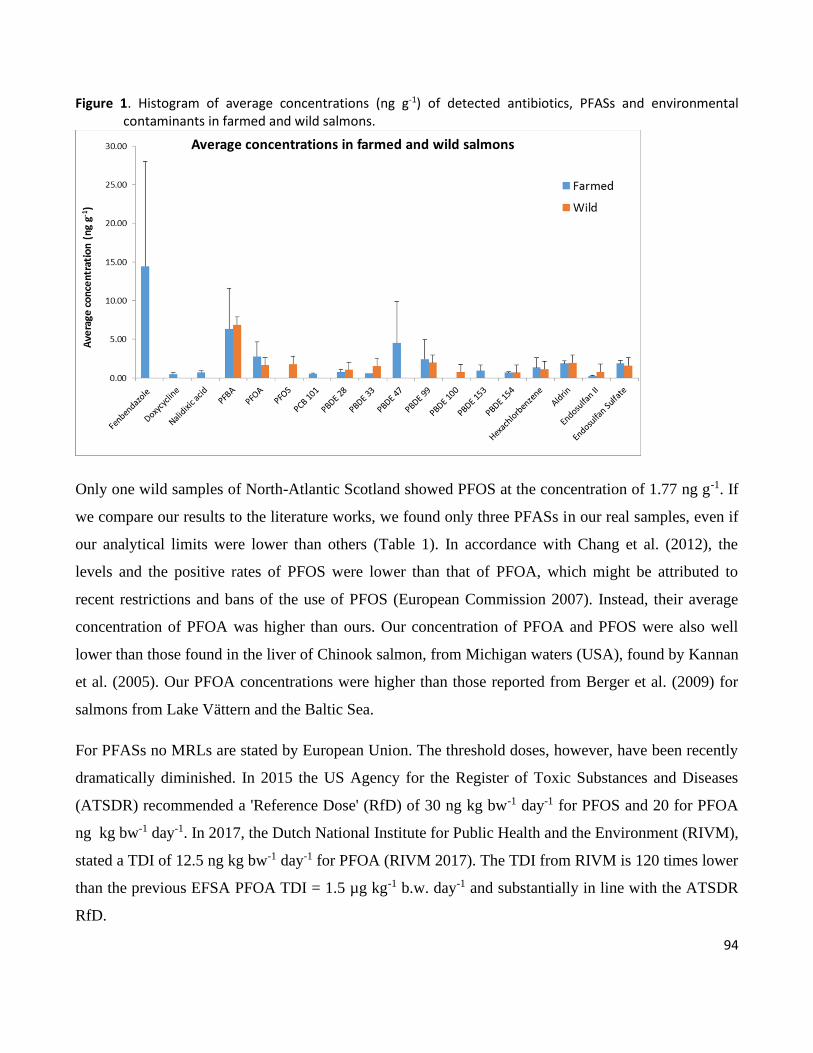
94
Figure 1. Histogram of average concentrations (ng g-1) of detected antibiotics, PFASs and environmental contaminants in farmed and wild salmons.
Only one wild samples of North-Atlantic Scotland showed PFOS at the concentration of 1.77 ng g-1. If
we compare our results to the literature works, we found only three PFASs in our real samples, even if
our analytical limits were lower than others (Table 1). In accordance with Chang et al. (2012), the
levels and the positive rates of PFOS were lower than that of PFOA, which might be attributed to
recent restrictions and bans of the use of PFOS (European Commission 2007). Instead, their average
concentration of PFOA was higher than ours. Our concentration of PFOA and PFOS were also well
lower than those found in the liver of Chinook salmon, from Michigan waters (USA), found by Kannan
et al. (2005). Our PFOA concentrations were higher than those reported from Berger et al. (2009) for
salmons from Lake Vättern and the Baltic Sea.
For PFASs no MRLs are stated by European Union. The threshold doses, however, have been recently
dramatically diminished. In 2015 the US Agency for the Register of Toxic Substances and Diseases
(ATSDR) recommended a 'Reference Dose' (RfD) of 30 ng kg bw-1 day-1 for PFOS and 20 for PFOA
ng kg bw-1 day-1. In 2017, the Dutch National Institute for Public Health and the Environment (RIVM),
stated a TDI of 12.5 ng kg bw-1 day-1 for PFOA (RIVM 2017). The TDI from RIVM is 120 times lower
than the previous EFSA PFOA TDI = 1.5 µg kg-1 b.w. day-1 and substantially in line with the ATSDR
RfD.

95
As above stated the salmon daily intake is 5.95 g and is the 9% of the total seafood consumed per
capita, while contribution of fish consumption to PFASs exposure is the 10% of the threshold limit
(RIVM 2017). This means that salmon alone contributes for 0.9%. Accounting for a chronic
consumption and with a conservative approach, the highest value between mean and median was
considered: 2.51 ng g-1 of PFOA resulting in a daily intake of 14.93 ng, that, for a person of 70 kg is
0.21 ng kg-1 day-1. This value is much lower than the RIVM TDI, but if we consider only the
contribution of salmon, it results to give a significant contribution to the human toxicological risk. The
RIVM TDI should therefore multiplied by 0.009 to evaluate human toxicological risk limit deriving
from PFOA in salmon. The Quality Standard for salmon should therefore be 0.11 ng g-1, a value lower
than the mean value we detected, meaning that the contribution of salmon to PFOA exposure is higher
than it should be. An analogous calculation for PFOS, accounting for the ATSDR RfD (in absence of a
RIVM TDI) gives an exposition of PFOS through salmon meals of 0.15 ng kg-1 day-1and a contribution
of salmon to RfD of 0.27 ng kg-1 day-1, thus not giving a cause for concern as regards PFOS.
As regard antibiotics, few traces of nalidixic acid and doxycycline were found in farmed
salmons. These few detections might confirm the previous statement on the possibility of antibiotic
dilution in the open sea (Chiesa et al. 2018a).
On the other hand, the anthelmintic fenbendazole was found with high incidence and high
concentrations (if compared with the other compounds) only in farmed salmon, too (Table 3, Figure 1).
On this regard, Kim et al. (2017) confirmed that the findings of this molecule were associated with the
usage patterns of pharmaceuticals in terrestrial and aquaculture areas. Currently the MRLs for
fenbendazole are established for all ruminants, porcine, equidae and recommended for chicken tissues.
However, no information on the applicability of the analytical method to fish was available and
therefore extrapolation of MRLs to fish are not recommended (EMA/CVMP/914694/2011 2013).
Conflict of Interest
No potential conflict of interest was reported by the authors.

96
References
Berger U, Glynn A, Holmström KE, Berglund M, Ankarberg EH, Törnkvist A. 2009. Fish consumption
as a source of human exposure to perfluorinated alkyl substances in Sweden–Analysis of edible
fish from Lake Vättern and the Baltic Sea. Chemosphere 76(6): 799-804.
Chang YC, Chen WL, Bai FY, Chen PC, Wang GS, Chen CY. 2012. Determination of perfluorinated
chemicals in food and drinking water using high-flow solid-phase extraction and ultra-high
performance liquid chromatography/tandem mass spectrometry. Anal. Bioanal. Chem. 402(3):
1315-1325.
Chiesa LM, Nobile M, Panseri S, Arioli F. 2017. Antibiotic use in heavy pigs: Comparison between
urine and muscle samples from food chain animals analysed by HPLC-MS/MS. Food Chem.
235: 111-118.
Chiesa LM, Nobile M, Malandra R, Panseri S, Arioli F. 2018a. Occurrence of antibiotics in mussels
and clams from various FAO areas. Food Chem. 240: 16-23.
Chiesa LM, Nobile M, Panseri S, Arioli F. 2018b. Suitability of feathers as control matrix for
antimicrobial treatments detection compared to muscle and liver of broilers. Food Control 91:
268-275.
Chiesa LM, Nobile M, Pasquale E, Balzaretti C, Cagnardi P, Tedesco D, Panseri S, Arioli F. 2018c.
Detection of perfluoroalkyl acids and sulphonates in italian eel samples by HPLC-HRMS
Orbitrap. Chemosphere 193: 358-364.
Chiesa LM, Nobile M, Malandra R, Pessina D, Panseri S, Labella GF, Arioli F. 2018d. Food safety
traits of mussels and clams: distribution of PCBs, PBDEs, OCPs, PAHs and PFASs in sample
from different areas using HRMS-Orbitrap® and modified QuEChERS extraction followed by
GC-MS/MS. Food Addit. Contam. Part A. In press, doi: 10.1080/19440049.2018.1434900.
Council Directive (EC) No 2003/11/EC of 6 february 2003 amending for the 24th time Council
Directive 76/769/EEC relating to restrictions on the marketing and use of certain dangerous
substances and preparations (pentabromodiphenyl ether, octabromodiphenyl ether). Official
Journal of the European Union, L 42/45.
Cullon DL, Yunker MB, Alleyne C, Dangerfield NJ, O'Neill S, Whiticar MJ, Ross PS. 2009. Persistent
organic pollutants in Chinook salmon (Oncorhynchus tshawytscha): implications for resident
killer whales of British Columbia and adjacent waters. Environ. Toxicol. Chem. 28(1): 148-161.

97
Dickson LC. 2014. Performance characterization of a quantitative liquid chromatography–tandem mass
spectrometric method for 12 macrolide and lincosamide antibiotics in salmon, shrimp and
tilapia. J. Chromatogr. B, 967: 203-210.
Done HY, Halden RU. 2015. Reconnaissance of 47 antibiotics and associated microbial risks in
seafood sold in the United States. J. Hazard. Mater. 282: 10-17.
EFSA. 2008. Opinion of the Scientific Panel on Contaminants in the Food chain on Perfluorooctane
sulfonate (PFOS), perfluorooctanoic acid (PFOA) and their salts. EFSA J. 653: 1-131.
EFSA. 2011. Polycyclic Aromatic Hydrocarbons in Food. Scientific Opinion of the Panel on
Contaminants in the Food Chain. EFSA J. 724: 1-114.
EMA/CVMP/914694/2011. 2013. European public MRL assessment report (EPMAR) for
fenbendazole (extension to chicken and extrapolation to all food pro ducing species), pp. 1-9.
http://www.ema.europa.eu/docs/en_GB/document_library/Maximum_Residue_Limits_-
_Report/2013/01/WC500137339.pdf.
European Commission. 1990. Council regulation 2377/90/EC of 26 June 1990 laying down a
Community procedure for the establishment of maximum residue limits of veterinary medicinal
products in foodstuffs of animal origin. OJ L224: 1–124.
European Commission. 2002. Commission Decision 2002/657/EC of 12 August 2002 implementing
Council Directive 96/23/EC concerning the performance of analytical methods and the
interpretation of results. OJ L221: 8–36.
European Commission. 2014. European Commission, on the monitoring of traces of brominated flame
retardants in food. OJ L 65/39.
European Commission. 2015. SANTE/11945/2015. Guidance document on analytical quality control
and method validation procedures for pesticides residues analysis in food and feed, pp.1-42.
European Commission: 2017. THE EU FISH MARKET 2017 EDITION. Highlights the EU in the
world EU market supply consumption trade EU landings aquaculture production. Affairs and
Fisheries of the European Commission, pp. 1-108.
http://www.eumofa.eu/documents/20178/108446/The+EU+fish+market+2017.pdf/80acad95-
907f-4b90-b2a7-1086964df3d9.
European Parliament. 2005. Regulation (EC) 396/2005 on maximum residue levels of pesticides in or
on food and feed of plant and animal origin. OJ L 70: 1-16.

98
Fedorova G, Nebesky V, Randak T, Grabic R. 2014. Simultaneous determination of 32 antibiotics in
aquaculture products using LC-MS/MS. Chem. Pap. 68(1): 29-36.
Hamilton MC, Hites RA, Schwager SJ, Foran JA, Knuth BA, Carpenter DO. 2005. Lipid composition
and contaminants in farmed and wild salmon. Environ. Sci. Technol. 39(22): 8622-8629.
Hites RA, Foran JA, Carpenter DO, Hamilton MC, Knuth BA, Schwager SJ. 2004. Global assessment
of organic contaminants in farmed salmon. Science. 303 (5655): 226-229.
Jacobs MN, Covaci A, Schepens P. 2002. Investigation of selected persistent organic pollutants in
farmed Atlantic salmon (Salmo salar), salmon aquaculture feed, and fish oil components of the
feed. Environ. Sci. Technol. 36(13): 2797-2805.
Jia W, Shi L, Chu X. 2018. Untargeted screening of sulfonamides and their metabolites in salmon using
liquid chromatography coupled to quadrupole Orbitrap mass spectrometry. Food Chem. 239:
427-433.
Johnson LL, Ylitalo GM, Sloan CA, Anulacion BF, Kagley AN, Arkoosh MR, ... Collier TK. 2007.
Persistent organic pollutants in outmigrant juvenile chinook salmon from the Lower Columbia
Estuary, USA. Sci. Total Environ. 374(2-3): 342-366.
Kannan K, Tao L, Sinclair E, Pastva SD, Jude DJ, Giesy JP. 2005. Perfluorinated compounds in
aquatic organisms at various trophic levels in a Great Lakes food chain. Arch. Environ. Contam.
Toxicol. 48(4): 559-566.
Kelly BC, Fernandez MP, Ikonomou MG, Knapp W. 2008. Persistent organic pollutants in aquafeed
and Pacific salmon smolts from fish hatcheries in British Columbia, Canada. Aquaculture
285(1-4): 224-233.
Kim HY, Lee IS, Oh JE. 2017. Human and veterinary pharmaceuticals in the marine environment
including fish farms in Korea. Sci. Total Environ. 579: 940-949.
Lavado R, Schlenk D. 2011. Microsomal biotransformation of chlorpyrifos, parathion and fenthion in
rainbow trout (Oncorhynchus mykiss) and coho salmon (Oncorhynchus kisutch): mechanistic
insights into interspecific differences in toxicity. Aquat Toxicol. 101(1): 57-63.
Mills DH. 1989. Ecology and Management of Atlantic Salmon. London: Chapman& Hall.
Montory M, Habit E, Fernandez P, Grimalt JO, Barra R. 2010. PCBs and PBDEs in wild Chinook
salmon (Oncorhynchus tshawytscha) in the Northern Patagonia, Chile. Chemosphere 78(10):
1193-1199.

99
Norli HR, Christiansen A, Deribe E. 2011. Application of QuEChERS method for extraction of
selected persistent organic pollutants in fish tissue and analysis by gas chromatography mass
spectrometry. J. Chromatogr. A 1218(41): 7234-7241.
Pleasance S, Kelly J, LeBlanc MD, Quilliam MA, Boyd RK, Kitts DD, ... North DH. 1992.
Determination of erythromycin A in salmon tissue by liquid chromatography with ionspray
mass spectrometry. Biol. Mass Spectrom. 21(12): 675-687.
Rambla-Alegre M, Peris-Vicente J, Esteve-Romero J, Carda-Broch S. 2010. Analysis of selected
veterinary antibiotics in fish by micellar liquid chromatography with fluorescence detection and
validation in accordance with regulation 2002/657/EC. Food Chem. 123(4): 1294-1302.
Rasmussen RR, Søndergaard AB, Bøknæs N, Cederberg TL, Sloth JJ, Granby K. 2017. Effects of
industrial processing on essential elements and regulated and emerging contaminant levels in
seafood. Food Chem. Toxicol. 104: 85-94.
RIVM. 2017. National Institute for the Public Health and the Environment. Water quality standards for
PFOA. A proposal in accordance with the methodology of the Water Framework Directive
RIVM Letter report 2017-0044.
Shaw SD, Berger ML, Brenner D, Carpenter DO, Tao L, Hong CS, Kannan K. 2008. Polybrominated
diphenyl ethers (PBDEs) in farmed and wild salmon marketed in the Northeastern United
States. Chemosphere 71(8): 1422-1431.
Vuorinen PJ, Kiviranta H, Koistinen J, Pöyhönen O, Ikonen E, Keinänen M. 2014. Organohalogen
concentrations and feeding status in Atlantic salmon (Salmo salar L.) of the Baltic Sea during
the spawning run. Sci. Total Environ. 468: 449-456.
Wania F, Mackay D. 1995. A global distribution model for persistent organic chemicals. Sci. Total
Environ. 12: 211-232.

100
3.4 Levels and distribution of PBDEs and PFASs in pork from different European countries.
Published in: Food Additives & Contaminants: Part A, 2018, Volume 35, pages 2414-2423.
Luca Maria Chiesaa, Shih-Kuo Lina,b, Federica Ceriania, Sara Panseria and Francesco Ariolia
a Department of Health, Animal Science and Food Safety, University of Milan, Italy.
b Council of Agriculture, Executive Yuan, Bureau of Animal and Plant Inspection and Quarantine,
Taipei City, Taiwan.
Keywords: GC-MS/MS, LC-HRMS, PBDEs, PFASs, Pork, food safety
Abstract
Meat and meat products are included in a great number of human diets. However, the great
consumption of meat needs to be controlled for the presence of traces of contaminants. The European
Commission has not stated maximum limits (MLs) for some environmental pollutants such as the
perfluoroalkyl substances (PFASs) and polybrominated diphenyl ether (PBDEs); the European Food
Safety Authority (EFSA) Scientific Panel has recommended that more occurrence data for PFASs in
food should be collected to improve the accuracy of future exposure calculations. Therefore, the
distribution of PFASs and PBDEs traces from eight EU Member States were investigated through
liquid chromatography coupled to high-resolution mass spectrometry (LC-HRMS) and Gas
Chromatography-Mass Spectrometry (GC-MS/MS). No perfluoroalkyl substances were detected,
except PFOA, in only one Austrian sample at the concentration of 0.531 ng g-1. PBDEs were detected
in three out of 77 samples: the one came from Germany showed the presence of all congeners analyzed
in the concentration range 0.53-0.77 ng g-1, the ones from Netherland and Italy, respectively PBDE 153
(0.53 ng g-1) and PBDE 100 (0.62 ng g-1). The results show that the analyzed samples do not pose a risk
for human beings about PFASs and PBDEs. Further studies are needed to keep monitoring their
presence in foodstuff, as it has been suggested by European Commission.

101
1. Introduction
Generally, food of animal origin, plays an important role in determining the exposure of human beings
to contaminants of chemical origin (Vogt et al.,2012). The PFASs and PBDE contamination in food are
a global issue of environmental pollution. PBDEs are one class of brominated flame retardants (BFRs)
that can be released from manufacturing commercial products (e.g. acrylonitrile-butadiene-styrene and
polystyrene plastics, polyurethane foams), packaging materials, electronic devices, as computers or
televisions. PBDEs can be released into the air, water, and soil at places where they are produced or
used, but they have very low water solubility, and when these substances are released to water, they
typically bind to sediment (ATSDR, 2011). These substances generally bind strongly to soil particles,
and therefore, do not move easily through soil layers (Routti et al., 2015).
Perfluoroalkyl substances, such as perfluorooctane sulfonate (PFOS), represent a class of compounds
showing high thermal, chemical, and biological inertness. Their application began in the early 1950s
and, due to their widespread use, they are globally found in the environment, both in animals and in
humans (Routti et al., 2015). Many countries, e.g., the Germany, French, Denmark and Spain, reported
the results of PFASs analysis from human serum samples (Ingelido et al., 2010) and other animals
(Chiesa et al., 2018), where they found very low concertation with the average about 15 pg g-1 in pork
and higher in fish where they reach 45 ng g-1 (Table 1). The highest concentrations are found near
densely inhabited areas due to discharge of industrial and municipal wastewater and fire-fighting
operations (Lindstrom et al., 2011; Zacs et al., 2016). On the basis of their properties, the EFSA
proposed tolerable daily intake (TDI) levels for PFOA (1,500 ng kg-1 body weight per day) and PFOS
(150 ng kg-1 body weight per day) (EFSA, 2012) due to their adverse effects in experimental animals
and due to dietary exposure has been suggested as the main exposure route to PFASs.
Most of information regarding toxicity of PBDEs and their metabolites is from animal studies that
show developmental neurotoxicity and endocrine disruption (Costa et al., 2007; Darnerud et al., 2008).
In one study has been shown the effects of PBDEs in humans.

102
Table 1. The literature data on PFOA, PFOS and PBDE.
The authors detected four congeners (PBDEs 47, 99,100, 153) in greater than 97% of woman serum
samples analysed and found significant decreases in fecundability associated with PBDE exposure in
women (Harley et al., 2010). The EFSA Panel on Contaminants in the Food Chain (EFSA, 2011)
considers eight PBDE congeners to be of primary interest: PBDE-28, -47, -99, -100, -153, -154, -183
and -209 and the levels of PBDE-209 were the highest in almost all the food categories studied. In
2008, the United States Environmental Protection Agency (EPA, 2009) issued health assessments of
four individual PBDE congeners, PBDE-47, -153, -99 and -209, within its Integrated Risk Information
System (IRIS) program. The dominant food category that is exposed to PBDE, is food with high fat
Investigated Compounds Author Analytical technique Sample
matrix
Producing
area Concentration or range
PFOA Ingelido et al. 2010 HPLC-MS Human
serum Italy 5.77 ng g-1 h.w.
Noorlander et al. 2011 LC-MS/MS (ESI) Pork Netherland Average 15 pg g-1 w.w.
Domingo et al. 2012 UPLC-MS/MS Meat, meat
products Spain <300 pg g-1 f.w.
. Guerranti et al. 2013 HPLC-MS/MS Pork Italy n.d. <LOD w.w.
PFOS Noorlander et al. 2011 LC-MS/MS (ESI) Pork Netherland 14 pg g-1 w.w.
Domingo et al. 2012 UPLC-MS/MS Meat, meat
products Spain 34 pg g-1 f.w.
Guerranti et al. 2013 HPLC-MS/MS Pork Italy 0.74 ng g-1 w.w.
PBDE Bocio et al. 2003 GC/MS Pork, pork
products Spain 172 ng g-1 w.w.
Perelló et al. 2009 HRGC/HRMS Loin of
pork Spain 7.05 ng kg-1 f.w.
Törnkvist et al. 2011 GC-MS/MS Meat Sweden 0.023 ng g-1 f.w.
Gong et al. 2014 GC/MS Pork China 0.32173±0.75326 ng g-1 w.w.
Analytical technique: f.w.: fresh weight; h.w.: whole weight; w.w.: wet weight; n.d.: not detected.

103
content, because there is a relationship between the PBDEs levels and the fat content (EFSA, 2011). In
2012–13 an US meat and poultry (beef, pork, chicken, turkey) study has been reported that the mean
summed concentrations of seven PBDE congeners from beef, pork, chicken and turkey were 0.40, 0.36,
0.19, and 0.76 ng g–1 lipid weight (lw), suggested that the US consumer daily intake of PBDEs from
meat and poultry was 6.42 ng day–1 (Lupton SJ and Hakk H. 2017).
Meat and meat products are included in a great number of human diets. Their regular consumption
means a significant intake of proteins and essential micronutrients. In addition, pork meat is used in
many countries to produce derivative products (hams and cured meats) with high qualitative value and
relative recognition as Protected Designation of Origin (PDO) and the Protected Geographical
Indication (PGI) products.
However, the great consumption of pork meat (Table 2) needs to be controlled for the presence of
residues. EU has not stated Maximum Limits (MLs) for PBDEs and PFASs; the EFSA Scientific Panel
on Contaminants in the Food Chain (CONTAM Panel) recommended that more occurrence data for
PFASs in food should be collected to improve the accuracy of future exposure calculations
(EFSA,2008). Subsequently, the European Commission issued the Commission Recommendation
2010/161/EU on the monitoring of PFASs in food in the Member States (EFSA,2012). It’s, therefore
important, give information on the presence of these pollutants in food, mainly in those products whose
consumption is highest (Table 2). EFSA’s CONTAM Panel acknowledged that there were significant
data gaps on issues such as the contribution of different foodstuffs, among which pork, to human
exposure and that further research and data collection would be necessary (EFSA,2008).

104
Table 2. Intake of pork meat of European countries (g/capita/day) and fresh water fish.
Region Pork intake:
year 2000
Pork intake:
year 2013
Freshwater Fish intake
2000
Freshwater Fish intake
2013
European Union 113 107 6 10
Austria 165 144 5 11
Denmark 74 68 8 2
France 103 91 9 12
Germany 145 142 6 12
Netherland 149 100 5 8
Italy 103 110 5 8
Poland 131 127 4 5
Spain 175 134 5 11
Data sources: Food Supply - Livestock and Fish Primary Equivalent, provided by Food and
Agriculture Organization of the United Nations (FAO).
Toxicological studies show that PFOS and PFOA are adsorbed after oral exposure and primarily
accumulate in the serum, kidney and liver (EFSA,2008). Perfluoroalkyls tend to remain in the body
unchanged for long periods. It takes approximately 4 years for the level to halve, so the constant
exposure could increase the levels in the organism resulting in adverse overcome (ATSDR, 2009).
People could be exposed to PBDEs in a wide variety of ways, including foods or dusts/soils, air, or
through skin contact. The toxicokinetic of PBDEs depends on the number and position of the bromine
atoms: the more toxic congeners are the lower brominated PBDEs, due their ability to bioaccumulate,
mainly in body fat, consequently decabromodiphenyl ether is expected to be less toxic than lower-
brominated PBDEs. Nowadays, the effects of PBDEs are not all well established and it is not known if
PBDEs are carcinogens to human. However, the International Agency for Research on Cancer (IARC)

105
has classified PBDE as a Group 3 carcinogen based on inadequate evidence of carcinogenicity in
humans and inadequate or limited evidence in experimental animals (ATSDR, 2011). So, based on the
EFSA recommendation, in this paper we investigated the presence of PFASs through LC-HRMS and
PBDE through GC-MS/MS in pork samples from eight EU Member States, to improve the knowledge
on data gap of these compounds in literature.
2. Materials and Methods
2.1. Chemicals and reagents
The 13C-labeled PFOS (MPFOS) and 13C-labeled Perfluorononanoic acid (MPFNA), which were used
as the internal standard (IS) in this study, and the 17 PFASs derivatives the Perfluorobutyric acid
(PFBA), Perfluoropentanoic acid (PFPeA), (Perfluorobutane sulfonate acid), Perfluorohexanoic acid
(PFHxA), Perfluoroheptanoic acid (PFHpA), Perfluorooctanoic acid (PFOA), Perfluorononanoic acid
(PFNA), Perfluorodecanoic acid (PFDA), Perfluorooctane sulfonic acid (PFOS), Perfluoroundecanoic
acid (PFUdA), Perfluorododecanoic acid (PFDoA), Perfluorodecane sulfonic acid (PFDS),
Perfluorotridecanoic acid (PFTrDA), Perfluorotetradecanoic acid (PFTeDA), Perfluorohexadecanoic
acid (PFHxDA), Perfluorooctadecanoic acid (PFODA), Perfluorobutane sulfonate acid (PFBS) and
Perfluorohexane sulfonic acid (PFHxS), which were used for standard curve constructions, were
purchased from Fluka (Sigma-Aldrich, St. Louis, MO, USA). Mixtures of polybrominated diphenyl
ether (PBDE) congeners (PBDE 28; PBDE 33; PBDE 47; PBDE 99; PBDE 100; PBDE 153 and PBDE
154) and 3-fluoro-2,2',4,4',6-pentabromodiphenyl ether (FBDE) as IS for PBDEs were purchased from
AccuStandard (New Haven, USA). All standard purity was greater than 98%. Hexane and acetone
(special grade for pesticide residue analysis (Pestanal) were purchased from Fluka (Sigma-Aldrich,
St.Louis, MO, USA). Each solvent is in HPLC or analytical grade. Purified water was supplied from
Milli-Q system (Millipore, Merck KGaA, Darmstadt, Germany). The solid phase extraction cartridges
(Oasis WAX 3 mL, 60 mg) were bought from WatersTM (Milford, MA, USA). The ammonium formate,
sodium acetate, acetic acid (99.9%) and 25% ammonia solution were purchased from Fluka.
QuEChERS materials for the extraction were obtained from Supelco (SigmaeAldrich, St.Louis, MO,
USA); SupelTM QuE Citrate (EN) tubes, containing Sodium Citrate tribasic dihydrate and Sodium
Citrate dibasic sesquihydrate. Magnesium Sulphate and Sodium Chloride were used for the extraction.
SupelTM QuE-Z SEP (EN) tubes were used for the clean-up step.

106
2.2. Standard solutions
To make the stock solution, each of 17 standard PFASs compounds were prepared for 1 mg mL-1
concentration in methanol and store at -20 °C. The working solutions which were diluted from the
stock solution at concentrations of 10 ng mL-1 and 100 ng mL-1 in methanol were freshly prepared
before use and store at 4 °C.
Working solutions of PBDEs were prepared by diluting the stock solution in hexane for pesticides and
then stored at -20 °C. An uncontaminated meat sample (previously checked for the presence of PBDEs
and considered blank with a concentration of compounds less than limit of detection (LOD) used as
control was selected for all procedure's optimization steps. For meat fortification, 1.0 g of the control
sample was spiked by adding an appropriate volume of the standard working solution to cover the
concentration range from 0.5 to 10 ng g-1 (five calibration points: 0.5, 1, 2, 5, 10 ng g-1) for PBDEs in
relation to literature to realise the matrix-matched calibration curves.
2.3. Sample collection
The muscle samples belonged to pigs from the food chain weighing 130 to 160 kg, and, to minimize
the damage to the carcass, the used muscles were obliquus internus abdominis and obliquus externus
abdominis. Seventy-seven frozen samples from eight different European countries (Austria, Denmark,
French, Germany, Holland, Italy, Poland and Spain) were collected. The samples were homogenized
and then stored in -20 °C refrigerator; they were defrosted before being analyzed. The date of sample
collection was from Dec 5th, 2016 to May 5th, 2017.
2.4. Sample extraction of PFASs
Weight 1.0 g of homogenized sample into a 15-mL polypropylene screw-cap centrifuge tube. Add
50µL of internal standard solution (which contains 100 ng mL-1 MPFNA and 100 ng mL-1 MPFOS in
methanol) into the tube, to proceed a final concentration of 5 ng mL-1 over the matrix. Shake the tube
by hand to mix it with the sample matrix. Add 10 mL of acetonitrile, vortex for 1 minute, then put the
tube into the water tank with ultrasonication for 30 minutes in room temperature. Ultrasonicated
samples were centrifuged at 4,612×g, 4 °C, for 10 minutes. Transfer all supernatant liquid into the
evaporation flask and dried it with rotary vacuum evaporator at 35 °C. Add 10 mL of Milli-Q water
into flask and resuspend the analyte by vortex for 10 seconds. Load the re-suspended liquid into

107
WatersTM WAX SPE cartridge, which was previously conditioned with 3 mL of 0.05mL mL-1 NH4OH
in methanol, followed with 3 mL of methanol, and 3 mL of Milli-Q water. After sample liquid running
out through the cartridge, flush the cartridge through 3mL of 25mM acetate buffer pH 4.5 to release
proteins and lipids from cartridge, followed with 2 mL of methanol. Elute the cartridge with 3 mL of
0.05mL mL-1 NH4OH in methanol and transfer the eluted liquid into evaporation flask then dried it
with rotary vacuum evaporator at 35 °C. The dried analyte was solved with 100 µL of
methanol:ammonium formate 20 mM (10:90 v/v) to reconstruct the final volume. Transfer liquids into
a screw vial and perform for the analysis with LC-HRMS.
For the estimation of recovery ratio, use blank pork samples of 1.0 g, divided into group A and B. In
Group A, spike into matrix with 50 µL of internal standard solution (which contains 100 ng mL-1
MPFNA and 100 ng mL-1 MPFOS in methanol) into the tube, to proceed a final concentration of 5 ng
mL-1, and with 10 µL of 17 PFASs mixture (each single compound contains 100 ng mL-1) to proceed a
final concentration of 1 ng mL-1, then run the extraction procedure. In the Group B, spike the internal
standard solution of 50 µL into matrix, then run the extraction procedure. While solid phase extraction
finished, spike the 10 µL of 17 PFASs mixture into eluted liquid. Use LC-HRMS to determine
concentration of each PFASs then calculate the ratio of same PFASs between Group A and B.
For coefficient of variation of intra-day (repeatability), and inter-day (reproducibility) evaluation, use
blank pork samples of 1.0 g, spike into matrix with 50 µL of same internal standard solution into the
tube, to proceed a final concentration of 5 ng mL-1, and 10 µL of 17 PFASs mixture (each single
compound contains 100 ng mL-1) to proceed a final concentration of 1 ng mL-1, then run the extraction
procedure. Use LC-HRMS to determine the concentration of each PFASs from each tube and calculate
the value of each PFASs for the coefficient of variation of intra-day (repeatability) and inter-day
(reproducibility).
2.5. Sample extraction of PBDEs
The extraction of PBDEs was performed using the QuEChERS (quick, easy, cheap, effective, rugged
and safe) method. Briefly, 1.0 g of sample was homogenized and transferred to a QuEChERS
extraction tube, then a solution containing the ISs (FBDE) was added to the sample to a final
concentration of 100 ng g-1. 10 mL of acetonitrile were added as extraction solvent; the tube was
shaken for 1 min using a vortex and centrifuged for 10 min at 4,612×g at 4 °C. Later, the supernatant

108
was transferred to a QuEChERS clean-up tube, shaken and centrifuged at the same conditions
described above. The extract was collected, divided into two aliquots and dried under vacuum in a
centrifugal evaporator at a temperature of 35 °C. The residue was dissolved in 200 µL hexane for the
analysis by GC-MS/MS.
2.6. LC-HRMS Orbitrap analyses
The LC-HRMS analysis was performed by an HPLC system (Thermo Fisher Scientific, San Jose, CA,
USA), composed with a Surveyor MS quaternary pump with a degasser, a Surveyor AS auto-sampler
with a column oven and a Rheodyne valve with a 20-μL loop. Chromatographic separation was carried
out using a Synergi Hydro RP reverse-phase HPLC column (150 x 2.0 mm, internal diameter 4 µm),
with a C18 guard column (4 x 3.0 mm; Phenomenex, Torrance, CA, USA). To minimize PFASs
background contamination in the system, use stainless steel column tubes and peeks. Moreover, since
PFOA and PFOS were always present in the blank of the chromatographic system, we mounted a small
Megabond WR C18 column (5 cm x 4.6 mm, i.d. 10 µm) between pump and injector to delay our
analytes of two minutes than those already present in the system.
The mobile phase used for the gradient consisted of a programmed mixture of solvents A (aqueous
ammonium formate 20 mM), and B (Methanol). The elution started with 10% B, which increased to
40% in 4 min. Subsequently, the mobile phase B was gradually increased to 95% at the 12th minute,
which remained constant up to the 18th minute. The initial conditions were reached at the 20th minute,
with an equilibration time of 7 min. The run was performed at flowrate of 0.3 mL min-1.
The detector was a Thermo Q-Exactive Plus (Thermo Scientific, San Jose,CA, USA), equipped with an
heated electrospray ionization (HESI) source. Capillary temperature and vaporizer temperature were set
at 330 °C and 280 °C, while the electrospray voltage was set at 3.50 kV operating in negative mode.
Sheath and auxiliary gas (nitrogen) were set at 35 and 15 arbitrary units, with S lens RF level of 60.
Xcalibur 3.0 software (Thermo Fisher Scientific, San Jose, CA, USA) was used to control the HPLC-
HRMS system. The exact mass of the compounds was calculated using Qualbrowser program in
Xcalibur 3.0 software. Instrument calibration was done every analytical session with a direct infusion
of a LTQ Velos ESI Negative Ion Calibration Solution (Pierce Biotechnology Inc., Rockford, IL,
USA).

109
The Full scan (FS) acquisition was combined with an Independent Data Acquisition (DIA) mode,
providing the MS2 spectra for confirmatory response, based on an inclusion list.
The resolving power of FS was set at 70,000 FWHM. In consideration of molecular weight to our
compound list, a scan range of m/z 200–950 was chosen; the automatic gain control (AGC) was set at 1
x 106 and the maximum injection time was 200 ms. The DIA segment operated in negative mode at
35,000 FWHM.
Detection of analytes was based on retention time of target compounds, on calculated exact mass of the
deprotonated molecular ions, and at least one specific and typical fragment (Table 3). The formula of
the compounds, with the exact theoretical mass of the parents and the diagnostic transition used to
confirm the different PFASs are reported in Table 3. Acquisition data were recorded and elaborated
using Xcalibur™ software from Thermo Fisher.
Table 3 Formula, exact theoretical mass of the parents, diagnostic transitions and validation parameters
of the selected PFASs. The electrospray ionization (ESI) is set as negative.
Compou
nd* Name Formula
Exact mass
[m/z]
Transition
[m/z]
LOD
(pg g-
1)
LOQ
(pg g-
1)
Recove
ry
(%)
intra-day CV
(%)
(n=5)
inter-day CV
(%)
(n=7)
PFBA Perfluorobutyric
acid C4HF7O2 212.9792 168.98836 10 30 99 6 20
PFPeA Perfluoropentanoi
c acid C5HF9O2 262.97601 218.98560 10 30 104 15 14
PFBS Perfluorobutane
sulfonate acid
C4F9HO3
S 298.94299 98.95434 5 15 119 19 20
PFHxA Perfluorohexanoi
c acid
C6HF11O
2 312.97281 268.98288 10 30 112 11 15
PFHpA Perfluoroheptanoi
c acid
C7HF13O
2 362.96962 318.97949 5 15 109 7 10
PFHxS Perfluorohexane
sulfonic acid
C6F13HO
3S 398.9366 98.95437 5 15 101 19 20
PFOA Perfluorooctanoic
acid
C8HF15O
2 412.96643 368.97681 8 24 114 8 11
PFNA Perfluorononanoi
c acid
C9HF17O
2 462.96323 418.97385 20 60 110 8 11
PFOS Perfluorooctane
sulfonic acid
C8F17HO
3S 498.93022 79.95598 10 30 84 13 17
PFDA Perfluorodecanoi
c acid
C10HF19
O2 512.96004 468.97064 28 84 87 5 9

110
PFUdA Perfluoroundecan
oic acid
C11HF21
O2 562.95684 518.96729 30 90 87 13 20
PFDS Perfluorodecane
sulfonic acid
C10F21H
O3S 598.92383 79.95593 50 150 81 10 15
PFDoA Perfluorododecan
oic acid
C12HF23
O2 612.95365 568.96436 5 15 80 12 20
PFTrDA Perfluorotridecan
oic acid
C13HF25
O2 662.95046 618.96094 30 90 80 8 16
PFTeDA Perfluorotetradec
anoic acid
C14HF27
O2 712.94726 668.95795 50 150 83 10 15
PFHxDA Perfluorohexadec
anoic acid
C16HF31
O2 812.94088 768.95093 50 150 80 9 13
PFODA Perfluorooctadeca
noic acid
C18HF35
O2 912.93449 868.94507 50 150 80 16 20
*= reported in alphabetic order
2.7. GC-MS/MS analyses
Triple quadrupole mass spectrometry (QqQ) in electron ionization (EI) mode was used for the
simultaneous detection and quantification of PBDE in meat samples.
A GC Trace 1310 chromatograph coupled to a TSQ8000 triple quadrupole mass detector (Thermo
Fisher Scientific, Palo Alto, CA, USA) was used to confirm and quantify residues in meat samples by
using a fused-silica capillary column Rt-5MS Crossbond-5% diphenyl 95% dimethylpolysiloxane (35
m x 0.25 mm i.d., 0.25 μm film thickness, Restek, Bellefonte, PA, USA). The oven temperature
program was as follows: initial temperature of 80 °C, held for 3 min, and increased to 170 °C at 10 °C
min-1; then, increased from 170 °C to 190 °C at 3°C min-1, and raised to 240 °C at 2 °C min-1, before
being ramped to 280 °C at 3 °C min-1 and finally from 280 °C to 310 °C at 10°C min-1 and held at this
temperature for 5 min. The carrier gas (Helium, purity higher than 99.999%) was in constant flow
mode at 1.0 ml min-1. A volume of 1 μL was injected using a programmed temperature vaporiser
injector (PTV) in splitless mode with a 1-min splitless period and the following inlet temperature
programme: 80 °C (0.05 min), 14.5 °C s-1 to 200 °C (1 min) and 4.5 °C s-1 to 320 °C (12 min –
cleaning phase). A baffle liner (2 mm × 2.75 mm × 120 mm, Siltek-deactivated; Thermo Fisher
Scientific) was used. The transfer line was maintained at 270 °C and the ion source at 250 °C. The
electron energy and emission current were set to 70 eV and 50 μA, respectively. The scan time was 0.3
s and the peak width of both quadrupoles was 0.7 Da full widths at half maximum. Argon was used as a

111
collision cell gas at a pressure of 1.5 mTorr. The QqQ mass spectrometer was operated in selected
reaction monitoring mode (SRM) detecting two-three transitions per analyte. Identification of PBDEs
was carried out by comparing sample peak relative retention times with those obtained for standards
under the same conditions and the MS/MS fragmentation spectra obtained for each compound.
The XcaliburTM processing and instrument control software program and Trace Finder 3.0 for data
analysis and reporting (Thermo Fisher Scientific) were used.
2.8. Analytical performances and method validation
The validation was carried out following the European Commission SANTE/2015 guideline (SANTE,
2015). SANTE/2015 has been superseded by SANTE/2017 (SANTE, 2017). For the PFASs, the
method showed high specificity, without interference signals close to the retention time of the analytes,
and consequently showed a high signal-to-noise (S/N) ratio in presence of analytes even at
concentrations in the order of pg g-1. Selectivity demonstrated a good compliance with the relative
retention times for each analyte, which in our case were within 2.5% tolerance, with a S/N ratio greater
than 3 when compared with the standard solution mix, both in FS and MS2 chromatograms. Moreover,
diagnostic fragments showed an ion ratio within the recommended tolerances (European Commission,
2002).
The mean recoveries for all analytes ranged between 80 and 117%, indicating the efficiency of the
extraction protocol.
By searching the S/N ratio of each sample, the LOD values of 17 PFASs were from 5 pg g-1 to 50 pg g-
1, the limit of quantification (LOQ) values were from 15 pg g-1 to 150 pg g-1.
Matrix validation curves were linear over the working range demonstrating a good fit for all analytes
with an R2 value greater than 0.99. Precision in terms of intra- and inter-day repeatability (Thompson et
al., 2010) was calculated using one-way analysis of variance ANOVA, expressed as coefficients of
variation (CVs), and was below 19 and 21%, respectively.
About PBDE, the selectivity of the method was evaluated by injecting extracted blank meat samples.
The absence of interferences was proved by the lack of peaks with a S/N ratio higher than 3 at the
retention times of the target compounds. Pork samples, previously analysed and checked for the
absence of all PBDEs, were used as control samples during the optimisation and validation procedure.

112
For the LOQ of the methods, we used the lowest validated spiked level meeting the requirements of
recovery within the range of 70–120% and an RSD less than or equal to 20%, as defined by the
European Commission (EC, 2002). Finally, the extraction methods were also evaluated for their
repeatability, linearity and recovery. Recoveries were calculated at LOQ for all compounds. (Table 4).
The repeatability as CV% was calculated by analysing six replicates at the same fortification level.
Table 4. The retention times (Tr), precursor ions (m/z), product ions (m/z), Collision Energy (V),
Recovery (%), LOQ (ng g-1) of investigated polybrominated diphenyl ethers (PBDE).
Compound Name Formula
Mass
[m/z]
Tr
minute
Precursor ion
[m/z]
Product ion
[m/z]
Collision
energy
(V)
LOQ
ng g-1
Recovery
(%)
Intra-
day
CV
(%)
n=6
inter-
day
CV
(%)
n=6
PBDE 28
2,4,4'-
Tribromodiphenyl
ether
C12H7Br3O 406.9 32.35
248
246
408
139
139
246
30
30
10
0.5 88
4
8
PBDE 33
2,3',4'-
Tribromodiphenyl
ether
C12H7Br3O 406.9 31.95
246
248
406
139
139
246
30
30
10
0.5 89
4
10
PBDE 47
2,2',4,4'-
Tetrabromodiphenyl
ether
C12H6Br4O 485.8 38.52
326
328
482
217
219
326
30
30
20
0.5 91
3
7
PBDE 99
2,2',4,4',5-
Pentabromodiphenyl
ether
C12H5Br5O 564.7 41.27
404
406
563
297
297
404
30
30
20
0.5 89
1
5
PBDE 100
2,2',4,4',6-
Pentabromodiphenyl
ether
C12H5Br5O 564.7 42.01
404
406
564
297
297
404
30
30
10
0.5 90
7
10
PBDE 153
2,2',4,4',5,5'-
Hexabromodiphenyl
ether
C12H4Br6O 643.6 43.70
482
484
642
324
377
482
30
30
20
0.5 93
3
6
PBDE 154
2,2',4,4',5,6'-
Hexabromodiphenyl
ether
C12H4Br6O 643.6 44.91
484
486
644
324
326
484
30
30
20
0.5 92
3
2
*=The precursor ion and product ion value reported in bold indicates the diagnostic transition.

113
3. Results and discussion
3.1. Method validation parameters
The methods showed high specificity, without any interference close to the retention time of each
compound, and consequently a S/N ratio great than or equal to 3 in the presence of analytes was
confirmed, even at the lowest detectable concentration demonstrating good selectivity. Matrix
validation curves show good linearity over the working range with a good fit (R2 greater than 0.99) for
all compounds. The mean recoveries (from 80 to 119%), with the other validation parameters, are
reported in Tables 1 and Table 2. The CVs % are below 19% and 21%, satisfying the criteria required
by the European Commission (EC, 2002) and specified by Thompson et al, (2010). Regarding the LOD
and LOQ for PFASs and for PBDEs, our satisfactory results show high method sensitivity for the
selected compounds both for LC-HRMS and GC-MS/MS analyses.
3.2. Application to pork samples
Overall results in terms of number detected, concentration levels and distribution of contaminant
residues in the pork samples investigated are summarised in Table 5.
Table 5. Quantification results of chemical residues from different production areas.
Production area N° of Sample Analyte detected
Concentration
(ng g-1 fresh weight)
Austria 7 PFOA (n=1) 0.53
Denmark 8 n.d. -
France 8 n.d. -

114
Germany 10
PBDE 28
PBDE 33
PBDE 47
PBDE 99
PBDE 100
PBDE 153
PBDE 154
(n=1)
0.57
0.73
0.60
0.74
0.77
0.70
0.53
Netherland 8 PBDE 153 (n=1) 0.53
Italy 20 PBDE 100 (n=1) 0.62
Poland 8 n.d. -
Spain 8 n.d. -
n.d.=Not detected
Based on results of 77 samples, only PFOA was detected in an Austrian sample with the concentration
of 0.531 ng g-1. PBDEs were detected in three out of 77 samples; only one, coming from Germany,
showed the presence of all congeners analysed with the range concentration from 0.53 to 0.77 ng g-1. In
the other two samples, coming from Netherland and Italy, only one congener was detected, respectively
PBDE 153 (0.53 ng g-1) and PBDE 100 (0.62 ng g-1).
Based on our results some consideration could be made. EU has not stated MLs for PBDEs in food, due
to the risk characterization has not been defined about PBDEs in people, thought recent studies have
evaluated associations between PBDE concentrations in human tissues (e.g., blood, human milk) and
health effects (immunological, reproductive, developmental, genotoxic and carcinogenic effects)
(ATSDR, 2011). Comparing our results on literature, in this work has been found very low
concentration than other study about the presence of PBDEs in pork meat coming from Spain (109 ng
g-1) (Bocio et al., 2003), Catalonia (32.3 ng g-1) (Perellò et al., 2009); Sweden (63.6 ng kg-1) (Domingo
et al., 2004) and (8.074 ng g-1) China (Gong et al., 2014).
Due to their lipophilicity, Törnkvist et al., 2011 have shown that the highest contributors to the total of
PBDEs intake were fish (39%) and dairy products (31%), followed by meat (17%). Vouriner et al.

115
2012, studied the biomagnification of PBDEs in Atlantic salmon from three areas of the Baltic Sea and
they demonstrated that PBDE accumulation is dependent on both age and fat content.
Humans can be exposed to PBDEs in a wide variety of ways. The main routes of exposure is from the
contaminated foods, environment (air, soils) and skin contact with contaminated products. Several
studies indicate that infants and toddlers have higher exposures to PBDEs compared to children or
adults, due to their smaller weight and their frequent skin contact with the floor dust (ATSDR, 2011).
Information on PBDE dietary intake is very scarce in literature. It is also important to note that we
analysed fresh meat, whereas preparation and different cooking methods can influence the levels of
contaminants and so also consumers exposure. It has been observed that during the cooking process
PBDE losses were higher than other POPs probably to lipid remove during the process. (Perello et
al.,2009). Pork is widely used into the market, mostly due to its products. In almost all the places that
we have included in our paper we have distinctive derived products in which the amount of PBDEs
could be increase/reduce to the industrial processing method (ATSDR, 2011). On the base on this
consideration we could suppose that the human intake, on the base on our results, don’t pose a risk for
human beings. It reasonable defined that a risk could be present due to the long exposure to this
compound.
About PFOA we could do a similar consideration. PFOA are a class of chemical compounds that due to
their chemical structure, are very stable in the environment and resistant to biodegradation and
hydrolysis (ATSDR, 2009). In living organisms, perfluoroalkyls, unlike PBDEs, bind to protein
albumin in blood, liver, and eggs, but do not accumulate in fat tissue. Due to their hydrolytic properties
are more present in water environment and tend to be much present in fish than other products.
PFOS in our samples did not appear concerning, in fact it was found to be predominant compound in
fish samples (Chiesa et al., 2018; Squadrone et al., 2015, Guerranti et al., 2013), although other studies
have found low concentrations in pork (15 pg g-1; 0.74 ng g-1) (Guerranti et al., 2013; Noorlander et al.,
2011).
The PFOA concentrations was found in only one sample coming from Austria (0.531 ng g-1). Our
results provide reasons for low concern. Based on what has been reported in literature, our
concentration looks under than other study made in Italy (less than 500 pg g-1) (Guerranti et al., 2013);
Belgium and Spain (55 pg g-1) (Corneli et al., 2012; Ericson et al., 2008); and Norway (15 pg g-1)

116
(Haug., 2010). The Highest concentration has been found in Fat fish (1.678 pg g-1) (Berger et al.,
2009). EFSA Scientific Panel on Contaminants in the Food Chain recommended that more occurrence
data for PFASs in food should be collected to improve the accuracy of future exposure calculations
(EFSA, 2008). Subsequently, the European Commission issued the Commission Recommendation
2010/161/EU on the monitoring of PFASs in food in the Member States (EFSA, 2012). This paper
gives a contribute about the knowledge of their presence in foodstuff. On the bases of these results,
there is no risk for human beings, but further studies are needed to keep monitoring their presence in
foodstuff, as it has been suggested by EU.
Conflicts of Interest Statement
No potential conflict of interest was reported by the authors.
References:
Agency for Toxic Substances and Disease Registry. Draft Toxicological Profile for Perfluoroalkyls.
Atlanta, GA: ATSDR, 2009. Available at http://www.atsdr.cdc.gov/toxprofiles/tp200.pdf. Accessed
March 8, 2018.
Agency for Toxic Substances and Disease Registry. Toxicological Profile: Polybrominated
Diphenyl Ethers (PBDEs). Atlanta, GA: ATSDR, 2011. Available at
http://www.atsdr.cdc.gov/toxprofiles/TP.asp?id=901&tid=183. Accessed March 8, 2018.
Berger U, Glynn A, Holmström KE, Berglund M, Ankarberg EH, Törnkvist A. 2009. Fish consumption
as a source of human exposure to perfluorinated alkyl substances in Sweden–Analysis of edible fish
from Lake Vättern and the Baltic Sea. Chemosp. 76:799-804.
Bocio A, Llobet JM, Domingo JL, Corbella J, Teixidò A, Casas C. 2003. Polybrominated diphenyl
ethers (PBDEs) in Foodstuffs: Human exposure through the diet. J. Agric. Food Chem. 51:3191-95.
Chiesa L, Nobile M, Pasquale E, Balzaretti C, Cagnardi P, Tedesco D, Panseri S, Arioli F. 2018.
Detection of perfluoroalkyl acids and sulphonates in Italian eel samples by HPLC-HRMS Orbitrap.
Chemosp.193:358-64.

117
Cornelis C, D'Hollander W, Roosens L, Covaci A, Smolders R, Van Den Heuvel R, Govarts E, Van
Campenhout K, Reynders H, Bervoets L. 2012. First assessment of population exposure to
perfluorinated compounds in Flanders, Belgium. Chem. 86:308-14.
Costa LG, Giordano G. 2007. Developmental neurotoxicity of polybrominated diphenyl ether (PBDE)
flame retardants. Neurotoxicol. 28:1047-67.
Darnerud PO. 2008. Brominated flame retardants as possible endocrine disrupters. Internat. J. Androl.
31:152-60.
Domingo JL. 2004. Human exposure to polybrominated diphenyl ethers through the diet. J.
Chromatogr. A.1054 (1-2): 321-26.
EFSA. 2008. Opinion of the scientific panel on contaminants in the food chain on perfluorooctane
sulfonate (PFOS), perfluorooctanoic acid (PFOA) and their salts. EFSA J. 653:1-131.
EFSA. 2011. Scientific Opinion on Polybrominated Diphenyl Ethers (PBDEs) in Food1 EFSA Panel
on Contaminants in the Food Chain (CONTAM). EFSA J. 9 (5): 2156.
EFSA. 2012. Perfluoroalkylated substances in food: occurrence and dietary exposure. EFSA J. 10 (6):
2743-97.
EPA. (European Protection Agency) 2009. Polybrominated Diphenyl Ethers (PBDEs) Action Plan.
Environmental protection agency.
https://www.epa.gov/sites/production/files/201509/documents/pbdes_ap_2009_1230_final.pdf
Accessed 16 September 2018.
Ericson I, Marti-Cid R, Nadal M, Van Bavel B, Lindstrom G, Domingo JL.2008. Human exposure to
perfluorinated chemicals through the diet: intake of perfluorinated compounds in foods from the
Catalan (Spain) market. J. Agric. Food Chem. 56 (5):1787-94.
European Commission. 2002. Commission Decision of 12 August 2002 implementing Council
Directive 96/23/EC concerning the performance of analytical methods and the interpretation of results
(2002/657/EC). Off. J. Eur. Communities. L221/8, 8-36.
European Commission. 2015. SANTE/11945/2015. Guidance document on analytical quality

118
control and method validation procedures for pesticides residues analysis in food and feed, pp.1-42.
European Commission. 2017. SANTE/11813/2017. Guidance document on analytical quality control
and method validation procedures for pesticide residues and analysis in food and feed, pp.1-46.
Gong Y, Wen S, Zheng C, Peng X, Li Y, Hu D, Peng L. 2014. Potential risk assessment of
polybrominated diphenyl ethers (PBDEs) by consuming animal-derived foods collected from interior
areas of China. Environ. Sci Pollut. Res. Int. 22 (11): 8349-58.
Guerranti C, Perra G, Corsolini S, Focardi SE. 2013. Pilot study on levels of perfluorooctane sulfonic
acid (PFOS) and perfluorooctanoic acid (PFOA) in selected foodstuffs and human milk from
Italy. Food Chem. 140 (1-2):197-203.
Harley KG, Marks AR, Chevrier J, Bradman A, Sjödin A, Eskenazi B. 2010. PBDE Concentrations in
Women’s Serum and Fecundability. Environ. Health Perspect. 118(5) :699-704.
Haug LS, Salihovic S, Jogsten IE, Thomsen C, van Bavel B, Lindström G, Becher G.2010. Levels in
food and beverages and daily intake of perfluorinated compounds in Norway. Chem. 80 (10):1137-43.
Ingelido A, Marra V, Abballe A, Valentini S, Iacovella N, Barbieri P, Porpora MG, Domenico Ad, De
Felip E. 2010. Perfluorooctanesulfonate and perfluorooctanoic acid exposures of the Italian general
population. Chem. 80 (10):1125-30.
Lindstrom AB, Strynar MJ, Libelo EL.2011. Polyfluorinated Compounds: Past, Present, and Future.
Environ. Sci Technol. 45:7954-61.
Lupton SJ, Hakk H. 2017. Polybrominated diphenyl ethers (PBDEs) in US meat and poultry: 2012–13
levels, trends and estimated consumer exposures, Food Additives & Contaminants Part A, 34:1584-
1595.
Noorlander CW, Leeuwen SPJV, Biesebeek JD, Mengelers MJB Zeilmaker MJ. 2011. Levels of
Perfluorinated Compounds in Food and Dietary Intake of PFOS and PFOA in The Netherlands. Agric.
Food Chem. 59(13):7496–505.
Perelló G, Martì-Cid R, Castell V, Llobet JM, Domingo JL.2009. Concentrations of polybrominated
diphenyl ethers, hexachlorobenzene and polycyclic aromatic hydrocarbons in various foodstuffs before
and after cooking. J. Food Chem. Toxicol. 47 (4) :709-15.

119
Pérez F, Llorca M, Köck-Schulmeyer M, Škrbić B, Oliveira LS, da Boit Martinello K, Al-Dhabi NA,
Antić I, Farré M, Barceló D. 2014. Assessment of perfluoroalkyl substances in food items at global
scale. Environ. Res.135:181-9.
Routti H, Krafft B, Herzke D, Eisert R, Oftedal O. 2015. Perfluoroalkyl substances detected in the
world's southernmost marine mammal, the Weddell seal (Leptonychotes weddellii). Environ.
Pollut.197:62-7.
Squadrone S, Ciccotelli V, Prearo M, Favaro L, Scanzio T, Foglini C, Abete MC. 2015.
Perfluorooctane sulfonate (PFOS) and perfluorooctanoic acid (PFOA): emerging contaminants of
increasing concern in fish from Lake Varese, Italy. Environ Monit Assess 187:438-44.
Thompson J, Lorber M, Toms LML, Kato K, Calafat AM, Mueller JF. 2010. Use of simple
pharmacokinetic modeling to characterize exposure of Australians to perfluorooctanoic acid and
perfluorooctane sulfonic acid. Environ. Int. 36:390-7.
Törnkvist A, Glynn A, Aune M, Darnerud PO, Ankarberg EH. 2011. PCDD/F, PCB, PBDE, HBCD
and chlorinated pesticides in a Swedish market basket from 2005 - Levels and dietary intake
estimations. Chem. 83:193-9.
Vogt R, Bennett D, Cassady D, Frost J, Ritz B, Hertz-Picciotto I. 2012. Cancer and non-cancer health
effects from food contaminant exposures for children and adults in California: a risk assessment.
Environ. Health. 11:83-96.
Vuorinen PJ, Keinänen M, Kiviranta H, Koistinen J, Kiljunen M, Myllylä T, Pönni J, Peltonen H,
Verta M, Karjalainen J. 2012. Biomagnification of organohalogens in Atlantic salmon (Salmo salar)
from its main prey species in three areas of the Baltic Sea. Science Tot. Envir. 421:129-43.
Zacs D, Bartkevics V. 2016. Trace determination of perfluorooctane sulfonate and perfluorooctanoic
acid in environmental samples (surface water, wastewater, biota, sediments, and sewage sludge) using
liquid chromatography – Orbitrap mass spectrometry. J. Chromatog. A. 1473:109-21.

120
3.5. Presence of organic halogenated compounds, organophosphorus insecticides and polycyclic
aromatic hydrocarbons in meat of different game animal species from an Italian subalpine area.
Published in, Food Additives & Contaminants Part A, Volume 36, 2019, Pages 1244-1252.
Francesco Arioli a ¥, Federica Ceriania¥, Maria Nobile a ¥, Roberto Viganò b, Martina Besozzi b, Sara
Panseri a*, Luca Maria Chiesa a
a Department of Health, Animal Science and Food Safety, University of Milan, Via Celoria 10, 20133
Milan, Italy.
b Studio Associato ALPVET, Consulenza veterinaria faunistica e ambientale, Busto Arsizio (Va).
* Corresponding author: Sara Panseri, Department of Health, Animal Science and Food Safety,
University of Milan, Via Celoria 10, 20133 Milan, Italy. Phone: 0250317931; Fax: 00390250317941;
E-mail: [email protected]
¥: These authors equally contributed to the work.
Keywords: game animals, non-dioxin-like polychlorobiphenyls, organochlorine insecticides,
organophosphorus insecticides, polybromodiphenyl ethers, perfluoroalkyl substances, polycyclic
aromatic hydrocarbons.
Research Highlights:
• NDL PCBs, PBDEs, PFASs, PAHs, insecticide presence was monitored in game animals
• The muscle of red deer, roe deer, chamois and wild boar from Piedmont was analysed
• An endemic presence of PCBs, organochlorine and organophosphorus pesticides was found
• Generally, the highest prevalence of quantifiable contaminants was found in red deer.
• The highest concentrations of NDL PCBs and phorate were detected in wild boar.

121
Abstract
The exposure to several compounds such as polychlorinated biphenyls (PCBs), organochlorine
pesticides (OCPs), organophosphorus pesticides (OPs), polycyclic aromatic hydrocarbon (PAHs),
perfluoroalkyl substances (PFASs) and polybrominated diphenyl ethers (PBDEs) is a public health
issue. The European Union (EU) recommended that its member states monitor the presence of
emerging contaminants, like PBDEs and PFASs, in food and in the environment to obtain an accurate
estimation of exposure. The tissues of wild animals exposed to these compounds can represent a
suitable indicator of environmental pollution. The aim of this work is to evaluate: i) the occurrence of
PCBs, PBDEs, PFASs, PAHs, OCPs and OPs in four game animals’ meat (chamois, red deer, wild
boar and roe deer); ii) interspecies differences and iii) human exposure. Muscle samples from seventy-
nine animals were collected during the hunting season in a Northern Italy mountain area at altitudes
ranging from 300 to 2500 meters above sea level. The analyses were performed with gas
chromatography-mass spectrometry (GC-MS/MS) and ultra-performance liquid chromatography -
tandem mass spectrometry (UHPLC-MS/MS). No PBDEs were found in the samples. OCPs, OPs and
PCBs were detected in almost all samples at different concentration ranges, showing higher frequency
in ungulate species than in wild boar. PFAs were found only in wild boar. Anthracene and
benzopyrene, among PAHs, were found only in chamois at low concentrations. The lack of an accurate
pattern of exposure as well as variable consumption by hunters does not allow accurate risk
characterisation. However, a low risk for consumers can be indicated due to the frequent detection of
contaminants at trace levels, the scarce prevalence of high concentrations of some contaminants and the
low consumption of game animal meat. In conclusion, the organisation of a control plan on residues in
game animals would be advisable.

122
1. Introduction
The exposure to polychlorinated biphenyls (PCBs), organochlorine pesticides (OCPs),
organophosphorus pesticides (OPs), polycyclic aromatic hydrocarbons (PAHs) perfluoroalkyl
substances (PFASs) and polybrominated diphenyl ethers (PBDEs) is a major issue for public health.
Recently, the European Union (EU) recommended that Member States monitor the presence of
emerging contaminants like PBDEs and PFASs in food and in the environment to obtain an accurate
estimation of exposure (European Commission 2014; EFSA 2018a). PBDEs reduce the flammability of
combustible materials and are used in a wide range of products (electronics, vehicles, construction
materials, etc.).
Directive 2003/11/EC (European Commission 2003) revising Directive 76/769/EEC on the marketing
and use of certain dangerous substances, forbade preparation and sale of two commercial mixtures of
PBDEs, known as penta BDE and octa BDE, in concentrations higher than 0,1 % by mass. Since July
2006, under Directive 2002/95/EC, all electrical and electronic equipment may no longer contain PBBs
and PBDEs, at any concentration, other than deca PBDEs. PFASs have been used since the 1950s to
make oil- and water-proof paper and textiles, in food packaging and fire-fighting foams (Paul et al.
2008). Some OPs, like e.g. chloripyrifos and ethoprophos, are still approved for use on plants in the EU
(European Commission 2005b). In the past, compounds like PCBs and OCPs were widely used in
industry or agriculture. They tend to be transported by atmospheric circulation, thus contaminating
areas far from the place of emission (Wania and Mackay 1996). Although several compounds have
been banned in Italy since the 1970s, some are still present in the environment and bioaccumulate in
fatty tissues (Vallack and Giordano 1998). PBDE toxicity includes neurotoxicity and endocrine
disruption (Costa et al. 2007; EFSA 2011); eight of them are considered of primary interest by the EU
and relevant toxicological data are available on four of them (BDE-47; BDE-99; BDE-153 and BDE-
209): the main targets are the liver, thyroid hormone, and the reproductive and nervous system.
Moreover, PBDEs cause DNA damage through the induction of reactive oxygen species (EFSA 2011).
Perfluorooctane sulfonate (PFOS) and perfluorooctanoic acid (PFOA) are involved in hepatotoxicity,
developmental toxicity, immunotoxicity and reproductive and hormonal effects. (EFSA 2018a); dioxin-
like PCBs (DL-PCBs) and non-dioxin-like PCBs (NDL-PCBs) elicit various toxicological profiles,
with neurological, neuroendocrine, endocrine and immunological effects (EFSA, 2005). However, no
health-based guidance values for humans could be defined for NDL-PCBs because they usually occur

123
with the more toxic DL-PCBs, muddling the interpretation of their effects. OCPs and OPs are involved
in neurological and endocrine effects (Ray, 2010; Richardson, 2010), as shown by studies on laboratory
animals. For NDL-PCBs, the EU defined Maximum Levels (MLs) at 40 ng g-1 fat for bovines, sheep,
poultry and pigs (European Commission 2011). Regarding PBDEs, EFSA (2011) fixed the following
lower benchmark doses (BMDLs): BDE-47, 309 μg/kg b.w.; BDE-99, 12 μg/kg b.w.; BDE-153, 83
μg/kg b.w.; BDE-209, 1,700 μg/kg b.w. based on neurodevelopment as a critical endpoint (EFSA
2011).
Very recently, EFSA proposed the tolerable weekly intake (TWI) as 13 ng/kg body weight (b.w.) per
week for PFOS and 6 ng/kg b.w. per week for PFOA based on increase in total serum cholesterol as an
endpoint (EFSA 2018a).
Wild animals can be exposed to the above mentioned compounds and the levels their tissues represent a
suitable indicator of environmental pollution. Several studies are present in literature regarding the
presence of these compounds in game animals (Table 1).
Finally, even if game animal consumption in Italy is very low, the apparent intake of game meat being
0.1-0.3 kg per capita per year, the availability of wild meat has been increasing in the noughties
(Ramanzin et al. 2010). Moreover, game animal meat is usually eaten by a small portion of the
population, like hunters and closely linked people, who could be more exposed to the associated dietary
risk: it is in fact estimated that game animal consumption in some regions rises to 1.0-4.0 Kg per capita
per year (Ramanzin et al. 2010). In this study, the occurrence of persistent, bioaccumulative, toxic
(PBTs) substances and OPs was evaluated in four game animals (chamois, red deer, wild boar and roe
deer).

124
Table 1: Concentration of environmental compounds from literature analysed by GC-MS/MS and LC-
HRMS.
Reference Element Area organs instruments concentrations
Riebe et al. 2016
PFOA
PFNA
PFOS
PFBS
Germany,
Austria
Chamois
(Liver) LC–MS/MS
<LOQ
1.9a μg g−1 w.w.
2.4a μg g−1 w.w.
<LOQ
Szymczyk-Kobrzynska et al. 2003
DDD
DDT
γ-HCH
PCBs
Poland red deer
(perirenal fat) GC-MS/MS
traces
8.2b μg kg-1
0.6b μg kg-1
23.7b μg kg-1
Naso et al. 2004
OCPs
Centre of Italy
Roe deer
(liver and perirenal
fat)
GC-MS/MS
<LOQ
PCBs <LOQ- 414.5 ng g-1 l.w.
Falk et al. 2012
PFOS
Germany Roe deer
(Liver) LC–MS/MS
6.3a μg kg-1 w.w.
PFNA 1.2 a μg kg-1 w.w.
PFDA 0.3 a μg kg-1 w.w.
PFOA 0.5 a μg kg-1 w.w.
Guitart et al. 1999
HCB
PCBS
pp DDE
pp'DDT
Aldrin
Heptachlor-epox.
Spain Chamois GC-MS/MS
6.61-79.05 ng g-1 w.w.
2.87-30.36 ng g-1 w.w.
0.79- 6.42 ng g-1 w.w.
N.D.- 1.81 ng g-1 w.w.
N.D.- 0.14 ng g-1 w.w.
N.D.- 1.23 ng g-1 w.w.
a: median concentration; b: average concentration; w.w.: wet weight; l.w.: lipid weight

125
2. Materials and methods
2.1. Chemicals and reagents
All solvents, formic acid (98–100%), acetic acid (99.9%), sodium acetate, 25% ammonia solution,
ammonium formate, trichloroacetic acid (TCA), and disodium hydrogen phosphate dihydrate, citric
acid monohydrate and EDTA, to prepare EDTA-McIlvaine buffer solution, pH 4, were purchased from
Merck KGaA, Darmstadt, Germany. Water was purified by a Milli-Q system (Millipore, Merck KGaA,
Darmstadt, Germany). The extraction cartridges Oasis WAX 3 mL, 60 mg for PFASs were provided by
Waters (Milford, MA, USA). SupelTM QuE Citrate (EN) tubes for POP extraction and SupelTM QuE-
ZSEP (EN) tubes for the clean-up step were from Supelco (Sigma Aldrich, St.Louis, MO, USA).
Mixtures of non-dioxin-like polychlorinated biphenyl (ndl-PCB) congeners (PCB 28; 52; 101; 138; 153
and 180) and PBDE congeners (PBDE 28; 33; 47; 99; 100; 153 and 154), PCB 209, internal standard
(IS) for PCBs, and 3-fluoro-2,2,4,4,6- pentabromodiphenyl ether (FBDE), IS for flame retardants, were
from AccuStandard (New Haven, USA). Organochlorine pesticides (OCPs) (aldrin, α-1,2,3,4,5,6-
Hexachlorocyclohexane (α-HCH); hexachlorobenzene (HCB); β-1,2,3,4,5,6-Hexachlorocyclohexane
(β-HCH); 1,1-Dichloro-2,2-bis(4-chlorophenyl)ethene, 4,4′-DDE;1,1,1-Trichloro-2,2-bis[4-
chlorophenyl]ethane 2,40-DDT; 1,1-Dichloro-2,2-bis(4-chlorophenyl)ethane 4,40-DDD; 1,1-Dichloro-
2,2-bis(4-chlorophenyl)ethan 4,40-DDT; endosulphan I; endosulphan II; endosulphan sulphate; endrin;
heptachlor; heptachlor epoxide; lindane and trans chlordane) were purchased from Restek (Bellefonte,
PA, USA). Organophosphorous pesticide (OPs) standards of chlorpyriphos diazinon, disulfoton,
ethoprophos, mevinphos and phorate were purchased from Sigma-Aldrich, St Louis, Mo, USA. 4-
nonylphenol (IS for OCs and OPs) was purchased from Merck (Sigma-Aldrich, Merck KGaA,
Darmstadt, Germany). PFASs analysed by HPLC-HRMS system were both sulphonates and
carboxylates: perfluorobutanoic acid (PFBA), perfluoropentanoic acid (PFPeA), perfluorohexanoic
acid (PFHxA), perfluorobutane sulphonic acid (PFBS), perfluoroheptanoic acid (PFHpA), PFOA,
perfluorohexane sulphonate (PFHxS), perfluorononanoic acid (PFNA), perfluorodecanoic acid
(PFDA), PFOS, perfluorododecanoic acid (PFDoA), perfluoroundecanoic acid (PFUnDA),
perfluorotridecanoic acid (PFTrDA), perfluorotetradecanoic acid (PFTeDA), perfluorohexadecanoic
acid (PFHxDA), and perfluorooctadecanoic acid (PFODA). All these compounds and the two 13C-

126
labeled internal standards (ISs) perfluoro-[1,2,3,4,5-13C5] nonanoic acid (MPFNA) and perfluoro-
[1,2,3,4-13C4] octanesulfonic acid (MPFOS) were purchased from Chemical Research 2000 Srl (Rome,
Italy).
1.2. Analytical Standard Solutions
The working solutions of analytes were prepared daily in hexane from stock solutions (10 µg
mL-1) stored at -20 °C.
1.3. Investigated species
The investigated species were chamois (Rupicapra rupicapra), red deer (Cervus elaphus), roe deer
(Capreolus capreolus) and wild boar (Sus scrofa), chosen for their habitats, characterized by different
altitudes. In the Alps, chamois live at 1000-2800 m above sea level, in both woody and rocky areas.
Red deer live in deciduous and mixed forests at 500-1500 m above sea level. Roe deer live in mixed
forests with dense undergrowth and in agriculture areas (700-1200 m above sea level). They are strict
herbivores and eat grass, herbs, berries, mushrooms and shoots, blackberries and buds of deciduous and
coniferous trees. Wild boars occupy the same geographical areas as red deer and are widespread (0-900
m above sea level). Wild boars are omnivorous and search for food burrowing into the ground. Their
diet consists of herbs, tubers, mushrooms, corn, grain cereals, potatoes, insects, snails, amphibians,
reptiles and small rodents. Muscle samples from hunted animals, precisely twelve roe deer, twenty-four
chamois, twenty-three red deer and twenty wild boars, were collected in the Province of Verbano-
Cusio-Ossola located in North East Piedmont, a region of North West Italy. The muscles chosen were
diaphragm and M. obliquus externus abdominis and M. rectus abdominis with the aim of not damaging
the carcass during the inspection visit.
1.4. Extraction procedures
1.4.1. Pesticides, PCBs and PBDEs extraction
Sample extraction was described in our previous work (Chiesa et al. 2018a) using the QuEChERS
Technique. Briefly, 1 g of sample was spiked with the IS solution (4-nonylphenol, PCB 209 and
FBDE) to a final concentration of 50, 25, 20 ng g-1 and then transferred to a QuEChERS extraction
tube. Ten milliliters of hexane/acetone (4:1) were added as extraction solvent; the tube was shaken for
1 min and centrifuged for 10 min at 2500×g at 4°C. Later, the supernatant was transferred to a

127
QuEChERS clean up tube Z-SEP and centrifuged in the same condition described above. The extract
was dried under vacuum in a centrifugal evaporator at a temperature of 40°C and then dissolved in 1
mL of hexane for GC-MS/MS analysis.
1.4.2. PFASs
The pre-treatment and extraction protocol for PFASs was the same as that described in our previous
works (Chiesa et al. 2018b). 2 g of sample was spiked with the two internal standards at a concentration
of 5 ng mL-1. Protein precipitation and analyte extraction were carried out by addition of 10 mL of
acetonitrile, stirring and sonication for 15 min. After centrifugation (2500×g, 4°C for 10 min), the
supernatant was evaporated in a rotary vacuum evaporator at 35°C and then suspended in 10 mL of
water, ready for the SPE extraction using the Oasis WAX Cartridges under vacuum. The SPE
cartridges were preconditioned with 3 mL of 0.5% ammonium hydroxide in methanol, 3 mL of
methanol, and 3 mL of Milli-Q water. The sample was loaded, washed with 3 mL of 25 mM acetate
buffer pH 4.5 followed by 2 mL of methanol.
Finally, the compounds were eluted using 3 mL of 0.5% ammonium hydroxide in methanol. The eluate
was dried in a rotary vacuum evaporator at 35°C and suspended in 100 µL of methanol: ammonium
formate 20 mM (10:90 v/v).
1.5. Instrumental analyses
1.6. GC-MS/MS analyses
Triple quadrupole mass spectrometry (QqQ) in electron ionization (EI) mode was used for the
simultaneous detection and quantification of pesticides and POPs in meat samples. The mass condition
was the same as that of our previous work (Chiesa et al. 2018a). A GC Trace 1310 chromatograph
coupled to a TSQ8000 triple quadrupole mass detector (Thermo Fisher Scientific, Palo Alto, CA, USA)
was used to confirm and quantify residues by using a fused-silica capillary column Rt-5MS Crossbond-
5% diphenyl 95% dimethylpolysiloxane (35 m x 0.25 mm i.d., 0.25 μm film thickness, Restek,
Bellefonte, PA, USA). The oven temperature program and all operation parameters are reported in the
work mentioned before. The QqQ mass spectrometer was operated in selected reaction monitoring
mode (SRM) detecting two-three transitions per analyte. Identification of POPs was carried out by

128
comparing sample peak relative retention times with those obtained for standards under the same
conditions and the MS/MS fragmentation spectra obtained for each compound.
The XcaliburTM processing and instrument control software program and Trace Finder 3.0 for
data analysis and reporting (Thermo Fisher Scientific) were used.
1.7. LC-HRMS Orbitrap analyses
LC-Orbitrap was used for detection and quantification of PFASs. HPLC analysis was
performed by an HPLC system (Thermo Fisher Scientific, San Jose, CA, USA), equipped with a
Surveyor MS quaternary pump and degasser, a Surveyor AS autosampler and column oven, and a
Rheodyne valve with a 20-μL loop. The analytes were chromatographically separated, using a Synergi
Hydro-RP reverse-phase HPLC column (150 × 2.0 mm, i.d. 4 µm), with a C18 guard column (4 × 3.0
mm; Phenomenex, Torrance, CA, USA). The mobile phase used for the PFAs separation consisted of a
binary mixture of solvents C (aqueous NH4COOH 20 mM) and B (MeOH). The two gradients were
described in our previous works (Chiesa et al. 2018b).
The detector was a Thermo Q-Exactive Plus Orbitrap (Thermo Scientific, San Jose, CA, USA),
equipped with a heated electrospray ionisation (HESI) source. Capillary and vaporiser temperatures
were set at 320 and 280°C, respectively, while the electrospray voltage was set at 3.00 kV, operating in
negative mode for PFASs. Nitrogen as sheath and auxiliary gas was set at 35 and 15 arbitrary units,
respectively. The full scan (FS) acquisition was combined with a data-independent acquisition (DIA)
strategy, providing the MS2 spectra for a confirmatory response.
Detection of the analytes was based on the calculated exact mass of the
protonated/deprotonated molecular ions, and at least one specific and typical fragment. Xcalibur 3.0
software (Thermo Fisher Scientific, San Jose, CA, USA) was used to control the HPLC-HRMS system,
to calculate the exact mass of the compounds and to acquire and elaborate data.
1.8. Method validation
Validation was performed following the SANTE/2017 guidelines (European Commission
2017). All the validation parameters and the assessment of validation protocols have already been
described in our previous works (Chiesa et al. 2018a, 2018b).

129
2. Results and discussion
Limits of Quantification (LOQs) were in the range 15.0-150 pg g-1 for PFASs, 0.50 ng g-1 for PCBs,
PBDEs and PAHs, 1.0 ng g-1 for organochlorine and organophosphorus pesticides. All the validation
parameters satisfied the SANTE/2017 guidelines. The results concerning NDL-PCB are summarized in
Table 2. As the PCB MLs concentrations for farm animals are expressed in ng g-1 lipid weight (l.w.)
(European Commission 2011) we adopted this formula also for wild animals. At least one PCB
congener was quantified in 32% of the samples, with higher prevalence in red deer than other species
(Table 2, Figure 1). 68% of the samples showed traces of PCBs under the limit of quantification. All
the six NDL-PCB indicators were found in all species with a frequency PCB 138> PCB 153> PCB
180>PCB 52>PCB 101>PCB 28. Their presence was reported in other studies conducted in Italy (Naso
et al. 2004; Turrio-Baldassarri et al. 2009) and in Europe (Mateo et al. 2012; Romanić et al. 2012). Red
deer muscle had more frequent quantifiable concentrations of PCBs than other investigated species.
However, the highest total concentration of the six NDL-PCBs was found in wild boar (674 ng/g l.w),
that is an animal at higher trophic levels, therefore less representative as a sentinel species compared to
herbivorous ungulates (Niewiadowska et al. 2013). An interesting aspect could be the evaluation of a
possible relationship between the presence and concentration of PCBs, and age and sex of animals.
However, some considerations have to be made in advance: firstly, the ages were only estimated,
because they were hunted animals that lived wild; secondly, even considering age ranges, the groups
had no homogeneous numbers; thirdly, the quantifiable concentrations of PCBs, i.e. those higher than
the LOQ, were scarce. Although all these premises made statistical analysis impossible, a consideration
can be made. Among the juvenile animals, aged less than one year, the frequency of PCB detection was
one out of four roe deers, one out of two chamois and zero out of two wild boars. No samples were
collected from young red deers. Therefore, PCBs were quantifiable in 37% of young animals, a
percentage comparable to the 32% calculated on all the animals. Therefore, although bioaccumulation
of lipophilic substances takes place over time, transfer from mother to young animal via milk is an
important cause of exposure to PCBs in lactating animals (EFSA 2018b).
Table 2 PCBs in wild animal samples. Concentrations expressed as mean ±SD, in ng g-1; N= number
of animals; n = quantifiable samples. Values are expressed in lipid weight.

130
Chamois N=24 Wild boar N=20 Roe deer N=12 Red deer N=23
nd <LOQ mean ±SD
(n)
nd <LOQ
mean
±SD (n)
nd <LOQ
mean ±SD
(n)
nd <LOQ
mean ±SD
(n)
PCB
28 0 22 42.9 (1)
0 18
24.5±0.2
(2)
0 12 -
0 22 38.18 (1)
PCB
52 0 18
51.4±11.3
(3)
0
17
10.8±3.5
(3)
0 12 -
0 18 40.8±9.7 (5)
PCB
101 0 24 -
0
19 31.4 (1)
0 12 -
0 21 58.0±26.1 (2)
PCB
138 0 20
63.6±24.6
(4)
0
15
190±143
(5)
0 10
52.9±29.9
(2)
0 18 77.1±49.0 (5)
PCB
153 0 21
79.2±17.8
(3)
0
16
190±140
(4)
0 12 -
0 18 84.9±65.7 (5)
PCB
180 0 24 -
0
19 6.8 (1)
0 12 -
0 21 158±129 (2)
Figure 1 Percentage of muscle samples of the four game animal species with quantified concentrations
of the compounds studied.

131
Finally, PCB presence in mountain areas where anthropic activities are scarce is due to their chemical
and physical features. Tremolada et al. (2015) described the seasonal trend of PCBs in air and soil in
high-altitude mountains in the Italian Alps. According to their research, PCBs follow the seasonal trend
of the mountain climate, tending to be transported in the atmosphere during the warm season and
deposited to the soil during the cold season. They concluded that PCBs can be present also in high-
altitude mountains. Table 3 summarizes all the results regarding other contaminants; data are expressed
in ng g-1 wet weight (w.w.). No PBDEs were quantified in muscles, with only few samples showing the
presence of PBDE 154 under the LOQ. As regards PFASs, we found only PFOS in 25% of wild boar
samples. Their concentration range (0.83-2.90 ng g-1) was lower than the concentration range found in
the muscle (<LOQ-28.6 ng g-1) of wild boars of Hesse, Germany (Stahl et al. 2012). Regarding PAHs,
only anthracene and benzopyrene at low concentrations were found in chamois. The presence of OCPs
and OPs in the meat of wild terrestrial animals is regulated by Regulation N° 396/2005 of the
Parliament and of the Council (European Commission 2005a) with successive amendments reported in
the EU pesticide database (European Commission 2005b). The value of all MRLs is 0.01 mg kg-1 w.w.
except DDT and metabolites whose MRL is 0.05 mg kg-1 and ethoprophos for which MRLs are not
stated in food of animal origin. The use of detected pesticides is banned in the European Union
(European Commission 2005b).
Table 3 Detected contaminants in wild animal samples. Concentrations expressed as mean ±SD, in ng
g-1; N= number of animals; n = quantifiable samples. Values are expressed in wet weight.
Chamois N=24 Wild boar N=20 Roe deer N=12 Red deer N=23
n
d
<LO
Q
mean
±SD (n)
n
d
<LO
Q
mean ±SD
(n)
n
d
<LO
Q
mean
±SD (n)
n
d
<LO
Q
mean ±SD
(n)
PBDE154 21 3 - 20 0 - 10 2 - 21 2 -
PFOS 24 0 -
15 0
1.44±0.86
(5)
12 0 -
23 0 -
Antracene 23 0 1,54 (1) 20 0 - 12 0 - 23 0 -
Benzopyren
e 21 1
1.49±0.0
4 (2)
19 1 -
12 0 -
23 0 -
Aldrin 0 15
2.62±5.0
3 (9)
0 19 0.04 (1)
0 5
3.43±3.8
4 (7)
0 15
61.4±179
(8)
α HCH 0 22
1.63±3.8
9 (2)
0 20 -
0 12 -
0 14
4.19±12.9
(9)

132
β HCH 0 21
0.24±0.4
(3)
0 20 -
0 12 -
0 21
0.09±0.31
(2)
Endrin 0 24 - 0 20 - 12 0 - 0 23 -
Endosulfan
S 0 24 -
0 20 -
0 9
0.38±0.8
9 (3)
0 20
13.50±44.6
(3)
Endosulfan
I 0 24 -
0 20 -
12 0 -
0 21
0.04±0.14
(2)
HCB 0 14
1.91±1.6
4 (10)
0 19 0.06 (1)
0 11 5.77 (1)
0 11
10.18±25.5
5 (12)
Lindane 0 16
1.07±1.0
5 (8)
0 19 0.03 (1)
0 12 -
0 21
0.71±3.30
(2)
pp DDD 0 23 0.66 (1) 0 19 2.99 (1) 0 12 - 0 23 -
op DDT 0 24 -
0 20 -
0 12 -
0 19
0.23±0.77
(4)
pp DDT 0 24 -
0 18
1.89±2.22
(2)
0 12 -
0 22 3.88 (1)
pp DDE 0 24 -
0 17
10.38±10.9
1 (3)
0 12 -
0 22 0.48 (1)
Ethoprofhos 21 0
1.71±2.4
3 (3)
6 12
0.12±0.33
(2)
10 2 -
15 2
2.50±1.92
(6)
Diazinon 0 24 -
0 18
0.28±0.77
(2)
1 10 1.76 (1)
2 21 -
Disulfoton 0 17
0.82±1.4
9 (7)
0 17
0.89±2.85
(3)
0 9
0.81±1.5
4 (3)
1 14
1.74±3.0
(8)
Phorate 0 16
7.25±11.
1 (8)
0 9
33.4±86.9
(11)
2 2
17.1±15.
3 (8)
0 11
7.75±8.8
(12)
Quantifiable OCPs were found in 58% of the samples analysed with the highest prevalence in roe deer,
followed by red deer, chamois and wild boar. α-HCH, aldrin, HCB, endosulfan sulfate and DDT were
detected with higher frequency and/or higher concentration. One out of 24 chamois samples (19.24 µg
g-1), six out of 23 red deer samples (38.22- 880 µg g-1) exceeded the Aldrin MRL value, while two roe
deer showed a value just above the MRL only if analytical error is not considered. Regarding α- and β-
HCH, only one out of 24 chamois samples (11.7 µg g-1) and two out of 23 red deer samples (29.2 µg g-
1and 56.5 µg g-1) showed higher concentrations of α-HCH, while β-HCH was always below the limit.
The samples were always compliant for endrin. As regards endosulfan and endosulfan sulfate, the
limits were exceeded only for the latter for two out of 23 red deer samples (149 and 161 µg g-1). Only

133
one out of 24 red deer samples exceeded the lindane MRL (15.9 µg g-1). HCB was introduced as a
fungicide and was banned in the European Union in 1981. However, even afterwards, HCB continued
to be used in industrial and chemical manufacturing and released into the environment during
incineration, as a by-product and in several pesticide formulations (EFSA 2006); only in red deer the
MRL was exceeded in four out of 23 samples with values ranging from 17.15 µg g-1 to 121 µg g-1.
DDT and its metabolites were found to be below the LOQ in almost all samples. When quantifiable,
values of DDT and metabolites were roughly comparable in wild boar and red deer. Quantification of
OPs was possible in 66 % of the samples tested. Residues were found in all species. In particular, 67 %
of the concentrations higher than LOQ were found in roe deer, 54 % in chamois, 83 % in red deer and
60 % in wild boar. All species showed a high contamination of phorate and disulfoton. As the
persistence of these compounds is not high (Ragnarsdottir 2000) their presence could be due to current
use in agricultural areas, although most compounds, such as phorate, demeton, diazinon and disulfoton
are not approved in Europe (European Commission 2005a). The area, in fact, is close to agriculture
zones and in a previous study conducted on honey produced in the same area, a high presence of OPs
like demeton, disulfoton and menvinphos was found, (Chiesa et al. 2018c), evidence of illicit use of
these compounds.
Finally, due to the non-homogeneous food habits of individual hunters compared to hunted animals, it
is difficult to perform a risk characterization. Therefore, a mere qualitative description can be made:
firstly, all quantified PCBs samples exceeded the MRL except one; the mean concentrations were 67.9,
138, 135 and 306 ng g-1 respectively in roe deer, chamois, red deer and wild boar, indicating a possible
matter of concern about exposure to PCBs. PBDEs were always below the LOQ. As regards PFOSs,
considering a tolerable weekly intake (TWI) of 13 ng kg-1 (EFSA 2018a), and a consumption of 200 g
per day of wild boar meat, with an unreal and very conservative approach, the highest value found
would lead to exposure about 190 times lower than the indicated TWI.
The higher values of the four PAHs in our samples would produce an exposure by far lower than the
calculated exposure considered safe by EFSA (2008) for average and high European consumers.
Moreover, the margins of exposure (MOEs) resulting from BMDL10 values derived from
carcinogenicity studies (Culp et al. 1998) were 17500 and 9900, for average and high European

134
consumers. The concentrations of the PAHs found in our samples indicate an even lower exposure,
therefore a very low risk.
The meat of red deer poses some causes of concern because OCPs were generally present in this
species at higher concentrations and frequencies than other species, except for DDT and metabolites,
similarly present in wild boar.
OPs deserve a separate consideration, because since they are not very persistent in the environment,
their presence in the meat of animals means that illicit use still occurs. Moreover, an appreciable
difference between species does not appear. In fact, seven roe deer, eight chamois, six red deer and
three wild boars showed concentrations above the MRL, ranging from 15.0 to 40.0 ng g-1 casually
distributed between species. In this case, keeping in mind the above statement about hunters' eating
habits, the high number of non-compliant samples suggests a particular caution in the consumption of
this meat, e.g. a non-frequent intake.
As a conclusion, in the light of the results of this work, for the majority of the contaminants
investigated, the consumption of game meat is not a cause for concern due to the scarce presence of
high concentration residues and to its low consumption, even by hunters or closely linked people. An
endemic presence of contaminants is highlighted, and the detection of OPs needs particular attention
due to their low persistence, that indicates illicit use. Our data suggest that a residue control plan would
be necessary on game animals.
References
Costa LG, Giordano G. 2007. Developmental neurotoxicity of polybrominated diphenyl ether (PBDE)
flame retardants. Neurotoxicology 28:1047-1067.
Chiesa LM, Shih-Kuo L, Ceriani F, Panseri S, Arioli F. 2018a. Levels and distribution of PBDEs and
PFASs in pork from different European countries. Food Addit. Contam.: Part A, 35: 2414-2423.
Chiesa LM, Nobile M, Malandra R, Pessina D, Panseri S, Labella GF, Arioli F. 2018b. Food safety
traits of mussels and clams: distribution of PCBs, PBDEs, OCPs, PAHs and PFASs in sample from
different areas using HRMS-Orbitrap® and modified QuEChERS extraction followed by GC-MS/MS.
Food Addit. Contam. 35:959-971.

135
Chiesa LM, Panseri S, Nobile M, Ceriani F, Arioli F. 2018c. Distribution of POPs, pesticides and
antibiotic residues in organic honeys from different production areas. Food Addit. Contam: Part A. 35:
1340-1355.
Culp SJ, Gaylor DW, Sheldon WG, Goldstein LS, Beland FA. 1998. A comparison of the tumours
induced by coal tar and benzo[a]pyrene in a 2-year bioassay. Carcinogenesis, 19: 117-124.
EFSA. 2006. opinion of the scientific panel on contaminants in the food chain on a request from the
commission related to hexachlorobenzene as undesirable substance in animal feed. EFSA J. 402: 1-49
EFSA. 2011. Polycyclic Aromatic Hydrocarbons in Food. Scientific Opinion of the Panel on
Contaminants in the Food Chain. EFSA J. 724: 1-114.
EFSA. 2018a. Risk to human health related to the presence of perfluorooctane sulfonic acid and
perfluorooctanoic acid in food. EFSA J. 16: 1-5194.
EFSA. 2018b. Risk for animal and human health related to the presence of dioxins and dioxin-like
PCBs in feed and food. EFSA J. 16: 5333-563.
European Commission 2003. Directive 2003/11/EC of the European Parliament and of the Council of 6
February 2003 on amending for the 24th time Council Directive 76/769/EEC relating to restrictions on
the marketing and use of certain dangerous substances and preparations (pentabromodiphenyl ether,
octabromodiphenyl ether). OJ L 42/45: 1-2.
European Commission. 2005a. Regulation No 396/2005 of the Parliament and of the Council on
maximum residue levels of pesticides in or on food and feed of plant and animal origin and amending
Council Directive 91/414/EEC. OJ L 70/1: 1-16.
European Commission. 2005b. European Commission pesticide database:
https://ec.europa.eu/food/plant/pesticides_en. (accessed 18-03-2019)
European Commission. 2011. Commission Regulation 1259/2011 EC of 2 December 2011 amending
Regulation (EC) No 1881/2006 as regards maximum levels for dioxins, dioxin-like PCBs and non-
dioxin-like PCBs in foodstuffs. OJ L 320/18: 1-6.

136
European Commission. 2014. European Commission Recommendation 2014/118/EU on the
monitoring of traces of brominated flame retardants in food. OJ L 65/39.
European Commission. 2017. SANTE/11813/2017. Guidance document on analytical quality control
and method validation procedures for pesticide residues and analysis in food and feed, pp.1-46.
Falk S, Brunn H, Schröter-Kermani C, Failing K, Georgii S, Tarricone K, Stahl T. 2012. Temporal and
spatial trends of perfluoroalkyl substances in liver of roe deer (Capreolus capreolus). Environ. Pollut.
171: 1-8.
Guitart R, Riu JL, Puigdemont A, Arboix M. 1990. Organochlorine residues in adipose tissue of
chamois from the Catalan Pyrenees, Spain. Bull. Environ. Contam. Toxicol. 44: 555-560.
Mateo R, Millán J, Rodríguez-Estival J, Camarero PR, Palomares F, Ortiz-Santaliestra, ME 2012.
Levels of organochlorine pesticides and polychlorinated biphenyls in the critically endangered Iberian
lynx and other sympatric carnivores in Spain. Chemosphere 86: 691-700.
Naso B, Zaccaroni A, Perrone D, Ferrante MC, Severino L, Stracciari GL, Lucisano A. 2004.
Organochlorine pesticides and polychlorinated biphenyls in European Roe Deer (Capreolus capreolus)
resident in a protected area in Nothern Italy. Sci. Total Environ. 328: 83-93.
Niewiadowska A, Kiljanek T, Semeniuk S, Zmudzki J. 2013. Organochlorine pesticides and
polychlorinated biphenyls in game animals from Poland. Bull Vet Inst Pulawy 57: 197-201.
Paul AG, Jones KC, Sweetman AJ. 2008. A first global production, emission, and environmental
inventory for perfluorooctane sulfonate. Environ. Science Techn. 43: 386-392.
Ray D. 2010. Organochlorine and Pyrethroid Insecticides in: Comprehensive Toxicology (2nd edition).
Edited by C.A. McQueen, Elsevier Science, Kidlington, UK, 445-457.
Ramanzin M, Amici A, Casoli C, Esposito L, Lupi P, Marsico G, ..Russo C. 2010. Meat from wild
ungulates: Ensuring quality and hygiene of an increasing resource. Ital. J. Anim. Sci. 9: e61.
Ragnarsdottir KV.2000. Environmental fate and toxicology of organophosphate pesticides. J. Geolo.
Soc.157: 859-876.

137
Richardson RJ. 2010. Anticholinesterase Insecticides Insecticides in: Comprehensive Toxicology (2nd
edition). Edited by C.A. McQueen, Elsevier Science, Kidlington, UK, 433-444.
Riebe RA, Falk S, Georgii S, Brunn H, Failing K, Stahl T. 2016. Perfluoroalkyl Acid Concentrations in
Livers of Fox (Vulpes vulpes) and Chamois (Rupicapra rupicapra) from Germany and Austria. Arch.
Environ. Contam. Toxicol. 71: 7-15.
Romanić SH, Klinčić D, Kljaković-Gašpić Z, Kusak J, Reljić S, Huber Đ. 2015. Organochlorine
pesticides and polychlorinated biphenyl congeners in wild terrestrial mammals from Croatia:
Interspecies comparison of residue levels and compositions. Chemosphere, 137: 52-58.
Stahl T, Falk S, Failing K, Berger J, Georgii S, Brunn H. 2012. Perfluorooctanoic acid and
perfluorooctane sulfonate in liver and muscle tissue from wild boar in Hesse, Germany. Arch. Environ.
Contam. Toxicol. 62: 696-703.
Szymczyk-Kobrzynska K, Zalewski K. 2003. DDT, HCH and PCB Residues in Fat of Red Deer
(Cervus Elaphus) from the Region of Warmia and Mazury, 2000-2001. Polish J. Environ. Studies 12:
613-617.
Tremolada P, Guazzoni N, Comolli R, Parolini, Lazzaro S, Binelli A. 2015. Polychlorinated biphenyls
(PCBs) in air and soil from a high-altitude pasture in the Italian Alps: evidence of CB-209
contamination. Environ. Sci. Pollut. Res. 22: 19571-19583.
Turrio-Baldassarri L, Alivernini S, Carasi S, Casella M, Fuselli S, Iacovella N, Iamiceli AL, La Rocca
C, Scarcella C, Battistelli CL. 2009. PCB, PCDD and PCDF contamination of food of animal origin as
the effect of soil pollution and the cause of human exposure in Brescia. Chemosphere 76: 278-285.
Vallack HW, Bakker DJ, Brandt I, Branstrom-Luden E, Brouwer A, Bulla KR, et al. 1998. Controlling
persistent organic pollutant – what next? Environ. Toxicol. Pharmacol. 6:143-175.
Wania F, Mackay D. 1996. Tracking the distribution of persistent organic pollutants. Environ. Sci.
Technol. 30: 390A-396A.

138
3.6. Distribution of POPs, pesticides and antibiotic residues in organic honeys from different
production areas.
Published in, Food Additives & Contaminants Part A, Volume 35, 2018, Pages 1340-1355.
Luca Maria Chiesa, Sara Panseri*, Maria Nobile, Federica Ceriani & Francesco Arioli.
Department of Health, Animal Science and Food Safety, University of Milan, Milan, Italy.
* Corresponding author: Dr. Sara Panseri, Phone: 0250317931; Fax: 00390250317941. E-mail:
[email protected]. Address: Department of Health, Animal Science and Food Safety,
University of Milan, Via Celoria 10, 20133 Milan, Italy.
Keywords: organic honey; pesticides; antibiotics; triple quadrupole mass spectrometry (GCMS/ MS);
LC-Orbitrap; food safety.
Abstract
Demand for honey is increasing, especially if it is organic and if its nutritional properties are linked to
untreated environments in order to guarantee quality for health. Sources of contamination of honey can
be divided into environmental and apicultural Therefore, the distribution of POPs (persistent organic
pollutants), pesticides and antibiotic residues from geographical areas with different contamination
sources (high anthropic impact, intensive farming, husbandry and low anthropic impact) was
investigated in order to confirm the potential transfer of xenobiotics into the supply chain and to give
beekeepers tools for the selection of areas dedicated to organic production. The presence of PCBs,
PBDE and PAHs was confirmed, not only in proximity to highly urbanised centres, where the
concentrations were higher, but in all environment contexts, confirming their ubiquity. No antibiotics
or neonicotinoids were detected in 95 organic honeys, demonstrating the absence of apicultural
treatments and consequently the good quality of honey of different areas. These results are important
due to the undefined regulatory European situation on honey antibiotic limits.
1. Introduction
Honey is a natural food product, made of nectar, secretions of livings parts of plants or excretions of
insects sucking on the living parts of plants, which Apis mellifera bees collect, transform by combining

139
with specific substances and deposit in honeycombs (Wilczynska et al., 2007; Panseri al., 2014). Honey
is generally considered as a natural and healthy product. In these last years, much consumer interest
regarding honey and its derived products is oriented towards organic foods (Berrie et al., 2005).
Regarding this, the European Commission establishes that the qualification of organic honey and other
beekeeping products is closely bound to the characteristics of hive treatments as well as the quality of
the environment (Blasco et al., 2004). The Council Regulation
1804/1999 EC is very restrictive with regard to the production of organic honey in terms of the origin
of bees, siting of the apiaries, feed, disease prevention and veterinary treatments (Malhat et al., 2015).
In addition, the use of allopathic chemically synthesized medicinal products for preventive treatments
in organic beekeeping is prohibited, since these fat-soluble and non-volatile compounds can
accumulate in the stored honey, where they are able to migrate from the wax comb (Panseri et al.,
2014). Safety of food and feed is one of the main objectives in consumer health policy. Maintaining a
high level of protection in this contest remains crucial not only for public health, but also to preserve
consumer confidence in food. Bees and bee products can be contaminated by several sources.
Contamination may derive either from the environment or inadequate beekeeping practices (Baggio et
al., 2009).
Contaminants of key importance for the above products include antibiotics. Like all living organisms,
honey bees can suffer from pests and diseases. Bee diseases caused by microorganisms such as
American and European foulbrood, and nosemosis can be cured by anti-infectious agents (Baggio et
al., 2009). The presence of antibiotic residuals in food products constitutes an important health risk as it
is associated with the increased microbial resistance to antibiotics. The antibiotics and
chemotherapeutics of interest in apiculture include tetracyclines (oxytetracycline), aminoglycosides
(streptomycin), sulfonamides (sulfamethazine, sulfathiazole, sulfadiazine, sulfamethoxazole,
sulfamerazine, sulfadimethoxine), macrolides (tylosin, erythromycin), neonicotinoids derivates and
they are systematically used for the treatment of infections in humans and animals (Balsco et al., 2003).
Furthermore, they are classified based on their chemical structure r their mechanism of action (Lambert
et a., 2013). At present, no MRLs have been established for antibiotics and sulfonamides in honey
(Commission Regulation (EU) No 37/2010, 2010 and amendments), meaning that the use of antibiotics
in beekeeping is not permitted in the EU. However, anti-infectious agents could be used in the EU in
apiculture based on the “cascade” system as described in Article 11 of Directive 2001/82/EC (2001) of

140
the European Parliament and of the Council, as amended by Directive 2004/28/EC (2004) of the
European Parliament and of the Council. The cascade system is open to all animal species, including
honey bees (Anonymous, 2016a, 2017). In the EU the absence of MRLs for residues of antibiotics and
chemotherapeutics in honey resulted for a long period in a zero-tolerance for antibiotic residues in
honey. In some EU Member States (Belgium, France, UK) action limits, recommended target
concentrations, nonconformity, or tolerance levels were applied (Leidoux et al., 2012). However, in
2012, it was decided to restrict zero-tolerance to residues of non-allowed substances while residues of
allowed substances should be judged based on scientific risk assessment (Anonymous, 2016b, 2016c).
This last decision makes honey trade more complex, and there are signs that not all European Member
States are respecting this decision and that in some countries a zero-tolerance for residues of antibiotics
and chemotherapeutics is still applied. Recently in Italy the National residue control Plan implemented
detection limits of 5 μg kg-1for sulfamides, tetracyclines and macrolides and 1.3-1.6 μg kg-1 for
aminoglycosides confirmatory methods (Italian Ministry of Health, 2017). The recent unrest on the
neonicotinoids resulted in the proposal of the European Commission to restrict the use of clothianidin,
imidacloprid and thiamethoxam for seed treatment, soil application and foliar treatment on bee-
attractive plants and cereals (EFSA 2013a; EFSA 2013b and EFSA 2013c). Therefore, in organic
honey production, direct pollution by beekeeping practices as well as indirect contamination from the
environment must be prevented. Many pollutants in the environment may contaminate bee matrices,
comprising bee, honey and pollen. Environmental pollutants include pesticides (Marini et al., 2012),
heavy metals (Wilczynska et al., 2007), bacteria and radioactive materials (Debayle et al., 2012).
Honeybees are able to cover a wide area and come into contact with contaminated food sources, such
as pollen, nectar and water during foraging. Therefore, honeybees and beehive products are considered
potential indicators for environmental biomonitoring (Malhat et al., 2015; He et al., 2015). As an
example, organophosphorus pesticides (OPs) represent important environmental and food
contamination sources, as they are widely used in agriculture for the control and protection of crop-
eating insects. Previous research has highlighted that the contamination of honey is strictly related to
the environmental context as well. In particular several pesticides used for crop protection are as a
consequence able to contaminate honey representing a potential risk for food safety (Kaufmann et al.,
2012). At present few data are available on multiresidue screening of xenobiotics examining the
relation between a production context in which intensive farms are present and their potential risk of

141
honey contamination with antibiotic substances. This study could be considered the continuation of our
previous work as regard the analysis of POPs in honey samples (Chiesa et al., 2016a). In the previous
paper, honey samples were extracted by a different technique and collected from the North and South
of Italy considering only the industrialised area and the agricultural one. In this new study, the main
focus was the investigation of a broader spectrum of analytes, pesticides, persistent organic pollutants
and antibiotics in organic honeys collected from different productive areas according to their
characteristics (area with an agricultural, zootechnical or anthropic impact) to confirm the potential
transfer of xenobiotics into supply chain from different sources than beekeeping practices. This
approach could be particularly useful to give the beekeepers tools for the selection of areas dedicated to
production in particular for the organic ones. Lastly, this paper presents a rapid, accurate and sensitive
method to evaluate multiple antibiotic substances by using LC Orbitrap approach.
2. Materials and methods
2.1.Chemicals and reagents
All solvents were of HPLC or analytical grade and were purchased from Fluka (Sigma-Aldrich, St.
Louis, MO, USA). Formic acid (98–100%) was obtained from Riedel-de Haën (Sigma-Aldrich, St.
Louis, MO, USA). Ammonium formate, trichloroacetic acid (TCA) crystals and the ingredients
required to prepare EDTA-McIlvaine buffer solution, pH 4 (disodium hydrogen phosphate dihydrate,
citric acid monohydrate and EDTA) were purchased from Fluka. Water was purified by a Milli-Q
system (Millipore, Merck KGaA, Darmstadt, Germany). The extraction cartridges (Oasis HLB 3 mL,
60 mg) used for antibiotics and neonicotinoids were provided by Waters (Milford, MA, USA).
QuEChERS materials for the extraction of POPs and polar pesticides were obtained from Supelco
(SigmaeAldrich, St.Louis, MO, USA); SupelTM QuE Citrate (EN) tubes, containing sodium citrate
tribasic dihydrate and sodium citrate dibasic sesquihydrate. Magnesium sulphate and sodium chloride
were used for the extraction. SupelTM QuE-PSA (EN) tubes were used for the clean-up step. Mixtures
of polychlorinated biphenyl (PCB) congeners (PCB 28; PCB 52; PCB 101; PCB 138; PCB 153 and
PCB 180) and polybrominated diphenyl ether (PBDE) congeners (PBDE 28; PBDE 33; PBDE 47;
PBDE 99; PBDE 100; PBDE 153 and PBDE 154), PCB 209 as internal standard (IS) for PCBs, and 3-

142
fluoro-2,2,4,4,6- pentabromodiphenyl ether (FBDE) as IS for PBDEs, were purchased from
AccuStandard (New Haven, USA). Organochlorine pesticides (OCPs) (α-HCH; β-BHC; aldrin; pp’-
DDD; pp’-DDE; op’-DDT; pp’-DDT; endosulphan I; endosulphan II, endosulphan sulphate, endrin;
heptachlor; heptachlor epoxide; hexachlorobenzene; lindane; trans chlordane) was purchased from
Restek (Bellefonte, PA, USA). Organophosphorus pesticide (OPs) standards of chlorpyriphos,
demeton, disulfoton, ethoprophos, mevinphos, phoratediazinon, were purchased from Sigma-Aldrich
(St Louis, Mo, USA). Florisil (100e200 96 mesh) was provided by 6 Promochem (Wesel, Germany).
Hexane, acetone, ethyl acetate (special grade for pesticide residue analysis (Pestanal)) and 4-
nonylphenol (IS for OCPs and OPs) were purchased from Fluka (Sigma-Aldrich, St. Louis, MO, USA).
Polar pesticides: atrazine, azinphos-ethyl, azinphos-methyl, azoxystrobin, benalaxyl, bitertanol,
bupirimate, buprofezin, cadusafos, chlorfenvinphos, cyproconazole, cyprodinil, ethoxyquin,
fenamiphos, fenarimol, fludioxonil, flusilazole, furalaxyl, kresoxim-methyl, malathion, metalaxyl,
methidathion, oxadixyl, paraoxon-methyl, phosalone, piperonyl butoxide, pyrazophos, pirimicarb,
pirimiphos-methyl, pirimiphos-ethyl, profenophos, propachlor, propargite, quinalphos, simazine,
tetrachlorvinphos, tetraconazole, triazophos, and 4- nonylphenol, used as internal standard, were also
purchased from Fluka. Antibiotics and neonicotinoids: actamiprid, amoxicillin, ampicillin, benzyl
penicillin, cefquinome, ceftiofur, cefalexin, ciprofloxacin, chloramphenicol, chlortetracycline,
clothianidin, cloxacillin, danofloxacin, dicloxacillin, dimetridazole, dinotefuran, doxycycline,
enrofloxacin, florfenicol, florfenicol amine, flumequine, furaltadone, furazolidone, imidacloprid,
lincomycin, lomefloxacin, marbofloxacin, nalidixic acid, nytempiram, nitrofurazone, oxolinic acid,
oxytetracycline, ronidazole, spectinomycin, spiramycin, sulfadiazine, sulfathiazole, sulfadimethoxine,
sulfadimidine, sulfamerazine, tetracycline, thiacloprid, thiamethoxam, thiamphenicol, tiamulin,
tilmicosine, tinidazole, trimethoprim, tylosin and enrofloxacin d5 as the internal standard (IS) were
purchased from Fluka. The purity of all standards was > 98%.
2.2.Standard solutions
Working solutions of POPs were prepared by diluting the stock solution in hexane for pesticides and
then stored at -20 °C. Mixed compound calibration solution, in hexane, was prepared daily from the
stock solutions (10 μg mL-1) and the proper volume was used as a spiking solution as well. For each

143
LC-HRMS standard, stock solutions were prepared (1 mg mL-1) in methanol and kept at -20 °C.
Working solutions at 10 and 100 ng mL-1, were prepared daily. Each working solution was maintained
at 4 °C during the method validation procedure.
2.3. Sample collection
Sample collection was conducted to obtain representative samples from different environmental and
anthropogenic contexts, as summarized in Table 1. The investigated areas were identified as follows:
High anthropic impact (HA): includes honey samples of Tilia europaea botanical origin from beehives
located close to large inhabited centres, with an important industrial activity, presence of motorway
junctions and high population density. Low anthropic impact (LA): these areas are characterized by the
presence of woodland vegetation, the absence of large industrial activities and the presence of modest
road networks; the botanical origin was Castanea sativa Miller. Intensive farming area (IF): this group
includes samples of Tilia europaea botanical origin from areas where the main activity identified was
cultivation. In particular, cereal crops, orchards, vineyards and greenhouses were highlighted. Intensive
husbandry area (IH): these are territories in which the presence of cattle farms, chickens, horses and
also a fish farm emerged; the sample botanical origin was both Castanea sativa Miller and Tilia
europaea. Farming and husbandry areas (FH): this category includes areas with intermediate
characteristics compared to the previous two. Due to the simultaneous presence of large cultivated
areas and breeding farms, mainly of cattle, it was not possible to assign the samples to one of the other
groups. It was therefore decided to form an area that can be considered polyvalent depending on the
results obtained. Also, in this case, the sample botanical origin was both Castanea sativa Miller and
Tilia europaea. Moreover 18 organic samples, purchased from the market were included in our
application.

144
Table 1 Origins of 95 honey samples from different production areas. (C) = High anthropogenic
impact; (F) = Free, low anthropogenic impact; (A) = Agriculture areas; (Z)= Farming area; (AZ)=
Agriculture and farming areas.
Sample No. Sample’s
identification
Origin Information Area characteristic in relation to
its potential pesticides sources
18 - Market EU Produced (variable
Pesticides, antibiotic sources)
15 C North Italya-b Industrialized area (PCBs,OCs
source)
12 F North Italy (Novara-V.C.O.)c Free Area (no presence of
industries or agricultural intensive
systems; absence of pesticides and
antibiotics)
10 Z North Italy (Novara)d Farming Area(Antibiotic source)
25 AZ North Italye Farming and agriculture area
(Antibiotics, OCs source)
15 A Centro of Italyf Agriculture Area ( OCs source)
a= Lombardia (Rho, north west); b= Piemonte (Novara, north west ); c= Piemonte (Novara; Stresa
Verbano-Cusio-Ossola (VCO); d= Piemonte (North west); e= Piemonte (Alessandria-Asti-Torino); f=
Emilia Romagna (Modena).
2.4. Sample extraction for antibiotics and neonicotinoids
The sample treatment clean-up carried out for antibiotics and neonicotinoids in honey was similar to
the method adopted in our previous works on antibiotics in different matrices (Chiesa et al., 2015,
2016, 2017, 2018; Pastorelli et al., 2005) with some modifications, as well as an increased number of
analysed compounds. Briefly, an aliquot (1 g) of honey was spiked with the IS (enrofloxacin-d5) at a
final 5 ng mL-1 and 100 μl of 20% TCA for protein precipitation and 5 mL McIlvaine buffer (pH 4.0)
were added for the extraction. The samples were vortexed and sonicated for 15 min. For honey the
defatting steps applied in the previous mentioned studies were excluded. After centrifugation (2500 x g,
4 °C, 10 min), the supernatant was transferred to a clean polytetrafluoroethylene centrifuge and

145
purified by SPE Oasis HLB cartridges under vacuum. The SPE cartridges were preconditioned with 3
mL methanol and 3 mL Milli-Q water. The samples were loaded, and then washed with 2 x 3 mL
methanol: water (5:95 v/v). Finally, the analytes were eluted with 5 mL methanol and collected in a 15-
mL glass tube. The eluate was evaporated in a rotary vacuum evaporator at 40 °C. The dried extract
was reconstituted in 200 μL methanol:water (10:90 v/v), and then transferred to an auto-sampler vial.
The injection volume was 10 μL.
2.5. Sample extraction for pesticides
The extraction of pesticides and contaminants was performed using the QuEChERS method. The ASE
extraction (Chiesa et al., 2016a) was changed with this new quickly, easy and cheap strategy, in order
to combine the extraction of polar pesticides and POPs. In the meantime we obtained and confirmed
the same validation parameters of the previous work about POPs. Briefly, two grams of sample were
homogenized and transferred to a QuEChERS extraction tube, then a solution containing the ISs (4-
nonylphenol, PCB 209 and FBDE) was added to the sample to a final concentration of 100 ng g-1. Ten
millilitres of acetonitrile were added as extraction solvent; the tube was vortex-mixed for 1 min and
centrifuged for 10 min at 2500×g at 4°C. Later, the supernatant was transferred to a QuEChERS clean
up tube, shaken and centrifuged under the same conditions described above. The extract was collected,
divided into two aliquots and dried under vacuum in a centrifugal evaporator at a temperature of 35°C.
The residue was dissolved in 200 μL methanol:ammonium formate 10 mM (10:90 v/v) for the analysis
by LC-HRMS and in 200 μL hexane for GC-MS/MS analysis. For honey fortification, 2 g of the
control sample was spiked by adding an appropriate volume of the standard working solution to cover
the concentration range from 1 to 100 ng g-1 for PCBs, from 0.5 to 10 ng g-1 for PBDEs, and from 5 to
100 ng g-1 for OCs and OPs, and also in relation to pesticide MRLs when available in order to obtain
matrix-matched calibration curves.
2.6. LC-HRMS Orbitrap analyses
LC-Orbitrap was used for the simultaneous detection and quantification of polar pesticides and
antibiotic in honey samples. HPLC analysis was performed by an HPLC system (Thermo Fisher

146
Scientific, San Jose, CA, USA), equipped with a Surveyor MS quaternary pump and degasser, a
Surveyor AS autosampler and column oven, and a Rheodyne valve with a 20-μL loop. The analytes
were chromatographically separated, using a Synergi Hydro-RP reverse-phase HPLC column (150 ×
2.0 mm, i.d. 4 μm), with a C18 guard column (4 × 3.0 mm; Phenomenex, Torrance, CA, USA). The
mobile phase used for the antibiotics and neonicotinoids separation gradient consisted of a binary
mixture of solvents A (aqueous HCOOH 0.1%) and B (MeOH). The elution started with 5% B, which
increased to 95% in 10 min and remained constant up to the 14th min. The initial conditions were
obtained again at the 17th min, with an equilibration time of 8 min. The run was performed at 0.3 mL
min-1 for a total of 25 min. The mobile phase used for polar pesticides was a binary combination of
solvents C (aqueous ammonium formate 10 mM) and B (MeOH). The elution started with 10% B,
which increased to 95% after 13 min and remained constant up to the 20th min. The initial conditions
were obtained again at the 22nd min, with an equilibration time of 6 min. The run was performed at 0.3
mL min-1 for a total of 28 min. The detector was a Thermo Q-Exactive Plus Orbitrap (Thermo
Scientific, San Jose, CA,
USA), equipped with a heated electrospray ionisation (HESI) source. Capillary and vaporiser
temperatures were set at 320 and 280°C, respectively, while the electrospray voltage was set at 3.00
kV, operating in both positive and negative mode. Nitrogen as sheath and auxiliary gas was set at 35
and 15 arbitrary units, respectively. Instrument calibration was performed every analytical session,
using LTQ Velos ESI negative and positive ion calibration solutions (Pierce Biotechnology Inc.,
Rockford, IL, USA). The full scan (FS) acquisition was combined with a data-independent acquisition
(DIA) strategy, providing the MS2 spectra for a confirmatory response. For antibiotics and
neonicotinoids, the FS resolution was 70,000 FWHM. On the basis of the compound list, a scan range
of 120–1000 m/z was chosen; the automatic gain control (AGC) was set at 1 x 10⁶, and the maximum
injection time was 150 ms. The DIA segment operated in both positive and negative mode at 17,500
FWHM. The AGC target was set to 2 x 10⁴, with 100 ms maximum injection time. A loop count of 20
was set for the positive ion mode, 10 for the negative. The precursor ions are filtered by the
quadrupole, which operates at an isolation window of 1 m/z. Fragmentation of the precursors was
optimised with two-step normalised collision energy (25 and 40 eV). For polar pesticides, the FS
resolution was 70,000 FWHM. On the basis of the compound list, a scan range of 180–600 m/z was
chosen; the automatic gain control (AGC) was set at 1 x 10⁶, and the maximum injection time was 200

147
ms. The DIA segment operated in both positive and negative mode at 17,500 FWHM. The AGC target
was set at 2 x 10⁴, with 100 ms maximum injection time. A loop count of 2 was set for the positive ion
mode, 1 for the negative. We set an isolation window of 1 m/z. Fragmentation of the precursors was
optimised with three-step normalised collision energy (10, 40, and 60 eV). Detection of the analytes
was based on the calculated exact mass of the protonated/deprotonated molecular ions, and at least one
specific and typical fragment. The formula of the selected compounds, the exact theoretical mass of the
parents and the diagnostic transition used to confirm the studied antibiotics and neonicotinoids are
reported in Tables 2 and 3, respectively. Xcalibur 3.0 software (Thermo Fisher Scientific, San Jose,
CA, USA) was used to control the HPLC-HRMS system, to calculate the exact mass of the compounds
and to acquire and elaborate data.
2.7. GC-MS/MS analyses
Triple quadrupole mass spectrometry (QqQ) in electron ionization (EI) mode was used for the
simultaneous detection and quantification of pesticides and POPs in honey samples. The mass
condition was the same of our previous work (Chiesa et al., 2016a). A GC Trace 1310 chromatograph
coupled to a TSQ8000 triple quadrupole mass detector (Thermo Fisher Scientific, Palo Alto, CA, USA)
was used to confirm and quantify residues in honey samples by using a fusedsilica capillary column Rt-
5MS Crossbond-5% diphenyl 95% dimethylpolysiloxane (35 m x 0.25 mm i.d., 0.25 μm film thickness,
Restek, Bellefonte, PA, USA). The oven temperature program was as follows: initial temperature of
80°C, held for 3 min, and increased to 170°C at 10°C min-1; then, increased from 170°C to 190°C at
3°C min-1, and raised to 240°C at 2°C min-1, before being ramped to 280°C at 3°C min-1 and finally
from 280°C to 310°C at 10°C min-1 and held at this temperature
for 5 min. The carrier gas (helium, purity higher than 99.999%) was in constant flow mode at 1.0 ml
min-1. A volume of 1 μL was injected using a programmed temperature vaporiser injector (PTV) in
splitless mode with a 1-min splitless period and the following inlet temperature programme: 80°C (0.05
min), 14.5°C s-1 to 200°C (1 min) and 4.5°C s-1 to 320°C (12 min – cleaning phase). A baffle liner (2
mm × 2.75 mm × 120 mm, Siltek-deactivated; Thermo Fisher Scientific) was used. The transfer line
was maintained at 270°C and the ion source at 250°C. The electron energy and emission current were
set to 70 eV and 50 μA, respectively. The scan time was 0.3 s and the peak width of both quadrupoles

148
was 0.7 Da full widths at half maximum. Argon was used as a collision cell gas at a pressure of 1.5
mTorr. The QqQ mass spectrometer was operated in selected reaction monitoring mode (SRM)
detecting two-three transitions per analyte. Identification of POPs was carried out by comparing sample
peak relative retention times with those obtained for standards under the same conditions and the
MS/MS fragmentation spectra obtained for each compound. The XcaliburTM processing and
instrument control software program and Trace Finder 3.0 for data analysis and reporting (Thermo
Fisher Scientific) were used.
2.8. Analytical performances and method validation
For antibiotics and neonicotinoids, validation was carried out following the Commission Decision
guidelines 657/2002/CE (European Commission 2002, 2008), by spiking the samples with all the
selected analytes, in six replicates, at three concentration levels, for three different days resulting in
three analytical series (matrix validation curves). The three concentration levels (C0, 2C0, 3C0),
previously planned according to the minimum concentration detectable with our instrumentation (C0)
were 0.5, 1 and 1.5 ng g-1 for all analytes and 3, 6, 9 ng g-1 for amoxicillin and benzyl penicillin.
Instrumental linearity was assessed through six-point calibration curves, constructed in the solvent
containing a fixed amount of the IS (5 ng mL-1), with the initial analyte concentration corresponding to
the minimum detectable concentration for each analyte up to 100 ng mL-1. Detection limits CCα and
detection capabilities CCβ were calculated using the three-validation series following the Document
SANCO/2004/2726-revision 4 (European Commission 2008). Intraday and inter-day repeatability
(Thompson 2000), representing precision, were calculated using one-way analysis of variance
(ANOVA) expressed as CV % (coefficient of variation). Robustness of the method was evaluated using
the fractional factorial design of Youden (European Commission, 2002). Matrix effect was estimated
according to the protocol described by Matuszewski et al. (2003). For polar pesticides and POPs,
validation had already been carried out following the European Commission (2015) SANTE/2015
guideline and reported in a previous work (Chiesa et al., 2016a). The selectivity of the method was
evaluated by injecting extracted blank honey samples.
The absence of interferences was proved by the lack of peaks with a signal-to-noise ratio higher than 3
at the retention times of the target compounds. Honey samples, previously analysed and checked for

149
the absence of all polar pesticides and POPs, were used as control samples during the optimisation and
validation procedure. For the limit of quantification (LOQ) of the methods, we used the lowest
validated spiked level meeting the requirements of recovery within the range of 70–120% and an RSD
≤ 20%, as defined by the European Commission (2015). Finally, the extraction methods were also
evaluated for their repeatability, linearity and recovery. Recoveries were calculated at LOQ for all
compounds. The repeatability as CV% was calculated by analysing six replicates at the same
fortification level.
2.9. Statistical analysis
As residue concentrations in honey did not follow a normal distribution, checked through the
Kolmogorov–Smirnov test, the non-parametric Kruskal–Wallis ANOVA test was used to evaluate the
differences of contaminants in samples among the productive areas investigated. The level of
significance was set at P ≤ 0.05 throughout this study. Data were analysed using SPSS 15.0 software
(SPSS, Inc., Illinois, USA). In addition, it must be pointed out that, for the calculations, ½ LOD was
used for compounds with a concentration lower than LOD.
3. Results and discussion
3.1. Method validation parameters
The methods showed high specificity, without any interference close to the retention time of each
compound, and consequently a S/N ratio ≥3 in the presence of analytes was confirmed, even at the
lowest detectable concentration demonstrating good selectivity. Matrix validation curves showed good
linearity over the working range with a good fit (R2 > 0.99) for all compounds. The mean recoveries
(from 82 to 120%), with the other validation parameters, are reported in Tables 2 and 3. The CVs %
were lower than 20% for all analytes, satisfying the criteria required by the European Commission
(2015) and specified by Thompson (2000). Regarding the CCα and CCβ for antibiotics and
neonicotinoids, and LOQs for POPs, our satisfactory results showed high method sensitivity for the
selected compounds both for LC-HRMS and GC-MS/MS analyses. Method ruggedness was good for
all compounds. A modest matrix effect was found, with values ranging from 84 116% for the selected
analytes in honey samples.

150
Table 2. Formula, exact theoretical mass of the parents, diagnostic transition and validation parameters
of the selected antibiotics and neonicotinoids.
Compounda Class Formula Exact mass
[m/z]
Main fragment
[m/z]
Ion CCα
(ng g-
1)
CCβ
(ng g-
1)
Recovery
%
intra-day CV
(%)
inter-day CV
(%)
Actamiprid neonicotinoid C10H11ClN4 223.07450 126.01052 (+) 0.51 0.75 90 14 17
Amoxicillin penicillin C16H19N3O5S 366.11182 114.00109 (+) 3.15 3.58 84 13 16
Ampicillin penicillin C16H19N3O4S 350.11690 106.06545 (+) 0.56 0.79 83 13 15
Benzylpenicilli
n
penicillin C16H18N2O4S 335.10600 176.06030 (+) 3.10 3.45 113 14 18
Cefalexin cephalosporin C16H17N3O4S 348.10125 158.02704 (+) 0.54 0.74 87 12 17
Cefquinome cephalosporin C23H24N6O5S2 529.13224 134.09634 (+) 0.58 0.81 97 13 16
Ceftiofur cephalosporin C19H17N5O7S3 524.03629 126.01212 (+) 0.52 0.77 95 16 18
Chloramphenic
ol
amphenicol C11H12Cl2N2O
5
321.00505 257.03409 (-) 0.54 0.82 95 12 15
Chlortetracycli
ne
tetracycline C22H23ClN2O8 479.12157 444.08377 (+) 0.55 0.85 102 11 14
Ciprofloxacin fluoroquinolo
ne
C17H18FN3O3 332.14050 288.15005 (+) 0.51 0.81 112 10 12
Clothianidin neonicotinoid C6H8ClN5O2S 250.01600 169.05406 (+) 0.57 0.89 86 10 13
Danofloxacin fluoroquinolo
ne
C19H20FN3O3 358.15615 314.16579 (+) 0.55 0.90 93 11 12
Dimetridazole nitroimidazol
e
C5H7N3O2 142.06110 112.06335 (+) 0.61 0.98 89 13 15
Dinotefuran neonicotinoid C7H14N4O3 203.11387 129.08963 (+) 0.59 0.92 90 12 14
Doxycycline tetracycline C22H24N2O8 445.16054 410.12305 (+) 0.55 0.90 106 11 14
Enrofloxacin fluoroquinolo
ne
C19H22FN3O3 360.17180 316.18188 (+) 0.52 0.81 113 9 11
Florfenicol amphenicol C12H14Cl2FNO
4S
355.99319 185.02769 (-) 0.54 0.83 95 11 14
Florfenicol
amine
amphenicol C10H14FNO3S 248.07512 130.06515 (+) 0.57 0.88 96 10 15
Flumequine quinolone C14H12FNO3 262.0874 244.07686 (+) 0.62 0.96 86 14 16
Furaltadone nitrofuran C13H16N4O6 325.11426 100.07608 (+) 0.53 0.87 90 14 18
Furazolidone nitrofuran C8H7N3O5 226.04585 95.03703 (+) 0.57 0.90 87 11 13
Imidacloprid neonicotinoid C9H10ClN5O2 256.05958 209.05874 (+) 0.55 0.80 87 11 15
Lincomycin lincosamide C18H34N2O6S 407.22103 126.12775 (+) 0.55 0.79 90 10 12
Lomefloxacin fluoroquinolo
ne
C17H19F2N3O3 352.14672 265.11438 (+) 0.51 0.77 120 9 11
Marbofloxacin fluoroquinolo
ne
C17H19FN4O4 363.14631 320.10410 (+) 0.53 0.75 110 9 10
Nalidixic acid quinolone C12H12N2O3 233.09207 205.06041 (+) 0.52 0.72 96 12 17
Nytempiram neonicotinoid C11H15ClN4O2 271.09563 225.10242 (+) 0.57 0.85 88 14 16
Nitrofurazone nitrofuran C6H6N4O4 199.04618 152.96921 (+) 0.57 0.91 90 14 18
Oxolinic acid quinolone C13H11NO5 262.07100 244.06044 (+) 0.54 0.78 98 13 19

151
Oxytetracyclin
e
tetracycline C22H24N2O9 461.15546 426.11816 (+) 0.51 0.73 107 14 15
Ronidazole nitroimidazol
e
C6H8N4O4 201.06183 140.04529 (+) 0.60 0.94 85 12 14
Spyramicin * macrolide C43H74N2O14 422.26428 174.11231 (+) 0.58 0.91 91 15 19
Sulfadiazine sulfonamide C10H10N4O2S 251.05972 156.01120 (+) 0.59 0.96 83 14 16
Sulfadimethoxi
ne
sulfonamide C12H14N4O4S 311.08085 156.07666 (+) 0.62 0.99 82 14 15
Sulfadimidine sulfonamide C12H14N4O2S 279.09102 149.02325 (+) 0.61 0.94 82 13 17
Sulfamerazine sulfonamide C11H12N4O2S 265.07537 156.01135 (+) 0.57 0.79 87 12 13
Sulfathiazole sulfonamide C9H9N3O2S2 256.02089 156.01120 (+) 0.54 0.77 82 13 19
Tetracycline tetracycline C22H24N2O8 445.16054 410.12305 (+) 0.54 0.74 116 11 16
Thiacloprid neonicotinoid C10H9ClN4S 253.03092 126.01062 (+) 0.58 0.81 84 13 16
Thiamethoxam neonicotinoid C8H10ClN5O3S 292.02656 211.06470 (+) 0.55 0.80 96 13 14
Thiamphenicol amphenicol C12H15Cl2NO5
S
353.99752 185.02805 (-) 0.56 0.81 88 9 11
Tiamulin diterpene C28H47NO4S 494.32986 192.10501 (+) 0.64 0.96 114 12 15
Tilmicosine * macrolide C46H80N2O13 435.2903 174.11232 (+) 0.65 0.92 97 14 19
Tinidazole nitroimidazol
e
C8H13N3O4S 248.06995 121.03193 (+) 0.59 0.97 90 13 18
Trimethoprim sulfonamide C14H18N4O3 291.14517 245.10294 (+) 0.53 0.76 104 8 12
Tylosin macrolide C46H77NO17 916.52643 174.11229 (+) 0.55 0.78 94 10 12
Enrofloxacin-
d5
IS C19D5H17FN3
O3
365.20318 321.21289 (+) - - - - -
*in these cases the double charged species [M+2H]+2 were considered; a= reported in alphabetic order
Table 3. Formula, exact theoretical mass of the parents, diagnostic transition and validation parameters
of the selected polar pesticides.
Compound Formula Exact mass
[m/z] Main fragment
[m/z] Ion
LOQ (ng g-
1) Recovery
% intra-day
CV% inter-day
CV%
Atrazin C8H14ClN5 216.10105 174.05385 (+) 8.80 87 12 16
Azinphos-ethyl C12H16N3O3PS2
346.04435 114.96143 (+) 8.91 89 13 15
Azinphos-methyl C10H12N3O3PS
2
318.01305 142.99245 (+) 8.15 83 14 17
Azoxystrobin C22H17N3O5 404.1241 372.09729 (+) 8.05 90 12 17
Benalaxyl C20H23NO3 326.17507 148.11185 (+) 8.11 91 11 15
Bitertanol C20H23N3O2 338.18630 70.04069 (+) 7.92 93 10 14
bupirimate C13H24N4O3S 317.16419 108.01172 (+) 8.95 90 14 17
Buprofezin C16H23N3OS 306.16346 201.10551 (+) 7.70 95 12 16
Cadusafos C10H23O2PS2 271.09498 158.96980 (+) 9.05 88 14 19
Chlorfenvinphos C12H14Cl3O4P 358.97681 155.04663 (+) 9.11 85 13 18
Cyproconazol C15H18ClN3O 292.12112 70.04073 (+) 9.24 87 11 15

152
Cyprodinil C14H15N3 226.13387 108.08103 (+) 9.52 82 14 19
Ethoxyquin C14H19NO 218.15394 190.12244 (+) 8.87 85 13 17
Fenamiphos C13H22NO3PS 304.11308 217.00816 (+) 8.23 91 13 15
Fenarimol C17H12Cl2N2O 331.03994 81.04534 (+) 9.54 85 14 19
Fludioxonil* C12H6F2N2O2 266.07356 227.04482 (+) 9.05 84 14 18
Flusilazole C16H15F2N3Si 316.10761 165.06987 (+) 9.15 82 15 19
Furalaxyl C17H19NO4 302.13868 95.01640 (+) 7.78 87 11 14
Kresoxim-methyl C18H19NO4 314.13868 222.09219 (+) 8.00 89 12 15
Malathion C10H19O6PS2 331.04334 99.00809 (+) 7.65 93 11 14
Metalaxyl C15H21NO4 280.15433 220.13306 (+) 7.50 96 9 12
Methidathion C6H11N2O4PS3 302.96913 145.00656 (+) 8.47 92 10 13
Oxadixyl C14H18N2O4 279.13393 219.11262 (+) 8.85 91 11 16
Paraoxon-methyl C8H10NO6P 248.03185 234.02864 (+) 9.80 88 13 17
Phosalone C12H15ClNO4PS2
367.99414 182.00029 (+) 9.56 85 14 19
Piperonyl
butoxide*
C19H30O5 356.24315 177.09122 (+) 7.93 92 12 15
Pirimicarb C11H18N4O2 239.15025 72.04513 (+) 7.67 95 11 14
Pirimiphos-ethyl C13H24N3O3PS 334.13488 198.1058 (+) 7.15 98 10 13
Pirimiphos-methyl C11H20N3O3PS 306.10358 108.05595 (+) 7.38 97 11 14
Profenophos C11H15BrClO3P
S
372.94242 344.91083 (+) 8.10 90 13 18
Propachlor C11H14ClNO 212.08367 170.03662 (+) 7.07 96 11 14
Propargite * C19H26O4S 368.18901 231.17419 (+) 8.22 91 13 16
Pyrazophos C14H20N3O5PS 374.0934 194.55950 (+) 7.29 95 10 13
Quinalphos C12H15N2O3PS 299.06138 147.05527 (+) 8.89 84 15 19
Simazine C7H12ClN5 202.0854 132.03226 (+) 9.03 85 14 19
Tetrachlorvinphos C10H9Cl4O4P 364.90653 127.01553 (+) 8.55 87 12 16
Tetraconazole C13H11Cl2F4N3O
372.02881 91.05791 (+) 9.33 83 14 18
Triazophos C12H16N3O3PS 314.07228 162.06616 (+) 8.15 89 14 17
IS: 4-nonylphenol C15H24O 219.17544 133.06580 (-)
* The [M+NH4]+ adduct were considered.
3.2. Application to organic honey samples
Overall results in terms of number detected, concentration levels and distribution of contaminant
residues and antibiotics in the organic honey samples investigated are summarised in Table 4 and
Figure 1. A total ion current (GC-MS/MS) chromatograms of blank honey samples spiked with
investigated compounds and a naturally contaminated sample are shown in figures 2 and 3.

153
Table 4. Distribution of contaminant residues in 77 organic honeys from different productive areas.
Concentration are expressed as single value, when only one positive was detected, or mean ± sd, ng
High anthropization
(Na=15)
Intensive farming
(Na =15)
Intensive farming
/husbandry
(Na =25)
Intensive husbandry
(Na =10)
Low anthropization
(Na =12)
MRL
nb nb na nb nb ng g-1
PCB (ICES-6)
PCB 28 5.33 1 35.1 1 nd - nd - 19.2±14 4 -
PCB 52 127 1 1
93.8 ± 20.1
2 nd - nd - 35.5±31.7 4 -
PCB 101 5.15 1 22.4 1 nd - nd - 80.2 ±105 4 -
PCB 138 105 1 Nd - nd - nd - 77.3 ±57.0 4 -
PCB 153 118 1 Nd - nd - nd - 61.6 ± 26.9 4 -
PCB 180 7.56 1 Nd - nd - nd - 5.40 ± 0.66 3 -
PBDEs
PBDE 28 4.06 1 Nd - nd - nd - 2.35 ± 1.20 2 -
PBDE 33 Nd - Nd - nd - nd - 0.80 1 -
PBDE 47 5.90 1 Nd - nd - nd - Nd - -
PBDE 99 1.61 1 Nd - 3.12 1 nd - 0.88 1 -
PBDE 100 Nd - Nd - 7.98 1 nd - 1.31 1 -
PBDE 153 36.9 1 Nd - Nd - nd - 62.7 ± 68.1 2 -
PBDE 154 Nd - Nd - Nd - nd - 0.99 1 -
OCs
α HCH Nd - 7.78 1 Nd - nd - Nd - -
β BHC Nd - Nd - Nd - nd - Nd - -
Hexachlorbenzene Nd - 69.7 1 Nd - nd - Nd - 10
Lindane Nd - 11.9±7.73 2 Nd - nd - Nd - 10
Heptachlor Nd - 51.0 1 Nd - nd - Nd - 10
Aldrin Nd - 59.9 1 Nd - nd - Nd - 10
Heptachlor epoxide Nd - 53.5 1 Nd - nd - Nd - 10
Trans chlordane Nd - - - Nd - nd - Nd - 10
Endosulfan I Nd - Nd - Nd - nd - Nd - 10
Endosulfan II Nd - 20.6 1 Nd - nd - Nd - 10
pp' DDE Nd - 60.6 1 Nd - nd - 5.30 1 50

154
Endosulfan Sulfate Nd - nd - Nd - nd - Nd - 10
Endrin Nd - 104 1 Nd - nd - Nd - 10
op’ DDT Nd - Nd - Nd - nd - Nd - 50
pp’ DDD Nd - 78.4 1 Nd - nd - 23.0 1 50
pp’ DDT Nd - 10.5 1 Nd - nd - Nd - 50
PAHs
Chrysene Nd - Nd - Nd - nd - 6.32 1 -
Antracene Nd - Nd - Nd - nd - 51.5 ±45.2 2 -
Benzofluoranthene Nd - Nd - Nd - nd - 85.7± 103 2 -
Benzopyrene 42.7 1 Nd - Nd - nd - 94.0 ± 137 3 -
OPs
Ethoprophos Nd - Nd - Nd - nd - Nd - -
Phorate Nd - 39.8 1 Nd - nd - Nd - 10
Demeton Nd - 344 1 Nd - nd - Nd - 10
Diazinon Nd - 22.9 1 Nd - nd - Nd - 10
Disulfoton Nd - 50.9 1 Nd - nd - 2.05 1 10
Chlorpyrifos Nd - 28.4 1 Nd - nd - Nd - 50
Mevinphos 9.92 ± 10.1
14 27 ± 61 11 1.65± 0.64 25 nd - 3.60 ± 1.35 10 -
Antibiotics
Amoxicillin nd - nd - nd - nd - Nd - -
Ampicillin nd - nd - nd - nd - nd - -
Benzylpenicillin nd - nd - nd - nd - nd - -
Cefalexin nd - nd - nd - nd - nd - -
Cefquinome nd - nd - nd - nd - nd - -
Ceftiofur nd - nd - nd - nd - nd - -
Chloramphenicol nd - nd - nd - nd - nd - -
Chlortetracycline nd - nd - nd - nd - nd - -
Ciprofloxacin nd - nd - nd - nd - nd - -
Danofloxacin nd - nd - nd - nd - nd - -
Dinotefuran nd - nd - nd - nd - nd - -
Doxycycline nd - nd - nd - nd - nd - -
Enrofloxacin nd - nd - nd - nd - nd - -
Florfenicol nd - nd - nd - nd - nd - -
Florfenicol amine nd - nd - nd - nd - nd - -
Flumequine nd - nd - nd - nd - nd - -
Furaltadone nd - nd - nd - nd - nd - -

155
Furazolidone nd - nd - nd - nd - nd - -
Lincomycin nd - nd - nd - nd - nd - -
Lomefloxacin nd - nd - nd - nd - nd - -
Marbofloxacin nd - nd - nd - nd - nd - -
Nalidixic acid nd - nd - nd - nd - nd - -
Nitrofurazone nd - nd - nd - nd - nd - -
Oxolinic acid nd - nd - nd - nd - nd - -
Oxytetracycline nd - nd - nd - nd - nd - -
Ronidazole nd - nd - nd - nd - nd - -
Spyramicin nd - nd - nd - nd - nd - -
Sulfadiazine nd - nd - nd - nd - nd - -
Sulfadimethoxine nd - nd - nd - nd - nd - -
Sulfadimidine nd - nd - nd - nd - nd - -
Sulfamerazine nd - nd - nd - nd - nd - -
Sulfathiazole nd - nd - nd - nd - nd - -
Tetracycline nd - nd - nd - nd - nd - -
Thiamphenicol nd - nd - nd - nd - nd - -
Tiamulin nd - nd - nd - nd - nd - -
Tilmicosine nd - nd - nd - nd - nd - -
Tinidazole nd - nd - nd - nd - nd - -
Trimethoprim nd - nd - nd - nd - nd - -
Tylosin nd - nd - nd - nd - nd - -
Neonicotinoids
Actamiprid nd - nd - nd - nd - nd - -
Clothianidin nd - nd - nd - nd - nd - 50
Dimetridazole nd - nd - nd - nd - nd - -
Imidacloprid nd - nd - nd - nd - nd - 50
Nytempiram nd - nd - nd - nd - nd - -
Thiacloprid nd - nd - nd - nd - nd - 200
Thiamethoxam nd - nd - nd - nd - nd - 50
Polar pesticides
Atrazin nd - nd - nd - nd - nd - 50
Azinphos-ethyl nd - nd - nd - nd - nd - -
Azinphos-methyl nd - nd - nd - nd - nd - -
Azoxystrobin nd - nd - nd - nd - nd - 50
Benalaxyl nd - nd - nd - nd - nd - -

156
Bitertanol nd - nd - nd - nd - nd - 50
bupirimate nd - nd - nd - nd - nd - 50
Buprofezin nd - nd - nd - nd - nd - 50
Cadusafos nd - nd - nd - nd - nd - 10
Chlorfenvinphos nd - nd - nd - nd - nd - 10
Cyproconazol nd - nd - nd - nd - nd - 50
Cyprodinil nd - nd - nd - nd - nd - 50
Ethoxyquin nd - nd - nd - nd - nd - 50
Fenamiphos nd - nd - nd - nd - nd - 10
Fenarimol nd - nd - nd - nd - nd - 50
Fludioxonil nd - nd - nd - nd - nd - 50
Flusilazole nd - nd - nd - nd - nd - 50
Furalaxyl nd - nd - nd - nd - nd - -
Kresoxim-methyl nd - nd - nd - nd - nd - -
Malathion nd - nd - nd - nd - nd - 50
Metalaxyl nd - nd - nd - nd - nd - 50
Methidathion nd - nd - nd - nd - nd - 20
Oxadixyl nd - nd - nd - nd - nd - 10
Paraoxon-methyl nd - nd - nd - nd - nd - 10
Phosalone nd - nd - nd - nd - nd - 10
Piperonyl butoxide nd - nd - nd - nd - nd - -
Pirimicarb nd - nd - nd - nd - nd - 50
Pirimiphos-ethyl nd - nd - nd - nd - nd - -
Pirimiphos-methyl nd - nd - nd - nd - nd - 50
Profenophos nd - nd - nd - nd - nd - 50
Propachlor nd - nd - nd - nd - nd - 20
Propargite nd - nd - nd - nd - nd - 50
Pyrazophos nd - nd - nd - nd - nd - 50
Quinalphos nd - nd - nd - nd - nd - 50
Simazine nd - nd - nd - nd - nd - 10
Tetrachlorvinphos nd - nd - nd - nd - nd - -
Tetraconazole nd - nd - nd - nd - nd - 20
Triazophos nd - nd - nd - nd - nd - 50
nd = not detected; a = standard deviation; b = detection frequency

157
Fig 1. Detection frequency of xenobiotic compounds in organic honeys from different productive areas
Fig 2. Total ion current (GC-MS/MS) chromatogram of blank organic honey samples spiked with some
investigated compounds.

158
Fig 3. Total ion current (GC-MS/MS) chromatogram of organic honey sample naturally contaminated
with some contaminats
Among the POPs, the six PCBs examined were found in 3 of 5 areas (HA, IF, LA) with relatively low
detection frequencies ranging from 6.7% to 33.3 %. However, this aspect requires particular
consideration, primarily because in two areas - HA and LA - all 6 congeners were found. In particular,
area HA includes two zones in the province of Milan (Lombardy) and one in the province of Novara
(Piedmont). All these zones are characterized by significant industrial activities and a strong
urbanization impact, also with the presence of important highway junctions nearby. Area LA was
chosen as a less densely populated representative area characterized mainly by woodland vegetation,
with small roads, except for some motorways at a minimum distance of 3 km. In the two zones of this
area, we found 4 out of 12 samples with concentration range 4.39-234 ng g -1. Their presence in this
apparently unspoiled area confirmed the theory that nowadays PCBs are ubiquitous contaminants, as
reported in others works (Chiesa et al. 2016a; Panseri et al., 2014; Tette et al., 2016; Herrera et
al.,2005). Their presence in the environment can be regardless of their proximity to industrial contexts
and therefore of their territorial origin (Chiesa et al. 2016a; Blasco et al., 2004). A similar consideration
has to be made regarding area IF, located in Emilia Romagna, characterised by intensive agriculture.
Despite the fact that the hives were located close to fields, woods, vineyards and orchards, one sample

159
showed the presence of PCBs 28, 52, 101 and one sample of the congener 52 (Table 4). Considering
honey taken from the market, of the 18 analysed samples only one from Hungary showed the presence
of 5 of the 6 congeners investigated, with concentration range 10.5 (PCB 52)-44.1 (PCB 28) ng g-1.
Overall data concerning PCBs showed that there are no significant differences in concentrations among
the investigated areas and therefore PCB contamination is not influenced by the sample’s source. A
similar phenomenon was observed for brominated flame retardants (BFRs). This research showed that
they were present in 3 out of 5 areas (HA, LA, FH) and absent in the market samples. Regarding FH
area, PBDE congeners 99 and 100 were found in just one sample at the concentrations of 3.12 ng g -1
and 7.98 ng g -1, respectively. The PBDE concentrations regarding areas HA and LA appear more
noteworthy. Four congeners were detected in one sample in the HA area from the zone of Milan and 6
congeners were detected in two samples from Novara and VCO, with maximum concentrations higher
for one order of magnitude. In particular PBDE 153 showed a concentration higher than area HA, 111
ng g -1 versus 36.9 ng g -1. The scarce literature regarding BFR monitoring plans in honey, confirms
their presence in the environment. Our results agree with a previous study that shows a higher
concentration in the LA area characterised by woodlands than in area HA with industrial activities
(Chiesa et al. 2016a). About polycyclic aromatic hydrocarbons (PAHs), our work shows that samples
showing high concentrations of the 4 polycyclic aromatic hydrocarbons belonged to areas HA and,
mostly, LA. In this last area benzofluoranthene and anthracene were found in 2 samples with the
highest
concentrations of 158 ng g -1 and 83.5 ng g -1. Benzopyrene, on the other hand, was the only
hydrocarbon present in both HA and LA areas, quantified at 42.7 ng g -1 and 252 ng g -1, respectively.
Their presence is probably due to the fact that they are a category of chemicals that derives from
various processes, both natural, such as forest fires, and industrial, such as combustion processes at
high temperatures, so the environment and conditions probably have significant roles in the presence of
this class of pollutants. OCPs were only found in 2 areas. Residues of pp’DDE and pp’DDD in a single
sample were found with a concentration of 5.39 ng g -1 and 24.0 ng g -1, respectively, in area LA. The
presence of organochlorine pesticide residues in eastern Piedmont has already been demonstrated by
Chiesa et al (2014) at concentrations of pp’DDE and pp’DDD of 8.8 ng g -1and 2 ng g -1. Although the
use of OCPs was banned in the 1970s, their presence in the environment is due to their chemical
properties, since their high stability, low volatility and lipophilic nature ensure the tendency to persist

160
in the environment and accumulate in foods. In one sample of area IF, dedicated to agricultural
production with orchards, cereal crops and vineyards, almost all OCP compounds were detected at
concentrations ranging from 7.80 ng g-1 of α HCH to 103 ng g-1 of endrin. Other OCPs were only
sporadically detected. As regards commercial honeys, three of the 18 samples analysed were found to
have different OCPs at varying concentrations. One sample from Hungary showed the presence of α
HCH (8.38 ng g-1), lindane (16.9 ng g-1), aldrin (172 ng g-1, and endrin (99.9 ng g-
1); the second, from Ukraine, showed a concentration of lindane (116 ng g-1), heptachlor (5.93 ng g-1),
aldrin (196 ng g-1), pp’DDE (9.22 ng g-1) and endosulfan II (415 ng g-1). The third, a mixture of
honeys of different origins, in particular Moldovan-Bulgarian and Argentinean, showed a concentration
of heptachlor (8.54 ng g-1), aldrin (110 ng g-1), endosulfan sulfate (635 ng g -1), endosulfan II (38.3
ng g-1) and pp’DDD (6.94 ng g -1). Particular attention must be given to OPs. Demeton, diazinon, and
disulfoton were found in just one sample from the intensive cultivation area at concentration higher
than the EU maximum level (ML) of 0.01 mg kg-1, together with chlorpyrifos at permitted
concentration. The honey from the market showed the presence of demeton, disulfoton and
chlorpyrifos. In particular, Disulfotonwas detected in 2 samples, coming from Ukraine and Hungary,
with the same concentrations of 65 ng g-1, exceeding the MRLs. Mevinphos has been found in almost
all samples from 4 of 5 areas at higher concentrations and detection frequencies if compared to other
substances, even if its use is not permitted. Mevinphos was used in the past mainly for vineyard pest
defence and its chemical properties allow it to persist in the environment (EPA 1996). Particularly
striking are the high frequencies in area FH, characterized by the presence of husbandry farms and
large vineyards. Regarding its toxicity, Mevinphos is active by contact inhalation and ingestion. The
biochemical mechanism of Mevinphos acute toxicity is through inhibition of acetylcholinesterase,
causing nerve paralysis, with possible consequences like convulsions, coma, pulmonary oedema,
muscle paralysis and death by respiratory blockage (EPA 1994). However, it has no Maximum
Residual Limits for honeys, while a MRL for agricultural products has been set at 0.01 mg kg -1. The
presence of mevinphos could be traced back to its past use and environmental persistence, as Panseri et
al (2014) demonstrated. As regards the analysis of antibiotics, neonicotinoids and polar pesticides, no
residues were found in organic honey samples. Some conclusions can be made: the sources of honey
contamination can be divided into environmental (heavy metals such as lead, radioactive isotopes,
organic pollutants, pesticides, pathogenic bacteria and genetically modified organisms) and apicultural

161
(acaricides, antibiotics etc.). In the first case the contaminants can reach the beehive: through air and
water by means of bees, which can transport them directly into the colony; through the air, water and
soil reaching plants, which can then pass them on through nectar and honeydew. In the case of
apicultural techniques contaminants are due to beekeepers’ use of antibiotics directly on the beehive for
the control of bacterial honeybee diseases (Bogdanov 2006). Indeed, it can be said that for POPs the
environmental contamination and transport of the substances through bees is effective and
demonstrated with the detected residues in honeys. In the case of antibiotics, the environmental context
near agricultural or livestock areas has not shown any contamination or possible transfer of antibiotics
to honeys. On the other hand, when antibiotics were reported in the literature (Table 5), authors always
refer to contamination which was strictly related to beekeeping practices. So, on the basis of our
application, the contamination of antibiotics appears to be merely linked to beekeeping techniques. In
fact, as regards the organic honeys examined in this study, the absence of treatment directly on the
hives was ascertained, confirming the suitability of our analytical methods and consequently the good
and effective quality of our organic honey samples collected in different areas. Finally, even a negative
result appears important due to the undefined regulatory European situation regarding limits on
antibiotics in honey. In conclusion, the optimised analytical method was applied to survey contaminant
residues through samples produced in different areas characterized by different contamination sources.
The determination of residues in the environment and food is important in order to avoid human
exposure by dietary intake. Based on our results, it can be confirmed that honey is an optimal matrix
for environmental pollutant research and bees are a suitable bioindicator to survey environmental
pollution. The results have shown some peculiarities. In particular, OCs and Ops were found in the
farming area, as we expected, confirming that the contamination could be linked to the area. The
husbandry area have been shown to be free of any kind of contamination. The presence of several
compounds, such as PCBs, PBDE and PAHs was confirmed, not only in proximity to highly urbanised
centres, where the concentrations were higher, but in all environment contexts, confirming the theory
that nowadays PCBs are ubiquitous contaminants. Particular concern regards honey samples coming
from area LA, chosen as an area hypothetically free from contaminants and where a lower
concentration of contaminants was expected; the contamination was instead evident, and the area was
mostly polluted by PCBs, PBDEs and PAHs, suggesting industrial sources. They may be present in the
environment regardless of proximity to industrial regions. The situation was totally different for

162
antibiotic residues that were not found in any organic honeys regardless of the production area. This
phenomenon could provide interesting evidence of the close relationship between the presence of
antibiotics and its respective provenance from beekeeping practices rather than from areas also
involved in intensive breeding contexts. This kind of approach is important in order to indicate that
beekeepers select untreated production areas, suitable for organic honey, especially when its demand is
increasing for its nutritional properties, and to guarantee quality for health.
Disclosure statement
No potential conflict of interest was reported by the authors.
Acknowledgements
This work was partially funded according to the project: “Distribution and risk assessment of
xenobiotics in different foods of animal origin and their role for food safety” - Piano di Sostegno alla
Ricerca 2017 - Linea 2 – Azione A
References:
Alfredsson G, Branzell C, Granelli K, Lundström Å. 2004. Simple and rapid screening and
confirmation of tetracyclines in honey and egg by a dipstick test and LC-MS/MS. Anal Chim Acta.
529: 47-51.
Anonymous 2016a. Collection residues: Statutory surveillance results. Statistics/Residues of veterinary
medicines in food. Veterinary Medicines Directorate. Retrieved from https://
www.gov.uk/government/statistics?departments%5B%5D=veterinary-medicines-directorate.
Anonymous 2016b. Recalls, market withdrawals, & safety alerts. FDA. Retrieved from
http://www.fda.gov/Safety/Recalls/default.htm.
Anonymous 2016c. Food recalls and allergy alerts site. Canadian Food Inspection Agency. Retrieved
from http://www.inspection.gc.ca/english/corpaffr/recarapp/recaltoce.shtml.
Anonymous 2017. Notifications list. RASFF Portal. Retrieved from https://webgate.ec.europa.eu/rasff-
window/portal/?event=SearchForm&cleanSearch=1

163
Baggio A, Gallina A, Benetti C, Mutinelli F. 2009. Residues of antibacterial drugs in honey from the
Italian market. Food Addit. Contam. Part B. 2: 52-58.
Beatrice B, Riccardo C, Edoardo M. 2003. Presenza degli idrocarburi policiclici aromatici negli
alimenti. Istituo Superiore di Sanita’, Rapporti ISTISAN 03/22.
Benetti C, Piro R, Binato G, Angeletti R, Biancotto G. 2006. Simultaneous determination of
lincomycin and five macrolide antibiotic residues in honey by liquid chromatography
coupled to electrospray ionization mass spectrometry (LC-MS/MS). Food Addit Contam. 23: 1099-
1108.
Berrie A and Cross J. 2005. Development of an integrated pest and disease management system for
apples to produce fruit free from pesticide residues. IOBC. 28: 23-31.
Blasco C, Fernandez M, Pena A, Lino C, Silveira MI, Font G. 2003. Assessment of pesticide residues
in honey samples from Portugal and Spain. J. Agric. Food Chem. 51: 8132-8138.
Blasco C, Fernandez M, Pico Y, Font G. 2004. Comparison of solid-phase microextraction and stir bar
sorptive extraction for determining six organophosphorus insecticides in honey by liquid
chromatographyemass spectrometry. J. Chromatogr. A. 1030: 77- 85.
Blasco C, Vazquez-Roig P, Onghena M, Masia A, Picó Y. 2011. Analysis of insecticides in honey by
liquid chromatography–ion trap-mass spectrometry: Comparison of different extraction procedures. J.
Chromatogr. A. 1218: 4892– 4901.
Bogdanov S. 2006. Contaminants of bee products. Apidologie. 37(1): 1-18.21
Chiesa L, Nobile M, Arioli F, Britti D, Trutic N, Pavlovic R, Panseri S. 2015. Determination of
veterinary antibiotics in bovine urine by liquid chromatography–tandem mass spectrometry. Food
Chem. 185: 7-15.
Chiesa LM, Labella GF, Giorgi A, Panseri S, Paplovic R, Bonacci S, Arioli F. 2016a. The occurrence
of pesticides and persistent organic pollutants in Italian organic honeys from
different productive areas in relation to potential environmental pollution. Chem. 154: 482- 490.

164
Chiesa LM, Nobile M, Panseri S, Biolatti B, Cannizzo FT, Pavlovic R, Arioli, F. 2016b. A Liquid
Chromatography–Tandem Mass Spectrometry Method for the Detection of Antimicrobial Agents from
Seven Classes in Calf Milk Replacers: Validation and Application. J. Agric. Food Chem. 64(12): 2635-
2640.
Chiesa LM, Nobile M, Panseri S, Arioli F. 2017. Antibiotic use in heavy pigs: Comparison between
urine and muscle samples from food chain animals analysed by HPLC-MS/MS. Food Chem.235: 111-
118.
Chiesa LM, Nobile M, Malandra R, Panseri S, Arioli F. 2018. Occurrence of antibiotics in mussels and
clams from various FAO areas. Food Chem. 240: 16-23.
Debayle D, Dessalces G, Grenier-Loustalot MF. 2008. Multi-residue analysis of traces of pesticides
and antibiotics in honey by HPLC-MS-MS. Anal. Bioanal. Chem. 391: 1011-1020.
EFSA. 2013a. Conclusion on the risk assessment for bees for the active substance clothianidin. EFSA
J. 11(1):3066, pp. 1-58. 10.2903/j.efsa.2013.3066
EFSA. 2013b. On pesticide peer review. Conclusion on the peer review of the pesticide risk assessment
for bees for the active substance imidacloprid. EFSA J. 11 (1):3058, pp.1-55. 10.2903/j.efsa.2013.3068
EFSA. 2013c. Conclusion on the risk assessment for bees for the active substance thiamethoxam.EFSA
J. 11(1): 3067, pp.1-68. 10.2903/j.efsa.2013.3067
European protection agency (EPA). 1994. Registration Eligibility Decision (Red) fact sheet
Menvinphos. EPA -738-F-R94-020-023.
European Commission. 2002. Commission Decision 2002/657/EC of 12 August 2002 implementing
Council Directive 96/23/EC concerning the performance of analytical methods and the interpretation of
results. Official Journal of the European Union, L221, 8–36.
European Commission. 2005. Regulation (EC) No 396/2005 on maximum residue levels of pesticides
in or on food and feed of plant and animal origin and amending Council Directive 91/414/EEC. OJ L
70: pp. 1-2640. 22

165
European Commission. 2008. European Commission, Health and Consumer Protection, Directorate
General, Directorate E, Safety of the Food Chain, Document SANCO/2004/2726-revision 4, December
2008, Guidelines for the Implementation of Decision 2002/657/EC.
European Commission. 2015. SANTE/11945/2015. Guidance document on analytical quality control
and method validation procedures for pesticides residues analysis in food and feed, pp.1-42.
FDA. 2007. Tolerances for residues on new animal drugs in food. Code of Federal Regulations, Food
and Drugs, Part 556, Title 21; Office of the Federal Register, National Archives andRecords
Administration: Washington, DC.Galarini R, Saluti G, Giusepponi D, Rossi R, Moretti S. 2015.
Multiclass determination of 27 antibiotics in honey. Food Control. 48: 12-24.
Gbylik-Sikorska M, Sniegocki T, Posyniak A. 2015. Determination of neonicotinoid insecticides and
their metabolites inhoney bee and honey by liquid chromatography tandem massspectrometry. J.
Chromatogr. B. 990: 132-140.
Gómez-Pérez ML, Plaza-Bolaños P, Romero-González R, Martínez-Vidal JL, Garrido-Frenich A.2012.
Comprehensive qualitative and quantitative determination of pesticides and veterinary drugs in honey
using liquid chromatography–Orbitrap high resolution mass spectrometry. J. Chromatogr. A. 1248:
130-138.
He J, Song L, Chen S, Li Y, Wei H, Zhao D, Gu K, Zhang S. 2015. Novel restricted accessmaterials
combined to molecularly imprinted polymers for selective solid-phase extraction oforganophosphorus
pesticides from honey. Food Chem. 187: 331-337
Herrera A, Peréz-Arquillué, Conchello P, Bayarri S, Lázaro R, Yagüe C, Arino A. 2005. Determiantion
of Pesticides and PCBs in honey by solid phase extraction clean up followed by gas chromatography
with electron-capture and nitrogen-phosphorus detection. Anal. Bioanl. Chem. 381: 695-701
Italian Ministry of Health. 2017. Direzione generale per l’igiene e la sicurezza degli alimenti e la
nutrizione. Piano Nazionale Residui 2017.
Ji S, Zhang F, Luo X, Yang B, Jin G, Yan J, Liang X. 2013. Synthesis of molecularly imprinted
polymer sorbents and application for the determination of aminoglycosides antibiotics in honey. J.
Chromatogr. A. 1313: 113-118. 23

166
Jin Y, Zhang J, Zhao W, Zhang W, Wang L, Zhou J, Li Y. 2017. Development and validation of a
multiclass method for the quantification of veterinary drug residues in honey and royal jelly by liquid
chromatography–tandem mass spectrometry. Food Chem. 221: 1298-1307.
Jovanov P, Guzsvány V, Lazić S, Franko M, Sakač M, Šarić L, Kos J. 2015. Development of HPLC-
DAD method for determination of neonicotinoids in honey. J. Food Compost. Anal. 40: 106-113.
Kasiotis KM, Anagnostopoulos C, Anastasiadou P, Machera K. 2014. Pesticides residues inhoneybees,
honey and bee pollen by LC-MS/MS screening: Reported death incidents in honeybees. Science of
Total Environ. 485-486, 633-642.
Kaufmann A, Roth S, Ryser B, Widmer M, Guccisberg D. 2002. Quantitative LC-MS/MS
determination of sulphonamides and some other antibiotics in honey. J AOAC Int. 85: 853-860.
Lambert O, Piroux M, Puyo S, Thorin C, L'hostis M, Wiest L, Buleté A, Delbac F, Pouliquen
H2013.Widespread occurrence of chemical residues in beehive matrices from apiaries locatedin
different landscapes of Western France. Plos One. (8) 67007: 1-12.
LeDoux M. 2011. Analytical methods applied to the determination of pesticide residues in foods of
animal origin. A review of the past two decades. J. Chromatogr. A. 1218: 1021–1036.
Liu HY, Lin SL, Fuh MR. 2016. Determination of chloramphenicol, thiamphenicol and florfenicol in
milk and honey using modified QuEChERS extraction coupled with polymeric monolithbased capillary
liquid chromatography tandem mass spectrometry. Talanta. 150: 233-239.
Lombardo-Agüí M, García-Campaña AM, Gámiz-Gracia L, Cruces-Blanco C. 2012. Determination of
quinolones of veterinary use in bee products by ultra-high performance liquid chromatography–tandem
mass spectrometry using a QuEChERS extraction procedure. Talanta. 93: 193-199.
Malhat FM, Haggag MN, Loutfy NM, Osman MAM. 2015. Residues of organochlorine and synthetic
pyrethroid pesticides in honey, an indicator of ambient environment, a pilot study. Chem. 120: 457-
461.
Marini L, Quaranta M, Fontana P, Biesmeijer JC, Bommarco R. 2012. Landscape context and elevation
affect pollinator communities in intensive apple orchards. Basic and Appl. Ecolog. 13: 681-689.

167
Matuszewski BK, Constanzer ML, Chavez-Eng CM. 2003. Strategies for the assessment of matrix
effect in quantitative bioanalytical methods based on HPLC-MS/MS. Anal. Chem. 75: 3019-3030.
Panseri S, Catalano A, Giorgi A, Arioli F, Procopio A, Britti D, Chiesa L.M. 2014. Occurrence of
pesticide residues in Italian honey from different areas in relation to its potential contamination
sources. Food Contrl. 38: 150-156.
Paradis D, Bérail G, Bonmatin JM, Belzunces LP. 2014. Sensitive analytical methods for 22 relevant
insecticides of 3 chemical families in honey by GC-MS/MS and LC-MS/MS. Anal Bioanal Chem. 406:
621–633.
Pastorelli G, Moretti VM, Macchioni P, Lo Fiego DP, Santoro P, Panseri S, Rossi R, Corino C. 2005.
Influence of dietary conjugated linoleic acid on the fatty acid composition and volatile compounds
profile of heavy pig loin muscle J. Sci. Food Agric. 85: 2227-2234
Sánchez-Hernández L, Hernández-Domínguez D, Martín MT, Nozal MJ, Higes M, Bernal Yagüe JL.
2016. Residues of neonicotinoids and their metabolites in honey and pollenfromsunflower and maize
seed dressing crops. J. Chromatogr. A. 1428: 220-227.
Shendy AH, Al-Ghobashy MA, Gad Alla SA, Lotfy HM. 2016. Development and validation of a
modified QuEChERS protocol coupled to LC–MS/MS for simultaneous determination of multi-class
antibiotic residues in honey. Food Chem. 190: 982-989.
Tette PAS, da Silva Oliveira FA, Pereira ENC, Silva G, de Abreu Glória MB, Fernandes C. 2016.
Multiclass method for pesticides quantification in honey by means of modified QuEChERSand
UHPLC–MS/MS. Food Chem. 211: 130-139.
Thompson M. 2000. Recent trends in inter-laboratory precision at ppb and sub-ppb concentrations in
relation to fitness for purpose criteria in proficiency testing. Analyst. 125: 385-386.
Tomasini D, Sampaio MRF, Caldas SS, Buffon JG, Duarte FA, Primel EG. 2012. Simultaneous
determination of pesticides and 5-hydroxymethylfurfural in honey by the modified QuEChERS method
and liquid chromatography coupled to tandem mass spectrometry. Talanta. 99: 380–386.

168
Vichapong J, Burakham R, Srijaranai S. 2015. In-coupled syringe assisted octanol–water partition
microextraction coupled with high-performance liquid chromatography for simultaneous determination
of neonicotinoid insecticide residues in honey. Talanta. 139: 21-26.
Wang J. 2004. Determination of five macrolide antibiotic residues in honey by LC-ESI-MS and
LCESI-MS/MS. J. Agric. Food Chem. 52: 171-181.
Wiest L, Buleté A, Giroud B, Fratta C, Amic S, Lambert O, Pouliquen H, Arnaudguilhem C. 2011.
Multi-residue analysis of 80 environmental contaminants in honeys, honeybees and pollens by one
extraction procedure followed by liquid and gas chromatography coupled with mass spectrometric
detection. J. Chromatogr. A. 1218: 5743– 5756.
Wilczynska A and Przybylowski P. 2007. Residues of Organochlorine Pesticides in Polish Honeys.
APIACTA. 42: 16 – 24.
Yang X, Zhang S, Yu W, Liu Z, Lei L, Li N, Zhang H, Yu Y. 2014. Ionic liquid-anionic surfactant
based aqueous two-phase extraction for determination of antibiotics in honey by highperformance
liquid chromatography. Talanta. 124:1-6.

169
CHAPTER 4
Summary & Conclusion

170
SUMMARY
Food contamination is an issue of major concern for human health and for the environment. The
presence of drug residues and contaminats in food is often regulated and human exposition is control
by European Organisms. This doctoral dissertation is a part of a larger project aims to carry out a
survey on the safety of food of animal origins. With this purpose we focused the attention on some of
the most consumed (fish, meat) and food with scarce literature (game meat). Food of increasing
importance, like honey, was also investigated related to environmental contaminants for which
European Commission (EC) asked to improve the data to collect more information and evaluate the
human risk. In this work, the papers published on international scientific journal are exposed.
Two studies focus on the occurrence of cadmium, lead, mercury, arsenic, chromium and nickel in 50
mussel, 40 clam and 130 tuna samples available to the Italian consumers, and the risk associated to the
consumption of this seafood. Analyses were carried out using inductively-coupled plasms-mass
spectrometry. For the first three metals only one mussel sample was non-compliant for cadmium. For
arsenic, nickel and chromium, maximum levels are not stated by the European Union. A risk
characteritazion demonstrated that the average Italian consumption of molluscs, does not pose a risk for
consumers, except nickel, which can cause allergic dermatitis in nickel-sensitive individuals. A risk for
large consumers comes from Arsenic presence in mussels and, to a lesser degree in clams. One red tuna
and 11 yellow tunas exceeded lead maximum levels. Three red tunas exceeded mercury maximum
levels. The risk characterization showed that only a negligible health hazard could derive from the
ingestion of tuna, for both average and high consumers.
Another paper on seafood focus on the presence of organochlorine and organophosphorous
compounds, polybromodiphenylethers, perfluoroalkyl substances and antibiotics in both acquaculture
and wild salmon. Polychlorobiphenyl 101 and polybromodiphenylethers congeners 28, 33, 47 and 100,
153, 154 were seldom observed; congener 99 was detected in 33% of the samples. Pentafluorobenzoic
acid and perfluorooctanoic acid were detected about in 30 % of the samples. Aldrin and Endosulfan
sulphate were often detected (about 30%-35% of the samples) while hexaclhorobenzene was detected
in about 80% of farmed and only in 20% of wild salmons. As far as antibiotics only fenbendazole was
frequently detected; doxiclyne and nalidixic acid were found in 5% of only farmed salmon. The risk

171
deriving from salmon intake is low for all the substances analysed, being of minor concern only for
PBDE 99. However, after the 2018 EFSA revision of perfluorooctanoic acid tolerable weekly intake
the risk from perfluoroalkyl substances results to be high for the level for serum cholesterol, adopted as
the new end point (this is the conclusion different from what reported in the paper, written before the
2018 EFSA report was published).
The presence of perfluoroalkyl substances and polybrominated diphenyl ethers was investigated in a
paper related to pork meat coming from eight European countries. No perfluoroalkyl substances were
detected, except perfluorooctanoic acid, in only one Austrian sample. polybrominated diphenyl ethers
were detected in three out of 77 samples: the one from Germany showed the presence of all congeners
analyzed, the ones from Netherland and Italy, respectively PBDE 153 and PBDE 100. The
charactherization of the risk resulted in no concern for human health.
A further paper dealt with the occurrence of polychlorinated biphenyls, organochlorine pesticides,
organophosphorus pesticides, polycyclic aromatic hydrocarbon, perfluoroalkyl substances and
polybrominated diphenyl ethers in muscle from chamois, red deer, wild boar and roe deer. Muscle
samples from seventy-nine animals were collected during the hunting season in Northern Italy
mountain areas. No polybrominated diphenyl ethers were found in the samples. organochlorine
pesticides, organophosphorus pesticides and polychlorinated biphenyls were detected in almost all
samples at different concentration ranges, showing higher frequency in ungulate species than in wild
boar. perfluoroalkyl substances were found only in wild boar. Anthracene and benzopyrene were found
only in chamois at low concentrations. The lack of hunter consumption estimates does not allow
accurate risk characterisation.
The final work regarded a food of raising importance for human consumption: honey. Therefore, the
distribution of persistent organic pollutants, pesticides and antibiotic residues from different
geographical areas was investigated to confirm the potential transfer of xenobiotics into this food and
to give beekeepers tools for the selection of areas dedicated to organic production correlalted to their
antrhopization and industrialization. The presence of polychlorinated biphenyls, polybrominated
diphenyl ethers and polycyclic aromatic hydrocarbon was confirmed, not only in proximity to highly
urbanised centres, where the concentrations were higher, but in all environment contexts, confirming

172
their ubiquity. No antibiotics or neonicotinoids were detected in 95 organic honeys, demonstrating the
absence of apicultural treatments and consequently the good quality of honey of different areas.
The analytes in the different matrices required different methods for sample pretreatment, extraction
and clean up before the analysis with liquid chromatography–tandem mass spectrometry (LC-MS/MS)
or – gas mass spectrometry (GC-MS/MS). The approach of analytical part has required the
optimisation of instrumental performances as well as all steps of sample pretreatment, to reach good
levels of sensitivity, specificity and robustness of the method to then make qualitative and quantitative
considerations. The planning, optimisation and validation was performed according to Commission
SANTE/11945/2015 and SANTE/10553/2017 document.
In conclusion we presented data about the occurrence of many persistent organic pollutants and
antibiotic residues in different food of animal origin coming from different areas so contributed to
improve the knowledge regarding contamination in food.
The results of this manuscript suggest that there is a low risk for the average consumer health.
Environmental concentrations of persistent organochlorine compounds have been decreasing over the
past two decades, and this could be correlate with remarkable advances in the detection of low levels of
these compounds in human populations and the improvement of European control. PCBs still are
present in environment due to their wide consumption in the past and their chemical and physical
properties even if their use was banned in many industries application. Regarding emerging
compounds, PFAs still need to be concern due to their wide use and their possible toxicological role.
Antibiotics still are a matter of concern and need a close control to ensure human safety and decrease
antimicrobial resistance.
References
European Food Safety Authority (EFSA), 2018. Risk to human health related to the presence of
perfluorooctane sulfonic acid and perfluorooctanoic acidin food. The EFSA Journal, 1-284.
European Commission. 2015. SANTE/11945/2015. In: Guidance document on analytical quality
control and method validation procedures for pesticide residues and analysis in food and feed.
Bruxelles: Directorate General for Health and Food Safety, 1–42.

173
European Commission. 2017. SANTE/11813/2017. In: Guidance document on analytical quality
control and method validation procedures for pesticide residues and analysis in food and feed.
Bruxelles: Directorate General for Health and Food Safety, 1–46.
Aknowledgements:
• I would like to thank my research group whom I have shared these trhee years of my life and
which has allowed the success of these researches.
• Special thanks to my tutor who has helped, supported, guided and taught me over the past three
years. Thank you.
• Thanks to those who have shared with me these three years for the laughter, the moments of
discouragement and support that have helped me go ahead.
“Coming togeheter is a beginning,
Staying togeheter is progress,
And working togeheter is success.”
-Henry Ford.