![Our [National] Federalism - Yale Law Journal · source: federalism now comes from federal statutes. It is “National Federalism”— statutory federalism, or “intrastatutory”](https://static.fdocuments.net/doc/165x107/5f84f6df3b712117dc60d34f/our-national-federalism-yale-law-journal-source-federalism-now-comes-from-federal.jpg)
FEDERALISM AND REGIONAL HCEs REVISED - … · focussing in particular on the role of federalism and...
34
Luca Crivelli, Massimo Filippini, Ilaria Mosca Federalism and regional health care expenditures : an empirical analysis for the Swiss cantons Quaderno N. 04-07 Decanato della Facoltà di Scienze economiche Via G. Buffi, 13 CH-6900 Lugano
Transcript of FEDERALISM AND REGIONAL HCEs REVISED - … · focussing in particular on the role of federalism and...

Luca Crivelli, Massimo Filippini, Ilaria Mosca
Federalism and regional health care expenditures : an empirical analysis for the Swiss cantons Quaderno N. 04-07
Decanato della Facoltà di Scienze economiche Via G. Buffi , 13 CH-6900 Lugano

FEDERALISM
AND REGIONAL HEALTH CARE EXPENDITURES:
AN EMPIRICAL ANALYSIS FOR THE SWISS CANTONS ∗
LUCA CRIVELLI ([email protected]) Faculty of Economics – Università della Svizzera italiana (USI)
Department of Management and Social Sciences - Scuola Universitaria Professionale
della Svizzera italiana (SUPSI)
MASSIMO FILIPPINI ([email protected]) Faculty of Economics – Università della Svizzera italiana (USI)
Federal Institute of Technology – Zurich
ILARIA MOSCA ([email protected]) Faculty of Economics – Università della Svizzera italiana (USI)
∗ We are very grateful to the Federal Office for Social Security and to the Santésuisse association for providing us with the statistical data. We would also like to thank Gianfranco Domenighetti for some interesting suggestions and Dr. Titus Morger-Vetter.

2
Abstract
Switzerland (7.2 million inhabitants) is a federal state composed of 26 cantons. Article 3
of the Federal Constitution grants ample autonomy to individual cantons in those
sectors that are not directly regulated by the Constitution, among others health and
social care. The autonomy of cantons creates strong heterogeneity in terms of regulatory
systems and the organization of health care services. Moreover, the State’s financial
contribution varies in size and form according to the 26 different legal frameworks.
Instead of having one single health system, Switzerland can be seen as 26 micro-
systems linked to each other by the Federal Health Insurance Act (FHIA), which came
into force on January 1st, 1996. The present-day differences between cantons make
Switzerland a natural laboratory where to develop some interesting economic analyses
and observations that might be useful for countries set on reorganizing their health
systems in a federal way.
In the first part of the paper we present an overview of Switzerland’s health care system,
focussing in particular on the role of federalism and on the differences between
compulsory health insurance premiums and per-capita health expenses in the cantons.
The second part of the paper presents an econometric analysis, using panel data over the
period 1996-2001, of the most important determinants in the cantonal health care
expenditures. Following the approach of Gerdtham and Jönsson (2000) for international
health comparisons, we consider demographic, socio-economic, and production
capacity factors as explanatory variables of the model.
3
1. Introduction
Switzerland (7.2 million inhabitant s) is a federal state of 26 cantons. Article 3 of the
Swiss Constitution grants a high degree of autonomy to the cantons, stating that “The
cantons are sovereign insofar as their sovereignty is not limited by the Federal
Constitution; they shall exercise all rights which are not transferred to the
Confederation”. The precept of the Swiss decentralization is that public policies and
their implementation should be assigned to the lowest level of government capable of
achieving the objectives.
The organization of the health care system is under the responsibility and control of
the cantons. Decentralization of competences and of expenditure responsibility has led
to a series of significant differences among cantons with respect to per-capita public
spending, the regulatory settings, the role of private versus public sector, and the level
of production capacity. Instead of being a single health-care system, Switzerland is
composed of 26 sub-systems, connected to each other by the Federal Health Insurance
Act (FHIA) that has been in force since January 1st, 1996. Health insurance is
mandatory for all residents (premiums are regulated by the state; they are risk
independent but not income-dependent) and covers a package of health-care benefits
defined by law. Notwithstanding the fact that this package is the same throughout
Switzerland, there are some significant differences in the regional health-care
expenditures.
The aim of this study is to analyse the determinants that cause the differences in the
per-capita health care expenditures between the Swiss cantons. The literature regarding
the determinants of health expenditures is also surveyed in order to place the results of
this paper into proper context. In particular, we will refer to Gerdtham and Jönsson’s
studies.1 Moreover, the paper will provide some considerations on the impact of
federalism on the organization of the Swiss health-care sector. The discussion is of
interest because this process of decentralization is seen as a central tenet of health sector
reform in many European countries. It is an effective way to stimulate improvements in
service delivery, to secure better allocation of resources according to needs, to involve
the community in decision about priorities and to facilitate the reduction in inequities in
1 See Gerdtham and Jönsson (2000).

4
health-care provision. Thus, Switzerland may be taken as an example, since the origin
of federalism dates back to a good many years.
The paper is structured as follows: in section 2 we present the main features of the
Swiss health care system and show the impact of federalism on the organization of the
health care sector in Switzerland; section 3 is devoted to the analysis of the present
literature in this area; in sections 4 and 5 we discuss the specification of the model and
submit the empirical estimation results of the panel data set. Conclusions are drawn in
section 6.
2. The Swiss health care system
In 2001 health care costs reached SFr 46 billion. This value corresponds to 11.1% of GDP. Therefore Switzerland ranks first among European countries with respect to per-capita health expenditures (3275 PPP-$). The Swiss health care system is based on a mixed (private-social) health insurance system. The main characteristics of this system can be summarized in the following eight points:
1. it is a mixed (private-social) health insurance system, with about 100 competing private insurance companies (sickness funds) on the one hand and some characteristics of social insurance on the other hand. These characteristics are: regulated and risk- independent premiums, mandatory health insurance for all residents (since 1996), and a subsidy designed to help people with low income pay their health insurance premiums;
2. the package of services covered by the mandatory insurance is laid down in the insurance contracts; however, since 1996 the basic contract has been defined by the Confederation and therefore it is by law the same for all residents;
3. both public and private hospitals, as well as nursing homes, offer inpatient health care, which (in most cases) is still reimbursed on a per diem basis 2; however, only public- interest hospitals receive financial support from the state (i.e. from the cantons) in the form of subsidies, while private hospitals have to finance their cost totally through health insurers’ reimbursement. Moreover, cantons have to plan hospital capacity and only hospitals included in the cantonal lists are entitled to be reimbursed by mandatory health insurance;
2 The introduction of AP-DRG reimbursement in some cantons started in 2000.

5
4. ambulatory health care services are provided by independent general practitioners and specialists, and are reimbursed according to a fee-for-service scheme;
5. the insured can freely choose the service provider (general practitioner, specialist) because of compulsory contracting. The compulsory contracting principle states that all medical practitioners who are authorized to practise as independent professionals in Switzerland have the right to be party to a framework contract with any of the sickness funds;
6. the service fees are regulated and defined according to agreements concluded between the service provider associations, the health insurance companies and the state;
7. many services are simultaneously financed by multiple payers (the state and the mandatory health insurance or the mandatory health insurance and complementary private insurers);
8. compared to other EU-countries, public financing of the health care system is very limited.
The financing model and the allocation of competences between the Confederation and cantons
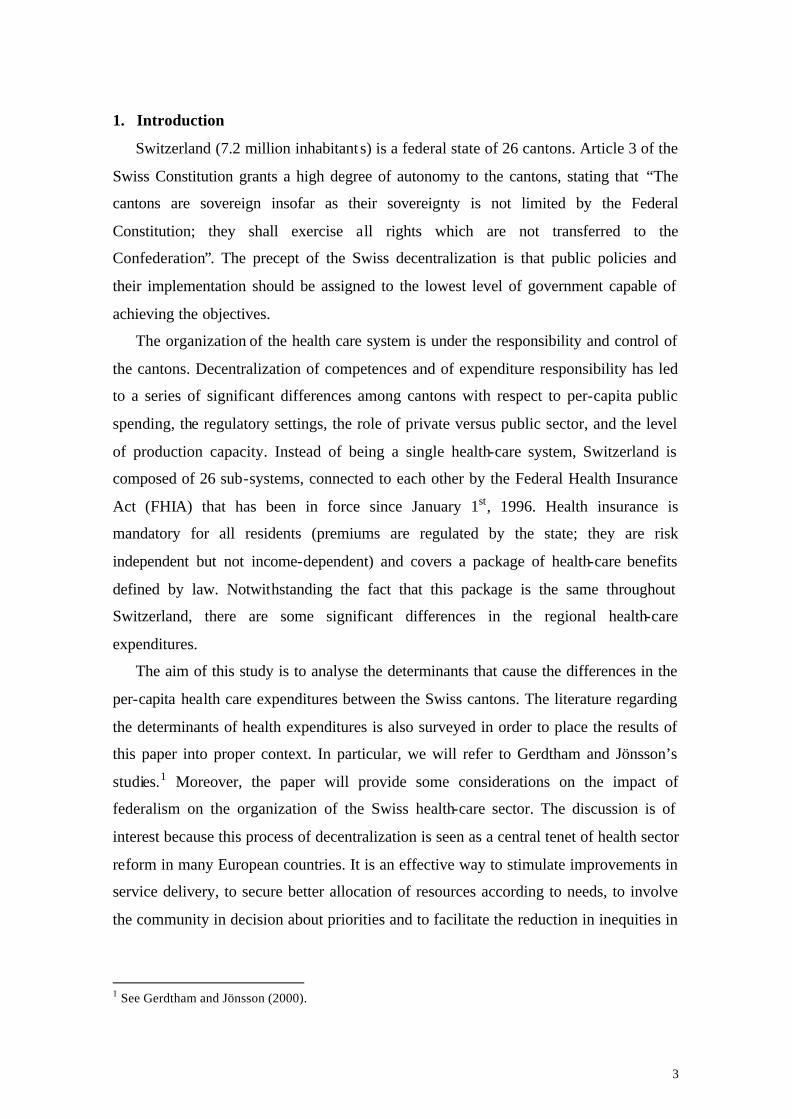
In Switzerland the funding model of the health system is particularly regressive (see table 1). Overall, only one-third of the financing is collected in an income-dependent way (this concerns public financing, which in 2001 amounted to 26.8% of total health expenses3, and social insurance contributions – 6.4%). Moreover, public contribution is predominantly provided by cantons and municipalities, whereas the Confederation contributes only 20% to the public health care budget. The remaining two-thirds of the financing, which do not depend on the citizens’ ability to pay, include, in particular, mandatory health insurance premiums (26.5%), premiums for private complementary insurance (10.2%), co-payment of insured services (5.3%) and out-of-pocket expenses (23.9%). It is worth noting that the proportion of expenses borne by patients is considerable. When co-payment for insured services and the out-of-pocket health expenses are added, the share charged to patients reaches the threshold of 30% of total
3 This quota is divided into shares of 16.9% for public financing of hospitals and nursing homes, 8.3% for subsidies to the less wealthy citizens in the form of a public contribution to the payment of the mandatory health insurance premiums and of nursing homes daily rates, and 1.6% for public subsidies to other social insurances that participate in the health care expenditure.
6
health expenditures and corresponds to an annual per capita amount of SFr 1,852 (about 955 PPP-$).
Table 1 Health care financing in Switzerland (2001)
Sfr million in % Public financing of direct cost (in particular subsidies to public hospitals) 7,802.5 16.9% Public subsidies to health insurance premiums and nursing homes’ daily rates of the less wealthy citizens 2,671.6 5.8% Other public subsidies to social insurance 1,879.6 4.1% Total expenditure financed through general taxation 12,353.7 26.8% Accident insurance (UV) 1,475.3 3.2% Other social insurances (AHV, IV, MV) 1,472.5 3.2% Total expenditure financed through payroll taxes 2,947.8 6.4% Mandatory health insurance premiums 12,215.1 26.5% Private health insurance premiums (complementary insurance) 4,699.9 10.2% \Co-payment for insured services 2,428.3 5.3% Out-of-pocket payments 11,021.2 23.9% Other private financing 463.5 1.0% Total expenditure privately financed 3,'828.0 66.8% Total health expenditure 46,129.5 100.0%
Source: Federal Office of Statistics, Kosten des Gesundheitswesens, Neuchâtel, 2003.
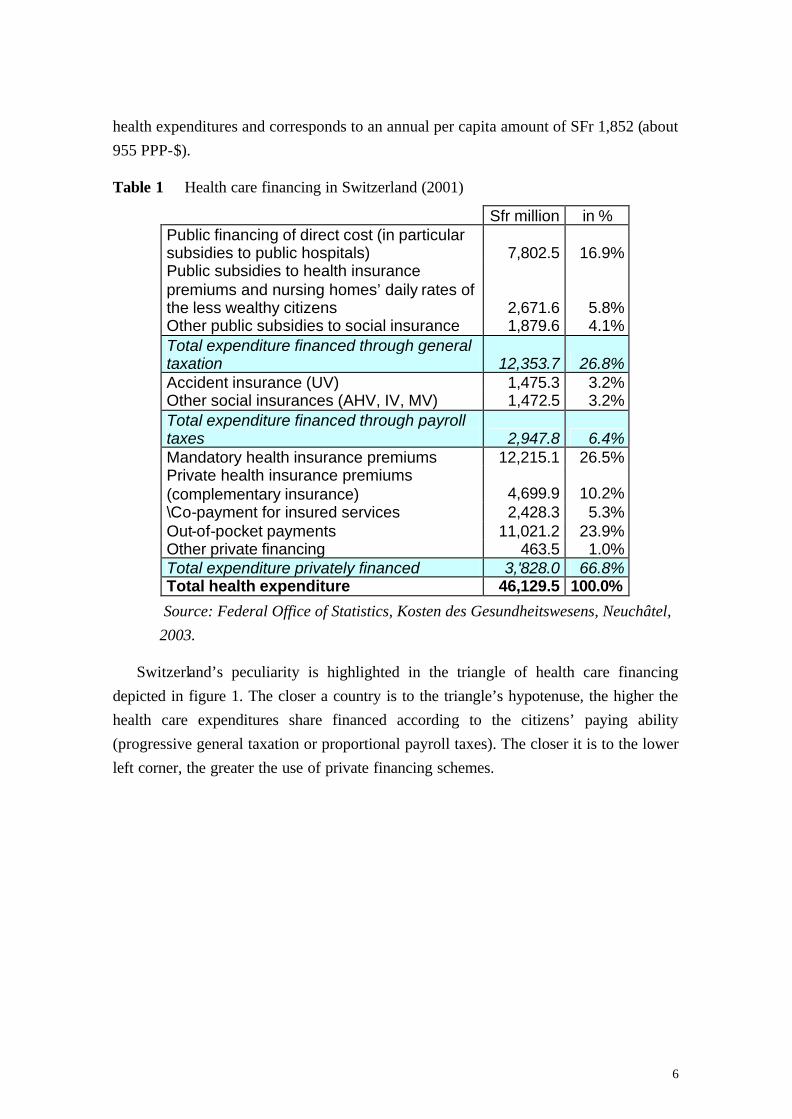
Switzerland’s peculiarity is highlighted in the triangle of health care financing depicted in figure 1. The closer a country is to the triangle’s hypotenuse, the higher the health care expenditures share financed according to the citizens’ paying ability (progressive general taxation or proportional payroll taxes). The closer it is to the lower left corner, the greater the use of private financing schemes.
USA
7
Figure 1 Health care financing triangle
Source: Wagstaff et al (1999).
Switzerland’s position in 2001 is in sharp contrast with all the other European countries (which are all within a range of income-dependent financing between 65% and 80% of health care expenditures) and resembles the situation in the United States. The particular structure of the health care financing scheme has two main consequences:
- the Swiss health care system does not attach much importance to the principle of equity of financing. According to the World Bank (2000), vertical equity means that “those who are in different circumstances with respect to a characteristic of concern for equity should, correspondingly, be treated differently”. Vertical equity implies that citizens with greater economic means have to pay more. Therefore, the larger the share of progressive (or at least income-proportional) financing, the greater the vertical equity of the financing of a health care system. The fact that the mandatory health insurance premiums are income-independent and that citizens have to finance directly (or through private insurances) 40.3% of total expenditure4, leads to a highly regressive financing model.5 This has negative repercussions especially on the medium income class, which does not benefit from subsidies for the payment of the insurance premiums. The goal of these subsidies is to help those people on a low-income level, and thus to
4 This percentage results from the sum of private health insurance premiums, co-payment for insured services, out-of-pocket financing and other private funding. 5 Wagstaff et al. (1999) have published a comparative study on the equity of financing in OECD countries, where Switzerland ranked last.
USA
CH96
DK
F
D
IRL
0% 20% 40% 60% 80% 100%
20%
40%
60%
80%
100%
0%
% raised through social insurance
% r
aise
dth
roug
hta
xes
ITA
UK
E
SFIN
NL
P
USA
CH96
DK
F
D
IRL
0% 20% 40% 60% 80% 100%
20%
40%
60%
80%
100%
0%
% raised through social insurance
% r
aise
dth
roug
hta
xes
ITA
UK
E
SFIN
NL
P
CH96CH96
DKDK
FF
DD
IRLIRL
0% 20% 40% 60% 80% 100%
20%
40%
60%
80%
100%
0%
% raised through social insurance
% r
aise
dth
roug
hta
xes
ITA
UKUK
EE
SSFINFIN
NLNL
PP
USA

8
improve the level of vertical equity across the country. However, we should bear in mind that these subsidies cover only one part of the population6;
- the presence of a large number of third-party payers makes it extremely complex to follow the financial flows, which in turn makes it more difficult to manage the health care expenditures in general, and leads to a cost shifting problem. Since nobody is entirely responsible for the global health care budget, it is sometimes easier for a single financing body to obtain a reduction in its own financial share, rather than to engage in a more rational use of total health care spending. This encourages shifting costs at the expense of another payer, rather than looking for solutions allowing an effective rationalisation of expenditure.
Although the state’s presence in the Swiss health care system cannot be considered to be financially very strong, it is definitely stronger in terms of regulatory activity. As far as allocation of competences is concerned, cantons are legally entitled to legislate on all health care matters except for a few issues that explicitly fall within the competence of the Confederation. Almost all cantons have passed cantonal health care laws and specific provisions regulating the application of the federal health insurance legislation. According to the Constitution, each canton enjoys decision-making autonomy in planning health care institutions (particularly hospitals and nursing homes), in settling which competences are to be delegated to local authorities, and in vocational training. In other words, cantons guarantee accessibility, effectiveness and efficiency of health services to their population, while the Confederation is responsible only for the regulation of health insurance.
Since 1996 the Confederation has played a more active role in the health care sector. Health insurance became compulsory at a federal level, through the enforcement of the Federal Health Insurance Act. A package of basic health services was defined for the whole Swiss population. However, the additional decision-making powers of the central body were not supported by a formal devolution of competences from the cantons to the Confederation (which would have required a change in the Constitution) nor by a redistribution of public health expenditures for a greater engagement of the Confederation (see Crivelli and Filippini, 2003).
6 About one-third of the Swiss population benefits from the subsidy system. The rest are liable to health premiums that are regressive to their income. Moreover, on account of federalism, subsidy policies vary from one canton to another, creating strong territorial disparities. For example in 2002, one household with two children with a yearly gross income of SFr 70,000, had a medium health premium incidence of 8.2% of the disposable income across the country, with a minimum of 1.2% in Canton Valais and 13.8% in Canton Geneva.

9
The organizational autonomy granted to cantons in the last 90 years has created a very heterogeneous system both in the delivery of health care services and in the level of public health financing, giving rise to concerns about social and territorial inequity.
Such a marked decentralisation of the organization and financing of the health care system has no parallel in other countries with a federal setting such as Canada or Germany. In these countries, central government plays a more active role in the financing of the health care sector.7 Moreover, since the regional entities are much larger than the Swiss cantons, regional differences are not as marked and the problems connected to the presence of micro-systems are not as significant.
Consequences of federalism for the organization of the health care system in Switzerland
Decentralisation of competences and expenditure has led to a series of significant inter-cantonal differences with regard to public financing and the regulatory settings, as well as to production capacity.
The socialized health expenditures, including services covered by mandatory health insurance as well as public health expenditures, in 2001 ranged from per capita 1051 PPP-$ in the Canton of Appenzell to per capita 2781 PPP-$ in Geneva (see figure 2). Public health expenditures can be calculated by combining two fundamental elements: (a) cantonal and local direct financing for the provision of health care services to the population (in particular the subsidies to public and private, public- interest hospitals, the participation in hospitalisations outside the home canton, the subsidies to nursing homes and to home care services) and (b) financial support to the less wealthy in the form of subsidies to meet health insurance premiums.8
7 See Banting and Corbett (2002). 8 Before 1996 the state subsidized health insurance companies directly, while since 1996 subsides have been given to needy people. With the FHIA a social goal was established: the purpose of state subsidies is to keep the ratio between net premiums and taxable income below 8% for the poorest citizens. In general, the burden of premiums has increased considerably in the last few years and fewer and fewer cantons achieve this social goal.

10
Figure 2 Per-capita socialized health expenditures in Swiss cantons (2001), PPP-$
0 $ 500 $ 1 000 $ 1 500 $ 2 000 $ 2 500 $ 3 000 $
ZHBELUURSZO
NWGLZGFRSOBSBLSHARAI
SGGRAGTGTI
VDVSNEGEJU
Public health expenditure Health expenditure of the mandatory health insurance
Source: UFS (2003), Coûts du système de santé, Neuchâtel. UFAS (2002), Statistiques de
l'assurance-maladie 2001, Berne, Santesuisse.
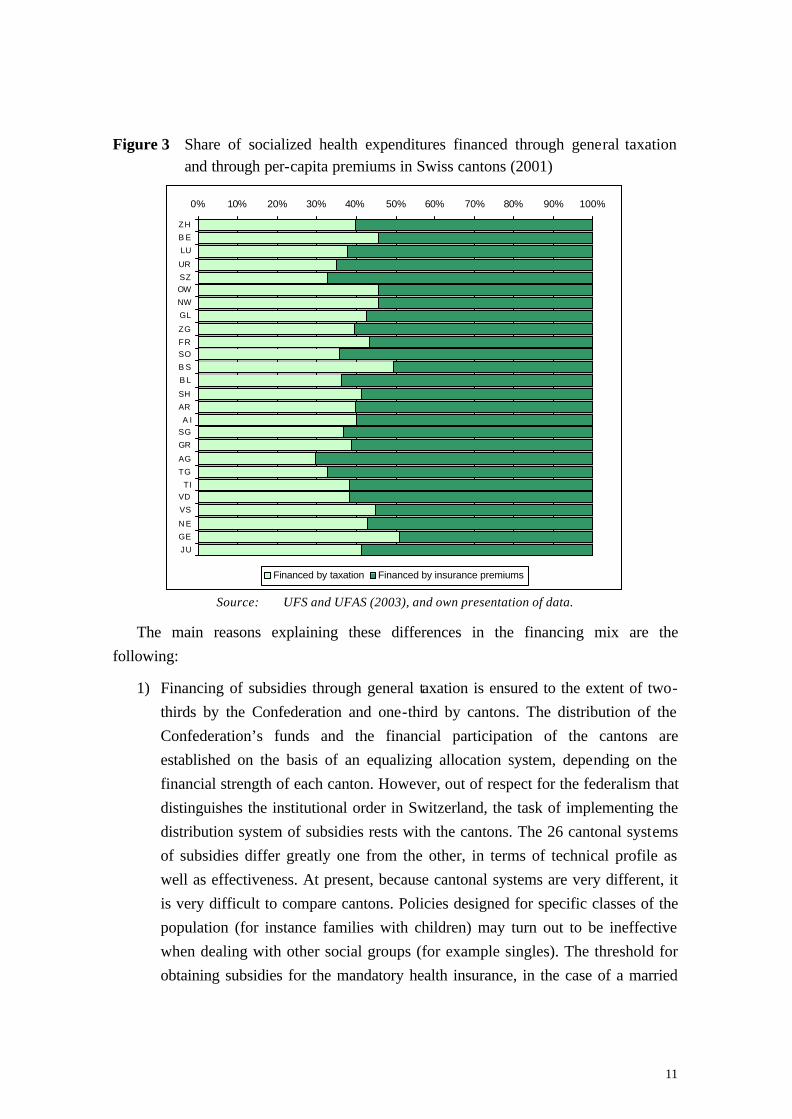
The high degree of autonomy granted to cantons in the definition of local public policies has caused marked differences also in the concept of equity of financing. Figure 3 represents the subdivision in percentages of socialized health expenditures into two elements: (1) public financing through taxes, (2) financing through income-independent health premiums. Some cantons (generally those with high levels of socialized health expenditures, as Basel-City and Geneva) show a 50% of expenses covered by general taxation, while others (Aargau and Thurgau) show 30%.
11
Figure 3 Share of socialized health expenditures financed through general taxation and through per-capita premiums in Swiss cantons (2001)
0% 10% 20% 30% 40% 50% 60% 70% 80% 90% 100%
ZH
B E
LU
UR
SZOW
NW
GL
ZG
FRSO
B S
B L
SH
AR
A ISG
GR
AG
TG
TIVD
VS
N E
GE
JU
Financed by taxation Financed by insurance premiums
Source: UFS and UFAS (2003), and own presentation of data.
The main reasons explaining these differences in the financing mix are the following:
1) Financing of subsidies through general taxation is ensured to the extent of two-thirds by the Confederation and one-third by cantons. The distribution of the Confederation’s funds and the financial participation of the cantons are established on the basis of an equalizing allocation system, depending on the financial strength of each canton. However, out of respect for the federalism that distinguishes the institutional order in Switzerland, the task of implementing the distribution system of subsidies rests with the cantons. The 26 cantonal systems of subsidies differ greatly one from the other, in terms of technical profile as well as effectiveness. At present, because cantonal systems are very different, it is very difficult to compare cantons. Policies designed for specific classes of the population (for instance families with children) may turn out to be ineffective when dealing with other social groups (for example singles). The threshold for obtaining subsidies for the mandatory health insurance, in the case of a married

12
couple with two children, varies from 20,000 PPP-$ of taxable income in Canton Ticino (TI) to 54,000 PPP-$ in Basel-Country (BL).
2) The second reason is the frequency of the institutional forms in the hospital sector. In figure 4 a pie-chart has been drawn for each canton. The pie surface represents the total number of hospitals operating in a specific canton, whereas the two pie slices represent the relative weight of public and private subsidized hospitals in comparison with non-subsidized private institutions. The public-private mix has a strong impact on the financing model of mandatory health care. The higher the percentage of private hospitals in a canton, the higher the share covered by means of health insurance premiums
Figure 4: Comparison between public or subsidized, private acute hospitals and
private clinics in the different Swiss cantons (year 2000)
Source: UFS, Informations sur le projet "Statistiques des établissements de santé (soins intra-muros), StatSanté 1/2002, 17.
Consequently, cantons contribute less to the total expenditure, as they have to subsidize only beds in public and public-interest hospitals. Therefore they can reduce the revenues of general taxation (and taxes are collected progressively according to tax-payers’ income). More private hospital beds imply, ceteris paribus, a greater iniquity of financing. In this sense the hospital situation in Ticino, Thurgau, Geneva and Appenzell Outer-Rhodes appears to be rather peculiar, as it is characterized by a clear prevalence of private non-subsidised hospitals.
Public Private
1 24
52 Zurigo
Berna Lucerna
Uri
Svitto
Obvaldo
Nidvaldo
Glarona
Zug
Friborgo
Soletta
Basilea Città
Basilea Campagna
Sciaffusa
Appenzello Est. Appenzello Int.
San Gallo
Grigioni
Argovia
Turgovia
Ticino
Vaud
Vallese
Neuchâtel
Ginevra
Giura
0 100 km Fondo carta: UST
© IRE, Università della Svizzera italiana, Lugano
13
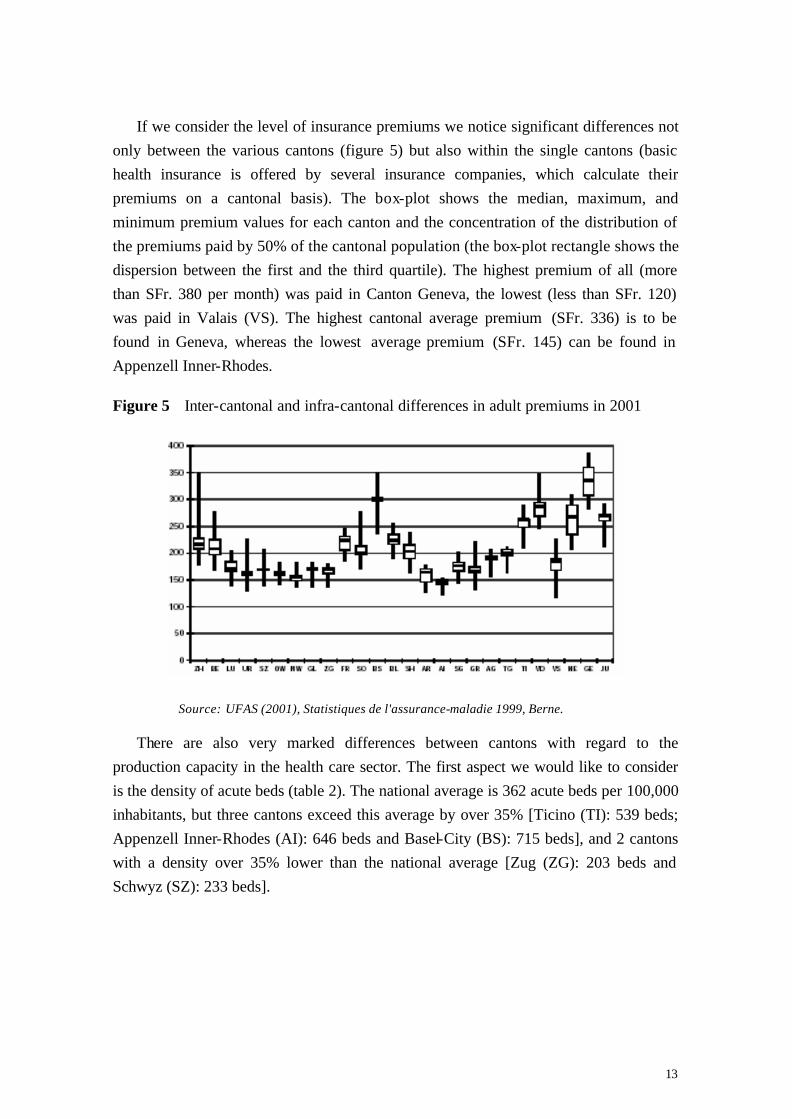
If we consider the level of insurance premiums we notice significant differences not only between the various cantons (figure 5) but also within the single cantons (basic health insurance is offered by several insurance companies, which calculate their premiums on a cantonal basis). The box-plot shows the median, maximum, and minimum premium values for each canton and the concentration of the distribution of the premiums paid by 50% of the cantonal population (the box-plot rectangle shows the dispersion between the first and the third quartile). The highest premium of all (more than SFr. 380 per month) was paid in Canton Geneva, the lowest (less than SFr. 120) was paid in Valais (VS). The highest cantonal average premium (SFr. 336) is to be found in Geneva, whereas the lowest average premium (SFr. 145) can be found in Appenzell Inner-Rhodes.
Figure 5 Inter-cantonal and infra-cantonal differences in adult premiums in 2001
Source: UFAS (2001), Statistiques de l'assurance-maladie 1999, Berne.
There are also very marked differences between cantons with regard to the production capacity in the health care sector. The first aspect we would like to consider is the density of acute beds (table 2). The national average is 362 acute beds per 100,000 inhabitants, but three cantons exceed this average by over 35% [Ticino (TI): 539 beds; Appenzell Inner-Rhodes (AI): 646 beds and Basel-City (BS): 715 beds], and 2 cantons with a density over 35% lower than the national average [Zug (ZG): 203 beds and Schwyz (SZ): 233 beds].

14
Table 2 Density of acute beds and density of medical practices per 100,000 inhabitants (year 2001)
Canton Density of acute beds per 100,000
inhabitants
Density of medical
practices per 100,000
inhabitants
Canton Density of acute beds per 100,000
inhabitants
Density of medical
practices per 100,000
inhabitants Argau (AG) 341 138 Nidwalden (NW) 243 110
Appenzell Inner-Rhodes (AI) 646 109 Obwalden (OW) 277 105
Appenzell Outer-Rhodes (AR) 244 153 St Gall (SG) 331 156
Berne (BE) 377 200 Schaffhausen (SH) 299 184
Basel-Country (BL) 346 187 Solothurn (SO) 336 156
Basel-City (BS) 715 357 Schwyz (SZ) 233 117
Fribourg (FR) 330 142 Thurgovia (TG) 241 126
Geneva (GE) 380 326 Ticino (TI) 539 194
Glarus (GL) 316 129 Uri (UR) 424 129
Grisons (GR) 360 164 Vaud (VD) 435 239
Jura (JU) 409 149 Valais (VS) 332 169
Lucerne (LU) 291 145 Zug (VS) 203 158
Neuchâtel (NE) 406 205 Zurich (ZH) 366 223
Swiss average 362 172
Source: UFS, Statistiques des établissements de santé (soins intra-muros), 2001, and Encyclopédie Statistique de la Suisse.
There is a real gap with respect to the density of medical practices. The data range from more than 300 medical practices per 100,000 inhabitants in Basel-City and Geneva to 100-110 practices per 100,000 inhabitants in Obwalden (OW), Nidwalden, and Appenzell Inner-Rhodes, whereas the national average is 172. In Switzerland all doctors who have obtained a Swiss university degree in medicine and have at least two years’ hospital experience are automatically entitled to practise independently and to invoice for their services at the expense of the mandatory health insurance according to a fee-for-service scheme (the fees were fixed on a cantonal basis in a specific price list for medical services; and this went on till 2003).9 Of course this payment system could easily lead to a phenomenon of supply- induced demand. Note that from 2004 the same reimbursement system will apply to all cantons.
9 The health insurance companies are obliged to cooperate with all the medical practitioners entitled to practise independently within the framework of the coverage provided for by the Federal Health Insurance Act (FHIA). Service-providers can be excluded from the reimbursement of the mandatory health insurance only in the case of citizens who have voluntarily joined a managed care insurance scheme.
15
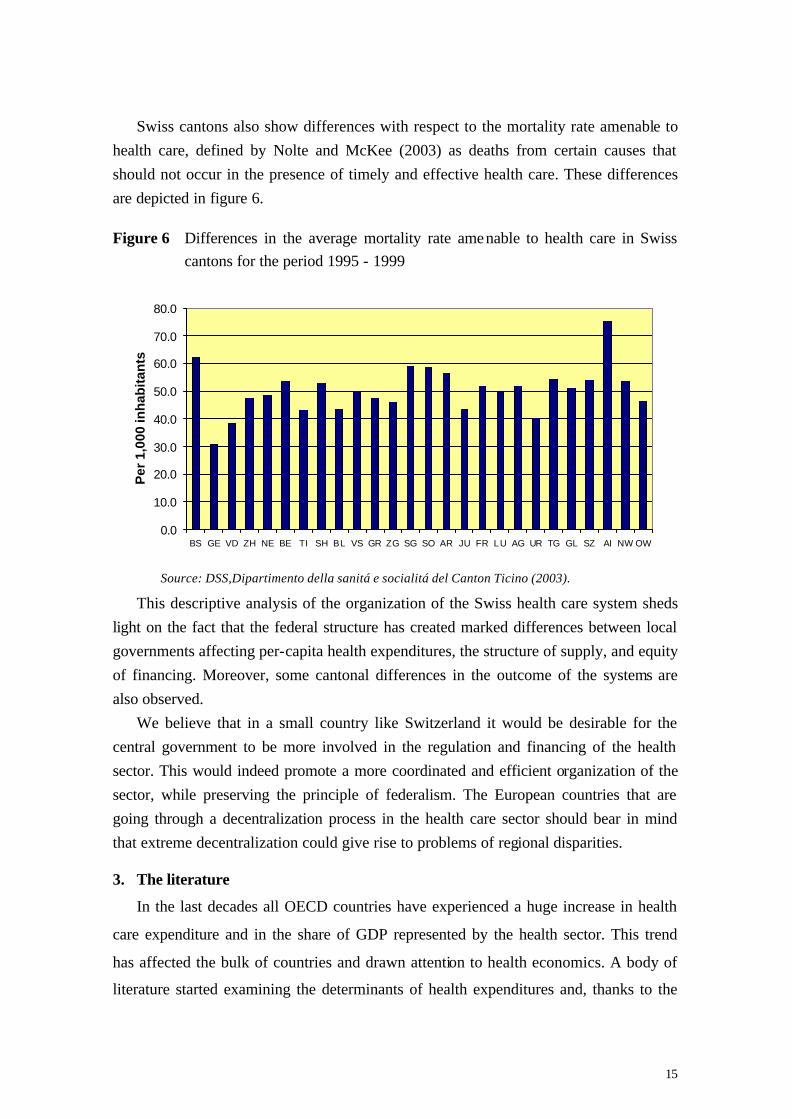
Swiss cantons also show differences with respect to the mortality rate amenable to health care, defined by Nolte and McKee (2003) as deaths from certain causes that should not occur in the presence of timely and effective health care. These differences are depicted in figure 6. Figure 6 Differences in the average mortality rate amenable to health care in Swiss
cantons for the period 1995 - 1999
0.0
10.0
20.0
30.0
40.0
50.0
60.0
70.0
80.0
BS GE VD ZH NE BE TI SH BL VS GR ZG SG SO AR JU FR LU AG UR TG GL SZ AI NW OW
Per
1,0
00 in
hab
itan
ts
Source: DSS,Dipartimento della sanitá e socialitá del Canton Ticino (2003).
This descriptive analysis of the organization of the Swiss health care system sheds light on the fact that the federal structure has created marked differences between local governments affecting per-capita health expenditures, the structure of supply, and equity of financing. Moreover, some cantonal differences in the outcome of the systems are also observed.
We believe that in a small country like Switzerland it would be desirable for the central government to be more involved in the regulation and financing of the health sector. This would indeed promote a more coordinated and efficient organization of the sector, while preserving the principle of federalism. The European countries that are going through a decentralization process in the health care sector should bear in mind that extreme decentralization could give rise to problems of regional disparities. 3. The literature
In the last decades all OECD countries have experienced a huge increase in health
care expenditure and in the share of GDP represented by the health sector. This trend
has affected the bulk of countries and drawn attention to health economics. A body of
literature started examining the determinants of health expenditures and, thanks to the

16
use of econometric methods, suggestions on variables that have an impact on the health
costs have been given. Most studies have estimated the relation between per-capita
health care expenditure and its determinants, namely: the proportion of population over
65 and under 5, per-capita GDP, the public finance share of health care spending,
urbanization, and the number of practising physicians per capita.
Recently, the same determinants approach has been applied not to international
comparisons but to the national level. This study belongs to the latter category insofar as
our analysis deals with the Swiss cantons only.
The first generation of studies at the international level has focused mainly on the
estimation of the elasticity of health care expenditures with respect to per-capita GDP.
Newhouse (1977) regresses per-capita medical expenditures on per-capita GDP on 13
OECD countries and finds income elasticity for health care spending greater than one,
thus leading to the conclusion that medical care is a luxury good. This result has been
later confirmed by some other studies. Leu (1986), for example, using cross-sectional
data for 19 OECD countries, finds income elasticity higher than one. However, he
introduces in his analysis a set of important variables (like dummy variables) for
countries with a national health system and countries based on a public insurance
scheme, dummy variables where there is direct democracy, and variables that reflect the
public offer of health services. Gerdtham et al. (1992) used a single cross-section of 19
OECD countries in 1987 and reported per-capita income, urbanization, and the share of
public financing to total health expenditures as positive and significant variables with a
reported income elasticity of 1.33.
The second generation studies use panel sample of OECD countries. A main feature
of the studies belonging to this data, combining cross-country and time-series data, is
the introduction of variables describing the regulatory settings and the production
capacity of health services. Hitiris and Posnett (1992) used panel data observations from
20 OECD countries over the period 1960-1987 and found a strong and positive
correlation between per capita health spending and GDP with income elasticity at about
unity. Other variables were included in the model and the share of over 65 in the
population was found to be positive and significant. Gerdtham et al. (1998) used a panel
data set for 22 OECD countries over the period 1970-1991, including in the model
variables like the per-capita number of physicians and the regulatory set-ups of each

17
single country. This is the most complete study at the international level. Amongst the
non institutional factors, only GDP and tobacco consumption generally have a
significant impact on health expenditures: the elasticity of tobacco consumption
indicates that health expenditures would increase by about 1.3% if tobacco consumption
increased by 10%. Countries with primary physicians as gatekeepers for inpatient care
have consistently lower health expenditures (costs drop by 16%). Public reimbursement
systems tend to be less expensive than public contract systems. Countries that reimburse
their physicians by capitation appear to experience lower health expenditures; the
proportion of inpatient care expenditures tends to be positively related to health
expenditures; the public sector is relatively more important than the private sector and
helps lower the costs. Furthermore, it seems that the number of doctors swells health
expenditures in systems that reimburse their physicians by fee-for-service. In contrast
with other studies, the estimated income elasticity is lower than one (0.74).
Barros (1998) focuses his study on the determinants of growth of aggregate health
expenditures. The study has its starting point in previous literature but looks at
differences across countries in growth, and not in levels, of health expenditures. Barros
basically uses the same explanatory variables, but he gets different results. Health
system characteristics usually believed to influence health expenditures growth, like
population ageing, the type of health system and existence of gatekeepers, are found to
be non-significant. The only exception is the income variable, with elasticity below but
close to one.
Di Matteo and Di Matteo (1998) used a pooled time-series cross-section approach to
study the growth of real per-capita provincial government health care expenditures in
Canada. Some of the problems that have affected the international studies are thus not
present here and therefore this obviously simplifies the analysis. The data set consists of
10 provincial annual time-series over the period 1965-1991. The income elasticity of
real per-capita provincial government health expenditures is lower than one at 0.77.
Hence, this result suggests that health care expenditures are indeed more of a necessity
than a luxury good. The proportion of provincia l population aged over 65 is significant
and has a large impact, as well as federal transfers.
Crivelli, Filippini and Mosca (2003) investigated the differences in health care
expenditures between Swiss cantons using a panel data set. Data cover 26 cantons over
18
the years 1996-2000. The income elasticity is found not to be significant but the other
major variables carry the expected sign and are significant: the most important factors
explaining health expenditures are physicians’ density and the density of acute beds, the
age structure of the population, and the unemployment rate. Compared to the study of
Crivelli et al. (2003), in this paper we will use a data set that covers the period 1996-
2001 and a more detailed model specification.
In Table 4 we present the main characteristics of four reference studies. Hitiris and
Posnett (1992) and Gerdtham et al. (1998) belong to the category of panel data studies
at the international level, while Di Matteo and Di Matteo (1998) and Crivelli et al.
(2003) belong to the more recent category of comparative regional studies.
Table 4 Characteristics of three reference studies
Countries Data set No. of
variables (No.
dummies)
Significant
explicative factors
Hitiris e
Posnett (1992)
20 OECD
countries
Panel data
1960-1987
4 (2) GDP per capita,
population aged over
65
Gerdtham
(1998)
22 OCSE
countries
Panel data
1970-1991
3 (9) Tobacco consumption,
income per capita,
gatekeeping model,
reimbursement model,
physicians’
remuneration with
capitation, importance
of ambulatory care
vs. hospital care,
physicians’ density,
importance of the
public sector vs. the
private sector.
Di Matteo e Di 10 Canadian Panel data 14 (10) GDP per capita,

19
Matteo (1998) provinces 1965-1991 population over 65,
federal transfers per
capita.
Crivelli,
Filippini and
Mosca (2003)
26 Swiss
cantons
Panel data
1996-2000
7 (1) Physicians’ density,
population aged over
75, population aged
below 5,
unemployment rate,
density of acute beds.
4. Model specification and estimates
In this study we use a single equation approach to model the per-capita cantonal
expenditures on health care services. We postulate that per-capita health expenditures
depend on some economic, demographic and structural factors. Following the model
specifications used in previous studies and taking into account the availability and
quality of data for the Swiss cantons, we decided to specify the following parsimonious
cantonal health expenditures model:
SHEit = f (Yit, UNit, POit, A75it, A05it, MOit, DPit, DDIit, PHYit, BEDSit, MCARE, T) [1]
where subscript i stands for the canton and t for the year. Moreover,
SHEit = socialized health expenditures per capita (which is obtained by the sum of the
per capita public health expenditures and expenses covered by the mandatory
insurance);
Yit = per-capita income;
UNit = unemployment rate, calculated as the ratio of the unemployed over the
working population;
POit = poverty rate, calculated as the percentage of households with an income below
50% of the average cantonal income;10
A75it = percentage of population older than 75;
A05it = percentage of population aged under 5;
10 See Connolly and Munro (1999) for a discussion on different measures of poverty.

20
MOit = mortality rate amenable to health care. This rate is based on the concept that
deaths from certain causes should not occur in the presence of timely and
effective health care;11
DPit = population density, calculated as the ratio of the population to the Canton’s
area;
DDIit = cantonal index for direct democracy. Direct democracy is defined in terms of
individual political participation possibilities. The index was calculated by
Trechsel and Serdült (1999) and Frey and Stutzer (2000);
PHYit = physicians’ density (physicians per 100,000 inhabitants);
BEDSit = density of acute beds in hospitals per 100,000 inhabitants;
MCARE = percentage of cantonal population opting for a managed care programme;
T = time variable which should capture the cost differences over time owing to
changes in medical technology or to other factors that may influence the
development of health costs at the national level.
Compared to the model specification used by Crivelli et al. (2003), model [1]
includes the following additional variables: poverty rate, mortality rate, population
density, index for direct democracy, and managed care programmes. Moreover the
period of analysis has been increased by one year.
Estimation of equation [1] requires the specification of a functional form. The
log- log form offers an appropriate functional form for answering questions about the
elasticities of health expenditures. The major advantage, of course, is that the estimated
coefficients amount to elasticities, which are therefore assumed to be constant.
By applying the log-log functional form, expression [1] can be written as
ln SHEit = β0 + β1 lnYit + β2 lnUNit + β3 lnPOit + β4 lnA75it + β5 lnA05it +
β6 lnMOit + β7 lnDPit + β8 lnDDIit + β9 lnPHYit + β10 lnBEDSit +
β11 lnMCARE + β12 T + eit [2]
11 See Nolte and McKee (2003) for a more detailed discussion on this issue.

21
5. Data and estimation results
The econometric estimation of model [2] is based on a combination of time-series
and cross-section data for 26 cantons over the period 1996-2001.12 These data were
obtained from some annual publications by the Swiss Federal Statistical Office and
from some yearly publications by Santésuisse, an association that groups together all
insurance companies.13 Note that, for some variables, only one value is available for the
whole period analysed. These variables are: poverty rate, mortality rate, and index of
direct democracy. Therefore model [1] includes these three time- invariant variables.
Table 5 gives some statistical details on the variables employed in the estimation of
model [2].
Table 5 Descriptive statistics of the variables employed
Variables Unit of measurement
Minimum Median Maximum
Socialized Health Expenditures per capita (SHE)
SFr/inhabitant 1526.8 2520.6 5397.0
Income per capita (Y) SFr/inhabitant 30191 41158 84605
Unemployment rate (UN) Unemployed/ working population
0.003 0.025 0.078
Poverty rate (PO) % of households with an income below 50% the average income
0.127 0.173 0.237
Over 75 (A75) Over 75/population 0.049 0.069 0.107
Under 5 (A05) Under 5/population 0.042 0.059 0.080
Mortality rate (MO) Rate of mortality amenable to health care
22.39 29.84 48.76
Population density (DP) Population/canton’s area
26.10 206.10 5267.9
Direct democracy index (DDI)
Index from 1 (minimum) to 6 (maximum)
1.75 4.45 5.69
Physicians’ density (PHY) Physicians/100'000 inhabitants
76.20 152.25 357.15
12 It is worth pointing out that some variables of the model show a high within variation while others show a low within variation. 13 For more detailed statistics see: http://www.statistik.admin.ch/stat_ch/ber14/gewe/dtfr14i.htm (intramuros statistics) and http://www.statistik.admin.ch/dienstle/elektron/dstatinf.htm (database Statweb)

22
Density of acute beds (BEDS) Beds/100'000 inhabitants
109 374 1098
Managed Care (MCARE) % of cantonal population with a mcare programme
0.09 3.33 25.72
Density of acute beds (BEDS) Beds/100'000 inhabitants
109 374 1098
Concerning the choice of econometric technique, it should be noted that in the
econometric literature we can find various types of models focusing on cross-sectional
variation, i.e., heterogeneity across units. The three most widely used approaches are:
the OLS model, the fixed-effects (LSDV) model, and the random-effects model
(GLS).14 In the OLS model, a common intercept as well as common slope coefficients
are assumed across individuals and time periods. The main difference between the OLS
and LSDV models involves the constant term. By introducing a complete set of cross-
section dummy variables, LSDV allows a separate constant term for each unit. The third
type is the random-effects model. While there are several alternative ways to specify the
error components, the most common is to assume that the individual constants are
random variables. In this case, differences between units are not viewed as parametric
shifts of the regression function as in the LSDV model, but as randomly distributed
shocks. Moreover, using the LSDV model it is not possible to estimate the parameters
of time- invariant variables, e.g., the poverty rate, the mortality rate and the direct
democracy index. Equation [2] is estimated using the fixed-effects model (LSDV) and
the random-effects model (GLS).
Table 6 presents the final regression results of the LSDV and GLS estimations:
Table 6 Econometric results
Coefficients LSDV model Cantonal Health Expenditure
GLS model Cantonal Health Expenditure
β0 9.846*** (1.464)
10.855*** (1.240)
β1 - 0.205*** (0.073)
- 0.171** (0.068)
β2 0.038** (0.019)
0.034** (0.017)
14 For a detailed presentation of the econometric methods that have been used to analyse panel data,
see Balestra and Nerlove (1966), Greene (2000) and Hsiao (2002).
23
β3 - -
0.161 (0.164)
β4 0.800*** (0.252)
0.555*** (0.144)
β5 - 0.025 (0.202)
- 0.142 (0.179)
β6 - -
- 0.282* (0.159)
β7 0.215 (0.145)
0.062*** (0.023)
β8 - -
- 0.109 (0.082)
β9 0.243* (0.128)
0.200** (0.099)
β10 - 0.012 (0.016)
- 0.006 (0.016)
β11 0.007 (0.013)
- 0.016 (0.010)
β12 0.035*** (0.007)
0.039*** (0.006)
Within R2
Between R2
Overall R2
0.830 0.554 0.562
0.822 0.833 0.832
*, **, ***: significantly different from zero at the 90, 95 and 99% confidence level.
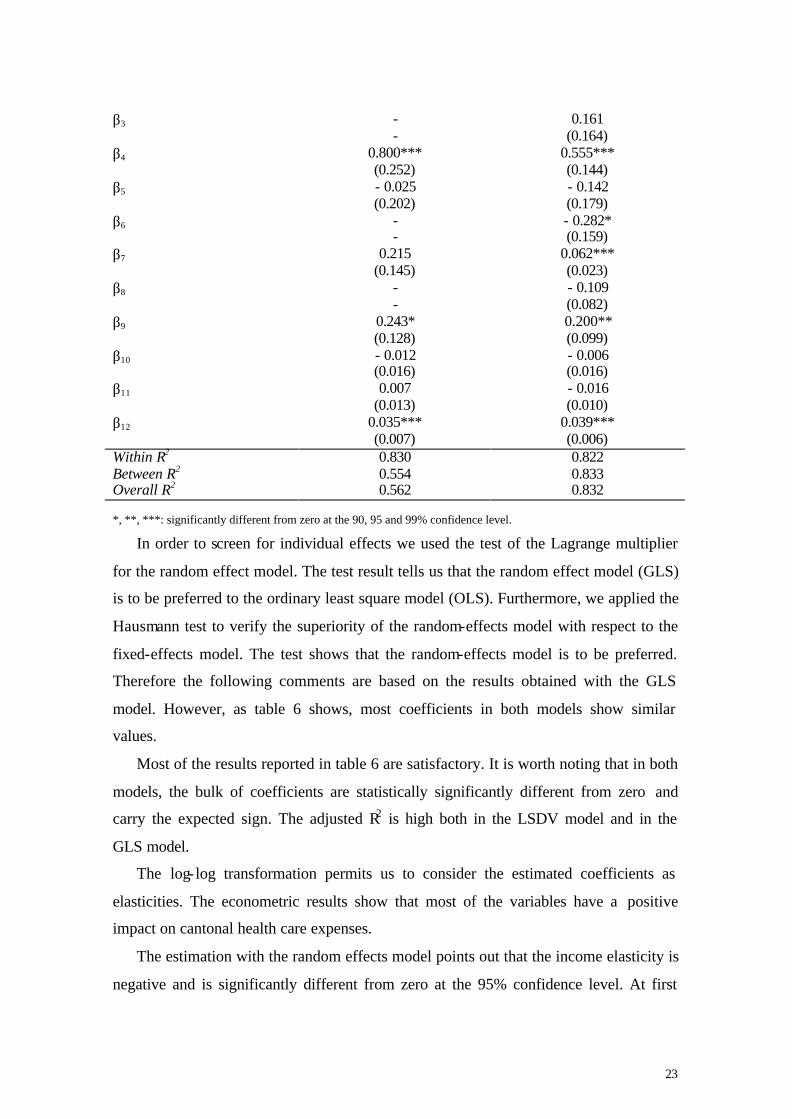
In order to screen for individual effects we used the test of the Lagrange multiplier
for the random effect model. The test result tells us that the random effect model (GLS)
is to be preferred to the ordinary least square model (OLS). Furthermore, we applied the
Hausmann test to verify the superiority of the random-effects model with respect to the
fixed-effects model. The test shows that the random-effects model is to be preferred.
Therefore the following comments are based on the results obtained with the GLS
model. However, as table 6 shows, most coefficients in both models show similar
values.
Most of the results reported in table 6 are satisfactory. It is worth noting that in both
models, the bulk of coefficients are statistically significantly different from zero and
carry the expected sign. The adjusted R2 is high both in the LSDV model and in the
GLS model.
The log- log transformation permits us to consider the estimated coefficients as
elasticities. The econometric results show that most of the variables have a positive
impact on cantonal health care expenses.
The estimation with the random effects model points out that the income elasticity is
negative and is significantly different from zero at the 95% confidence level. At first

24
sight, this result may appear surprising, since normally in the international literature
[Gerdtham et al. (1998), Di Matteo and Di Matteo (1998), Manning et al. ((1987)]
income elasticity is the most important factor explaining health expenditures, and it
carries a positive sign. However, this result may be due to the way the Swiss health care
system is organized. As previously discussed, in Switzerland all citizens are obliged by
law to take out a health insurance policy, which covers some specific services: this is
the mandatory and basic insurance. Citizens are also offered an additional private
insurance, which is not compulsory and offers a package of additional health care
services. Moreover, these private insurance plans also cover part of the basic services
normally financed by the state. This type of insurance is normally chosen by wealthier
people, as it tends to be rather expensive. The negative sign of the income coefficient
may explain this effect: the higher the average income in one canton, the lower the
socialized health expenditures; in fact individuals opt for the optional and private
insurance, and the expenditures of these insurance companies are not included in the
variable SHE. 15
With respect to the unemployment rate, a 10% increase in it is associated with
0.34% increase in the socialized health expenditures. This latter result confirms the
recent debate on the impact of social policies and the socio-economic determinants of
health. The coefficient for the cantonal poverty rate is not significantly different from
zero.16 This result could be explained by the fact that the poverty rate in Switzerland,
measured with this indicator, is lower than in other European countries.
The coefficient for the percentage of population over 75 is positive and significantly
different from zero at the 99% confidence level. This result confirms the hypothesis that
an older population tends to cause higher health expenditures, because of the increased
incidence of illnesses as insanity or other chronic diseases, as well as proximity to the
time of death of the elderly.17 A 10% increase in people aged over 75 would cause a
5.6% increase in health costs.
The level of health expenditures is also conditioned on the mortality rate amenable
to health care. This is an important variable because it can be considered as a proxy
15 Note that the system has changed since 2001. This implies that from 2002 private insurances do not have to cover anymore part of the basic services. 16 For a more detailed discussion of this issue please refer to the UFS, Enquête Suisse sur la santé 2002 . 17 See Zweifel at al. (1999).

25
variable for the outcome of a health care sector. As expected, it has a negative sign and
is statistically different from zero at the 90% confidence interval. If the canton’s
mortality rate amenable to health care decreases by 10%, then health expenditures
increase by 2.82%. This result shows that cantons with low mortality rate have higher
per-capita health expenditures.
Another important factor that explains our model is the cantonal population density.
This variable has been used as a proxy for the urbanization level in each region of
Switzerland. It is highly significant and carries a positive sign. This could confirm
previous studies on the international comparisons of health expenditures. The more
populated a specific region is, the higher its health expenditures, since diseases spread
faster and have a higher impact in these areas than in rural ones. However, another
interpretation is that the supply of medical services is higher in populated areas and
therefore there are lower transaction costs for people benefiting from the health care,
which in turn increases the probability of success of supply- induced demand strategies.
As the previous section should have made clear, DDI represents a variable
introduced in the model to test a hypothesis of the local public choice theory. With this
variable we tried to capture the preferences expressed by citizens with respect to health
policies. In the public choice literature, it is argued that the more citizens can express
their preferences, the more public goods will be fashioned according to their tastes (see
Oates [1972 and 1999], Leu [1986], Frey [1994]). The coefficient of this variable turns
out to be statistically not significantly different from zero but, as we expected, it carries
a negative sign. A negative sign implies that in those cantons where direct democracy is
stronger, health care expenditures are generally lower because citizens’ preferences are
taken more seriously, and waste contained.18
The elasticity of physicians’ density has a positive value. In other words, an increase
in the number of physicians causes an increase in the cantonal socialized health
expenditures. A 10% increase in physicians’ density is linked with a 2.0% increase in
health costs. This latter result might highlight the supplier- induced demand problem. In
fact, doctors are paid through a fee-for-service scheme. As a consequence there might
18 It is interesting to bring to the fore the fact that in Switzerland popular initiatives and referenda are a central part of the democratic life of the country, and they are very frequently used. Citizens can also call a referendum on issues like cantonal hospital planning.

26
be an incentive to expand the number of services given to patients as physicians’ density
goes up.19
The coefficient for the variable managed care is negative, as expected, but not
significantly different from zero. The general hypothesis or expectation is that the
greater the number of people choosing a managed care programme, the lower the
ensuing health costs. The result obtained in this study could be due to the fact that
managed care plans offered nowadays in Switzerland are a somewhat weaker version of
managed care programmes normally provided in other countries (for instance, in the
US). For example, the selected physicians of managed care plans are remunerated with
a fee-for-service scheme, not much of an incentive for a family doctor to reduce his
services, and hence costs.
Time variable T is positive and significantly different from zero. Hence, there is a
tendency in all cantons toward higher per-capita health expenditures. This phenomenon
might be explained by the presence on the market of new and more expensive
technologies, and by the fact that the package of health care benefits covered by the
FHIA has ballooned in the 1990s.
6. Conclusions
Our study has presented the organization of the Swiss health care system and an
empirical analysis of the determinants of the per-capita cantonal health care
expenditures. In the first part of the paper, particular attention has been paid to the
description of broad differences existing between the 26 cantons with respect to per-
capita health expenditures, the public financing activity and existing productive
capacity. The descriptive analysis shows that in Switzerland, where the principle of
federalism is very deep-rooted and deeply felt by the whole population, such
decentralization of the health care sector has given rise to significant differences
between cantons in terms of per-capita health expenditures, equity of financing, and
structure of the supply. For these reasons we suggest that the central state should play a
more dominant role in the Swiss health policy, toning down these current marked
19 For further details on the supplier-induced demand theory see McGuire (2000) and Domenighetti et al. (1997). Furthermore, it is worth pointing out that the impact of physicians’ density on the per capita socialized health expenditures, associated with a fee-for-service scheme, confirms the results obtained by Gerdtham et al. (1998).

27
regional differences and finding the adequate instruments to control the growth of health
care expenditures effectively.
In the second part of the paper we have presented the results of the estimation of a
double logarithmic linear econometric model of per-capita cantonal health care
expenditures over the years 1996-2001 using panel data. The model serves to determine
the responsiveness of per-capita expenditures to own income, unemployment and
variables relating to demographic and structural characteristics of cantons. The
estimated model demonstrates the importance of physicians’ density (possible supply
induced demand phenomenon in a system where the fee-for-service scheme is present).
We believe that by controlling physicians’ density we may curb any rise in per-capita
health care expenditures. Another important factor that seems to explain the difference
in the cantonal health care expenditures is the percentage of over 75 in the population,
which cannot be influenced by health policies. It is our belief that, faced with an ageing
population exhibiting regional differences, a more active financial intervention by the
central state would be highly desirable in order to avoid fiscal distress at the cantonal
level.
7. References
Balestra P. and M. Nerlove (1996), Formulation and estimation of econometric models for panel data, in: Matyas L. and P. Sevestre (eds), The econometrics of panel data: A handbook of the theory with applications, Dordrecht, Boston and New York: Kluwer.
Banting G. and S. Corbett (2002), Health Policy and Federalism. A Comparative Perspective on Multi-Level Governance, Montreal & Kingston: McGill-Queen’s University Press.
Barros P.P. (1998), The black-box of health care expenditure growth determinants, Health Economics 7, 533-544.
Connolly S. and A. Munro (1999), Economics of the Public Sector, London: Prentice Hall.
Crivelli, L. and M. Filippini (2003), ‘Il federalismo nel settore sanitario’, in Ghiringhelli, A. (ed.), Il Ticino nella Svizzera, Locarno: Dadò, 353-379.
Crivelli, L., M. Filippini and D. Lunati (2002), Regulation, Ownership and Efficiency in the Swiss Nursing Home Industry, International Journal of Health Care Finance and Economics, II (2), 79-97.
Crivelli, L., M. Filippini e I. Mosca (2003), ‘Federalismo e spesa sanitaria regionale: Analisi empirica per i cantoni svizzeri’ in: Franco, D. e Zanardi, A. (a cura di), Welfare
28
state e decentramento fiscale, Società italiana di economia pubblica, Milano: Franco Angeli.
Di Matteo L. and R. Di Matteo (1998), Evidence on the determinants of Canadian provincial Government health expenditures: 1965-1991, Journal of Health Economics 17, 211-228.
Domenighetti, G. et L. Crivelli (2001), Sécurité de l'approvisionnement en médecine de ville dans le cadre de la suppression de l'obligation de contracter, perizia per conto di SantéSuisse.
Domenighetti, G. et al. (1997), Dépense et maîtrise des coûts sanitaires en Suisse, Bollettino dei medici svizzeri 78 (16), 588-593.
Domenighetti, G. et C. Limoni (1994), Effet de la densité médicale sur les dépenses pour la médecine ambulatoire en Suisse, Médecine et Hygiène 52, 1902-09.
France, G. (2001) (a cura di), Federalismo, regionalismo e standard sanitari nazionali. Quattro paesi, quattro approcci, Milano: Giuffré.
Frey, B. and A. Stutzer (2000), Happiness, economy and institutions, The Economic Journal 110, 918-938.
Frey B., (1994), Direct democracy: Politico-economic lessons from Swiss experience, The American Economic Review, 84 (2), 338-342.
Gerdtham U.G., J. Sogaard, F. Andersson and B. Jonsson (1992), An econometric analysis of health care expenditure: A cross-section study of the OECD countries, Journal of Health Economics 11, 63.
Gerdtham U.G., B. Jönsson , M. MacFarlan and H.Oxley (1998), The determinants of health expenditure in the OECD countries, in P. Zweifel (ed.), Health, The Medical Profession and Regulation, Dordrecht: Kluwer.
Gerdtham U.G. and B. Jönsson (2000), International Comparisons of Health Expenditure: Theory, Data and Econometric Analysis, in: Culyer, A.J. e J.P. Newhouse (eds), Handbook of Health Economics, North-Holland: Elsevier Science.
Greene W.H. (2000), Econometric Analysis, New York: Prentice Hall.
Hitiris T. and J. Posnett (1992), The determinants and effects of health expenditure in developed countries, Journal of Health Economics 11, 173.
Hsiao C. (1986), Analysis of panel data, Econometric Society Monographs No. 11, Cambridge: Cambridge University Press.
Hsiao, C., (2002), Analysis of panel data, Cambridge: Cambridge University Press
Leu R. E. (1986), The public-private mix and international health care costs, in: A.J. Culyer, B. Jonsson (eds.), Public and Private Health Services, Oxford: Basil Blackwell.
Manning W.G. et al. (1987), Health insurance and the demand for medical care: evidence from a randomized experiment, The American Economic Review 77, 251.
McGuire T. (2000), Physician Agency, in: Culyer, A.J. e J.P. Newhouse (eds), Handbook of Economics, Vol. 1, North-Holland: Elsevier Science.

29
Newhouse J. P. (1977), Medical care expenditure: a cross-national survey, Journal of Human Resources 12, 115.
Nolte E. and M. McKee (2003), Measuring the health of nations: analysis of mortality amenable to health care, British Medical Journal 327, 1129.
Oates W.E. (1972), Fiscal federalism, New York: Harcourt Brace Jovanovich.
Oates W.E. (1999), An essay on fiscal federalism, Journal of Economic Literature 37, 1120-1149.
Rüefli, C. und A. Vatter (2001), Kostendifferenzen im Gesundheitswesen zwischen den Kantonen. Statistische Analyse kantonaler Indikatoren, Bern: Teilprojekt der Wirkungsanalyse KVG 318.010.14/01.
Trechsel, A. and U. Serdült (1999), Kaleidoscop Volksrechte: die Institutionen der direkten Demokratie in den schweizerischen Kantonen 1970-1996, Basel, Genf and Munich: Helbling & Lichtenhahn.
Ufficio Federale delle Assicurazioni Sociali (2001), Statistiques de l’assurance maladie 1999, Berna: UFAS.
Ufficio Federale di Statistica (2003), Kosten des Gesundheitswesen, Neuchâtel: UFS.
Ufficio Federale di Statistica (2002), Informations sur le projet “Statistiques des établissements de santé (soins intra-muros), StatSanté 1/2002, 17.
Ufficio Federale di Statistica (2002), Enquête suisse sur la santé.
Ufficio Federale di Statistica (2001), Statistiques des établissements de santé (soins intra-muros).
Wagstaff A. et al. (1999), The redistributive effect of health care finance in twelve OECD countries, Journal of Health Economics 18, 291.
World Bank Institute (2000), Flagship program on health sector reform and sustainable financing.
Zweifel, P., S. Felder and M. Meier (1999), Ageing of population and health care expenditure: A red herring?, Health Economics 8, 485-496.
QUADERNI DELLA FACOLTÀ
I quaderni sono richiedibili (nell’edizione a stampa) alla Biblioteca universitaria di Lugano via G. Buffi 13 CH 6900 Lugano e-mail: [email protected] The working papers (printed version) may be obtained by contacting the Biblioteca universitaria di Lugano via G. Buffi 13 CH 6900 Lugano e-mail: [email protected] Quaderno n. 98-01
P. Balestra, Efficient (and parsimonious) estimation of structural dynamic error component models
Quaderno n. 99-01
M. Filippini, Cost and scale efficiency in the nursing home sector : evidence from Switzerland
Quaderno n. 99-02
L. Bernardi, I sistemi tributari di oggi : da dove vengono e dove vanno Quaderno n. 99-03
L.L. Pasinetti, Economic theory and technical progress Quaderno n. 99-04
G. Barone -Adesi, K. Giannopoulos, L. Vosper, VaR without correlations for portfolios of derivative securities
Quaderno n. 99-05
G. Barone-Adesi, Y. Kim, Incomplete information and the closed-end fund discount Quaderno n. 99-06
G. Barone -Adesi, W. Allegretto, E. Dinenis, G. Sorwar, Valuation of derivatives based on CKLS interest rate models
Quaderno n. 99-07
M. Filippini, R. Maggi, J. Mägerle , Skalenerträge und optimale Betriebsgrösse bei den schweizerische Privatbahnen
Quaderno n. 99-08
E. Ronchetti, F. Trojani, Robust inference with GMM estimators Quaderno n. 99-09
G.P. Torricelli, I cambiamenti strutturali dello sviluppo urbano e regionale in Svizzera e nel Ticino sulla base dei dati dei censimenti federali delle aziende 1985, 1991 e 1995
Quaderno n. 00-01
E. Barone, G. Barone-Adesi, R. Masera, Requisiti patrimoniali, adeguatezza del capitale e gestione del rischio
Quaderno n. 00-02
G. Barone-Adesi, Does volatility pay? Quaderno n. 00-03
G. Barone-Adesi, Y. Kim, Incomplete information and the closed-end fund discount
Quaderno n. 00-04 R. Ineichen, Dadi, astragali e gli inizi del calcolo delle probabilità
Quaderno n. 00-05
W. Allegretto, G. Barone-Adesi, E. Dinenis, Y. Lin, G. Sorwar, A new approach to check the free boundary of single factor interest rate put option
Quaderno n. 00-06
G.D.Marangoni, The Leontief Model and Economic Theory Quaderno n. 00-07
B. Antonioli, R, Fazioli, M. Filippini, Il servizio di igiene urbana italiano tra concorrenza e monopolio
Quaderno n. 00-08
L. Crivelli, M. Filippini, D. Lunati. Dimensione ottima degli ospedali in uno Stato federale
Quaderno n. 00-09
L. Buchli, M. Filippini, Estimating the benefits of low flow alleviation in rivers: the case of the Ticino River
Quaderno n. 00-10
L. Bernardi, Fiscalità pubblica centralizzata e federale: aspetti generali e il caso italiano attuale
Quaderno n. 00-11
M. Alderighi, R. Maggi, Adoption and use of new information technology Quaderno n. 00-12
F. Rossera, The use of log-linear models in transport economics: the problem of commuters’ choice of mode
Quaderno n. 01-01
M. Filippini, P. Prioni, The influence of ownership on the cost of bus service provision in Switzerland. An empirical illustration
Quaderno n. 01-02
B. Antonioli, M. Filippini, Optimal size in the waste collection sector
Quaderno n. 01-03 B. Schmitt, La double charge du service de la dette extérieure

Quaderno n. 01-04
L. Crivelli, M. Filippini, D. Lunati, Regulation, ownership and efficiency in the Swiss nursing home industry
Quaderno n. 01-05
S. Banfi, L. Buchli, M. Filippini, Il valore ricreativo del fiume Ticino per i pescatori Quaderno n. 01-06
L. Crivelli, M. Filippini, D. Lunati, Effizienz der Pflegeheime in der Schweiz Quaderno n. 02-01
B. Antonioli, M. Filippini, The use of a variable cost function in the regulation of the Italian water industry
Quaderno n. 02-02
B. Antonioli, S. Banfi, M. Filippini, La deregolamentazione del mercato elettrico svizzero e implicazioni a breve termine per l’industria idroelettrica
Quaderno n. 02-03
M. Filippini, J. Wild, M. Kuenzle, Using stochastic frontier analysis for the access price regulation of electricity networks
Quaderno n. 02-04
G. Cassese, On the structure of finitely additive martingales Quaderno n. 03-01
M. Filippini, M. Kuenzle, Analisi dell’efficienza di costo delle compagnie di bus italiane e svizzere
Quaderno n. 03-02
C. Cambini, M. Filippini, Competitive tendering and optimal size in the regional bus transportation industry
Quaderno n. 03-03
L. Crivelli, M. Filippini, Federalismo e sistema sanitario svizzero Quaderno n. 03-04
L. Crivelli, M. Filippini, I. Mosca, Federalismo e spesa sanitaria regionale : analisi empirica per i Cantoni svizzeri
Quaderno n. 03-05
M. Farsi, M. Filippini, Regulation and measuring cost efficiency with panel data models : application to electricity distribution utilities
Quaderno n. 03-06
M. Farsi, M. Filippini, An empirical analysis of cost efficiency in non-profit and public nursing homes
Quaderno n. 03-07
F. Rossera, La distribuzione dei redditi e la loro imposizione fiscale : analisi dei dati fiscali svizzeri
Quaderno n. 03-08 L. Crivelli, G. Domenighetti, M. Filippini, Federalism versus social citizenship : investigating the preference for equity in health care
Quaderno n. 03-09
M. Farsi, Changes in hospital quality after conversion in ownership status Quaderno n. 03-10
G. Cozzi, O. Tarola, Mergers, innovations, and inequality Quaderno n. 03-11
M. Farsi, M. Filippini, M. Kuenzle , Unobserved heterogeneity in stochastic cost frontier models : a comparative analysis
Quaderno n. 04-01
G. Cassese, An extension of conditional expectation to finitely additive measures Quaderno n. 04-02
S. Demichelis, O. Tarola, The plant size problem and monopoly pricing Quaderno n. 04-03
F. Rossera, Struttura dei salari 2000 : valutazioni in base all’inchiesta dell’Ufficio federale di statistica in Ticino
Quaderno n. 04-04
M. Filippini, M. Zola, Economies of scale and cost efficiency in the postal services : empirical evidence from Switzerland
Quaderno n. 04-05
F. Degeorge, F. Derrien, K.L. Womack, Quid pro quo in IPOs : why book -building is dominating auctions
Quaderno n. 04-06
M. Farsi, M. Filippini, W. Greene , Efficiency measurement in network industries : application to the Swiss railway companies
Quaderno n. 04-07
L. Crivelli, M. Filippini, I. Mosca, Federalism and regional health care expenditures : an empirical analysis for the Swiss cantons