Federal Tax Incentives for Rehabilitating Historic Buildings · immediate rehabilitation work, but...
29
National Park Service U.S. Department of the Interior Technical Preservation Services December 2011 The Roshek Building, Dubuque, Iowa Statistical Report and Analysis for Fiscal Year 2011 Federal Tax Incentives for Rehabilitating Historic Buildings
Transcript of Federal Tax Incentives for Rehabilitating Historic Buildings · immediate rehabilitation work, but...

National Park ServiceU.S. Department of the InteriorTechnical Preservation Services December 2011
The Roshek Building, Dubuque, Iowa
Statistical Report and Analysis for Fiscal Year 2011
Federal Tax Incentives for Rehabilitating
Historic Buildings
Federal Tax Incentives for Rehabilitating Historic BuildingsStatistical Report and Analysis for Fiscal Year 2011
U.S. Department of the Interior, National Park ServiceCultural Resources, Technical Preservation Services, Washington, DC
December 2011

Job creation sets new recordRoshek Building, Dubuque, Iowa
While promoting the rehabilita-tion and preservation of historic buildings, the Federal Historic Tax Incentives program also serves as an important eco-nomic catalyst to helping revi-talize older communities.
One of the important immediate benefi ts is job creation. More labor intensive than new con-struction, rehabilitating historic buildings has the added eco-nomic benefi t in that it usually involves a faster start to completion time than new construction. Job creation is realized not only through the immediate rehabilitation work, but when the underutilized or vacant building is once again placed in service in the community.
In FY 2011, the Federal Historic Preservation Tax Incentives program set a record high of 78 jobs created on the average for each certifi ed rehabilitation project. A major increase over the previous year and breaking the old record of 68 jobs set in FY 2009, the program is a proven job stimulant in today’s troubled economy. In FY 2011, more than 55,458 jobs were created, concentrated in the construction, service, and retail sectors.
The Roshek Building in Dubuque, Iowa, featured on the cover and on this page, is an outstanding example of this activity. Formerly the Roshek Department Store building, it has had a long history of job creation. Built during the early years of the Great Depression, it provided much needed jobs for construction workers and the department store be-came a major retail employer and served as a key compo-nent of downtown Dubuque’s fi nal pre-World War II building expansion.
The tallest building in the city, it remained remarkably intact through 1970 when the department store relocated and the building was converted to offi ce use. By 2008 with the loss of major tenants, the Roshek Building was on the verge of becoming a white elephant in the central downtown.
Through the efforts of the City, the developer Dubuque Initiatives, Inc., and others, an ambitious and success-ful turnaround for the building was achieved, beginning when IBM selected the city and the Roshek Building in 2009 for its new regional service headquarters. A fast track rehabilitation of the building was essential, since IBM would be creating 1,300 well-paying technical and support jobs by 2011. With a commitment to preserving the historic character of the building and making the building a model of sustainability, rehabilitation work started in 2009, providing employment to more than 200 during the construc-tion phase. Cast-iron canopies, ornamental millwork, plaster ceilings and decorative columns were restored or carefully replicated. Historic steel windows and terrazzo fl oors were repaired and new system furniture installed, providing desirable offi ce space while respecting the building’s historic open fl oor plan.
Over $45 million in rehabilitation work took place, resulting in nearly 260,000 square feet of leasable space. Today, the fi rst fl oor includes restaurants and retail stores with new businesses and others which relocated into expanded spaces. Besides the 1,300 new jobs at IBM, commercial and retail tenants in the building added over 40 additional new jobs.
photo: Design Photography, Dubuque, Iowa
photo: Aaron DeJong

Statistical Report and Analysis for Fiscal Year
2011
Highlights for 2011
Estimated investment in historic rehabilitationRehabilitation costs (Part 2): $4.02 billionAverage cost of projects: $4.29 million Number of approved applications (Part 2s): 937
Number of housing units sets new recordNumber of housing units: 15,651Rehabilitated housing units: 7,435New housing units: 8,216New low and moderate income housing units: 7,470
Job creation sets new record highAverage number of local jobs created per project: 78Estimated number of local jobs created: 55,458
Program Accomplishments 1977-2011
Number of historic rehabilitation projects certifi ed (Part 3s): 38,075Rehabilitation investment: $62.94 billionRehabilitated housing units: 231,486New housing units: 209,913Low and moderate income housing units: 117,975
Numbers used in this report are taken from the Part 1, 2, and 3 Historic Preservation Certifi cation Applications and voluntary User Profi le and Customer Satisfaction Ques tion naire.
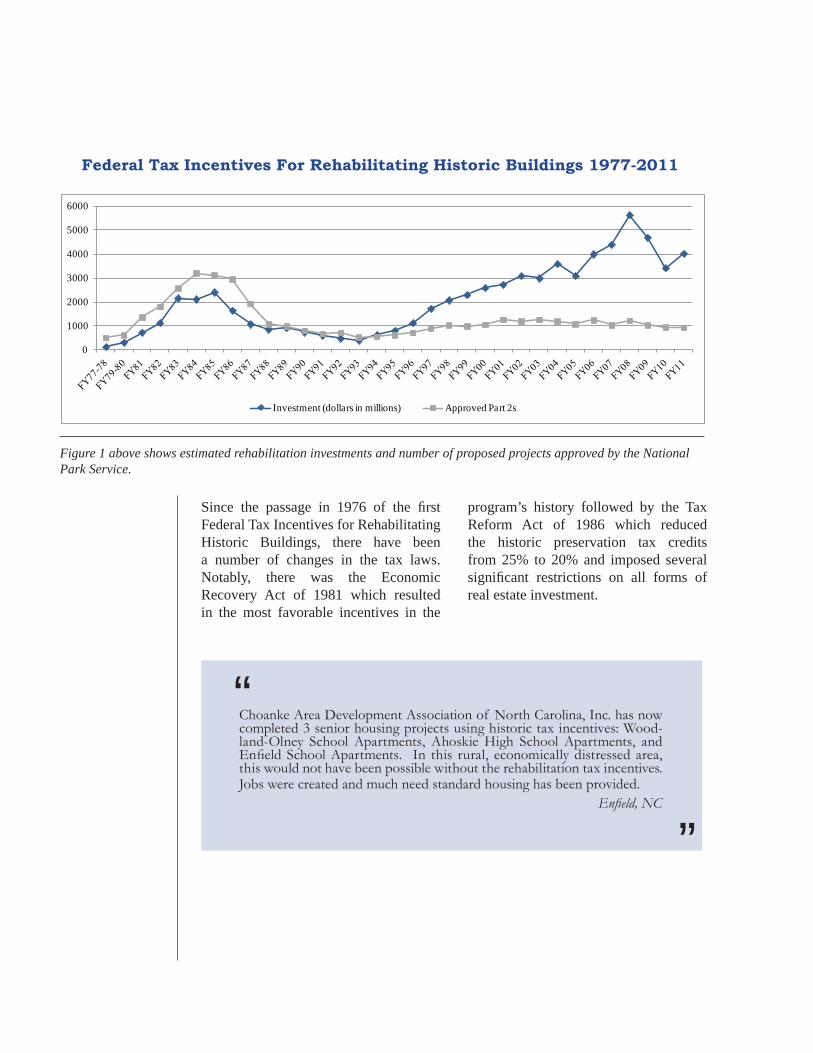
Figure 1 above shows estimated rehabilitation investments and number of proposed projects approved by the National Park Service.
Since the passage in 1976 of the fi rst Federal Tax Incentives for Rehabilitating Historic Buildings, there have been a number of changes in the tax laws. Notably, there was the Economic Recovery Act of 1981 which resulted in the most favorable incentives in the
program’s history followed by the Tax Reform Act of 1986 which reduced the historic preservation tax credits from 25% to 20% and imposed several signifi cant restrictions on all forms of real estate investment.
Federal Tax Incentives For Rehabilitating Historic Buildings 1977-2011
0
1000
2000
3000
4000
5000
6000
Investment (dollars in millions) Approved Part 2s
Choanke Area Development Association of North Carolina, Inc. has now completed 3 senior housing projects using historic tax incentives: Wood-land-Olney School Apartments, Ahoskie High School Apartments, and Enfi eld School Apartments. In this rural, economically distressed area, this would not have been possible without the rehabilitation tax incentives. Jobs were created and much need standard housing has been provided. Enfi eld, NC
“
”

Statistical Report and Analysis for Fiscal Year
2011
Federal Tax Incentives for Rehabilitating Historic Buildings 1
The Historic Preservation Tax Incentives program, administered by the National Park Service in partnership with the State Historic Preservation Offi ces, is the nation’s most effective Federal program to promote both urban and rural revitalization and encourage private investment in historic building rehabilitation. Since 1976, the tax incentives have spurred the rehabilitation of historic structures of every period, size, style, and type. The incentives have been instrumental in preserving the historic places that give cities, towns, and rural areas their special character, and have attracted new private investment to historic cores of cities and towns. The tax incentives also generate jobs, enhance property values, create affordable housing, and augment revenues for Federal, state, and local governments. Through this program, abandoned or underutilized schools, warehouses, factories, churches, retail stores, apartments, hotels, houses, and offi ces throughout the country have been restored to life in a manner that maintains their historic character.
The tax credit applies specifi cally to income-producing historic properties and throughout its history has leveraged many times its cost in private expendi-tures on historic preservation. This pro-gram is the largest Federal program spe-cifi cally supporting historic preservation, generating over $62 billion in historic preservation activity since its inception
Foreword
in 1976. During fi scal year (FY) 2011, the National Park Service approved 937 proposed projects (Part 2 applications)representing an estimated $4.02 billion of investment being spent to restore and rehabilitate historic buildings.
Over 38,000 projects to rehabilitate historic buildings have been undertaken in the past 35 years using the Federal Historic Preservation Tax Incentives. Rehabilitation work has taken place in all 50 states, the District of Columbia, the Virgin Islands, and Puerto Rico. The completed projects have brought new life to deteriorated business and residential districts, created new jobs and new housing, and helped to ensure the long-term preservation of irreplaceable cultural resources.
In 1986, Congress amended the Federal Tax Code, signifi cantly reducing the Federal tax incentives for historic preservation and creating more stringent rules for their use. The result was a dramatic decline in activity. Starting in the mid-1990s, activity nationwide rebounded, reaching record highs in recent years in the amount of investment dollars. While the recent downturn in the economy in general, and the real estate market in particular, has continued to impact program activity in FY 2011, the amount of rehabilitation investment in proposed new projects increased 17% surpassing the $4 billion mark for only the fourth time in the program history.
(continued next page)

Statistical Report and Analysis for Fiscal Year 2011
Federal Tax Incentives for Rehabilitating Historic Buildings2
The average investment in completed certifi ed projects (Part 3 applications) in FY 2011 was $4.88 million, the second highest in program history.
During FY 2011, National Park Service review of project submissions continued to be undertaken by the Cultural Resources, Technical Preservation Services Branch, in Washington, DC. To enhance customer service, Technical Preservation Services maintains a Web site, <http:// www.nps.gov/tps>, where applicants, State Historic Preservation Offi ces, and others can check the status of projects online. In addition, the certifi cation application, guidance on applying the Secretary of the Interior’s
Standards for Rehabilitation, and technical information concerning the treatment of historic buildings can be found on the National Park Service Web site.
This statistical report and analysis was prepared by Kaaren Staveteig of the Technical Preservation Services Branch. Questions regarding the data and analysis discussed may be addressed to Ms. Staveteig by e-mail at <[email protected]>. Special thanks are due to the staff of the Technical Preservation Services Branch for their assistance in the preparation of this report, particularly Charles Fisher, Michael Auer, and Liz Petrella.
Technical Preservation ServicesDecember, 2011

Statistical Report and Analysis for Fiscal Year
2011
Federal Tax Incentives for Rehabilitating Historic Buildings 3
Foreword..................................................................................1-2
States By Geographic Region......................................................................4
Preservation Tax Incentives Project Activity...........................................5-13 Estimated Future Investment Certifi cations of Signifi cance Approvals of Proposed Rehabilitation Work Certifi ed Rehabilitation Projects Investment by Region Activity on a State-by-State Basis
Denials and Appeals...................................................................................14
Ownership of Certifi ed Rehabilitation Projects.........................................15 Ownership and Size of Completed Projects
Uses of Rehabilitated Properties.................................................................16
Housing and Preservation............................................................................17
Use of Additional Incentives and Funding Assistance...............................18
State Historic Preservation Tax Incentives..................................................20
Appendices: Appendix A: Alphabetical List of State Activity in FY 2011..............21 Appendix B: States Ranked by Approved Proposals (Part 2s) in FY 2011...............................................................................22
Appendix C: States Ranked by Certifi ed Projects (Part 3s) in FY 2011...............................................................................23
Appendix D: States Ranked by Certifi ed Expenses in FY 2011...............................................................................24
Table of Contents

Statistical Report and Analysis for Fiscal Year 2011
Federal Tax Incentives for Rehabilitating Historic Buildings4
States By Geographic Region
States listed by Geographic Regions:
Mountain/Plains:ColoradoIllinoisIowaKansasMinnesotaMissouriMontanaNebraskaNew MexicoNorth DakotaOklahomaSouth DakotaTexasWisconsinWyomingUtah
Northeast:ConnecticutDelawareIndianaMaineMarylandMassachusettsMichiganNew HampshireNew JerseyNew YorkOhioPennsylvaniaRhode IslandVermontVirginiaWashington DCWest Virginia
Southeast:AlabamaArkansasFloridaGeorgiaKentuckyLouisianaMississippiNorth CarolinaPuerto RicoSouth CarolinaTennesseeVirgin Islands
Far West:AlaskaArizonaCaliforniaHawaiiIdahoNevadaOregonWashington
Figure 2
for Purposes of Statistical Reporting and Analysis
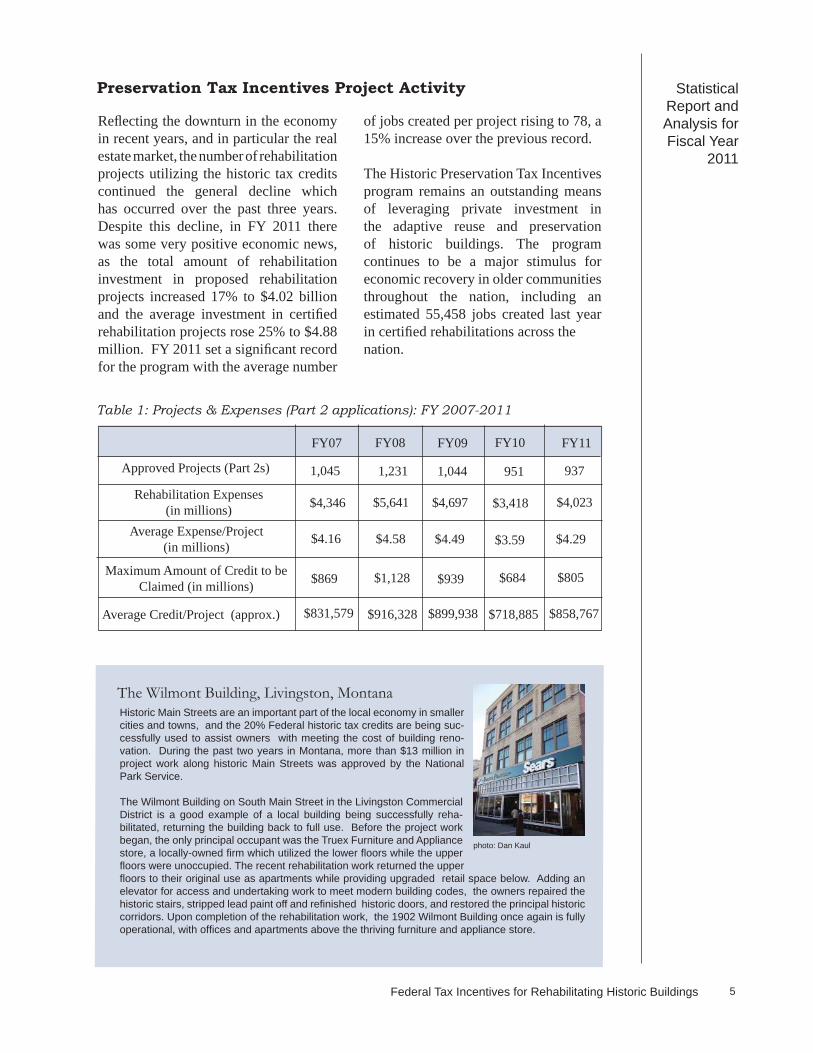
Historic Main Streets are an important part of the local economy in smaller cities and towns, and the 20% Federal historic tax credits are being suc-cessfully used to assist owners with meeting the cost of building reno-vation. During the past two years in Montana, more than $13 million in project work along historic Main Streets was approved by the National Park Service.
The Wilmont Building on South Main Street in the Livingston Commercial District is a good example of a local building being successfully reha-bilitated, returning the building back to full use. Before the project work began, the only principal occupant was the Truex Furniture and Appliance store, a locally-owned fi rm which utilized the lower fl oors while the upper fl oors were unoccupied. The recent rehabilitation work returned the upper fl oors to their original use as apartments while providing upgraded retail space below. Adding an elevator for access and undertaking work to meet modern building codes, the owners repaired the historic stairs, stripped lead paint off and refi nished historic doors, and restored the principal historic corridors. Upon completion of the rehabilitation work, the 1902 Wilmont Building once again is fully operational, with offi ces and apartments above the thriving furniture and appliance store.
Statistical Report and Analysis for Fiscal Year
2011
Federal Tax Incentives for Rehabilitating Historic Buildings 5
Refl ecting the downturn in the economy in recent years, and in particular the real estate market, the number of rehabilitation projects utilizing the historic tax credits continued the general decline which has occurred over the past three years. Despite this decline, in FY 2011 there was some very positive economic news, as the total amount of rehabilitation investment in proposed rehabilitation projects increased 17% to $4.02 billion and the average investment in certifi ed rehabilitation projects rose 25% to $4.88 million. FY 2011 set a signifi cant record for the program with the average number
Preservation Tax Incentives Project Activity
of jobs created per project rising to 78, a 15% increase over the previous record.
The Historic Preservation Tax Incentives program remains an outstanding means of leveraging private investment in the adaptive reuse and preservation of historic buildings. The program continues to be a major stimulus for economic recovery in older communities throughout the nation, including an estimated 55,458 jobs created last year in certifi ed rehabilitations across thenation.
Maximum Amount of Credit to be Claimed (in millions)
Average Credit/Project (approx.)
Approved Projects (Part 2s)
Rehabilitation Expenses(in millions)
Average Expense/Project(in millions)
Table 1: Projects & Expenses (Part 2 applications): FY 2007-2011
FY07
1,045
$4,346
$4.16
$869
$831,579
FY09
1,231
$5,641
$4.58
$1,128
$916,328
FY08
1,044
$4,697
$4.49
$939
$899,938
FY10
951
$3,418
$3.59
$684
$718,885
FY11
937
$4,023
$4.29
$805
$858,767
The Wilmont Building, Livingston, Montana
photo: Dan Kaul

Statistical Report and Analysis for Fiscal Year 2011
Federal Tax Incentives for Rehabilitating Historic Buildings6
Certifi cations of Historic Signifi cance (Part 1s) are the fi rst step in establishing eligibility for the historic tax credit and an early economic indicator for future rehabilitation projects. A building must be individually listed in the National Register of Historic Places or be certifi ed as contributing to a registered historic district (Part 1), in order to qualify for the 20% credit. Last year, 1,058 properties were approved for Certifi cation of Historic Signifi cance, a 7% increase over the previous year. The National
Certifi cations of Signifi cance
Two major events have impacted the Historic Preservation Tax Incentives program in the past 25 years. Changes in the Federal tax law in 1986 led to a dramatic decline between FY 1989 and 1993 in the estimated investment in new historic rehabilitation projects throughout the country. This trend was reversed starting in FY 1994, as the number of new projects steadily increased and the amount of investment in new projects
reached a record high in FY 2008. Since then, the downturn in the economy has led to a general decline in approved proposed projects. Within two years, the amount of investment in proposed new projects dropped 65% to $3.4 billion. While the number of proposed new projects decreased slightly in FY 2011, the amount of proposed new investment increased 17% to $4.02 billion, reversing the previous two-year decline.
Estimated Future Investment
COST
Less than$20,000
$20,000-$99,999
$100,000-$249,999
$250,000-$499,999
$500,000-$999,999
$1,000,000 and over
TOTAL 100% 100% 100% 100%
FY07
1%
8%
15%
19%
15%
42%
FY08
2%
15%
19%
15%
12%
37%
FY09
0.5%
8%
17%
17%
14.5%
43%
100%
Table 2: Size of Approved Rehabilitation Projects (part 2s) As Percentage of Total
Park Service also certifi es buildings as nonsignifi cant, i.e., not contributing to a National Register historic district. A building that has been certifi ed as nonsignifi cant but was built before 1936 can qualify for a 10% tax credit if it is rehabilitated for income-producing, non-residential purposes. The National Park Service also can certify State or Local Historic Districts that are not listed in the National Register. This allows buildings in these districts to qualify for tax credits if they meet other
FY11
0.5%
9.5%
15.5%
17.5%
13%
44%
FY10
1%
7%
13%
18%
12%
49%

Statistical Report and Analysis for Fiscal Year
2011
Federal Tax Incentives for Rehabilitating Historic Buildings 7
Table 3: Approved Certifi cations of Signifi cance (Part 1s)
NE
SE
MP
FW
TOTAL
REGION FY07
690
303
408
30
1,431
FY08
648
44
317
1,365
356
criteria of contributing and being income-producing, and the rehabilitation meets the Secretary of the Interior’s Standards for Rehabilitation. In addition, the Part 1 submissions are certifi ed where the applicant is seeking only to
take a charitable donation for a historic preservation easement. In such a case, no Part 2 or 3 submissions are necessary. In FY 2011, there were 21 Certifi cations of Signifi cance for easement purposes, a 42% decline from the previous year.
FY09
657
309
300
103
1,369
FY10
470
242
239
32
983
484
301
236
37
1,058
FY11
Kent Road Village, Richmond, VirginiaBuildings within a National Register historic district or within a complex of buildings that is individually listed in the National Register need to individually contribute to the historic signifi cance of the district or listed property in order to qualify as a certifi ed historic structure for historic tax credit purposes.
The late 19th and early 20th century saw mass migration from rural to urban areas. When built in 1943, the Kent Road Village apartment complex provided a unique opportunity for Richmond resi-dents facing an acute wartime housing shortage. Characterized by groups of two- and three-story buildings harmoniously arranged in a landscaped, suburban setting, the buildings featured walk-up apartments with central entrances, and fl oor plans that provided for ample light, ventilation, and pleasant views, while allowing ready access to the outdoor space.
Today Kent Road Village is a rare example of an intact WW II era garden apartment complex with both buildings and the surrounding landscape retaining a high degree of integrity. Utilizing the Fed-eral historic tax credits, a $2.7 million rehabilitation project was undertaken. The original 11 buildings were preserved with no exterior changes except for the removal of some contemporary shed addi-tions. The historic features and fi nishes within the common spaces were also retained. Interior plan changes occurred within 8 of the 88 units where new two-bed room units were created; otherwise, the majority of the units retain their original confi gurations.
photo: Sadler & Whitehead Architects, PLC

Statistical Report and Analysis for Fiscal Year 2011
Federal Tax Incentives for Rehabilitating Historic Buildings8 Federal Tax Incentives for Rehabilitating Historic Buildings
Certifi cations of completed projects (Part 3s) are issued only when all work has been fi nished on a certifi ed historic building or building complex. These approvals are the last administrative actions taken by the National Park Service for taxpayers eligible for the historic rehabilitation tax credit. Due
Certifi ed Rehabilitation Projects
in part to the signifi cantly large number of designated historic buildings in the Northeast region, that region continues to lead the nation in certifi ed projects (Part 3s), while the percentage breakdown by region basically remained the same from the previous year.
In comparison to FY 2010, when decreases in the number of approved Part 2s occurred in three of the four regions, in FY 2011 only the Northeast region saw a decrease in activity. In the Southeast region, which witnessed a small increase in approved proposed projects, Kentucky (aided by a state historic tax credit) and Louisiana (benefi ting from both an enhanced Federal historic tax credit of 26% due to Federal disaster relief and state historic tax incentives) had major increases of 16% and 41% respectively.
Approvals of Proposed Rehabilitation Work
In the Mountain Plains region the number of approved proposed projects was essentually the same as the previous year. However, a signifi cant decline in the number of approved projects in Missouri masked the increases which otherwise occurred in the large majority of the states. Leading the way in the Mountain Plains region were major increases in approved proposed projects in Michigan (61%) and in Illinois (111%). Other states with signifi cant increases in the number of projects included Minnesota and Iowa.
FY88 FY89 FY90 FY91 FY92NESEMPFW
TO TAL
NESEMPFW
TO TAL
FY93 FY94 FY95
FY96 FY97 FY98
56127120456
1,092
43032120142
994
33329514640
814
27021416034
678
30722415533
719
217
137
538
195178149
38560
22020415047
621
28320820429
724
348219293
42902
406384204
421,036
REGION
REGION
39
145
FY99404315211 43
973
FY01467319217
621,065
FY00542408264
1,276
FY02493399
52258
1,202
NESEMPFW
REGION
TO TAL
62
FY03642320272
1,27036
FY04558286319
371,200
FY0546721737938
1,101
FY0654328934180
1,253
FY0745425230138
1,045
FY0857425137135
1,231
FY09463251279
511,044
FY10
Table 4: Approved Proposals (Part 2s) by Geographic Regions: FY 1988-2011
470230219
32
FY11440
219
937951
244
34
Statistical Report and Analysis for Fiscal Year
2011
Federal Tax Incentives for Rehabilitating Historic Buildings 9
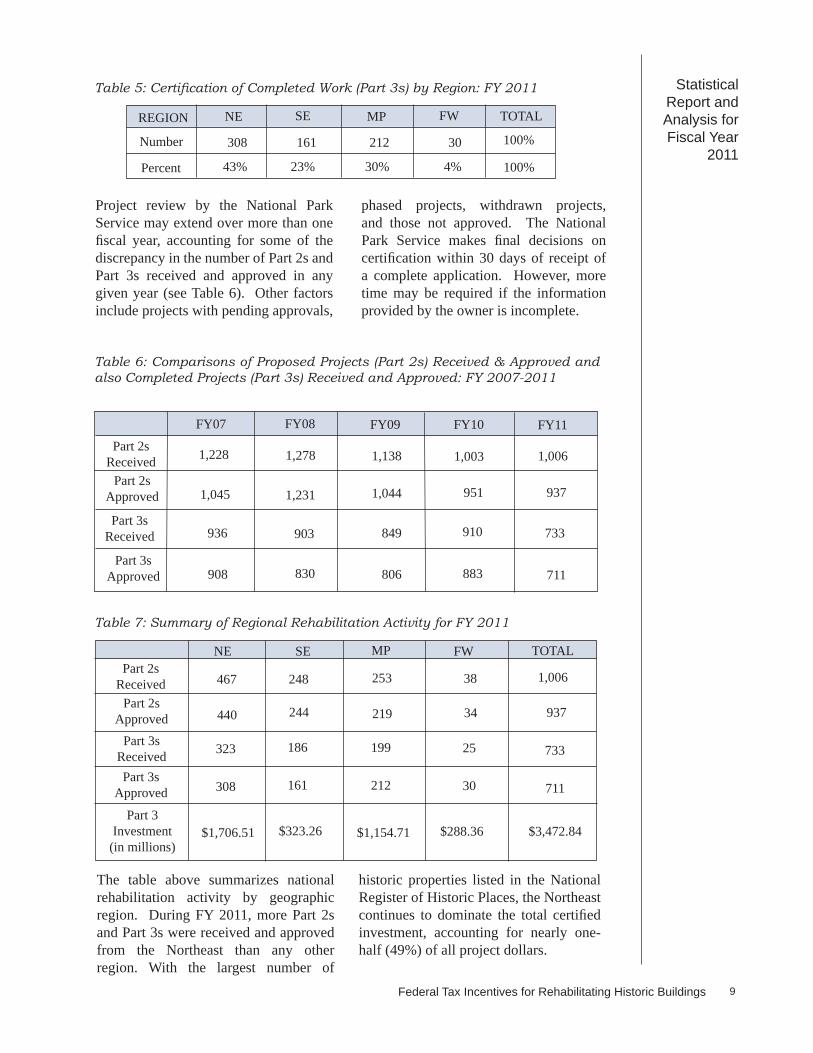
Project review by the National Park Service may extend over more than one fi scal year, accounting for some of the discrepancy in the number of Part 2s and Part 3s received and approved in any given year (see Table 6). Other factors include projects with pending approvals,
phased projects, withdrawn projects, and those not approved. The National Park Service makes fi nal decisions on certifi cation within 30 days of receipt of a complete application. However, more time may be required if the information provided by the owner is incomplete.
The table above summarizes national rehabilitation activity by geographic region. During FY 2011, more Part 2s and Part 3s were received and approved from the Northeast than any other region. With the largest number of
historic properties listed in the National Register of Historic Places, the Northeast continues to dominate the total certifi ed investment, accounting for nearly one-half (49%) of all project dollars.
Part 2sReceived
Part 2sAp proved
Part 3sReceived
Part 3sAp proved
Table 5: Cer ti fi ca tion of Com plet ed Work (Part 3s) by Re gion: FY 2011
Table 7: Summary of Regional Rehabilitation Activity for FY 2011
NE SE MP FWPart 2s
ReceivedPart 2s
ApprovedPart 3s
ReceivedPart 3s
Approved
Part 3In vest ment
(in millions)
TO TAL
FY07
1,228
1,045
936
908
FY08
TO TALREGION
Number
Percent
NE SE MP FW
100%
100%
1,278
1,231
903
830
FY09
1,138
1,044
849
806
Table 6: Comparisons of Proposed Projects (Part 2s) Re ceived & Approved and also Completed Projects (Part 3s) Received and Approved: FY 2007-2011
FY10
1,003
951
910
883
308 161 212 30
43% 23% 30% 4%
FY11
1,006
937
733
711
308
467
323
440
161
248
186
244
212
253
199
219
30
38
25
34
1,006
937
733
711
$1,706.51 $323.26 $288.36 $3,472.84$1,154.71
Statistical Report and Analysis for Fiscal Year 2011
Federal Tax Incentives for Rehabilitating Historic Buildings10
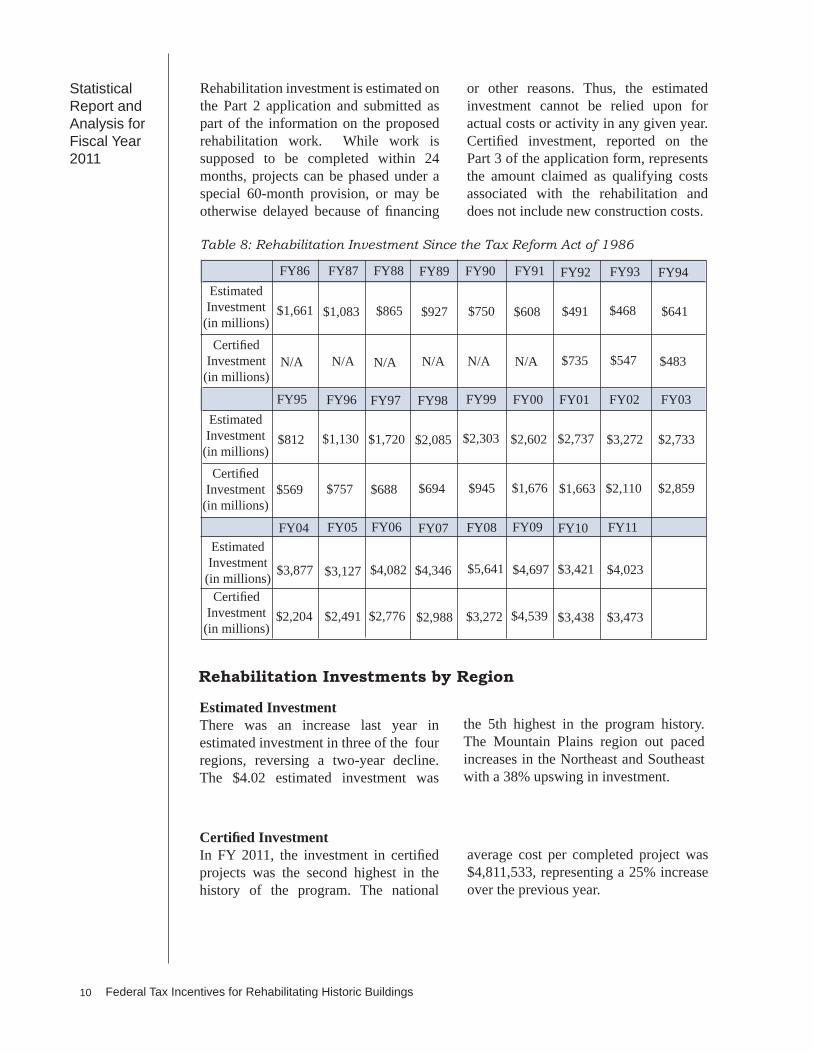
Rehabilitation investment is estimated on the Part 2 application and submitted as part of the information on the proposed rehabilitation work. While work is supposed to be completed within 24 months, projects can be phased under a special 60-month provision, or may be otherwise delayed because of fi nancing
or other reasons. Thus, the estimated investment cannot be relied upon for actual costs or activity in any given year. Certifi ed investment, reported on the Part 3 of the application form, represents the amount claimed as qualifying costs associated with the rehabilitation and does not include new construction costs.
Certifi ed InvestmentIn FY 2011, the investment in certifi ed projects was the second highest in the history of the program. The na tion al
av er age cost per completed project was $4,811,533, representing a 25% increase over the previous year.
Estimated InvestmentThere was an increase last year in estimated investment in three of the four regions, reversing a two-year decline. The $4.02 estimated investment was
the 5th highest in the program history. The Mountain Plains region out paced increases in the Northeast and Southeast with a 38% upswing in investment.
Table 8: Rehabilitation Investment Since the Tax Re form Act of 1986
$641
$483
FY86 FY87 FY88 FY89 FY90 FY91
FY95 FY96 FY97 FY98
FY94EstimatedInvestment
(in millions)
Certifi edInvestment
(in mil lions)
Certifi edInvestment
(in mil lions)
EstimatedInvestment
(in millions)
$1,661 $1,083 $865 $927 $750 $491$608
N/A N/A N/A N/A N/A $735N/A
$812 $1,130 $1,720 $2,085
$569 $757 $688 $694
FY99
$2,303
$945
FY92
$468
FY00
$2,602
$1,676
$547
FY01
$2,737
$1,663
FY02
$2,110
$3,272
FY93
FY03
$2,859
$2,733
EstimatedInvestment
(in millions)Certifi ed
Investment(in mil lions)
FY04
$3,877
$2,204
FY05
$3,127
$2,491
FY06
$4,082
$2,776
FY07
$2,988
$4,346
FY08
$5,641
$3,272
Rehabilitation Investments by Region
FY09
$4,697
$4,539
FY10
$3,421
$3,438
FY11
$4,023
$3,473

Statistical Report and Analysis for Fiscal Year
2011
Federal Tax Incentives for Rehabilitating Historic Buildings 11
Table 9: Estimated Investment by Region (in millions) FY 1988-2011
FY92
491
FY88 FY90 FY91
NE
SE
MP
FW
TOTAL
NE
SEMP
FW
TO TAL
550
74
20735
866
476
218
143
90
927
357
135
184
74
750
422
41
82
65
610
FY94 FY95 FY96 FY97 FY98
144
84
111152
178
18
129
81
406
353
152
9442
641
427
122
233
30812
444
240
287
159
1,130
849
245
521
113
1,728
124
356
355
1,249
2,085
FY99
990
355
709
248
2,303
FY93
FY00
1,571
195666
170
2,602
FY01
1,248
520632
337
2,737
FY02
1,401
467
1,146
258
3,272
FY03
1,264
408793
268
2,733
FY04
1,718
3761,090
693
3,877
FY05
1,331
4531,252
91
3,127
FY89
FY06
2,046
4271,204
405
4,082
FY07
2,037
5411,353
414
4,345
FY08
2,844
944
1,386
467
5,641
FY09
2,494
7091,164
330
4,697
FY10
2,074
400
705
242
3,421
FY11
2,305
4291,142
147
4,023
Since 1976 the Federal Historic Preservation Tax Incentives have spurred the rehabilitation of his-toric buildings all across the country. The regional breakout of rehabilitation investment for FY 2011 had the Northeast with the largest share and the Far West the smallest. The Mountain Plains con-tinue to outpace the Southeast.
Regional project activity continues long-term trend
Clockwise from top left: Hennessey Funeral Home, Portland, OR; Walker Bank Building, Salt Lake City, UT; Daylight Building, Knoxville, TN; and Cheney Mill Yarn Dye House, Manchester, CT.
photo: Dana Sohm
photo: Daylight Partners, LLC
photo: Christi Wuthrich
photo: Crosskey Architects, LLC

Statistical Report and Analysis for Fiscal Year 2011
Federal Tax Incentives for Rehabilitating Historic Buildings12
FY92FY88 FY90 FY91
NE
SE
MP
FW
TOTAL
NESE
MP
FW
TO TAL
FY94 FY95 FY96 FY97 FY98 FY99FY93
FY00 FY01 FY02 FY03 FY04 FY05
FY89
FY06 FY07
Table 10: Estimated Regional Investment as a Percentage of Total Rehabilitation Expenditures: FY 1988-2011*
100%
*Totals may not add up to 100% due to round ing.
64% 51% 48% 69% 29%
8% 24% 18% 7% 17%
24% 15% 25% 14% 22%
4% 10% 10% 11% 31%
100% 100% 100% 100% 100% 100% 100% 100% 100% 100%
100%
38%
17%
28%
17%
55%
24%15%
7%
52%
15%
29%
4%
39%
21%
25%
14%
42%
16%
34%
7%
60%
17%
17%
5%
43%15%
31%
11%
100%
60%7%
26%7%
100%
46%19%
23%12%
100%
43%14%
35%8%
100%
46%15%
29%10%
100%
44%
10%
28%
18%
100%
42%
15%
40%
3%
100%
50%
11%
29%
10%
47%13%
31%
9%
100%
FY08
50%
17%
25%
8%
100%
FY09
25%
15%
7%
53%
100%
FY10
60%
12%
21%
7%
100%
FY11
4%
57%
11%
28%
100%
Proposed projects up in most of Mountain Plains statesChemistry Research Building Chicago, Illinois
Rehabilitation projects in Illinois were up 111% from last year, the largest increase in the Midwest.
Last fi scal year (2011), Illinois ranked number one in the nation in terms of rehabilitation expendi-tures in completed projects with a total investment of over $365 million, representing over 10% of the nationwide total of $3,472 billion.
Formerly the Illinois Institute of Technology’s Chemistry Research Building, this 1959 era building was purchased by a private company for redevelopment. Using the Federal historic tax credits, it became the new home for a wet-and-dry-lab-capable research and development facility. Work to accommodate future tenants included installation of a new atrium, exterior wall and window reno-vations, and new mechanical, electrical and plumbing services. The creation of an atrium provides a more modern, open interior and natural light that meets modern tenants’ expectations as well as allowed the primary facades to be preserved.
Above: before; Right: after. photos: Illinois Historic Preservation Agency

Statistical Report and Analysis for Fiscal Year
2011
Federal Tax Incentives for Rehabilitating Historic Buildings 13
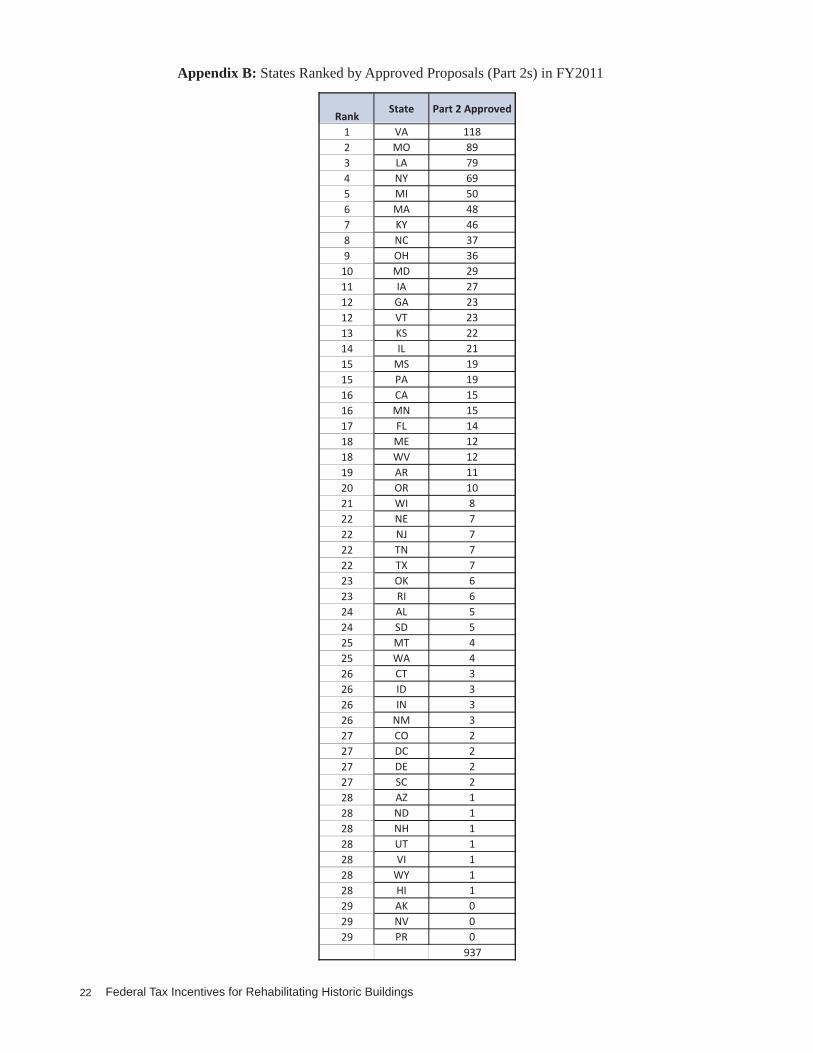
Comparisons of state-by-state activity may be made by referring to the lists in the Ap pen di ces. Project activity oc curred in 49 states, Wash ing ton, DC, and the Virgin Islands, with only Nevada and Puerto Rico re port ing no re ha bil i ta tion projects in FY 2011.
Ap pen dix B shows state rank ing by ap proved proposed projects (Part 2s). In FY 2011, Virginia claimed the top spot for the most ap proved projects. The four states with the most re ha bil i ta tion ac tiv i ty were Virginia (118), Missouri (89), Louisiana (79), and New York (69). Six of the ten states with the most proposed pres er va tion ac tiv i ty are in the North east re gion (VA, MI, MA, NY, OH, and MD); three are in the South east re gion (LA, KY, and NC); and one in the Mountain Plains (MO).
Twenty-four states had more pro pos ed projects ap proved in FY 2011 than in FY 2010. These states included Arkansas, California, Delaware, Florida, Georgia, Iowa, Idaho, Illinois, Kentucky, Louisiana, Maryland, Massachusetts, Michigan, Minnesota, Montana, North Dakota, Nebraska, New Hampshire, New Jersey, New Mexico, Oregon, South Dakota, Vermont, and West Virginia, and also the Virgin Islands. When states were ranked by the number of completed projects cer ti fi ed (Part 3s) in FY 2011, Missouri claimed the number one spot. Ap pen dix C ranks the states in de scend ing order by the num ber of cer ti fi ed projects. For certifi ed projects (Part 3s), states ranking by investment dollars in FY 2011 (Appendix D), fi nds Illinois on top with $365 mil lion.
Activity Investment on a State-by-State Basis
The regional share of rehabilitation investment in certifi ed projects, indicative of the fi nal cost of the re ha bil i ta tion work, is shown in Table 11. The North east continues to dom i nate the coun try with 49% of the na tion’s total investment
in certifi ed projects refl ecting, in part, the large number of historic buildings in the region potentially eligible for historic preservation tax incentives. The Mountain Plains increased to 8.5% while the Southeast dropped to 4.5%.
Table 11: Certifi ed Rehabilitation Investment by Region (in millions): FY 2007-2011
NE
SE
MP
FW
TOTAL
FY07
$1,411 (46%)
$434 (14%)
$951 (32%)
$242 (8%)
$2,988 (100%)
FY08
$1,631 (50%)
$287 (9%)
$1,099 (33%)
$255 (8%)
$3,272 (100%)
FY09
$2,157 (48%)
$1,032 (22%)
$896 (20%)
$452 (10%)
$4,539 (100%)
FY10
$1,799 (53%)
$492 (14%)
$860 (25%)
$285 (8%)
$3,438 (100%)
FY11
$1,706 (49%)
$323 (9.5%)
$1,154 (33.5%)
$288 (8%)
$3,473 (100%)
I think this program is a government incentive that actually works. It preserves historic build-ings while making such preservation economically viable. ITC applicant from Oklahoma City
“ ”
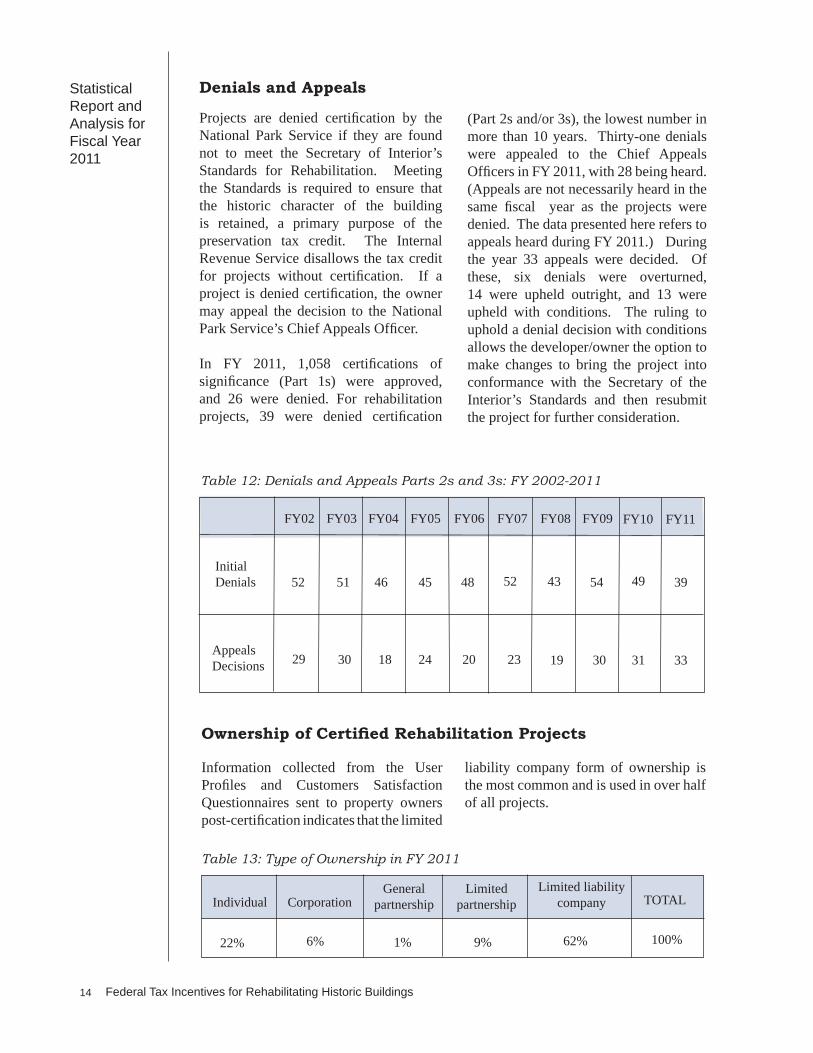
Information collected from the User Pro fi les and Customers Sat is fac tion Ques tion naires sent to prop er ty owners post-certifi cation indicates that the limited
liability company form of ownership is the most common and is used in over half of all projects.
Ownership of Certifi ed Rehabilitation Projects
Limited liability companyIndividual Corporation
General partnership
Limited partnership TOTAL
100%
Table 13: Type of Ownership in FY 2011
Statistical Report and Analysis for Fiscal Year 2011
Federal Tax Incentives for Rehabilitating Historic Buildings14
Projects are denied certifi cation by the National Park Service if they are found not to meet the Sec re tary of Interior’s Stan dards for Rehabilitation. Meeting the Stan dards is required to ensure that the his tor ic char ac ter of the build ing is re tained, a pri ma ry pur pose of the pres er va tion tax credit. The Internal Revenue Service dis al lows the tax credit for projects with out cer ti fi ca tion. If a project is denied cer ti fi ca tion, the owner may appeal the de ci sion to the National Park Service’s Chief Ap peals Offi cer.
In FY 2011, 1,058 cer ti fi ca tions of sig nifi cance (Part 1s) were ap proved, and 26 were de nied. For rehabilitation projects, 39 were denied certifi cation
Denials and Appeals
(Part 2s and/or 3s), the lowest number in more than 10 years. Thirty-one denials were ap pealed to the Chief Ap peals Of fi c ers in FY 2011, with 28 being heard. (Appeals are not nec es sar i ly heard in the same fi scal year as the projects were de nied. The data presented here refers to ap peals heard during FY 2011.) Dur ing the year 33 appeals were de cid ed. Of these, six denials were overturned, 14 were upheld outright, and 13 were upheld with conditions. The ruling to uphold a denial decision with conditions allows the developer/owner the option to make changes to bring the project into conformance with the Secretary of the Interior’s Standards and then re sub mit the project for further consideration.
Table 12: Denials and Appeals Parts 2s and 3s: FY 2002-2011
Appeals Decisions
Initial Denials
FY02 FY03 FY04 FY05 FY06 FY07 FY08 FY09
52 51 46 45 48 52 43 54
29 30 18 24 20 23 19 30
FY10
49
31
FY11
39
33
62%9%1%6%22%

Statistical Report and Analysis for Fiscal Year
2011
Federal Tax Incentives for Rehabilitating Historic Buildings 15
Table 14 shows the breakout of projects by the amount of rehabilitation investment de vel oped un der each type of own er ship. The larg est groups in vest ing in tax in cen tive projects in FY 2011 were limited liability companies with 62% of all projects, individuals with 22%, and limited partnerships with 9%. A wide distribution of project valuation
was posted in FY 2011 with the $20,000 - $99,999 range accounting for 6.5%; the $100,000 - $249,000 range comprising 14%; and $250,000 - $499,999 range accounting for 18%; the $500,000 -$999,999 range accounting for 11.5%, and projects costing more than $1,000,000 making up over 49% of the total projects rehabilitated within the program.
Ownership and Size of Completed Projects
Table 14: Size of Projects By Own er ship Type as a Percentage of Reported Projects from Customer Questionnaire in FY 2011
Owner
Individual
Corporation
General partnershipLimited
partnership
Limited liability co.
TOTAL
<$20,000$20,000-$99,999
$100,000- $249,999
$250,000-$499,999
$500,000-$999,999 TOTAL>$1,000,000
Bringing vacant properties back to lifeBaron & Company Cigar Building Baltimore, MarylandAn invaluable fi nancial tool for historic building rehabilitation, the Federal tax incentives help pre-serve historic structures of every period, size, style, and type. Abandoned or unoccupied schools, warehouses, factories, churches, retail stores, apartments, hotels, houses, and offi ces throughout the country have been given new life in a manner that maintains their historic character.
The Baron & Company Cigar Building, Baltimore, Maryland, is an industrial-style building con-structed in 1880. The local cigar company occupied the building until 1910 when a clothing manu-facturer, the American Coat Pad Company, moved in. Several decades later the apparel company
relocated and the building became vacant. In 2008 O’Connell & Associates purchased the building and began a rehabilitation proj-ect using Federal historic tax credits. Project work included saving and restoring existing doors, replicating metal windows where the originals had deteriorated too badly to be salvaged, and keeping the original metal shutters. The interior spaces were largely compatible for light manufacturing, and were kept intact. The $1,2 million proj-ect was completed in 2011 and became the new home of Premiere Rides, designers and suppliers of amusement park rides.photo: National Park Service
0%
0% 0%
4.5% 7%
1% 0%
3% 3%
0% 0%
0% 0%
0% 0%
2% 0%
0%
0% 4%
0% 9%
1% 2%
1% 6.5%
6.5% 11%
14% 18%
8.5% 33%
11.5% 49%
4.5%
0%
22%
6%
1%
9%
62%
100%

Statistical Report and Analysis for Fiscal Year 2011
Federal Tax Incentives for Rehabilitating Historic Buildings16
Table 15: Comparison of Percentage of All Certifi ed Projects in Each Size Category: FY 2007-2011
<$20,000 $20,000-$99,999
$100,000-$249,999
$250,000-$499,999
$500,000-$999,999 >$1,000,000 TOTAL
100%
100%
100%
100%
FY07 1% 7.5% 12% 18% 17.5% 44% 100%
FY08 0% 5% 15% 17% 10% 53%
The following table (Table 16) shows the fi nal primary use of projects certifi ed over the past fi ve fi scal years as drawn from
Primary Uses of Rehabilitated Properties
FY09 0% 8% 12.5% 9.5% 15% 55%
customer questionnaires. Of projects re port ing hous ing as a fi nal primary use, 69% were for multiple-fam i ly hous ing.
Table 16: Uses of Certifi ed Rehabilitation Projects: FY 2007-2011
Housing
Offi ce
Com mer cial
Other
FY07
45%
21%
27%
7%
FY08
40%
23%
34%
3%
FY09
36%
25%
31%
8%
Table 17: Percentage of Projects Listing Uses After Re ha bil i ta tion by Re gion in FY 2011
Housing Offi ce Com mer cial Other Total
NE
SE
MP
FW 100%
100%
100%
100%
FY10
FY10
43%
23%
24%
10%
0.5% 5% 30% 14% 12.5% 38%
FY11
FY11
69%
16%
3%
12%
0.5% 8% 13% 19% 15.5% 44%
37%
49%
54%
26%
29%
15%
13%
21%
25%
21%
18%
19%
9%
15%
15%
34%

Statistical Report and Analysis for Fiscal Year
2011
Federal Tax Incentives for Rehabilitating Historic Buildings 17
The Historic Preservation Tax Incentives program has been an in valu able tool in both the re vi tal iza tion of historic communities and neigh bor hoods and in the in creased public aware ness of the im por tance of pre serv ing tan gi ble links to the nation’s past. In many cases, the re ha bil i ta tion of one key building has resulted in the rehabilitation of ad ja cent build ings. Hous ing has been the sin gle most im por tant use for re ha bil i tat ed
Housing and Preservation
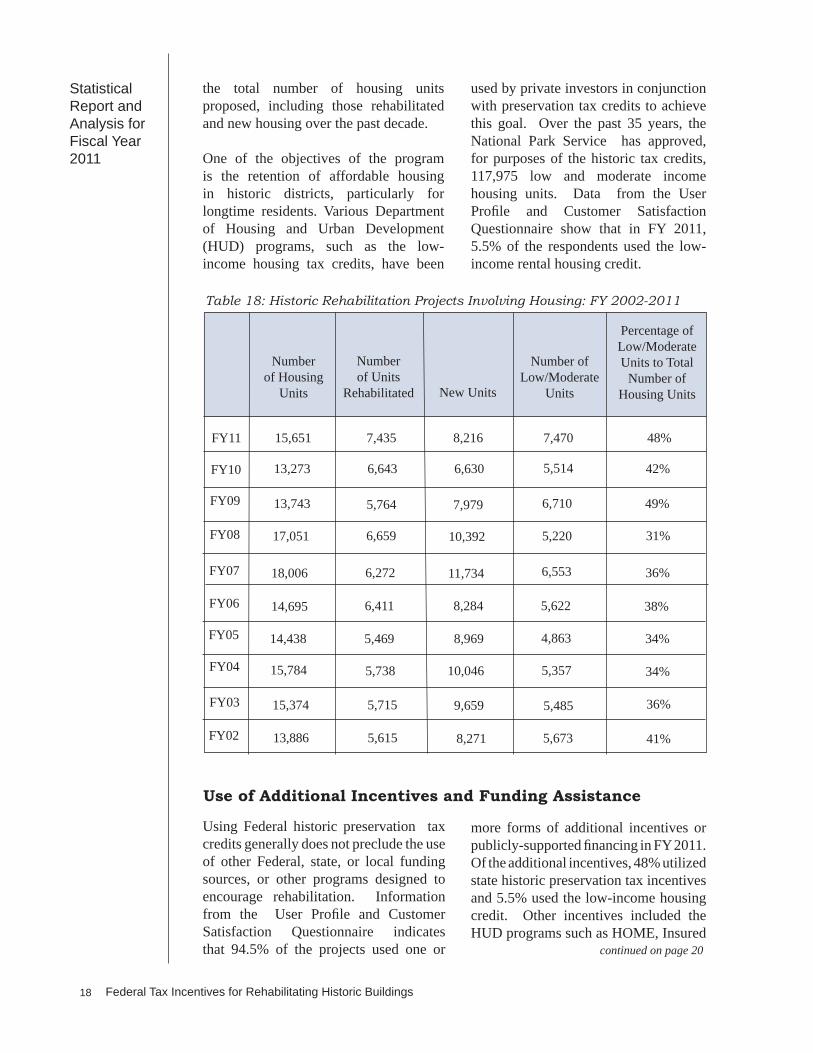
his tor ic build ings under the His tor ic Pres er va tion Tax In cen tives pro gram. Over the past fi ve years, between 36% and 69% of the projects have in clud ed hous ing. Since the program be gan, the National Park Service has approved the rehabilitation of 224,051 hous ing units and creation of 209,913 new units. In FY 2011, 15,651 housing units were approved, including 7,435 hous ing units re ha bil i tat ed and 8,216 new units. Table 18 shows
Record number of new affordable housing units Beattyville School ApartmentsBeattyville, KentuckyBesides preserving historic buildings and promoting community revitalization, the Federal Preser-vation Tax Incentives program has led to the creation of 117,975 low and moderate income housing units. Over the years, the number of affordable housing units has continued to rise. In 1993, only 19% of the total 8,236 housing units in that year aided by the historic tax credits were specifi cally targeted for affordable housing. In FY2011, a record number of 7,470 low and moderate income housing units representing 48% of the total 15,651 housing units were in approved historic tax credit projects.
Historic school buildings in older communities often have outserved their intended use yet, remain important to a community’s sense of time and place. Historic tax credits have proven to be an important incentive to returning vacant and underutilized school buildings back into productive new use, often as affordable housing.
The Beattyville School in Beattyville, Kentucky, was built in 1926 and for 40 years served the small town as a learning center for children in grades 1-12. In 1940, it also became home to the fi rst educational ra-dio station in the country, WBKY, owned and operated by the University of Kentucky. By the early 1970s, the school had closed and the build-ing had been converted into the local board of education administrative and maintenance facility.
In 2008, the school property was purchased by AU Associates of Lexington, Kentucky, and soon the building was being converted to provide 18 affordable housing units in the community. Having a proven track record of historic school rehabilitations, AU Associates considered the historic interior of the school to be an attractive and desirable feature to help foster a distinc-tive place for people to live. They preserved the wide hallways along with the glazed door transoms and sidelights, converted class-rooms to apartments, and retained the audito-rium for resident use and community activities.
The $2.5 million rehabilitation of Beattyville School is one of eight historic school buildings across Kentucky which AU Associates has de-
veloped in the past 10 years for affordable housing utilizing the historic tax credits, including proj-ects in Glasgow, Buffalo, Winchester, Irvine, Louisville, and Covington, Kentucky.
photos: Holly B. Wiedemann, AU Associates
Statistical Report and Analysis for Fiscal Year 2011
Federal Tax Incentives for Rehabilitating Historic Buildings18
Use of Additional Incentives and Funding Assistance
the to tal num ber of hous ing units proposed, in clud ing those re ha bil i tat ed and new hous ing over the past decade.
One of the objectives of the program is the retention of af ford able hous ing in his tor ic dis tricts, par tic u lar ly for longtime res i dents. Var i ous De part ment of Hous ing and Urban De vel op ment (HUD) pro grams, such as the low-income hous ing tax cred its, have been
Table 18: Historic Rehabilitation Projects Involving Housing: FY 2002-2011
used by private in ves tors in con junc tion with pres er va tion tax cred its to achieve this goal. Over the past 35 years, the National Park Service has approved, for purposes of the historic tax credits, 117,975 low and mod er ate in come hous ing units. Data from the User Profi le and Customer Satisfaction Ques tion naire show that in FY 2011, 5.5% of the re spon dents used the low-income rent al hous ing cred it.
Number of Housing
Units
Number of Units
Rehabilitated New Units
Number of Low/Moderate
Units
Percentage of Low/Moderate Units to Total
Number of Housing Units
FY02 13,886 5,615 8,271 5,673 41%
FY03 15,374 5,715 9,659 5,485 36%
FY04 15,784 5,738 10,046 5,357 34%
FY05 14,438 5,469 8,969 4,863 34%
FY06 14,695 6,411 8,284 5,622 38%
FY07 18,006 6,272 11,734 6,553 36%
FY08 17,051 6,659 10,392 5,220 31%
FY09 13,743 5,764 7,979 6,710 49%
more forms of ad di tion al in cen tives or publicly-sup port ed fi nanc ing in FY 2011. Of the ad di tion al in cen tives, 48% utilized state historic preservation tax incentives and 5.5% used the low-income hous ing cred it. Oth er incentives included the HUD pro grams such as HOME, Insured
Using Federal historic preservation tax credits generally does not pre clude the use of oth er Federal, state, or local fund ing sourc es, or other pro grams de signed to en cour age re ha bil i ta tion. In for ma tion from the User Pro fi le and Customer Sat is fac tion Ques tion naire in di cates that 94.5% of the projects used one or continued on page 20
FY10 13,273 6,643 6,630 5,514 42%
FY11 15,651 7,435 8,216 7,470 48%

Statistical Report and Analysis for Fiscal Year
2011
Federal Tax Incentives for Rehabilitating Historic Buildings 19
The Federal Historic Tax Incentives promote not only the preservation and rehabilitation of historic buildings, but also the revitalization of older communities. Columbus, Ohio, is well known for its historic neighborhood districts and a downtown commercial center with a large concentration of historic buildings. With a population of 800,000, the city has more than 20 historic districts.
Community Properties of Ohio, a subsidiary of the nonprofi t Ohio Capital Corporation for Housing, recently completed a multi-year citywide rehabilitation of 71 historic buildings in seven urban historic neighborhoods, utilizing the historic tax credits. Their overall effort cen-tered on the acquisition and subsequent rehabilitation of 209 buildings of Section 8 housing, the majority of which were located in neighborhoods suffering from disinvestment and criminal activity. One neighborhood with a signifi cant concentration of these properties is adjacent to the Ohio State University, which served as a critical partner in this reinvestment effort.
The portfolio within these seven communities con-sisted of vacant buildings and dilapidated housing, with units in extremely poor physical condition. The revitalization and preservation of the existing Sec-tion 8 housing was considered key to helping sta-bilize and stimulate community renewal. All historic buildings were certifi ed as completed rehabilitations by the National Park Service.
The renovation work included groups of historic buildings and other scattered site properties, with varying architecture and building materials. Missing porches were replaced and exterior repairs made, which along with new landscaping, blended into and
contributed to the stability of the respective city neighborhoods. At the same time the interiors of the affordable housing units were modernized, adding amenities that were previously nonexis-tent such as showers and air conditioning. Residents who had been temporarily relocated while the work took place were provided the opportunity to return to the newly renovated buildings.
The award-winning work of Community Properties of Ohio (CPO) did not end following the investment of more than $100 million in the project. As the quality of housing improved, CPO established a 501(c)3 non-profi t foundation, CPO Impact, and began to focus on building resi-dent relationships with community partnerships to address resident needs, stabilize housing, increase neighborhood safety, and identify ways to help residents move beyond poverty.
CPO Impact has partnered with local law enforcement to launch a public safety program, help send kids to summer camp, implemented an at-risk resident program, added se-nior/disabled supportive services, as well as many other programs which support their resident and community ob-jectives
Setting a new standard for economic revitalization Columbus, Ohio
photo: Community Properties of Ohio
photo: Judy Williams
photo: Community Properties of Ohio

Statistical Report and Analysis for Fiscal Year 2011
Federal Tax Incentives for Rehabilitating Historic Buildings20
*Many projects used more than one type of pro gram. This is refl ected in the percent-age rates above. This data is taken from the questionnaire voluntarily returned by property owners.
Table 19: Other Incentives Used In Addition to Preservation Tax Cred its in FY 2011*
None
Low-income Rental Housing Credits
Local Property Tax/Ad Valorum Tax Abatement
Historic Preservation Easement
Facade Grant Program
State Historic Preservation Tax Incentives
HUD Program
Low Interest Loan
Other
Local Historic Preservation Tax Credits
Many states offer state tax incentives of various kinds for pres er va tion re ha bil i ta tion projects. Over 48% of the projects receiving Part 3 certifi cation also used state historic tax credits in FY 2011. At least 30 states of fer state in come tax credits, including: Arkansas, Col o rado, Con nect i cut, Del a ware, Georgia, In di ana, Iowa, Kansas, Kentucky, Louisiana, Maine, Mary land, Mas sa chu setts, Mich i gan, Minnesota, Mississippi, Mis sou ri, Mon tana, New Mex i co, New York, North Caro li na, North Dakota, Ohio, Oklahoma, South Carolina, Utah, Ver mont, Vir gin ia, West Vir gin ia, and
Wis con sin. Property tax relief is avail able for qual i fi ed projects through statewide programs in Alabama, Arizona, Geor gia, Il li nois, Indiana, Nebraska, Michigan, Oregon, and South Da ko ta. Half of the states offer prop er ty tax re lief as a lo cal option. These states in clude: Alas ka, Cal i for nia, Delaware, Florida, Hawaii, Iowa, Kan sas, Ken tucky, Lou i si ana, Maine, Mary land, Mas sa chu setts, Min ne so ta, Mis sis sip pi, Missouri, Mon tana, New Hampshire, New Jer sey, New York, North Caro li na, North Dakota, South Caro li na, Tex as, Virginia, and Wash ing ton.
State Historic Preservation Tax Incentives
Loan Programs and the Community Development Block Grant (CDBG); New Market Tax Credit Program (NMTC); Tax Increment Financing (TIF); Brownfi elds Economic Development Initiative Grant; and USDA Rural Development
Loan Programs. Local prop er ty tax/ad valorum tax abate ment was used by 15% of the re spon dents, and low in ter est loans through their cities were obtained by 3%.
5.5%
15%
1%
4%
48%
6.5%
3%
0%
11.5%
5.5%

Federal Tax Incentives for Rehabilitating Historic Buildings 21
State Part 1 R* Part 2 R* Part 3 R* Part 1 A** Part 2 A** Part 3 A** Certified ExpenseAverage Expense
AK 0 0 0 0 0 0 $0.00 $0.00 AL 13 5 5 8 5 4 $5,635,214.00 $1,408,803.50 AR 16 10 10 16 11 9 $13,114,147.00 $1,457,127.44 AZ 14 2 0 10 1 1 $5,600,000.00 $5,600,000.00 CA 18 19 14 16 15 15 $213,143,571.00 $14,209,571.40 CO 3 6 4 1 2 3 $1,103,897.00 $367,965.67 CT 19 5 4 19 3 5 $92,561,630.00 $18,512,326.00 DC 6 2 4 4 2 4 $33,863,224.00 $8,465,806.00 DE 2 2 12 1 2 12 $37,666,321.00 $3,138,860.08 FL 23 19 7 21 14 6 $5,589,882.00 $931,647.00 GA 27 29 17 27 23 16 $33,521,098.00 $2,095,068.63 HI 0 0 0 0 1 0 $0.00 $0.00 IA 30 29 25 30 27 27 $161,924,069.00 $5,997,187.74 ID 0 2 1 0 3 3 $6,377,610.00 $2,125,870.00 IL 22 26 10 26 21 13 $365,424,124.00 $28,109,548.00 IN 7 5 8 6 3 8 $7,305,134.00 $913,141.75 KS 33 29 20 29 22 17 $34,512,157.00 $2,030,126.88 KY 47 44 32 45 46 28 $19,637,125.00 $701,325.89 LA 100 76 41 89 79 29 $85,769,605.00 $2,957,572.59 MA 53 51 25 47 48 20 $104,222,495.00 $5,211,124.75 MD 42 33 20 40 29 20 $71,081,795.00 $3,554,089.75 ME 12 13 6 12 12 6 $28,459,790.00 $4,743,298.33 MI 51 52 27 44 50 22 $151,025,883.00 $6,864,812.86 MN 21 16 2 19 15 2 $32,077,684.00 $16,038,842.00 MO 86 94 93 79 89 99 $330,838,654.00 $3,341,804.59 MS 36 19 21 31 19 23 $41,820,328.00 $1,818,275.13 MT 5 2 2 5 4 2 $8,041,612.00 $4,020,806.00 NC 53 39 42 55 37 38 $89,712,744.00 $2,360,861.68 ND 1 2 0 1 1 0 $0.00 $0.00 NE 8 8 3 8 7 7 $55,418,927.00 $7,916,989.57 NH 0 1 0 0 1 0 $0.00 $0.00 NJ 10 8 4 7 7 5 $31,750,125.00 $6,350,025.00
NM 0 2 3 0 3 3 $21,120,431.00 $7,040,143.67 NV 0 0 0 0 0 0 $0.00 $0.00 NY 58 73 17 60 69 15 $298,071,761.00 $19,871,450.73 OH 39 35 29 39 36 30 $266,166,006.00 $8,872,200.20 OK 11 7 5 9 6 6 $45,214,906.00 $7,535,817.67 OR 7 10 6 6 10 7 $48,211,580.00 $6,887,368.57 PA 41 26 38 38 19 35 $305,466,790.00 $8,727,622.57 PR 0 0 0 0 0 0 $0.00 $0.00 RI 6 7 17 5 6 16 $110,540,998.00 $6,908,812.38 SC 3 2 6 2 2 5 $12,536,733.00 $2,507,346.60 SD 7 7 6 5 5 5 $8,772,396.00 $1,754,479.20 TN 10 5 4 7 7 3 $15,925,000.00 $5,308,333.33 TX 10 8 2 8 7 4 $21,124,993.04 $5,281,248.26 UT 2 3 5 2 1 6 $19,844,215.00 $3,307,369.17 VA 135 124 97 129 118 97 $161,423,815.00 $1,664,163.04 VI 0 0 1 0 1 0 $0.00 $0.00 VT 25 23 7 25 23 7 $4,347,804.00 $621,114.86 WA 5 5 4 5 4 4 $15,028,199.00 $3,757,049.75 WI 14 13 18 13 8 17 $49,247,758.00 $2,896,926.94 WV 8 7 8 8 12 6 $2,558,458.00 $426,409.67 WY 1 1 1 1 1 1 $39,990.00 $39,990.00
1140 1006 733 1058 937 711 $3,472,840,678.04
Appendix A: Alphabetical List of State Activity in FY 2011
* Received ** Approved
Federal Tax Incentives for Rehabilitating Historic Buildings22
Appendix B: States Ranked by Approved Proposals (Part 2s) in FY2011
RankState Part 2 Approved
1 VA 1182 MO 893 LA 794 NY 695 MI 506 MA 487 KY 468 NC 379 OH 36
10 MD 2911 IA 2712 GA 2312 VT 2313 KS 2214 IL 2115 MS 1915 PA 1916 CA 1516 MN 1517 FL 1418 ME 1218 WV 1219 AR 1120 OR 1021 WI 822 NE 722 NJ 722 TN 722 TX 723 OK 623 RI 624 AL 524 SD 525 MT 425 WA 426 CT 326 ID 326 IN 326 NM 327 CO 227 DC 227 DE 227 SC 228 AZ 128 ND 128 NH 128 UT 128 VI 128 WY 128 HI 129 AK 029 NV 029 PR 0
937

Federal Tax Incentives for Rehabilitating Historic Buildings 23
Appendix C: States Ranked by Certifi ed Projects (Part 3s) in FY2011
RankState
Part 3 Approvals
1 MO 992 VA 973 NC 384 PA 355 OH 306 LA 297 KY 288 IA 279 MS 23
10 MI 2211 MA 2011 MD 2012 KS 1712 WI 1713 GA 1613 RI 1614 CA 1514 NY 1515 IL 1316 DE 1217 AR 918 IN 819 NE 719 OR 719 VT 720 FL 620 ME 620 OK 620 UT 620 WV 621 CT 521 NJ 521 SC 521 SD 522 AL 422 DC 422 TX 422 WA 423 CO 323 ID 323 NM 323 TN 324 MN 224 MT 225 AZ 125 WY 126 AK 026 HI 026 ND 026 NH 026 NV 026 PR 026 VI 0
711

Federal Tax Incentives for Rehabilitating Historic Buildings24
Appendix D: States Ranked by Certifi ed Expenses in FY2011
RankState
Part 3 Approval
Certified Expense
1 IL 13 $365,424,124.00 2 MO 99 $330,838,654.00 3 PA 35 $305,466,790.00 4 NY 15 $298,071,761.00 5 OH 30 $266,166,006.00 6 CA 15 $213,143,571.00 7 IA 27 $161,924,069.00 8 VA 97 $161,423,815.00 9 MI 22 $151,025,883.00
10 RI 16 $110,540,998.00 11 MA 20 $104,222,495.00 12 CT 5 $92,561,630.00 13 NC 38 $89,712,744.00 14 LA 29 $85,769,605.00 15 MD 20 $71,081,795.00 16 NE 7 $55,418,927.00 17 WI 17 $49,247,758.00 18 OR 7 $48,211,580.00 19 OK 6 $45,214,906.00 20 MS 23 $41,820,328.00 21 DE 12 $37,666,321.00 22 KS 17 $34,512,157.00 23 DC 4 $33,863,224.00 24 GA 16 $33,521,098.00 25 MN 2 $32,077,684.00 26 NJ 5 $31,750,125.00 27 ME 6 $28,459,790.00 28 TX 4 $21,124,993.04 29 NM 3 $21,120,431.00 30 UT 6 $19,844,215.00 31 KY 28 $19,637,125.00 32 TN 3 $15,925,000.00 33 WA 4 $15,028,199.00 34 AR 9 $13,114,147.00 35 SC 5 $12,536,733.00 36 SD 5 $8,772,396.00 37 MT 2 $8,041,612.00 38 IN 8 $7,305,134.00 39 ID 3 $6,377,610.00 40 AL 4 $5,635,214.00 41 AZ 1 $5,600,000.00 42 FL 6 $5,589,882.00 43 VT 7 $4,347,804.00 44 WV 6 $2,558,458.00 45 CO 3 $1,103,897.00 46 WY 1 $39,990.00 47 AK 0 $0.00 47 HI 0 $0.00 47 ND 0 $0.00 47 NH 0 $0.00 47 NV 0 $0.00 47 PR 0 $0.00 47 VI 0 $0.00
711 $3,472,840,678.04