Federal Ministry of Finance -...
102
1 Federal Ministry of Finance Responses to the 50 Questions on Nigeria’s Economy Posed by the House of Representatives’ Committee on Finance PREAMBLE We are pleased to provide responses to a set of 50 questions which were submitted to us by the House of Representatives Finance Committee on 19 th December 2013 (NASS/7HR/CT.32/1999). We are somewhat surprised by the content of many of these questions for a number of reasons. First, the responses to most of these questions are already in the public domain, and have been extensively debated by the government, media, civil society organizations and the private sector. We have answered these questions or similar ones many times before various Committees of the National Assembly. Nevertheless, we are pleased to answer them again with supporting data and analyses. Second, the questions are repetitive in several instances (for example, questions 28, 34 and 40 on the benchmark oil price), and in some cases are directly contradictory (for example, questions 5 and 9 on debt management). This makes it somewhat confusing for those trying to respond. Third, several of these questions contain false or incorrect assertions and are overly personalized. So it is not clear whether the focus is really on the economy as far as those questions are concerned. Nevertheless, we have attempted to respond as objectively as we can.
Transcript of Federal Ministry of Finance -...
1
Federal Ministry of Finance
Responses to the 50 Questions on Nigeria’s Economy Posed by
the House of Representatives’ Committee on Finance
PREAMBLE
We are pleased to provide responses to a set of 50 questions which were
submitted to us by the House of Representatives Finance Committee on
19th December 2013 (NASS/7HR/CT.32/1999). We are somewhat
surprised by the content of many of these questions for a number of
reasons.
First, the responses to most of these questions are already in the public
domain, and have been extensively debated by the government, media,
civil society organizations and the private sector. We have answered these
questions or similar ones many times before various Committees of the
National Assembly. Nevertheless, we are pleased to answer them again
with supporting data and analyses.
Second, the questions are repetitive in several instances (for example,
questions 28, 34 and 40 on the benchmark oil price), and in some cases are
directly contradictory (for example, questions 5 and 9 on debt
management). This makes it somewhat confusing for those trying to
respond.
Third, several of these questions contain false or incorrect assertions and
are overly personalized. So it is not clear whether the focus is really on the
economy as far as those questions are concerned. Nevertheless, we have
attempted to respond as objectively as we can.
2
Finally, we have spent considerable efforts to gather supporting factual
documentation to buttress our answers as requested by the Committee. We
have done so in good faith, and look forward to the exchange and dialogue
with the Committee.
With best personal regards,
Dr. Ngozi Okonjo-Iweala, CFR
Co-ordinating Minister for the Economy
and Hon. Minister of Finance
Abuja – 16th January 2014
3
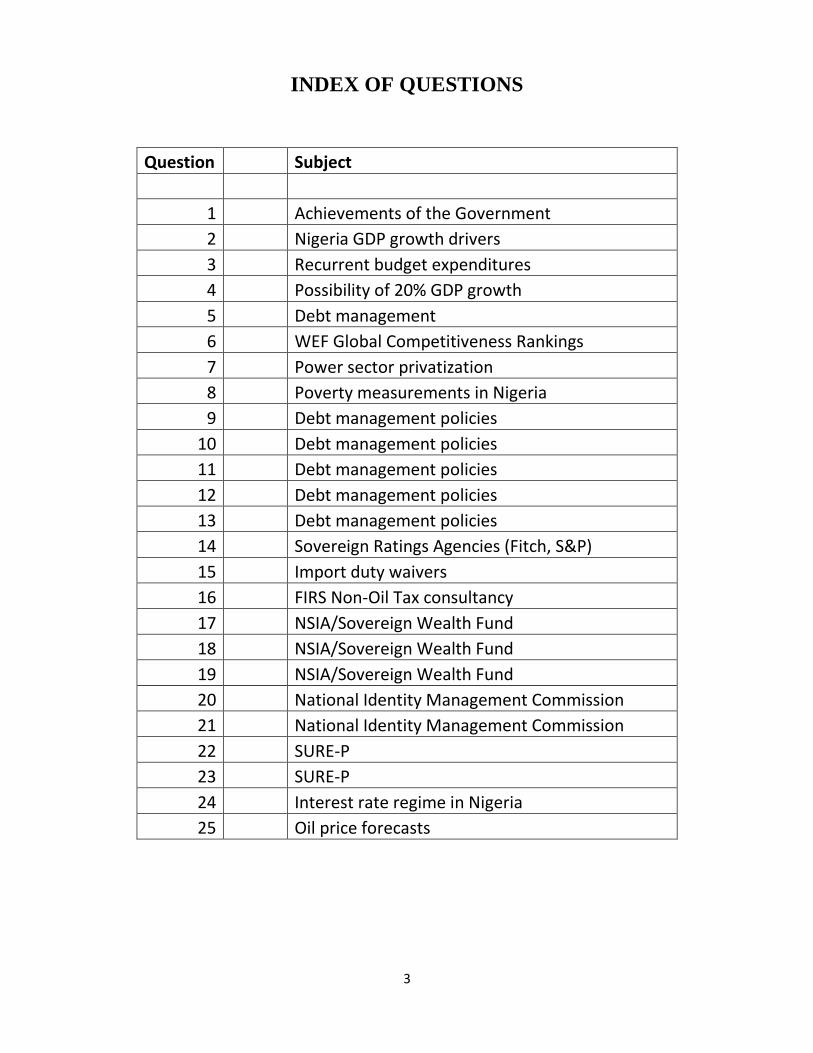
INDEX OF QUESTIONS
Question Subject
1 Achievements of the Government
2 Nigeria GDP growth drivers
3 Recurrent budget expenditures
4 Possibility of 20% GDP growth
5 Debt management
6 WEF Global Competitiveness Rankings
7 Power sector privatization
8 Poverty measurements in Nigeria
9 Debt management policies
10 Debt management policies
11 Debt management policies
12 Debt management policies
13 Debt management policies
14 Sovereign Ratings Agencies (Fitch, S&P)
15 Import duty waivers
16 FIRS Non-Oil Tax consultancy
17 NSIA/Sovereign Wealth Fund
18 NSIA/Sovereign Wealth Fund
19 NSIA/Sovereign Wealth Fund
20 National Identity Management Commission
21 National Identity Management Commission
22 SURE-P
23 SURE-P
24 Interest rate regime in Nigeria
25 Oil price forecasts
4
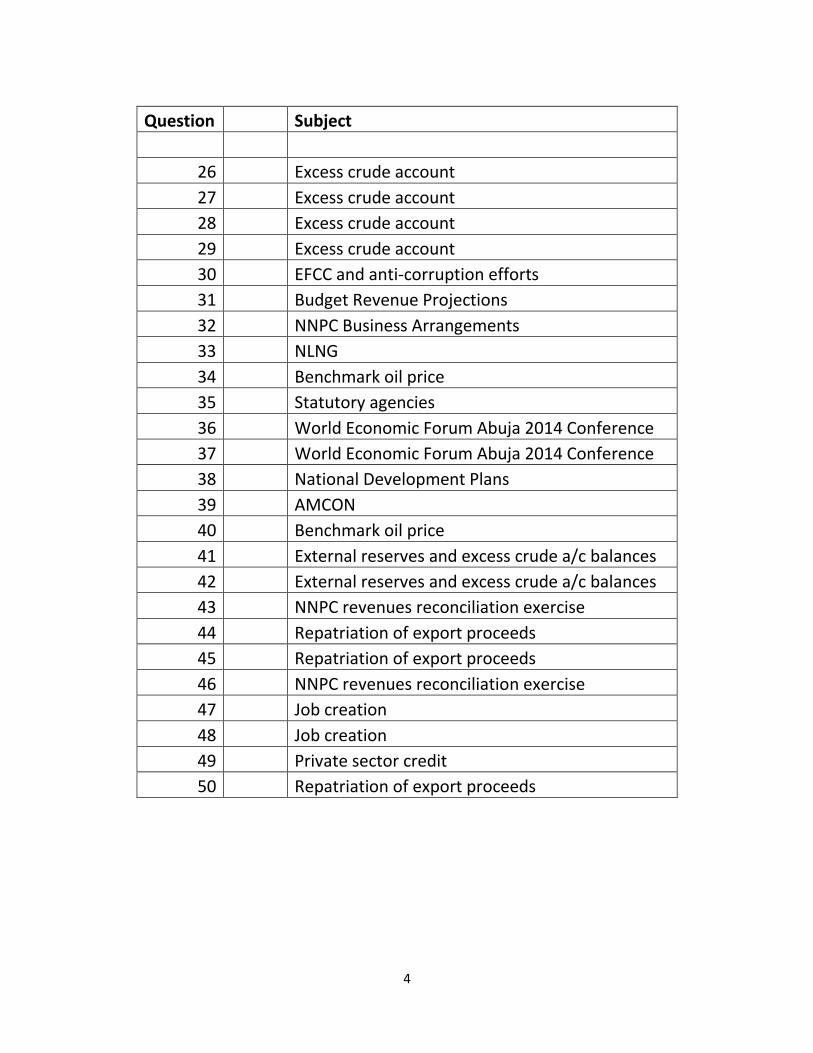
Question Subject
26 Excess crude account
27 Excess crude account
28 Excess crude account
29 Excess crude account
30 EFCC and anti-corruption efforts
31 Budget Revenue Projections
32 NNPC Business Arrangements
33 NLNG
34 Benchmark oil price
35 Statutory agencies
36 World Economic Forum Abuja 2014 Conference
37 World Economic Forum Abuja 2014 Conference
38 National Development Plans
39 AMCON
40 Benchmark oil price
41 External reserves and excess crude a/c balances
42 External reserves and excess crude a/c balances
43 NNPC revenues reconciliation exercise
44 Repatriation of export proceeds
45 Repatriation of export proceeds
46 NNPC revenues reconciliation exercise
47 Job creation
48 Job creation
49 Private sector credit
50 Repatriation of export proceeds
5
1. What should you consider as the major economic achievements of this
government in the 2013 fiscal year and why? In your explanation, we will
need facts and figures in demonstrating such achievements.
The Administration detailed its 2013 achievements in an extensive report when
the President gave the mid-term report on the Transformation Agenda. We have
made several priority investments in physical and human infrastructure across
the country; and these investments have resulted in many achievements across
the real sectors of the economy. Details can be found in the Mid-Term Review
Report, and also on the website of the National Planning Commission. Below
are some of the key sectoral achievements in 2013.
Job creation: Our strong economic performance across various sectors is
creating jobs, and improving the livelihoods of our citizens. According to the
National Bureau of Statistics (NBS) a total of 1.6 million jobs were created
in the past year. The NBS jobs data are based on Quarterly Job Creation
surveys which are conducted in partnership with the Office of the Chief
Economic Adviser to the President, the National Planning Commission, and
the Federal Ministry of Labour & Productivity. The survey is conducted for
all 36 States and the FCT and covers all sectors of the economy.
Of the 1.6 million total jobs created, we can highlight a few examples which
demonstrate the impacts made across the country.
o In agriculture, the provision of inputs in 10 Northern States enabled
dry season farming; and profitably engaged over 250,000 farmers and
youths even during the dry season.
o In manufacturing, many new jobs were also created across the
country. For example, the Onne Oil and Gas Free Zone created an
estimated 30,000 direct and indirect jobs.
o The Government’s special intervention programs also created job
opportunities. The YouWiN program has supported young Nigerian
entrepreneurs and created over 18,000 jobs, while the SURE-P
Community Services Scheme has also created 120,000 job
opportunities across the country.
However, given the large number of new entrants into the labor force each
year, and the pre-existing stock of people already looking for jobs, we will
need to maintain our unrelenting focus on job creation for Nigerians. Job
creation will therefore remain the central focus of this Administration.
6
Transportation Infrastructure (Roads & Railways): We have made progress
in the construction of various road projects across the country, such as the
Kano-Maiduguri road, the Abuja-Lokoja road, the Apapa-Oshodi road, the
Onitsha-Enugu-Port-Harcourt road and the Benin-Ore-Shagamu road,
among others. Preliminary work has also commenced on the Lagos-Ibadan
road, as well as on the Second Niger Bridge. The Railway Modernization
Programme involving the construction of standard gauge lines is underway.
The 1,124 km Western line linking Lagos and Kano is now functional while
work on the Eastern line linking Port Harcourt to Maiduguri is about 36%
complete. The Abuja-Kaduna Standard Gauge line has attained 68%
completion, and the Itakpe-Ajaokuta-Warri Line which is presently 77%
completed, will be completed next year. The annual passenger traffic on our
railways has increased steadily: rising from 1 million in 2011 to 5 million in
2013.
Inland waterways: We have dredged about 72 km of the lower River Niger
from Baro in Niger State to Warri in Delta State; and completed the
construction of the Onitsha inland port; while the Baro port is nearing
completion. The result of all these is that we now have year round
navigation around the lower Niger; and we are already witnessing an
increase in cargo volume from below 2.9 million metric tons in 2011 to over
5 million metric tons in 2013 on the inland waterways. As in the case of the
rail transport, the number of passengers travelling via our inland waterways
has increased fourfold from 250,000 in 2011 to over 1.3 million.
Water resources: Key milestones recorded in 2013 include the construction
of 9 dams which resulted in an increase in the volume of the nation’s water
reservoir by 422MCM. Progress was made on major projects such as the
South Chad Irrigation Project, the Bakolori Irrigation Project, and the Galma
Dam. Implementation of irrigation and drainage programme resulted in
increase of the total irrigable area by over 31,000Ha and increased
production of over 400,000Mt of assorted irrigated food products. To
improve supply of potable drinking water to a larger cross-section of
Nigerians, the administration has constructed and rehabilitated several small
town and urban water projects and over 2500 hand pumps and solar powered
boreholes under the water supply and sanitation programme.
Aviation: The 22 airports across Nigeria are being remodeled and upgraded:
in 2013, we completed the upgrade of 11 airport terminals and work on the
remaining 11 terminals is in progress. The Enugu Airport is now operational
as an international airport with a new terminal under construction. We have
7
also commenced work on the construction of three new international airport
terminals: in Lagos, in Kano, and in Abuja. Modern navigational and
meteorological systems were installed at our airports to improve air safety.
In addition, 6 airports namely: Jos, Markurdi, Yola, Jalingo, Lagos and
Ilorin which are strategically located in proximity to food baskets have been
designated as perishable cargo airports and international standards
perishable cargo facilities are being developed at these airports. A new
Cargo Development Division has been established in FAAN to give focus to
this effort.
Power: We have completed one of the most comprehensive and ambitious
power sector privatization and liberation programmes globally. We have
privatized 4 power generation companies and 10 power distribution
companies, and have virtually settled all claims and entitlements of PHCN
workers. Some major cities get an average of 16-18 hours of electricity per
day in 2013. This however dropped slightly in November and December
2013 during the transition and as a result of gas supply problems; we expect
some teething problems and then power supply should pick up. In 2013, we
also mobilized $1.5 billion in financing from multilateral sources for
investment and upgrade of the transmission network in 2014 and beyond. To
promote clean energy, we also commenced construction of the 700MW
Zungeru Hydro-Power project in 2013. We have strengthened relevant
power market intermediaries such as the Nigerian Bulk Electricity Trading
Plc (NBET), which is backed with over N120 billion in financing to help
stimulate greater private investments in the sector.
Communications Technology: We continued our strategic focus on investing
in modern ICT technologies. We constructed 500km of fibre-optic cable to
rural areas; 3,000km targeted for deployment in 2013/2014. A total of 266
Public Access Venues were established in 2013 – 156 Rural IT Centres, 110
Community Communication Centres. We facilitated the deployment of
mobile communications base stations in rural areas of Nigeria. A total of 59
Base Stations have been installed thus far, with an additional 1,000 planned
for 2014. In addition, we also provided wholesale internet bandwidth to
Internet Service Providers, Cyber cafes, and ICT centres like Community
Communication Centres (CCC) in rural communities – connectivity to 12
out of 18 pilot sites completed. In 2013, we deployed a fibre-optic high-
speed internet network to connect 27 Federal universities, and provided
computing facilities to 74 tertiary institutions and 218 public schools across
the country. Finally, we established innovation centers to support
8
entrepreneurs in the ICT sector, and also launched a Venture Capital fund of
$15 million for ICT businesses.
Industry, Trade and Investments: We launched the National Industrial
Revolution Plan (NIRP) which focuses on industrializing Nigeria and
diversifying our economy into sectors such as agro-processing, light
manufacturing, and petrochemicals. In the 2013 fiscal year, Nigeria was
named the #1 destination for investments in Africa by UNCTAD (the UN
Conference on Trade and Development), attracting over $7 billion in FDI.
There were a large number of both foreign and domestic investments in the
economy. Some examples are: $250m investments by Procter and Gamble in
Ogun State; $40 million in agricultural projects by Dominion Farms in
Taraba State; $1.2 billion in fertilizer and petrochemicals by Indorama; a
$200 million steel plant by Kam Industries; and a $9 billion investment in a
petrochemicals and refinery complex by the Dangote Group.
To further support the manufacturing sector, the Government successfully
negotiated a strong Common External Tariff (CET) agreement with our
ECOWAS partners which would enable us to protect our strategic industries
where necessary. The Nigerian Enterprise Development Programme
(NEDEP) was initiated in 2013 to address the needs of small businesses.
Some key interventions by NEDEP include supporting small companies with
access to affordable finance, access to markets, capacity support, business
development services, youth training, and support in formalizing their
operations. In addition, in 2013, we reduced business registration costs for
small businesses by 50%, to help them conserve capital. Finally, as a result
of our backward integration policies, Nigeria is now a net exporter of cement
and expanded cement output capacity from 2 million metric tonnes in 2002
to 28.5 million metric tonnes in 2013.
Oil and gas: In 2013, work was completed on important projects such as the
136km gas pipeline from Oben to Geregu, the 31km pipeline from Itoki to
Olorunshogo and the acquisition of 250 square kilometers of 3D-seismic
data for the Chad basin. The government also initiated the Ogidigben Gas
Industrialization Project which will provide a petrochemicals complex in
Delta State. We have also supported greater indigenous participation in the
oil and gas sector. At present, the Ebok Terminal – with a daily crude oil
output of 7000 b/d – is operated by an indigenous firm.
Agriculture: There have been many achievements in the agricultural sector
following the launch of the Government’s comprehensive Agricultural
9
Transformation Agenda program. In October 2013, inflation fell to 7.8%, its
lowest since 2008, partly due to higher domestic food production. The
Government’s Growth Enhancement Scheme (GES) is providing subsidized
inputs to farmers via an e-Wallet program. In fiscal year 2013, an estimated
4.2 million farmers received subsidized inputs via the Government’s Growth
Enhancement Scheme. As a result, in 2013, we produced 1.1 million metric
tonnes of dry season rice across 10 Northern states; and over 250,000
farmers and youths in these States are now profitably engaged in farming
even during the dry season.
The Federal Government launched Staple Crop Processing Zones to support
investments in the entire agricultural value chain. At present, there are
significant private investment commitments from agribusiness ventures such
as: Flour Mills of Nigeria, the Dangote Group, Syngenta, Indorama, AGCO,
and Belstar Capital. In 2012, 2.2 million metric tonnes of cassava chips were
exported, exceeding the ATA’s target by over 100% while the 40 percent
substitution of cassava for wheat has been achieved through research and
collaboration with the IITA and Federal Institute for Industrial Research.
Similarly, there has been a decline in wheat imports to Nigeria from an all-
time high of 4,051,000 MT in 2010 to 3,700,000 MT in 2012.
Health: To further invest in the human capital of our population, we are
building strong safety nets and improving access to primary health care
using the Saving One Million Lives programme. In the 2013 fiscal year, we
recruited 11,300 frontline health workers who were deployed to under-
served communities across the country. We have reached over 10,000
women and children with conditional cash transfer programmes across 8
States (Anambra, Bauchi, Bayelsa, Ebonyi, Kaduna, Niger, Ogun, Zamfara)
and the FCT and we intend to scale up this successful initiative. As a result,
over 400,000 lives have been saved through our various interventions.
Nigeria’s national immunization coverage has now exceeded 80% and is
yielding demonstrable results. The Type-3 Wild Polio virus has been
contained in 2013, with no recorded transmissions for more than one year;
while Guinea worm that previously affected the lives of over 800,000
Nigerians yearly has been largely eradicated. Facilities at various medical
centers across the country – such as the University of Nigeria Teaching
Hospital in Enugu, and the University College Hospital in Ibadan – have
also been upgraded. Finally, Nigeria has also been honoured as Co-Chair of
the fourth replenishment of the Global Fund to fight AIDS, TB and Malaria.
10
Education: To improve access to education at all levels, a number of priority
investments were made in 2013. These include the construction of 125
Almajiri schools and establishment of 3 additional Federal Universities, to
bring the total number of new Federal Universities to 12. Additionally,
special girls’ schools were constructed in 13 States of the Federation. In
fiscal year 2013, we rehabilitated 352 science and technical laboratories
while 72 new libraries have been constructed in the Federal Unity Schools.
Furthermore, the laboratories of all 51 Federal and State Polytechnics have
been rehabilitated and micro-teaching laboratories are being constructed in
58 Federal and State Colleges of Education. The Presidential Special
Scholarship programme for first class graduates has commenced with an
initial set of 101 beneficiaries. Over 7,000 lecturers from Universities,
Polytechnics and Colleges of Education are benefitting from scholarships to
support their doctoral training in Nigerian and overseas institutions. The
Federal Government also committed N200 billion to the upgrade and
reconstruction of infrastructure for our tertiary institutions.
Sports: The Sports sector is an important contributor to the economy and
capable of generating revenues and jobs. As such, this Administration has
taken concrete steps to restore the glory of Nigerian sports through strong
financial backing, capacity building and moral support. There is renewed
interest in sports as a commercial venture – with international investor
interests in our football and basketball leagues. Our sportsmen and women
also continue to make us proud. The Golden Eaglets won the FIFA U-17
World Cup in the United Arab Emirates. The Super Eagles won the African
Nations Cup in January 2013 after a 19-year drought, and have qualified for
the FIFA World Cup Finals in Brazil this year. The Flying Eagles also won
the bronze medal at the African Youth Championship. Nigeria also won the
African Junior Athletics Championship and our nation’s flag was hoisted
twice during the World Athletics Championship through the outstanding
efforts of Blessing Okagbare.
Creative Industries: This Administration is also working to fully harness the
potential of our creative industries. This sector sustains 200,000 direct jobs,
and an additional 1 million indirect jobs across the country. This
Administration has therefore taken concrete steps to support the sector
through the Project Advancing Creativity and Technology (PACT) in
Nollywood, which is a ₦3 billion grant programme for Nollywood. In 2013,
the Fund already supported capacity building and film production in the
industry. In 2014, we will go further to tackle intellectual property and
distribution challenges faced in the industry.
11
Macroeconomic Achievements: It is worth emphasizing that our current
stable macroeconomic environment provided the platform for the strong
performance observed across the various sectors. Inflation remains in single
digits (at 8.0 percent as at end-December 2013); the exchange rate has
remained relatively stable within the target band of N155-160/Dollar. Our
budget deficit of 1.85% of GDP is one of the lowest in the world. In the
2013 fiscal year, the National Bureau of Statistics reported quarterly GDP
growth of 6.56%, 6.18% and 6.81% in Q1, Q2 and Q3 respectively.
We have mentioned developments in some key sectors above as examples.
However, we acknowledge that challenges remain, especially in creating jobs
for our growing youth population, and also in tackling income inequality and
eradicating poverty. We will return to these topics in Question 8 when we
discuss some of the government’s recent social protection programs which are
intended to tackle poverty and inequality in our nation.
12
2. You have been credited with many announcements regarding Nigeria's
economy as one of the fastest growing economies in Africa. If the economy
is one of the fast growing economies, what is exactly growing the economy?
What role does government play in the said economic growth, especially
given that as high as 80 percent of the country's total annual budget
spending still goes into recurrent expenditure?
First, we must correct the wrong statistic quoted in the question. The share
of recurrent expenditures in total spending was 67.5 percent in Budget 2013,
and 74% in 2014. While this recurrent expenditure ratio has been high in
recent years, it has never reached the 80 percent mark quoted above. In
drafting the budget each year, we aim to reduce our recurrent spending and
thus allocate more resources for capital investments in priority sectors. The
2014 fiscal year is a challenging year of reduced revenues, and hence
recurrent expenditures have taken a larger proportion of the overall budget.
But we think this is not acceptable for an economy such as Nigeria and we
must reverse this trend by trimming down Government recurrent
expenditures and waste. In our response to Question #3, we will provide a
discussion on why the recurrent expenditures in the Federal Government
budget are currently so high, and what measures can be taken to reduce this
in the future.
Now, we turn to answer the question above on the sources of economic
growth in Nigeria.
Nigeria’s economy is one of the fastest growing in Africa, and also among
the emerging markets. This finding is based on external reports by
institutions such as the Africa Development Bank (AfDB), the United
Nations Economic Commission for Africa (UNECA), the International
Monetary Fund (IMF), and the Organization for Economic Cooperation and
Development (OECD).
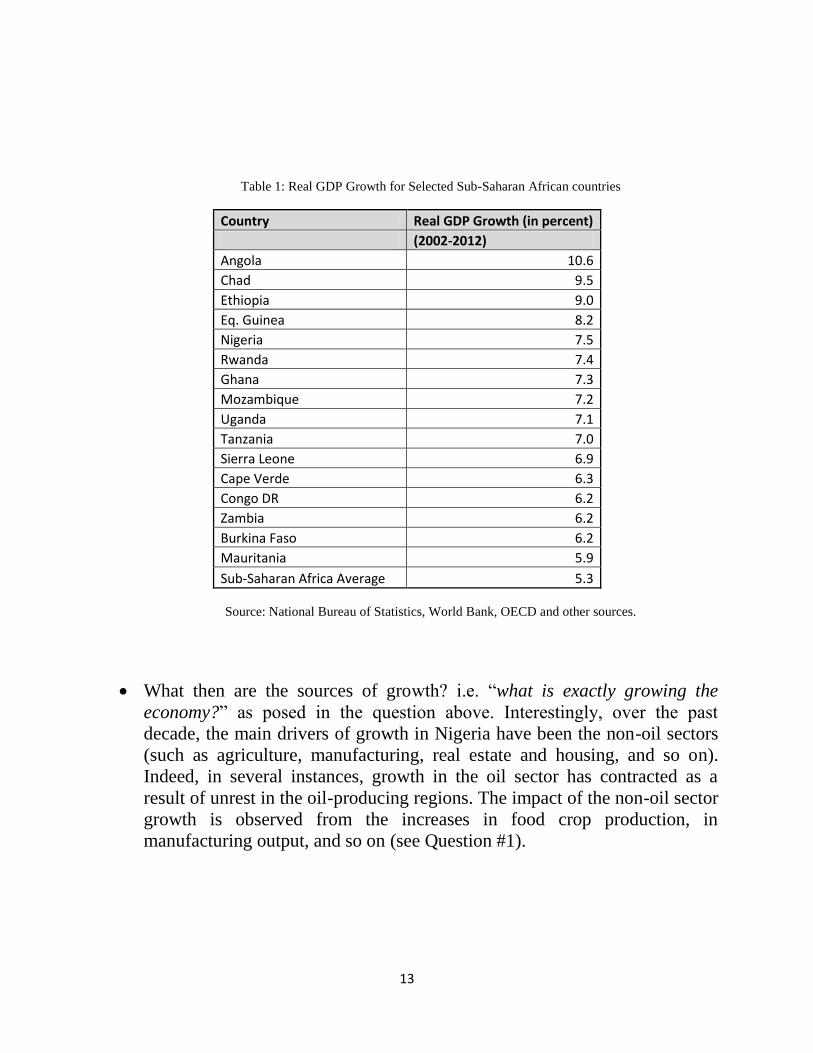
In Table 1 below, we compare Nigeria’s growth to other African economies
over the period, 2002 to 2012. We observe that Nigeria recorded the 5th
fastest economic growth rate among African countries over the stated period.
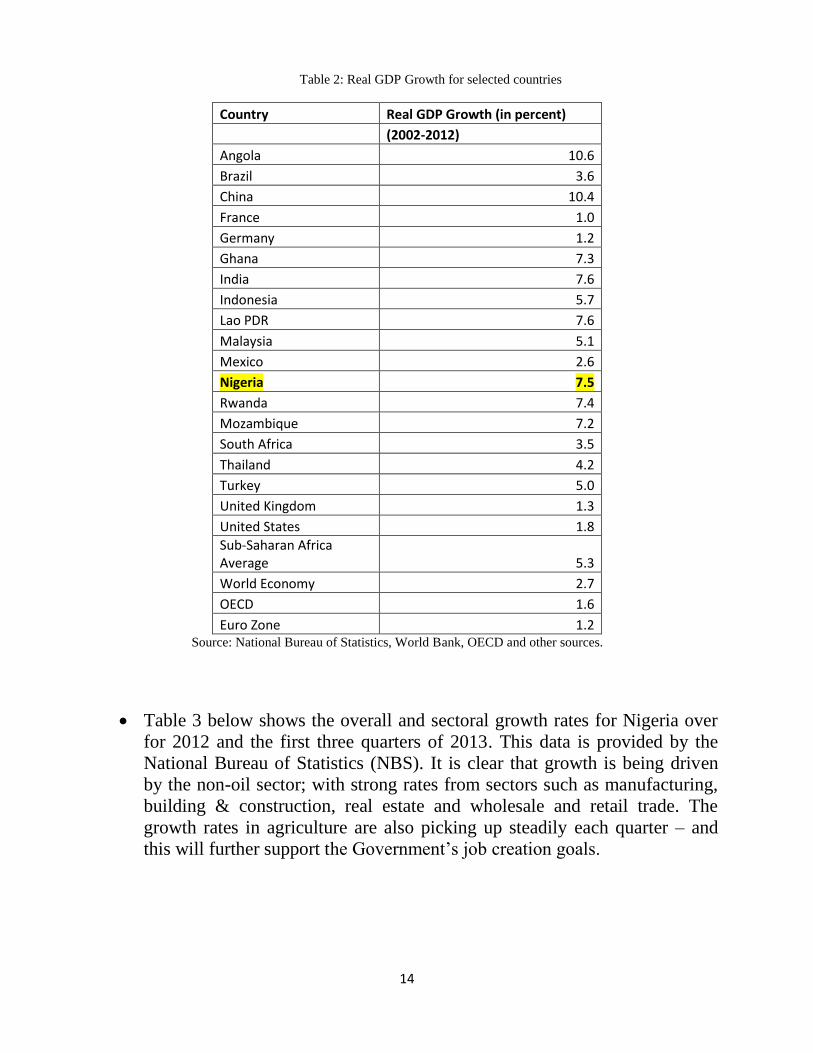
In Table 2, we go further to compare Nigeria’s economic growth to that of
other emerging economies. In fact, from all our external research, we find
that Nigeria actually was the 13th fastest growing economy globally over the
period 2002 to 2012.
13
Table 1: Real GDP Growth for Selected Sub-Saharan African countries
Country Real GDP Growth (in percent)
(2002-2012)
Angola 10.6
Chad 9.5
Ethiopia 9.0
Eq. Guinea 8.2
Nigeria 7.5
Rwanda 7.4
Ghana 7.3
Mozambique 7.2
Uganda 7.1
Tanzania 7.0
Sierra Leone 6.9
Cape Verde 6.3
Congo DR 6.2
Zambia 6.2
Burkina Faso 6.2
Mauritania 5.9
Sub-Saharan Africa Average 5.3
Source: National Bureau of Statistics, World Bank, OECD and other sources.
What then are the sources of growth? i.e. “what is exactly growing the
economy?” as posed in the question above. Interestingly, over the past
decade, the main drivers of growth in Nigeria have been the non-oil sectors
(such as agriculture, manufacturing, real estate and housing, and so on).
Indeed, in several instances, growth in the oil sector has contracted as a
result of unrest in the oil-producing regions. The impact of the non-oil sector
growth is observed from the increases in food crop production, in
manufacturing output, and so on (see Question #1).
14
Table 2: Real GDP Growth for selected countries
Country Real GDP Growth (in percent)
(2002-2012)
Angola 10.6
Brazil 3.6
China 10.4
France 1.0
Germany 1.2
Ghana 7.3
India 7.6
Indonesia 5.7
Lao PDR 7.6
Malaysia 5.1
Mexico 2.6
Nigeria 7.5
Rwanda 7.4
Mozambique 7.2
South Africa 3.5
Thailand 4.2
Turkey 5.0
United Kingdom 1.3
United States 1.8
Sub-Saharan Africa Average 5.3
World Economy 2.7
OECD 1.6
Euro Zone 1.2 Source: National Bureau of Statistics, World Bank, OECD and other sources.
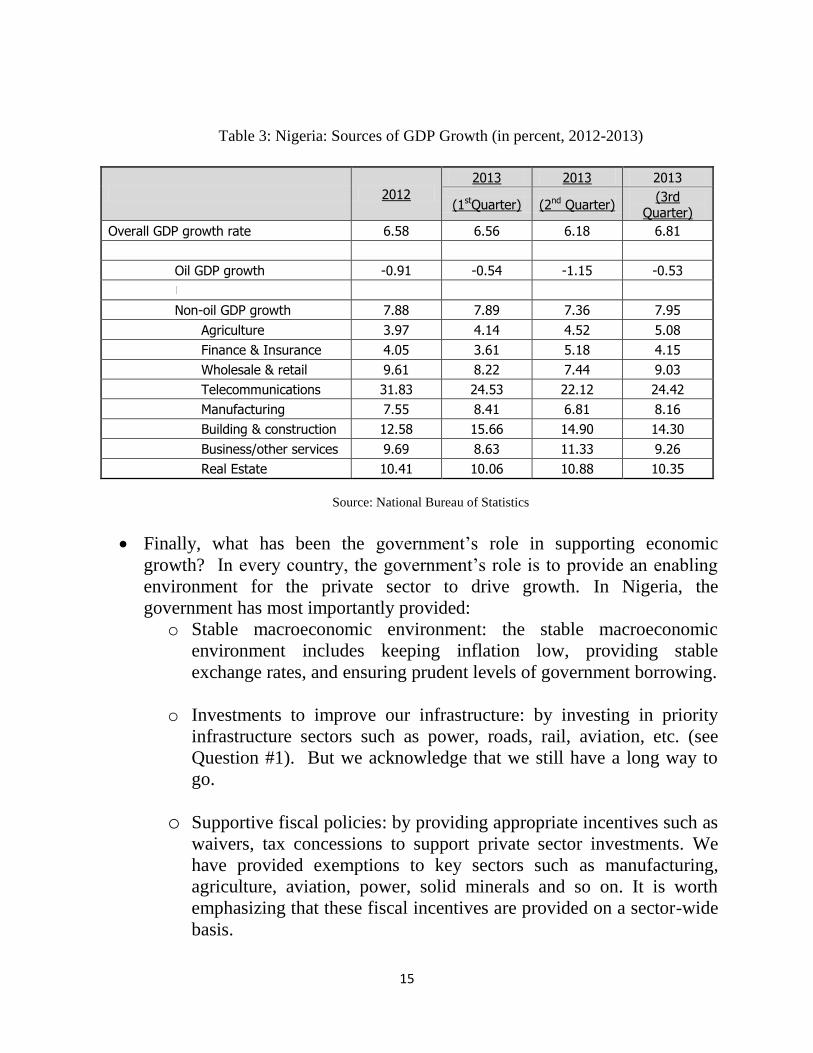
Table 3 below shows the overall and sectoral growth rates for Nigeria over
for 2012 and the first three quarters of 2013. This data is provided by the
National Bureau of Statistics (NBS). It is clear that growth is being driven
by the non-oil sector; with strong rates from sectors such as manufacturing,
building & construction, real estate and wholesale and retail trade. The
growth rates in agriculture are also picking up steadily each quarter – and
this will further support the Government’s job creation goals.
15
Table 3: Nigeria: Sources of GDP Growth (in percent, 2012-2013)
2012
2013 2013 2013
(1stQuarter) (2nd Quarter) (3rd
Quarter)
Overall GDP growth rate 6.58 6.56 6.18 6.81
Oil GDP growth -0.91 -0.54 -1.15 -0.53
Non-oil GDP growth 7.88 7.89 7.36 7.95
Agriculture 3.97 4.14 4.52 5.08
Finance & Insurance 4.05 3.61 5.18 4.15
Wholesale & retail 9.61 8.22 7.44 9.03
Telecommunications 31.83 24.53 22.12 24.42
Manufacturing 7.55 8.41 6.81 8.16
Building & construction 12.58 15.66 14.90 14.30
Business/other services 9.69 8.63 11.33 9.26
Real Estate 10.41 10.06 10.88 10.35
Source: National Bureau of Statistics
Finally, what has been the government’s role in supporting economic
growth? In every country, the government’s role is to provide an enabling
environment for the private sector to drive growth. In Nigeria, the
government has most importantly provided:
o Stable macroeconomic environment: the stable macroeconomic
environment includes keeping inflation low, providing stable
exchange rates, and ensuring prudent levels of government borrowing.
o Investments to improve our infrastructure: by investing in priority
infrastructure sectors such as power, roads, rail, aviation, etc. (see
Question #1). But we acknowledge that we still have a long way to
go.
o Supportive fiscal policies: by providing appropriate incentives such as
waivers, tax concessions to support private sector investments. We
have provided exemptions to key sectors such as manufacturing,
agriculture, aviation, power, solid minerals and so on. It is worth
emphasizing that these fiscal incentives are provided on a sector-wide
basis.
16
3. Since your arrival as minister of finance in 2011, you have publicly
announced the need to reduce the recurrent expenditure so that more
money would be made available to capital spending which is critical to
growing and diversifying the country's economy. How far has government
succeeded in making these necessary cuts; and where exactly have these
cuts been made in this effort to reduce recurrent expenditure? In other
words, based on real amount spent on capital expenditure, how much
reduction was made in 2011 against 2010, in 2012 against 2011 and in 2013
against 2012?
In 2011, at the beginning of the current administration, recurrent
expenditures accounted for 74.4 percent of the budget. This high share of
recurrent expenditures in the total budget was of great concern as it reduced
the size of funds available for investments in capital projects. The Minister
of Finance made a clear and recorded statement at Senate clearance that
high recurrent expenditure was one of the most important problems of the
Nigerian economy and needed to be improved.
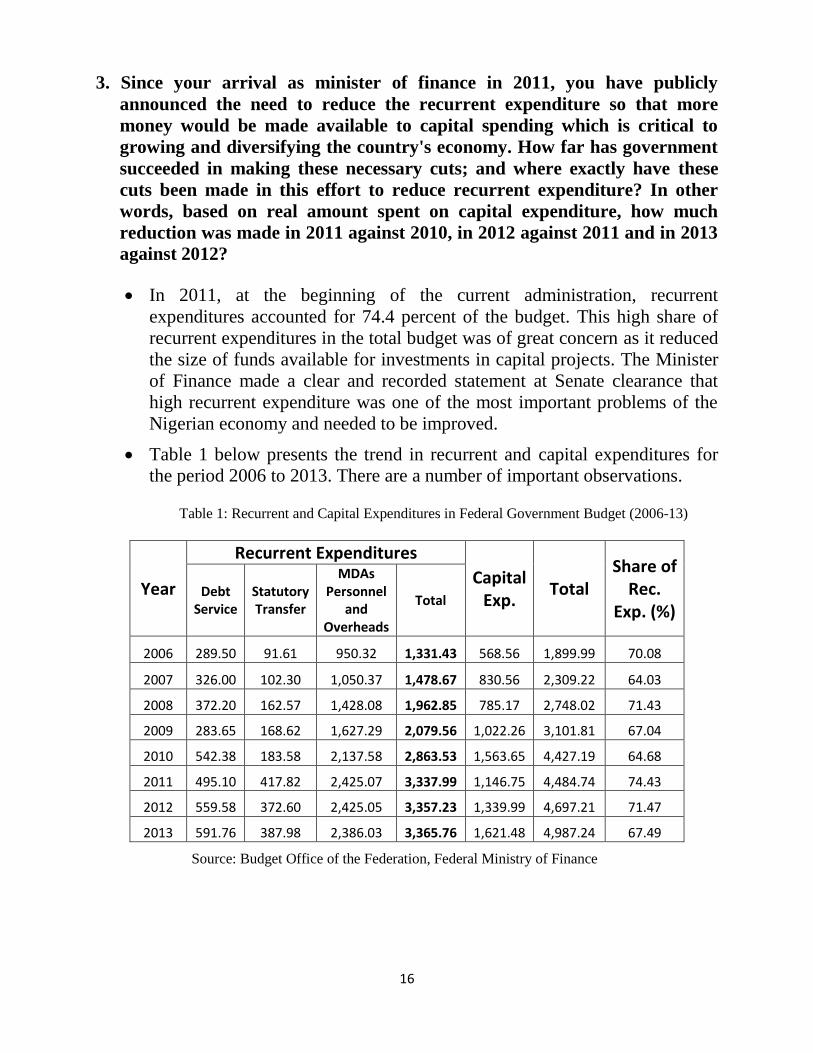
Table 1 below presents the trend in recurrent and capital expenditures for
the period 2006 to 2013. There are a number of important observations.
Table 1: Recurrent and Capital Expenditures in Federal Government Budget (2006-13)
Year
Recurrent Expenditures
Capital Exp.
Total Share of
Rec. Exp. (%)
Debt Service
Statutory Transfer
MDAs Personnel
and Overheads
Total
2006 289.50 91.61 950.32 1,331.43 568.56 1,899.99 70.08
2007 326.00 102.30 1,050.37 1,478.67 830.56 2,309.22 64.03
2008 372.20 162.57 1,428.08 1,962.85 785.17 2,748.02 71.43
2009 283.65 168.62 1,627.29 2,079.56 1,022.26 3,101.81 67.04
2010 542.38 183.58 2,137.58 2,863.53 1,563.65 4,427.19 64.68
2011 495.10 417.82 2,425.07 3,337.99 1,146.75 4,484.74 74.43
2012 559.58 372.60 2,425.05 3,357.23 1,339.99 4,697.21 71.47
2013 591.76 387.98 2,386.03 3,365.76 1,621.48 4,987.24 67.49
Source: Budget Office of the Federation, Federal Ministry of Finance
17
o First, in 2007, the recurrent expenditure share had declined to 64.03
percent. However, this ratio increased sharply by 2011 to 74.4
percent.
o The steep rise in recurrent expenditures was due to the sudden
increases in personnel costs (wage increases) granted in 2010 which
were introduced in the 2011 Budget. Indeed, between 2006 and 2013,
personnel expenses have nearly tripled from N527.9 billion to
N1718.2 billion.
o It is also worth noting that following wage increases, constitutionally,
pensions are also expected to be increase. Pensions increases were
not factored in since 2010. However, starting in 2013, this
Administration has now taken steps to tackle outstanding military
pensions, and the 2014 Budget further tackles civilian pensions.
Pension arrears are not also factored in; only the current pension
adjustments are incorporated. Thus, when pension arrears are
incorporated, these will further increase our recurrent expenditures.
o Clearly, the country has to make choices. And we will need to strike
a balance between a growing wage bill for the public sector versus
increased capital investments in priority infrastructure projects. We
welcome a debate on this issue as the present stance is not sustainable
and affects all Nigerians.
Since 2011, the current administration has introduced various measures to
reduce the share of recurrent expenditures in the total budget. We have
reduced this ratio steadily from 74.4% in 2011, to 71.5% in 2012, and
further to 67.5% in 2013, but it has risen back to 74% in 2014.
Looking at the composition of recurrent expenditures, personnel and
overhead costs for MDAs constitute the bulk of these expenditures. We
have successfully reduced overhead costs by 17% since 2011; and we
anticipate that personnel expenditures will be gradually reduced with the
introduction of the Integrated Personnel and Payroll Information System.
However, the recommendations of the Oronsaye Report have been difficult
to implement in terms of closing or streamlining agencies because most are
underpinned by law. We are therefore looking to the National Assembly to
help us repeal some of the laws so we can merge and wind duplicative
agencies up. This, of course, must be done carefully so as to phase and
reduce impact on workers given the current unemployment situation.
18
4. You are known to be celebrating a single-digit GDP growth. But
speaking recently at a breakfast dialogue with some members of the
organized private sector in Lagos, organized by the Nigerian
Economic Summit Group (NESG), you were quoted as saying: “We
are growing, but not creating enough jobs. That is a very big
challenge…We need to grow faster. I think it needs to grow at least
9 to 10 percent to drive job growth the way we want.” Don't you
agree that a good finance minister managing an economy like ours
should be celebrating a GDP growth as high as 20 percent annually?
Why is it that our economy cannot grow beyond a single digit? How
many jobs are being created as a result of these said growths? In
which sectors of the economy are these jobs created? If in private
sector, what contributions is government making to further assist
these private sector firms?
This question about why Nigeria is not celebrating a 20 percent GDP growth
rate is a bit puzzling as we are sure that the Finance Committee Chair knows
such growth rates are historically rare. Nevertheless, for the avoidance of
any further misunderstandings, we begin our response by providing a brief
primer on the concept of GDP growth, the historical trends in GDP growth
across the world, and Nigeria’s recent growth performance.
The Gross Domestic Product (GDP) captures the final value of all goods
and services produced in a given economy. It can also be expressed as the
sum of value added across all sectors in an economy. Economists also
distinguish between nominal and real GDP. For a given year, the nominal
GDP refers to the final value of goods and services produced that year, and
valued at the prices of that year. In contrast, real GDP refers to the value of
the same quantities of goods and services, but valued at an unchanged prices
of a given reference year. This is an important distinction. In general,
economists are often interested in real GDP, which measures real output
changes and not just the impact of price movements.
Therefore, the real GDP growth measures the increase in economic activity
over a given period of time, calculated at unchanged prices from a reference
year. It is typically reported on a quarterly or annual basis. An economy
19
which experiences two consecutive quarters of negative GDP growth is said
to be in a recession.
Growth rates below 3% are viewed as sluggish, while rates between 3-5%
are viewed as steady. GDP growth rates in the range of 5%-10% are
generally termed as strong or robust. Growth rates in excess of 10% are not
very common, and observed mostly in cases of post-conflict countries where
economic reconstruction is occurring from a very low base or for countries
which have recently discovered new natural resources, such as oil and gas
deposits. For example, Liberia grew by about 25.7% and 22.1% in 2000 and
2001 respectively when their post-conflict reconstruction commenced; and
Ghana grew by about 15% in 2011 at the onset of oil production.
Lessons from Economic History. Economic history provides us with good
examples of countries which experienced rapid and sustained real GDP
growth. These examples may be found in the report published by the
Commission on Growth and Development – a high-level panel of 22
eminent economists chaired by Nobel Laureate Michael Spence, and
including other leading scholars such as the Nobel Laureate Prof. Robert
Solow and Dr. Ngozi Okonjo-Iweala. Countries rarely “celebrate growth of
20% annually”. Indeed, in the Growth Commission report, a growth rate
around 7% per annum is seen as very strong. The 7% annual growth rate is
commonly used as a benchmark, as it would result in the doubling of the size
of the economy each decade.
The Growth Commission points out that only 13 countries have managed to
sustain growth rates of 7% or higher per annum over a 25- year period. The
countries are: (alphabetically) – Botswana, Brazil, China, Hong Kong,
Indonesia, Japan, Korea, Malaysia, Malta, Oman, Singapore, Taiwan and
Thailand. The report is available online at
http://www.growthcommission.org. (As an aside, it is worth noting that all
13 successful countries did five things right: they exploited the world
economy, maintained macroeconomic stability, achieved high savings and
investment rates, allowed markets to allocate resources, and had committed
and focused governments.)
20
In response to question 2, we showed that two of the fastest growing
economies in Asia, namely China and India, had grown at rates of about
10.4 and 7.6 percent per annum over the past decade. Nigeria’s GDP growth
over this period was 7.5 percent, and is viewed as one of the strong
performances among emerging market economies. This growth performance
should be celebrated and not trivialized.
Please note that a similar set of economic reforms launched under the second
Obasanjo Administration by the Economic Team lead by the same Finance
Minister that helped accelerate Nigeria’s average growth rate. In fact, for the
period 1980 to 1999, Nigeria’s average GDP growth was about 1% per
annum, in contrast to the 7.5% average which we have attained between
2002 and 2012. Without this increase in economic growth, the already
challenging economic situation in the country would have been even worse
as no domestic or foreign investor would have been attracted to invest the
way Aliko Dangote and others are investing now.
21
5. In the presence of Nigeria’s huge infrastructure deficit, why is it
that the country's debt-to-GDP at about 19 percent in 2012
remains one of the lowest in the world when compared to nations
already with world-class infrastructure and industrial economies
such as America’s 105 percent, Brazil’s 65.49 percent, India’s
67.60 percent, and South Africa’s 40.9 percent?
It is acknowledged that Nigeria faces infrastructure challenges but this
question is rather puzzling as it implies that Nigeria should borrow to build
infrastructure, and become heavily indebted like several other countries are
at present rather than continue the prudent borrowing policies implemented
by this administration.
Nigeria had an unfortunate history with managing debt. To briefly recount
that history; external debt rose from $1.3 billion in 1976 to $19 billion by
1985 as the country’s leaders borrowed extensively to finance infrastructure
projects – many of which were poorly executed or not executed at all. Debt
service climbed to $4 billion around this time, yet Nigeria was able to pay
only $1.5 billion. The country had to reschedule its debt payments to
external lenders, like the Paris Club on four occasions – 1986, 1989, 1991,
and 2000. By the end of 2004, our external debt had hit about $36 billion (or
about 50 percent of GDP) and the huge annual debt service had severely
constrained economic growth, until debt relief from the Paris Club in 2005
wiped off about 60 percent ($18 billion) from our national debt, and we
utilized $6 billion savings from the ECA to buyback the rest of the debt at 25
cents on the dollar, after paying off accumulated interest arrears. The total
Paris Club debt of $30 billion was wiped off our books. The table below
shows the trend in our debt-to-GDP ratio.
But starting in 2007, the government has had to recourse to domestic
borrowing to finance its burgeoning recurrent expenditure, hence the recent
rise in our debt-to-GDP ratio (see Table below).
A more efficient and effective model for financing infrastructure projects
nowadays is for government to create an environment conducive for private
sector investment in infrastructure projects through PPPs and other
22
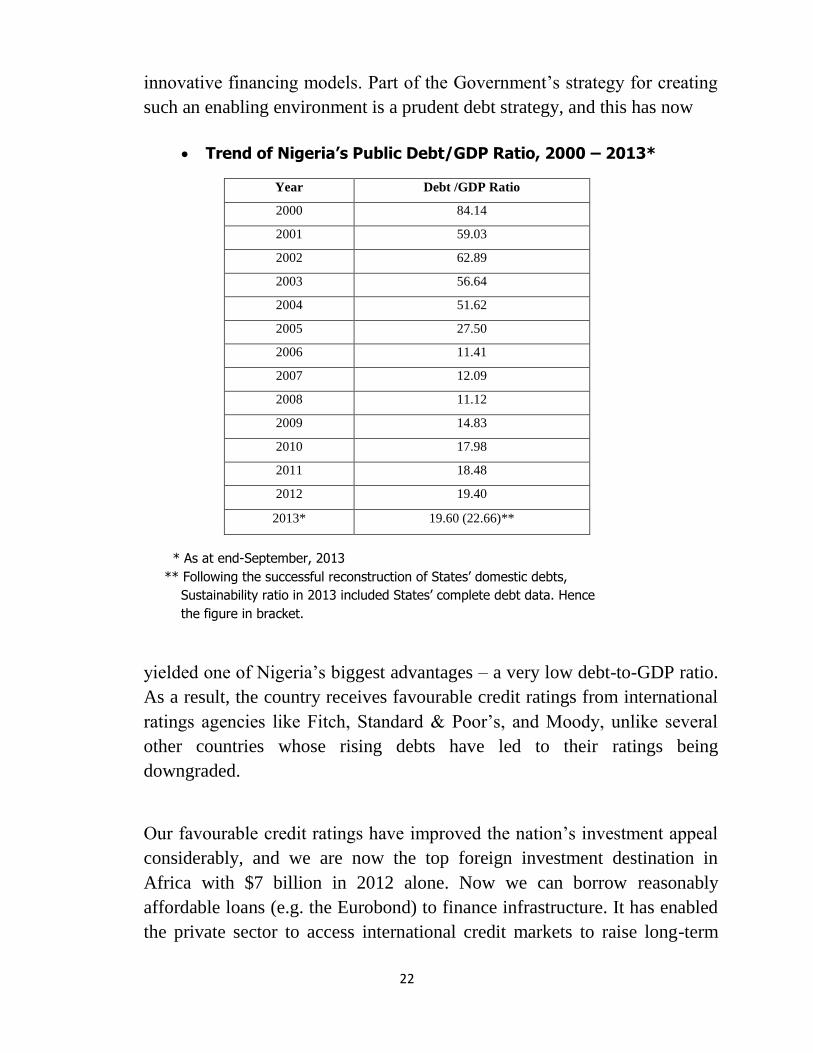
innovative financing models. Part of the Government’s strategy for creating
such an enabling environment is a prudent debt strategy, and this has now
Trend of Nigeria’s Public Debt/GDP Ratio, 2000 – 2013*
Year Debt /GDP Ratio
2000 84.14
2001 59.03
2002 62.89
2003 56.64
2004 51.62
2005 27.50
2006 11.41
2007 12.09
2008 11.12
2009 14.83
2010 17.98
2011 18.48
2012 19.40
2013* 19.60 (22.66)**
* As at end-September, 2013
** Following the successful reconstruction of States’ domestic debts,
Sustainability ratio in 2013 included States’ complete debt data. Hence
the figure in bracket.
yielded one of Nigeria’s biggest advantages – a very low debt-to-GDP ratio.
As a result, the country receives favourable credit ratings from international
ratings agencies like Fitch, Standard & Poor’s, and Moody, unlike several
other countries whose rising debts have led to their ratings being
downgraded.
Our favourable credit ratings have improved the nation’s investment appeal
considerably, and we are now the top foreign investment destination in
Africa with $7 billion in 2012 alone. Now we can borrow reasonably
affordable loans (e.g. the Eurobond) to finance infrastructure. It has enabled
the private sector to access international credit markets to raise long-term

23
funds, at low interest rates, to finance infrastructure projects. Therefore, the
government cannot afford to be complacent on Nigeria’s competitive edge,
and must continue to exercise caution on accumulating domestic or external
debt.
24
6. Since facts don't lie, have you any disagreements with the
September 4, 2013 Global Competitiveness Report of the World
Economic Forum for 2013-2014, which ranked Nigeria 120th out
of 148 countries ranked in the Global Competitiveness Index,
including being ranked far behind some African countries such as
Mauritius 45th, South Africa 53rd, and Kenya 96th?
No, we do not have disagreements with this ranking or that of the World
Bank Doing Business which ranks Nigeria as 147 out of 189 countries.
However, please note that Nigeria’s composite rank of 120 out of 148 does
not mean that progress is not being made, it simply means that other
countries are moving faster with the much needed advances and reforms in
the areas for which countries are ranked, and we have a lot of work ahead of
us to improve our standings. Bigger countries such as India and Russia also
fell in their relative rankings based on one criteria or the other. Even the
United States experienced a 4-year decline from the 2008-2009 ranking (1st)
through 2012-2013 (7th
)1 before improving in the current rankings (5
th). It
goes to say that there will always be movements in the rankings based on
near-current country performance and world economic conditions and there
is always room for improvement.
These rankings – including the World Bank’s Doing Business reports – are
important, but they are not the only predictors of economic growth. Indeed
some large and fast-growing countries sometimes had low “Doing Business”
rankings based on the ranking methodology used; China (96), Brazil (116),
Indonesia (120), Kenya (129) and India (134). The Doing Business rankings
look at speed of getting licenses, port infrastructure, investor protection and
contract enforceability among other criteria.
It is important that we are aware of the criteria on which countries are
ranked by the Global Competitiveness Report. There are 12 pillars, namely:
Institutions, Infrastructure, Macroeconomic environment, Health and
primary education, Higher education and training, Goods market efficiency,
1 United States Ranking: 2008-2009 (1
st), 2009-2010 (2
nd), 2010-2011 (4
th), 2011-2012 (5
th), 2012-2013 (7
th)
25
Labour market efficiency, Financial market development, Technological
readiness, Market size, Business Sophistication and Innovation.
Nigeria ranked well in each of about 50% of the categories noted above;
notably, Market Size (32nd
), Macroeconomic Environment (46th), Labour
Market Efficiency (52nd
), Financial Market Development (66th
), Business
Sophistication (75th
) and Goods Market Efficiency (93rd
). However, Nigeria
fell far below expectation on the other six criteria. There is no doubt that
Nigeria does not do well in many competitive rankings for two reasons.
First, there is a need for genuine improvements needed in our institutions
and bureaucracy; second, the Index does not capture many of the reforms we
have implemented in the electricity, agriculture and financial sectors and the
infrastructural advances we have made. Indeed, many of the reforms needed
in Nigeria are often impeded by vested interests who are deriving benefits
from the present situation so it is not easy but this administration has made
great headway.
For instance, in the last two years, we have made transformational changes
to the Agricultural sector, introducing the e-wallet system that reduced
leakages and created savings of up to $175m a year in subsidy to farmers.
This is a key institutional change that has also increased the number of
farmers who receive subsidized inputs from 11% to about 94% of the
farmers, and further increased the interest of investors in the sector.
The reforms in the electricity sector are well known. In this sector, we are
carrying out both institutional and infrastructural reforms. The generation
and distribution companies have been privatized, bring about a much needed
institutional change as we set about improving power generation and supply
to Nigerian citizens. The Transmission Company of Nigeria remains in
Government hands and in continuing the reforms of the sector, the
Government has raised funding for transmission infrastructure
improvements. $135m of the $1bn Eurobond raised in June 2013 has
already been provided to the Transmission Company for its near-term
infrastructure upgrades. Other funds are being readied for the Transmission
Company for medium-to long-term upgrades so that as the privatized
26
generations companies produce power, the Transmission Company is able to
wheel the power to Nigerian citizens.
The Federal Government has also made strident efforts at expanding and
diversifying the Nigerian economy and focusing additional attention on the
non-oil sector. The Federal Government has introduced measures to bring
more people and entities into the tax net, improve tax collection including
collecting additional non-oil tax revenue of N75bn. This involves the
redrafting of existing tax laws in an easily understood language, thus
reducing the cost of compliance. The FIRS is also reviewing the
introduction of technology that would enable tax –payers file tax returns
online. These initiatives will go a long way to improving Nigeria’s global
competitiveness.
27
7. ''For the first time in Nigeria’s 53rd year history, we have
successfully privatized the electric power industry,’’ so said the
President at a recent meeting in London with some foreign
investors. As minister of finance should you agree that the recent
privatization of the country's power infrastructure is worth
celebrating as a major economic achievement in 2013, when in
reality there is little or nothing to show as an improvement in the
country power supply? Also why our rush to wholesale
privatization of the power sector when countries like South
Africa, generating as high as 42,000MW still have their power
sector mostly in public hands?
The recent privatization of the country’s power infrastructure is indeed
worth celebrating as a major economic achievement in 2013. Given the
challenges of the power sector in the last three decades, the importance of
power to our economic development, and the inability of past governments
to adequately fund investments in the sector or to manage it, it makes sense
to privatise the sector and allow the sector to be run in a business-like
manner with strong oversight by the Nigerian Electricity Regulatory
Commission.
It is worth noting that similar arguments were made against privatisation and
liberalization of the telecoms sector in 2000, but now the results are self-
evident. Nigeria had 600,321 landlines for a privileged few in 2001. Now
100 million GSM lines are in operation. Young Nigerians are now accessing
the internet on their hand-held phones. If the Government had accepted the
argument then that telecoms privatization and liberalization could not be
done, our young people would today be locked out of the global information
network.
Privatisation is not an end in of itself, it is a means to an end – getting better
management for a sector vital to our economy. Following the successful
privatization, there is a transition period of handover where performance will
slacken off. Following that, the private sector is expected to make the
requisite investments and upgrades which have been lacking for the last 20
years. The results of these investments will obviously take a while to show.
28
Having said that, some positive results are already being experienced in
different parts of the country while those experiencing a downturn will soon
be corrected.
South Africa has strong institutions built in an earlier time with stronger
governance systems. As such, in South Africa, the power sector investments
and upgrades have been consistent and widespread over the last several
decades; and it is the effect of these investments over the years that has
resulted in South Africa reaching 42000 MW at this time. Nigerian
institutions were weak and corrupt and unable to manage the power system.
With the privatization, the country is bravely admitting that it will not
continue to make the same mistakes it made over the past decades and will
take a step in a new direction.
Finally, the present administration did not make the decision to privatize – it
was long decided that the government could not manage the power sector
and had indeed failed to do so over three (3) decades. This administration
had the singular achievement of actually implementing the plans started
three (3) administrations ago.
29
8. What was your reaction to the November 12, 2013 statement credited to
the World Bank Country Director for Nigeria, Marie-Francoise Marie-Nelly,
who said that over 100 million Nigerians are today living in absolute
destitution, representing an unheard-of 8.33 percent of the world’s total
number of people living in destitution?
We must begin by noting that the World Bank Country Director, Marie-
Francoise Marie-Nelly, never used the phrase “absolute destitution” in
describing low-income households in Nigeria. Destitution refers to an
extreme form of poverty and is defined as the inability to meet subsistence
needs, a complete lack of assets, and a state of social exclusion. The World
Bank has recently clarified that they did not use the word “destitution”
during their November 2013 policy seminar; and this was a term which was
wrongly used by a journalist who reported the story.
On our part, our reaction to this news was one of determination that as few
Nigerians as possible should live in poverty; that poverty is not an
acceptable condition for any Nigerian to live in and that we must work
harder to transform our economy so that poverty becomes a thing of the past.
The truth is that though our economy has been growing, inequality has
increased over time as well – as has been the case in many fast-growing
economies – and many people are being left behind2. Whether it is 100
people or 100 million, no Nigerian should be left behind. So the Government
will continue to work to improve the welfare of low-income households
across the country. There are two principal ways to do this:
o First, to create jobs for the unemployed and those entering the
labor force each year to ensure that people are able to find jobs
to work themselves out of poverty.
o Second, we can also create safety nets programs to provide a
cushion for the vulnerable. The Government has started some 2 For example, we know that the Gini coefficient, which measures income inequality, has increased in many fast-
growing economies. The higher the Gini coefficient, the greater the level of income inequality. Today, the Gini coefficient in developed countries (OECD) is about 31, compared with higher levels in emerging economies such as for China (42), Nigeria (49), Brazil (55), and South Africa (63).
30
safety net programs using funds from the SURE-P programme.
In addition, the World Bank is assisting with the design of a
comprehensive safety net program for Nigeria – to commence
in February 2014. Today, we already have conditional cash
transfer programs in operation in 8 States; and also have
various community-driven development programs that are
working.
That being said, we also need to bring up some methodological issues in
poverty measurement that Nigerians may not be aware of. A number of
years ago, Nigeria’s National Bureau of Statistics adopted a methodology for
assessing poverty that was not the international standard, and this introduced
an upward bias in Nigeria’s poverty numbers. According to the Food and
Agriculture Organization (FAO) of the United Nations, which is the main
body that sets this threshold, the average minimum food requirement per
person is about 1,680 calories per day. In view of this, FAO recommends
that countries measure their poverty line using 2,500 calories per day, and
this is the number widely used across the world for calculating poverty. This
means that persons below this threshold are counted as poor. In Nigeria,
however, the National Bureau of Statistics uses 3,000 calories per day for
computing poverty. By using this much higher number, there is a tendency
to dramatically increase the number of poor people in Nigeria. More
importantly, this anomaly makes it incorrect to compare Nigeria’s poverty
rate with those of other countries.
For example, food poverty is measured in terms of a household’s access to a
minimum amount of food per day, with the internationally accepted standard
stipulated at 2,500 calories per day. Using this measure yields a poverty rate
of about 41 percent in 2010. Absolute poverty is measured in terms of a
household’s access to a minimum amount of money for shelter, clothing,
food, and other essential incidentals. The internationally recommended
threshold is US$1.25 per day, which translates into about N200 per day (or
N6,000 per month). This approach yields a poverty rate of about 56.5
percent in 2010. Note that given our population estimates in 2010, none of
these measures translate into 100 million Nigerians.
31
No one denies that poverty is an issue in this country. In fact, it is on the
basis of this recognition that the Administration of President Goodluck
Jonathan, from the onset, has been working very hard to address it. This
administration has focused on critical reforms in all key sectors of the
economy. For example, the reforms in the agricultural sector have created
much more transparency in the distribution of fertilizers to farmers, and
established an E-Wallet system of input delivery to farmers, have continued
to support strong growth of over 4 percent in the sector. In recognition of the
fact that growth in the Agricultural Sector is pro-poor, we are confident that
the consistent growth being recorded in agriculture will translate into
poverty reduction in the short to medium term.
Indeed, Nigeria was recently honoured for meeting the Millennium
Development Goal (MDG) of reducing people living in absolute hunger by
half well ahead of the 2015 target set by the United Nations. On average,
about 20 percent of the Subsidy Reinvestment Programme (SURE-P) is
allocated exclusively to protecting the poor through different types of social
safety nets. One important area of success is the Conditional Grant Scheme
with total conditional cash transfer to almost 40,000 households and
recruitment of over 2,000 new health workers working on improving
maternal and child health. Also by February 2013, almost 120,000 Nigerians
were benefitting from the Public Works, Women and Youth Employment
Programme.
32
9. Nigerians are increasingly perplexed that these days nothing
happens without government borrowing. And for most Nigerians,
it is frightening how those managing the economy are just
dragging us into excessively unproductive debts. More worrisome
is the fact that every effort is being made to hide the details of the
country's debt stock from Nigerians. Where are the facts that the
country's current high rate of borrowing is productive, let alone
have the ability to be repaid without having to resort to more
borrowings?
This question is in direct contradiction to Question 5 earlier which seems to
urge Nigeria to borrow more.
On the statement that nothing happens without Government borrowing, it is
important to state that this government supports a very prudent approach to
debt. In the first instance, all borrowings, external and domestic, undertaken
by the Federal Government have the prior approval of the National
Assembly through the Medium-Term External Borrowing Programme and
the annual Appropriation Acts in line with the provisions of the Constitution.
The claim that “every attempt is being made to hide the debt stock from
Nigerians” is a false allegation, and it must be emphasized that there has not
been any attempt whatsoever to hide the details of the country’s debt stock
from Nigerians. Nigeria’s debt statistics are one of the most transparent in
the world, and the Debt Management Office (DMO) was recently
acknowledged by the UK’s Department for International Development
(DfID), as one of the best in Africa. The DMO updates and publishes the
public debt stock on a quarterly basis on its website (www.dmo.gov.ng)
which is easily available and accessible. The DMO also produces its Annual
Reports and Statement of Account, which is published on the website and
widely circulated in print to all relevant stakeholders, including the National
Assembly and indeed the House Committee on Finance rightly quoted from
the Annual Reports and Statement of Account for 2012 under its question
11.
33
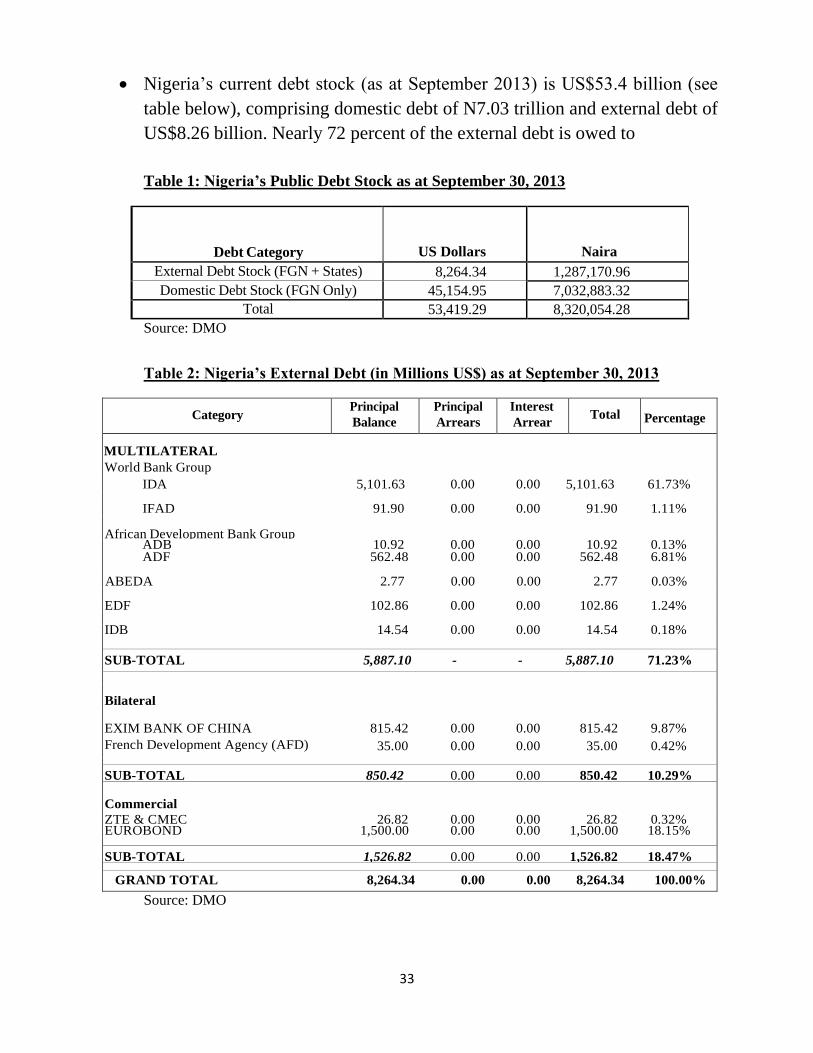
Nigeria’s current debt stock (as at September 2013) is US$53.4 billion (see
table below), comprising domestic debt of N7.03 trillion and external debt of
US$8.26 billion. Nearly 72 percent of the external debt is owed to
Table 1: Nigeria’s Public Debt Stock as at September 30, 2013
Debt Category
US Dollars
Naira
External Debt Stock (FGN + States) 8,264.34 1,287,170.96
Domestic Debt Stock (FGN Only) 45,154.95 7,032,883.32
Total 53,419.29 8,320,054.28
Source: DMO
Table 2: Nigeria’s External Debt (in Millions US$) as at September 30, 2013
Category Principal
Balance
1
Principal
Arrears
2
Interest
Arrear
s 3
Total
Percentage
MULTILATERAL
World Bank Group
IDA 5,101.63 0.00 0.00 5,101.63 61.73%
IFAD 91.90 0.00 0.00 91.90 1.11% African Development Bank Group
ADB 10.92 0.00 0.00 10.92 0.13% ADF 562.48 0.00 0.00 562.48 6.81%
ABEDA 2.77 0.00 0.00 2.77 0.03% EDF 102.86 0.00 0.00 102.86 1.24% IDB 14.54 0.00 0.00 14.54 0.18%
SUB-TOTAL 5,887.10 - - 5,887.10 71.23%
Bilateral EXIM BANK OF CHINA 815.42 0.00 0.00 815.42 9.87%
French Development Agency (AFD) 35.00 0.00 0.00 35.00 0.42%
SUB-TOTAL 850.42 0.00 0.00 850.42 10.29% Commercial
ZTE & CMEC 26.82 0.00 0.00 26.82 0.32% EUROBOND 1,500.00 0.00 0.00 1,500.00 18.15% SUB-TOTAL 1,526.82 0.00 0.00 1,526.82 18.47%
GRAND TOTAL 8,264.34 0.00 0.00 8,264.34 100.00%
Source: DMO
34
multilaterals (e.g. the World Bank Group), 10.3 percent is owed to bilaterals
(France and China), while the remainder of 18.5 percent is owed to the
international private sector.
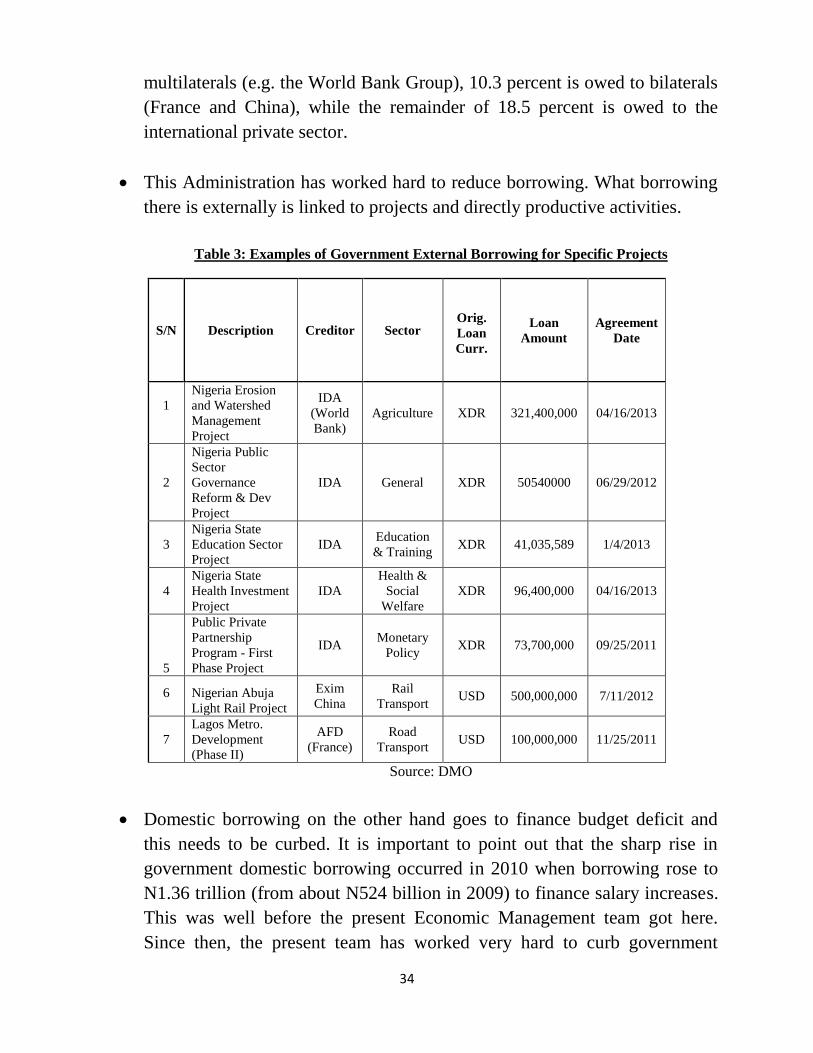
This Administration has worked hard to reduce borrowing. What borrowing
there is externally is linked to projects and directly productive activities.
Table 3: Examples of Government External Borrowing for Specific Projects
S/N Description Creditor Sector
Orig.
Loan
Curr.
Loan
Amount
Agreement
Date
1
Nigeria Erosion
and Watershed
Management
Project
IDA
(World
Bank)
Agriculture XDR 321,400,000 04/16/2013
2
Nigeria Public
Sector
Governance
Reform & Dev
Project
IDA General XDR 50540000 06/29/2012
3
Nigeria State
Education Sector
Project
IDA Education
& Training XDR 41,035,589 1/4/2013
4
Nigeria State
Health Investment
Project
IDA
Health &
Social
Welfare
XDR 96,400,000 04/16/2013
5
Public Private
Partnership
Program - First
Phase Project
IDA Monetary
Policy XDR 73,700,000 09/25/2011
6
Nigerian Abuja
Light Rail Project
Exim
China
Rail
Transport USD 500,000,000 7/11/2012
7
Lagos Metro.
Development
(Phase II)
AFD
(France)
Road
Transport USD 100,000,000 11/25/2011
Source: DMO
Domestic borrowing on the other hand goes to finance budget deficit and
this needs to be curbed. It is important to point out that the sharp rise in
government domestic borrowing occurred in 2010 when borrowing rose to
N1.36 trillion (from about N524 billion in 2009) to finance salary increases.
This was well before the present Economic Management team got here.
Since then, the present team has worked very hard to curb government
35
borrowing and the result is clear for everyone to see. Government borrowing
is reducing i.e. N852 billion in 2011, N744 billion in 2012, N588 billion in
2013, and N572 billion in the proposed 2014 budget. So statements
suggesting high rates of borrowing by the current government are fallacious.
On the issue of ability to repay the country’s debt, I wish to remind the
House Committee on Finance that the DMO, in conjunction with the Federal
Ministry of Finance, National Planning Commission, Central Bank of
Nigeria, Office of the Accountant General of the Federation, Budget Office
of the Federation and the National Bureau of Statistics, has been conducting
Debt Sustainability Analysis (DSA) for the country on annual basis since
2005. The key policy objectives of the exercise are to analyze the country’s
current and future debt portfolio with a view to assessing its debt
sustainability, detecting any potential risk and advising on mitigating
measures, as well as to provide guidance to the Government in its borrowing
decisions in order to ensure that financing needs and future repayment
ability are taken into account.
36
10. Is prudence in our borrowing simply reduction in borrowing or
simply constructive borrowing with government putting
necessary measures in place to ensure that domestic debt profile
is properly supervised and utilized by curbing corruption?
Prudence in borrowing has two aspects. The first is that government must and
is reducing borrowing to assure a situation in which our country never
becomes a debt slave ever again. In Nigeria, we are successfully managing
this aspect using reliable technical tools, including the annual Debt
Sustainability Analysis (DSA) exercise. The second aspect is that borrowing
must also go to productive purposes, and a lot of progress is being made
starting from the development and use of the Borrowing Guidelines, which are
used to shut-off borrowing proposals that would not clearly contribute to
macro-social objectives. In addition, the DMO routinely carries out analysis of
our debt profile, and with the Department of International Economic Relations
(DIER) in the Federal Ministry of Finance, supervises the use of funds.
37
11. From Debt Management Office (DMO) 2012 Annual Report, the
total public debt outstanding between 2008 and 2012 for
external stock rose from $3.72bn to $6.53bn, while domestic
stock rose from $17.68bn to $41.97bn. The total debt service the
same period saw the percentage of external debt service
drastically reduced from 11.46 per cent to 5.96 per cent while
the percentage of domestic debt servicing grew from 88.54 per
cent in 2008 to 94.04 per cent in 2012, drastically increasing the
cost of the total debt service since the cost of domestic
borrowing is atrociously higher than the cost of external
borrowing. How could your debt sustainability analysis
rationalize this without seeing some narrow interests being the
overriding reason? Could this be the explanation why
commercial banks in the country are declaring unheard-of three
digit profits and the high Foreign Portfolio Investment and low
Foreign Direct Investment?
We thank you for referring to the DMO Annual Report which is publicly and
transparently available contrary to assertions in Question 9. With respect to
the growth in domestic debt stock between 2008 and 2012, it is pertinent to
mention that this growth is not as a result of Government’s borrowings in the
last two or three years, but the accumulation and consistent growth of
domestic debt stock over the last few years. The rise in domestic debt stock
is directly attributable to the growth in the annual fiscal deficits, which grew
explosively between 2007 and 2012.
During this period, the Government’s expenditure, especially recurrent
expenditure, expanded as civil servants, doctors, and others demanded a
large wage increase from the government and got it. Governments ran large
deficits and borrowed to pay for this. In particular, a significant contributor
to this trend is the increase of about 53.7% in the wage bill in 2010 for all
categories of federal employees, including political appointees and elected
officials. It is very clear that the rapid growth in the domestic debt stock
mirrors the trend in huge fiscal deficits in the annual budgets as
appropriated.
38
It is also pertinent to emphasize that the relative size and structure of the
external and domestic debt and the rising trend of domestic debt have been
as approved by the National Assembly. Growth in the domestic debt
reflected objective policy realities as articulated both by the executive and
legislature and have nothing to do with satisfying “some undefined narrow
interest”. It would be recalled that after the exit from the Paris and London
Club debts, there was a strategic imperative to develop the domestic debt
market for a number of benefits:
i. To establish an alternative source of funding for Government to avoid
compelling dependence on only external sources.
ii. To develop a complete capital market; the existence of a developed
equities segment of the capital market without a corresponding debt
segment meant that the market was standing on one leg and such a
market cannot be the basis for the development of a regional or
continental financial hub. Sovereign bond issuance based on sovereign
domestic borrowing is in itself an objective worth pursuing to be able to
develop a benchmark yield curve, which the private sector would need
to rely on to issue their own long-term debt instruments to raise funds to
develop the real sector and infrastructure projects.
In summary, here is no hidden interest or agenda behind the ratios of
domestic and foreign debt. Following the Paris Club debt relief, Nigerians
had shown an aversion to borrowing externally. As a result, the domestic
debt market was developed as part of developing the domestic capital market
and providing an alternative avenue of financing. It is always a delicate
balancing act deciding between domestic and foreign debt. The recent debt
strategy suggests curtailing borrowing and rebalancing a bit toward external
debt, given lower costs.
39
12. It is an established fact that the willingness and ability to borrow
do not automatically translate into economic growth. If you
agree with this fact, how productive are the country's recent
borrowings?
As noted earlier, external borrowings are all tied to specific projects located
in various States in the country. Domestic borrowing is based on
predetermined funding gaps in the national budget, which were
appropriated by the National Assembly. It is pertinent to note that even for
domestic borrowing the proceeds are used to fund the package of projects
and programmes (with their capital and recurrent components) in the annual
budgets, which through its Appropriation Acts, the National Assembly
would have endorsed as being appropriate for growth, development and
poverty reduction. Examples of these include capital projects like the Abuja
Light Rail Project for US$500m, and government programmes like the
State Education Project for XDR41.05m. In this sense, the answer as to
whether the borrowing has been productive would be in the affirmative.

40
13. Why should our internal debts continue to represent more than
two-thirds of Nigeria's external debt profile, when the cost of
servicing domestic debts is ridiculously far more expensive than
servicing external debts? Why should government continue to
borrow internally when in so doing results in insufficient funds,
skyrockets the cost of borrowing and above all, crowds out the
real sector from the money market? Shouldn't the high cost of
domestic borrowing override whatever are the assumed
benefits? Since both London Interbank Offer Rates (LIBOR)
and the US Treasury Bonds rates offer far better interest rates
for sovereign borrowings, why have we continued not to take
advantage of cheaper interest rates?
The strategic objectives for domestic borrowing and the benefits have
been discussed under question 11. It is obvious that at least in the
short to medium-term, to achieve those objectives and realize the
benefits thereof, the cost of domestic borrowing has to be taken more
or less as given. However, in the medium to long-term, having
achieved the strategic objectives summarized in the establishment of a
globally recognized domestic bond market, it becomes optimal to try
to maximize benefits of lower cost of external funding. It is important
to note that this administration remains concerned about domestic
borrowing and the high debt service to revenue ratio which stands at
almost 19% now.
As a result, as part of our new debt strategy, we not only reduced the
flow of domestic borrowing, but we also retired N75 billion in
maturing bonds for the first time in a decade of Nigeria’s intervention
in the bond market. We also established a sinking fund into which
funds will be put each year towards retirement of bonds which mature
in the future.
Further, over the past three years, Government has started reducing
domestic borrowing as part of its fiscal consolidation programme (see
our response in Question 9). A certain amount of external borrowing
directed at specific infrastructure projects will continue to help fill the
gap in financing.
41
14. Your references to the country's economic growth profile have
always been based on Fitch, Standard and Poor's, and Moody’s
ratings. Are you aware that these same rating agencies are being
sued in New York (with case # 652410/2013) by two Bear
Stearns hedge funds for fraudulently assigning inflated ratings
to securities in the run-up to the 2008 financial crisis? If you do,
why do you insist on accepting the rating as reliable.
Our references on the external assessments of the Nigerian economy have
included reviews from the African Development Bank, the World Bank,
the UN Economic Commission for Africa, the International Monetary
Fund, Goldman Sachs JP Morgan as well as the international rating
agencies above. Most of these institutions have independently assessed
Nigeria’s economic performance favorably.
Regarding the international rating agencies, these institutions provide a
useful service in capital markets by providing information on the credit
worthiness of both corporate organizations and sovereign institutions. The
three main credit rating agencies – namely Moody’s Investor Service,
Standard & Poor’s, and Fitch Ratings – collectively account for about
95% of the international ratings markets.
We are aware that following the recent financial crises, international
credit agencies have been criticized for some of their assessments which
understated the risks involved with various structured finance products,
such as mortgage-backed securities. US regulators have introduced
various remedial measures to guard against conflicts of interest which
may lead to similar optimistic assessments in the future.
However, the performance of international rating agencies in evaluating
“Sovereigns” (such as, for sovereign nations, municipalities or local
governments) has remained more conservative. Across the globe, their
ratings are still used to assess the creditworthiness of various sovereign
42
authorities. Indeed, in recent years, there have been downgrades of the
major advanced economies (such as the USA) following prolonged fiscal
crises. In this regard, Nigeria’s credit rating of BB- with a stable outlook
is a positive vote of confidence in the management of our economy. The
assessments of these rating agencies should therefore be seen in a positive
light.

43
15. How much exactly has been the amount of money lost in government
revenue as a result of import duty waivers in 2011, 2012 and 2013?
Provide the names and beneficiaries and justification for same. In your
opinion as the minister of finance who oversees the economy, what are the
implications to the country's economy? What efforts have you have made
to stop this waiver policy, which is distorting the economy? Our non oil
income has dropped in 2013. A case where increased tariffs on various
items effectively reduced importation to zero in some sectors. However,
those items now find their way into Nigeria through our borders. Does it
make any sense to increase these tariffs when we have such porous
borders? As an example, officially, Togo imported more rice this year
than Nigeria.
As a large and important country in Africa, Nigeria has the objective of
producing most of its goods domestically so it can be more self-reliant and
reduce its dependence on imports. As in other emerging and advanced
economies – such as South Korea, Malaysia and China – fiscal policy
incentives can serve as one of the instruments to support our industrial
policy. These policy measures are also partly intended to serve as incentives
to support our private sector given some of the regulatory challenges faced
in the domestic business environment (see Question #6)
These policies include reduced import duty rates or waivers for equipment
and materials for the hospitality, power and aviation sectors; for agricultural
machinery; for solid mineral equipment; for gas-using equipment; for the
steel sector; for specific manufacturing sub-sectors (e.g. for imports of
completely-knocked down parts) and for automobiles and tires3. There are
also additional programs such as the Export Expansion Grants (EEG)
Scheme designed to promote Nigeria’s non-oil exports. These sectors are
seen as strategic areas which can stimulate growth, support diversification of
the Nigerian economy, and create jobs for Nigerians.
In the past, waivers were granted to individual businesses in an approach
that resulted in rent-seeking behaviors and an uneven playing field for other
businesses. It was precisely the need to stop such a discretionary approach
that led to reforms by the Economic Management Team under the leadership
3 Legally, the Federal Ministry of Finance processes and issues Import Duty Exemption Certificates based on
existing statutes and guiding principles. These include, but not limited to Schedule 2 of the Customs and Excise
Tariff (Consolidation) Act: 1995 – 2001, Common External Tariff: 2008-2012 (as extended); the Customs and
Excise Tariff etc. Act No. 16, 1997; and the Finance Miscellaneous Act 39 of 1990 which permit various categories
of exemptions.
44
of President Goodluck Ebele Jonathan. A sector-wide waiver policy was
introduced to provide specific incentives for some strategic, job-creating
sectors. Under this regime, all businesses in a sector have access to the same
incentives. In addition, some waivers and exemptions make up for gaps in
our economy; for example waivers to bring in vehicles for sporting events
and conferences. Nigeria has no car leasing businesses capable of servicing
such events as in advanced countries. In the past, Government dealt with this
by having a fleet of cars. However, these were scrapped some time ago. To
fill this gap, waivers are given to institutions hosting an event to arrange for
imports of such cars with local dealers. Abuse of this system as recently
observed is reprehensible; and stronger monitoring of these waivers is being
put in place. Over time, the private sector would need to step in to invest in
this leasing sector.
The introduction of these policies will have impacts on tariff revenue
collection. Thus a trade-off has to be made between our short-term revenue
collection, and our long-term industrial development. We have to weigh the
balance between collecting customs revenues today, versus providing
incentives to our private sector to stimulate growth and job creation.
Smuggling remains a scourge, and must be tackled. It is true that some fiscal
policies, such as for rice, while leading to greater production has also
resulted in smuggling. Efforts are under way with the Minister of
Agriculture to correct this. Mr. President has instructed the Nigeria Customs
Service and the Nigeria Immigration Service to modify their tactics and to
work closely with our neighboring countries to combat these leakages.
It is important to mention that with the strengthening of the exemptions and
waiver policy, President Goodluck Jonathan gave his support a month ago
for us to begin publishing these waivers to enhance the transparency of our
processes. These list of waivers are now published in the media by the
Federal Ministry of Finance and are available online on the website of the
Budget Office of the Federation.
As requested, a summary of recent import waivers and their fiscal
implications for the period 2011-2013 is provided below.
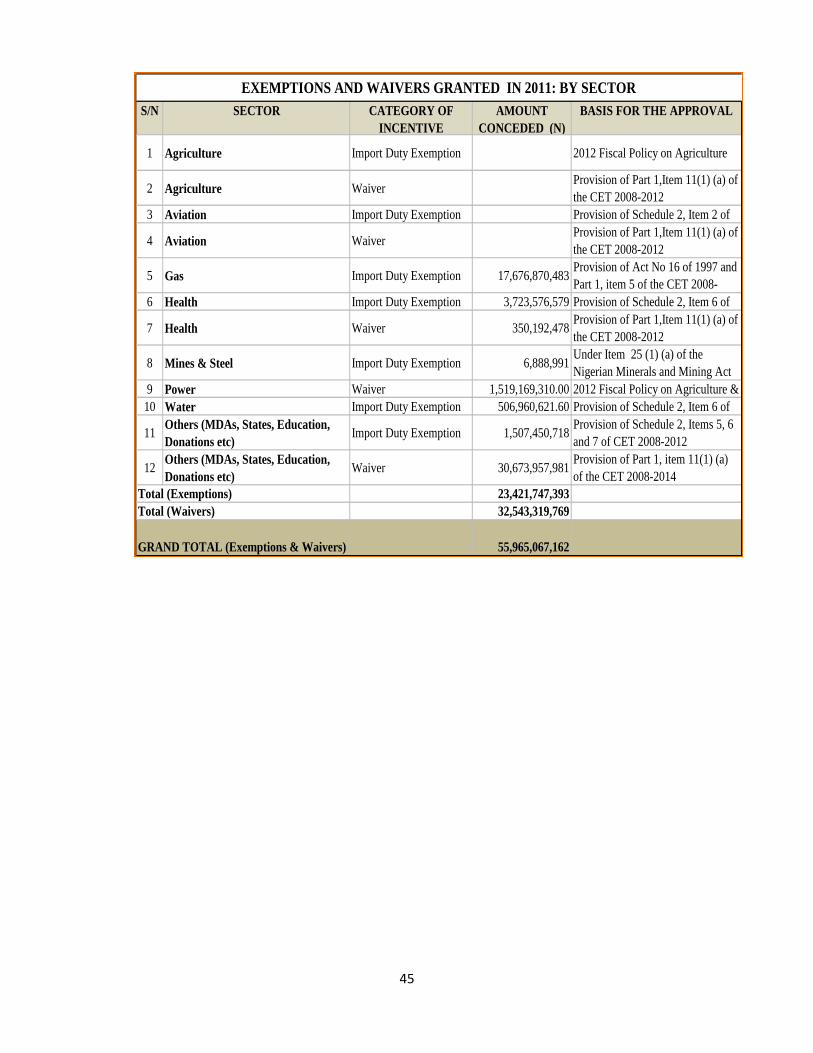
45
S/N SECTOR CATEGORY OF
INCENTIVE
AMOUNT
CONCEDED (N)
BASIS FOR THE APPROVAL
1 Agriculture Import Duty Exemption 2012 Fiscal Policy on Agriculture
2 Agriculture WaiverProvision of Part 1,Item 11(1) (a) of
the CET 2008-2012
3 Aviation Import Duty Exemption Provision of Schedule 2, Item 2 of
CET 2008-20124 Aviation Waiver
Provision of Part 1,Item 11(1) (a) of
the CET 2008-2012
5 Gas Import Duty Exemption 17,676,870,483Provision of Act No 16 of 1997 and
Part 1, item 5 of the CET 2008-
2012 as extended6 Health Import Duty Exemption 3,723,576,579 Provision of Schedule 2, Item 6 of
CET 2008-20127 Health Waiver 350,192,478
Provision of Part 1,Item 11(1) (a) of
the CET 2008-2012
8 Mines & Steel Import Duty Exemption 6,888,991Under Item 25 (1) (a) of the
Nigerian Minerals and Mining Act
of 20079 Power Waiver 1,519,169,310.00 2012 Fiscal Policy on Agriculture &
Power10 Water Import Duty Exemption 506,960,621.60 Provision of Schedule 2, Item 6 of
CET 2008-201211
Others (MDAs, States, Education,
Donations etc)Import Duty Exemption 1,507,450,718
Provision of Schedule 2, Items 5, 6
and 7 of CET 2008-2012
12Others (MDAs, States, Education,
Donations etc)Waiver 30,673,957,981
Provision of Part 1, item 11(1) (a)
of the CET 2008-2014
Total (Exemptions) 23,421,747,393
Total (Waivers) 32,543,319,769
GRAND TOTAL (Exemptions & Waivers) 55,965,067,162
EXEMPTIONS AND WAIVERS GRANTED IN 2011: BY SECTOR

46
S/N SECTOR CATEGORY OF
INCENTIVE
AMOUNT CONCEDED
(N)
BASIS FOR THE APPROVAL
1 Agriculture Import Duty Exemption 1,377,163,934.66 2012 Fiscal Policy on Agriculture
2 Agriculture Waiver 814,253,129.66Provision of Part 1,Item 11(1) (a) of the CET
2008-2012
3 Aviation Import Duty Exemption 3,942,929Provision of Schedule 2, Item 2 of CET 2008-
2012
4 Aviation Waiver 1,576,933,193Provision of Part 1,Item 11(1) (a) of the CET
2008-2012
5 Gas Import Duty Exemption 18,301,768,464Provision of Act No 16 of 1997 and Part 1, item
5 of the CET 2008-2012 as extended
6 Health Import Duty Exemption 5,922,340,105Provision of Schedule 2, Item 6 of CET 2008-
2012
7 Health Waiver 46,100,350Provision of Part 1,Item 11(1) (a) of the CET
2008-2012
8 Mines & Steel Import Duty Exemption 36,604,000Under Item 25 (1) (a) of the Nigerian Minerals
and Mining Act of 2007
9 Power Import Duty Exemption 2,889,034,007.83 2012 Fiscal Policy on Agriculture & Power
10 Water Import Duty Exemption 96,449,818.50Provision of Schedule 2, Item 6 of CET 2008-
2012
11Others (MDAs, States,
Education, Donations etc)Import Duty Exemption 18,161,928,499
Provision of Schedule 2, Items 5, 6 and 7 of
CET 2008-2012
12Others (MDAs, States,
Education, Donations etc)Waiver 6,118,738,414
Provision of Part 1, item 11(1) (a) of the CET
2008-2014
Total (Exemptions) 46,789,231,759
Total (Waivers) 8,556,025,086
GRAND TOTAL (Exemptions & Waivers) 55,345,256,845
EXEMPTIONS AND WAIVERS GRANTED IN 2012: BY SECTOR
S/N SECTOR CATEGORY OF
INCENTIVE
AMOUNT
CONCEDED (N)
BASIS FOR THE APPROVAL
1 Agriculture Import Duty Exemption 2,089,851,099.54 2012 Fiscal Policy on Agriculture
2 Agriculture Waiver 1,369,628,301.28Provision of Part 1,Item 11(1) (a) of the
CET 2008-2012
3 Aviation Import Duty Exemption 63,121,558Provision of Schedule 2, Item 2 of CET
2008-2012
4 Aviation Waiver 2,390,661,886Provision of Part 1,Item 11(1) (a) of the
CET 2008-2012
5 Gas Import Duty Exemption 13,031,680,572Provision of Act No 16 of 1997 and Part
1, item 5 of the CET 2008-2012 as
6 Health Import Duty Exemption 12,380,119,901Provision of Schedule 2, Item 6 of CET
2008-2012
7 Health WaiverProvision of Part 1,Item 11(1) (a) of the
CET 2008-2012
8 Mines & Steel Import Duty Exemption 595,431,737Under Item 25 (1) (a) of the Nigerian
Minerals and Mining Act of 2007
9 Power Import Duty Exemption 4,368,774,980.002012 Fiscal Policy on Agriculture &
Power
10 Water Import Duty Exemption 457,340,918.29Provision of Schedule 2, Item 6 of CET
2008-2012
11Others (MDAs, States,
Education, Donations etc)Import Duty Exemption 333,029,695
Provision of Schedule 2, Items 5, 6 and 7
of CET 2008-2012
12Others (MDAs, States,
Education, Donations etc)Waiver 22,337,113,681
Provision of Part 1, item 11(1) (a) of the
CET 2008-2014
Total (Exemptions) 33,319,350,461
Total (Waivers) 26,097,403,868
GRAND TOTAL (Exemptions & Waivers) 59,416,754,329
EXEMPTIONS AND WAIVERS GRANTED IN 2013: BY SECTOR
47
16. It was reported that the FIRS is to engage foreign consultants for tax
collection in 2014. Could the Minister clarify this position and what
Nigeria stands to gain? Have the FIRS not been working effectively?
Nigeria’s tax revenue to GDP ratio of 7% is low in comparison with other
emerging economies and other middle-income African countries. The
average tax revenue to GDP ratio for most emerging economies and
middle-income African countries is between 20-30%. While FIRS has been
successful in increasing tax revenues in recent years, there is scope for
further improvement. Nigeria needs to improve its tax revenue
performance especially for non-oil tax revenues as a means of diversifying
our revenue base.
As the economy also diversifies it is important to have a better tax
administration. To do this, FIRS sought advice on what other countries
such as Angola and South Africa had recently done to increase their tax
revenues. It turned out that McKinsey & Co had conducted analyses of tax
issues of these economies and recommended specific initiatives. FIRS
subsequently engaged the services of McKinsey to conduct a tax diagnostic
for Nigeria, and assist in plugging tax leakages.
Specific interventions to be introduced include: improving audits,
enforcement of tax filing, review of tax holidays and exemptions,
collection of tax arrears/debt enforcement, increased registration of
companies, tax drives to improve compliance by evasive businesses and
improved external communication. Overall, it is anticipated that this
initiative will increase non-oil tax revenues significantly.
The McKinsey team is only providing temporary assistance and capacity-
building to support FIRS over the next 12-18 months. Following their
intervention, FIRS can implement the new approaches as done in
comparator middle-income countries.
48
17. Do you really believe that Nigeria needs a 'Sovereign Wealth
Fund' at this critical juncture of budgetary deficits, and having
to be borrowing extensively in an effort to address government
revenue gaps? Shouldn't the presence of Nigerian Sovereign
Investment Authority (NSIA) simply mean spreading
government's scarce resources thinly? Why will you insist that
no matter what we still need to operate a sovereign wealth fund?
Sincerely speaking, how sustainable are the objectives of
Nigeria's Sovereign Wealth Fund, particularly in the long-term?
This question asks for reasons why resource-dependent countries establish
sovereign wealth funds. This is an important question, which has been
discussed by policy-makers all over the world. In the case of Nigeria, this
topic has already been well established as we shall show below.
Below, we provide a brief discussion on why resource-dependent countries
establish Sovereign Wealth Funds; and subsequently also provide some
information on the objectives of Nigeria’s Sovereign Wealth Fund.
There are 2 main reasons why commodity exporting countries create
sovereign wealth funds.
o First, because commodity prices are volatile, and so we must
put aside savings to ensure smooth and stable budget revenues
in the future.
o Second, because natural resources are depleting assets, and so
some resource revenues must be preserved for future
generations.
Volatility of commodity prices. Because commodity prices are volatile,
they generate fluctuations in resource revenues which are transmitted into
the economy through the national budgets. If natural resource revenues
are a substantial share of government revenues, the external volatility can
result in significant fluctuations in public expenditures. This leads to a
pro-cyclical fiscal policy where government spending on projects increase
during the boom times, and crashes when resource revenues collapse.
The fluctuations in expenditures result in macroeconomic volatility, which
creates uncertainty for businesses, and reduces economic growth. In fact,
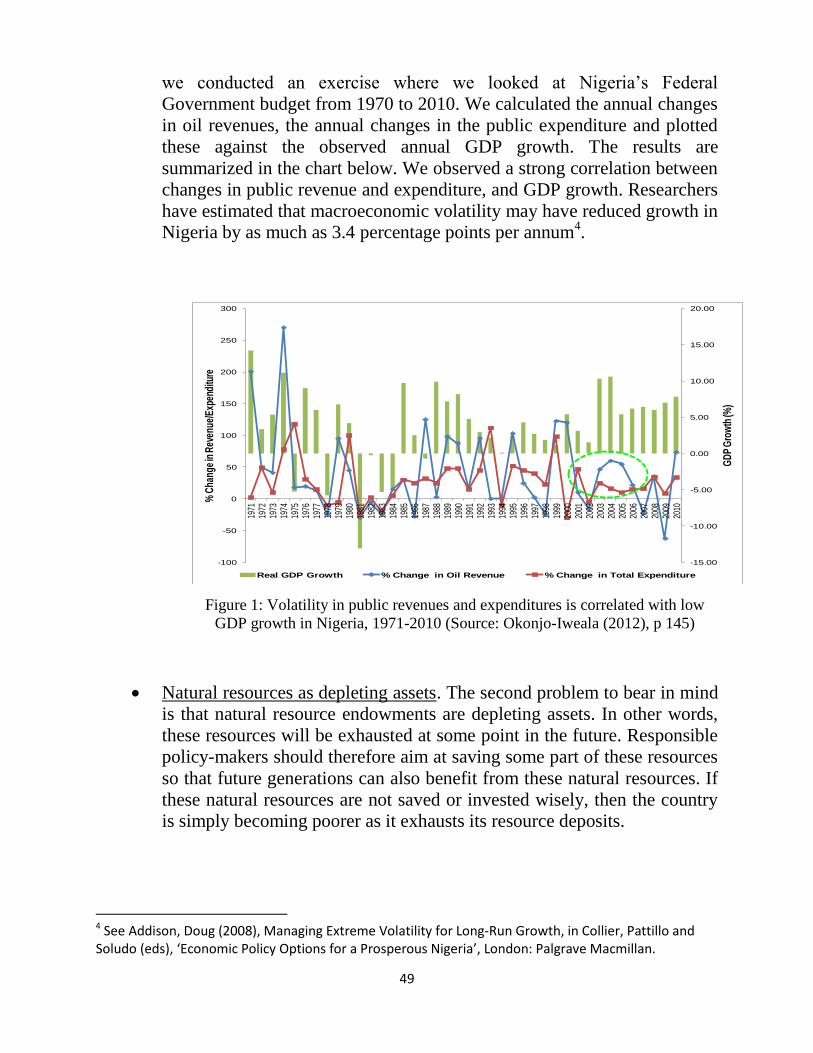
49
we conducted an exercise where we looked at Nigeria’s Federal
Government budget from 1970 to 2010. We calculated the annual changes
in oil revenues, the annual changes in the public expenditure and plotted
these against the observed annual GDP growth. The results are
summarized in the chart below. We observed a strong correlation between
changes in public revenue and expenditure, and GDP growth. Researchers
have estimated that macroeconomic volatility may have reduced growth in
Nigeria by as much as 3.4 percentage points per annum4.
Figure 1: Volatility in public revenues and expenditures is correlated with low
GDP growth in Nigeria, 1971-2010 (Source: Okonjo-Iweala (2012), p 145)
Natural resources as depleting assets. The second problem to bear in mind
is that natural resource endowments are depleting assets. In other words,
these resources will be exhausted at some point in the future. Responsible
policy-makers should therefore aim at saving some part of these resources
so that future generations can also benefit from these natural resources. If
these natural resources are not saved or invested wisely, then the country
is simply becoming poorer as it exhausts its resource deposits.
4 See Addison, Doug (2008), Managing Extreme Volatility for Long-Run Growth, in Collier, Pattillo and Soludo (eds), ‘Economic Policy Options for a Prosperous Nigeria’, London: Palgrave Macmillan.
-15.00
-10.00
-5.00
0.00
5.00
10.00
15.00
20.00
-100
-50
0
50
100
150
200
250
300
1971
1972
1973
1974
1975
1976
1977
1978
1979
1980
1981
1982
1983
1984
1985
1986
1987
1988
1989
1990
1991
1992
1993
1994
1995
1996
1997
1998
1999
2000
2001
2002
2003
2004
2005
2006
2007
2008
2009
2010
GD
P G
row
th (%
)
% C
hang
e in
Rev
enue
/Exp
endi
ture
Real GDP Growth % Change in Oil Revenue % Change in Total Expenditure
50
For Nigeria, in the past, income from natural resources supported wasteful
public expenditures and led to the accumulation of debt. In the 1980s and
1990s we accumulated substantial financial liabilities in the form of
external debts to the Paris Club and London Club creditors. Indeed, by
2002 – after 45 years of oil production – Nigeria had accumulated total
external debts of about $40.5 billion (or about 87.9 per cent of GDP). This
was comprised of $31.0 billion in external debt and the equivalent of $9.5
billion of domestic debts. The high costs of servicing these debts strained
government fiscal resources, until our successful Paris Club Debt deal in
2005.
The Excess Crude Account
Because of the problems above, in 2003, the government adopted an oil-
price based fiscal rule. Under this rule, government revenues earned above
a reference benchmark oil price are saved in a common account (‘the
Excess Crude Account’) for all tiers of government. The adoption of this
rule has solved two problems: first it reduced the macroeconomic
volatility which previously plagued the Nigerian economy, and second,
increasing public savings in the Excess Crude Account.
The government has been able to gradually increase savings to cushion
external declines in oil revenues. For example, in 2008, at the peak of the
global financial crises, oil prices crashed from about $147 to $38 per
barrel in 4-months, and Nigeria turned to savings in its Excess Crude
Account to plug the revenue gap in its budget and administer a fiscal
stimulus to sustain economic growth. This Excess Crude Account has
formed the basis of our Sovereign Wealth Fund.
The Sovereign Wealth Fund
Today, Nigeria has a Sovereign Wealth Fund which began with an initial
capitalization of $1 billion. This is a good beginning, but still very small
when compared with the funds of other countries such as:
o Abu Dhabi (UAE): $795 billion
o Norway Government Pension Fund: $664 billion
o SAFE Investment Company (China): $600 billion
51
o Temasek Holdings (Singapore): $158 billion
o National Welfare Fund (Russia): $150 billion
o Future Fund (Australia): $83 billion
o Kazakhstan National Fund: $65 billion
o Libya Investment Authority: $65 billion
o Khazanah Nasional (Malaysia): $34 billion
o State Oil Fund (Azerbaijan): $33 billion
Most countries started with small funds, but consistently invested in these
funds over time. Abu Dhabi launched its Fund in 1976 with $50 million,
today they are at $795 billion. Norway began in 1996 with $300 million,
and today has a fund in excess of $650 billion.
In Africa, many resource exporters have also launched their Funds.
Angola now has a sovereign wealth fund which began with $5 billion.
Ghana has launched the Ghana Heritage Fund (for its future generations)
and the Ghana Stabilization Fund. Other African commodity exporters,
such as Gabon, Zambia and Mozambique are also launching their Funds.
Most of these countries are even less developed and poorer than Nigeria.
Yet their citizens have seen it fit to save. Should Nigeria not provide an
example and a leadership role for African countries in this regards?
52
18. You should agree that a lot of Nigerians are interested in the link
between NSIA and the government. Since there is no doubt that
Nigerian Sovereign Investment Authority is an agent of
government — or is it not? The question is: How should we
think about the management structure in so far as major
decisions are concerned? Where is the line between NSIA, as a
commercially minded entity, and the government, especially
given government's policy of having no business doing business?
If, for example, government does not get involved in specific
investments, then, who appoints the external managers involved
in managing some parts of the NSIA funds?
To answer these questions we refer to the NSIA Establishment Act of 2011, duly
approved by the National Assembly:
1. According to the Act s.2 (1) The NSIA is an independent body corporate
set up by an Act of the National Assembly. The Act also provides that in
s.1(4) Except as otherwise provided in this Act, the Authority shall be
independent in the discharge of its functions and shall not be subject to
the direction or control of any other person or authority.
2. Management Structure. The Board of the NSIA is responsible for the
management structure and delegates to the management team. The Board
is set up along the following lines by the NSIA Establishment Act. In
Section 15, 16 of the NSIA establishment Act. The Members of the
Board with their qualifications are listed in Table 1 below.
3. In addition, there is a Governing Council which provides advice and
counsel to the Board. It is comprised of the President (who can delegate
to Mr. Vice President), the Governors of the 36 States of the Federation
and FCT Minister, the Minister of Finance, the Attorney General of the
Federation, the Governor of the Central Bank, the Minister of National
Planning, the Chief Economic Adviser to the President, and the Chairman
of the Revenue Mobilization, Allocation and Fiscal Commission. See
http://nsia.com.ng/governing-council/ for more information on the
Governance of the NSIA.
4. The NSIA is a commercially minded entity for the following reasons: In
Sections 4(2), it is clearly stated that the NSIA is expected to generate a
profit. And to buttress that point, they are expected to pay for their
expenses from the revenue generated.
53
5. The Appointment of External Managers is decided by the Board of the
NSIA, as is supported by the NSIA Establishment Act. S.6 (1) and s.6
(2).
Table 1: NSIA BOARD MEMBERS
CHAIRMAN
Alhaji Mahey Rasheed (OFR), Chairman of the Board
Chairman, Legacy Pension; former Deputy Governor, Central Bank of Nigeria; Board
Member, First Bank
Wealth of experience gained from sitting on the boards of over 20 companies on
behalf of NNDC, CBN and the Federal Government of Nigeria
MPA, Public Policy, Harvard University (Edward Mason Fellow); BSc, Economics,
Ahmadu Bello University-Zaria
EXECUTIVE DIRECTORS
Mr. Uche Orji, Managing Director & Chief Executive Officer
Former Managing Director UBS AG; Managing Director, J.P. Morgan & Co.;
Executive Director and equity portfolio manager at Goldman Sachs Asset
Management
Previously worked with Diamond Bank Plc. and Arthur Andersen Nigeria
MBA, Harvard Business School; BSc in Chemical Engineering, University of Port
Harcourt
Mrs. Stella Ojekwe-Onyejeli, Executive Director & Chief Risk Officer
Former Director & Head of Operational Risk & Control, Barclays Bank, Emerging
Markets and Africa
Previously worked as Vice President & Head of Quality Assurance Africa, Citibank;
Senior Manager, Arthur Andersen Nigeria; KPMG in South Africa and Nigeria
MBA, Cranfield School of Management, UK; BSc, Chemistry, University of Lagos.
Qualified Chartered Financial and Tax Accountant
Mr. Hanspeter Ackermann (CFA), Executive Director & Chief Investment Officer
Former Chief Investment Officer, Head of Asset Management & Assistant General
Manager, Samba Capital in Riyadh, Arabia

54
Co-founder, Principal of Monteverdi International Management LLC; Managing
Director, Deutsche Bank Investment Management Inc.; President & Managing Partner
of Eiger Asset Management; CIO & Senior Portfolio Manager, Swiss Bank
Corporation (UBS)
B.S., Business Administration, Handelsschule Kaufmaennischer Verein in Basel,
Switzerland. Mr. Ackermann is also a Chartered Financial Analyst (CFA)
NON-EXECUTIVE DIRECTORS
Mr. Jide Zeitlin, Chair of Investment Committee
Retired Partner, Goldman Sachs & Company; Chairman & CEO of the Keffi Group
Chairman Emeritus, Amherst College; Board Member, Affiliated Managers Group,
Inc. Board Member, Coach, Inc.
MBA, Harvard Business School; A.B., Economics & English, Amherst College
Mr. Arnold Ekpe, Chair of Risk Committee
Retired Group CEO & Executive Director of Ecobank Transnational Incorporated
Former MD/CEO, UBA; previously established and headed Citibank’s Structured &
Corporate Finance business in Sub-Sahara-Africa; Partner, African Capital Alliance
MBA, Manchester Business School; BSc, Mechanical Engineering, Manchester
University
Mrs. Ibukun Awosika
Founder & Chief Executive Officer, Chair Centre, Sokoa Chair Centre Limited and
TCC Security Systems
Chairman, FBN Capital; Board Member, First Bank
MBA from IESE Business School, Barcelona, Spain; BSc, Chemistry, University of
Ife (Obafemi Awolowo University)
Barrister Olabisi Soyebo (SAN)
Partner, Abdullahi Ibrahim & Co., Head of Abuja Office
LL.B (Hons) in Law, University of Buckingham, Buckingham, England; BA
Sociology, College of St. Elizabeth, New Jersey, USA
Admitted to the Inner Bar as a Senior Advocate of Nigeria (SAN), Securities and
Exchange Commission (SEC) approved capital market consultant. Member of the
Chartered Institute of Arbitration (UK)
55
Alhaji Hassan Usman
Managing Director & Chief Executive Officer, ASO Savings & Loans Plc.
Former Executive Director (Investments), Abuja Investment & Property Development
Company Ltd.; Deputy Director, Bureau of Public Enterprises (BPE)
Previously worked with Citibank Nigeria, Arthur Andersen UK, and Central Bank of
Nigeria
M.Phil, Development Economics, University of Cambridge; BA, Economics,
University of Sussex. Associate of the Institute of Chartered Accountants in England
& Wales
56
19. Who determines the investment objective and who establishes
the risk parameter for the NSIA's portfolio? In providing
answer to this question, it is also important to understand and
explain why NSIA recently hired a Swiss national as its chief
portfolio investor? Answering this question is important since it
should help us to know who determines the maximum draw-
down that the government would be comfortable with in
extremely negative market environments.
The Board of the NSIA determines the Objective and establishes the Risk
parameters. These policies have been reviewed by the NSIA Board and
they have spent most of the past year putting several of these policies in
place.
Please note that the Board of the NSIA has both a Risk Committee and an
Investment Committee. Their charters are available online on the NSIA
website - www.nsia.com.ng. The Chief Investment Officer and the Chief
Risk Officer both report to the Board and their respective committees and
both investment and Risk decisions are made by the Board.
The Board of NSIA sets acceptable boundaries for portfolio volatility and
draw-down criteria embedded in the investment policy statements which
guide the investment decision making. In times of extremely negative
market environments or extra-ordinary conditions, the Board through its
Investment and Risk Committees will determine the maximum
drawdown acceptable and specific associated actions in consultation with
the Minister of Finance and Governing Council.
As with the appointment of the MD/CEO and the Chief Risk Officer, the
appointment of Mr. Hanspeter Ackermann as Chief Investment Officer
was based on a competitive process that was open to all nationalities
including Nigerians. In following with the NSIA Act, this process was
led by the Executive Nomination Committee (ENC), which is composed
of six Nigerians with integrity, independence, proven qualification and
tested market experience from the six geo-political zones of the country.
He came out tops on this basis and we want the best people to work in the
in NSIA to generate the best returns for Nigerians. Most sovereign wealth
funds and large institutional investors go for the best CIOs, regardless of
nationality.
For the records, the amount in the stabilization fund is the $200m or 20%
of the Fund under management by the NSIA. The law requires that a
minimum of 20% be put in each of the three funds, with the balance
distributed according to need. The NSIA Board therefore allocated funds
57
as follows: 20% in Stabilization Fund, 40% in Infrastructure Fund and
40% in future generations fund.
According to the Act, only the Stabilisation Fund is available for
drawdown. The disbursement process is as follows: The determination of
drawdown is made by the Minister depending on the needs of the
Federation. The funds in the Stabilisation Fund are in liquid assets with
daily liquidity. Upon request from the Minister, the NSIA will execute a
drawdown request with the asset managers, who will execute the trades
and make the funds available almost immediately. Please note that these
trades are settled maximum three days after they are executed. The funds
are then made available to the Ministry of Finance within 2-5 working
days.
58
20. What should be your explanations for awarding MasterCard a
multimillion dollar National Identity Smart Cards, when there are
indigenous ICT companies that not only have what it takes but would
have done it cheaper and create local jobs at the same time?
Having discussed with the National Identity Management Commission
(NIMC), the following were deduced:
i. MasterCard will not, and has not been awarded a contract to produce
the National Identity Smart Card for Nigeria. Mastercard just adds an
e-payment platform to the identity card making it a smart financial
card. The Card is not on the shelf, and from market intelligence
reports, no Nigerian company manufactures the Card. It is therefore
difficult to understand how the House Committee arrived at a cheaper
price.
ii. Three Nigerian companies (Auspoint Ltd; E-PayPlus Ltd; and Telnet
Nigeria Ltd) with foreign partners were recently cleared by BPP and
approved by FEC to produce the Cards.
iii. At present, in view of the set standard, MasterCard presents the best
financial platform for the project. Though Verve Card earlier rejected
the same project in 2010 claiming it was not profitable, they have now
reapplied to participate.
59
21. Have you taken into considerations how foreign company could
use such information available to it to invade the privacy of
Nigerians?
The NIMC posits that:
MasterCard has no access to the National Identity database. Only
Nigerian companies are involved in the account set up and transaction
processing involving the MasterCard payment platform.
Besides, only a portion of the personal information of the individual is
securely stored on the ‘chip’ (e-ID and e-PKI) of the National Identity
(smart) Card, with a ‘Back end’ managed in Nigeria by NIMC, the only
such Card PKI facility in Nigeria. This is similar to the technology
presently being used for the production of ATM Cards in Nigeria by
our Banks.
60
22. What are reasons for SURE-P to give preference to Chevrolet
cars for SURE-P taxis, when it is known that not only are such
cars very expensive to maintain compared with Asian and
European cars, but also are also not fuel efficient and not
durable on our roads?
The FGN SURE–P has allocated money only for on–lending to registered
transport operators, who typically buy buses. The Infrastructure Bank
(TIB) is the intermediary through which such funds have been provided.
Please be reminded that States and FCT also have their own SURE-P
schemes and we do not know if any of them patronize the vehicle brands
referred to. You may therefore wish to direct this question directly to the
various States and the FCTA.
61
23. Honorable Minister of Finance, you will agree that SURE-P is
very important to the people of this country, taking into
cognizance that it is the only thing they stand to gain from the
increase on petroleum product pump prices almost 2 years ago.
Who is in charge of the management of SURE-P and who takes
responsibility for its successes and failures?
A Presidential Committee (Board) of Twenty-One (21) members under the
Chairmanship of Dr. Christopher Kolade, who recently resigned, was
inaugurated by Mr. President in February 2012 to manage SURE – P funds
meant for specific infrastructural projects and social safety net
programmes. The SURE – P Board designated the Director General
Budget Office of the Federation as its Accounting Officer. The Presidential
Committee (Board) works with the Project Implementation Units (PIUs) in
the relevant MDAs to implement the SURE -Programmes. The areas
selected for SURE–P intervention are as follows:
Infrastructure development projects: such as construction and
maintenance of roads, bridges, and railways.
Social safety net programmes:
o Community service, women and youth empowerment programme
(including the Graduate Internship Scheme)
o Maternal and Child Health Program
o Mass Transit program
o Public Works (including FERMA)
o Vocational Training
o Culture and Tourism
The responsibility for the success or failure of the SURE Programme is
ultimately the Government’s, but primarily on the MDAs implementing
it and on other stakeholders mentioned earlier.
A recent update on the activities and achievements of the SURE-P
program is provided online at: http://www.sure-p.gov.ng/main/.
62
24. You will agree that inasmuch as the interest rate regime is
critical to the real sector borrowing decisions, most principal
factor in making borrowing decisions is the business's expected
rate of return on investing borrowed money? The question,
without efforts to protect local businesses from their foreign
counterparts, the high cost of doing business in Nigeria, puts
them at such a disadvantaged position that it makes no
economic sense borrowing to invest in their local businesses,
why should we expect private sector firms to be investing in the
economy?
Nigeria has a very vibrant economy and one of the most versatile set of
investors and entrepreneurs. The plain truth is that the Nigerian economy
offers one of the highest rates of return on investment, and this is the
reason why we are the largest investment destination in Africa. Despite
the impediments and the difficulties, many Nigerian businesses are still
investing in the economy, and it is their activity that is driving economic
growth.
We have 32 million SMEs in the country. That being said, SMEs face
difficult challenges of which the cost of borrowing is an important one.
That is why, in the short term, SMEs have enjoyed several intervention
funds including the latest N200 billion at the Central Bank.
Nevertheless, the government is working to bring down the high cost of
borrowing in the long term. The Federal Government is working to
reduce government borrowing so as not to crowd out the private sector,
and put inflation in check in order to help reduce short-term interest rates.
Measures such as the power sector reform would also help to reduce
operating costs for banks, and this will lower banks interest rate margins.
Finally, the Federal Government is working to establish a wholesale
development finance institution which will provide long-term finance at
affordable rates to Nigerian businesses.
63
25. You are quoted as saying, '' Very soon, the US would become a
net exporter of oil…So, it would be disingenuous for anyone to
say that just because the price of oil has hovered at around $100
per barrel, it cannot crash…Lest we forget, as recently as 2008,
oil prices crashed from a peak of $147 per barrel to $35 per
barrel in a space of months triggered by the global financial
crisis. Is the minority leader saying he has forgotten that?” This
forces one to wonder from which source should the US become
that net exporter of oil, given that the US daily oil consumption
was 18.7 million barrels with (10.6 million of which was
imported daily) in 2012? Or, should it be from the shale oil
which the International Energy Agency (IEA) demonstrates to
be at two million barrels daily? In other words, given the IEA
global oil price trajectory, can’t we agree that “There are many
constraints on supply keeping pace with demand’’ which means
that within this decade, oil prices should always hover around
$125 per barrel? Answering this question will help us
understand why you insist on benchmarking the oil price for the
2014 appropriation at below $79 per barrel? In answering this
question, would you also agree that as the global economy shifts
from West to Asia, so will the appetite for global oil
consumption shift from the West to Asia? As crude oil continues
to sell at $100-$110, how low will production have to fall for us
to record a net loss or at what production level can we break
even at a 2013 benchmark of $79.
This question basically raises three concerns:
a. Is the US projected to become a net exporter of oil?
b. Will crude oil demand in Asia fully compensate for increased
global supplies?
c. What are the future projections for oil prices, and how does that
affect the setting of the oil benchmark price in the Federal Budget.
64
a. Is the US projected to become a net exporter of oil?
o The US is taking measures to become self-reliant in crude oil, and
indeed to become a net exporter. This policy direction was clearly
articulated in President Obama’s re-election speech on 7th
November
2012, when he stated clearly that:
[In] the coming weeks and months, I am looking forward to
reaching and working with leaders of both parties to meet the
challenges we can only solve together – reducing our deficit,
reforming our tax code, fixing our immigration system, [and]
freeing ourselves from foreign oil.
o This vision is already being realized. The International Energy
Agency (IEA), the authoritative information source on global energy
markets, issued their 2012 World Economic Outlook (WEO) report
which stated that the US is set to overtake Saudi Arabia as the largest
oil-producing nation by 2017. The report also notes that the United
States will increase its oil and gas output and become a net exporter of
natural gas by 2020, and become self-sufficient in energy by 2035.
o The impact of the growing US production is already being noticed in
Nigeria. In fact, Nigeria’s exports to the US have declined from
318,069 barrels per day in 2008 to about 148,340 barrels per day in
2012.
b. Will crude oil demand in Asia fully compensate for increased global
supplies?
o Many oil analysts and economists are uncertain if demand in Asia is
likely to compensate for increased global supplies. For example, on
10th January 2014, the Financial Times published an important article
with the headline, “Slowing China crude imports to challenge
exporters”5.
5 This article may be viewed online at: http://www.ft.com/intl/cms/s/0/99a210a0-79af-11e3-b381-
00144feabdc0.html#axzz2qH1loLSz
65
o The basic gist of their analyses is that, based on China’s Customs
Data, Chinese oil imports had slowed down, and this “posed a
challenge to exporters from the Middle East to Africa who are
competing to sell more oil into the world’s second-largest economy”.
o With such an uncertain outlook from Asia’s largest economy, Nigeria
will need to plan prudently, cautiously and conservatively. We cannot
simply hope – wishfully – that increased demand will provide a
guaranteed market for our exports in the future.
c. What are the future projections for oil prices, and how does that affect the
setting of the oil benchmark price in the Federal Budget?
o We know that commodity markets in general, and oil markets in
particular, are volatile and unpredictable. The historical pattern of oil
prices also shows that they are susceptible to huge shocks, which are
often persistent. For this reason, forecasts and predictions about oil
markets must be assessed with great caution.
o The factors which currently drive the global commodity markets are
both fundamental and speculative, and these factors create
uncertainties in the markets. Even OPEC captured this view succinctly
in its 2013 World Oil Outlook Report that:
[Uncertainties] that surround the medium to long-term energy
future stem from many drivers, such as the world economy,
policies, technology and consumer choices.
There are many possible external factors which leads us to remain
conservative on our outlook for the future of world oil prices – for
example, the apparent thawing of relations between the US and Iran,
increased oil output from North America, discoveries of new oil
deposits in many African countries, and so on.
66
26. Do you agree that the Excess Crude Account as being operated by
government is illegal and unconstitutional, especially given how it has
been managed?
The Attorney-General of the Federation is the person best placed to
respond as to issues of illegality and unconstitutionality.
However, in our view, it is an indisputable fact that Section 162 (1) of the
1999 Constitution provides that ‘The Federation shall maintain a special
account to be called "the Federation Account" into which shall be paid all
revenues collected by the Government of the Federation, except the
proceeds from the personal income tax of the personnel of the armed
forces of the Federation, the Nigeria Police Force, the Ministry or
department of government charged with responsibility for Foreign
Affairs and the residents of the Federal Capital Territory, Abuja’.
In the same vein, Section 16 (1a) of the 1999 Constitution states that ‘The
State shall…harness the resources of the nation and promote national
prosperity and an efficient, a dynamic and self-reliant economy’. In
2003, the idea of creating the Excess Crude Account as a buffer for the
economy was based on this need to manage the economy in an efficient
and effective manner.
Furthermore, Nigeria’s oil earnings have been managed in line with the
provisions of the Fiscal Responsibility Act 2007 which empower the
Federal Government to prudently manage the nation’s resources and
ensure long-term macro-economic stability. Specifically, Section 35
subsection (1) of the Act stipulates that ‘Where the reference commodity
price rises above the predetermined level, the resulting excess proceeds
shall be saved...’.
Therefore, if the Federal Government set up the ECA without prejudice
to Section 162 (1) of the 1999 Constitution, the question then is, whether
this initiative has been beneficial to Nigeria? For the following reasons,
the answer is definitely yes:
i. First, Nigeria was able to withstand the negative impact of the global
economic and financial crises on the oil markets when oil prices
crashed from $147 per barrel to less than $40 per barrel, within a 4-
month period in 2008. In the absence of the ECA, Nigeria would
have financed its deficits by borrowing from international creditors
(such as the IMF or the World Bank) on very unfavourable terms.
Indeed, during the recent financial crises, Nigeria was one of the few
countries that did not seek budgetary support from multilateral
67
institutions. Developed and emerging economies – such as Ireland,
Hungary, Greece and Portugal – which lacked adequate fiscal buffers
had to request for external assistance. The ECA was an instrumental
fiscal buffer which enabled to Nigeria to withstand the 2008 financial
crisis and hold its head high with pride.
ii. Second, during periods of revenue shortfall arising from oil
production disruptions due to pipelines vandalism and oil theft, the
ECA has been used to augment FAAC allocations. This has provided
a useful source of additional financing for all three tiers of
government.
In 2011, with a view to the long-term, the Federal Government, after due
consultation with the State Governments, proceeded to establish the
Nigeria Sovereign Investment Authority (the Sovereign Wealth Fund)
which was backed by an Act of the National Assembly, the Nigeria
Sovereign Investment Authority (Establishment, etc.) Act, 2011. It is
important to emphasize that the sovereign wealth fund conforms to global
best practice as most oil producing countries have similar Funds.
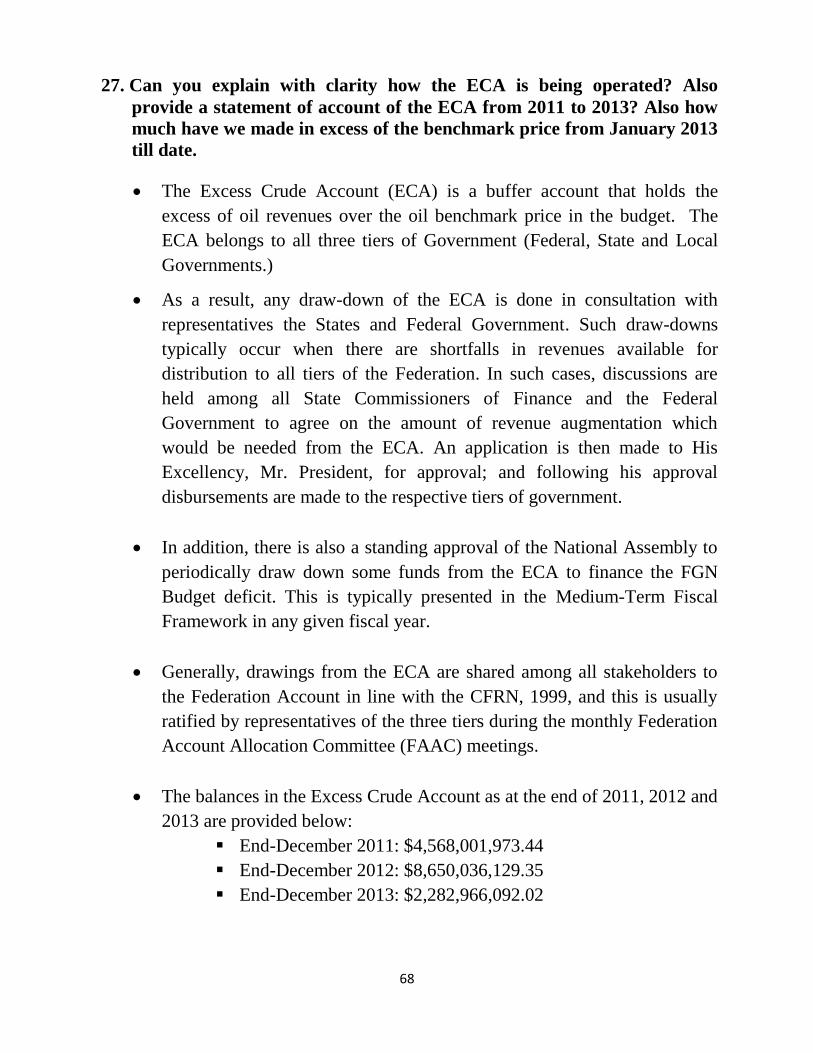
68
27. Can you explain with clarity how the ECA is being operated? Also
provide a statement of account of the ECA from 2011 to 2013? Also how
much have we made in excess of the benchmark price from January 2013
till date.
The Excess Crude Account (ECA) is a buffer account that holds the
excess of oil revenues over the oil benchmark price in the budget. The
ECA belongs to all three tiers of Government (Federal, State and Local
Governments.)
As a result, any draw-down of the ECA is done in consultation with
representatives the States and Federal Government. Such draw-downs
typically occur when there are shortfalls in revenues available for
distribution to all tiers of the Federation. In such cases, discussions are
held among all State Commissioners of Finance and the Federal
Government to agree on the amount of revenue augmentation which
would be needed from the ECA. An application is then made to His
Excellency, Mr. President, for approval; and following his approval
disbursements are made to the respective tiers of government.
In addition, there is also a standing approval of the National Assembly to
periodically draw down some funds from the ECA to finance the FGN
Budget deficit. This is typically presented in the Medium-Term Fiscal
Framework in any given fiscal year.
Generally, drawings from the ECA are shared among all stakeholders to
the Federation Account in line with the CFRN, 1999, and this is usually
ratified by representatives of the three tiers during the monthly Federation
Account Allocation Committee (FAAC) meetings.
The balances in the Excess Crude Account as at the end of 2011, 2012 and
2013 are provided below:
End-December 2011: $4,568,001,973.44
End-December 2012: $8,650,036,129.35
End-December 2013: $2,282,966,092.02
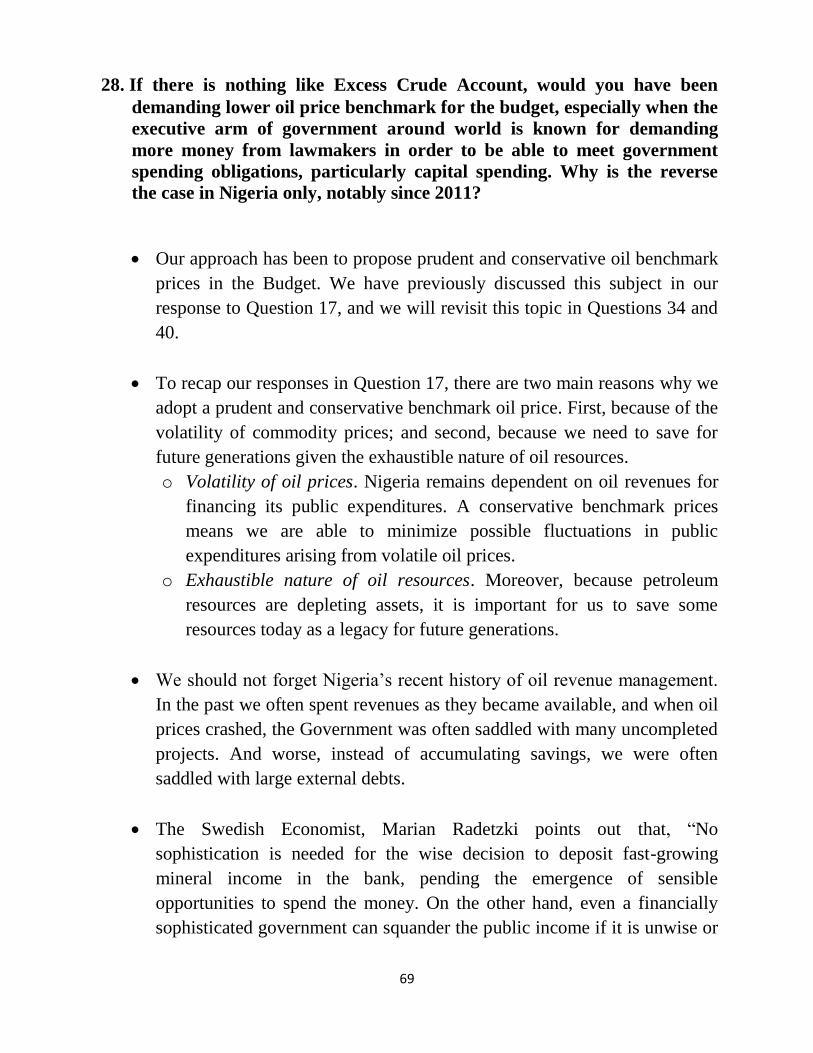
69
28. If there is nothing like Excess Crude Account, would you have been
demanding lower oil price benchmark for the budget, especially when the
executive arm of government around world is known for demanding
more money from lawmakers in order to be able to meet government
spending obligations, particularly capital spending. Why is the reverse
the case in Nigeria only, notably since 2011?
Our approach has been to propose prudent and conservative oil benchmark
prices in the Budget. We have previously discussed this subject in our
response to Question 17, and we will revisit this topic in Questions 34 and
40.
To recap our responses in Question 17, there are two main reasons why we
adopt a prudent and conservative benchmark oil price. First, because of the
volatility of commodity prices; and second, because we need to save for
future generations given the exhaustible nature of oil resources.
o Volatility of oil prices. Nigeria remains dependent on oil revenues for
financing its public expenditures. A conservative benchmark prices
means we are able to minimize possible fluctuations in public
expenditures arising from volatile oil prices.
o Exhaustible nature of oil resources. Moreover, because petroleum
resources are depleting assets, it is important for us to save some
resources today as a legacy for future generations.
We should not forget Nigeria’s recent history of oil revenue management.
In the past we often spent revenues as they became available, and when oil
prices crashed, the Government was often saddled with many uncompleted
projects. And worse, instead of accumulating savings, we were often
saddled with large external debts.
The Swedish Economist, Marian Radetzki points out that, “No
sophistication is needed for the wise decision to deposit fast-growing
mineral income in the bank, pending the emergence of sensible
opportunities to spend the money. On the other hand, even a financially
sophisticated government can squander the public income if it is unwise or
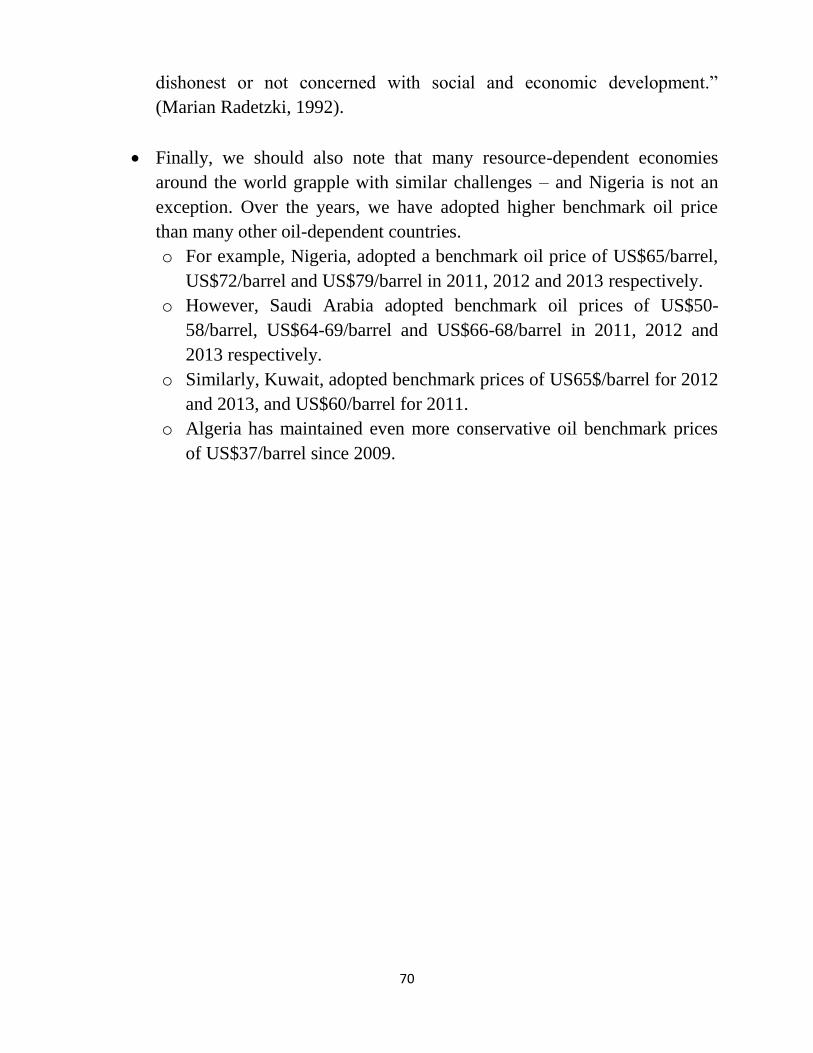
70
dishonest or not concerned with social and economic development.”
(Marian Radetzki, 1992).
Finally, we should also note that many resource-dependent economies
around the world grapple with similar challenges – and Nigeria is not an
exception. Over the years, we have adopted higher benchmark oil price
than many other oil-dependent countries.
o For example, Nigeria, adopted a benchmark oil price of US$65/barrel,
US$72/barrel and US$79/barrel in 2011, 2012 and 2013 respectively.
o However, Saudi Arabia adopted benchmark oil prices of US$50-
58/barrel, US$64-69/barrel and US$66-68/barrel in 2011, 2012 and
2013 respectively.
o Similarly, Kuwait, adopted benchmark prices of US65$/barrel for 2012
and 2013, and US$60/barrel for 2011.
o Algeria has maintained even more conservative oil benchmark prices
of US$37/barrel since 2009.
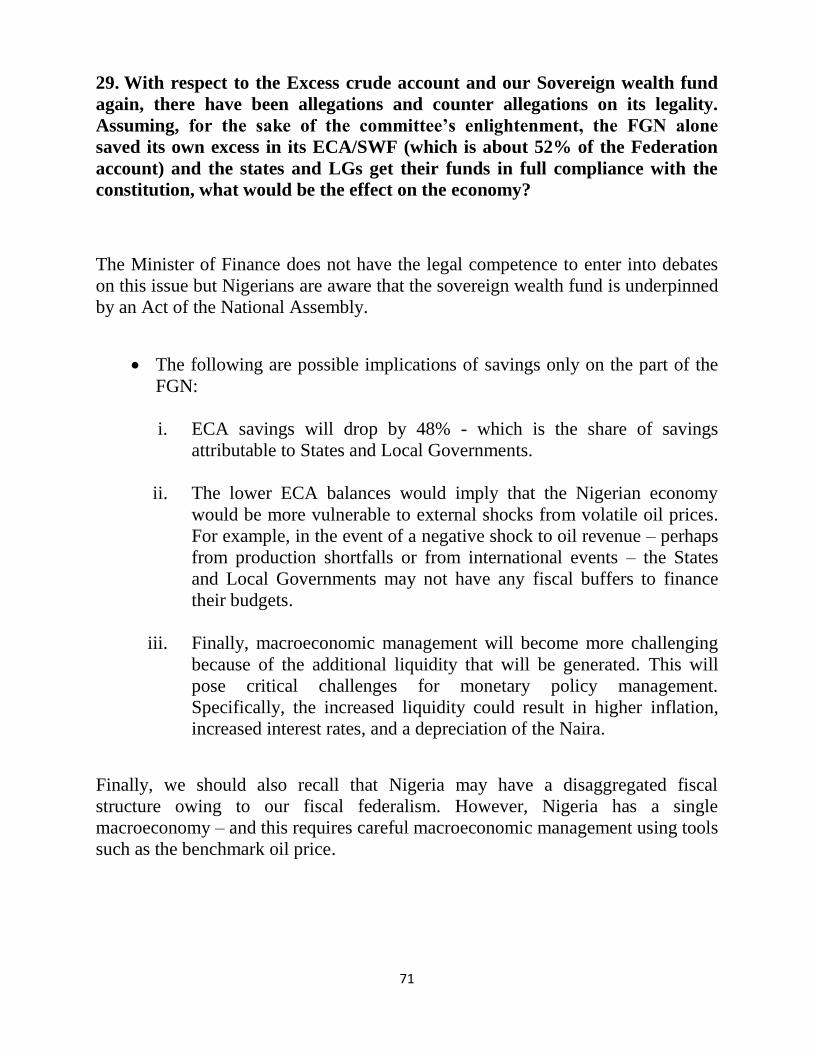
71
29. With respect to the Excess crude account and our Sovereign wealth fund
again, there have been allegations and counter allegations on its legality.
Assuming, for the sake of the committee’s enlightenment, the FGN alone
saved its own excess in its ECA/SWF (which is about 52% of the Federation
account) and the states and LGs get their funds in full compliance with the
constitution, what would be the effect on the economy?
The Minister of Finance does not have the legal competence to enter into debates
on this issue but Nigerians are aware that the sovereign wealth fund is underpinned
by an Act of the National Assembly.
The following are possible implications of savings only on the part of the
FGN:
i. ECA savings will drop by 48% - which is the share of savings
attributable to States and Local Governments.
ii. The lower ECA balances would imply that the Nigerian economy
would be more vulnerable to external shocks from volatile oil prices.
For example, in the event of a negative shock to oil revenue – perhaps
from production shortfalls or from international events – the States
and Local Governments may not have any fiscal buffers to finance
their budgets.
iii. Finally, macroeconomic management will become more challenging
because of the additional liquidity that will be generated. This will
pose critical challenges for monetary policy management.
Specifically, the increased liquidity could result in higher inflation,
increased interest rates, and a depreciation of the Naira.
Finally, we should also recall that Nigeria may have a disaggregated fiscal
structure owing to our fiscal federalism. However, Nigeria has a single
macroeconomy – and this requires careful macroeconomic management using tools
such as the benchmark oil price.
72
30. Do you believe in the fight against corruption? If you do why
has EFCC not been properly funded? Without properly funding
the commission, how should it be expected to carry out its duties
effectively?
Yes, we believe in the fight against corruption. It is worth stating briefly
here that this administration has undertaken some specific steps to tackle
corruption by implementing a number of reforms such as clean-up of the
fuel subsidy scheme; and the clean-up of pension fraud by creating the
Pension Transition Arrangement Department (PTAD). We are also
computerizing our public financial management platforms with the
introduction of the Government Integrated Financial Management
Information System (GIFMIS), Integrated Personnel and Payroll
Information System (IPPIS), and the Treasury Single Account (TSA).
Regarding the EFCC, we have supported the institution and anti-corruption
agencies within the limits of our overall budgetary constraints. Their total
budgetary allocation has grown by over 175% from N3.71 billion in 2008
to N10.22 billion in 2013.
In addition, we have reached out to the EFCC to discuss the successful
programme of recoveries that brings in income from the different arrests
and seizures. These recoveries, properly accounted for and appropriated,
could be another source of support for the EFCC. We will continue to
support the EFCC to enable it carry out its duty of fighting corruption in
the nation.
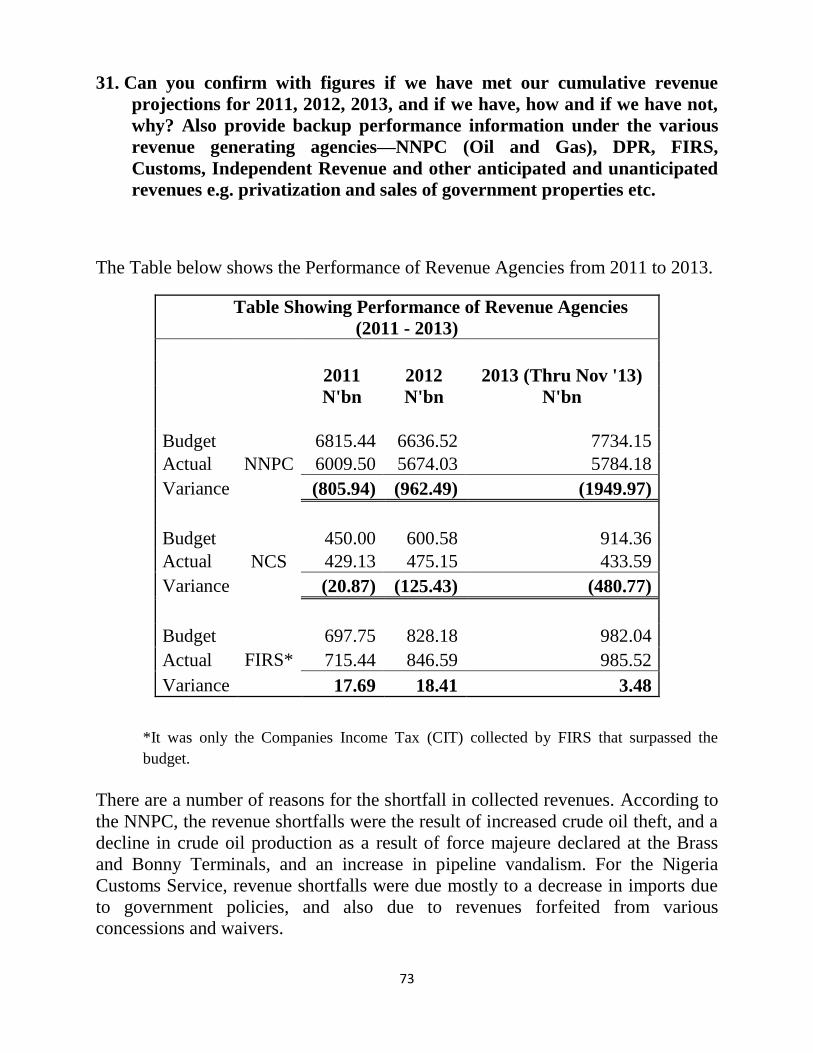
73
31. Can you confirm with figures if we have met our cumulative revenue
projections for 2011, 2012, 2013, and if we have, how and if we have not,
why? Also provide backup performance information under the various
revenue generating agencies—NNPC (Oil and Gas), DPR, FIRS,
Customs, Independent Revenue and other anticipated and unanticipated
revenues e.g. privatization and sales of government properties etc.
The Table below shows the Performance of Revenue Agencies from 2011 to 2013.
Table Showing Performance of Revenue Agencies
(2011 - 2013)
2011 2012 2013 (Thru Nov '13)
N'bn N'bn N'bn
Budget
NNPC
6815.44 6636.52 7734.15
Actual 6009.50 5674.03 5784.18
Variance (805.94) (962.49) (1949.97)
Budget
NCS
450.00 600.58 914.36
Actual 429.13 475.15 433.59
Variance (20.87) (125.43) (480.77)
Budget
FIRS*
697.75 828.18 982.04
Actual 715.44 846.59 985.52
Variance 17.69 18.41 3.48
*It was only the Companies Income Tax (CIT) collected by FIRS that surpassed the
budget.
There are a number of reasons for the shortfall in collected revenues. According to
the NNPC, the revenue shortfalls were the result of increased crude oil theft, and a
decline in crude oil production as a result of force majeure declared at the Brass
and Bonny Terminals, and an increase in pipeline vandalism. For the Nigeria
Customs Service, revenue shortfalls were due mostly to a decrease in imports due
to government policies, and also due to revenues forfeited from various
concessions and waivers.
74
32. As Minister of Finance, are you familiar and comfortable with
all the present business arrangements of the NNPC? Why were
these business arrangements excluded from the MTEF which
used to be the practice? Provide all the present business
arrangements, the parties involved, the share of each party, and
justifications for such.
The Nigerian National Petroleum Corporation (NNPC) is best suited to answer
this question about their business arrangements, and the Finance Committee of
the House of Representatives has the full competence to summon them to
discuss this question. Nevertheless, what we know is as follows:
There are four basic business arrangements through which the government
funds its stake in the oil and gas industry namely:
1. Joint Venture (JV) Cash Call arrangement by which the government funds
its equity share of JV investment. Over the years, JV cash calls have not
increased significantly in spite of higher oil prices and high cost of project
development and this underfunding has led to NNPC negotiating other
business arrangements in order to fund projects.
2. Alternative Funding (AF) arrangement which is a form of partner
financing resulting in project funding with compensation arising from the
incremental production. A variant of the Alternative Funding is the
Modified Carry Arrangement (MCA) which caps compensation to the
funding party to a specific financial internal rate of return, thereby
minimising interest cost to the government.
3. Production Sharing Contracts (PSC): In 1991, the government recognising
the high upfront cost of funding the JV, proposed a PSC for the deep
offshore. This resulted in the 1993 PSCs, the terms of which were
codified into law (Deep Offshore and Inland Basin Act of 1999). It is
interesting to note that the Deep Offshore PSCs generally offer lower
government take compared to the JV cash call system.
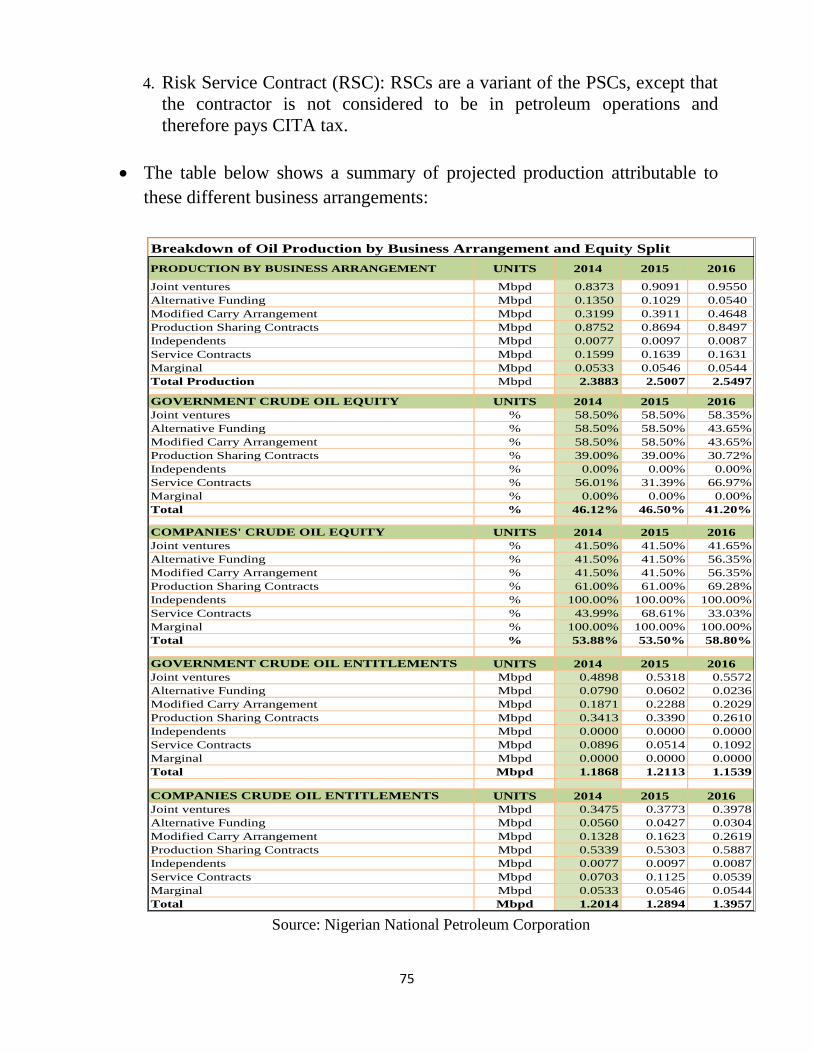
75
4. Risk Service Contract (RSC): RSCs are a variant of the PSCs, except that
the contractor is not considered to be in petroleum operations and
therefore pays CITA tax.
The table below shows a summary of projected production attributable to
these different business arrangements:
Source: Nigerian National Petroleum Corporation
PRODUCTION BY BUSINESS ARRANGEMENT UNITS 2014 2015 2016
Joint ventures Mbpd 0.8373 0.9091 0.9550
Alternative Funding Mbpd 0.1350 0.1029 0.0540
Modified Carry Arrangement Mbpd 0.3199 0.3911 0.4648
Production Sharing Contracts Mbpd 0.8752 0.8694 0.8497
Independents Mbpd 0.0077 0.0097 0.0087
Service Contracts Mbpd 0.1599 0.1639 0.1631
Marginal Mbpd 0.0533 0.0546 0.0544
Total Production Mbpd 2.3883 2.5007 2.5497
GOVERNMENT CRUDE OIL EQUITY UNITS 2014 2015 2016
Joint ventures % 58.50% 58.50% 58.35%
Alternative Funding % 58.50% 58.50% 43.65%
Modified Carry Arrangement % 58.50% 58.50% 43.65%
Production Sharing Contracts % 39.00% 39.00% 30.72%
Independents % 0.00% 0.00% 0.00%
Service Contracts % 56.01% 31.39% 66.97%
Marginal % 0.00% 0.00% 0.00%
Total % 46.12% 46.50% 41.20%
COMPANIES' CRUDE OIL EQUITY UNITS 2014 2015 2016
Joint ventures % 41.50% 41.50% 41.65%
Alternative Funding % 41.50% 41.50% 56.35%
Modified Carry Arrangement % 41.50% 41.50% 56.35%
Production Sharing Contracts % 61.00% 61.00% 69.28%
Independents % 100.00% 100.00% 100.00%
Service Contracts % 43.99% 68.61% 33.03%
Marginal % 100.00% 100.00% 100.00%
Total % 53.88% 53.50% 58.80%
GOVERNMENT CRUDE OIL ENTITLEMENTS UNITS 2014 2015 2016
Joint ventures Mbpd 0.4898 0.5318 0.5572
Alternative Funding Mbpd 0.0790 0.0602 0.0236
Modified Carry Arrangement Mbpd 0.1871 0.2288 0.2029
Production Sharing Contracts Mbpd 0.3413 0.3390 0.2610
Independents Mbpd 0.0000 0.0000 0.0000
Service Contracts Mbpd 0.0896 0.0514 0.1092
Marginal Mbpd 0.0000 0.0000 0.0000
Total Mbpd 1.1868 1.2113 1.1539
COMPANIES CRUDE OIL ENTITLEMENTS UNITS 2014 2015 2016
Joint ventures Mbpd 0.3475 0.3773 0.3978
Alternative Funding Mbpd 0.0560 0.0427 0.0304
Modified Carry Arrangement Mbpd 0.1328 0.1623 0.2619
Production Sharing Contracts Mbpd 0.5339 0.5303 0.5887
Independents Mbpd 0.0077 0.0097 0.0087
Service Contracts Mbpd 0.0703 0.1125 0.0539
Marginal Mbpd 0.0533 0.0546 0.0544
Total Mbpd 1.2014 1.2894 1.3957
Breakdown of Oil Production by Business Arrangement and Equity Split
76
As for the marginal fields and the independent producers, there is no cost
sharing between the parties and government because government does not
own equity in these entities. In some cases with the marginal fields, an
overriding royalty regime may be imposed, which of course will be subject
to payment of tax. Companies engaged in this form of business arrangement
are supposed to pay their royalty directly to Department of Petroleum
Resources (DPR) and taxes to Federal Inland Revenue Service (FIRS).
The Medium Term Revenue Framework was developed based on the
business arrangements discussed above and formed the basis of a roll up of
the revenue expectations for the period.
77
33. Provide details of government stake in NLNG. All categories of revenue
under the NLNG and total amount generated so far and evidence of
remittances.
The Nigerian National Petroleum Corporation (NNPC) serves as the Federal
Government’s representative at NLNG, and holds the Government’s 49% share
in NLNG. The Finance Committee may wish to summon the NNPC to obtain
detailed information on this subject. However, below are a few observations.
The Government’s take is often defined as the sum of revenues from
royalties and taxes. NLNG however operates as a midstream facility, and
thus the government take consists solely of taxes as there are no royalties.
Under the NLNG Act, the government granted specific incentives such as a
10-year tax holiday and 90% capital allowance after the tax holiday.
As a result of these incentives, NLNG has not been in a tax paying position
until 2014. The effect of a ten-year holiday and capital allowance always
results in an additional 5-year tax free period. In 2014, NLNG will be in a
tax paying position so we expect to see an initial tax payment by NLNG in
2014.
78
34. Why do you always prefer a lower benchmark which leaves government
with wider deficits and your attitude of no qualms with domestic
borrowings at excessively high interest rates to balance deficit as against
our position of increasing benchmark to reduce deficit which
consequently reduces domestic borrowing, that frees up funds for the real
sector of the economy, thereby bringing down the interest rate, increased
private sector investments and creating jobs.
To begin, the question is wrong and unjust to suggest that the Minister of
Finance has an “attitude of no qualms with domestic borrowings at
excessively high interest rates to balance the deficit”. The Minister of
Finance spoke strongly on the need to reduce domestic borrowing at her
Senate clearance, and has proceeded to implement a strategy in that
direction. It is unfair to now blame the person who is working to solve this
problem.
Regarding our specific policies, this Administration has introduced a
comprehensive approach to debt management in Nigeria as discussed in our
responses to Questions #9-13. It is worth re-stating that as part of our
comprehensive management of our domestic debts – for the first time in our
domestic borrowing – we paid off N75 billion of maturing debts. We have
also established a sinking fund with an initial capitalization of N25 billion
which will be used to fund maturing bond obligations in the future. Finally,
we now also have a clearer picture of our domestic debts following a
comprehensive review recently completed by the Debt Management Office.
So clearly, we take our domestic debt management very seriously.
Now to the question above on the oil price benchmark. There are a number
of trade-offs to be made in choosing the benchmark oil price and also
setting the deficit and level of domestic borrowing. Our general approach is
to take a conservative and prudent stance.
As pointed out in my response to Question 28, our choice of a lower
benchmark oil price is driven by the need to be cautious in our revenue
projections given the volatile nature of oil prices. It is easier for government
to manage the deficit gap and the implications of domestic borrowing on the
79
economy, than for us to experience a crash in oil prices with little savings. If
we experienced a crash in oil prices with little savings, we may be forced to
seek bail-out funds from the IMF and other international donors, as was the
recent case in Greece, Ireland and Portugal. We know that Nigerians have
very little appetite for that.
We also remain mindful of our level of domestic borrowing. Domestic
borrowing has declined from N852.08bn in 2011 to N744.44bn in 2012 and
to N577.07bn in 2013. For 2014, we have provisioned the sum of N571bn
as domestic borrowing despite the shortfall in revenue projections. The
fiscal deficit to GDP ratio has also declined from 2.96% to 2.85% and
1.85% in 2011, 2012 and 2013, but slightly up, to 1.9%, in the 2014 Budget
proposal.
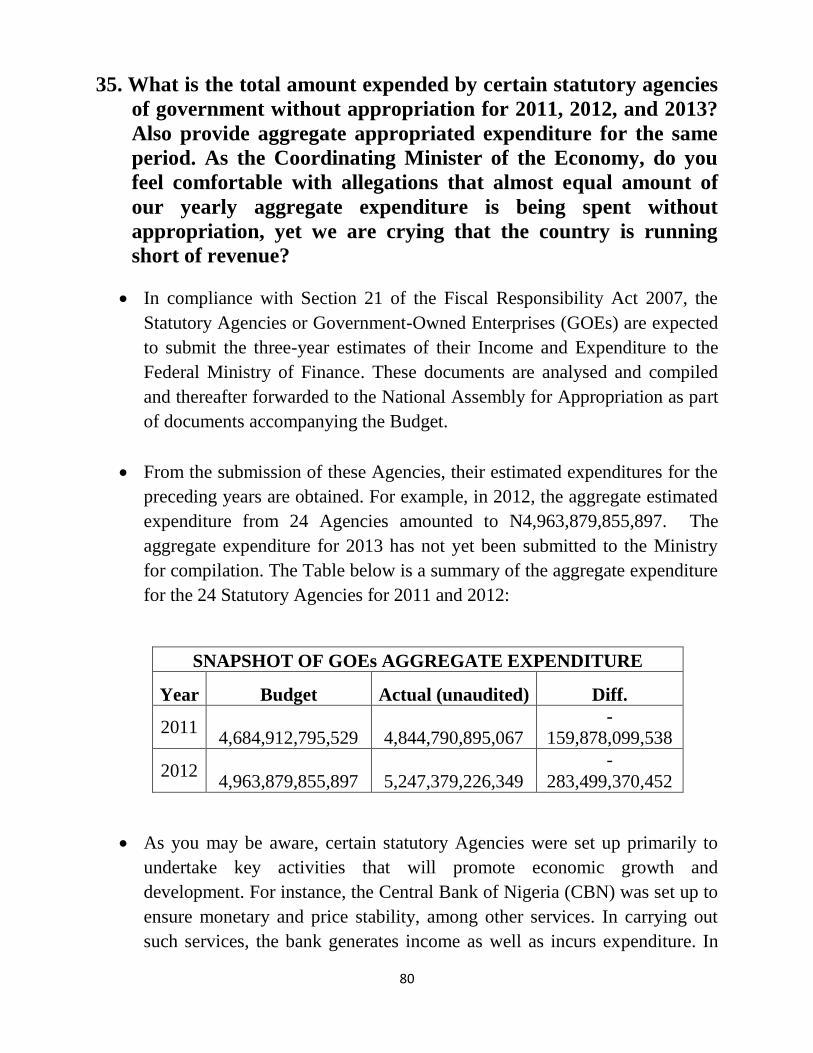
80
35. What is the total amount expended by certain statutory agencies
of government without appropriation for 2011, 2012, and 2013?
Also provide aggregate appropriated expenditure for the same
period. As the Coordinating Minister of the Economy, do you
feel comfortable with allegations that almost equal amount of
our yearly aggregate expenditure is being spent without
appropriation, yet we are crying that the country is running
short of revenue?
In compliance with Section 21 of the Fiscal Responsibility Act 2007, the
Statutory Agencies or Government-Owned Enterprises (GOEs) are expected
to submit the three-year estimates of their Income and Expenditure to the
Federal Ministry of Finance. These documents are analysed and compiled
and thereafter forwarded to the National Assembly for Appropriation as part
of documents accompanying the Budget.
From the submission of these Agencies, their estimated expenditures for the
preceding years are obtained. For example, in 2012, the aggregate estimated
expenditure from 24 Agencies amounted to N4,963,879,855,897. The
aggregate expenditure for 2013 has not yet been submitted to the Ministry
for compilation. The Table below is a summary of the aggregate expenditure
for the 24 Statutory Agencies for 2011 and 2012:
SNAPSHOT OF GOEs AGGREGATE EXPENDITURE
Year Budget Actual (unaudited) Diff.
2011
4,684,912,795,529
4,844,790,895,067
-
159,878,099,538
2012
4,963,879,855,897
5,247,379,226,349
-
283,499,370,452
As you may be aware, certain statutory Agencies were set up primarily to
undertake key activities that will promote economic growth and
development. For instance, the Central Bank of Nigeria (CBN) was set up to
ensure monetary and price stability, among other services. In carrying out
such services, the bank generates income as well as incurs expenditure. In
81
2012, the bank generated a gross income of N629,819,000,000 and made a
surplus of N100,386,000,000.
Another instance is the Nigerian Deposit Insurance Corporation (NDIC) that
provides specialised service of Insurance Cover for bank deposits. In 2012,
the corporation generated a gross income of N54,052,878,000 with a
surplus of N6,833,449,000 after providing for the Insurance Cover.
However, these Agencies are expected to remit 80% of their operating
surplus into FGN’s Consolidated Revenue Fund.
As the Coordinating Minister for the Economy, it is pertinent to state that,
some of these Statutory Agencies submit their budget to the National
Assembly for consideration and it may not be correct to allege that they
incur expenditures without appropriation. Nevertheless, the Ministry, in an
attempt to increase the revenue remittances from these Agencies sought and
obtained Mr. President’s approval to limit the expenditure of these Statutory
Bodies or GOEs to a maximum level of 75% of their revenue.
82
36. Between May 7 and 9, 2014, it is expected that Nigeria will be
hosting World Economic Forum on Africa. Who will finance
this event and why? In concrete terms, what are the expected
tangible benefits to the country in return to justify hosting such
expensive event that will require lots of money for logistics,
accommodations, security, especially given that South Africa
that recently hosted the event has nothing to show for it.
All Nigerians want Nigeria to be the giant of Africa and for our nation to
play a prominent role in world affairs. Our recent election to a seat on the
United Nations Security Council as well as our successes in the
international sporting arena are a source of pride – not only for Nigerians,
but indeed for the entire African continent. Our hosting of the World
Economic Forum conference – one of the most important gatherings of
global businesses and policy-makers – is a strong endorsement of
Nigeria’s importance among emerging market economies.
For many years, the WEF Africa Conference has been held in South
Africa – although Nigeria had requested for many years to serve as the
hosts. We are therefore pleased that the 24th World Economic Forum on
Africa will be held in Abuja from May 7 – 9 2014. The conference will
be financed from three sources – the Federal Government of Nigeria, the
Nigerian private sector and the World Economic Forum. Because the
event attracts Heads of Governments and Statesmen, CEOs of global
firms, leading financiers and policy and development technocrats, from
over 80 countries, it provides an unprecedented opportunity for economic
diplomacy for Nigeria. The successful hosting of the event would further
enhance the appreciation of our economic reforms, enable Nigeria to
attract new investment and strengthen efforts to diversify the country’s
production base, generate employment and attain the goal of inclusive
growth, especially in new areas of focus that include agriculture,
automobile, light manufacturing, infrastructure, housing and construction
and new technology.
83
South Africa has hosted the event 17 times – most recently in May 2013
– and greatly appreciates the enormous investment attraction of the
World Economic Forum on Africa. Other countries that have hosted at
least once, such as Tanzania (2010), Ethiopia (2012) leveraged on the
event to boost their agriculture and manufacturing productivities
following the event. The “Grow Africa” and the infrastructure initiative
that are now attracting billions of US dollars in investment started in
Tanzania and Ethiopia, respectively. We intend to leverage on WEF
event to attract the same or greater level of benefits to Nigeria. It is
presumptuous to claim that South Africa has nothing to show for its
hosting of the WEF; it would not have done so 17 times if there were no
benefits to their economy.
84
37. If you should for any reason say it will attract foreign investors, the
question, then becomes, what kind of foreign investors are we
talking about here because as we all know, no serious foreign
investor needs to attend such a forum in Nigeria in order to
recognize that our country should have been one of the world's
favored investment destinations had our perennial infrastructure
deficit been addressed head-on?
Today, countries compete in different ways, including road shows and
investor conferences, for the limited available global investment funds.
Importantly, every country seeks to get its investment message to as many
investors as possible, though investors will always look at economic
fundamentals and independent reports. Therefore, a single event such as a
conference is not sufficient to attract all the foreign direct investment (FDI)
we need in Nigeria. It is a combination of factors, including the ability to
leverage on the congregation of top global investors and decision-makers
that will gather during the 24th World Economic Forum on Africa in Abuja
next May, as well as our continued improvement of our nation’s
infrastructure.
Despite the infrastructure deficit but in recognition of the improvements
that are being made, Nigeria has attracted the largest FDI on the African
continent in the last three years, over 20 US billion dollars, 10 percent of
the volume. In addition, the recognition of the deficit is also one of the
reasons why we are hosting events like the WEF; so global investors can
appreciate the huge opportunity that Nigeria presents in this area. During
the conference, we intend to show case the 30-year infrastructure Master
plan we have developed and allow investors identify the opportunities that
suits their portfolio.
85
38. Most of the developing economies like China, India, and Brazil that the world
is today celebrating as economic success wouldn't have become this
successful without adopting multi-year development plans. Why after
knowing that their successes are as a result of carefully designed multi-year
economic planning, we are yet to adopt such a multi-year development
model? In other words, why wouldn’t you agree that Nigeria too needs that in
order to move faster and more sustainably in its quest for industrialization and
economic diversification and job creation for millions of the country's
unemployed young men and women?
Yes, these development plans are needed and it is NOT true that we lack
such plans. We currently have the Nigeria Vision 20:2020 document as
well as the Transformation Agenda which provide the overarching
direction for the Government’s development programs.
The Nigeria Vision 20:2020 provides a long-term plan with concrete
strategies needed to launch Nigeria onto a path of sustained and rapid
socio-economic development. Vision 20:2020 builds on the previous
National Economic Empowerment and Development Strategies
(NEEDS), and is based on three pillars: to guarantee the productivity and
wellbeing of the people of Nigeria; to optimize the key sources of
economic growth; and to foster sustainable social and economic
development.
As you may be aware, the current administration also initiated the
Transformation Agenda (TA) which is based on the Vision 20:2020 and
the First National Implementation Plan. The Transformation Agenda
targets thematic areas such as the real sector; infrastructure development;
human capital development; and private sector investments.
In addition to the Transformation Agenda, there are also macroeconomic
frameworks and sectoral master plans which are used to guide the
formulation of government programmes. For example:
o For macroeconomic planning, we currently have the fiscal
strategy paper (FSP) and the medium term expenditure
framework (MTEF) which present the government’s revenue
and expenditure forecasts in the medium-term.
o For our industrial policies, the Federal Ministry of Industry,
Trade and Investments recently developed the National
86
Industrial Revolution Plan (NIRP), which aims at
industrializing Nigeria and diversifying the economy into
sectors such as agro-processing, light manufacturing, and
petrochemicals.
o For our long-term infrastructure investments: the National
Planning Commission developed the National Integrated
Infrastructure Master Plan (NIIMP) which provides a
comprehensive 30-year infrastructure development plan for
Nigeria.
87
39. As the Coordinating Minister of the Economy, can you precisely
clarify how much is AMCON's debt exposure and what will its
defaulting mean to the country's economy?
AMCON’s total debt exposure in terms of issued bonds currently stands at
N4.67 trillion, after paying down N1 trillion in December 2013. Of the
amount outstanding, N868 billion is due for redemption in 2014, leaving
AMCON with a total of N3.8 trillion.
A system is in place to ensure the redemption of AMCON’s outstanding
debt when they fall due. This includes:
A Sinking Fund called the Banking Sector Resolution Cost Trust Fund,
into which Nigerian Banks will contribute yearly, 0.5 percent of total
assets, and the CBN will contribute N50 billion per annum for 10 years
until AMCON has repaid all outstanding obligations. This Trust Fund
is managed independent of AMCON, with a Board of Trustees to
manage and protect the funds.
Recoveries on Non-Performing Loans (NPLs) purchased; proceeds
from the sale of shares in intervened banks; proceeds from the sale of
AMCON-owned banks; and income generated from cash reinvestment.
In view of this, we are confident that the chances of a default or
crystallization of the FGN guarantee on AMCON’s bond are remote.
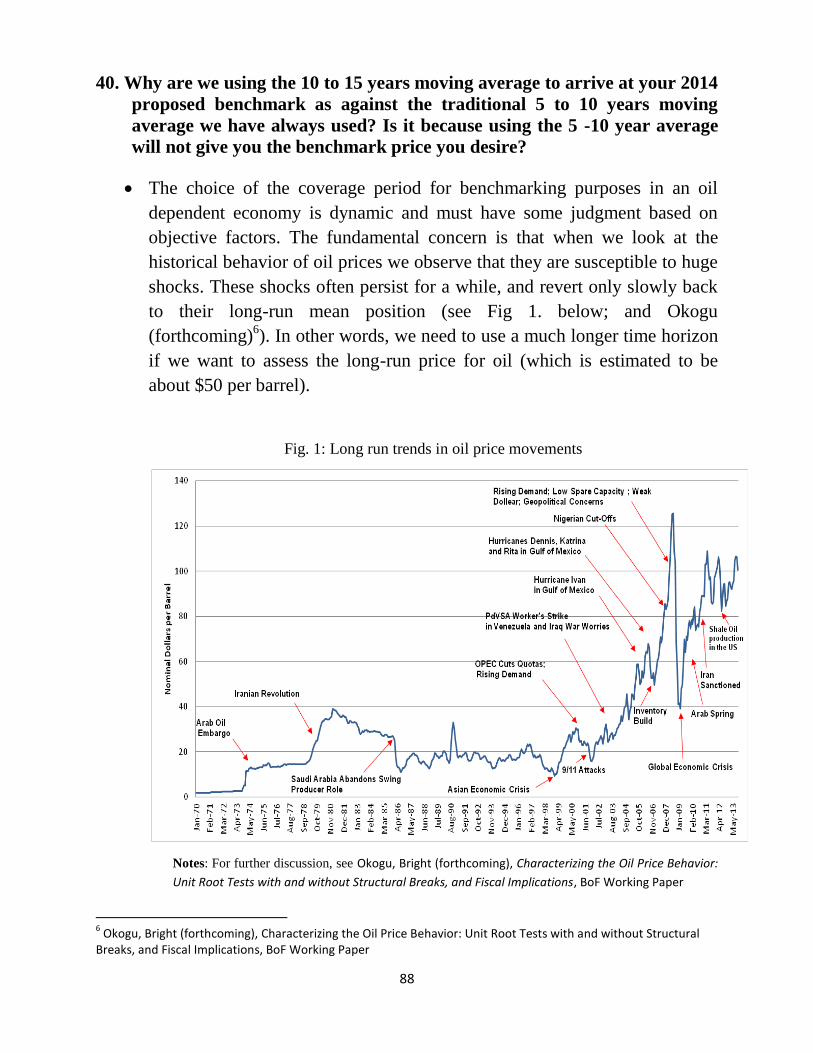
88
40. Why are we using the 10 to 15 years moving average to arrive at your 2014
proposed benchmark as against the traditional 5 to 10 years moving
average we have always used? Is it because using the 5 -10 year average
will not give you the benchmark price you desire?
The choice of the coverage period for benchmarking purposes in an oil
dependent economy is dynamic and must have some judgment based on
objective factors. The fundamental concern is that when we look at the
historical behavior of oil prices we observe that they are susceptible to huge
shocks. These shocks often persist for a while, and revert only slowly back
to their long-run mean position (see Fig 1. below; and Okogu
(forthcoming)6). In other words, we need to use a much longer time horizon
if we want to assess the long-run price for oil (which is estimated to be
about $50 per barrel).
Fig. 1: Long run trends in oil price movements
Notes: For further discussion, see Okogu, Bright (forthcoming), Characterizing the Oil Price Behavior:
Unit Root Tests with and without Structural Breaks, and Fiscal Implications, BoF Working Paper
6 Okogu, Bright (forthcoming), Characterizing the Oil Price Behavior: Unit Root Tests with and without Structural
Breaks, and Fiscal Implications, BoF Working Paper
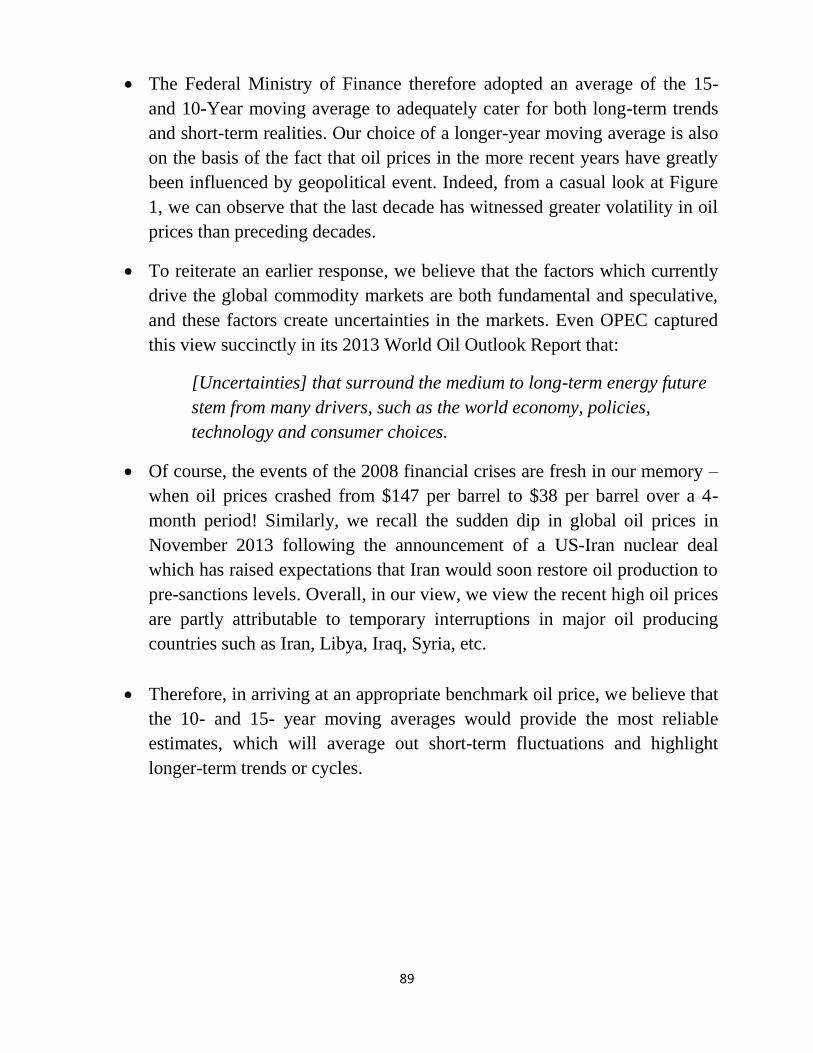
89
The Federal Ministry of Finance therefore adopted an average of the 15-
and 10-Year moving average to adequately cater for both long-term trends
and short-term realities. Our choice of a longer-year moving average is also
on the basis of the fact that oil prices in the more recent years have greatly
been influenced by geopolitical event. Indeed, from a casual look at Figure
1, we can observe that the last decade has witnessed greater volatility in oil
prices than preceding decades.
To reiterate an earlier response, we believe that the factors which currently
drive the global commodity markets are both fundamental and speculative,
and these factors create uncertainties in the markets. Even OPEC captured
this view succinctly in its 2013 World Oil Outlook Report that:
[Uncertainties] that surround the medium to long-term energy future
stem from many drivers, such as the world economy, policies,
technology and consumer choices.
Of course, the events of the 2008 financial crises are fresh in our memory –
when oil prices crashed from $147 per barrel to $38 per barrel over a 4-
month period! Similarly, we recall the sudden dip in global oil prices in
November 2013 following the announcement of a US-Iran nuclear deal
which has raised expectations that Iran would soon restore oil production to
pre-sanctions levels. Overall, in our view, we view the recent high oil prices
are partly attributable to temporary interruptions in major oil producing
countries such as Iran, Libya, Iraq, Syria, etc.
Therefore, in arriving at an appropriate benchmark oil price, we believe that
the 10- and 15- year moving averages would provide the most reliable
estimates, which will average out short-term fluctuations and highlight
longer-term trends or cycles.
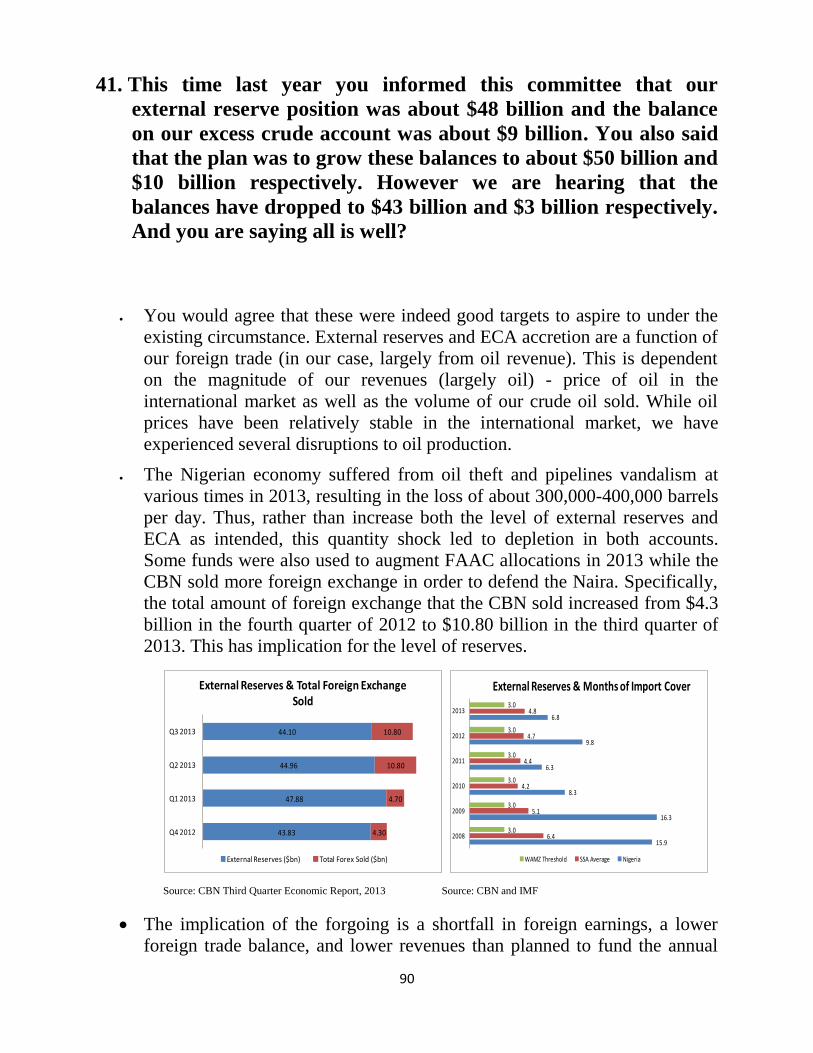
90
41. This time last year you informed this committee that our
external reserve position was about $48 billion and the balance
on our excess crude account was about $9 billion. You also said
that the plan was to grow these balances to about $50 billion and
$10 billion respectively. However we are hearing that the
balances have dropped to $43 billion and $3 billion respectively.
And you are saying all is well?
You would agree that these were indeed good targets to aspire to under the
existing circumstance. External reserves and ECA accretion are a function of
our foreign trade (in our case, largely from oil revenue). This is dependent
on the magnitude of our revenues (largely oil) - price of oil in the
international market as well as the volume of our crude oil sold. While oil
prices have been relatively stable in the international market, we have
experienced several disruptions to oil production.
The Nigerian economy suffered from oil theft and pipelines vandalism at
various times in 2013, resulting in the loss of about 300,000-400,000 barrels
per day. Thus, rather than increase both the level of external reserves and
ECA as intended, this quantity shock led to depletion in both accounts.
Some funds were also used to augment FAAC allocations in 2013 while the
CBN sold more foreign exchange in order to defend the Naira. Specifically,
the total amount of foreign exchange that the CBN sold increased from $4.3
billion in the fourth quarter of 2012 to $10.80 billion in the third quarter of
2013. This has implication for the level of reserves.
Source: CBN Third Quarter Economic Report, 2013 Source: CBN and IMF
The implication of the forgoing is a shortfall in foreign earnings, a lower
foreign trade balance, and lower revenues than planned to fund the annual
43.83
47.88
44.96
44.10
4.30
4.70
10.80
10.80
Q4 2012
Q1 2013
Q2 2013
Q3 2013
External Reserves & Total Foreign Exchange Sold
External Reserves ($bn) Total Forex Sold ($bn)
15.9
16.3
8.3
6.3
9.8
6.8
6.4
5.1
4.2
4.4
4.7
4.8
3.0
3.0
3.0
3.0
3.0
3.0
2008
2009
2010
2011
2012
2013
External Reserves & Months of Import Cover
WAMZ Threshold SSA Average Nigeria

91
budget. This poses serious challenges to the Central Bank (monetary-side
issues) management of foreign exchange market with a goal to ensure
stability of the Naira. On the fiscal side, the ECA was on different occasions
used to augment FAAC allocations.
However, despite the depletion in the level of external reserves, Nigeria is
still in a comfortable zone. This is because the level of our reserve is able to
cover more months of imports when compared with the 3 months
requirement under the convergence criteria of the West African Monetary
Zone (WAMZ). In addition, Nigeria’s external reserve level is able to cover
more months of imports than the sub-Saharan Africa average.
Whether all is well or not is clearly a function of the objective. Now, is all
well because we are not meeting planned sales volumes or foreign earnings
or revenues? No. But, viewed against a positively changing situation,
Nigerians and indeed the international community must be told the truth –
all is well for now. We just need to be extra vigilant and ensure that we bring
back both oil and non-oil revenues to pre-2013 levels.
92
42. Crude oil projections for 2013 were 2.53 million barrels per day
while actual figures as supplied by the NNPC/DPR/MTEF have
averaged about 2.3 million barrels per day giving a shortfall of
about 9%. Could this alone have caused such a drastic reduction
in our reserves and savings positions?
No, this alone is not responsible for the drop in our reserves (which by the
way cannot be characterized as drastic) and savings position. As rightly
indicated, the said ‘shortfall of 9%’ implies some shortfall in Government
revenues which as explained earlier, impacts on our ECA savings as well
as on our foreign reserves.
A critical factor in determining government take from oil produced, as
explained in our response to Question 32, is the underlying business
arrangement. The NNPC noted during the December 2013 reconciliation
exercises that there had been an increasing
Aside from the shortfall in revenues from oil sources, we also experienced
underperformance in non-oil revenue collection – particularly for customs
revenues. This contributed to lowering the overall savings accumulated in
2013 or the resort to drawdown from savings to augment FAAC
allocations.
93
43. Is any money missing from our anticipated revenue from the
NNPC in particular and oil industry in general. If there is, how
much? If not, how come such issues emanate from high offices in
the executive arm of Government?
In December 2013, a leaked letter from the Governor of the Central Bank
of Nigeria (CBN) to the Presidency alleged that the sum of $49.8 billion
from the NNPC had not been repatriated to the Federation Account. The
NNPC countered this claim.
To resolve the ensuing controversy, a meeting of the key stakeholders
involved in managing oil revenues was convened by the Ministry of
Finance on 17th December 2013 to clarify the discrepancies in oil
revenues reported by the CBN. The institutions present at the revenue
reconciliation meeting were: the Federal Ministry of Finance, the Federal
Inland Revenue Service (FIRS), the Office of the Accountant General of
the Federation, the Budget Office of the Federation, the Federal Ministry
of Petroleum Resources, NNPC, and the Department of Petroleum
Resources (DPR).
The response below is based on the findings of the reconciliation meeting
which was held on 17th December 2013 in the Federal Ministry of
Finance.
At the revenue reconciliation meeting, CBN noted that the non-
repatriated $49.8 billion were the proceeds from observed crude oil sales
by the NNPC over the period January 2012 to July 2013. The CBN raised
these concerns after observing the low accretion to Nigeria’s foreign
exchange reserves despite sustained high oil prices. According to the
CBN, based on data from pre-shipment inspection agents, over the period
January 2012 to July 2013, a total of 594.02 million barrels of crude oil
were lifted by the NNPC, amounting to about USD65.3 billion. However,
the amount remitted into the Federation Account at the CBN amounted to
only USD15.53 billion. This prompted the CBN to raise the issue of an
observed gap in expected revenues.
The NNPC however responded that the actual proceeds from crude oil
exports over the period amounted to USD67.12 billion, and was thus
94
about USD1.79 billion higher than the revenues reported by the CBN
(possibly due to timing differences and NPDC liftings which were not
included in the CBN report).
Moreover, according to the NNPC’s records, the total revenues of
USD67.12 billion, was comprised of revenues which directly accrued to
NNPC (for the Federation Account) of USD14 billion; and additional
revenues lifted by NNPC on behalf of other parties as follows: for FIRS
(USD15 billion), for DPR (USD2 billion), for NPDC (USD6 billion) and
for other third party financing (USD 2 billion). In addition, domestic
crude lifted by the NNPC amounted to about USD28 billion. This
domestic crude component was not reflected in the CBN’s foreign
accounts, but rather paid directly in Naira into the Federation Account.
Taking account of these various exports conducted on behalf of the non-
NNPC parties, the total of USD67 billion was mostly accounted for. This
substantially addresses the issues raised by the CBN.
Finally, the Federation Account indicates that over the period January
2012 to July 2013, a shortfall of USD10.8 billion was recorded from the
domestic crude oil receipts. This shortfall had previously been
acknowledged by NNPC, but the magnitude of the shortfall is still
disputed by NNPC. According to NNPC, the shortfall is explained to be
the result of subsidy claims, unrecovered crude/product losses, and cost
of strategic petroleum storage (which is currently not captured in the
PPPRA template for refunds). This figure is also well-known to all
stakeholders at the Federation Account Allocation Committee (FAAC),
and is reported and updated on a monthly basis. All parties concerned
are also working assiduously through the ongoing reconciliation efforts
to resolve the outstanding claims.
95
44. Referring to the pre-shipment inspection of exports act of 1996
and the Federal Ministry of Finance export guidelines. If any
good (oil, gas or non oil) is exported from Nigeria the exporter is
compelled to repatriate these proceeds through the domiciliary
account of a Nigerian bank. What has been the effectiveness of
these laws? Is there full compliance?
The repatriation of export proceeds back to Nigeria falls under the purview
of the Trade and Exchange Department of the Central Bank of Nigeria. The
Finance Committee may therefore wish to invite the CBN to provide a more
detailed discussion of this subject. However, to the best of our knowledge,
the laws have been largely effective.
96
45. If there has not been compliance, would it not make it difficult
for us to build up our foreign reserves? Could we not say that
the main thrust of the CBN letter was that our foreign reserves
are not growing even though there has been a consistent high
selling price of crude due to the fact that huge funds are not
being repatriated at all or are repatriated through the black
market?
Yes, the CBN noted during the reconciliation meetings that they had
raised their initial concerns partly because they had observed the low
accretion to Nigeria’s foreign exchange reserves. However, in their
response, NNPC also mentioned that as a result of the changing structure
of business arrangements (e.g. from joint ventures to production sharing
contracts), the government take in recent years had been declining. A
more extensive response to the revenue reconciliation exercise between
the CBN, NNPC, Federal Ministry of Finance and other institutions is
summarized in our response to Question 43.
97
46. Could we say that the issue is not so much that money is missing (which is
yet to be determined) but that proceeds that should have found their way
back to the Nigerian economy have grown wings or they fly in through
the black market, allowing oil industry players have a field day making
spreads of up to N7 per dollar in some cases.
As we discussed previously, the concerns raised by the CBN had been
mostly resolved. A more extensive response to the revenue reconciliation
exercise between the CBN, NNPC, Federal Ministry of Finance and other
institutions is summarized in our response to Question 43.
98
47. What is the Minister’s take on the apparent stagnation of the economy as
there seems to be very little job creation and growth in small businesses.
Even though the Minister has read out growth figures before it is not
telling on the average man on the street.
The Nigerian economy cannot be described as “stagnant”, as shown in our
previous responses. Particularly in Question #1, we listed the Federal
Government’s recent economic achievements – such as investments in
transport infrastructure (roads, railways, airports, etc), in the power sector,
in water resources, and in communications technology. As a result, we
have seen additional growth in agriculture, in the manufacturing sector,
and in other service sectors.
The National Bureau of Statistics estimates that 1.6 million jobs were
created across the country in the past 12 months. Sectors which have
experienced strong growth and created jobs include the agricultural, oil &
gas, manufacturing, housing & construction, and SME sectors.
The government’s economic achievements are creating demonstrable
impacts for the average man on the street. As is the case in every country
with an unemployment problem, even when the economy creates
thousands of jobs, if an individual is still unemployed, they never accept
that their Government is achieving any job creation.
o In agriculture, Nigeria produced over 8 million metric tons of
additional food in the past year. As a result, Nigeria’s food
import bill reduced from N1.1 trillion in 2011 to N648 billion in
2012. Moreover, last year, we produced 1.1 million metric tons
of dry season rice across 10 Northern States, employing over
250,000 farmers and youths in these States.
o In manufacturing, new jobs have also been created across the
country. In the Onne Oil and Gas Free Zone alone we created an
estimated 30,000 jobs.
The Government’s special intervention programs are also creating jobs
opportunities. The YouWiN program has supported young Nigerian
99
entrepreneurs and created over 18,000 jobs. The SURE-P Community
Services Scheme has also created 120,000 job opportunities across the
country, and the Federal Government’s investments in the primary health
care services also generated an estimated 178,000 jobs.
However, given Nigeria’s large and growing population, it is worth
acknowledging that even more jobs are needed for our growing youth
population.
100
48. Would the Minister say that the various Government initiatives at job
creation have not lived up to expectation as they affect only a very small
part of the population?
As we noted earlier in Question 1, our strong economic performance across
various sectors is creating jobs, and improving the livelihoods of our
citizens. According to the National Bureau of Statistics (NBS) a total of 1.6
million jobs were created in the past year. The NBS jobs data are based on
Quarterly Job Creation surveys which are conducted in partnership with the
Office of the Chief Economic Adviser to the President, the National
Planning Commission, and the Federal Ministry of Labour & Productivity.
The survey is conducted for a representative sample of 5000 establishments
across the nation (all 36 States and the FCT), covering all sectors of the
economy.
Of the 1.6 million total jobs created, we can highlight a few examples which
demonstrate the impacts made across the country.
o In agriculture, the provision of inputs in 10 Northern States enabled
dry season farming; and profitably engaged over 250,000 farmers and
youths even during the dry season.
o In manufacturing, many new jobs were also created across the
country. For example, the Onne Oil and Gas Free Zone created an
estimated 30,000 direct and indirect jobs.
o The Government’s special intervention programs also created job
opportunities. The YouWiN program has supported young Nigerian
entrepreneurs and created over 18,000 jobs. The SURE-P Community
Services Scheme has also created 120,000 job opportunities across the
country.
However, given the large number of new entrants into the labor force each
year, and the pre-existing stock of people already looking for jobs, we will
need to maintain our unrelenting focus on job creation for our youth
population. Job creation therefore remains the focus of this Administration.
101
49. Wouldn’t the Minister think that the private sector should be
the main driver of job and wealth creation through natural
growth of business and start ups being financed by the banking
industry?
Yes, the private sector serves as the engine of growth in modern
economies. Banks, and the broader financial sector, also have an important
role to play in mobilizing savings and allocating these resources to
profitable ventures by the private sector. Our response to Question 48
above clearly puts the private sector as the main source of job creation.
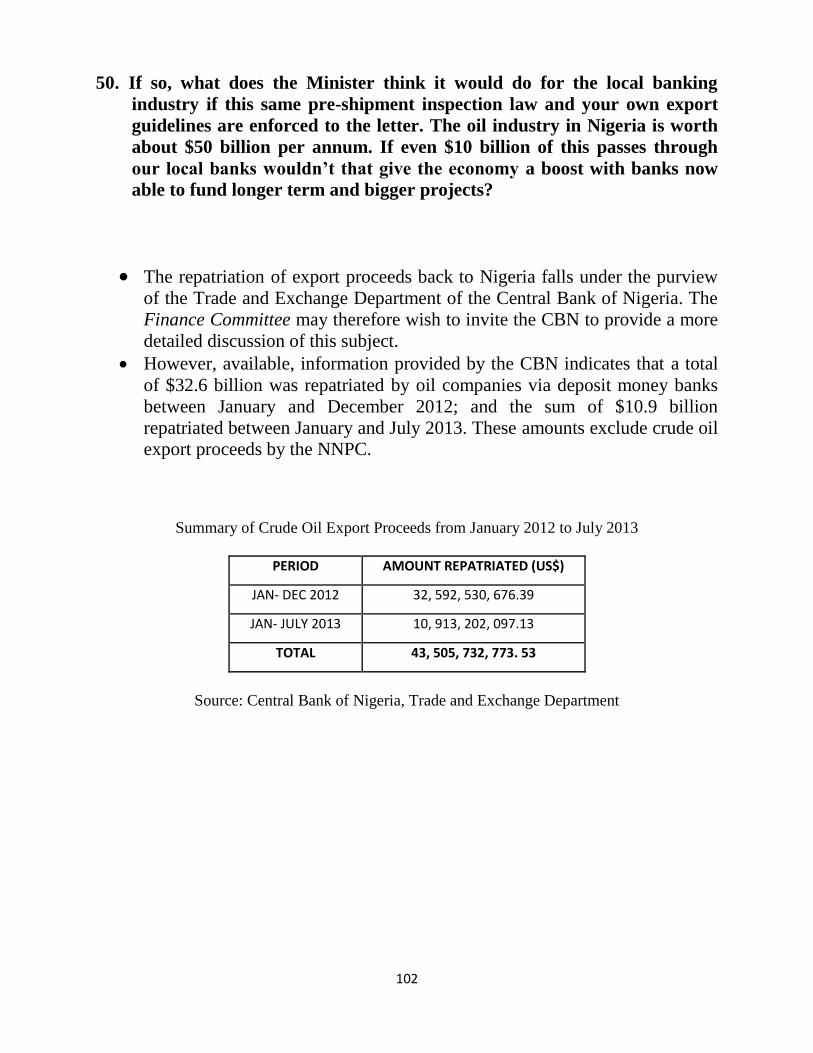
102
50. If so, what does the Minister think it would do for the local banking
industry if this same pre-shipment inspection law and your own export
guidelines are enforced to the letter. The oil industry in Nigeria is worth
about $50 billion per annum. If even $10 billion of this passes through
our local banks wouldn’t that give the economy a boost with banks now
able to fund longer term and bigger projects?
The repatriation of export proceeds back to Nigeria falls under the purview
of the Trade and Exchange Department of the Central Bank of Nigeria. The
Finance Committee may therefore wish to invite the CBN to provide a more
detailed discussion of this subject. However, available, information provided by the CBN indicates that a total
of $32.6 billion was repatriated by oil companies via deposit money banks
between January and December 2012; and the sum of $10.9 billion
repatriated between January and July 2013. These amounts exclude crude oil
export proceeds by the NNPC.
Summary of Crude Oil Export Proceeds from January 2012 to July 2013
PERIOD AMOUNT REPATRIATED (US$)
JAN- DEC 2012 32, 592, 530, 676.39
JAN- JULY 2013 10, 913, 202, 097.13
TOTAL 43, 505, 732, 773. 53
Source: Central Bank of Nigeria, Trade and Exchange Department