Federal Human Capital Survey
16
Federal Human Capital Survey Federal Human Capital Survey 2008 Results from the 2008 Federal Human Capital Survey FHCS Report by Demographic Questions by Agency (Unw eighted data)
Transcript of Federal Human Capital Survey

Federal Human Capital Survey
Federal Human Capital Survey
2008
Results from the 2008 Federal Human Capital SurveyFHCS Report by Demographic Questions by Agency
(Unweighted data)
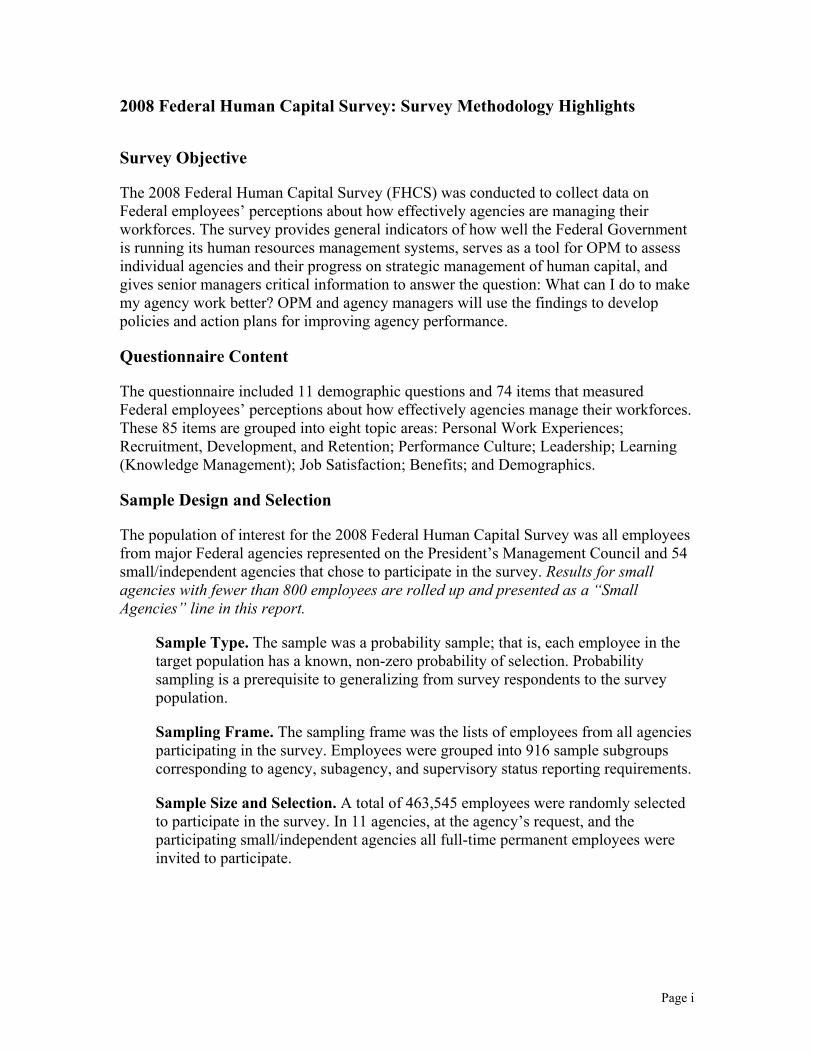
2008 Federal Human Capital Survey: Survey Methodology Highlights
Survey Objective
The 2008 Federal Human Capital Survey (FHCS) was conducted to collect data on Federal employees’ perceptions about how effectively agencies are managing their workforces. The survey provides general indicators of how well the Federal Government is running its human resources management systems, serves as a tool for OPM to assess individual agencies and their progress on strategic management of human capital, and gives senior managers critical information to answer the question: What can I do to make my agency work better? OPM and agency managers will use the findings to develop policies and action plans for improving agency performance.
Questionnaire Content
The questionnaire included 11 demographic questions and 74 items that measured Federal employees’ perceptions about how effectively agencies manage their workforces. These 85 items are grouped into eight topic areas: Personal Work Experiences; Recruitment, Development, and Retention; Performance Culture; Leadership; Learning (Knowledge Management); Job Satisfaction; Benefits; and Demographics.
Sample Design and Selection
The population of interest for the 2008 Federal Human Capital Survey was all employees from major Federal agencies represented on the President’s Management Council and 54 small/independent agencies that chose to participate in the survey. Results for small agencies with fewer than 800 employees are rolled up and presented as a “Small Agencies” line in this report.
Sample Type. The sample was a probability sample; that is, each employee in the target population has a known, non-zero probability of selection. Probability sampling is a prerequisite to generalizing from survey respondents to the survey population.
Sampling Frame. The sampling frame was the lists of employees from all agencies participating in the survey. Employees were grouped into 916 sample subgroups corresponding to agency, subagency, and supervisory status reporting requirements.
Sample Size and Selection. A total of 463,545 employees were randomly selected to participate in the survey. In 11 agencies, at the agency’s request, and the participating small/independent agencies all full-time permanent employees were invited to participate.
Page i

Page ii
Data Collection
Mode/Method. The 2008 Federal Human Capital Survey was a self-administered Web survey. OPM distributed paper versions of the survey to components of agencies that did not have electronic access.
Response Rate. Of the 417,128 employees receiving surveys, 212,223 completed the survey for a Governmentwide response rate of 51 percent.

2008 Federal Human Capital Survey: Report on Demographic Questions by Agency (Unweighted)Agency Year
# of
Respondents* HQ Field NonSupTeam Leader Sup Mgr Executive Male Female Yes No
American Indian/ Alaska Native Asian
Black/ African
American
Native Hawaiian/
Other Pacific
Islander White
Two or more races
All Responses 2008 212,223 39.7% 60.3% 55.7% 13.8% 18.0% 10.1% 2.3% 52.0% 48.0% 6.8% 93.2% 4.0% 4.1% 16.1% 0.7% 72.0% 3.0%Responses '06 221,479 39.8% 60.2% 54.4% 14.6% 18.3% 10.3% 2.4% 54.2% 45.8% 6.3% 93.7% 2.9% 4.1% 15.5% 0.7% 73.9% 2.9%All Responses '04 147,914 35.5% 64.5% 51.7% 13.9% 19.8% 11.9% 2.7% 56.6% 43.4% 5.9% 94.1% ----- ----- ----- ----- ----- -----AID 2008 831 67.5% 32.5% 35.4% 12.6% 19.9% 20.5% 11.7% 47.7% 52.3% 3.9% 96.1% 0.7% 4.7% 25.8% 0.4% 66.0% 2.4%AID '06 726 82.6% 17.4% 42.8% 16.8% 20.2% 13.8% 6.3% 45.7% 54.3% 4.8% 95.2% 0.6% 4.1% 29.0% 0.3% 63.2% 2.7%AID '04 803 70.4% 29.6% 34.9% 14.3% 20.0% 20.1% 10.7% 50.3% 49.7% 4.2% 95.8% ----- ----- ----- ----- ----- -----BBG 2008 556 90.6% 9.4% 57.7% 14.6% 15.3% 10.1% 2.3% 61.0% 39.0% 5.4% 94.6% 0.2% 11.8% 19.2% 0.2% 65.4% 3.3%BBG '06 570 87.7% 12.3% 56.7% 13.3% 16.1% 11.1% 2.8% 59.3% 40.7% 9.3% 90.7% 0.5% 9.8% 19.6% 0.5% 66.0% 3.5%BBG '04 543 82.7% 17.3% 57.3% 17.9% 13.6% 10.1% 1.1% 61.0% 39.0% 8.3% 91.7% ----- ----- ----- ----- ----- -----CSOSA 2008 604 46.2% 53.8% 68.0% 11.6% 12.7% 6.0% 1.7% 35.3% 64.7% 4.8% 95.2% 0.5% 1.0% 79.1% 0.3% 15.7% 3.3%CSOSA '06 518 44.6% 55.4% 70.1% 9.3% 13.5% 6.2% 1.0% 34.6% 65.4% 5.0% 95.0% 0.2% 1.2% 77.6% 0.4% 17.2% 3.5%CSOSA '04 554 ----- ----- ----- ----- ----- ----- ----- ----- ----- ----- ----- ----- ----- ----- ----- ----- -----DHS 2008 9,550 25.0% 75.0% 47.7% 14.6% 22.8% 12.0% 2.9% 65.9% 34.1% 14.4% 85.6% 1.1% 3.7% 13.1% 0.9% 78.0% 3.2%DHS '06 10,373 26.3% 73.7% 41.5% 12.6% 28.4% 15.2% 2.3% 65.3% 34.7% 13.7% 86.3% 0.9% 3.6% 13.3% 0.8% 78.5% 2.9%DHS '04 10,478 20.4% 79.6% 45.1% 12.6% 25.6% 15.1% 1.5% 66.6% 33.4% 13.5% 86.5% ----- ----- ----- ----- ----- -----DOC 2008 3,556 65.9% 34.1% 46.4% 10.6% 25.8% 12.8% 4.4% 55.9% 44.1% 4.9% 95.1% 0.5% 9.7% 16.5% 0.6% 69.9% 2.8%DOC '06 5,204 63.0% 37.0% 44.5% 12.5% 25.5% 13.3% 4.2% 57.3% 42.7% 4.3% 95.7% 0.4% 8.8% 16.0% 0.4% 71.7% 2.7%DOC '04 4,021 60.2% 39.8% 44.3% 13.6% 24.1% 13.8% 4.3% 58.4% 41.6% 3.2% 96.8% ----- ----- ----- ----- ----- -----DOE 2008 6,093 42.3% 57.7% 68.6% 15.5% 9.3% 3.3% 3.2% 59.6% 40.4% 6.8% 93.2% 1.8% 3.9% 9.3% 0.5% 81.3% 3.3%DOE '06 7,742 42.3% 57.7% 68.4% 15.9% 9.0% 3.4% 3.3% 61.5% 38.5% 6.3% 93.7% 1.7% 3.7% 9.2% 0.4% 80.8% 4.3%DOE '04 1,485 39.7% 60.3% 45.5% 11.9% 20.1% 10.4% 12.1% 67.1% 32.9% 4.7% 95.3% ----- ----- ----- ----- ----- -----DOI 2008 27,030 33.9% 66.1% 55.0% 16.6% 17.2% 10.3% 0.8% 54.6% 45.4% 5.9% 94.1% 9.9% 1.7% 5.3% 0.6% 79.1% 3.4%DOI '06 25,507 32.5% 67.5% 54.4% 17.4% 17.6% 9.9% 0.7% 56.6% 43.4% 5.9% 94.1% 4.0% 1.7% 5.6% 0.6% 85.1% 3.1%DOI '04 5,187 26.2% 73.8% 43.2% 13.6% 25.6% 16.3% 1.2% 57.8% 42.2% 5.0% 95.0% ----- ----- ----- ----- ----- -----DOJ 2008 14,021 35.6% 64.4% 62.4% 12.7% 15.8% 6.5% 2.5% 48.4% 51.6% 9.3% 90.7% 0.8% 2.9% 17.6% 0.5% 75.7% 2.5%DOJ '06 10,967 39.8% 60.2% 54.9% 14.0% 19.7% 8.5% 2.9% 52.5% 47.5% 8.5% 91.5% 0.6% 3.0% 18.7% 0.5% 74.9% 2.2%DOJ '04 7,701 36.0% 64.0% 50.8% 12.4% 22.8% 10.7% 3.2% 54.0% 46.0% 7.9% 92.1% ----- ----- ----- ----- ----- -----DOL 2008 4,110 40.5% 59.5% 57.0% 10.4% 18.8% 11.2% 2.5% 50.8% 49.2% 7.2% 92.8% 0.8% 4.0% 20.0% 0.5% 71.8% 2.9%DOL '06 4,538 38.1% 61.9% 56.8% 10.3% 18.9% 11.5% 2.6% 52.7% 47.3% 7.8% 92.2% 0.8% 3.9% 20.1% 0.2% 72.4% 2.6%DOL '04 4,082 34.9% 65.1% 61.4% 9.1% 18.0% 9.5% 2.1% 51.0% 49.0% 7.3% 92.7% ----- ----- ----- ----- ----- -----DOT 2008 6,354 36.4% 63.6% 62.4% 13.0% 13.7% 7.3% 3.6% 63.5% 36.5% 8.3% 91.7% 1.3% 4.0% 15.8% 0.5% 75.3% 3.2%DOT '06 5,453 40.0% 60.0% 57.2% 14.5% 15.3% 8.5% 4.5% 64.2% 35.8% 8.9% 91.1% 0.8% 3.7% 16.9% 0.4% 75.3% 2.9%DOT '04 4,951 39.8% 60.2% 57.7% 16.4% 14.6% 8.4% 3.0% 64.8% 35.2% 8.1% 91.9% ----- ----- ----- ----- ----- -----
2008 FHCS Page 1
RaceWork Location Supervisor Status Hispanic or LatinoSex
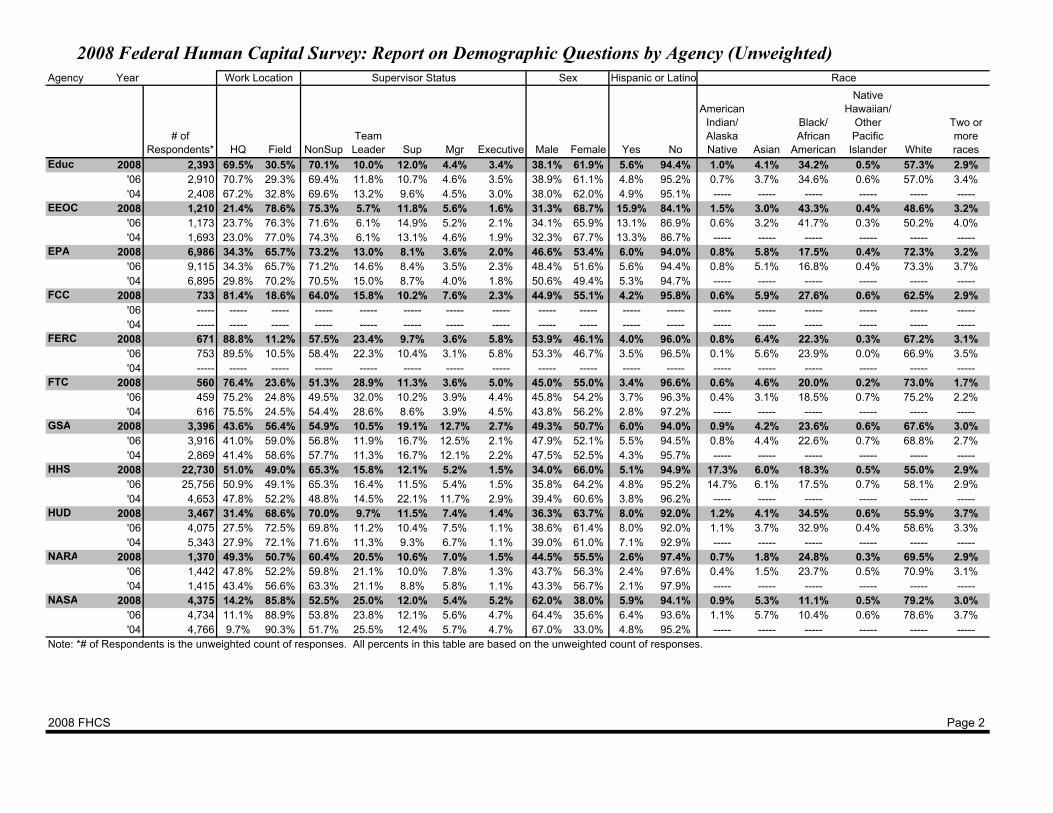
Note: *# of Respondents is the unweighted count of responses. All percents in this table are based on the unweighted count of responses.
2008 Federal Human Capital Survey: Report on Demographic Questions by Agency (Unweighted)Agency Year
# of
Respondents* HQ Field NonSupTeam Leader Sup Mgr Executive Male Female Yes No
American Indian/ Alaska Native Asian
Black/ African
American
Native Hawaiian/
Other Pacific
Islander White
Two or more races
Educ 2008 2,393 69.5% 30.5% 70.1% 10.0% 12.0% 4.4% 3.4% 38.1% 61.9% 5.6% 94.4% 1.0% 4.1% 34.2% 0.5% 57.3% 2.9%Educ '06 2,910 70.7% 29.3% 69.4% 11.8% 10.7% 4.6% 3.5% 38.9% 61.1% 4.8% 95.2% 0.7% 3.7% 34.6% 0.6% 57.0% 3.4%Educ '04 2,408 67.2% 32.8% 69.6% 13.2% 9.6% 4.5% 3.0% 38.0% 62.0% 4.9% 95.1% ----- ----- ----- ----- ----- -----EEOC 2008 1,210 21.4% 78.6% 75.3% 5.7% 11.8% 5.6% 1.6% 31.3% 68.7% 15.9% 84.1% 1.5% 3.0% 43.3% 0.4% 48.6% 3.2%EEOC '06 1,173 23.7% 76.3% 71.6% 6.1% 14.9% 5.2% 2.1% 34.1% 65.9% 13.1% 86.9% 0.6% 3.2% 41.7% 0.3% 50.2% 4.0%EEOC '04 1,693 23.0% 77.0% 74.3% 6.1% 13.1% 4.6% 1.9% 32.3% 67.7% 13.3% 86.7% ----- ----- ----- ----- ----- -----EPA 2008 6,986 34.3% 65.7% 73.2% 13.0% 8.1% 3.6% 2.0% 46.6% 53.4% 6.0% 94.0% 0.8% 5.8% 17.5% 0.4% 72.3% 3.2%EPA '06 9,115 34.3% 65.7% 71.2% 14.6% 8.4% 3.5% 2.3% 48.4% 51.6% 5.6% 94.4% 0.8% 5.1% 16.8% 0.4% 73.3% 3.7%EPA '04 6,895 29.8% 70.2% 70.5% 15.0% 8.7% 4.0% 1.8% 50.6% 49.4% 5.3% 94.7% ----- ----- ----- ----- ----- -----FCC 2008 733 81.4% 18.6% 64.0% 15.8% 10.2% 7.6% 2.3% 44.9% 55.1% 4.2% 95.8% 0.6% 5.9% 27.6% 0.6% 62.5% 2.9%FCC '06 ----- ----- ----- ----- ----- ----- ----- ----- ----- ----- ----- ----- ----- ----- ----- ----- ----- -----FCC '04 ----- ----- ----- ----- ----- ----- ----- ----- ----- ----- ----- ----- ----- ----- ----- ----- ----- -----FERC 2008 671 88.8% 11.2% 57.5% 23.4% 9.7% 3.6% 5.8% 53.9% 46.1% 4.0% 96.0% 0.8% 6.4% 22.3% 0.3% 67.2% 3.1%FERC '06 753 89.5% 10.5% 58.4% 22.3% 10.4% 3.1% 5.8% 53.3% 46.7% 3.5% 96.5% 0.1% 5.6% 23.9% 0.0% 66.9% 3.5%FERC '04 ----- ----- ----- ----- ----- ----- ----- ----- ----- ----- ----- ----- ----- ----- ----- ----- ----- -----FTC 2008 560 76.4% 23.6% 51.3% 28.9% 11.3% 3.6% 5.0% 45.0% 55.0% 3.4% 96.6% 0.6% 4.6% 20.0% 0.2% 73.0% 1.7%FTC '06 459 75.2% 24.8% 49.5% 32.0% 10.2% 3.9% 4.4% 45.8% 54.2% 3.7% 96.3% 0.4% 3.1% 18.5% 0.7% 75.2% 2.2%FTC '04 616 75.5% 24.5% 54.4% 28.6% 8.6% 3.9% 4.5% 43.8% 56.2% 2.8% 97.2% ----- ----- ----- ----- ----- -----GSA 2008 3,396 43.6% 56.4% 54.9% 10.5% 19.1% 12.7% 2.7% 49.3% 50.7% 6.0% 94.0% 0.9% 4.2% 23.6% 0.6% 67.6% 3.0%GSA '06 3,916 41.0% 59.0% 56.8% 11.9% 16.7% 12.5% 2.1% 47.9% 52.1% 5.5% 94.5% 0.8% 4.4% 22.6% 0.7% 68.8% 2.7%GSA '04 2,869 41.4% 58.6% 57.7% 11.3% 16.7% 12.1% 2.2% 47.5% 52.5% 4.3% 95.7% ----- ----- ----- ----- ----- -----HHS 2008 22,730 51.0% 49.0% 65.3% 15.8% 12.1% 5.2% 1.5% 34.0% 66.0% 5.1% 94.9% 17.3% 6.0% 18.3% 0.5% 55.0% 2.9%HHS '06 25,756 50.9% 49.1% 65.3% 16.4% 11.5% 5.4% 1.5% 35.8% 64.2% 4.8% 95.2% 14.7% 6.1% 17.5% 0.7% 58.1% 2.9%HHS '04 4,653 47.8% 52.2% 48.8% 14.5% 22.1% 11.7% 2.9% 39.4% 60.6% 3.8% 96.2% ----- ----- ----- ----- ----- -----HUD 2008 3,467 31.4% 68.6% 70.0% 9.7% 11.5% 7.4% 1.4% 36.3% 63.7% 8.0% 92.0% 1.2% 4.1% 34.5% 0.6% 55.9% 3.7%HUD '06 4,075 27.5% 72.5% 69.8% 11.2% 10.4% 7.5% 1.1% 38.6% 61.4% 8.0% 92.0% 1.1% 3.7% 32.9% 0.4% 58.6% 3.3%HUD '04 5,343 27.9% 72.1% 71.6% 11.3% 9.3% 6.7% 1.1% 39.0% 61.0% 7.1% 92.9% ----- ----- ----- ----- ----- -----NARA 2008 1,370 49.3% 50.7% 60.4% 20.5% 10.6% 7.0% 1.5% 44.5% 55.5% 2.6% 97.4% 0.7% 1.8% 24.8% 0.3% 69.5% 2.9%NARA '06 1,442 47.8% 52.2% 59.8% 21.1% 10.0% 7.8% 1.3% 43.7% 56.3% 2.4% 97.6% 0.4% 1.5% 23.7% 0.5% 70.9% 3.1%NARA '04 1,415 43.4% 56.6% 63.3% 21.1% 8.8% 5.8% 1.1% 43.3% 56.7% 2.1% 97.9% ----- ----- ----- ----- ----- -----NASA 2008 4,375 14.2% 85.8% 52.5% 25.0% 12.0% 5.4% 5.2% 62.0% 38.0% 5.9% 94.1% 0.9% 5.3% 11.1% 0.5% 79.2% 3.0%NASA '06 4,734 11.1% 88.9% 53.8% 23.8% 12.1% 5.6% 4.7% 64.4% 35.6% 6.4% 93.6% 1.1% 5.7% 10.4% 0.6% 78.6% 3.7%NASA '04 4,766 9.7% 90.3% 51.7% 25.5% 12.4% 5.7% 4.7% 67.0% 33.0% 4.8% 95.2% ----- ----- ----- ----- ----- -----
2008 FHCS Page 2
RaceWork Location Supervisor Status Hispanic or LatinoSex
Note: *# of Respondents is the unweighted count of responses. All percents in this table are based on the unweighted count of responses.
2008 Federal Human Capital Survey: Report on Demographic Questions by Agency (Unweighted)Agency Year
# of
Respondents* HQ Field NonSupTeam Leader Sup Mgr Executive Male Female Yes No
American Indian/ Alaska Native Asian
Black/ African
American
Native Hawaiian/
Other Pacific
Islander White
Two or more races
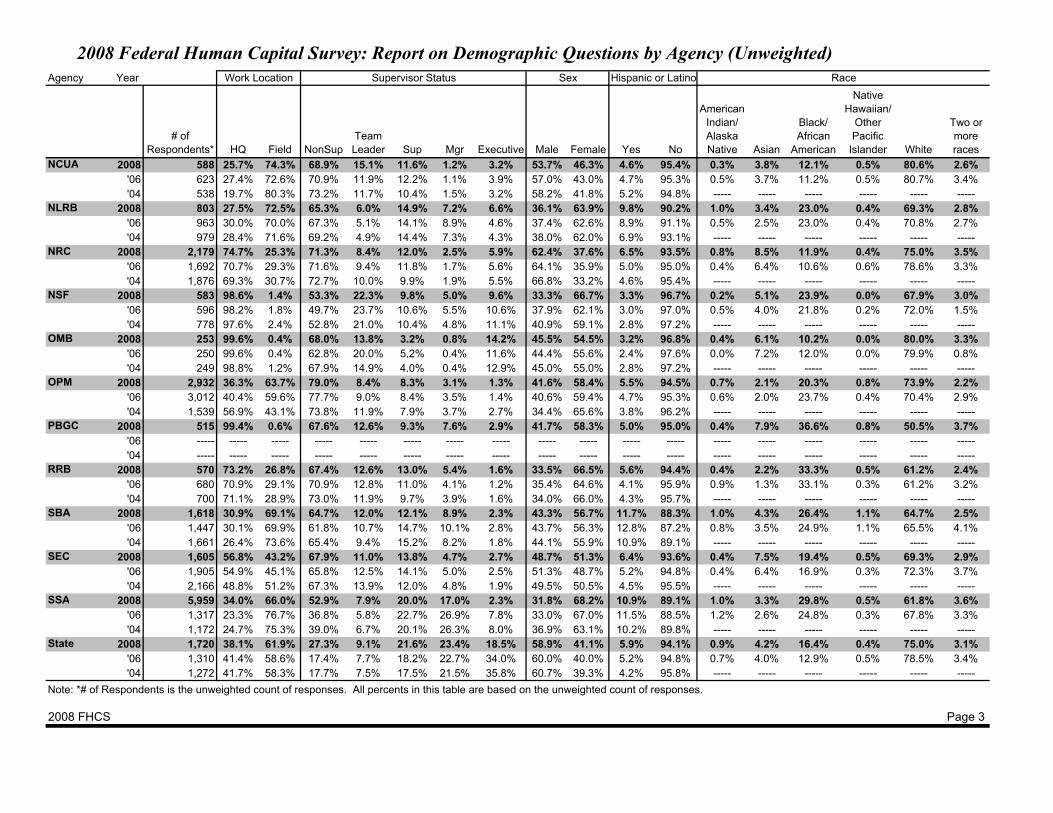
NCUA 2008 588 25.7% 74.3% 68.9% 15.1% 11.6% 1.2% 3.2% 53.7% 46.3% 4.6% 95.4% 0.3% 3.8% 12.1% 0.5% 80.6% 2.6%NCUA '06 623 27.4% 72.6% 70.9% 11.9% 12.2% 1.1% 3.9% 57.0% 43.0% 4.7% 95.3% 0.5% 3.7% 11.2% 0.5% 80.7% 3.4%NCUA '04 538 19.7% 80.3% 73.2% 11.7% 10.4% 1.5% 3.2% 58.2% 41.8% 5.2% 94.8% ----- ----- ----- ----- ----- -----NLRB 2008 803 27.5% 72.5% 65.3% 6.0% 14.9% 7.2% 6.6% 36.1% 63.9% 9.8% 90.2% 1.0% 3.4% 23.0% 0.4% 69.3% 2.8%NLRB '06 963 30.0% 70.0% 67.3% 5.1% 14.1% 8.9% 4.6% 37.4% 62.6% 8.9% 91.1% 0.5% 2.5% 23.0% 0.4% 70.8% 2.7%NLRB '04 979 28.4% 71.6% 69.2% 4.9% 14.4% 7.3% 4.3% 38.0% 62.0% 6.9% 93.1% ----- ----- ----- ----- ----- -----NRC 2008 2,179 74.7% 25.3% 71.3% 8.4% 12.0% 2.5% 5.9% 62.4% 37.6% 6.5% 93.5% 0.8% 8.5% 11.9% 0.4% 75.0% 3.5%NRC '06 1,692 70.7% 29.3% 71.6% 9.4% 11.8% 1.7% 5.6% 64.1% 35.9% 5.0% 95.0% 0.4% 6.4% 10.6% 0.6% 78.6% 3.3%NRC '04 1,876 69.3% 30.7% 72.7% 10.0% 9.9% 1.9% 5.5% 66.8% 33.2% 4.6% 95.4% ----- ----- ----- ----- ----- -----NSF 2008 583 98.6% 1.4% 53.3% 22.3% 9.8% 5.0% 9.6% 33.3% 66.7% 3.3% 96.7% 0.2% 5.1% 23.9% 0.0% 67.9% 3.0%NSF '06 596 98.2% 1.8% 49.7% 23.7% 10.6% 5.5% 10.6% 37.9% 62.1% 3.0% 97.0% 0.5% 4.0% 21.8% 0.2% 72.0% 1.5%NSF '04 778 97.6% 2.4% 52.8% 21.0% 10.4% 4.8% 11.1% 40.9% 59.1% 2.8% 97.2% ----- ----- ----- ----- ----- -----OMB 2008 253 99.6% 0.4% 68.0% 13.8% 3.2% 0.8% 14.2% 45.5% 54.5% 3.2% 96.8% 0.4% 6.1% 10.2% 0.0% 80.0% 3.3%OMB '06 250 99.6% 0.4% 62.8% 20.0% 5.2% 0.4% 11.6% 44.4% 55.6% 2.4% 97.6% 0.0% 7.2% 12.0% 0.0% 79.9% 0.8%OMB '04 249 98.8% 1.2% 67.9% 14.9% 4.0% 0.4% 12.9% 45.0% 55.0% 2.8% 97.2% ----- ----- ----- ----- ----- -----OPM 2008 2,932 36.3% 63.7% 79.0% 8.4% 8.3% 3.1% 1.3% 41.6% 58.4% 5.5% 94.5% 0.7% 2.1% 20.3% 0.8% 73.9% 2.2%OPM '06 3,012 40.4% 59.6% 77.7% 9.0% 8.4% 3.5% 1.4% 40.6% 59.4% 4.7% 95.3% 0.6% 2.0% 23.7% 0.4% 70.4% 2.9%OPM '04 1,539 56.9% 43.1% 73.8% 11.9% 7.9% 3.7% 2.7% 34.4% 65.6% 3.8% 96.2% ----- ----- ----- ----- ----- -----PBGC 2008 515 99.4% 0.6% 67.6% 12.6% 9.3% 7.6% 2.9% 41.7% 58.3% 5.0% 95.0% 0.4% 7.9% 36.6% 0.8% 50.5% 3.7%PBGC '06 ----- ----- ----- ----- ----- ----- ----- ----- ----- ----- ----- ----- ----- ----- ----- ----- ----- -----PBGC '04 ----- ----- ----- ----- ----- ----- ----- ----- ----- ----- ----- ----- ----- ----- ----- ----- ----- -----RRB 2008 570 73.2% 26.8% 67.4% 12.6% 13.0% 5.4% 1.6% 33.5% 66.5% 5.6% 94.4% 0.4% 2.2% 33.3% 0.5% 61.2% 2.4%RRB '06 680 70.9% 29.1% 70.9% 12.8% 11.0% 4.1% 1.2% 35.4% 64.6% 4.1% 95.9% 0.9% 1.3% 33.1% 0.3% 61.2% 3.2%RRB '04 700 71.1% 28.9% 73.0% 11.9% 9.7% 3.9% 1.6% 34.0% 66.0% 4.3% 95.7% ----- ----- ----- ----- ----- -----SBA 2008 1,618 30.9% 69.1% 64.7% 12.0% 12.1% 8.9% 2.3% 43.3% 56.7% 11.7% 88.3% 1.0% 4.3% 26.4% 1.1% 64.7% 2.5%SBA '06 1,447 30.1% 69.9% 61.8% 10.7% 14.7% 10.1% 2.8% 43.7% 56.3% 12.8% 87.2% 0.8% 3.5% 24.9% 1.1% 65.5% 4.1%SBA '04 1,661 26.4% 73.6% 65.4% 9.4% 15.2% 8.2% 1.8% 44.1% 55.9% 10.9% 89.1% ----- ----- ----- ----- ----- -----SEC 2008 1,605 56.8% 43.2% 67.9% 11.0% 13.8% 4.7% 2.7% 48.7% 51.3% 6.4% 93.6% 0.4% 7.5% 19.4% 0.5% 69.3% 2.9%SEC '06 1,905 54.9% 45.1% 65.8% 12.5% 14.1% 5.0% 2.5% 51.3% 48.7% 5.2% 94.8% 0.4% 6.4% 16.9% 0.3% 72.3% 3.7%SEC '04 2,166 48.8% 51.2% 67.3% 13.9% 12.0% 4.8% 1.9% 49.5% 50.5% 4.5% 95.5% ----- ----- ----- ----- ----- -----SSA 2008 5,959 34.0% 66.0% 52.9% 7.9% 20.0% 17.0% 2.3% 31.8% 68.2% 10.9% 89.1% 1.0% 3.3% 29.8% 0.5% 61.8% 3.6%SSA '06 1,317 23.3% 76.7% 36.8% 5.8% 22.7% 26.9% 7.8% 33.0% 67.0% 11.5% 88.5% 1.2% 2.6% 24.8% 0.3% 67.8% 3.3%SSA '04 1,172 24.7% 75.3% 39.0% 6.7% 20.1% 26.3% 8.0% 36.9% 63.1% 10.2% 89.8% ----- ----- ----- ----- ----- -----State 2008 1,720 38.1% 61.9% 27.3% 9.1% 21.6% 23.4% 18.5% 58.9% 41.1% 5.9% 94.1% 0.9% 4.2% 16.4% 0.4% 75.0% 3.1%State '06 1,310 41.4% 58.6% 17.4% 7.7% 18.2% 22.7% 34.0% 60.0% 40.0% 5.2% 94.8% 0.7% 4.0% 12.9% 0.5% 78.5% 3.4%State '04 1,272 41.7% 58.3% 17.7% 7.5% 17.5% 21.5% 35.8% 60.7% 39.3% 4.2% 95.8% ----- ----- ----- ----- ----- -----
2008 FHCS Page 3
RaceWork Location Supervisor Status Hispanic or LatinoSex
Note: *# of Respondents is the unweighted count of responses. All percents in this table are based on the unweighted count of responses.
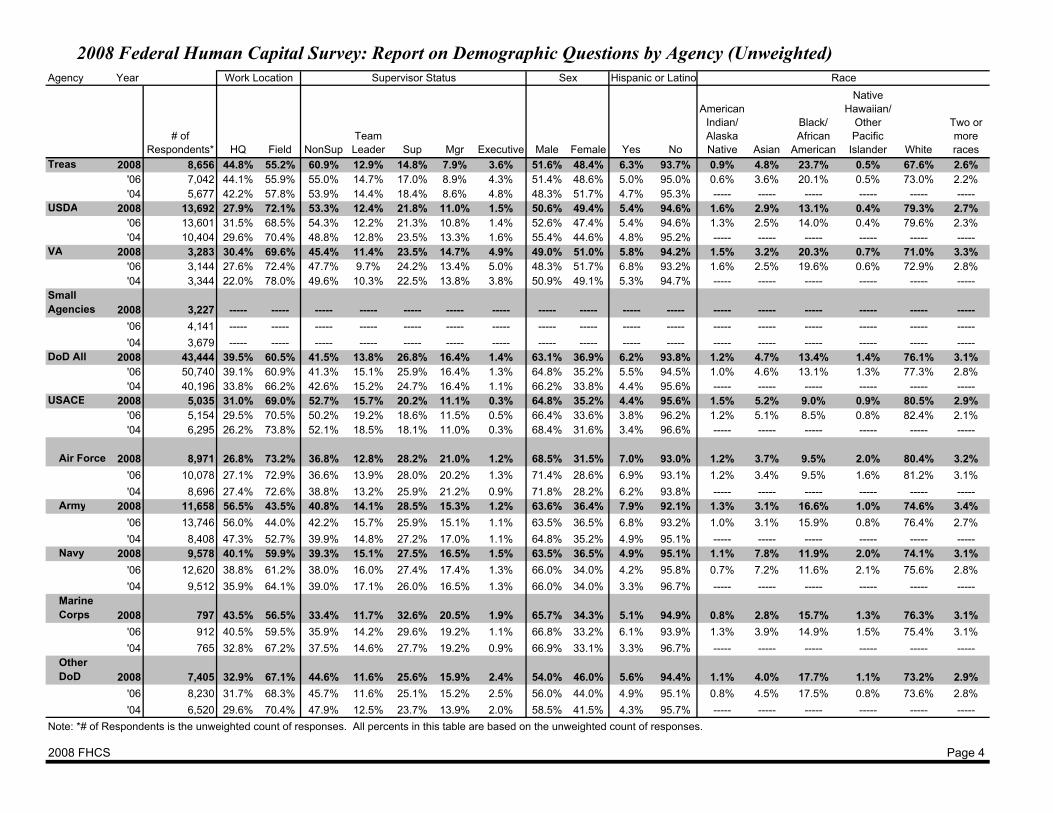
2008 Federal Human Capital Survey: Report on Demographic Questions by Agency (Unweighted)Agency Year
# of
Respondents* HQ Field NonSupTeam Leader Sup Mgr Executive Male Female Yes No
American Indian/ Alaska Native Asian
Black/ African
American
Native Hawaiian/
Other Pacific
Islander White
Two or more races
Treas 2008 8,656 44.8% 55.2% 60.9% 12.9% 14.8% 7.9% 3.6% 51.6% 48.4% 6.3% 93.7% 0.9% 4.8% 23.7% 0.5% 67.6% 2.6%Treas '06 7,042 44.1% 55.9% 55.0% 14.7% 17.0% 8.9% 4.3% 51.4% 48.6% 5.0% 95.0% 0.6% 3.6% 20.1% 0.5% 73.0% 2.2%Treas '04 5,677 42.2% 57.8% 53.9% 14.4% 18.4% 8.6% 4.8% 48.3% 51.7% 4.7% 95.3% ----- ----- ----- ----- ----- -----USDA 2008 13,692 27.9% 72.1% 53.3% 12.4% 21.8% 11.0% 1.5% 50.6% 49.4% 5.4% 94.6% 1.6% 2.9% 13.1% 0.4% 79.3% 2.7%USDA '06 13,601 31.5% 68.5% 54.3% 12.2% 21.3% 10.8% 1.4% 52.6% 47.4% 5.4% 94.6% 1.3% 2.5% 14.0% 0.4% 79.6% 2.3%USDA '04 10,404 29.6% 70.4% 48.8% 12.8% 23.5% 13.3% 1.6% 55.4% 44.6% 4.8% 95.2% ----- ----- ----- ----- ----- -----VA 2008 3,283 30.4% 69.6% 45.4% 11.4% 23.5% 14.7% 4.9% 49.0% 51.0% 5.8% 94.2% 1.5% 3.2% 20.3% 0.7% 71.0% 3.3%VA '06 3,144 27.6% 72.4% 47.7% 9.7% 24.2% 13.4% 5.0% 48.3% 51.7% 6.8% 93.2% 1.6% 2.5% 19.6% 0.6% 72.9% 2.8%VA '04 3,344 22.0% 78.0% 49.6% 10.3% 22.5% 13.8% 3.8% 50.9% 49.1% 5.3% 94.7% ----- ----- ----- ----- ----- -----Small Agencies 2008 3,227 ----- ----- ----- ----- ----- ----- ----- ----- ----- ----- ----- ----- ----- ----- ----- ----- -----Small Agenci '06 4,141 ----- ----- ----- ----- ----- ----- ----- ----- ----- ----- ----- ----- ----- ----- ----- ----- -----Small Agenci '04 3,679 ----- ----- ----- ----- ----- ----- ----- ----- ----- ----- ----- ----- ----- ----- ----- ----- -----DoD All 2008 43,444 39.5% 60.5% 41.5% 13.8% 26.8% 16.4% 1.4% 63.1% 36.9% 6.2% 93.8% 1.2% 4.7% 13.4% 1.4% 76.1% 3.1%DoD All '06 50,740 39.1% 60.9% 41.3% 15.1% 25.9% 16.4% 1.3% 64.8% 35.2% 5.5% 94.5% 1.0% 4.6% 13.1% 1.3% 77.3% 2.8%DOD '04 40,196 33.8% 66.2% 42.6% 15.2% 24.7% 16.4% 1.1% 66.2% 33.8% 4.4% 95.6% ----- ----- ----- ----- ----- -----USACE 2008 5,035 31.0% 69.0% 52.7% 15.7% 20.2% 11.1% 0.3% 64.8% 35.2% 4.4% 95.6% 1.5% 5.2% 9.0% 0.9% 80.5% 2.9%
USACE '06 5,154 29.5% 70.5% 50.2% 19.2% 18.6% 11.5% 0.5% 66.4% 33.6% 3.8% 96.2% 1.2% 5.1% 8.5% 0.8% 82.4% 2.1%ACE '04 6,295 26.2% 73.8% 52.1% 18.5% 18.1% 11.0% 0.3% 68.4% 31.6% 3.4% 96.6% ----- ----- ----- ----- ----- -----
Air Force 2008 8,971 26.8% 73.2% 36.8% 12.8% 28.2% 21.0% 1.2% 68.5% 31.5% 7.0% 93.0% 1.2% 3.7% 9.5% 2.0% 80.4% 3.2%Air Force '06 10,078 27.1% 72.9% 36.6% 13.9% 28.0% 20.2% 1.3% 71.4% 28.6% 6.9% 93.1% 1.2% 3.4% 9.5% 1.6% 81.2% 3.1%Air Force '04 8,696 27.4% 72.6% 38.8% 13.2% 25.9% 21.2% 0.9% 71.8% 28.2% 6.2% 93.8% ----- ----- ----- ----- ----- -----Army 2008 11,658 56.5% 43.5% 40.8% 14.1% 28.5% 15.3% 1.2% 63.6% 36.4% 7.9% 92.1% 1.3% 3.1% 16.6% 1.0% 74.6% 3.4%Army '06 13,746 56.0% 44.0% 42.2% 15.7% 25.9% 15.1% 1.1% 63.5% 36.5% 6.8% 93.2% 1.0% 3.1% 15.9% 0.8% 76.4% 2.7%Army '04 8,408 47.3% 52.7% 39.9% 14.8% 27.2% 17.0% 1.1% 64.8% 35.2% 4.9% 95.1% ----- ----- ----- ----- ----- -----Navy 2008 9,578 40.1% 59.9% 39.3% 15.1% 27.5% 16.5% 1.5% 63.5% 36.5% 4.9% 95.1% 1.1% 7.8% 11.9% 2.0% 74.1% 3.1%Navy '06 12,620 38.8% 61.2% 38.0% 16.0% 27.4% 17.4% 1.3% 66.0% 34.0% 4.2% 95.8% 0.7% 7.2% 11.6% 2.1% 75.6% 2.8%Navy '04 9,512 35.9% 64.1% 39.0% 17.1% 26.0% 16.5% 1.3% 66.0% 34.0% 3.3% 96.7% ----- ----- ----- ----- ----- -----Marine Corps 2008 797 43.5% 56.5% 33.4% 11.7% 32.6% 20.5% 1.9% 65.7% 34.3% 5.1% 94.9% 0.8% 2.8% 15.7% 1.3% 76.3% 3.1%Corps '06 912 40.5% 59.5% 35.9% 14.2% 29.6% 19.2% 1.1% 66.8% 33.2% 6.1% 93.9% 1.3% 3.9% 14.9% 1.5% 75.4% 3.1%Corps '04 765 32.8% 67.2% 37.5% 14.6% 27.7% 19.2% 0.9% 66.9% 33.1% 3.3% 96.7% ----- ----- ----- ----- ----- -----Other DoD 2008 7,405 32.9% 67.1% 44.6% 11.6% 25.6% 15.9% 2.4% 54.0% 46.0% 5.6% 94.4% 1.1% 4.0% 17.7% 1.1% 73.2% 2.9%
Other DoD '06 8,230 31.7% 68.3% 45.7% 11.6% 25.1% 15.2% 2.5% 56.0% 44.0% 4.9% 95.1% 0.8% 4.5% 17.5% 0.8% 73.6% 2.8%Other DoD '04 6,520 29.6% 70.4% 47.9% 12.5% 23.7% 13.9% 2.0% 58.5% 41.5% 4.3% 95.7% ----- ----- ----- ----- ----- -----
2008 FHCS Page 4
RaceWork Location Supervisor Status Hispanic or LatinoSex
Note: *# of Respondents is the unweighted count of responses. All percents in this table are based on the unweighted count of responses.

2008 Federal Human Capital Survey: Report on Demographic Questions by Agency (Unweighted)Agency Year
# of
Respondents* NoYes,
to retire
Yes,to other job
in Govt
Yes,to other job
outside Govt
Yes,other Within 1 year
Between1 and 3 years
Between3 and 5 years
5 or more years
25 and under 26-29 30-39 40-49 50-59
60 or older
All Responses 2008 212,223 68.6% 6.5% 17.9% 3.1% 3.9% 4.0% 11.7% 12.6% 71.7% 1.1% 3.1% 14.1% 30.7% 39.3% 11.8%Responses '06 221,479 69.2% 6.6% 16.4% 3.6% 4.2% 4.2% 11.6% 12.9% 71.3% 1.1% 2.9% 14.4% 32.2% 40.0% 9.3%Responses '04 147,914 70.4% 6.6% 15.7% 3.5% 3.8% 4.2% 11.4% 13.4% 71.0% ----- ----- 14.5% 32.6% 40.1% 8.9%AID 2008 831 67.1% 8.4% 13.5% 5.9% 5.1% 6.0% 14.9% 16.0% 63.1% 0.0% 1.9% 13.0% 31.8% 40.7% 12.6%AID '06 726 66.3% 7.9% 16.0% 6.2% 3.7% 4.8% 17.5% 14.5% 63.2% 0.4% 2.2% 14.2% 30.0% 41.7% 11.4%AID '04 803 66.3% 9.5% 14.6% 6.1% 3.6% 6.7% 18.4% 15.4% 59.4% ----- ----- 11.1% 29.8% 45.6% 12.8%BBG 2008 556 65.1% 6.3% 18.0% 4.3% 6.3% 3.6% 11.9% 13.8% 70.7% 0.5% 0.9% 9.4% 29.5% 41.0% 18.7%BBG '06 570 64.9% 8.8% 16.8% 3.9% 5.6% 4.4% 13.9% 12.5% 69.3% 0.4% 0.9% 10.7% 30.4% 41.4% 16.3%BBG '04 543 66.7% 7.4% 16.2% 5.5% 4.2% 4.8% 12.5% 12.0% 70.7% ----- ----- 10.5% 31.7% 41.6% 14.2%CSOSA 2008 604 57.3% 3.1% 32.8% 1.0% 5.8% 2.0% 4.8% 6.0% 87.3% 2.6% 6.3% 39.9% 30.3% 18.2% 2.6%CSOSA '06 518 52.7% 4.2% 34.4% 1.4% 7.3% 3.7% 6.6% 7.1% 82.6% 2.7% 10.8% 39.8% 26.6% 18.5% 1.5%CSOSA '04 554 ----- ----- ----- ----- ----- ----- ----- ----- ----- ----- ----- ----- ----- ----- -----DHS 2008 9,550 64.0% 4.3% 24.4% 2.8% 4.6% 2.6% 8.8% 9.6% 79.0% 1.5% 4.6% 21.8% 33.5% 30.5% 8.1%DHS '06 10,373 64.2% 5.5% 22.0% 3.6% 4.8% 3.6% 10.6% 11.0% 74.8% 0.6% 2.6% 20.4% 35.5% 34.1% 6.7%DHS '04 10,478 66.9% 5.2% 20.1% 3.8% 3.9% 3.5% 9.6% 11.6% 75.3% ----- ----- 22.3% 36.2% 31.9% 5.8%DOC 2008 3,556 71.2% 4.6% 15.9% 4.3% 4.0% 2.5% 10.3% 10.0% 77.1% 2.4% 4.5% 17.2% 33.3% 31.3% 11.3%DOC '06 5,204 71.5% 6.4% 13.9% 4.1% 4.2% 4.2% 9.8% 10.5% 75.4% 2.4% 3.9% 18.8% 31.4% 34.4% 9.1%DOC '04 4,021 73.0% 5.7% 13.2% 4.2% 3.8% 4.2% 11.2% 10.9% 73.7% ----- ----- 19.2% 32.1% 34.9% 9.5%DOE 2008 6,093 68.4% 6.7% 15.7% 4.6% 4.5% 4.4% 13.3% 13.0% 69.3% 1.0% 3.4% 12.5% 29.2% 41.3% 12.7%DOE '06 7,742 69.8% 7.5% 14.2% 4.6% 3.9% 4.7% 13.3% 13.9% 68.1% 1.1% 2.5% 11.9% 31.4% 43.0% 10.2%DOE '04 1,485 72.4% 8.8% 10.0% 5.1% 3.6% 6.8% 14.5% 15.2% 63.5% ----- ----- 10.0% 30.5% 46.2% 11.1%DOI 2008 27,030 67.8% 6.8% 18.2% 3.2% 4.0% 4.3% 11.9% 13.1% 70.6% 0.8% 2.5% 14.0% 29.0% 42.8% 10.9%DOI '06 25,507 69.0% 6.6% 16.3% 3.7% 4.4% 4.3% 11.6% 13.6% 70.5% 0.7% 2.6% 14.4% 30.7% 43.6% 8.1%DOI '04 5,187 71.3% 7.0% 15.2% 2.8% 3.6% 4.3% 11.4% 15.0% 69.2% ----- ----- 12.6% 31.9% 44.3% 8.0%DOJ 2008 14,021 74.2% 4.3% 15.0% 3.2% 3.4% 2.6% 9.4% 11.1% 76.9% 1.2% 3.8% 21.9% 36.3% 29.8% 6.9%DOJ '06 10,967 72.2% 4.7% 15.5% 4.0% 3.6% 2.8% 9.1% 10.9% 77.2% 1.1% 3.6% 23.9% 37.5% 28.5% 5.3%DOJ '04 7,701 72.9% 4.6% 15.1% 3.8% 3.6% 2.9% 8.6% 10.8% 77.7% ----- ----- 23.9% 39.2% 28.5% 4.4%DOL 2008 4,110 66.1% 8.4% 17.6% 3.6% 4.3% 4.9% 13.8% 13.2% 68.1% 1.0% 3.6% 13.8% 28.3% 39.3% 14.0%DOL '06 4,538 70.6% 7.7% 14.0% 3.6% 4.1% 4.3% 13.8% 13.8% 68.0% 0.9% 3.5% 13.8% 27.6% 42.8% 11.4%DOL '04 4,082 71.2% 6.7% 14.7% 3.8% 3.6% 4.2% 11.0% 13.2% 71.6% ----- ----- 15.8% 27.1% 42.2% 9.9%DOT 2008 6,354 70.2% 6.5% 16.9% 2.6% 3.7% 4.2% 11.6% 13.5% 70.8% 0.6% 3.2% 12.2% 31.2% 38.9% 14.0%DOT '06 5,453 67.4% 7.1% 17.4% 4.3% 3.9% 4.8% 12.5% 12.9% 69.8% 1.1% 3.1% 14.4% 30.5% 40.0% 11.0%DOT '04 4,951 70.0% 7.4% 15.5% 3.6% 3.5% 4.8% 10.7% 13.8% 70.7% ----- ----- 15.4% 30.6% 40.6% 10.4%
2008 FHCS Page 5
Age GroupRetiringLeaving
Note: *# of Respondents is the unweighted count of responses. All percents in this table are based on the unweighted count of responses.
2008 Federal Human Capital Survey: Report on Demographic Questions by Agency (Unweighted)Agency Year
# of
Respondents* NoYes,
to retire
Yes,to other job
in Govt
Yes,to other job
outside Govt
Yes,other Within 1 year
Between1 and 3 years
Between3 and 5 years
5 or more years
25 and under 26-29 30-39 40-49 50-59
60 or older
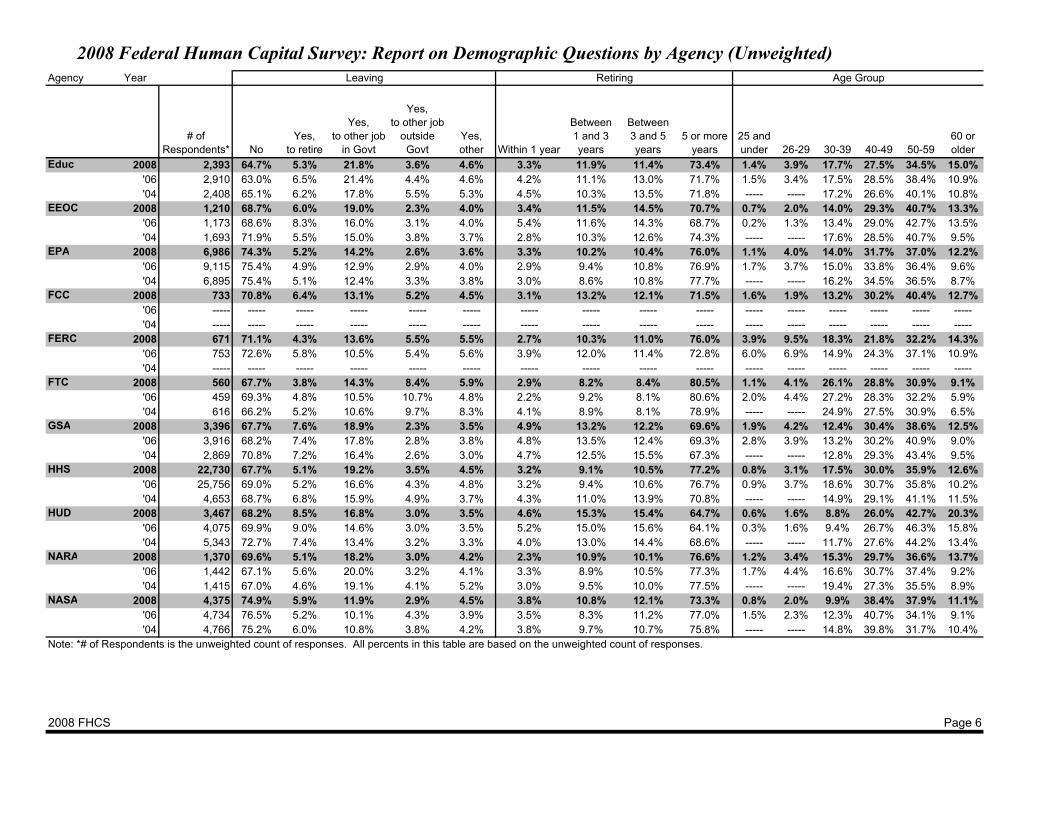
Educ 2008 2,393 64.7% 5.3% 21.8% 3.6% 4.6% 3.3% 11.9% 11.4% 73.4% 1.4% 3.9% 17.7% 27.5% 34.5% 15.0%Educ '06 2,910 63.0% 6.5% 21.4% 4.4% 4.6% 4.2% 11.1% 13.0% 71.7% 1.5% 3.4% 17.5% 28.5% 38.4% 10.9%Educ '04 2,408 65.1% 6.2% 17.8% 5.5% 5.3% 4.5% 10.3% 13.5% 71.8% ----- ----- 17.2% 26.6% 40.1% 10.8%EEOC 2008 1,210 68.7% 6.0% 19.0% 2.3% 4.0% 3.4% 11.5% 14.5% 70.7% 0.7% 2.0% 14.0% 29.3% 40.7% 13.3%EEOC '06 1,173 68.6% 8.3% 16.0% 3.1% 4.0% 5.4% 11.6% 14.3% 68.7% 0.2% 1.3% 13.4% 29.0% 42.7% 13.5%EEOC '04 1,693 71.9% 5.5% 15.0% 3.8% 3.7% 2.8% 10.3% 12.6% 74.3% ----- ----- 17.6% 28.5% 40.7% 9.5%EPA 2008 6,986 74.3% 5.2% 14.2% 2.6% 3.6% 3.3% 10.2% 10.4% 76.0% 1.1% 4.0% 14.0% 31.7% 37.0% 12.2%EPA '06 9,115 75.4% 4.9% 12.9% 2.9% 4.0% 2.9% 9.4% 10.8% 76.9% 1.7% 3.7% 15.0% 33.8% 36.4% 9.6%EPA '04 6,895 75.4% 5.1% 12.4% 3.3% 3.8% 3.0% 8.6% 10.8% 77.7% ----- ----- 16.2% 34.5% 36.5% 8.7%FCC 2008 733 70.8% 6.4% 13.1% 5.2% 4.5% 3.1% 13.2% 12.1% 71.5% 1.6% 1.9% 13.2% 30.2% 40.4% 12.7%FCC '06 ----- ----- ----- ----- ----- ----- ----- ----- ----- ----- ----- ----- ----- ----- ----- -----FCC '04 ----- ----- ----- ----- ----- ----- ----- ----- ----- ----- ----- ----- ----- ----- ----- -----FERC 2008 671 71.1% 4.3% 13.6% 5.5% 5.5% 2.7% 10.3% 11.0% 76.0% 3.9% 9.5% 18.3% 21.8% 32.2% 14.3%FERC '06 753 72.6% 5.8% 10.5% 5.4% 5.6% 3.9% 12.0% 11.4% 72.8% 6.0% 6.9% 14.9% 24.3% 37.1% 10.9%FERC '04 ----- ----- ----- ----- ----- ----- ----- ----- ----- ----- ----- ----- ----- ----- ----- -----FTC 2008 560 67.7% 3.8% 14.3% 8.4% 5.9% 2.9% 8.2% 8.4% 80.5% 1.1% 4.1% 26.1% 28.8% 30.9% 9.1%FTC '06 459 69.3% 4.8% 10.5% 10.7% 4.8% 2.2% 9.2% 8.1% 80.6% 2.0% 4.4% 27.2% 28.3% 32.2% 5.9%FTC '04 616 66.2% 5.2% 10.6% 9.7% 8.3% 4.1% 8.9% 8.1% 78.9% ----- ----- 24.9% 27.5% 30.9% 6.5%GSA 2008 3,396 67.7% 7.6% 18.9% 2.3% 3.5% 4.9% 13.2% 12.2% 69.6% 1.9% 4.2% 12.4% 30.4% 38.6% 12.5%GSA '06 3,916 68.2% 7.4% 17.8% 2.8% 3.8% 4.8% 13.5% 12.4% 69.3% 2.8% 3.9% 13.2% 30.2% 40.9% 9.0%GSA '04 2,869 70.8% 7.2% 16.4% 2.6% 3.0% 4.7% 12.5% 15.5% 67.3% ----- ----- 12.8% 29.3% 43.4% 9.5%HHS 2008 22,730 67.7% 5.1% 19.2% 3.5% 4.5% 3.2% 9.1% 10.5% 77.2% 0.8% 3.1% 17.5% 30.0% 35.9% 12.6%HHS '06 25,756 69.0% 5.2% 16.6% 4.3% 4.8% 3.2% 9.4% 10.6% 76.7% 0.9% 3.7% 18.6% 30.7% 35.8% 10.2%HHS '04 4,653 68.7% 6.8% 15.9% 4.9% 3.7% 4.3% 11.0% 13.9% 70.8% ----- ----- 14.9% 29.1% 41.1% 11.5%HUD 2008 3,467 68.2% 8.5% 16.8% 3.0% 3.5% 4.6% 15.3% 15.4% 64.7% 0.6% 1.6% 8.8% 26.0% 42.7% 20.3%HUD '06 4,075 69.9% 9.0% 14.6% 3.0% 3.5% 5.2% 15.0% 15.6% 64.1% 0.3% 1.6% 9.4% 26.7% 46.3% 15.8%HUD '04 5,343 72.7% 7.4% 13.4% 3.2% 3.3% 4.0% 13.0% 14.4% 68.6% ----- ----- 11.7% 27.6% 44.2% 13.4%NARA 2008 1,370 69.6% 5.1% 18.2% 3.0% 4.2% 2.3% 10.9% 10.1% 76.6% 1.2% 3.4% 15.3% 29.7% 36.6% 13.7%NARA '06 1,442 67.1% 5.6% 20.0% 3.2% 4.1% 3.3% 8.9% 10.5% 77.3% 1.7% 4.4% 16.6% 30.7% 37.4% 9.2%NARA '04 1,415 67.0% 4.6% 19.1% 4.1% 5.2% 3.0% 9.5% 10.0% 77.5% ----- ----- 19.4% 27.3% 35.5% 8.9%NASA 2008 4,375 74.9% 5.9% 11.9% 2.9% 4.5% 3.8% 10.8% 12.1% 73.3% 0.8% 2.0% 9.9% 38.4% 37.9% 11.1%NASA '06 4,734 76.5% 5.2% 10.1% 4.3% 3.9% 3.5% 8.3% 11.2% 77.0% 1.5% 2.3% 12.3% 40.7% 34.1% 9.1%NASA '04 4,766 75.2% 6.0% 10.8% 3.8% 4.2% 3.8% 9.7% 10.7% 75.8% ----- ----- 14.8% 39.8% 31.7% 10.4%
2008 FHCS Page 6
Age GroupRetiringLeaving
Note: *# of Respondents is the unweighted count of responses. All percents in this table are based on the unweighted count of responses.

2008 Federal Human Capital Survey: Report on Demographic Questions by Agency (Unweighted)Agency Year
# of
Respondents* NoYes,
to retire
Yes,to other job
in Govt
Yes,to other job
outside Govt
Yes,other Within 1 year
Between1 and 3 years
Between3 and 5 years
5 or more years
25 and under 26-29 30-39 40-49 50-59
60 or older
NCUA 2008 588 76.9% 4.9% 11.9% 3.4% 2.9% 2.9% 9.4% 9.4% 78.4% 2.4% 3.4% 16.5% 37.6% 31.6% 8.5%NCUA '06 623 80.1% 2.6% 9.8% 4.7% 2.9% 1.9% 7.9% 9.0% 81.2% 2.1% 2.2% 20.2% 37.1% 32.3% 6.1%NCUA '04 538 77.7% 3.9% 7.8% 5.8% 4.8% 3.2% 5.9% 12.6% 78.3% ----- ----- 18.8% 39.5% 34.1% 4.5%NLRB 2008 803 70.7% 8.7% 12.3% 4.4% 3.9% 5.9% 13.0% 15.1% 66.1% 0.7% 3.4% 16.3% 24.3% 39.5% 15.8%NLRB '06 963 73.7% 5.6% 12.2% 4.2% 4.4% 2.9% 12.3% 12.7% 72.2% 1.5% 5.0% 18.0% 25.5% 39.9% 10.2%NLRB '04 979 73.5% 4.7% 12.1% 5.8% 3.9% 2.2% 8.8% 13.6% 75.4% ----- ----- 18.1% 25.2% 37.9% 9.5%NRC 2008 2,179 79.6% 4.8% 9.3% 3.9% 2.4% 3.3% 10.3% 10.3% 76.0% 3.0% 6.8% 13.4% 27.4% 35.9% 13.5%NRC '06 1,692 77.4% 5.7% 10.4% 3.1% 3.5% 4.5% 9.7% 12.8% 73.1% 2.5% 5.1% 12.2% 31.0% 37.5% 11.7%NRC '04 1,876 78.8% 5.3% 9.8% 3.0% 3.0% 3.1% 10.9% 10.8% 75.2% ----- ----- 12.7% 31.7% 36.4% 12.0%NSF 2008 583 71.4% 5.5% 15.8% 3.6% 3.8% 2.7% 13.6% 12.7% 71.0% 0.5% 2.7% 14.8% 26.8% 37.0% 18.2%NSF '06 596 71.5% 6.9% 14.4% 2.2% 5.0% 4.0% 12.9% 13.1% 70.0% 0.8% 1.3% 15.9% 26.2% 38.9% 16.8%NSF '04 778 62.7% 5.5% 16.2% 5.5% 10.0% 4.2% 11.4% 11.7% 72.6% ----- ----- 17.1% 23.3% 38.0% 16.2%OMB 2008 253 61.3% 3.6% 21.7% 8.7% 4.7% 3.6% 5.1% 4.7% 86.6% 2.8% 14.2% 37.9% 22.9% 16.2% 5.9%OMB '06 250 56.0% 4.4% 19.2% 12.0% 8.4% 3.6% 8.0% 4.8% 83.6% 2.4% 11.2% 40.4% 20.4% 18.4% 7.2%OMB '04 249 57.8% 6.0% 18.1% 8.4% 9.6% 4.4% 6.4% 8.4% 80.7% ----- ----- 36.1% 21.7% 22.5% 6.4%OPM 2008 2,932 69.8% 5.2% 20.7% 1.4% 2.9% 3.1% 11.1% 11.1% 74.7% 2.3% 6.7% 16.7% 30.1% 35.5% 8.7%OPM '06 3,012 67.6% 6.0% 20.3% 2.0% 4.1% 3.8% 11.5% 13.3% 71.4% 1.6% 4.4% 15.2% 32.9% 38.4% 7.5%OPM '04 1,539 64.8% 5.8% 21.8% 2.6% 4.9% 4.1% 10.1% 12.6% 73.2% ----- ----- 19.2% 33.1% 35.6% 7.1%PBGC 2008 515 61.6% 4.9% 26.0% 2.9% 4.7% 3.3% 9.5% 7.8% 79.4% 2.3% 2.3% 23.1% 32.0% 30.3% 9.9%PBGC '06 ----- ----- ----- ----- ----- ----- ----- ----- ----- ----- ----- ----- ----- ----- ----- -----PBGC '04 ----- ----- ----- ----- ----- ----- ----- ----- ----- ----- ----- ----- ----- ----- ----- -----RRB 2008 570 82.1% 8.1% 7.0% 1.2% 1.6% 3.3% 19.6% 17.0% 60.0% 0.2% 0.7% 6.3% 30.4% 50.5% 11.9%RRB '06 680 79.9% 8.1% 9.0% 1.3% 1.8% 3.1% 15.1% 19.3% 62.5% 0.3% 0.6% 8.5% 35.4% 48.4% 6.8%RRB '04 700 80.3% 10.1% 6.3% 1.0% 2.3% 6.7% 12.6% 15.4% 65.3% ----- ----- 12.9% 33.0% 45.5% 7.7%SBA 2008 1,618 69.8% 6.5% 18.3% 1.9% 3.5% 3.8% 14.7% 13.5% 68.0% 0.5% 1.2% 8.8% 27.5% 43.8% 18.2%SBA '06 1,447 67.9% 5.0% 19.3% 4.0% 3.8% 3.3% 13.7% 17.3% 65.7% 0.3% 1.2% 9.8% 28.1% 46.3% 14.4%SBA '04 1,661 66.8% 8.0% 16.6% 4.0% 4.6% 5.4% 13.5% 15.4% 65.7% ----- ----- 11.1% 27.6% 46.0% 14.4%SEC 2008 1,605 72.5% 3.2% 9.5% 8.8% 5.9% 1.5% 5.9% 6.6% 86.0% 0.4% 4.5% 31.1% 32.1% 24.2% 7.6%SEC '06 1,905 71.7% 2.8% 7.8% 12.1% 5.6% 1.8% 5.8% 5.7% 86.7% 1.7% 6.5% 33.2% 30.8% 21.9% 5.8%SEC '04 2,166 74.6% 2.8% 6.5% 10.5% 5.7% 1.8% 4.9% 5.1% 88.1% ----- ----- 33.9% 28.2% 20.1% 5.0%SSA 2008 5,959 76.7% 9.5% 9.9% 1.5% 2.3% 5.3% 15.4% 14.4% 64.9% 0.7% 4.0% 14.1% 24.5% 43.6% 13.0%SSA '06 1,317 78.6% 10.5% 6.4% 2.7% 1.8% 6.2% 17.4% 15.9% 60.5% 1.7% 3.0% 13.4% 24.0% 48.3% 9.7%SSA '04 1,172 79.1% 9.6% 6.1% 3.0% 2.2% 5.0% 17.8% 15.9% 61.3% ----- ----- 10.7% 24.3% 52.4% 7.8%State 2008 1,720 72.8% 7.3% 11.2% 5.3% 3.4% 4.0% 14.2% 16.4% 65.5% 0.8% 4.0% 16.9% 28.8% 37.9% 11.5%State '06 1,310 73.4% 10.8% 7.9% 5.0% 3.1% 7.5% 15.7% 17.8% 59.0% 0.5% 1.8% 11.9% 27.6% 47.5% 10.7%State '04 1,272 75.3% 9.2% 6.9% 5.3% 3.3% 5.7% 16.7% 18.2% 59.4% ----- ----- 11.9% 29.2% 48.7% 8.0%
2008 FHCS Page 7
Age GroupRetiringLeaving
Note: *# of Respondents is the unweighted count of responses. All percents in this table are based on the unweighted count of responses.
2008 Federal Human Capital Survey: Report on Demographic Questions by Agency (Unweighted)Agency Year
# of
Respondents* NoYes,
to retire
Yes,to other job
in Govt
Yes,to other job
outside Govt
Yes,other Within 1 year
Between1 and 3 years
Between3 and 5 years
5 or more years
25 and under 26-29 30-39 40-49 50-59
60 or older
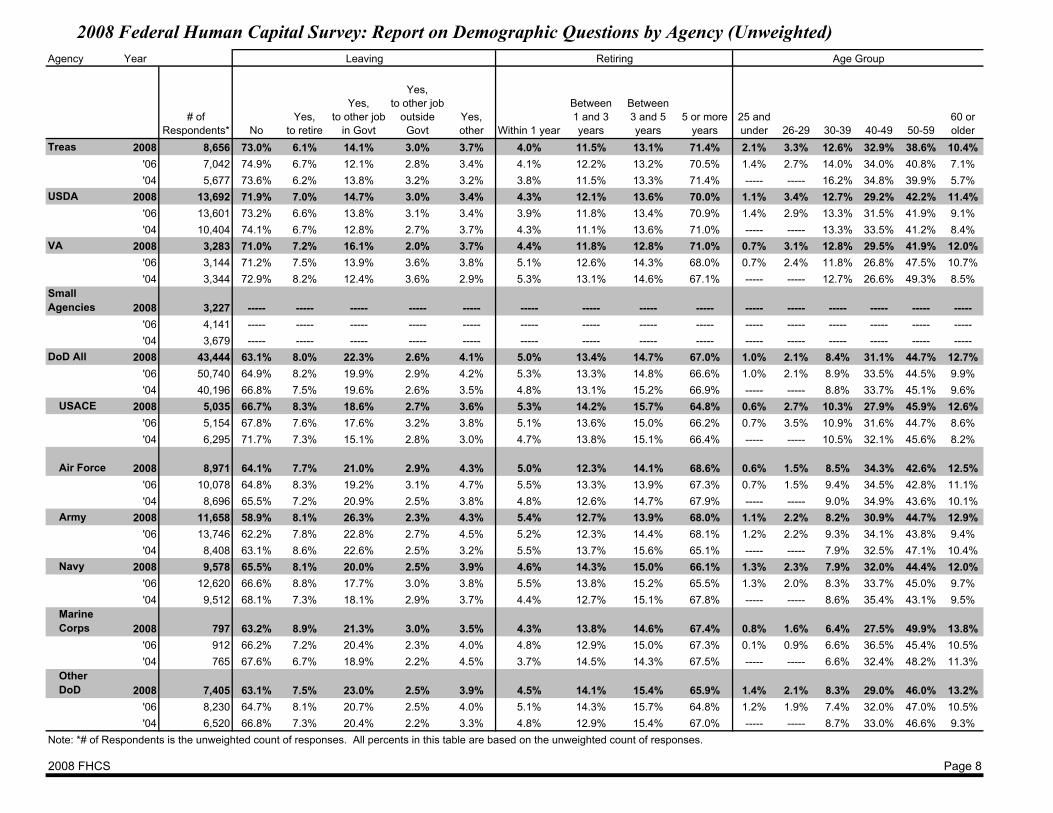
Treas 2008 8,656 73.0% 6.1% 14.1% 3.0% 3.7% 4.0% 11.5% 13.1% 71.4% 2.1% 3.3% 12.6% 32.9% 38.6% 10.4%Treas '06 7,042 74.9% 6.7% 12.1% 2.8% 3.4% 4.1% 12.2% 13.2% 70.5% 1.4% 2.7% 14.0% 34.0% 40.8% 7.1%Treas '04 5,677 73.6% 6.2% 13.8% 3.2% 3.2% 3.8% 11.5% 13.3% 71.4% ----- ----- 16.2% 34.8% 39.9% 5.7%USDA 2008 13,692 71.9% 7.0% 14.7% 3.0% 3.4% 4.3% 12.1% 13.6% 70.0% 1.1% 3.4% 12.7% 29.2% 42.2% 11.4%USDA '06 13,601 73.2% 6.6% 13.8% 3.1% 3.4% 3.9% 11.8% 13.4% 70.9% 1.4% 2.9% 13.3% 31.5% 41.9% 9.1%USDA '04 10,404 74.1% 6.7% 12.8% 2.7% 3.7% 4.3% 11.1% 13.6% 71.0% ----- ----- 13.3% 33.5% 41.2% 8.4%VA 2008 3,283 71.0% 7.2% 16.1% 2.0% 3.7% 4.4% 11.8% 12.8% 71.0% 0.7% 3.1% 12.8% 29.5% 41.9% 12.0%VA '06 3,144 71.2% 7.5% 13.9% 3.6% 3.8% 5.1% 12.6% 14.3% 68.0% 0.7% 2.4% 11.8% 26.8% 47.5% 10.7%VA '04 3,344 72.9% 8.2% 12.4% 3.6% 2.9% 5.3% 13.1% 14.6% 67.1% ----- ----- 12.7% 26.6% 49.3% 8.5%Small Agencies 2008 3,227 ----- ----- ----- ----- ----- ----- ----- ----- ----- ----- ----- ----- ----- ----- -----Small Agenci '06 4,141 ----- ----- ----- ----- ----- ----- ----- ----- ----- ----- ----- ----- ----- ----- -----Small Agenci '04 3,679 ----- ----- ----- ----- ----- ----- ----- ----- ----- ----- ----- ----- ----- ----- -----DoD All 2008 43,444 63.1% 8.0% 22.3% 2.6% 4.1% 5.0% 13.4% 14.7% 67.0% 1.0% 2.1% 8.4% 31.1% 44.7% 12.7%DoD All '06 50,740 64.9% 8.2% 19.9% 2.9% 4.2% 5.3% 13.3% 14.8% 66.6% 1.0% 2.1% 8.9% 33.5% 44.5% 9.9%DOD '04 40,196 66.8% 7.5% 19.6% 2.6% 3.5% 4.8% 13.1% 15.2% 66.9% ----- ----- 8.8% 33.7% 45.1% 9.6%
USACE 2008 5,035 66.7% 8.3% 18.6% 2.7% 3.6% 5.3% 14.2% 15.7% 64.8% 0.6% 2.7% 10.3% 27.9% 45.9% 12.6%USACE '06 5,154 67.8% 7.6% 17.6% 3.2% 3.8% 5.1% 13.6% 15.0% 66.2% 0.7% 3.5% 10.9% 31.6% 44.7% 8.6%ACE '04 6,295 71.7% 7.3% 15.1% 2.8% 3.0% 4.7% 13.8% 15.1% 66.4% ----- ----- 10.5% 32.1% 45.6% 8.2%
Air Force 2008 8,971 64.1% 7.7% 21.0% 2.9% 4.3% 5.0% 12.3% 14.1% 68.6% 0.6% 1.5% 8.5% 34.3% 42.6% 12.5%Air Force '06 10,078 64.8% 8.3% 19.2% 3.1% 4.7% 5.5% 13.3% 13.9% 67.3% 0.7% 1.5% 9.4% 34.5% 42.8% 11.1%Air Force '04 8,696 65.5% 7.2% 20.9% 2.5% 3.8% 4.8% 12.6% 14.7% 67.9% ----- ----- 9.0% 34.9% 43.6% 10.1%
Army 2008 11,658 58.9% 8.1% 26.3% 2.3% 4.3% 5.4% 12.7% 13.9% 68.0% 1.1% 2.2% 8.2% 30.9% 44.7% 12.9%Army '06 13,746 62.2% 7.8% 22.8% 2.7% 4.5% 5.2% 12.3% 14.4% 68.1% 1.2% 2.2% 9.3% 34.1% 43.8% 9.4%Army '04 8,408 63.1% 8.6% 22.6% 2.5% 3.2% 5.5% 13.7% 15.6% 65.1% ----- ----- 7.9% 32.5% 47.1% 10.4%
Navy 2008 9,578 65.5% 8.1% 20.0% 2.5% 3.9% 4.6% 14.3% 15.0% 66.1% 1.3% 2.3% 7.9% 32.0% 44.4% 12.0%Navy '06 12,620 66.6% 8.8% 17.7% 3.0% 3.8% 5.5% 13.8% 15.2% 65.5% 1.3% 2.0% 8.3% 33.7% 45.0% 9.7%Navy '04 9,512 68.1% 7.3% 18.1% 2.9% 3.7% 4.4% 12.7% 15.1% 67.8% ----- ----- 8.6% 35.4% 43.1% 9.5%
Marine Corps 2008 797 63.2% 8.9% 21.3% 3.0% 3.5% 4.3% 13.8% 14.6% 67.4% 0.8% 1.6% 6.4% 27.5% 49.9% 13.8%
Marine Corp '06 912 66.2% 7.2% 20.4% 2.3% 4.0% 4.8% 12.9% 15.0% 67.3% 0.1% 0.9% 6.6% 36.5% 45.4% 10.5%Marine Corp '04 765 67.6% 6.7% 18.9% 2.2% 4.5% 3.7% 14.5% 14.3% 67.5% ----- ----- 6.6% 32.4% 48.2% 11.3%
Other DoD 2008 7,405 63.1% 7.5% 23.0% 2.5% 3.9% 4.5% 14.1% 15.4% 65.9% 1.4% 2.1% 8.3% 29.0% 46.0% 13.2%
Other DoD '06 8,230 64.7% 8.1% 20.7% 2.5% 4.0% 5.1% 14.3% 15.7% 64.8% 1.2% 1.9% 7.4% 32.0% 47.0% 10.5%Other DoD '04 6,520 66.8% 7.3% 20.4% 2.2% 3.3% 4.8% 12.9% 15.4% 67.0% ----- ----- 8.7% 33.0% 46.6% 9.3%
2008 FHCS Page 8
Age GroupRetiringLeaving
Note: *# of Respondents is the unweighted count of responses. All percents in this table are based on the unweighted count of responses.
2008 Federal Human Capital Survey: Report on Demographic Questions by Agency (Unweighted)Agency Year
# of
Respondents*
Federal Wage
System
GS 1-6or
equivalent
GS 7-12or
equivalent
GS 13-15or
equivalent
SESor
equivalentSL/ ST Other
Less than
1 year
1 to 3years
4 to 5years
6 to 10years
11 to 14
years
15 to 20
years
More than 20
years
Less than
1 year
1 to 3years
4 to 5years
6 to 10years
11 to 20
years
More than 20
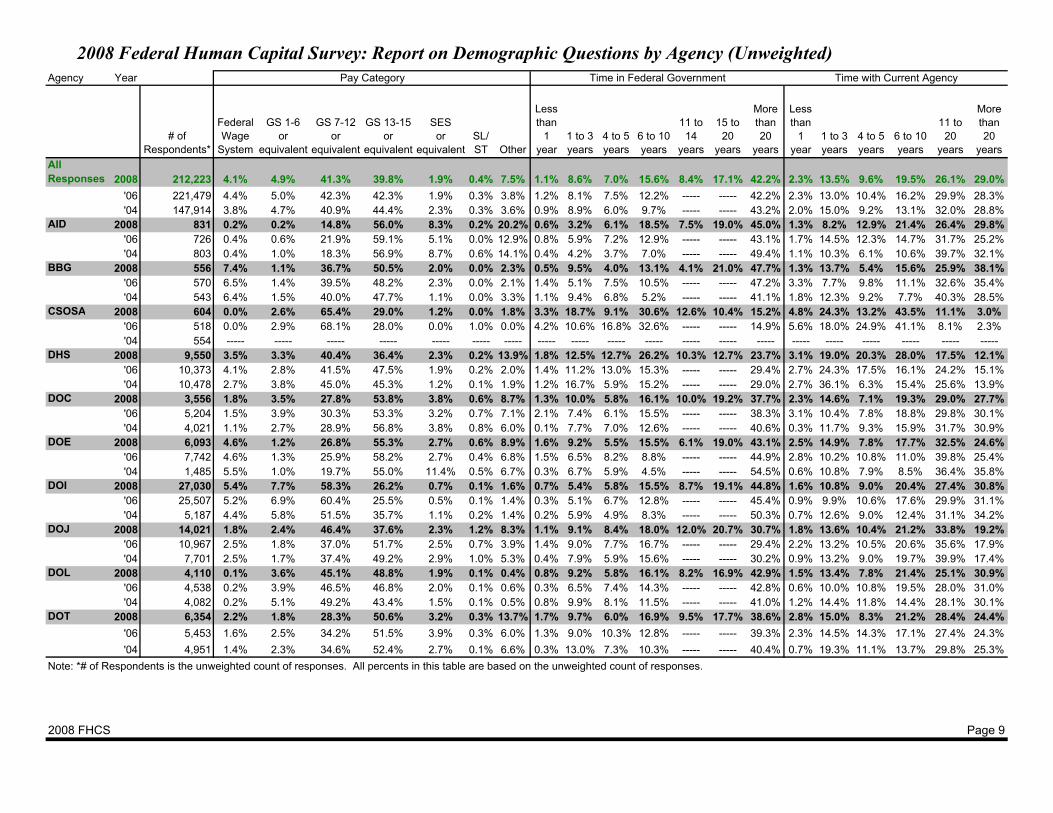
yearsAll Responses 2008 212,223 4.1% 4.9% 41.3% 39.8% 1.9% 0.4% 7.5% 1.1% 8.6% 7.0% 15.6% 8.4% 17.1% 42.2% 2.3% 13.5% 9.6% 19.5% 26.1% 29.0%Responses '06 221,479 4.4% 5.0% 42.3% 42.3% 1.9% 0.3% 3.8% 1.2% 8.1% 7.5% 12.2% ----- ----- 42.2% 2.3% 13.0% 10.4% 16.2% 29.9% 28.3%Responses '04 147,914 3.8% 4.7% 40.9% 44.4% 2.3% 0.3% 3.6% 0.9% 8.9% 6.0% 9.7% ----- ----- 43.2% 2.0% 15.0% 9.2% 13.1% 32.0% 28.8%AID 2008 831 0.2% 0.2% 14.8% 56.0% 8.3% 0.2% 20.2% 0.6% 3.2% 6.1% 18.5% 7.5% 19.0% 45.0% 1.3% 8.2% 12.9% 21.4% 26.4% 29.8%AID '06 726 0.4% 0.6% 21.9% 59.1% 5.1% 0.0% 12.9% 0.8% 5.9% 7.2% 12.9% ----- ----- 43.1% 1.7% 14.5% 12.3% 14.7% 31.7% 25.2%AID '04 803 0.4% 1.0% 18.3% 56.9% 8.7% 0.6% 14.1% 0.4% 4.2% 3.7% 7.0% ----- ----- 49.4% 1.1% 10.3% 6.1% 10.6% 39.7% 32.1%BBG 2008 556 7.4% 1.1% 36.7% 50.5% 2.0% 0.0% 2.3% 0.5% 9.5% 4.0% 13.1% 4.1% 21.0% 47.7% 1.3% 13.7% 5.4% 15.6% 25.9% 38.1%BBG '06 570 6.5% 1.4% 39.5% 48.2% 2.3% 0.0% 2.1% 1.4% 5.1% 7.5% 10.5% ----- ----- 47.2% 3.3% 7.7% 9.8% 11.1% 32.6% 35.4%BBG '04 543 6.4% 1.5% 40.0% 47.7% 1.1% 0.0% 3.3% 1.1% 9.4% 6.8% 5.2% ----- ----- 41.1% 1.8% 12.3% 9.2% 7.7% 40.3% 28.5%CSOSA 2008 604 0.0% 2.6% 65.4% 29.0% 1.2% 0.0% 1.8% 3.3% 18.7% 9.1% 30.6% 12.6% 10.4% 15.2% 4.8% 24.3% 13.2% 43.5% 11.1% 3.0%CSOSA '06 518 0.0% 2.9% 68.1% 28.0% 0.0% 1.0% 0.0% 4.2% 10.6% 16.8% 32.6% ----- ----- 14.9% 5.6% 18.0% 24.9% 41.1% 8.1% 2.3%CSOSA '04 554 ----- ----- ----- ----- ----- ----- ----- ----- ----- ----- ----- ----- ----- ----- ----- ----- ----- ----- ----- -----DHS 2008 9,550 3.5% 3.3% 40.4% 36.4% 2.3% 0.2% 13.9% 1.8% 12.5% 12.7% 26.2% 10.3% 12.7% 23.7% 3.1% 19.0% 20.3% 28.0% 17.5% 12.1%DHS '06 10,373 4.1% 2.8% 41.5% 47.5% 1.9% 0.2% 2.0% 1.4% 11.2% 13.0% 15.3% ----- ----- 29.4% 2.7% 24.3% 17.5% 16.1% 24.2% 15.1%DHS '04 10,478 2.7% 3.8% 45.0% 45.3% 1.2% 0.1% 1.9% 1.2% 16.7% 5.9% 15.2% ----- ----- 29.0% 2.7% 36.1% 6.3% 15.4% 25.6% 13.9%DOC 2008 3,556 1.8% 3.5% 27.8% 53.8% 3.8% 0.6% 8.7% 1.3% 10.0% 5.8% 16.1% 10.0% 19.2% 37.7% 2.3% 14.6% 7.1% 19.3% 29.0% 27.7%DOC '06 5,204 1.5% 3.9% 30.3% 53.3% 3.2% 0.7% 7.1% 2.1% 7.4% 6.1% 15.5% ----- ----- 38.3% 3.1% 10.4% 7.8% 18.8% 29.8% 30.1%DOC '04 4,021 1.1% 2.7% 28.9% 56.8% 3.8% 0.8% 6.0% 0.1% 7.7% 7.0% 12.6% ----- ----- 40.6% 0.3% 11.7% 9.3% 15.9% 31.7% 30.9%DOE 2008 6,093 4.6% 1.2% 26.8% 55.3% 2.7% 0.6% 8.9% 1.6% 9.2% 5.5% 15.5% 6.1% 19.0% 43.1% 2.5% 14.9% 7.8% 17.7% 32.5% 24.6%DOE '06 7,742 4.6% 1.3% 25.9% 58.2% 2.7% 0.4% 6.8% 1.5% 6.5% 8.2% 8.8% ----- ----- 44.9% 2.8% 10.2% 10.8% 11.0% 39.8% 25.4%DOE '04 1,485 5.5% 1.0% 19.7% 55.0% 11.4% 0.5% 6.7% 0.3% 6.7% 5.9% 4.5% ----- ----- 54.5% 0.6% 10.8% 7.9% 8.5% 36.4% 35.8%DOI 2008 27,030 5.4% 7.7% 58.3% 26.2% 0.7% 0.1% 1.6% 0.7% 5.4% 5.8% 15.5% 8.7% 19.1% 44.8% 1.6% 10.8% 9.0% 20.4% 27.4% 30.8%DOI '06 25,507 5.2% 6.9% 60.4% 25.5% 0.5% 0.1% 1.4% 0.3% 5.1% 6.7% 12.8% ----- ----- 45.4% 0.9% 9.9% 10.6% 17.6% 29.9% 31.1%DOI '04 5,187 4.4% 5.8% 51.5% 35.7% 1.1% 0.2% 1.4% 0.2% 5.9% 4.9% 8.3% ----- ----- 50.3% 0.7% 12.6% 9.0% 12.4% 31.1% 34.2%DOJ 2008 14,021 1.8% 2.4% 46.4% 37.6% 2.3% 1.2% 8.3% 1.1% 9.1% 8.4% 18.0% 12.0% 20.7% 30.7% 1.8% 13.6% 10.4% 21.2% 33.8% 19.2%DOJ '06 10,967 2.5% 1.8% 37.0% 51.7% 2.5% 0.7% 3.9% 1.4% 9.0% 7.7% 16.7% ----- ----- 29.4% 2.2% 13.2% 10.5% 20.6% 35.6% 17.9%DOJ '04 7,701 2.5% 1.7% 37.4% 49.2% 2.9% 1.0% 5.3% 0.4% 7.9% 5.9% 15.6% ----- ----- 30.2% 0.9% 13.2% 9.0% 19.7% 39.9% 17.4%DOL 2008 4,110 0.1% 3.6% 45.1% 48.8% 1.9% 0.1% 0.4% 0.8% 9.2% 5.8% 16.1% 8.2% 16.9% 42.9% 1.5% 13.4% 7.8% 21.4% 25.1% 30.9%DOL '06 4,538 0.2% 3.9% 46.5% 46.8% 2.0% 0.1% 0.6% 0.3% 6.5% 7.4% 14.3% ----- ----- 42.8% 0.6% 10.0% 10.8% 19.5% 28.0% 31.0%DOL '04 4,082 0.2% 5.1% 49.2% 43.4% 1.5% 0.1% 0.5% 0.8% 9.9% 8.1% 11.5% ----- ----- 41.0% 1.2% 14.4% 11.8% 14.4% 28.1% 30.1%DOT 2008 6,354 2.2% 1.8% 28.3% 50.6% 3.2% 0.3% 13.7% 1.7% 9.7% 6.0% 16.9% 9.5% 17.7% 38.6% 2.8% 15.0% 8.3% 21.2% 28.4% 24.4%DOT '06 5,453 1.6% 2.5% 34.2% 51.5% 3.9% 0.3% 6.0% 1.3% 9.0% 10.3% 12.8% ----- ----- 39.3% 2.3% 14.5% 14.3% 17.1% 27.4% 24.3%DOT '04 4,951 1.4% 2.3% 34.6% 52.4% 2.7% 0.1% 6.6% 0.3% 13.0% 7.3% 10.3% ----- ----- 40.4% 0.7% 19.3% 11.1% 13.7% 29.8% 25.3%
2008 FHCS Page 9
Time with Current AgencyPay Category Time in Federal Government
Note: *# of Respondents is the unweighted count of responses. All percents in this table are based on the unweighted count of responses.
2008 Federal Human Capital Survey: Report on Demographic Questions by Agency (Unweighted)Agency Year
# of
Respondents*
Federal Wage
System
GS 1-6or
equivalent
GS 7-12or
equivalent
GS 13-15or
equivalent
SESor
equivalentSL/ ST Other
Less than
1 year
1 to 3years
4 to 5years
6 to 10years
11 to 14
years
15 to 20
years
More than 20
years
Less than
1 year
1 to 3years
4 to 5years
6 to 10years
11 to 20
years
More than 20
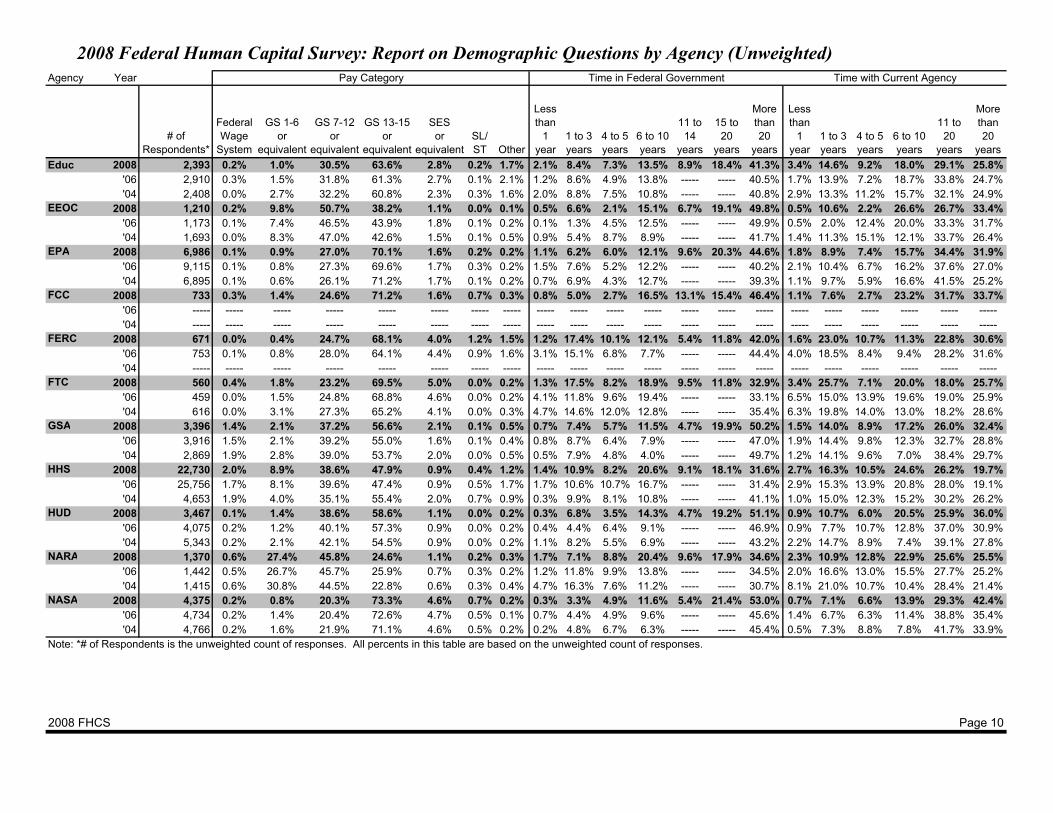
yearsEduc 2008 2,393 0.2% 1.0% 30.5% 63.6% 2.8% 0.2% 1.7% 2.1% 8.4% 7.3% 13.5% 8.9% 18.4% 41.3% 3.4% 14.6% 9.2% 18.0% 29.1% 25.8%Educ '06 2,910 0.3% 1.5% 31.8% 61.3% 2.7% 0.1% 2.1% 1.2% 8.6% 4.9% 13.8% ----- ----- 40.5% 1.7% 13.9% 7.2% 18.7% 33.8% 24.7%Educ '04 2,408 0.0% 2.7% 32.2% 60.8% 2.3% 0.3% 1.6% 2.0% 8.8% 7.5% 10.8% ----- ----- 40.8% 2.9% 13.3% 11.2% 15.7% 32.1% 24.9%EEOC 2008 1,210 0.2% 9.8% 50.7% 38.2% 1.1% 0.0% 0.1% 0.5% 6.6% 2.1% 15.1% 6.7% 19.1% 49.8% 0.5% 10.6% 2.2% 26.6% 26.7% 33.4%EEOC '06 1,173 0.1% 7.4% 46.5% 43.9% 1.8% 0.1% 0.2% 0.1% 1.3% 4.5% 12.5% ----- ----- 49.9% 0.5% 2.0% 12.4% 20.0% 33.3% 31.7%EEOC '04 1,693 0.0% 8.3% 47.0% 42.6% 1.5% 0.1% 0.5% 0.9% 5.4% 8.7% 8.9% ----- ----- 41.7% 1.4% 11.3% 15.1% 12.1% 33.7% 26.4%EPA 2008 6,986 0.1% 0.9% 27.0% 70.1% 1.6% 0.2% 0.2% 1.1% 6.2% 6.0% 12.1% 9.6% 20.3% 44.6% 1.8% 8.9% 7.4% 15.7% 34.4% 31.9%EPA '06 9,115 0.1% 0.8% 27.3% 69.6% 1.7% 0.3% 0.2% 1.5% 7.6% 5.2% 12.2% ----- ----- 40.2% 2.1% 10.4% 6.7% 16.2% 37.6% 27.0%EPA '04 6,895 0.1% 0.6% 26.1% 71.2% 1.7% 0.1% 0.2% 0.7% 6.9% 4.3% 12.7% ----- ----- 39.3% 1.1% 9.7% 5.9% 16.6% 41.5% 25.2%FCC 2008 733 0.3% 1.4% 24.6% 71.2% 1.6% 0.7% 0.3% 0.8% 5.0% 2.7% 16.5% 13.1% 15.4% 46.4% 1.1% 7.6% 2.7% 23.2% 31.7% 33.7%FCC '06 ----- ----- ----- ----- ----- ----- ----- ----- ----- ----- ----- ----- ----- ----- ----- ----- ----- ----- ----- ----- -----FCC '04 ----- ----- ----- ----- ----- ----- ----- ----- ----- ----- ----- ----- ----- ----- ----- ----- ----- ----- ----- ----- -----FERC 2008 671 0.0% 0.4% 24.7% 68.1% 4.0% 1.2% 1.5% 1.2% 17.4% 10.1% 12.1% 5.4% 11.8% 42.0% 1.6% 23.0% 10.7% 11.3% 22.8% 30.6%FERC '06 753 0.1% 0.8% 28.0% 64.1% 4.4% 0.9% 1.6% 3.1% 15.1% 6.8% 7.7% ----- ----- 44.4% 4.0% 18.5% 8.4% 9.4% 28.2% 31.6%FERC '04 ----- ----- ----- ----- ----- ----- ----- ----- ----- ----- ----- ----- ----- ----- ----- ----- ----- ----- ----- ----- -----FTC 2008 560 0.4% 1.8% 23.2% 69.5% 5.0% 0.0% 0.2% 1.3% 17.5% 8.2% 18.9% 9.5% 11.8% 32.9% 3.4% 25.7% 7.1% 20.0% 18.0% 25.7%FTC '06 459 0.0% 1.5% 24.8% 68.8% 4.6% 0.0% 0.2% 4.1% 11.8% 9.6% 19.4% ----- ----- 33.1% 6.5% 15.0% 13.9% 19.6% 19.0% 25.9%FTC '04 616 0.0% 3.1% 27.3% 65.2% 4.1% 0.0% 0.3% 4.7% 14.6% 12.0% 12.8% ----- ----- 35.4% 6.3% 19.8% 14.0% 13.0% 18.2% 28.6%GSA 2008 3,396 1.4% 2.1% 37.2% 56.6% 2.1% 0.1% 0.5% 0.7% 7.4% 5.7% 11.5% 4.7% 19.9% 50.2% 1.5% 14.0% 8.9% 17.2% 26.0% 32.4%GSA '06 3,916 1.5% 2.1% 39.2% 55.0% 1.6% 0.1% 0.4% 0.8% 8.7% 6.4% 7.9% ----- ----- 47.0% 1.9% 14.4% 9.8% 12.3% 32.7% 28.8%GSA '04 2,869 1.9% 2.8% 39.0% 53.7% 2.0% 0.0% 0.5% 0.5% 7.9% 4.8% 4.0% ----- ----- 49.7% 1.2% 14.1% 9.6% 7.0% 38.4% 29.7%HHS 2008 22,730 2.0% 8.9% 38.6% 47.9% 0.9% 0.4% 1.2% 1.4% 10.9% 8.2% 20.6% 9.1% 18.1% 31.6% 2.7% 16.3% 10.5% 24.6% 26.2% 19.7%HHS '06 25,756 1.7% 8.1% 39.6% 47.4% 0.9% 0.5% 1.7% 1.7% 10.6% 10.7% 16.7% ----- ----- 31.4% 2.9% 15.3% 13.9% 20.8% 28.0% 19.1%HHS '04 4,653 1.9% 4.0% 35.1% 55.4% 2.0% 0.7% 0.9% 0.3% 9.9% 8.1% 10.8% ----- ----- 41.1% 1.0% 15.0% 12.3% 15.2% 30.2% 26.2%HUD 2008 3,467 0.1% 1.4% 38.6% 58.6% 1.1% 0.0% 0.2% 0.3% 6.8% 3.5% 14.3% 4.7% 19.2% 51.1% 0.9% 10.7% 6.0% 20.5% 25.9% 36.0%HUD '06 4,075 0.2% 1.2% 40.1% 57.3% 0.9% 0.0% 0.2% 0.4% 4.4% 6.4% 9.1% ----- ----- 46.9% 0.9% 7.7% 10.7% 12.8% 37.0% 30.9%HUD '04 5,343 0.2% 2.1% 42.1% 54.5% 0.9% 0.0% 0.2% 1.1% 8.2% 5.5% 6.9% ----- ----- 43.2% 2.2% 14.7% 8.9% 7.4% 39.1% 27.8%NARA 2008 1,370 0.6% 27.4% 45.8% 24.6% 1.1% 0.2% 0.3% 1.7% 7.1% 8.8% 20.4% 9.6% 17.9% 34.6% 2.3% 10.9% 12.8% 22.9% 25.6% 25.5%NARA '06 1,442 0.5% 26.7% 45.7% 25.9% 0.7% 0.3% 0.2% 1.2% 11.8% 9.9% 13.8% ----- ----- 34.5% 2.0% 16.6% 13.0% 15.5% 27.7% 25.2%NARA '04 1,415 0.6% 30.8% 44.5% 22.8% 0.6% 0.3% 0.4% 4.7% 16.3% 7.6% 11.2% ----- ----- 30.7% 8.1% 21.0% 10.7% 10.4% 28.4% 21.4%NASA 2008 4,375 0.2% 0.8% 20.3% 73.3% 4.6% 0.7% 0.2% 0.3% 3.3% 4.9% 11.6% 5.4% 21.4% 53.0% 0.7% 7.1% 6.6% 13.9% 29.3% 42.4%NASA '06 4,734 0.2% 1.4% 20.4% 72.6% 4.7% 0.5% 0.1% 0.7% 4.4% 4.9% 9.6% ----- ----- 45.6% 1.4% 6.7% 6.3% 11.4% 38.8% 35.4%NASA '04 4,766 0.2% 1.6% 21.9% 71.1% 4.6% 0.5% 0.2% 0.2% 4.8% 6.7% 6.3% ----- ----- 45.4% 0.5% 7.3% 8.8% 7.8% 41.7% 33.9%
2008 FHCS Page 10
Time with Current AgencyPay Category Time in Federal Government
Note: *# of Respondents is the unweighted count of responses. All percents in this table are based on the unweighted count of responses.

2008 Federal Human Capital Survey: Report on Demographic Questions by Agency (Unweighted)Agency Year
# of
Respondents*
Federal Wage
System
GS 1-6or
equivalent
GS 7-12or
equivalent
GS 13-15or
equivalent
SESor
equivalentSL/ ST Other
Less than
1 year
1 to 3years
4 to 5years
6 to 10years
11 to 14
years
15 to 20
years
More than 20
years
Less than
1 year
1 to 3years
4 to 5years
6 to 10years
11 to 20
years
More than 20
yearsNCUA 2008 588 0.5% 1.2% 39.8% 26.7% 2.0% 0.2% 29.6% 2.4% 11.4% 4.3% 16.3% 8.5% 19.9% 37.2% 2.0% 14.3% 6.6% 19.7% 31.1% 26.2%NCUA '06 623 1.4% 0.8% 40.3% 27.0% 1.9% 0.3% 28.3% 2.2% 6.7% 3.5% 18.6% ----- ----- 27.6% 3.1% 10.8% 3.7% 23.8% 40.9% 17.8%NCUA '04 538 1.3% 1.7% 41.8% 29.9% 1.7% 0.2% 23.5% 1.9% 2.2% 10.2% 13.0% ----- ----- 28.3% 2.8% 4.1% 13.2% 18.2% 45.5% 16.2%NLRB 2008 803 0.4% 7.0% 28.9% 56.2% 5.7% 0.2% 1.6% 0.4% 5.2% 5.4% 15.1% 7.0% 12.8% 54.2% 0.5% 7.1% 6.4% 19.6% 21.9% 44.6%NLRB '06 963 0.5% 7.2% 29.1% 57.6% 3.5% 0.2% 1.9% 1.4% 8.3% 6.1% 13.8% ----- ----- 48.5% 1.8% 11.7% 8.1% 16.5% 21.7% 40.2%NLRB '04 979 0.3% 9.0% 28.1% 57.3% 2.8% 0.0% 2.6% 3.1% 9.1% 12.4% 7.4% ----- ----- 45.3% 4.7% 13.4% 14.4% 8.3% 20.9% 38.3%NRC 2008 2,179 0.0% 1.1% 17.5% 71.4% 5.0% 2.4% 2.6% 1.7% 19.6% 9.4% 15.2% 6.3% 14.4% 33.5% 2.9% 26.5% 11.3% 15.7% 19.6% 24.0%NRC '06 1,692 0.3% 1.1% 18.0% 71.7% 5.0% 1.5% 2.4% 2.4% 14.3% 9.2% 11.1% ----- ----- 39.7% 3.8% 19.7% 11.0% 12.4% 23.9% 29.1%NRC '04 1,876 0.2% 1.2% 18.4% 71.2% 4.6% 2.3% 2.0% 4.1% 15.0% 5.2% 9.1% ----- ----- 39.2% 6.3% 18.9% 6.8% 9.8% 28.7% 29.5%NSF 2008 583 0.0% 0.5% 26.8% 42.9% 8.4% 5.7% 15.8% 0.3% 6.9% 6.3% 17.7% 10.3% 20.6% 37.9% 2.6% 18.0% 11.5% 22.8% 25.6% 19.6%NSF '06 596 0.3% 0.3% 27.9% 39.3% 8.2% 7.6% 16.4% 0.7% 6.4% 8.4% 15.1% ----- ----- 36.6% 2.5% 14.9% 13.1% 20.5% 28.5% 20.5%NSF '04 778 0.3% 1.8% 30.4% 30.5% 8.4% 7.9% 20.8% 4.1% 15.7% 8.9% 10.4% ----- ----- 31.6% 6.6% 23.7% 12.6% 12.9% 25.4% 18.9%OMB 2008 253 0.0% 0.0% 25.7% 60.1% 14.2% 0.0% 0.0% 1.6% 19.0% 14.6% 18.6% 10.7% 10.3% 25.3% 4.7% 30.0% 13.4% 18.6% 17.4% 15.8%OMB '06 250 0.0% 0.0% 24.8% 62.4% 12.8% 0.0% 0.0% 3.2% 16.0% 10.8% 22.4% ----- ----- 30.0% 7.6% 22.8% 14.8% 23.6% 16.4% 14.8%OMB '04 249 0.4% 0.0% 24.1% 61.4% 13.7% 0.0% 0.4% 0.8% 16.5% 14.9% 15.3% ----- ----- 31.3% 0.8% 27.3% 16.5% 17.7% 21.3% 16.5%OPM 2008 2,932 0.3% 5.5% 63.4% 29.3% 1.2% 0.0% 0.2% 1.1% 16.1% 6.8% 14.0% 5.6% 14.1% 42.4% 2.1% 35.0% 15.8% 14.3% 13.5% 19.3%OPM '06 3,012 0.2% 6.8% 59.5% 31.8% 1.3% 0.1% 0.3% 1.1% 8.5% 6.7% 11.3% ----- ----- 45.9% 2.8% 37.0% 8.8% 11.6% 19.2% 20.6%OPM '04 1,539 0.5% 14.0% 44.2% 38.1% 2.3% 0.1% 0.7% 0.9% 8.6% 5.9% 8.3% ----- ----- 42.9% 1.4% 17.1% 11.8% 9.3% 30.7% 29.8%PBGC 2008 515 0.0% 1.0% 31.8% 62.5% 0.0% 3.5% 1.2% 1.6% 15.7% 8.0% 17.1% 10.9% 21.7% 25.0% 4.9% 22.5% 9.3% 15.3% 34.2% 13.8%PBGC '06 ----- ----- ----- ----- ----- ----- ----- ----- ----- ----- ----- ----- ----- ----- ----- ----- ----- ----- ----- ----- -----PBGC '04 ----- ----- ----- ----- ----- ----- ----- ----- ----- ----- ----- ----- ----- ----- ----- ----- ----- ----- ----- ----- -----RRB 2008 570 0.2% 3.5% 71.1% 23.9% 1.2% 0.0% 0.2% 0.2% 0.2% 1.6% 3.5% 2.3% 19.5% 72.8% 0.7% 1.6% 2.6% 7.9% 24.9% 62.3%RRB '06 680 0.6% 4.6% 73.4% 20.1% 1.0% 0.0% 0.3% 0.3% 0.9% 2.4% 2.4% ----- ----- 65.3% 1.2% 1.9% 5.7% 5.1% 31.2% 54.9%RRB '04 700 0.3% 7.0% 72.5% 18.7% 1.0% 0.0% 0.4% 0.3% 2.0% 1.1% 2.4% ----- ----- 61.7% 0.4% 5.9% 3.4% 3.9% 35.9% 50.5%SBA 2008 1,618 0.2% 4.1% 47.2% 46.9% 1.4% 0.1% 0.1% 1.8% 6.3% 2.7% 7.2% 9.3% 22.6% 50.1% 2.8% 10.8% 4.4% 12.2% 36.9% 32.8%SBA '06 1,447 0.3% 4.1% 47.2% 45.7% 2.1% 0.1% 0.5% 0.9% 2.4% 1.5% 10.0% ----- ----- 46.2% 1.8% 5.2% 2.8% 19.9% 43.3% 27.1%SBA '04 1,661 0.1% 5.0% 52.3% 40.9% 1.4% 0.0% 0.2% 0.1% 1.3% 2.1% 10.7% ----- ----- 45.5% 0.6% 2.7% 4.9% 18.7% 46.5% 26.6%SEC 2008 1,605 0.4% 2.1% 14.4% 42.7% 1.7% 1.1% 37.6% 2.1% 7.9% 19.6% 21.3% 11.4% 16.3% 21.5% 2.7% 11.3% 23.2% 23.6% 24.9% 14.2%SEC '06 1,905 1.0% 1.8% 16.7% 47.8% 1.7% 1.0% 30.0% 1.6% 25.3% 8.8% 20.5% ----- ----- 19.8% 2.2% 31.7% 9.7% 23.1% 21.6% 11.8%SEC '04 2,166 0.6% 2.4% 18.9% 50.1% 1.4% 0.7% 25.8% #### 16.1% 14.2% 16.0% ----- ----- 17.1% #### 18.8% 16.9% 16.8% 20.6% 10.3%SSA 2008 5,959 0.6% 4.7% 55.0% 36.8% 1.6% 0.1% 1.1% 0.5% 6.7% 5.9% 12.4% 8.6% 12.9% 53.1% 1.2% 8.3% 7.2% 14.5% 23.1% 45.6%SSA '06 1,317 0.4% 4.5% 47.1% 39.8% 7.3% 0.1% 0.9% 0.6% 6.6% 4.5% 8.0% ----- ----- 62.9% 1.4% 7.5% 6.1% 10.1% 19.0% 56.0%SSA '04 1,172 0.3% 2.8% 47.5% 41.3% 7.0% 0.3% 0.7% 0.1% 7.1% 2.8% 7.3% ----- ----- 66.3% 0.1% 9.7% 4.2% 10.5% 16.1% 59.4%State 2008 1,720 1.5% 0.9% 22.1% 33.8% 15.3% 1.0% 25.5% 0.7% 9.0% 8.6% 17.5% 8.3% 15.2% 40.8% 1.2% 12.0% 10.8% 23.1% 22.0% 30.9%State '06 1,310 0.4% 0.4% 23.4% 37.5% 35.3% 0.2% 2.7% 0.5% 7.6% 5.1% 8.9% ----- ----- 53.8% 0.9% 10.4% 6.3% 13.7% 25.5% 43.3%State '04 1,272 1.3% 1.0% 13.3% 30.4% 32.1% 1.6% 20.4% 0.2% 7.0% 4.0% 7.6% ----- ----- 54.2% 0.6% 9.7% 9.1% 8.5% 30.9% 41.3%
2008 FHCS Page 11
Time with Current AgencyPay Category Time in Federal Government
Note: *# of Respondents is the unweighted count of responses. All percents in this table are based on the unweighted count of responses.
2008 Federal Human Capital Survey: Report on Demographic Questions by Agency (Unweighted)Agency Year
# of
Respondents*
Federal Wage
System
GS 1-6or
equivalent
GS 7-12or
equivalent
GS 13-15or
equivalent
SESor
equivalentSL/ ST Other
Less than
1 year
1 to 3years
4 to 5years
6 to 10years
11 to 14
years
15 to 20
years
More than 20
years
Less than
1 year
1 to 3years
4 to 5years
6 to 10years
11 to 20
years
More than 20
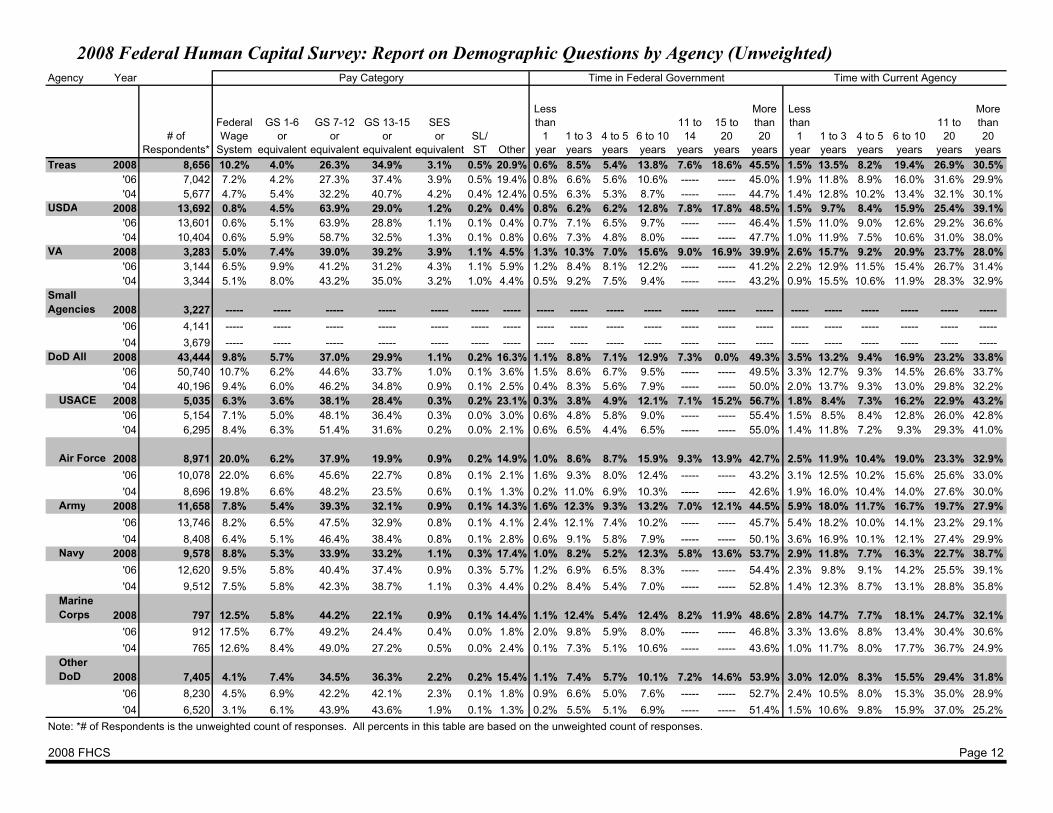
yearsTreas 2008 8,656 10.2% 4.0% 26.3% 34.9% 3.1% 0.5% 20.9% 0.6% 8.5% 5.4% 13.8% 7.6% 18.6% 45.5% 1.5% 13.5% 8.2% 19.4% 26.9% 30.5%Treas '06 7,042 7.2% 4.2% 27.3% 37.4% 3.9% 0.5% 19.4% 0.8% 6.6% 5.6% 10.6% ----- ----- 45.0% 1.9% 11.8% 8.9% 16.0% 31.6% 29.9%Treas '04 5,677 4.7% 5.4% 32.2% 40.7% 4.2% 0.4% 12.4% 0.5% 6.3% 5.3% 8.7% ----- ----- 44.7% 1.4% 12.8% 10.2% 13.4% 32.1% 30.1%USDA 2008 13,692 0.8% 4.5% 63.9% 29.0% 1.2% 0.2% 0.4% 0.8% 6.2% 6.2% 12.8% 7.8% 17.8% 48.5% 1.5% 9.7% 8.4% 15.9% 25.4% 39.1%USDA '06 13,601 0.6% 5.1% 63.9% 28.8% 1.1% 0.1% 0.4% 0.7% 7.1% 6.5% 9.7% ----- ----- 46.4% 1.5% 11.0% 9.0% 12.6% 29.2% 36.6%USDA '04 10,404 0.6% 5.9% 58.7% 32.5% 1.3% 0.1% 0.8% 0.6% 7.3% 4.8% 8.0% ----- ----- 47.7% 1.0% 11.9% 7.5% 10.6% 31.0% 38.0%VA 2008 3,283 5.0% 7.4% 39.0% 39.2% 3.9% 1.1% 4.5% 1.3% 10.3% 7.0% 15.6% 9.0% 16.9% 39.9% 2.6% 15.7% 9.2% 20.9% 23.7% 28.0%VA '06 3,144 6.5% 9.9% 41.2% 31.2% 4.3% 1.1% 5.9% 1.2% 8.4% 8.1% 12.2% ----- ----- 41.2% 2.2% 12.9% 11.5% 15.4% 26.7% 31.4%VA '04 3,344 5.1% 8.0% 43.2% 35.0% 3.2% 1.0% 4.4% 0.5% 9.2% 7.5% 9.4% ----- ----- 43.2% 0.9% 15.5% 10.6% 11.9% 28.3% 32.9%Small Agencies 2008 3,227 ----- ----- ----- ----- ----- ----- ----- ----- ----- ----- ----- ----- ----- ----- ----- ----- ----- ----- ----- -----Small Agenci '06 4,141 ----- ----- ----- ----- ----- ----- ----- ----- ----- ----- ----- ----- ----- ----- ----- ----- ----- ----- ----- -----Small Agenci '04 3,679 ----- ----- ----- ----- ----- ----- ----- ----- ----- ----- ----- ----- ----- ----- ----- ----- ----- ----- ----- -----DoD All 2008 43,444 9.8% 5.7% 37.0% 29.9% 1.1% 0.2% 16.3% 1.1% 8.8% 7.1% 12.9% 7.3% 0.0% 49.3% 3.5% 13.2% 9.4% 16.9% 23.2% 33.8%DoD All '06 50,740 10.7% 6.2% 44.6% 33.7% 1.0% 0.1% 3.6% 1.5% 8.6% 6.7% 9.5% ----- ----- 49.5% 3.3% 12.7% 9.3% 14.5% 26.6% 33.7%DOD '04 40,196 9.4% 6.0% 46.2% 34.8% 0.9% 0.1% 2.5% 0.4% 8.3% 5.6% 7.9% ----- ----- 50.0% 2.0% 13.7% 9.3% 13.0% 29.8% 32.2%
USACE 2008 5,035 6.3% 3.6% 38.1% 28.4% 0.3% 0.2% 23.1% 0.3% 3.8% 4.9% 12.1% 7.1% 15.2% 56.7% 1.8% 8.4% 7.3% 16.2% 22.9% 43.2%USACE '06 5,154 7.1% 5.0% 48.1% 36.4% 0.3% 0.0% 3.0% 0.6% 4.8% 5.8% 9.0% ----- ----- 55.4% 1.5% 8.5% 8.4% 12.8% 26.0% 42.8%ACE '04 6,295 8.4% 6.3% 51.4% 31.6% 0.2% 0.0% 2.1% 0.6% 6.5% 4.4% 6.5% ----- ----- 55.0% 1.4% 11.8% 7.2% 9.3% 29.3% 41.0%
Air Force 2008 8,971 20.0% 6.2% 37.9% 19.9% 0.9% 0.2% 14.9% 1.0% 8.6% 8.7% 15.9% 9.3% 13.9% 42.7% 2.5% 11.9% 10.4% 19.0% 23.3% 32.9%Air Force '06 10,078 22.0% 6.6% 45.6% 22.7% 0.8% 0.1% 2.1% 1.6% 9.3% 8.0% 12.4% ----- ----- 43.2% 3.1% 12.5% 10.2% 15.6% 25.6% 33.0%Air Force '04 8,696 19.8% 6.6% 48.2% 23.5% 0.6% 0.1% 1.3% 0.2% 11.0% 6.9% 10.3% ----- ----- 42.6% 1.9% 16.0% 10.4% 14.0% 27.6% 30.0%Army 2008 11,658 7.8% 5.4% 39.3% 32.1% 0.9% 0.1% 14.3% 1.6% 12.3% 9.3% 13.2% 7.0% 12.1% 44.5% 5.9% 18.0% 11.7% 16.7% 19.7% 27.9%Army '06 13,746 8.2% 6.5% 47.5% 32.9% 0.8% 0.1% 4.1% 2.4% 12.1% 7.4% 10.2% ----- ----- 45.7% 5.4% 18.2% 10.0% 14.1% 23.2% 29.1%Army '04 8,408 6.4% 5.1% 46.4% 38.4% 0.8% 0.1% 2.8% 0.6% 9.1% 5.8% 7.9% ----- ----- 50.1% 3.6% 16.9% 10.1% 12.1% 27.4% 29.9%Navy 2008 9,578 8.8% 5.3% 33.9% 33.2% 1.1% 0.3% 17.4% 1.0% 8.2% 5.2% 12.3% 5.8% 13.6% 53.7% 2.9% 11.8% 7.7% 16.3% 22.7% 38.7%Navy '06 12,620 9.5% 5.8% 40.4% 37.4% 0.9% 0.3% 5.7% 1.2% 6.9% 6.5% 8.3% ----- ----- 54.4% 2.3% 9.8% 9.1% 14.2% 25.5% 39.1%Navy '04 9,512 7.5% 5.8% 42.3% 38.7% 1.1% 0.3% 4.4% 0.2% 8.4% 5.4% 7.0% ----- ----- 52.8% 1.4% 12.3% 8.7% 13.1% 28.8% 35.8%Marine Corps 2008 797 12.5% 5.8% 44.2% 22.1% 0.9% 0.1% 14.4% 1.1% 12.4% 5.4% 12.4% 8.2% 11.9% 48.6% 2.8% 14.7% 7.7% 18.1% 24.7% 32.1%Marine Co '06 912 17.5% 6.7% 49.2% 24.4% 0.4% 0.0% 1.8% 2.0% 9.8% 5.9% 8.0% ----- ----- 46.8% 3.3% 13.6% 8.8% 13.4% 30.4% 30.6%Marine Co '04 765 12.6% 8.4% 49.0% 27.2% 0.5% 0.0% 2.4% 0.1% 7.3% 5.1% 10.6% ----- ----- 43.6% 1.0% 11.7% 8.0% 17.7% 36.7% 24.9%Other DoD 2008 7,405 4.1% 7.4% 34.5% 36.3% 2.2% 0.2% 15.4% 1.1% 7.4% 5.7% 10.1% 7.2% 14.6% 53.9% 3.0% 12.0% 8.3% 15.5% 29.4% 31.8%Other DoD '06 8,230 4.5% 6.9% 42.2% 42.1% 2.3% 0.1% 1.8% 0.9% 6.6% 5.0% 7.6% ----- ----- 52.7% 2.4% 10.5% 8.0% 15.3% 35.0% 28.9%Other Do '04 6,520 3.1% 6.1% 43.9% 43.6% 1.9% 0.1% 1.3% 0.2% 5.5% 5.1% 6.9% ----- ----- 51.4% 1.5% 10.6% 9.8% 15.9% 37.0% 25.2%
2008 FHCS Page 12
Time with Current AgencyPay Category Time in Federal Government
Note: *# of Respondents is the unweighted count of responses. All percents in this table are based on the unweighted count of responses.

United StatesOffice of Personnel Management
1900 E Street, NWWashington, DC 20415
www.fhcs.opm.gov