Federal Deposit Insurance Corporation Options Paper August 2000
87
i Federal Deposit Insurance Corporation Options Paper August 2000 Table of Contents I. INTRODUCTION ..................................................................................................................... 1 The Need for Reform........................................................................................................................... 2 How Should the FDIC Price Risk? .................................................................................................. 3 How Should New Deposits be Treated? .......................................................................................... 4 How Should Losses be Funded? ...................................................................................................... 5 How Should the Coverage Levels be Determined? ......................................................................... 5 Overview of Options Paper ................................................................................................................. 6 Review Process and Comments on Options Paper .............................................................................. 7 II. PRICING DEPOSIT INSURANCE FOR INDIVIDUAL BANKS....................................... 9 Textbox: Oliver, Wyman & Company Approach to Bank Level Pricing .................................... 9 Options Relying on Supervisory Evaluations .................................................................................... 12 Options Relying on Objective Factors............................................................................................... 14 Non-Public Bank-Specific Information ......................................................................................... 14 Bank Call Reports .......................................................................................................................... 16 Market Information........................................................................................................................ 17 Hybrid Approaches ............................................................................................................................ 20 Customized Financial Contracts ........................................................................................................ 20 III. FUNDING DEPOSIT INSURANCE LOSSES ..................................................................... 22 User Fee Model ................................................................................................................................. 23 Long-Term Premium Rates Based on Historical Experience ........................................................ 23 Moving Average Approach ........................................................................................................... 24 Analytical Approaches................................................................................................................... 25 Textbox: Oliver, Wyman & Company Analytical Framework................................................. 25 Adjustments for Current Insurance Expenses ............................................................................... 27 Linking Premium Rates to the Insurance Fund ............................................................................. 27
Transcript of Federal Deposit Insurance Corporation Options Paper August 2000

i
Federal Deposit Insurance Corporation
Options Paper
August 2000
Table of Contents
I. INTRODUCTION ..................................................................................................................... 1
The Need for Reform........................................................................................................................... 2How Should the FDIC Price Risk?.................................................................................................. 3How Should New Deposits be Treated?.......................................................................................... 4How Should Losses be Funded?...................................................................................................... 5How Should the Coverage Levels be Determined?......................................................................... 5
Overview of Options Paper ................................................................................................................. 6
Review Process and Comments on Options Paper .............................................................................. 7
II. PRICING DEPOSIT INSURANCE FOR INDIVIDUAL BANKS....................................... 9
Textbox: Oliver, Wyman & Company Approach to Bank Level Pricing .................................... 9
Options Relying on Supervisory Evaluations.................................................................................... 12
Options Relying on Objective Factors............................................................................................... 14Non-Public Bank-Specific Information......................................................................................... 14Bank Call Reports.......................................................................................................................... 16Market Information........................................................................................................................ 17
Hybrid Approaches............................................................................................................................ 20
Customized Financial Contracts ........................................................................................................ 20
III. FUNDING DEPOSIT INSURANCE LOSSES ..................................................................... 22
User Fee Model ................................................................................................................................. 23Long-Term Premium Rates Based on Historical Experience........................................................ 23Moving Average Approach ........................................................................................................... 24Analytical Approaches................................................................................................................... 25 Textbox: Oliver, Wyman & Company Analytical Framework................................................. 25Adjustments for Current Insurance Expenses ............................................................................... 27Linking Premium Rates to the Insurance Fund ............................................................................. 27

ii
Textbox: Solvency Standard – Oliver, Wyman & Company.................................................... 29Setting a Hard Target for the Insurance Fund ............................................................................... 29Setting a Soft Target for the Insurance Fund................................................................................. 30
Mutual Model .................................................................................................................................... 30Rebates........................................................................................................................................... 30Banks Hold Explicit Claims on the Mutual Insurance Fund ......................................................... 31Introducing Private Sector Features to the Deposit Insurance System.......................................... 32
Funding Systemic Risk...................................................................................................................... 33
IV. COVERAGE LIMITS............................................................................................................. 35
Past and Current Coverage Rules ...................................................................................................... 36
Effects of Changing Coverage.......................................................................................................... 37Immediate Effect ........................................................................................................................... 37Longer-Term Effect ....................................................................................................................... 38
Moral Hazard, Implicit Protection and Industry Structure ................................................................ 41
Options............................................................................................................................................... 44Status Quo...................................................................................................................................... 44Formal Indexing ............................................................................................................................ 45Simplification ................................................................................................................................ 46Additional Coverage for Municipal and Other Public Deposits.................................................... 46Optional Excess Coverage............................................................................................................. 48
V. NEXT STEPS ........................................................................................................................... 50
VI. REFERENCES ........................................................................................................................ 51
VII. ATTACHMENTS.................................................................................................................... 53
A. THE BIF AND SAIF SHOULD BE MERGED........................................................................... 53
B. CDIC-LIKE SCORING SYSTEMS............................................................................................. 56B-1. The CDIC System................................................................................................................. 56B-2. CDIC-Style Hybrid Approach .............................................................................................. 57
C. OVERVIEW OF THE RISK-BASED PREMIUM SYSTEM ..................................................... 60
D. DIFFERENTIATING AMONG A-RATED INSTITUTIONS .................................................... 62D-1. Using Prompt Corrective Action Capital Ratios to Distinguish the Risk of Institutionswithin a Capital Subgroup ............................................................................................................. 62D-2. Peer Group Comparisons...................................................................................................... 65D-3. Historical Benchmarks ......................................................................................................... 66

iii
E. EXPECTED LOSS PRICING....................................................................................................... 67E-1. Incorporating Credit Rating Agency Information in Deposit Insurance Pricing.................. 67E-2. Using Default Risk Premiums on Subordinated Debt To Estimate Banking OrganizationExpected Loss................................................................................................................................ 70E-3. Proportion of Insurance Loss Borne by the FDIC ................................................................ 72
F. SIMULATIONS............................................................................................................................ 74F-1. Steady Premium System ....................................................................................................... 74F-2. Simulation of Risk-Related Premiums, 1982 to 1999........................................................... 75F-3. Optimal Fund Size and Premium Adjustment Simulations .................................................. 79
G. EFFECT OF A COVERAGE LIMIT INCREASE TO $200,000 ON BANKS OF DIFFERENTASSET SIZES ................................................................................................................................... 83

1
I. INTRODUCTION
This options paper is part of a comprehensivereview of the U.S. deposit insurance system bythe Federal Deposit Insurance Corporation(FDIC). We are undertaking this review toassure the ability of the system to meet itsresponsibilities over the next decade. Industryconsolidation, expanded activities, global-ization and the use of technology haveadvanced the business of banking and theproducts and services offered to Americandepositors. The FDIC wants to ensure that thedeposit insurance system continues to protectdepositors and contributes to its full extent tothe stability of the banking system.
The United States has the oldest federal depositinsurance system in the world, established in1934 to put an end to the devastating bank runsthat shut down businesses and contributed tothe Great Depression. The system proved to bea success; following its introduction, depositinsurance restored public confidence in thebanking system. For the next threegenerations, the system served its purpose byhelping prevent banking problems frombecoming banking panics. In the 1980s, whenhundreds of banks and thrifts failed, depositinsurance acted as the anchor for publicconfidence in the banking system.
In good times and bad times, deposit insuranceprovides a safe and certain place for people toput their money. By eliminating the disruptioncaused by bank runs, deposit insurancecontributes to the foundation necessary for arobust banking system and by extension, adynamic financial system. In turn the generaleconomy benefits from the stabilizing influenceof deposit insurance.
The success of the U.S. system of federaldeposit insurance is particularly evident incontrasting the U.S. experience during the1980s crisis with recent crises in Asian and
Latin American countries that lacked explicitdeposit insurance systems. During the U.S.crisis, there were no depositor runs on banks,and bank failures were resolved through a well-established, orderly process. This was not thecase for countries without explicit depositinsurance, and it is perhaps sufficient to notethat more than 30 countries chose to implementnew, explicit deposit insurance systems duringthe 1990s. The benefits of deposit insuranceare appreciated worldwide, and the U.S. systemhas become a model for the rest of the world.
Nevertheless, the 1980s crisis in the U.S. alsoprovides a sobering reminder that a flaweddeposit insurance system can be extremelycostly. U.S. taxpayers were billed for morethan $130 billion to clean up the savings andloan crisis following the demise of the FederalSavings and Loan Insurance Corporation(FSLIC). This demonstrates that depositinsurance raises complicated issues andrequires a careful balancing of competingpublic policy concerns.
Today, the bank and thrift industries have neverbeen healthier. Bank capital levels are at an alltime high, profitability has climbed for theninth year in a row, and the insurance fundshave substantial combined reserves of $42billion. There will never be a better time toaddress the latent flaws in the system. Reformsnow will also help us maintain the properincentives for risk and reward to insuredinstitutions, as well as fairness amonginstitutions that present different levels of riskto the system.
The FDIC has identified three fundamentalareas for review: the processes for pricing risks,funding insurance losses, and setting coveragelimits. This options paper describes variousways in which we might make improvements

2
to the deposit insurance system. The optionsare intended to prompt analysis and commentfrom individuals and organizations that have aninterest in the issue.
1. The Need for Reform
With the Federal Deposit InsuranceCorporation Improvement Act of 1991(FDICIA), Congress passed a number ofsignificant reforms to shore up the depositinsurance system. These included promptcorrective action, least-cost resolutions, scalingback of too-big-to-fail, the introduction of risk-based premiums, and a mandate to maintainadequate insurance funds. With the DepositInsurance Funds Act of 1996 (DIFA), Congressensured that members of the Bank InsuranceFund (BIF) and the Savings AssociationInsurance Fund (SAIF) would not facesignificant and arbitrary differences in depositinsurance pricing.
Despite these significant improvements, thecurrent deposit insurance system has severalfeatures that work against the effective andequitable functioning of the system:
• The continued existence of two separateinsurance funds based on an anachronisticdistinction;
• The current pricing system that createsinappropriate incentives and raises fairnessissues;
• The requirement that banks are required tofund insurance losses when they can leastafford it; and
• Uncertainty for depositors as to the futurereal value of FDIC coverage.
Over the past decade the FDIC has stated itsview that the two insurance funds the FDICadministers should be merged. The distinction
between the funds is increasingly arbitrary; acombined fund would be stronger and moreefficient; and the time to merge them is whenthey are both healthy. These arguments arelaid out in detail in Attachment A. This optionspaper will not address this flaw, other than tostate the FDIC’s position that a merger of thefunds is good public policy either on a stand-alone basis or as the prerequisite for any otherchanges to the deposit insurance system.
The second and third of these problems resultfrom the conflicting mandates of the FDICIA:to price deposit insurance premiums accordingto the risk posed by individual institutions, andto maintain a target level of reserves within theinsurance funds. The tension between the dualmandates of risk-based pricing and a fixed fundlevel became far more explicit in 1996 as DIFAseverely limited the FDIC's ability to priceaccording to risk.
Because of current restrictions on pricingdeposit insurance, most banks and thrifts payno insurance premiums when they are doingwell, but pay high premiums when the industryis weak and banks are failing. This does notmake sense for the banks or for thecommunities they serve. It is possible that, indifficult times, deposit insurance premiumscould reduce the pre-tax net income of insuredinstitutions by almost $9 billion. Based oncurrent average capital and loan-to-assets ratiosfor all insured institutions, this reduction inincome could lead to a contraction in lending ofmore than $65 billion at the precise time in thebusiness cycle when loans are most needed.
The current process for setting depositinsurance coverage limits has brought the issuebefore Congress on a somewhat arbitrary andad hoc basis. This has resulted in significantfluctuation in the real value of insurance fordepositors. The current coverage limit of$100,000 has declined in real value by halfsince it was established in 1980. This raises thequestion of whether Congress wishes to

3
continue providing the same level of insuranceprotection for consumers in real terms, or toallow the coverage level to erode in value bymaintaining the status quo.
The current deposit insurance arrangementslead to several questions:
How Should the FDIC Price Risk?
Through a combination of legislative changes,regulatory choices and economic events, thepricing and funding of deposit insuranceevolved during the 1980s and 1990s intosomething fundamentally different from whatexisted during the first 50 years of the FDIC’shistory. Banks that are paying for depositinsurance at the end of the 1990s are those thathave run afoul of capital regulations or thesupervisory process. This is a significantdeparture from past practice. Pricing of depositinsurance has evolved into a penalty system forthe few, rather than a priced service for all.
Thus, a decade that began with a legislativemandate for risk-based insurance premiumsended with the FDIC providing a freeguarantee of almost three trillion dollars inbank and thrift liabilities. As a result, themoral hazard problems FDICIA intended toaddress with risk-based deposit insurance mayhave become more firmly entrenched than ever.(Moral hazard problems are discussed in moredetail in Section IV, "Coverage Limits.")
A striking feature of a zero premium is that notonly may the rate paid by vastly disparatebanks be identical, but the dollar amount aswell: a bank with $100 billion in deposits and acomplex risk profile can be billed the sameamount for its insurance as the smallest andmost conservatively run community bank.Presumably, the rationale behind a statutoryzero premium is that, as long as a fund is aboveits target level, it does not need additionalfunds. However, aside from raising money for
the insurance funds, premiums also serve toalign economic incentives. When a valuableproduct is offered at zero cost, it leads to thatproduct being overused, causing distortionsthroughout the marketplace and, in the case ofdeposit insurance, potentially exacerbatingmoral hazard.
If deposit insurance were priced according torisk, it is likely that every bank in the U.S. withinsured deposits would pay something fordeposit insurance, for the same reason thatevery bank pays at least some spread overTreasuries for unsecured debt. However, sinceshortly after the BIF was recapitalized in May1995, its members that are in the best-rated,1A-assessment category have not been requiredto pay deposit insurance premiums. Membersof the SAIF that are rated 1A have paid nopremiums since January 1997.1
At year-end 1999, only 7 percent of all banksand thrifts paid premiums into the depositinsurance funds. Ninety-three percent, or morethan 9,500 institutions, do not pay premiums.This stands in stark contrast to the first 50 yearsof the federal deposit insurance program, whenevery insured institution paid an annual rate of3.3 to 8.3 cents for every $100 of insureddeposits.
Despite the uniform assessment ratings given tothese 1A institutions, they do not all presentuniform risks to the deposit insurance funds.The current premium matrix does not recognizeinstitutions that, by objective measures andhistorical experience, have a higher risk profile,unless the institution fails to maintain theminimum level of capitalization to beconsidered "well-capitalized" as defined forprompt corrective action purposes or is subjectto heightened supervision.2 In a less favorable
1 More details on the risk categories in the currentpremium system are presented in Attachment C.2 Federal supervisors rate insured institutions on sixfactors: Capital; Asset Quality; Management; Earnings;Liquidity; and Sensitivity to market risk (CAMELS).

4
economic environment, many of these 1A-ratedinstitutions would deteriorate faster than others,yet that higher degree of risk is not built intothe current assessment scheme.
How Should New Deposits be Treated?
Most banks and thrifts established since therecapitalization of the insurance funds havenever paid for deposit insurance. ThroughMarch 2000 this included 844 new banks andthrifts whose insured deposits totaled more than$44 billion. The responsibility for maintainingthe $550 million needed to capitalize thesedeposits at a 1.25 percent DRR falls on theother members of the deposit insurance system.
Similarly, institutions that are rated 1A cangrow their insured deposits without payingassessments. This zero marginal cost ofinsurance clearly differs from the privateinsurance industry, in which higher coverageamounts entail higher charges. With themarginal cost of deposit insurance at zero, thesame issues of fairness arise that occur underthe new bank scenario: all insured institutionseventually are assessed to cover deposit growthat the fastest-growing, 1A-rated institutions. Ina deteriorating financial environment, it will benecessary to raise assessment rates earlier or bya greater amount to make up for the dilution ofthe reserve ratio attributable to unfundedinsured-deposit growth.
Under some circumstances, insured-depositgrowth could occur rapidly, accelerating the
Institutions receive an overall rating ranging from 1 to 5,with 1 being the best rating.
The original decision by the FDIC to lump CAMELS 1-and 2-rated institutions into the same risk category forpremium purposes was largely codified into law in 1996by the DIFA. Federal Deposit Insurance Funds Act, Pub.L. No. 104-208, §§ 2708(b) and 2708(c) (1996) (codifiedat 12 U.S.C. §§ 1817(b)(2)(A)(iii) and (v)). As a result,the FDIC is largely prohibited from distinguishingbetween CAMELS 1- and 2-rated institutions fordetermining premiums.
need to raise assessment rates for all insuredinstitutions. This could happen even in afavorable economic environment in whichdeposit-insurance losses remain low. In early2000, an investment company announced plansto convert some of its customers’ funds intoFDIC-insured accounts. Reports in the mediasuggested that as much as $100 billion could beconverted in this manner in a relatively shortperiod of time. Sudden growth of thismagnitude at 1A-rated banks, with nocorresponding growth in the fund balance,would dilute the fund’s reserve ratio. In thisexample, the BIF reserve ratio would fall by 5basis points. With a reserve ratio of 1.35percent as of March 31, 2000, such a declinewould leave the fund’s reserve ratio above thestatutory minimum of 1.25 percent, but theindustry would be closer to mandatory rateincreases for all insured institutions, dependingon insured-deposit growth and insurance losses.From March 31, 2000, through June 30, 2000,insured deposits at the banks affiliated with theinvestment company grew by $12 billion.
There is also the possibility of a large shift ofhousehold assets into insured deposit accountsin the event of financial market volatility.There is currently more than $11 trillionoutstanding in U.S. equity holdings (includingmutual fund shares) alone. In a protracted bearmarket, some of these funds could betransferred to insured deposits. And it is stilltoo early to gauge the probable impact ofelectronic banking on insured deposit growth.Obviously, the likelihood of deposit inflowsfrom these examples, as from a myriad of otherpossibilities in an era of financial modern-ization, cannot be known. The question iswhether the current deposit insurance system iscapable of addressing the issues raised by thesepossibilities.
Conversely, institutions that shrink theirdeposits are not compensated for the indirectbenefit they confer on other members of thesystem. Most BIF members have paid no

5
premiums since 1995, and most SAIF membershave paid none since 1996, but all insuredinstitutions paid very high rates in the earlier1990s. The issue of deposit growth andshrinkage becomes important in any discussionof rebates (other than the refunding of currentassessment income). Any such program wouldrequire legislation, but the question of who isentitled to how much is complicated by theexistence of institutions whose deposit growthor shrinkage was atypical. For example,aggregate BIF-insured deposits grew by 10.5percent from year-end 1995 to year-end 1999,during which time one bank grew its insureddeposits (without any acquisitions) from $19million to $1.2 billion (up 6,140 percent), andanother bank reduced its insured deposits from$763 million to $423 million (down 45percent). Of these two banks today, the onewith a lower level of insured deposits paidconsiderably higher total assessments in the1990s.
How Should Losses be Funded?
In reaching a point where the FDIC does notcollect assessment revenue from mostinstitutions during good times, we have clearlydeparted from any concept of spreadinginsurance losses over time by collectingrevenue on an ex ante or long-run expected lossbasis. In contrast, prior to 1989 it could beargued that Congress intended the FDIC tooperate under a form of long-term expectedloss pricing. During the period 1933-1989,when premiums were set by statute and neverdeparted from a range of between 3 and 8.3basis points per annum, accumulated premiumsand the investment income on those balancesenabled the system to roughly pay for itself.The system in place today, in contrast, amountsessentially to charging nothing in times ofprosperity, and a lot in times of adversity,thereby potentially magnifying swings in thebanking cycle.
The current “cushion” in the BIF, the amountby which the fund exceeds 1.25 percent, is $2.3billion.3 If insurance losses not covered by thesystemic risk exception were to exceed thisamount—as they did in each year from 1988through 19924—and the fund fell below 1.25percent and was expected to remain there for ayear or more, the FDIC would be forced toraise average assessment rates to a minimum of23 basis points. Therefore, all banks would beforced to pay substantially higher premiums ata time when many banks were under stress. Ona strict pay-as-you-go basis, banks would havehad to pay approximately 62 basis points in1991.
If the FDIC had more latitude in setting rateswhen the reserve ratio falls short of the DRR,the recapitalization period could be extendedwith rates less than 23 basis points. This wouldhelp to avoid a credit crunch and to moderatethe negative impact of deposit insurancepremiums on real economic activity.
How Should the Coverage Levels beDetermined?
The current process for setting depositinsurance coverage limits has brought the issuebefore Congress on a somewhat arbitrary andad hoc basis. This has resulted in significantfluctuation in the real value of insurance fordepositors. Deposit insurance has a simple, butimportant purpose: to provide a safe place fordepositors to keep their money, as a way toprevent bank runs and maintain the stability ofthe banking and financial system.
Since 1934, the basic coverage amount hasincreased five times, from $5,000 to $100,000. 3 Despite growth of the fund during the first quarter of2000, this cushion fell from $2.5 billion at year-end 1999because of insured-deposit growth in the first quarter.4 Annual losses ranged from $2.7 billion to $6.9 billionduring this five-year period. These are actual losses andnot loss provisions, which were even higher but werepartially recovered when many projected failures did notoccur.

6
Most of the increases more or less reflectedcost-of-living adjustments, but the most recentincrease is an exception. The 1980 jump from$40,000 to $100,000 had more to do withattracting deposits to insured institutions in acompetitive market of very high interest rates.Today, 20 years later, $100,000 of depositinsurance has lost about half its value, based onthe Consumer Price Index.
The next several decades will be a time inwhich the population is aging, retirement costsare increasing, and the supply of federally-backed investment vehicles, such as Treasurynotes and bonds, may decline. Thus, a long-term perspective may argue for allowing for thecoverage limit to keep up with changes in theprice level, household wealth, or othermeasures relevant to households.
However, there are trade-offs to consider.Higher coverage limits can increase moralhazard. The 1980 increase is widely viewed ascontributing to the high cost of the savings andloan crisis. Also, the impact of higher coveragelimits on insured deposit growth is difficult topredict, and the likely distribution of benefits issubject to debate.
2. Overview of Options Paper
This remainder of this paper organizes thediscussion into three major areas: pricing risk,funding insurance losses, and coverage levels.
Section II of this paper discusses the pricing ofdeposit insurance for individual banks. Ifdeposit insurance is viewed as a service thatbanks use, the question is how this serviceshould be priced. One answer is that the priceshould reflect the risk that the bank presents tothe deposit insurance system. This expectedloss approach to pricing is consistent with thebest practices that have developed in thebanking industry in recent years.
The next question is what information shouldserve as the basis for pricing. Supervisoryratings are appealing because they are based onquality information and reflect the judgment ofexperienced supervisors; however, too great areliance on ratings raises concerns aboutconsistency and subjectivity. This suggests theappeal of more objective information, whichcould include non-public information (such ascredit exposures), Call Report information, andmarket information. Finally, the FDIC couldgenerate pricing information through risk-sharing contracts with market participants.
Section III deals with how deposit insurancelosses are funded from an aggregateperspective. The funding of FDIC losses hasevolved over the years from a system thatfeatured steady premiums with a fluctuatingreserve ratio to a system that targets a specificreserve ratio and results in volatile premiums.The mandate to maintain a particular ratio canlead to steep premiums during bad times andcalls for rebates during good times.
One general approach is a user fee system inwhich banks have no claim on past premiums.Under such an approach, the question iswhether premiums will be relatively stable andconsistent with expected loss pricing, orwhether premiums will be more closely tied tocurrent losses or the reserve ratio in order toguard against premiums that are too high or toolow.
A mutual approach would differ from the userfee system in that banks would have someclaim on past premiums. This could take theform of rebates when the insurance fund isviewed as too large; this raises the question ofhow to allocate these rebates. Alternatively,banks could hold claims on the insurance fund,similar to mutual fund shares. This couldaddress concerns about free rider and pricingproblems. Under mutual arrangements, thecash flow between a bank and the insurancefund could have two components: one to price

7
risk at the margin and the other to reflect thebank’s claim on the fund.
Section IV discusses the appropriate extent ofdeposit insurance coverage. The section beginswith a review of the history of coverage levelsin nominal and real terms. This is followed bypreliminary estimates of how an increase in thecoverage limit would be expected to increasethe amount of insured deposits. This dependson the behavior of households and businesses,and further study would allow more confidencein these estimates.
It is widely recognized that there is a tradeoffbetween the stability that deposit insurancebrings and the potential for distortion of themarket process. Coverage levels speak directlyto that tradeoff: higher coverage may providegreater stability during difficult times, whilelower coverage may enhance market disciplineand minimize distortion. The section addressesthis tradeoff with a discussion of moral hazard,implicit protection, and industry structure.
The options in the coverage section includecontinuing the existing system of ad hocstatutory adjustments; indexing for inflationaryadjustments; or simplifying the current systemto limit a particular level of coverage to oneaccount per person. Other ideas for changes tocoverage include extending higher coverage tomunicipal and other public deposits; this raisesissues similar to those posed by brokereddeposits. The section ends with excesscoverage options including increased use ofprivate coverage, new excess coverage throughthe FDIC, FDIC-backed private insurance, orcoinsurance systems.
3. Review Process and Comments onOptions Paper
This paper is one step in the FDIC’scomprehensive review of the deposit insurancesystem. FDIC Chairman Donna Tanoue
publicly announced the review on March 7,2000, in a speech before the IndependentCommunity Bankers of America. On April 25,2000, the FDIC held a Deposit InsuranceRoundtable with bankers, their trade grouprepresentatives, consumer group represent-atives, and industry experts. The Roundtableprovided an opportunity for interested parties toraise issues and discuss broad policy optionsfor consideration in the FDIC’s review. Atranscript of the proceedings may be viewed atwww.fdic.gov. The Roundtable was followedby outreach meetings with bankers during Mayand June in Minneapolis, Dallas, and KansasCity. The FDIC also held discussions withmembers of state banking organizations duringtheir annual spring visits to Washington andwith several leadership groups and staff of thenational trade associations.
In addition, the FDIC has held discussions withacademics and other outside experts. Toprovide a more explicit “market perspective”on deposit insurance pricing and fundexposure, the FDIC retained the risk-management consulting firm of Oliver, Wyman& Company (Oliver, Wyman). Oliver, Wymanemployed an analytical framework similar tothat used by the largest financial institutions foranalyzing their credit exposures. The purposewas to explore ways to incorporate "bestpractices" from private-sector risk managementinto the consideration of FDIC pricing andfunding issues.
The ideas and perspectives that werecommunicated through these various effortshave been incorporated into the options paper.The FDIC will carefully review comments andweigh feedback from the options paper in orderto narrow the policy choices and guide theadditional analytical work necessary to developa set of policy recommendations that isappropriately balanced, workable, and fair. Asstudies conducted by FDIC staff and others arecompleted, additional discussion—perhaps a

8
new set of roundtables or outreach meetings—will be arranged with interested parties.
Because this paper is not intended to advocatespecific approaches but to solicit comment, wehave presented a wide range of concepts fordealing with the policy issues under discussion.Examples of how these conceptual approachesmight work in practice are included, andreaders are encouraged to comment both on thespecific examples and on broad conceptualapproaches.
Comments on the options paper may beregistered on the FDIC web site atwww.fdic.gov. The Internet version of theoptions paper will include a survey which willbecome available on August 31. Readers areinvited to respond to the specific questions thatwill be posted on the FDIC web survey foreach topic and to provide any additionalcomments relating to the survey questions.
Comments may also be addressed to Robert E.Feldman, Executive Secretary, Attention:Comments/OES, Federal Deposit InsuranceCorporation, 550 17th Street, N.W.,Washington, D.C. 20429. Comments may alsobe hand-delivered to the guard station at therear of the 550 17th Street Building (located onF Street) between 7:00 a.m. and 5:00 p.m. onbusiness days. In addition, comments may befaxed to (202) 898-3838, or sent via theInternet to [email protected].
FDIC staff will review comments as they arereceived and summarize them each monththrough the fall of 2000, beginning withSeptember. Comments will be available forinspection and photocopying at the FDICPublic Information Center, Room 100, 80117th Street, N.W., between 9:00 a.m. and 4:30p.m. on business days.

9
II. PRICING DEPOSIT INSURANCE FOR INDIVIDUAL BANKS
Depositors value the simplicity and certaintythat deposit insurance provides, and banksbenefit from being able to offer insureddeposits to customers. Like other servicesbanks use, a financial guarantee such as depositinsurance is not costless to provide. Thestarting point for the discussion in this sectionis that it is equitable and reasonable for a bankto compensate the parties who bear the risk ofproviding this benefit.
In this section we will consider ways ofdifferentiating among the risk profiles of themore than 9,000 insured institutions currentlyin the 1A category for deposit insurance. Themost straightforward conceptual approach isfor a bank to pay an amount equal to theexpected loss the deposit insurer faces fromproviding deposit insurance to that bank. An“expected loss” pricing system would 1) reflectthe differences in risk across banks and 2)generate revenue sufficient to pay for the costsof insuring deposits. The expected loss pricefor a bank would depend on three things:
• the probability of default for that bank;
• exposure; and
• severity, or loss given default.
At least in principle, every bank could beassigned something similar to a credit rating,with an associated range of default probabilitiesderived from experience. These defaultprobabilities, combined with customized orstandardized assumptions about loss givendefault, would yield the FDIC’s expected lossper dollar of assessable deposits, and theappropriate premium, for that institution. Suchan approach also would provide the rawmaterial to construct hypothetical distributions
of FDIC loss exposure using standard creditrisk measurement tools, as discussed in thefollowing text box.
Oliver, Wyman & Company Approach toBank Level Pricing
Expected loss pricing has two key benefits: atthe systemic level, setting the price for eachbank equal to its expected loss ensures that thepremium inflows to the fund are ultimatelyequal to average long-term loss. This ensuresthat the fund is self-financing over time.Additionally, risk-based pricing helps to relievemoral hazard problems: Banks that try to usethe availability of insured deposits to increaserisk will be penalized through higherpremiums.
Under Oliver, Wyman's proposed pricingstructure, expected loss would be calculated“bottom-up” at the level of individual banks.This can be done by breaking expected loss foreach bank into its components: expecteddefault frequency; exposure; and severity.Approaches for estimating each of thesebuilding blocks are suggested below:
Expected Default Frequency
Expected default frequency (EDF) is the mostsignificant of the expected loss buildingblocks.5 There are two basic approaches theFDIC could use to quantify the default
5 EDF is "expected default frequency," or probability ofdefault. The EDF is one of the three components thatdetermine expected loss, which is described by thefollowing relation:
Expected loss = (EDF) x (exposure) x (loss givendefault).

10
probability of individual banks. The firstmethod is a fundamental analysis of a bank’scondition, encompassing risk profile, financialstrength, management, market position, andfuture prospects. The second method is toleverage the analysis of others by interpretingmarket price information.
Fundamental analysis
A private sector company that underwrotedeposit insurance would need to have a processfor evaluating the riskiness of each customer.This process would likely resemble that whichlarge banks use in evaluating the risks oftrading counterparties and correspondentbanks. Typically, such an analysis incorporatesa number of elements, including the risk profileof the institution (credit, trading, asset/liability,event, and business risks), its financialresources (capital, reserves, subordinated debt,unrealized gains, sellable goodwill) and thequality of its management.
The FDIC already has access to many of thefactors that go into a fundamental analysis,either through Call Reports or through theexamination process. A key difference fromexisting CAMELS ratings, however, is howthis information is processed. In order to beuseful for pricing purposes, the fundamentalanalysis needs to be summarized in a score orgrade which, in turn, is directly calibrated to anabsolute measure of default risk (EDF). Atmany leading institutions, this is done bymapping the results of fundamental analysis tothe external agency ratings of rated financialinstitutions. This mapping is then used tocalibrate all scores (for both rated and unratedinstitutions) to their EDF equivalents.
At a minimum, such an approach can beundertaken with the elements of the existingCAMELS ratings. Oliver, Wyman would,however, advocate that the resulting gradesshould be more granular and provide for a
much greater dispersion of exposure than thecurrent risk buckets.
Market analysis
As an alternative (or supplement) tofundamental analysis, the FDIC could also seekto leverage market price information. In sodoing, the FDIC would be outsourcingcounterparty evaluation to the credit markets,using the premiums they are charging banks asan indicator of risk.
A number of market instruments could be usedas barometers of credit risk, including:
• (Uninsured) interbank deposits• Senior debentures• Subordinated debt• Interest rate swaps• Credit derivatives• Equity
In addition, the FDIC could encourage thedevelopment of new products for the purposeof providing market price information tailoredto FDIC’s pricing needs. For example, bankscould be required to purchase private depositinsurance in addition to that from the FDIC,either on a separate class of deposits, or as co-insurance to the FDIC. Recent proposals for aspecial class of subordinated debt could alsoserve as a market price indicator.
The main drawback to the use of market pricesis that they are limited to banks that are largeenough to attract an active market in theirsecurities. While regulatory encouragementcould increase the number of banks withappropriate instruments, it is likely that for themajority of smaller banks, even if they were toissue market debt, there would be little trading,and thus relevant price information. Forpractical purposes, a market-pricing regimewould have to be limited to larger banks.Nevertheless, market prices could still beuseful as external benchmarks of credit risk,

11
particularly to establishing relative risk on thebases of observed premiums.
Exposure
Exposure measurement is the moststraightforward of the expected loss buildingblocks. For each bank, this should be theamount of insured deposits. An alternativewould be to base exposure measurement ontotal deposits (insured plus uninsured) on thetheory that this would also capture exposure in“too big to fail” (TBTF) cases. However, sinceTBTF coverage would presumably affect onlyan unspecified number of large banks, insureddeposits remains the best single measure ofexposure.
Severity
Severity is the size of the loss to the FDIC, as apercentage of the total defaulted exposure to allinsured deposits. While important, differencesin the expected severity among banks aresmaller than differences in EDF. We wouldthus recommend a simpler treatment of severityestimation. The FDIC experience shows thatthe severity of loss from small banks is usuallygreater than that for larger banks. This shouldbe priced into risk-based premiums, eitherdirectly, or by investigating the underlyingdrivers of this difference. Factors which mightprove to be good indicators of severitydifferentiation include business mix, loanconcentration, and the structure of liabilities.6
The FDIC faces some practical constraints onits pricing of deposit insurance. There arelimits on the extent to which risk distinctions
6 Oliver, Wyman would normally recommend that theseverity rates used in pricing be based on historicalexperience. However, the changes in early resolutionbrought on by FDICIA, if successful, should lowerexpected severity. Unfortunately, the experience of bankdefaults since FDICIA is too limited to determine if thisis the case, and if so, how much loss severity has beenreduced.
can or should be made using either objective orsubjective measures. Within those limits,however, setting deposit insurance premiumsbased on expected loss is over the long termlikely to minimize the distortions and moralhazard problems associated with depositinsurance, and minimize the cross subsidizationof the weakest banks by the strongest.
Conceptually, the question of how depositinsurance is priced at a point in time can beviewed in two ways. As discussed in thepreceding text box, a "bottom-up" view wouldset pricing at the individual bank level and letoverall revenue result from the sum ofpayments across banks. A "top-down" viewwould instead attempt to estimate appropriateaggregate funding needs and then allocateprices across banks based on risk.
The next section of the paper takes anaggregate perspective and discusses howinsurance losses are funded over time. Thissection deals with how to assess risk at theindividual bank level; the discussion here isconsistent with either a bottom-up approach topricing or a top-down approach that features abase price with adjustments for individualbanks based on differences in risk.
Options for moving toward expected losspricing or otherwise differentiating among therisk profiles of institutions in the 1A categorycan be broadly classified into approaches thatrely on supervisory judgment, those that rely onother information, and hybrid approaches. Afew specific examples of how some of theseapproaches could be used to develop “expectedloss prices” for individual banks are includedfor illustrative purposes. We have notattempted to derive expected loss prices forevery risk-differentiation option, but inprinciple one could do this. One could derivehistorical failure rates and loss rates for groupsof banks and use such information to form thefirst and third elements of the FDIC’s expectedloss discussed above. The third element, the

12
proportion of loss borne by the FDIC, couldeither be based on a historical rule of thumb or,alternatively, could be based on a moresophisticated analysis tailored to an individualbank’s liability composition. (See AttachmentE-3 for a full discussion.)
Some of the risk differentiation methods wediscuss below are not amenable to historicalloss analysis because historical informationdoes not exist. Examples would include usinglarge bank supervisory risk matrices moreexplicitly, using a newly developed supervisoryrisk rating, or using elements of non-publicbank-specific information that have not beencollected in the past. In most of these cases,the risk differentiation methods discussedbelow are best viewed as tools to help allocateassessments on a risk-related basis. In somecases, for example, by differentiating risk basedon specific elements of risk-relatedinformation, and depending on the informationcollected, one could conceivably developestimates of expected loss at the bank level asdescribed in the preceding text box.
Because all of the methods considered have thepotential to distinguish more effectively amongA-rated banks, the likely result regardless of
Chart 1
the method selected would be that the safestbanks pay less over the long run.
Options Relying on Supervisory Evaluations
The case for relying on supervisory judgmentas the cornerstone of any attempt to enhancerisk differentiation is easy to state: onsiteexamination provides the most in-depthinformation available. The options for such anapproach include:
• Composite CAMELS ratings;
• Components of the CAMELSratings;
• Risk matrix results; and
• Uniform risk management ratings.
Composite examination ratings. It would bequite simple to achieve additional riskdifferentiation by application of existingsupervisory tools. Specifically, the FDIC coulddifferentiate for insurance purposes betweenbanks with examination ratings of 1 and 2.This would be clearly supportable from a risk
Failure Rates By Composite Rating*
0.7 1.8
16.2
5.1
49.7
0.0
10.0
20.0
30.0
40.0
50.0
60.0
1 2 3 4 5Composite Rating
Pe
rce
nt
*Average cumulative f ive-year failure rates by composite CAMELS rating among commercial and savings banks. Savings and loan associations are excluded.

13
perspective given the relative historical failurerates of these two groups of banks. As shownin Chart 1, the 5-year failure rate for CAMELS2-rated institutions since 1984 was more thantwo-and-a-half times the failure rate for 1-ratedinstitutions.
Component ratings. Other currently usedsupervisory tools could readily be put to use forpricing deposit insurance. For example, thecomponent ratings in the CAMELS systemcould play a greater role. The componentratings are ratings of the individual elements ofthe CAMELS acronym that are assigned in theexaminations: capital, asset quality, manage-ment, earnings, liquidity and sensitivity tomarket risk. The component ratings range from1 to 5, and 1 is the best rating. There is at leastconceptual appeal to greater use of theseratings for setting premiums. Purely toillustrate the concept, one could imagine, forexample, a rating of “2 minus” for 2-ratedbanks with a sufficient number of componentsrated 3 or worse.
Table 1
One concern with this approach is that greaterreliance on subjective information couldcompromise consistency in determiningpremiums, and more so the finer thedistinctions that supervisors are asked to make.This is a general concern that applies to alloptions involving supervisory information andis discussed further below.
Risk matrix results. For the largest banks,results from the Office of the Comptroller ofthe Currency (OCC) and the Federal ReserveBoard risk matrices could be used moreexplicitly. As a supervisory tool, largecomplex banks supervised by the OCC and theFederal Reserve Board are assigned ratings fora variety of risk-management factors. Bankswith the same composite CAMELS rating canhave substantial differences in these risk ratingsand these differences do not affect the premiumpaid by the institution. One could imagineassigning scores based on these matrices.Again, purely to illustrate the concept, a “2minus” could be a bank with a sufficientnumber of high or rising key risk elements inthese matrices.
An impediment to this approach is that there isa lack of uniformity at the agency level, withthe OCC and Federal Reserve using differentmatrices and the FDIC and Office of ThriftSupervision not using a matrix approach. Anexample of the OCC’s Risk Matrix is displayedin Table 1.
Uniform risk management rating. If weconsider approaches that require more time toimplement, the possibilities expand. Forexample, one could imagine an interagencyeffort to develop a uniform risk ratingexplicitly designed to differentiate among thelevels of risk implicit in a 1 or 2 rating. Such arating could consider such factors as the extentof credit concentrations and the quality ofunderwriting standards and internal controls—irrespective of the current financialperformance and condition of the institution—
Risk Types Level Direction
Credit High SteadyPrice Moderate Falling Interest Rate Low SteadyForeign Exchange Moderate RisingLiquidity High SteadyReputation - -Transaction - -Compliance - -Strategic - -
For each of the nine risk types, the OCC risk matrix
indicates the level (High, Moderate, or Low) and
direction (Rising, Steady, or Falling) of the risk.
OCC Risk Matrix

14
and would essentially gauge the institution’soverall appetite for risk. This approach couldbe applied to all institutions, or, alternatively,only to the largest institutions. One concernhere is that designing a uniform interagencyrisk-rating could take years.
There are arguments against basing riskdifferentiation on supervisory judgment. Theexamination process might require a greaterdegree of management discussion in order forexaminers to work constructively with banks toobtain needed information, and bankers mayhave discomfort with additional supervisorydiscretion. Examiner judgments are subject toseveral layers of review and an elaborateappeals process, and one of the disadvantagesof increasing the reliance on supervisoryjudgments for pricing deposit insurance couldbe an increase in the resources bankers andexaminers might have to devote to suchprocesses. It could also be argued that some ofthe tools described above—notably theindividual component ratings and the largebank risk matrices—were intended assubjective supervisory tools that should not beput to uses for which they were not designed.
For the 99-plus percent of insured institutionsthat do not have a continuous onsite examinerpresence, there also may be significant issuesof timeliness in relying on examiners todifferentiate the risks taken by the vast majorityof well-performing banks. Most banks areexamined on an eighteen-month cycle. Theissue concerning the timeliness of onsite data isreduced in larger insured institutions that aresubject to ongoing targeted examinations or amore frequent examination cycle.
Changes in risk profiles between examspresently are addressed using offsitemonitoring tools, with an onsite exam or othersupervisory review as needed; in particular, adowngrade of a bank to a 3-rating is generally
validated with an onsite examination. If thepremium system were structured todifferentiate more among the 9,000-plusinstitutions not currently subject to heightenedsupervision, and if changes in an institution’srisk category required an onsite supervisoryreview, resource demands on the supervisoryprocess would increase.
Options Relying on Objective Factors
Another general method to consider would be“factual” or data-driven approaches. Severalsources of information could feed suchapproaches: non-public bank specificinformation, bank Call Reports, or marketinformation.
Non-Public Bank-Specific Information
The federal banking regulators have access to asignificant amount of non-public informationabout insured institutions, information that maybe a useful supplement to Call Report data forpurposes of evaluating institution risk profiles.It may be possible to develop a basic packageof objective information that would assist in theprocess of differentiating the risk profiles of themajority of strong-performing institutions.Much as premiums are now assigned based notonly on supervisory evaluations of capitaladequacy, but on the capital ratios themselves,one could imagine the FDIC differentiating riskprofiles directly from non-public informationprovided by banks.
The Canada Deposit Insurance Corporation(CDIC) created a risk scoring system in 1999that is based, in part, on regulatory reportinginformation and partly on information provideddirectly to the CDIC by its member institutions.The score incorporates information on a varietyof risk-related factors including capitalization,significant credit concentrations, and self-certifications of the extent of adherence to

15
defined risk-management standards. Thestandards adherence information is submittedby the banks annually to the CDIC, with a copyprovided to each institution's primarysupervisor. CDIC assigns banks to one of fourrisk categories for insurance purposes based onboth the supervisor’s examination rating andthe information banks provide. (Banks that donot provide information are put in the worstpremium category.) The algorithm forassigning banks to categories based on theinformation provided is known to the memberinstitutions. Attachment B-1 summarizes themajor features of the CDIC risk scoring system.
The CDIC’s experience has been that itsscoring system provides a reasonable balancebetween qualitative and quantitative factors,and that it is relatively transparent and easilyunderstood by member institutions. Thedoubling of premiums payable resulting from adrop from one category to the next appears toprovide incentives to member institutions toeither improve their financial results or theiradherence to the standards.
The CDIC faces issues with its system thatundoubtedly would be faced under any similarscoring system that might be devised. Theselection of a particular scoring methodologycreates the possibility that institutions focusedon maximizing their scores could achieve thebest premium category, but might still beconsidered risky by other measures that are notencompassed by the system. This issue, andthe related question of how, and how often, theinformation the insurer receives is to beverified, are addressed in part through thesupervisory examination process. The detailsof how that occurs are a subject of continuingdiscussion between the CDIC and the primarysupervisor, as would likely also be the case ifthe FDIC were to implement such a system.There is also the tradeoff between reportingburden and comprehensiveness of results. Forexample, the quantitative part of the CDIC’ssystem includes very little off-balance sheet
information, as it was felt that such inclusionwould require excessive filing requirements.
The CDIC’s approach is one among many thatcould be devised along similar lines. Thedesign of a risk scorecard could be exposedboth to public comment and the expertise ofindustry practitioners in both small and largebanks.
The advantage of this approach potentiallywould be in using more detailed risk-relatedinformation without imposing a regime wheresupervisors are asked to make subjectivedistinctions among healthy banks. Moreover, itcould avoid the resource and timeliness issues,described above, that could arise if supervisorswere asked to monitor inter-examinationchanges in risk profiles for over 9,000 banksalong a more finely graduated scale than is nowrequired.
Such an approach could raise concerns aboutthe burdens of creating another layer of bankreporting. Those concerns might be allayed ifthe risk scorecard were either simple, or builton information that is readily available to awell-managed bank. In this regard, acomparison with developments in capitalregulation may be appropriate. The momentumtowards basing large-bank capital requirementson internal credit ratings accommodatesdifferences in banks’ internal ratings scales,provided those ratings can be mapped to acommon rating scale. Thus it may allow forboth flexibility at the bank level and analyticalrigor in the setting of capital requirements.This new direction in capital regulation is anexample of a systematic use of non-publicbank-specific information for a significantpolicy goal. Deposit insurance pricing maysimilarly be able to benefit from such asystematic use of non-public information.

16
Bank Call Reports
Better differentiation of risks in the premiumsystem using public financial reports would beconceptually straightforward. There isconsiderable variation in the financialcharacteristics of the 9,000-plus insuredinstitutions in the highest assessment category.Using figures reported by banks for year-end1999, Table 2 displays differences between 1A-rated banks in the top 10 percent on severalperformance factors and those ranked in thebottom 10 percent. (Attachment C explainsthe nine risk classifications currently used bythe FDIC to assign premiums.) The tablereveals substantial differences between thesegroups that are not reflected in their assessmentratings, since all are rated 1A and currently paynothing for deposit insurance.
Table 2
(See Attachment D-1 for more details on thedispersion of capital ratios for institutions rated1A.) As described below, the difficultquestions relate to choosing from a multitudeof available approaches, and evaluating theusefulness of the results.
A number of financial ratios have been shownto be indicators of the potential for futurefinancial distress, examination downgrade orfailure.7 An FDIC study of the banking crisisof the 1980s found that high loanconcentrations, rapid loan growth and highdependence on volatile liabilities were
7 O'Keefe and Reidhill (1997); Demirguc-Kunt (1991);Gajewski (1989); Whalen and Thomson (1988).
significantly associated with higherprobabilities of failure (FDIC, 1997).
Suppose we identify a set of ratios for whichhigher values often indicate higher risk, otherthings equal. One example of how to use theseratios for pricing would be to use peer analysisto identify outliers. (See Attachment D-2 foran example.)
As another example, a bank’s financial ratiosmight be used as inputs to a statistical creditscore designed to estimate failure probabilitiesbased on historical experience of banks withsimilar characteristics. The resulting scorecould be used as an indicator for the bank’spremium. Both examples are presented forillustrative purposes only, and represent onlytwo among many potential methods for usingreported financial information.
Using Call Report data to better differentiatethe risks of the majority of strong-performinginstitutions has a number of attractive features.Such data are uniform in format and regularlyavailable. At least in theory, such informationis objective. And there is a vast body ofanalytical work to draw from that is expresslydesigned to measure risk of failure using suchinformation.
One of the issues that would need to beaddressed in applying Call Report ratios iswhether to use peer comparisons or absoluteratio thresholds. Under the peer approach, aninstitution could be reclassified because it doespoorly relative to its peers, even if all of itsratios are strong by historical standards.Moreover, using purely relative comparisonswould make it difficult for bank managers todetermine exactly where their institutionswould be classified for insurance purposesprior to their actual classification. Thealternative is to use absolute benchmarks basedupon historical averages. This gives bankersexplicit targets, should they choose to shoot forthem, and ensures that more institutions move
First Decile Average (%)
Tenth Decile Average (%)
Non-Performing Loans/Loans & Leases 0 3.2
Charge-Offs/Loans & Leases 0 10.2
Loan Yield 5.1 11.1
Commercial Loan Growth -42.1 566
Volatile Liability Growth -41.4 721
Total Equity/Assets 23 6

17
into lower premium categories when theindustry is stronger. (See Attachment D-3 foran example of this approach.)
On the other hand, to the extent that the goal ofmaking additional risk distinctions is merely toensure that higher-risk institutions bear agreater share of the costs of deposit insurancethan lower-risk institutions, the purely relativecomparisons accomplish this. In drivingpricing off such peer-based ratio tests,however, attention should always be paid to theabsolute levels of the ratios, in order to avoidmaking pricing distinctions based on negligibleor economically insignificant differences infinancial ratios.
Reported information at times has beennotoriously inaccurate. The FDIC’s mostcostly bank failures in recent years haveoccurred rather abruptly among institutions thathad consistently reported strong earnings andcapital. In these cases, an examination oranother event ultimately revealed that reportedearnings had been artificial and overstatedwhile asset values had been inflatedunrealistically. In some cases, Call Report-based offsite tools were indicating that theseinstitutions should be candidates for upgradingfrom a CAMELS “2” to a “1” at the same timethat examiners were placing the institutions onthe problem list.
Another significant limitation of Call Reportinformation is that it is not detailed enough tofairly compare the risk profiles of insuredinstitutions. As a simple example, consider twoinstitutions whose Call Reports indicateidentical concentrations of consumer andresidential mortgage loans. One of theseinstitutions could be specializing in subprimeloans, and the other in conservativelyunderwritten loans, but the Call Reports wouldnot show the difference (except perhaps byinference based on loan yields or otherindicators). One institution could havesignificant commercial lending concentrations
to a few large counterparties, industries, orgeographic areas, while another, with the sameCall Report numbers, may be prudentlydiversified. Call Reports are useful incapturing some types of quantitative data, butdespite past revisions, fail to capture certainqualitative factors that also merit consideration.Reported financial information does notprovide a picture of the risk profile of thereported loans, the quality of internal controls,or, in some cases, the magnitudes of market-sensitive decisions management has made.
Market Information
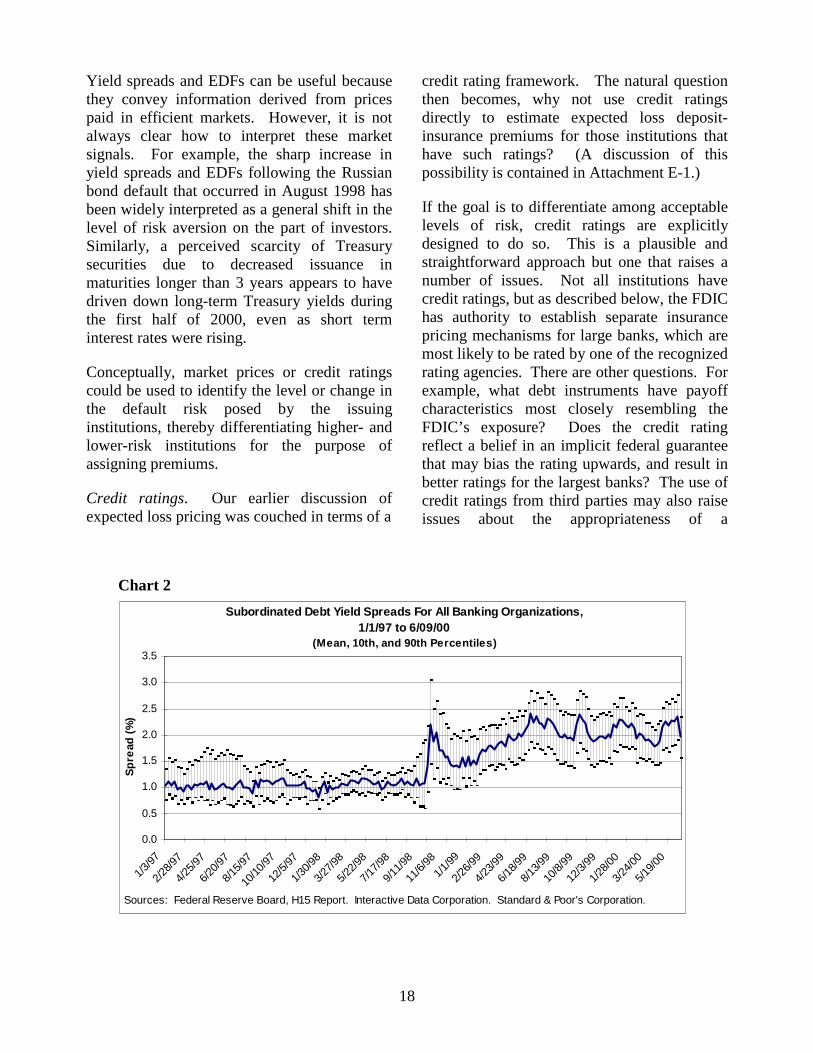
More than 750 insured institutions or theirholding companies, holding over 50 percent ofall insured deposits, currently issue debt orequity instruments that are traded in organizedfinancial markets. As indicated in Chart 2 (seenext page), market prices for these instrumentsappear to reflect a changing aggregate riskprofile over time as well as variations in riskacross institutions.
Chart 2 shows the mean and distribution ofsubordinated debt yield spreads over U.S.Treasury securities with comparable maturitiesfor the period from January 1997 to June 2000.The lower and upper bars of the graphrepresent the 10th and 90th percentile cutoffs,respectively, and are included to show thedegree to which spreads are dispersed aroundthe mean. Yield spreads increased significantlyover the period, and were particularly volatilein 1998. These widening spreads, in part, mayreflect growing investor uncertainty regardingcredit risk. Moreover, the expanding spreadbetween the yields at the 10th and 90th
percentiles suggests that market participantshave perceived an increasing disparity amongindividual institutions in recent periods. This iscorroborated by the disparity in EDFs that arebased upon asset price volatilities, in Chart 3(see page 19).
18
Yield spreads and EDFs can be useful becausethey convey information derived from pricespaid in efficient markets. However, it is notalways clear how to interpret these marketsignals. For example, the sharp increase inyield spreads and EDFs following the Russianbond default that occurred in August 1998 hasbeen widely interpreted as a general shift in thelevel of risk aversion on the part of investors.Similarly, a perceived scarcity of Treasurysecurities due to decreased issuance inmaturities longer than 3 years appears to havedriven down long-term Treasury yields duringthe first half of 2000, even as short terminterest rates were rising.
Conceptually, market prices or credit ratingscould be used to identify the level or change inthe default risk posed by the issuinginstitutions, thereby differentiating higher- andlower-risk institutions for the purpose ofassigning premiums.
Credit ratings. Our earlier discussion ofexpected loss pricing was couched in terms of a
Chart 2
credit rating framework. The natural questionthen becomes, why not use credit ratingsdirectly to estimate expected loss deposit-insurance premiums for those institutions thathave such ratings? (A discussion of thispossibility is contained in Attachment E-1.)
If the goal is to differentiate among acceptablelevels of risk, credit ratings are explicitlydesigned to do so. This is a plausible andstraightforward approach but one that raises anumber of issues. Not all institutions havecredit ratings, but as described below, the FDIChas authority to establish separate insurancepricing mechanisms for large banks, which aremost likely to be rated by one of the recognizedrating agencies. There are other questions. Forexample, what debt instruments have payoffcharacteristics most closely resembling theFDIC’s exposure? Does the credit ratingreflect a belief in an implicit federal guaranteethat may bias the rating upwards, and result inbetter ratings for the largest banks? The use ofcredit ratings from third parties may also raiseissues about the appropriateness of a
Subordinated Debt Yield Spreads For All Banking Organizations, 1/1/97 to 6/09/00
(Mean, 10th, and 90th Percentiles)
0.0
0.5
1.0
1.5
2.0
2.5
3.0
3.5
1/3/
97
2/28
/97
4/25
/97
6/20
/97
8/15
/97
10/1
0/97
12/5
/97
1/30
/98
3/27
/98
5/22
/98
7/17
/98
9/11
/98
11/6
/98
1/1/
99
2/26
/99
4/23
/99
6/18
/99
8/13
/99
10/8
/99
12/3
/99
1/28
/00
3/24
/00
5/19
/00
Sp
read
(%
)
Sources: Federal Reserve Board, H15 Report. Interactive Data Corporation. Standard & Poor's Corporation.

19
government agency relying on informationprovided by specific private firms for importantpublic policy decisions, especially when thosefirms may have less information or experiencethan the government agency on which to basetheir judgments.
Subordinated debt. The FDIC currentlymonitors the spreads individual institutions payover comparable U.S. Treasury obligations forvarious debt instruments. Referring again toChart 2, page 18, it is clear that the mean yieldspreads on subordinated debt vary over timeand that the market differentiates observablyamong institutions in its pricing ofsubordinated debt. One could envision asystem in which institutions with the highestspreads are classified into a higher-riskcategory for premium purposes. AttachmentE-2 contains a discussion of this issue.
Subordinated debt has received considerableattention as an instrument that could enhancemarket discipline for large institutions andconvey early warning signals to regulators.Subordinated debt is regarded as particularlyattractive because the incentives of
Chart 3
subordinated debt holders line up with those ofthe FDIC; these debt holders do not share in theupside from any gambles taken by bankmanagement, and subordinated debt pricingtends to discourage imprudent risk-taking.
Owing to these characteristics, there have beenseveral proposals to require large institutions toissue some minimum amount of subordinateddebt on a regular basis. The Gramm-Leach-Bliley Act requires the Treasury Departmentand Federal Reserve Board to conduct a studyof subordinated debt requirements, and thereport is due to Congress on May 12, 2001.One of the primary arguments against asubordinated debt requirement is that itinterferes with management decisionsregarding the optimal liability structure fortheir institution. Subordinated debt is notwidely issued at the bank level, and even whereit is, it may be in amounts or on terms differentfrom those that would be mandated by aregulatory requirement.
Top 50 Institutions (by assets): EDF Values, 1/97 to 4/00 (Mean, 10th, and 90th Percentiles)
0.0
0.2
0.4
0.6
0.8
1.0
1.2
01/9
703
/97
05/9
707
/97
09/9
711
/97
01/9
803
/98
05/9
807
/98
09/9
811
/98
01/9
903
/99
05/9
907
/99
09/9
911
/99
01/0
003
/00
EDF
Source: KMV Corporation. EDF=One Year Expected Default Frequencies, w hich are derived using a proprietary options-pricing model that incorporates asset price volatilities, among other factors.

20
There are at least two broader sets of issues thatarise in connection with the use of market datafor deposit insurance premiums. One is thatthe use of market data would effectively createtwo pricing mechanisms for deposit insurance,one for larger, publicly traded institutions andanother for smaller privately held institutions.The second issue is the difficulty of extractingthe appropriate information from market prices.Price movements often reflect more than purechanges in the individual default risk of theissuing institution. For example, price changescan reflect developments in the broadereconomy or the financial markets that influencethe supply or demand for many types ofinstruments. In analysts’ terms, the “signal-to-noise” ratio associated with price changes issometimes low, and extracting the true marketsignal regarding the institution may not bestraightforward. In addition, even after the truemarket signal about an individual institutionhas been extracted, the result may notcorrespond to supervisory evaluations of thatinstitution.
The differences between large and smallinstitutions have been growing for some time.Large institutions have increasingly complexrisk profiles, global operations, and expandinglines of business, and they are subjected tomarket scrutiny in an increasingly competitiveenvironment. Small institutions remain morecommunity-based, focused on a limited numberof core businesses, and privately held. Inrecognition of these differences, FDICIAexplicitly authorized the establishment of twodistinct premium systems based upon the sizeof institutions. The FDIC has thus far notexercised this authority, given that the 1996statutory constraint effectively precludes anymeaningful distinctions. A well-establishedmovement exists within the bank regulatorycommunity toward separate approaches tosupervision and capital regulation for large andsmall institutions, and it is time to reconsiderwhether a "one-size-fits-all" approach to
deposit insurance pricing will remain suitablegoing forward.
Hybrid Approaches
We have differentiated between subjective andobjective approaches. Our current pricingsystem uses both, namely examination ratingsand capital ratios. (Attachment C provides anoverview.) Market prices are likely toincorporate both subjective and objectiveinformation, as just discussed. Other hybridapproaches could be considered. For example,the subjective factor could continue to be basedon the examination rating, with the objectivefactor being some type of risk score based onCall Report ratios, market risk indicators, orother non-public information.
All three types of information considered in thepreceding sections could be combined into ascoring system for determining premiumclassifications. The approach used by theCDIC is another example of a hybrid approach.Attachment B-2 illustrates the results ofapplying a CDIC-style approach to U.S.institutions using a subset of variables. TheCDIC system is more complicated than theFDIC system in some respects, but it is alsosimpler in that it contains only four premiumcategories.
Customized Financial Contracts
One possible way to use market information todifferentiate risks without imposing a particularfunding structure on insured institutions mightbe to go beyond simply monitoring capitalmarkets and begin entering into financialcontracts that price and share the risk of failureat individual institutions. The FDIC couldenter into financial contracts that, in exchangefor a premium paid to the holder, expose theholder to a defined risk in the event of the

21
failure of a specific institution or pool ofinstitutions. The premium that holders requireon such contracts provides information relevantto expected loss pricing.
In 1991, the FDIC was granted the authority to“obtain private reinsurance covering not morethan 10 percent of any loss the Corporationincurs with respect to an insured depositoryinstitution.”8 The FDIC completed a study inJune of 1993 that found that the conceptualattractiveness of a reinsurance program wasoffset by the complexity of the practical andpublic-policy issues that would first have to beaddressed. Of particular importance was that amarket for such risk did not exist at that timeand, as a result, the terms under which suchcoverage could be obtained were not favorableto the FDIC.
In the last few years, however, financialinnovation has greatly expanded the range ofnontraditional alternatives in which the capitalmarkets can be employed to finance risk.Examples that may be useful for the purposesof pricing deposit insurance includecollateralized loan obligations, creditderivatives (default swaps) and other structured
8 12 U.S.C.A § 1817(b)(1)(B).
securities. The FDIC could work with marketpractitioners to explore the feasibility of usingsuch instruments for price discovery, as aninput to premium setting.
Making use of market information in thismanner can address bankers' concernsregarding subjectivity, given that market pricesreflect the collective judgment of diverse,informed parties with personal wealth at stake.Market prices also are inherently forward-looking, and they may serve as a check on anyinefficiencies in the FDIC pricing process. Forexample, through market pricing the FDIC maylearn that some reporting requirements havelow value-added, given other information, andindustry burden could be reduced byeliminating such requirements withoutsacrificing accuracy in price setting.
Similarly, market information could help toreduce the distortions that can arise whengovernment-administered prices are introducedinto otherwise competitive markets. Marketparticipants can be expected to use bothsubjective and objective information fromseveral sources to price risk—any informationthat contributes to more accurate pricing.

22
III. FUNDING DEPOSIT INSURANCE LOSSES
Funding arrangements play a critical role in thedesign of a deposit insurance system. A well-designed system will ensure that adequatefunds are readily available to respond toproblems as they arise; inadequate funding canlead to delay in resolving failed institutions andsignificant increases in costs. The design of thefunding arrangements will determine whetherthe industry is asked to pay for the costs ofdeposit insurance when the industry is healthyor when it is experiencing problems.
From 1934 until 1950, all FDIC-insured bankswere assessed at an annual rate of eight-and-one-third basis points per dollar of domesticdeposits. This revenue went into an insurancefund where it earned interest and was availableto meet operating expenses and pay for thecosts of insuring depositors. Under this fixedpremium rate approach, the size of the funddepended on the extent to which revenues andinterest income exceeded expenses. A keyfeature of this system was that banks wererequired to pay annually for deposit insurance.The fact that the premium rate was stable andthe fund grew when the economy was healthyallowed the system to smooth the costs ofdeposit insurance over time.
One concern with a fixed-premium approach isthat the premium rate might prove to be toohigh or too low. At an aggregate level, thiscould mean that over time the industry wouldeither be over- or under-charged for depositinsurance. As it happened, in 1950 Congressaddressed the industry’s concern that theinsurance fund had grown too large byrequiring the FDIC to return a portion of excesspremium revenue each year. Thus, theeffective premium rate was tied to the currentyear expenses of the deposit insurance system,
and could range from slightly more than 3 basispoints to 8.33 basis points.
This system was in place until 1989, when theearlier concerns about over-charging werereplaced by concerns about under-charging asthe insurance fund declined. In the aftermathof taxpayers funding FSLIC losses, Congressaddressed concerns about the viability of thesurviving funds by significantly changing theassessment system. A DRR was establishedand premiums depended on whether the reserveratio was above or below this target. Underthis system, which for the first time gave theFDIC some discretion over rate-setting, theeffective premium rate could range from 0 to32.5 basis points, with increases in any oneyear limited to no more than 7.5 basis points.By 1991, the premium rate had reached 23basis points.
As noted in the introduction of this paper, in1991 FDICIA brought further changes byproviding broad discretion to the FDIC toachieve two mandates: establishing a risk-based premium system and maintaining thefunds at the designated reserve ratio.9 TheDIFA significantly curtailed that discretionwhen the funds are above their targets.
As a result of these changes, the originalsystem with a focus on a steady long-termpremium rate has been replaced by a systemwith a focus on a target fund ratio. The current
9 FDICIA included additional mandates to help preventfuture crises, such as "prompt corrective action"requirements for bank supervisors to ensure earlysupervisory intervention for deteriorating institutions,and a " least-cost resolution" requirement to control thecosts of resolving bank failures. As with otherprovisions of FDICIA, these have not yet been tested byadverse economic conditions.

23
system has an adjustment mechanism wherebyas banks' condition deteriorates, they pay moreinto the fund. Current arrangements reflect thedesire to ensure that taxpayers will be protectedfrom deposit insurance losses. At the sametime, it results in what might be called a pay-as-you-go system. During good times, bankspay an insignificant amount; during bad times,the cost of bank failures are passed through tobanks when they can least afford it. Losses aredetermined after the fact and survivors areasked to pay.
Another key question that drives the discussionof aggregate funding is whether banks shouldbe able to receive disbursements from pastpremiums. If one views the government asbearing all the risk of bank failures with bankspaying a “user fee” to compensate thegovernment for doing so, then the answer is no.Another view is that if the government bearsonly extreme or catastrophic losses while theindustry bears losses up to that point through amutual arrangement, then banks should havesome explicit claim on past premiums.
Thus, the options discussed below areorganized under two broad headings: user feesand mutual arrangements. Under the user fee,there are two general approaches. The firstrelies on relatively steady average premiumrates designed to equate premium revenue withinsurance losses over a long-term horizon. Thesecond alternative is to allow for morevariation in the average premium rate byadjusting the rate based on current insurancelosses or by linking the rate to the reserve ratioof the deposit insurance fund.
The options under the mutual arrangementheading include: 1) rebates tied to the reserveratio; 2) a system in which banks hold explicitclaims on the insurance fund; or 3) a systemwhich more closely resembles private marketprovision of deposit insurance.
User Fee Model
As mentioned above, a user fee approachwould view the government, not the bankingindustry, as the provider of deposit insuranceand therefore the party responsible for bearingthe risk of guaranteeing bank deposits. Underthis approach, the industry would pay on aregular basis for access to the deposit insurancesystem. Because the payment would be viewedas in exchange for something of value, theindustry would have no claim on previouspayments. This is often compared to privateinsurance; a driver who does not have anaccident does not get his money back.
Long-Term Premium Rates Based onHistorical Experience
In the simplest case, the industry would pay astable average premium rate either set in statuteor subject to infrequent change at the discretionof the FDIC. If revenue needs (losses) in agiven year exceeded the revenue collected, thegovernment would be responsible for thedifference. Likewise, excess revenues wouldaccrue to the government.
One benefit of stable premium rates may be alower cost of capital for the banking industry.If the volatility of deposit insurance losses werepassed directly through to the industry, thiswould add volatility to bank earnings and themarket may discount those earnings. Shaffer(1997) estimates that, based on past FDIC lossexperience, steady premium rates could lowerthe banking industry’s capital cost by $1 billionto $4 billion per year. This is equivalent toadditional yearly premiums of 3 to 13 basispoints for BIF-insured institutions on a pre-taxbasis, or approximately $7 to $29 billion inpotential lending that might otherwise occur.
Obviously, a key issue under the stable rateapproach is the level at which average

24
premiums are set. The correct rate woulddepend on the risk of loss faced by thegovernment over a long-term horizon. Themain concern with an inflexible rate is that thecorrect rate will vary over time with changes inindustry structure, regulatory regimes, and thecompetitive environment.
The practical implication of this approach isthat policymakers must decide how to set theappropriate average stable rate. In the 1930s,the choice of 8.33 basis points was guided by areview of bank failures from 1865 to 1934. Ifwe choose to look to historical experience as aguide in choosing the appropriate price, the keydecision is what time period is most relevant.This is a subjective judgment about how thefuture will compare to past experience. Table 3shows the rates necessary to cover operatingexpenses and insurance losses over varioustime periods for the BIF.10
Attachment F-1 compares the results of a fixedrate approach to actual results for the period1982 to 1999.
Moving Average Approach
Instead of having Congress or the FDIC Boardadjust the rate on an ad hoc basis, an alternativewould be a mechanism for adjusting the rate
10 The table presents the rate that would need to becharged on total domestic deposits in order to make totalinsurance revenues equate to total expenses and lossesover the specified time period. The calculations assumethat there is no fund balance at the beginning of the timeperiod and that the only income to the fund isassessments charged on deposits. Expenses includeoperating and administrative expenses plus estimatedlosses. Deposit and expense figures are taken from theFDIC Annual Reports. The experience of the FSLIC(the prior insurance fund for savings-and-loaninstitutions) is not included in this analysis. Data areincomplete. Moreover, the 1980s savings-and-loanexperience is considered less relevant for today's bankingand thrift industries, given the unique balance sheetstructures of savings and loans in the earlier era,differences in accounting rules, and other factors that nolonger apply to insured institutions.
incrementally over time to reflect experience orchanges in expectations of future insurancelosses.
Table 3
One method would be to use a long-termmoving average of insurance expenses as thebasis for setting the average premium rate. Themoving average would allow premiums toreflect actual insurance expenses, while thelong-term horizon would result in gradualchanges in premiums over time. Thisapproach has been suggested by Konstas(1992) and Shaffer (1997). Chart 4 (see nextpage) shows the moving average of insuranceexpenses over different time horizons.
The annual average premiums that would haveprevailed over different periods using variousmoving averages are set out in Table 4.
Table 4
One of the concerns with such an approach isthat it will result in banks paying higherpremiums as a result of banking problems thatoccurred far in the past. Moreover, thisapproach could result in extended periods overwhich the deposit insurance system is not self-financing, and it is unclear whether this wouldbe politically acceptable.
10-Year 15-Year 20-YearMoving Moving MovingAverage Average Average
1934-1979 1.1 1.1 1.2
1980-1999 11.9 10.3 9.1
1934-1999 4.4 3.9 3.6
Time Period
1934-1979
1980-1999
1934-1999 8.5 basis points
Insurance Rate Required to Equate Premium Revenue with Fund Expenses
and Insurance Losses
11.2 basis points
1.0 basis points
Required Overall Rate

25
Analytical Approaches
The moving-average approach relies on pastperformance to set the assessment rate. Whilethis has the advantage of simplicity, it ignoresrelevant information about potential futurelosses. An alternative would be to incorporaterelevant financial, supervisory, and marketinformation. The previous section of this paperdiscussed how such information could be usedto develop expected loss pricing at individualinstitutions and how such information couldalso serve as the basis for aggregate pricing.The very preliminary analysis contained in theOliver, Wyman & Company report resulted inan expected loss figure for the BIF thattranslated into slightly more than 5 basis pointsof assessable deposits; again, this is a highlyqualified result. (See the following text box.)
Chart 4
Oliver, Wyman & Company AnalyticalFramework
Oliver, Wyman's suggested approach forevaluating policy options is to apply analyticaltools and methodologies that have beendeveloped for analyzing risk and capitalmanagement in banks and other financialinstitutions to the deposit insurance system.The cornerstone of this approach is to modelthe loss distribution of the FDIC insurancefunds. The loss distribution can then be used toevaluate the appropriate level of fund adequacyand reserving in terms of a stated confidenceinterval or solvency standard. Furthermore,this analytical approach can be applied toidentify pricing options that are consistent withmarket practice.
While the proposed analytical framework mayseem like a novel approach for evaluating therisk of the deposit insurance system, thisapproach is increasingly the best practice
Deposit Insurance Premiums: 1980-1998 Based on a Moving Average of Losses and Expenses to Insured Deposits
0
5
10
15
20
25
30
1980
1981
1982
1983
1984
1985
1986
1987
1988
1989
1990
1991
1992
1993
1994
1995
1996
1997
1998
Bas
is P
oin
ts
5 Year Moving Average
30 Year Moving Average
20 Year Moving Average
10 Year Moving Average

26
among leading bank and non-bank financialinstitutions in the U.S. and abroad. In fact,efforts to set capital in relation to an explicitmodel of a financial institution’s risk profile lieat the core of the current proposals for reformof the Bank for International Settlements' (BIS)capital rules. (See, for example, Jones andMingo, 1998). Oliver, Wyman's approachapplies the same types of methodologies thatare under consideration by the BIS ModelsTask Force to the FDIC’s own loss distributionfor resolving similar questions of risk andcapital management.
Modeling the Loss Distribution
The first step in analyzing the FDIC’s riskprofile is to recognize that the depositinsurance funds are portfolios of credit risks.These portfolios consist of individualexposures to insured banks and thrifts, each ofwhich has a small but non-zero chance ofcausing a loss to the fund. Such a portfolio issimilar to a bank loan portfolio, although thenature of the underlying risks in the FDICfunds raises unique issues.
Chart A shows the typical credit lossdistribution for an insured bank. Thedistribution is characterized by the portfolio’slevel of average, or expected, loss; by the sizeor concentration of individual exposures; andby the correlation among loans in the portfolio.Unlike a normal distribution, the bank creditdistribution is heavily skewed: It has a longright tail, meaning that most often, losses arerelatively small, but there are cases in whichlarge losses may arise. In order to protectagainst these losses, a bank is required byregulators (and by rating agencies, uninsureddepositors, and other creditors) to hold capitalto cover the potential for loss at a high degreeof confidence. In this case, the bank holdscapital up to the 99.9 percent confidenceinterval.
If the losses exceed this point, then the bankwill become insolvent. To the extent that thereare insufficient funds available to repay insureddeposits, then the excess deposit losses will beborne by the FDIC.11 Put another way, theFDIC assumes the residual “tail” risk of loss toinsured deposits. For the individual bankconsidered above, the FDIC’s risk profile isshown in Chart B. There is a high probabilityof no loss, and the residual tail probability ofsome loss to the fund.
The FDIC’s exposure to individual banks canbe added together to create a cumulative lossdistribution. Just as with a bank’s credit lossdistribution, the FDIC’s cumulative lossdistribution will reflect the expected loss of theindividual insured banks; the size of individualexposures; and the correlation of losses in theportfolio. Chart C shows conceptually what thecumulative loss distribution for the depositinsurance funds should look like. Thedistribution will be heavily skewed, with a highprobability of very small losses to the fund, buta significant probability of large losses. Thepotential for large losses will result, in part,from the presence of large banks in theportfolio. The “lumpiness” in the distributionreflects the contribution of individual largebanks, each of which imposes a discrete, non-zero probability of a sizeable loss to the fund.
11 In the event of default, history tells us that some of thelosses are “recovered.” As such, the loss to the insurancefund may be a fraction of what the tail suggests. This iscommonly referred to as “severity,” or loss given default(LGD). The severity should be taken into account whenwe move from Chart A to Chart B.

27
���������������� ������
����� �����
�����������������
��
� �����
�������!""
#�"���$%��!�
�!$�$�&��'
�!""
���(��)*������&!""���(�%��)*������&!""
������ ��� �#��� ������� ���� ��+����
�!$�$�&��'
�����
�!""
������ ��� �#��� ��,�����-�� ����#����������
�!$�$�&��'
�!��&��!""
Adjustments for Current InsuranceExpenses
Whether a long-term pricing mechanism isbased on past loss rates or forward-lookinganalytical techniques, the concern remains thatthe approach might lead to significant buildupsof the insurance funds or prolonged periods oflosses to the funds. One way to address this isto tie pricing more closely to currentperformance. As mentioned earlier, thepremium system in effect from 1950 until 1989
featured a statutory rate of 8.33 basis pointswith a refund of a portion (60 percent) ofexcess revenue in a given year. The statutoryrate was expressed as a maximum rate withdownward adjustments for current perform-ance.
A variation of this approach would be to allowan upward adjustment to premium rates in theevent of a revenue shortfall. Had such a systembeen in effect, premium rates would have risenduring the 1980s as insurance losses mounted.Table 5 (see next page) shows the rates thatwould have resulted assuming that any revenueshortfall up to 5 basis points could be chargedin a given year. In other words, premiumscould rise as high as 13.3 basis points to covershortfalls or fall as low as 3.3 basis points toreflect the overage of collections aboveinsurance expenses. The table also shows theassessment rates that would have resulted fromthe current assessment scheme had it been ineffect as of 1982. A description of thesimulation and methodology is contained inAttachment F-2.
Linking Premium Rates to the InsuranceFund
Under the approaches discussed thus far, thepremium rate is based on a long-term view ofexpected losses, perhaps adjusted for currentexperience. With these approaches, theinsurance fund is free to fluctuate in responseto insurance losses, and movements in the funddo not trigger changes in the premium rate.
All the pricing methods above are subject to theconcern that the rate-setting mechanism couldbe biased. If this were the case, over time thefund would come to reflect that bias: excessiverates would result in a fund that was “toolarge”; insufficient rates could result in anegative fund balance. One way to address theconcern about a fund that is too large or toosmall is to link rates to the size of the insurance

28
fund relative to a measure of fund exposure,such as the reserve ratio.
At this point it is helpful to discuss what aninsurance fund means under a user fee systemin which the government bears the risk oflosses in excess of current revenue. Some haveargued that it makes little difference whetherthere is an insurance fund, given that thegovernment is ultimately on the hook forlosses. Feldman (1999) proposes a system inwhich the insurance fund is replaced by astanding appropriation authority.
On the other hand, there are practical reasonsfor the government to maintain an explicitinsurance fund. The insurance fund helps toprotect taxpayers from deposit insurance losses
Table 5
by creating a buffer paid for by the industry.The insurance fund also can be viewed as afederal budgeting mechanism to sequesterdeposit insurance resources from the normalappropriations process. This can help to dotwo things: first, ensure that adequate resourcesare readily available when problems arise, thusavoiding potentially costly delay; and second,help to smooth the costs of deposit insuranceover time. The size of the fund and the lossdistribution determine the probability that aspecial call on industry capital or anappropriation would be needed. Theserelationships are considered further in theaccompanying text box (see next page).
Rate (bp) Ratio (%)
1982 11.6 1.25 7.7 1.21 11.70 1.261983 7.8 1.25 7.1 1.22 6.80 1.251984 11.9 1.25 7.7 1.19 12.50 1.271985 8.2 1.25 8.3 1.19 7.10 1.261986 13.3 1.23 8.3 1.12 15.40 1.271987 11.4 1.25 8.3 1.10 8.30 1.251988 13.3 1.00 8.3 0.80 23.80 1.141989 13.3 0.95 8.3 0.70 23.50 1.221990 13.3 0.47 12.0 0.21 24.00 0.871991 13.3 -0.20 21.3 -0.36 25.80 0.351992 13.3 0.04 23.0 -0.01 26.30 0.761993 13.3 0.59 24.4 0.69 5.90 1.241994 13.3 0.93 23.6 1.15 1.40 1.421995 13.3 1.10 12.4 1.30 0.50 1.421996 9.4 1.25 0.2 1.34 0.20 1.451997 3.3 1.34 0.1 1.38 0.09 1.481998 3.3 1.39 0.1 1.38 0.07 1.481999 3.3 1.41 0.1 1.37 0.10 1.46
BIF Rates Under Different Assessments Schemes
Comparison ResultsBIF Rates If Assessments Had Varied Within a 10 Basis
Point RangeActual
Assessment Rate (bp)
Actual Reserve Ratio (%)
Rates Under Current
Scheme (bp)
Reserve Ratio Under Current
Scheme (%)

29
Solvency Standard – Oliver, Wyman &Company
The cumulative loss distribution allows thepotential for loss to be directly compared withthe reserves and other resources available to theinsurance funds.�� This analysis can also bereversed to determine what level of resources—or reserve ratio—is required to reach a chosensolvency standard. A solvency standard is thedesired minimum confidence that the fund willbe sufficient to make payments on all itsobligations. This can also be expressed interms of a maximum default probability. Onecommon way of describing solvency standardsis in terms of the equivalent credit rating from amajor agency. Table 6 shows the one-yeardefault probabilities consistent with each of therating categories from the two leadingagencies, Standard & Poor’s (S&P) andMoody’s. For example, maintaining aninvestment grade status (BBB-/Baa3 or better)is equivalent to holding sufficient reserves toreduce the one-year default probability tobelow 0.32 percent. That is, an investmentgrade quality fund must be at least 99.68percent confident of being able to meet all ofits obligations in the coming year.
By creating an explicit link between thepotential for loss and reserves, the FDIC canconsider the appropriate level of fund adequacyin terms of both a stated confidence intervaland market equivalents. For example, just asan individual bank chooses to capitalizeaccording to a desired credit rating, so too canthe FDIC choose to capitalize the insurancefunds to a desired rating. This approach differsfundamentally from the current system, in
12 The first resource is the expected income frompremiums and interest. In most cases, this will be morethan sufficient to cover the losses and the fund will havea gain. The next resource is the current balance of thefund itself. If the losses in any period exceed the fundsavailable, a backstop resource, such as a loan or grantfrom the Treasury, is required to ensure the payment ofall obligations.
Table 6
*The calculated default probabilities reflect the methodology of Oliver,Wyman.
which the DRR is set as a fixed percentageindependent of the fund’s actual loss profile.
Setting a Hard Target for the InsuranceFund
A hard target for the insurance fund wouldmean that premium rates would adjust quicklyto changes in the reserve ratio. This is similarto the current system, in that the premium rateeffectively drops to zero when the fund isabove the target, and rises to a high level, 23basis points, if the reserve ratio is not expectedto return to the target within a year.13
The advantage of keeping the reserve ratio at atarget is that it helps to ensure that there isalways an adequate buffer between depositinsurance losses and the taxpayer. It does thisby giving the FDIC a call on this industry'scapital to the extent necessary to maintain thefund ratio target.
The disadvantage is that it can result in longperiods where deposit insurance is essentiallyfree followed by short periods where premiumrates are extremely high. This pattern makes it
13 See 12 U.S.C.A. § 1817(b)(2) (West Supp. 1999).
AAA 0.01% Aaa 0.01%AA+ 0.02% Aa1 0.02%AA 0.03% Aa2 0.03%AA- 0.04% Aa3 0.04%A+ 0.05% A1 0.05%A 0.07% A2 0.07%A- 0.09% A3 0.09%
BBB+ 0.13% Baa1 0.13%BBB 0.18% Baa2 0.18%BBB- 0.32% Baa3 0.34%BB+ 0.53% Ba1 0.63%BB 0.93% Ba2 1.21%BB- 1.57% Ba3 2.25%B+ 2.64% B1 4.21%B 4.46% B2 7.86%B- 7.52% B3 12.95%
Ratings Calibrations
Standard &Poor's Credit
Rating*
One YearDefault
Probability*
One YearDefault
Probability*Moody's Credit
Rating*

30
virtually impossible to implement a risk-basedpremium system with expected loss pricing.
Extended periods with zero premium rates alsoallow deposits to enter the system withoutcontributing to the insurance fund. Some havesuggested that this could be addressed byintroducing a surcharge for rapid growth orlarge deposit flows. While this would addressfree-rider concerns, there are several drawbacksto such an approach. First is the practicalquestion of deciding what constitutes rapidgrowth or large deposit flows. Applyingsurcharges on deposit growth in excess of somepercentage or dollar volume will result in ratherarbitrary distinctions and create incentives formanipulating the system.
Second, deposit growth will often simplyreflect the healthy innovative behaviornecessary to serve customers in a competitivemarket. This is true whether the growth is fromnewly chartered institutions, pioneers inelectronic banking, or large financial servicesfirms delivering the benefits of financialmodernization. It may be difficult to structuresurcharges that address concerns about fairnesswithout inappropriately stifling suchinnovation.
Setting a Soft Target for the Insurance Fund
There could be funding arrangements designedto maintain a target reserve ratio over timewithout introducing volatile swings in premiumrates. A soft target approach would allow thereserve ratio to return more slowly to the target,thus providing for more stable premiums. Thepremium rate could vary depending on how farthe reserve ratio was from the target.
Attachment F-3 reports the results of a MonteCarlo simulation of a system with a 15 basispoint cap and a 4 basis point floor. Premiumadjustments do not take place unless the fundbalance is ±21 basis points from the reserveratio target. Premiums would then be adjusted
by no more than ±11 basis points for a singlechange. Using data from 1980 to 1999, thefund balance remains positive in all 300simulations. This suggests that there may besoft target approaches that reduce premiumvolatility compared to the current systemwithout materially increasing the risk of fundinsolvency.
Mutual Model
Under a user fee approach, the notions ofrebates or banks holding claims on theinsurance fund are ruled out. With anappropriate pricing mechanism, past premiumsrepresent compensation for the government forbearing risk, not capital of the industry that isheld in trust by the government. This sectionwill discuss rebates, bank claims on the fund,and additional private-sector features that couldbe introduced into the deposit insurancesystem.
Rebates
The argument for rebates arises from theconcern that the pricing mechanism could, overtime, result in excessive charges to theindustry. This may be a reasonable argument,given the uncertainty associated with depositinsurance losses. Rebate authority would allowthe FDIC to price insurance at the margin foreach bank, while providing a safety valveagainst an excessively large insurance fund.
The reserve targeting approach can be used as amechanism for determining when rebateswould be appropriate. One approach is to placea cap on the insurance fund and to rebate fundsabove that amount. Pending legislativeproposals adopt this approach but direct therebates toward payment of insured institutions'obligation to pay interest on FinancingCorporation (FICO) bonds. An alternative is to

31
specify a range where some portion of excessfunds is rebated to the industry.
If policymakers reach the conclusion thatrebates are appropriate, the question stillremains as to how to allocate the rebates.While premiums are based on the currentassessment base held by banks, this is notlikely to be an appropriate basis for distributingrebates. New institutions and those that hadgrown rapidly would be given a distribution ofincome from past premiums that they did notpay. A more equitable approach would be tobase rebates on past premium payments, whichrequires a decision about the appropriate look-back period.
An important feature of mutual arrangements isthat rebates could be distinct from premiums.Rebates would be appropriate when theprobability of insolvency of the insurance fundsbecomes sufficiently remote, and would beallocated based on past payments. Premiumswould be based on the risk a bank posed to theinsurance fund; this would never be zero. Thecash flow between a bank and the insurancefund would thus have two components, onereflecting past contributions and the otherreflecting risk exposure. The net result of thesecash flows might be positive or negative. Evenif the net result were zero for many banks, thiswould still represent an improvement over thecurrent zero-premium system. This is becausebanks would be protected from the possibilitythat the insurance funds may grow withoutlimit, while still being charged at the marginfor the risk they pose to the insurance fund; thisis critical if premiums are to provideappropriate incentives.
Banks Hold Explicit Claims on the MutualInsurance Fund
Rebates are not the only possible feature of amutual deposit insurance system. Once thenotion of tracking past contributions for the
purposes of providing rebates is introduced, thesystem moves to a mutual system that involvesexplicit claims; this leads to a significantlydifferent framework for funding depositinsurance.
The current federal credit union share draftinsurance system is an example of a system inwhich insured institutions have explicit claimson the fund. Credit unions are required tomaintain a one percent deposit in the insurancefund. When the fund is above a leveldetermined (within bounds) by the depositinsurer, rebates are provided. Another featureis that on an individual institution basis, depositgrowth must be accompanied by a proportionalcontribution to the insurance fund. The creditunion model has been criticized for itsaccounting treatment because the deposits thata credit union must place in the insurance fundare counted as an asset on the books of thecredit union and as part of the insurance fund.These and other features of the credit unionsystem are reviewed in a 1997 study by theTreasury Department. On the other hand,Hendershott and Kane (1996) have argued thatthe credit union insurance model providespositive incentives for monitoring by memberinstitutions.
Following the mutual model, banks also couldbe required to pay into the fund an amountproportional to deposits. If a bank’s depositsgrew, the bank would be required to “top up”its contribution to maintain it at the specifiedproportion. Likewise, a bank with depositshrinkage would be entitled to a rebate orcredit.
This feature could address the concern thatbanks are able to bring insured deposits into thesystem without having contributed to theinsurance funds. The key decision here iswhether the asset will be carried on the booksof the insurance fund or of the bank.

32
If the asset is carried on the books of theinsurance fund, the bank’s payment can bethought of as an “initiation” fee to join thedeposit insurance system. Presumably, underthis approach, the current fund would beviewed as the accumulation of past initiationfees and existing banks would be given creditfor past payments.
The problem with this approach is that theinitial cost of chartering a bank or gatheringdeposits would be significantly increased, onceagain raising concerns about stiflinginnovation. Allowing the fee to be paid overtime, however, could mitigate these concerns.
Alternatively, if the asset is carried on thebooks of the bank, the concerns about stiflinginnovation and growth are diminished. Underthis approach, the bank’s payment would be inexchange for a claim on the insurance fund.The accounting treatment and valuation of thisclaim would depend on the features of theclaim.
As an example, the claims could be structuredsimilar to shares of a mutual fund. In goodyears when assessment revenue and interestearnings exceeded operating expenses andinsurance losses, the value of the shares wouldincrease. Conversely, when insurance losseswere high, the shares would lose value. Thisleads to the question of how changes in valuewould be realized—simply through accountingadjustments or through distributions from thefunds. Finally, there is the question of whetherthe claims are redeemable if a bank chooses toleave the deposit insurance system.
There are many ways such claims could bestructured, and the purpose of this discussion isto begin a dialog about the general implicationsof such an approach and the specific ways itcould be structured.
Introducing Private Sector Features to theDeposit Insurance System
There have been proposals to have a system inwhich private sector firms provide depositinsurance to banks with the governmentbackstopping catastrophic risk (Ely, 1998).The private sector approach was discussedduring an FDIC conference in early 1998.Among the themes that emerged from theconference was the consensus view that thepublic wants and expects the U.S. governmentto stand behind insured deposits.
Another theme concerned the observedtendency for private schemes and systemswithout explicit coverage limits to turn into 100percent government guarantee schemes intimes of crisis. Explicit coverage limits, statedin advance by the government, provide a meansto contain the federal safety net. Anothercommon view expressed by the participantswas that eliminating federal deposit insurancewould not eliminate or materially reducefederal supervision and regulation of bankinginstitutions.
An approach that incorporates private sectorfeatures is the use of loss-sharingarrangements. The risk of mispricing depositinsurance arises because of the inherentanalytical difficulties in measuring the riskexposure of the FDIC. However, this concernalso stems from the fact that the FDIC’s pricingis not subject to the checks and validation of acompetitive market process.
It may be possible to address this by lookingfor ways to price in the market some of theFDIC’s risk. This could be done by having theFDIC enter into loss-sharing arrangements withmarket participants. The purpose of thesearrangements would be to obtain a marketperspective on the appropriate FDIC pricing,not for the FDIC to shed a significant portionof its risk.

33
Such an approach could be used for pricediscovery regarding the Treasury's "backstop"risk, or the risk reflected by pools ofinstitutions, or other components of the FDIC'srisk exposure. Depending upon the desiredpricing information, this approach couldinvolve the issuance of catastrophe-likesecurities (CAT bonds), or FDIC notes (Wall,1997) or the writing of reinsurance contracts.Again, the FDIC would consult with marketparticipants to explore the design of workableinstruments or contracts.
Funding Systemic Risk
Congress has created a new and separateassessment system for recouping the costs ofassisting or resolving very large insuredinstitutions whose failure poses a systemic riskto the nation's financial system; this system hasnot yet been put into action. During thebanking crisis of the 1980s and early 1990s, theFDIC sometimes granted assistance to openbanks and often resolved large failinginstitutions in such a way that uninsureddepositors and even all creditors were paid infull, a practice often referred to as "too big tofail." The FDIC recouped the resulting coststhrough regular insurance assessments.
By adopting the "least-cost test" in FDICIA,Congress prohibited protection of uninsureddepositors and creditors if such protectionwould increase the cost to the FDIC. However,Congress provided a carefully framed systemicrisk exception, which, if invoked, can overridethe least-cost test. If the Secretary of theTreasury, upon the recommendation of two-thirds of the Boards of the FDIC and theFederal Reserve, and after consultation with thePresident, determines that a threatened bankfailure would pose serious adverse effects oneconomic conditions or financial stability, theleast-cost requirements can be avoided.
If a systemic risk determination is made,FDICIA requires that the extra costs berecovered in a timely manner through specialassessments. These special assessments are tobe levied on all of the affected fund's memberinstitutions based on "the amount of eachmember's average total assets . . ., minus thesum of the amount of the member's averagetotal tangible equity and the amount of themember's average total subordinated debt."14
Special assessments would not necessarilypreclude regular deposit insurance assessments.
The funding arrangements for systemic riskpose several issues. First, they contribute to thepay-as-you-go nature of the current depositinsurance system. Second, the costs fall in parton the vast majority of smaller banks for whomit is virtually inconceivable that they wouldreceive similar treatment if distressed. Finally,there are large complex financial institutionsthat conceivably could pose systemic risk butare not part—or are not wholly part—of thedeposit insurance system. This raises thequestion of whether it makes sense to havesignificantly different mechanisms foraddressing distress at groups of institutions thatmay, from a market perspective, appear quitesimilar.
Thus, there are at least three issues that arisefrom the current systemic risk fundingmechanism. The first is whether systemic riskfunding should be part of the deposit insurancesystem. One option is to remove the systemicrisk exception provision from the FederalDeposit Insurance Act (FDI Act) and fundsystemic risk involving banks the same way assystemic risk involving other financial servicefirms or other commercial firms.
The second issue involves measures to scaleback the implicit guarantee. The bankingagencies have been working together in recentyears to ensure that if and when such an
14 12 U.S.C.A. § 1823(c)(4)(G)(ii) (West Supp. 1999).

34
occasion arises, there will be feasible optionsthat do as little to undermine market disciplineas possible.15
The third issue is how the costs of systemic riskare distributed. The current arrangement shiftsthe cost, relative to the normal assessment
15 One explicit policy proposal in this regard has beenoffered by Stern (1999). This would alter the FDI Act toprevent the deposit insurance system from fullyprotecting uninsured creditors in the event of a systemicrisk exception.
process, from smaller banks to large banks.Nevertheless, small banks pay, and the questionremains whether a small bank benefits morefrom the special treatment of a large bank thando other small businesses or other largenonbank financial service providers.

35
IV. COVERAGE LIMITS
Federal deposit insurance was established toprotect small savers and prevent bank panics.By preventing bank panics, deposit insurancehelps to maintain public confidence in andotherwise support the stability of the bankingand financial system. Deposit insurance hasalso had the effect of helping to maintain theviability of community banks, thrifts and creditunions.
Federal deposit insurance has been successfulin fulfilling these purposes. Since the inceptionof deposit insurance, bank panics have virtuallydisappeared. Bank failures have not haddestabilizing effects on the nonfinancialeconomy. No depositor has ever lost a pennyon a federally insured deposit as the result of abank or thrift failure.
Nevertheless, deposit insurance can createmoral hazard and increase the risk and cost offailure if deposit insurance premiums do notfully compensate the FDIC for increases in riskposed by particular banks and thrifts. Byassuming the risk of loss that would otherwisebe borne by depositors, deposit insuranceeliminates any incentive for depositors who arefully insured to monitor bank or thrift risk, thusreducing what is known as "depositordiscipline."16 Management can therefore take
16 To what extent depositor discipline plays or can playmuch of a role at banks is controversial. Some argue thatdepositors are unlikely to provide effective discipline,given the cost of obtaining appropriate information andthe complexity of analyzing risk accurately. Otherspoint out that, if depositors had stronger incentives toassess risk, specialized firms in the private sector wouldprovide the information and expertise required for moreeffective depositor discipline. A contributing factor tomoral hazard is that depositors at large banks still canreceive full protection if the systemic risk exception isinvoked. For more discussion of this topic see Hanc(1999).
greater risks without increasing the depositoryinstitution's cost of funds.17
The coverage limit represents a balancebetween the goals of deposit insurance, on theone hand, and the need to limit moral hazardand the risk to taxpayers and the insurancefunds, on the other. The practical implicationof this tradeoff is that coverage limits cannot beconsidered in isolation. As discussed in earliersections, the current statutory link between thereserve ratio and pricing creates significantfree-rider problems and makes the currentsystem more vulnerable to moral hazard.These concerns become less of an issue ifexpected loss pricing is introduced. It can beargued that any dangers posed by highercoverage limits result primarily from thecurrent pricing anomalies. In a system wherepricing approximately reflects expected loss,raising or lowering the coverage limit wouldnot have a major impact on systemic risk.From a risk management perspective, betterpricing can make the level of coverage a matterof second-order importance.
The following sections will discuss thepotential impact of higher coverage limits andthe implications for moral hazard. Afundamental question is whether Congresswishes to continue providing the same level ofdeposit insurance protection for consumers inreal terms or to allow the level of protection toerode in value by maintaining the status quo.
17 On the other hand, Keeley (1990) has argued thatthrough much of the FDIC's history bank charters haveheld notable value and that much of the excessive risktaking supposedly created by deposit insurance has beencounterbalanced by banks' desire to avoid risk that woulderode their charter values. Deregulation and increasedcompetition, however, appear to have eroded bankcharter values.

36
Past and Current Coverage Rules
In 1934, Congress set the deposit insurancecoverage limit at $5,000, raising it from thetemporary limit of $2,500 that was in effect forthe first six months of 1934. Congress hasincreased the limit in a series of ad hoc stepsreflected in Table 7. The most recent increaseoccurred in 1980, when Congress raised thenominal value of coverage to $100,000, whereit remains today.
Table 7
Chart 5
Most increases more or less reflected changesin the price level. The increase to $100,000,however, far exceeded the amount necessary tokeep pace with inflation. In 1980, only timeaccounts with balances in excess of $100,000were exempt from interest-rate ceilings. Manybanks and thrifts, facing disintermediationbecause of high interest rates, had sizableamounts of large certificates of depositoutstanding. The new limit was partly intendedto help them retain some of these deposits andattract new deposits to offset some of theoutflows.
Since the nominal value of deposit insurancewas increased to $100,000 in 1980, the realvalue has fallen by about half, based on theConsumer Price Index, as reflected in Chart 5.It is now below the real value of coverage in1974, when the nominal coverage limit was$40,000. The real value of coverage todaynevertheless remains higher by this measurethan it was during the first 30 years of theFDIC’s existence.
Although the nominal deposit insurancecoverage limit is usually cited as $100,000 per
Year1934 $5,0001950 10,000 1966 15,000 1969 20,000 1974 40,000 1980 100,000
Basic Coverage Amount
Coverage Increases
The Real Value of Coverage Has Declined
0
20,000
40,000
60,000
80,000
100,000
120,000
1935
1938
1941
1944
1947
1950
1953
1956
1959
1962
1965
1968
1971
1974
1977
1980
1983
1986
1989
1992
1995
1998
Do
llars
Nominal InsuranceCoverage
Insurance Coverage in1980 Dollars

37
person per institution, complexities of thedeposit insurance laws can make the limitmuch greater in practice, since an individual isinsured up to $100,000 with respect to eachright and capacity in which he or she ownsdeposit accounts. Because of these separaterights and capacities, a family of four, forexample, can hold insured deposits of $2million at a single institution by maximizingthe coverage available in the five types ofconsumer accounts—single-ownership, joint,payable-on-death (POD), irrevocable trustaccounts and retirement accounts. At the sametime, while this level of coverage is providedfor within the rules, it may be complicated toarrange in practice and requires depositors toshare ownership rights and control of theirmoney with others.18
Effects of Changing Coverage
The immediate effect of raising coverage onfund balances and risk to the funds is uncertainand the long-term effect even more so. The
18 To achieve $2 million in coverage at a singleinstitution, a family of four could structure their accountsas follows: Each family member could set up anindividual (single ownership) account ($400,000). Thefamily could set up four joint accounts in the names of:the husband and wife; the husband and one child; thewife and the other child; and both children ($400,000).The family could set up a POD account in the name ofthe parents in trust for the two children ($400,000). Thefamily could also set up an irrevocable family trustaccount with four beneficiaries ($400,000). Finally, onespouse could set up a Keogh account and the otherspouse and each child could set up IRAs ($400,000).
For most families, setting up these accounts wouldrequire some family members to transfer funds to otherfamily members and relinquish ownership of thetransferred funds. The account arrangements would alsohave tax and other consequences, such as access to thefunds while all family members were alive anddisposition of the funds on the account holder's death. Inaddition, setting up an irrevocable trust account wouldusually require hiring a lawyer, since the trust agreementmust be in writing to qualify for separate depositinsurance.
immediate effect would result from theautomatic conversion of existing uninsureddeposits into insured deposits. The long-termeffect would depend upon whether an increasein coverage would cause a change in consumerand business behavior, resulting in a largerproportion of new wealth being placed indeposits or in a transfer of existing assets fromother investments to deposits.
Immediate Effect
The American Bankers Association (ABA)conducted a survey in April 2000 to estimatethe effect of raising the coverage level to$200,000. Extrapolating from 76 responses,the ABA reached a very preliminary conclusionthat raising insurance coverage to $200,000could add an additional $230 billion in insureddeposits. This amount would reduce thecombined BIF-SAIF reserve ratio from 1.38percent to 1.28 percent. (All ratios reflectMarch 31, 2000, data.) The ABA plans a moredetailed survey to obtain more refinedprojections.
The Federal Reserve Board has also estimatedthe initial effect of increasing the coveragelimit to $200,000 on household deposits, usingestimates from its 1998 Survey of ConsumerFinances. The Federal Reserve Boardestimates that the increase would add $143billion to insured deposits of households. Thiswould reduce the combined fund ratio to 1.31percent.19
19 Call Reports and Thrift Financial Reports do notcontain sufficiently detailed information to project theimmediate effect of an instantaneous increase incoverage on the amount of insured deposits. They docontain enough information, however, to develop a grossupper bound on the initial impact of a coverage increaseto $200,000 to reflect consumer price inflation since1980. Doubling insurance coverage would not increaseinsured deposits initially by more than $400 billion.Stated differently, the initial impact of a 100 percentincrease in the coverage limit at most would be a 14percent increase in combined fund exposure (based on

38
Longer-Term Effect
The longer-term effect of raising the coveragelimit depends upon the reactions of consumersand businesses. Historical year-over-yeardeposit growth in Chart 6 suggests thatprevious increases in the coverage limit havehad modest lasting effects. Preliminarystatistical analysis conducted for the FDIC byRegional Financial Associates, Inc., suggeststhat a doubling of the coverage limit couldincrease BIF-insured deposits by 11 to 14percent or $240 to $300 billion (90 percentconfidence interval). The point estimate fromthis analysis is an increase of $270 billion.This projection results from modeling historicaldeposit growth as a function of GDP, interest
Chart 6
March 31, 2000, insured deposits of almost $3 trillion).A 14 percent increase in insured deposits, if it occurredall at once, would reduce the reserve ratio of a combinedBIF and SAIF from 1.38 percent to 1.21 percent basedon March 31, 2000, data. The 14 percent is an upperbound in that it assumes no balances exceeding $100,000are currently insured and that deposits are evenlydistributed across accounts greater than $100,000, thusmaximizing the potential effect. Many accounts over the$100,000 limit are fully insured through the pass-throughrules on institutional deposits and similar arrangements.
rates on non-deposit instruments, and othervariables, including changes in the coveragelimit. However, the effects of past coverageincreases are difficult to separate statisticallyfrom other possible explanatory variables, andthese preliminary results require furtherinvestigation.
More generally, some factors suggest that thelong-term impact of higher coverage is unlikelyto be large, while other factors point to thepossibility of significant effects. Additionalanalysis is required to weigh these competingfactors appropriately.
One reason to believe that, in the long term, acoverage increase may not alter consumerbehavior or the amount of insured deposits
Year-Over-Year BIF-Insured Deposit Growth
-10
0
10
20
30
40
50
1935
1938
1941
1944
1947
1950
1953
1956
1959
1962
1965
1968
1971
1974
1977
1980
1983
1986
1989
1992
1995
1998
Pe
rce
nt

39
significantly is that consumers already have theoption of placing all of their assets in insureddeposits, either by opening accounts in separaterights and capacities or in different insuredinstitutions.
And data from the Federal Reserve's 1992 and1998 Surveys of Consumer Finance suggestthat consumers are using these options. In1992, 97.9 percent of all households withdeposits were fully insured. In 1998, 98.0percent of households with deposits were fullyinsured.
Moreover, as Chart 7 reflects, while the volumeof deposits in financial institutions increasedover the period of 1982 to 1999, deposits as apercentage of total financial assets held byhouseholds and nonprofit organizations havedeclined steadily since 1984, from 26.1 percentto 12.4 percent in 1999. Although depositsrose from $1.9 trillion to $4.3 trillion between1982 and 1999, mutual fund shares increasedfrom $57.3 billion to $3.1 trillion and equityholdings (not including equities held in mutualfunds) increased from $844 billion in 1982 to$8.0 trillion in 1999. Chart 8 (next page)shows that the growth of household liquid
Chart 7
assets held outside banks has far outpaced thegrowth of household deposits.
On the other hand, it is useful to consider theearlier discussion demonstrating that openingdeposit accounts in separate rights andcapacities is not always simple. Increasing thecoverage level will make it easier and moreconvenient for consumers to hold more than$100,000 in a single insured account. Thoseconsumers who are now unaware of thepossibility of establishing accounts in separaterights and capacities at a single institution maybe more likely to learn of a higher nominalcoverage limit. The question then becomes thedegree to which this greater convenience andawareness will produce a net inflow of newinsured deposits into the system.
While it may not seem likely that this greaterconvenience and awareness alone would causea large shift in consumer preference, thisshould not be ruled out. From the preliminaryresults of its survey, the ABA estimated that0.8 percent of all deposits fall between $80,000and $100,000. Deposits in this range suggestthat depositors may be deliberately maintainingthe deposits within insured limits. Some
Shift In Financial Asset Holdings: Households and Non-Profit Organizations(Percent of Total Financial Assets)
0.0
5.0
10.0
15.0
20.0
25.0
30.0
1982
1983
1984
1985
1986
1987
1988
1989
1990
1991
1992
1993
1994
1995
1996
1997
1998
1999
Pe
rce
nt
Deposits
Mutual Fund Shares
Corporate Equities
Source: Federal Reserve, Flow of Funds Accounts of the U.S.

40
portion of these depositors may increase theirdeposits if the coverage limit increases,although some of the increase will undoubtedlyrepresent deposit consolidation, rather thantransfers from uninsured investments. TheABA has stated its intent to explore this issuefurther in a formal study.
And while the secular trend in deposit holdingsby households has been downward, there isalso a demographic component to consider.For example, some data suggest a strongerpreference among older households forcertificates of deposits (CDs) than amongyounger households, and this could beparticularly important, given that the largebaby-boom cohort is currently in transitionfrom young to old. Data from the FederalReserve Board's 1998 Survey of ConsumerFinances indicate that deposits represent alarger share of total financial assets forhouseholds headed by individuals over age 65than for households headed by those under 55(21.1 percent versus 17.0 percent). Householdsheaded by individuals over age 65 holdapproximately one-half of the total dollarvolume of CDs outstanding. The decreased
Chart 8
issuance of Treasury securities may alsocontribute to higher demand for deposits goingforward, particularly among elderlyhouseholds.
Higher deposit balances also are more commonamong households experiencing various typesof financial transitions, such as the sale of ahome, an inheritance or an imminent largeexpenditure. The question is, what is thepattern and frequency of these transitions?Further analysis of such patterns and any likelychanges in them due to other drivers of savingbehavior are required to project the longer-termimpact of higher coverage.
There also remains the possibility of a largeshift of household assets into insured depositaccounts in the event of financial marketvolatility. The increase in insured depositsfollowing the stock market crash of 1987 wassignificant but short-lived. In this episode, thestock market rebounded rather quickly.Deposit data relating to earlier stock marketdownturns are scarce, complicating anyhistorical analysis. As noted earlier, there iscurrently more than $3 trillion outstanding in
Relative Growth of Households' Liquid Financial Assets
0
2,000
4,000
6,000
8,000
10,000
12,000
1980
1981
1982
1983
1984
1985
1986
1987
1988
1989
1990
1991
1992
1993
1994
1995
1996
1997
$ B
illio
ns
Bank Deposits & CDs
Liquid Assets not heldin Banks
Source: Federal Reserve, Flow of Funds Accounts for the U.S.; Securities Industry Association, 1998 Securities Industry Factbook.

41
U.S. mutual funds alone. It is uncertain howlarge the “flight to quality” could be in the caseof a protracted bear market.
There also is presently little information on thepossible effect that an increase in coverage mayhave on business deposits. Conventionalwisdom suggests that small businesses may bemore likely than large businesses to attempt tokeep deposits within insured limits.
However, further study would be required toproject the quantitative effect of a coverageincrease on business accounts.
Finally, some believe there is an argument forraising coverage that does not depend upon itsaggregate impact or a broad distribution ofbenefits. Those who typically suffer the mostdamaging losses in bank failures are among themost vulnerable in our society: individuals ofmodest means, who generally lack access tosophisticated financial advice. In manyinstances it is the elderly who are experiencingfinancial transitions like those mentionedearlier, and are caught with a substantialportion of their total net worth in uninsuredfunds. Some argue that it is precisely theseindividuals who are most in need and mostdeserving of protection, and that with thecurrent cost of medical care, housing, and basicnecessities during retirement, a $100,000coverage limit may not be sufficient. In recentbank failures one can identify several cases inwhich losses were suffered by financiallyunsophisticated individuals, public serviceorganizations or charities.
In summary, current predictions about theaggregate impact of raising coverage limits are,at best, educated guesses. Further analysis willhelp to reduce the uncertainty, but will noteliminate it. (See Attachment G.) If coveragelimits were to be raised, the use of gradualincreases would be one method of gauging andreacting to possible changes in consumer andbusiness behavior. Beyond this, there areconsiderations as to which groups benefit the
most from deposit insurance coverage whendetermining the advisability of higher limits.
Moral Hazard, Implicit Protection andIndustry Structure
The 1980 increase in deposit insurancecoverage to $100,000 is widely viewed asplaying a role in the ensuing savings and loancrisis. The Depository Institutions Dereg-ulation and Monetary Control Act of 1980began the process of lifting the old RegulationQ ceiling on the interest rates that banks couldoffer depositors. Some insured institutionswere having difficulty retaining deposits, giventhe rapid run-up of U.S. interest rates to recordlevels to near 20 percent. The increase incoverage to $100,000, combined with liftingRegulation Q ceilings at the same time,facilitated an influx of deposits into thrifts andperhaps elevated the liability of the FSLIC,which then insured thrift deposits. Manyfactors contributed to the saving and loan crisis,and it likely was the confluence of these factorsthat explains the magnitude of the crisis (FDIC,1997).
However, there is a potential for highercoverage limits to facilitate deposit-gatheringby institutions that engage in high-riskactivities. Recent experience highlights theneed to proceed carefully in this regard. TheFirst National Bank of Keystone, Keystone,West Virginia, which failed in 1999, hadobtained $280 million in brokered deposits.Deposit insurance plays a different roledepending on economic circumstances. Ahealthy bank in a healthy economy willconsider insured funds in a different light thana weak bank in a weak economy. In somerespects, the importance of deposit insurance tobanks will increase as the banks or theeconomy weaken. Banks that have the optionof raising funds in the capital markets will findthe availability of these funds diminished or the
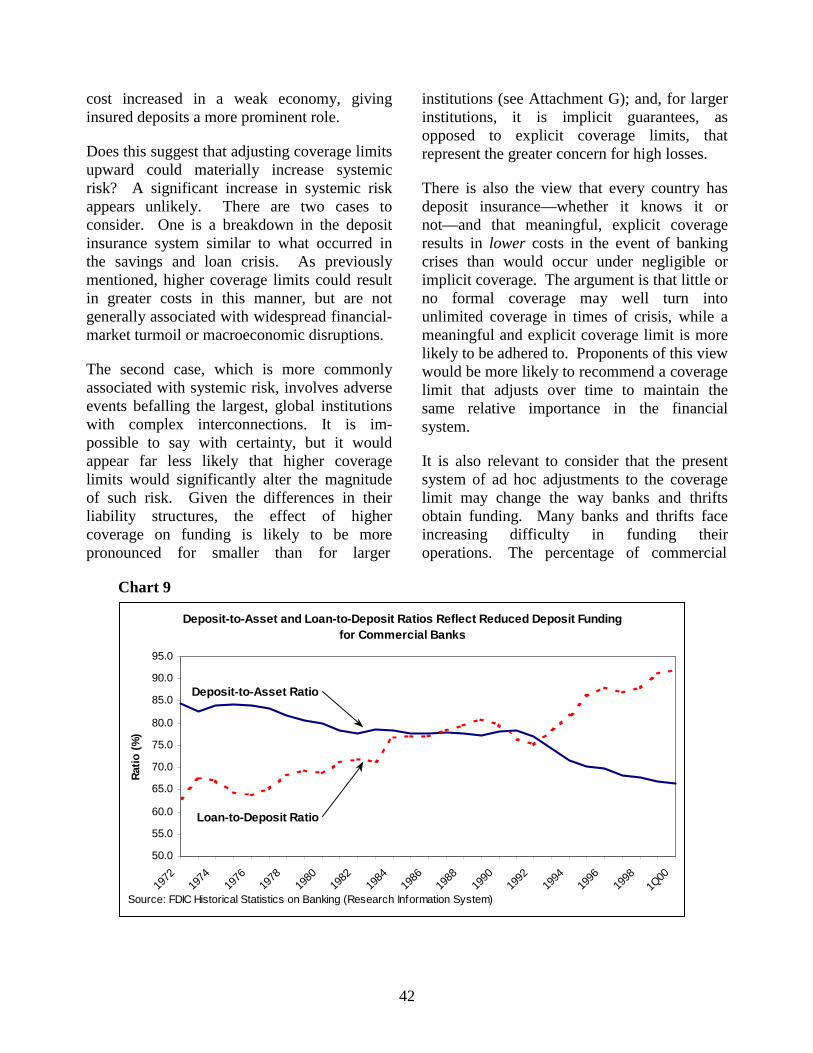
42
cost increased in a weak economy, givinginsured deposits a more prominent role.
Does this suggest that adjusting coverage limitsupward could materially increase systemicrisk? A significant increase in systemic riskappears unlikely. There are two cases toconsider. One is a breakdown in the depositinsurance system similar to what occurred inthe savings and loan crisis. As previouslymentioned, higher coverage limits could resultin greater costs in this manner, but are notgenerally associated with widespread financial-market turmoil or macroeconomic disruptions.
The second case, which is more commonlyassociated with systemic risk, involves adverseevents befalling the largest, global institutionswith complex interconnections. It is im-possible to say with certainty, but it wouldappear far less likely that higher coveragelimits would significantly alter the magnitudeof such risk. Given the differences in theirliability structures, the effect of highercoverage on funding is likely to be morepronounced for smaller than for larger
Chart 9
institutions (see Attachment G); and, for largerinstitutions, it is implicit guarantees, asopposed to explicit coverage limits, thatrepresent the greater concern for high losses.
There is also the view that every country hasdeposit insurance—whether it knows it ornot—and that meaningful, explicit coverageresults in lower costs in the event of bankingcrises than would occur under negligible orimplicit coverage. The argument is that little orno formal coverage may well turn intounlimited coverage in times of crisis, while ameaningful and explicit coverage limit is morelikely to be adhered to. Proponents of this viewwould be more likely to recommend a coveragelimit that adjusts over time to maintain thesame relative importance in the financialsystem.
It is also relevant to consider that the presentsystem of ad hoc adjustments to the coveragelimit may change the way banks and thriftsobtain funding. Many banks and thrifts faceincreasing difficulty in funding theiroperations. The percentage of commercial
Deposit-to-Asset and Loan-to-Deposit Ratios Reflect Reduced Deposit Funding for Commercial Banks
50.0
55.0
60.0
65.0
70.0
75.0
80.0
85.0
90.0
95.0
1972
1974
1976
1978
1980
1982
1984
1986
1988
1990
1992
1994
1996
1998
1Q00
Rat
io (
%)
Deposit-to-Asset Ratio
Loan-to-Deposit Ratio
Source: FDIC Historical Statistics on Banking (Research Information System)

43
bank assets funded with deposits has declinedsteadily in the 1990s. Trends in householdwealth accumulation, a declining savings rate,the availability of higher yielding investmentalternatives, and demographic shifts are makingit increasingly challenging for commercialbanks to attract deposits. From 1992 throughyear-end 1999, commercial bank assets havegrown at an average annual rate of 6.9 percentcompared with a 4.6 percent average annualgrowth rate for deposits. As a result, traditionalmeasures of liquidity for commercial banksreflect increasing reliance on equity orborrowings and record-low levels of depositfunding, as reflected in Chart 9.
Large commercial banks have traditionallymade greater use of nondeposit fundingalternatives than community banks, whichtypically have relied more on deposit funding.However, as a result of shifting funding trends,community banks increasingly have depositgrowth rates that are insufficient to meet loandemand, causing them to seek more expensiveand interest-rate sensitive funding sources,particularly borrowings.
We cannot today quantify the additionaldeposits community banks will be able toattract if the coverage limits are changed. Butunless they find alternatives, they may beforced to rely even more heavily on forms offunding such as Federal Home Loan Bank(FHLB) advances. Since 1980, FHLBadvances to thrifts have grown from 8.2 percentto 19.1 percent of liabilities. What thissuggests is that the deposit insurance fundsmay not benefit from stronger depositordiscipline by holding the line on the $100,000limit. FHLB advances are fully secured, whichmeans that they stand ahead of FDIC claims inliquidation.20
20 While FHLB advances can provide banks with a cost-effective and safe means of replacing deposit funds ifmanaged appropriately, they can also raise a financialinstitution's risk profile due to the complexities of
Thus, for all practical purposes, secured FHLBadvances and insured deposits mean the samething to the insurance funds when a bankfails—lost funds. To the extent that the lowercoverage limit forces banks to substitutesecured funding for deposits, this will not resultin a lower risk exposure for the depositinsurance funds or taxpayers as compared to asystem with a higher coverage limit.
A further consideration under the currentpricing system is that the FDIC is compensatedfor the additional exposure when risky (non-1A) institutions expand their insured deposits,but not when they expand secured borrowings.A lower coverage limit will not translate intostronger protection for taxpayers givenincreased reliance on secured borrowings bysuch institutions.
The current funding problems faced by smallbanks are not unprecedented. Funding andcompetitive equity issues historically have beenraised by both sides in debates over coverage(Golembe, 1984).
To the extent that a goal is to maintain a "levelplaying field" between large and smallinstitutions, alternatives to raising coveragelimits should also be considered. As notedpreviously, in FDICIA Congress createdhurdles to providing protection for uninsureddepositors and creditors and required that largebanks bear most of the additional costs if suchprotection is extended. There are several
advances as a funding source. It has been noted thatmany banks are taking advantage of embedded options inFHLB advances to lower their cost of funds. Anexample of this practice is a convertible advance offeredby the FHLB system whereby the FHLB is sold anoption allowing it to convert the advance from a fixed toa floating rate if interest rates rise. Convertible advancesare increasing as a percentage of total advances issued bythe FHLB, jumping from 13 percent at year-end 1997 togreater than 23 percent at year-end 1999. Furthermore,the call options associated with some FHLB borrowingshave liquidity implications as some prepayment penaltiesmay hinder banks' ability to unwind borrowingarrangements when most necessary.

44
proposals designed to proceed further alongthese lines and ensure that uninsured depositorsand creditors always bear some loss (anappropriate “haircut”) in the event of large-bank failures.21 Another option is to furtherinternalize the cost to the largest banks of anytoo-big-to-fail protections that may be extendedgoing forward, thereby creating incentives forthose banks as a group to avoid any specialtreatment. The pricing enhancementsmentioned earlier, including greater reliance onsubordinated debt, reinsurance or othercustomized contracts to price large-bank riskalso address concerns regarding competitivebalance.
Options
The following discussion sets forth severalpossible mechanisms for balancing the goals ofdeposit insurance with the need to limit moralhazard and the risk to taxpayers and theinsurance funds.
Table 8
21 Stern (1999); Flannery (1998).
Status Quo
Historically, Congress has, in effect, readjustedthe balance on an ad hoc basis, periodically butirregularly increasing the coverage limit toaccount for inflation. One option is to continuethe existing system of ad hoc statutoryreadjustments. The historical pattern ofirregularly increasing the deposit insurancelimit by statute has advantages as well asdrawbacks. It subjects the limit to the politicalprocess and to political lobbying. Some wouldargue that this is a virtue, since it allowsCongress to reset the balance betweenachieving the goals of deposit insurance andlimiting risk as needed. Others may favor amore systematic approach, which maintains thesame relative importance of deposit insurancein the economy over time, and would point tothe 1980 increase to $100,000 as too large.
YearCoverageAmount
As Multiple ofPer Capita
Income a
As Multiple ofAverage Home
Price b
Earlier Year'sLevel Indexed
to CPI
Earlier Year'sMultiple of PerCapita Income
Applied to 1998 PerCapita Income
Earlier Year'sMultiple of AverageHome Price Applied
to 1998 AverageHome Price
1934 $5,000 10.57 Not $61,000 $279,9151950 10,000 6.63 available 67,600 175,5761966 15,000 4.88 0.64 75,400 129,232 $111,6311969 20,000 5.21 0.67 88,900 137,971 115,9871974 40,000 7.05 1.06 132,000 186,698 184,4681980 100,000 9.94 1.36 198,000 263,231 236,240
Source: a) Bureau of Economic Affairs, Personal Income Per Capita; b) Federal Housing Finance Board, MonthlyInterest Rate Survey, Annual Summary, Rates & Terms on Conventional Mortgage Loans, Table 1: Annual NationalAverages, All Homes.
Coverage Limits in the Past Corresponding Coverage Limits in 1998

45
Formal Indexing
Indexing the coverage limit is an alternative tothe present system of ad hoc increases thatapproximate the effects of inflation. Institutinga formal indexing system would requirechoosing the index, the base year, and theadjustment mechanism. Determining the initialbase limit could depend in part uponassumptions about the correct level of coveragein the past and the proper index to use to find acomparable level today.
Initial Base Limit
Differing assumptions lead to differingconclusions as to the proper base limit today.For example, using inflation as a guide, the$100,000 limit set in 1980 would be equivalentto approximately $200,000 today. However,the $40,000 limit set in 1974 would beequivalent to approximately $130,000 today.
Table 8 and Chart 10 use the limits of coveragefrom six earlier years and apply three different
Chart 10
indices to illustrate possible comparable limitsin 1998. Using just these six years and threeindices, comparable limits today could rangefrom a low of $61,000 to a high of $279,915.Of course, other measures of the proper limitare possible, as are other indices, such aswages, different measures of income (e.g.,household income), wealth, and mortgage size.
Adjusting Indices
Indexed adjustments could be automaticallyimplemented, which would require some carein choosing the frequency and amounts ofadjustments. If adjustments occur too often orin odd lots, this could lead to confusion amongthe public as to the operative insurance limit. Ifadjustments occur too infrequently, this couldproduce large increases in insured deposits andsignificant declines in the reserve ratio.Alternatively, the FDIC could be givendiscretion to determine whether to implementan increase, as some have suggested. A newcoverage limit could be phased in graduallyover time. The FDIC could be given theauthority to defer the phase-in if it threatened to
Coverage Levels from Prior Years Indexed to 1998
-
50,000
100,000
150,000
200,000
250,000
300,000
Base Year
Co
mp
arab
le 1
998
Co
vera
ge
Lim
it
CPI Index
Per Capita Income Index
Average Home Price Index
For each base year, the plot points give the comparable 1998 coverage limit. Thus, for example, the plot points
for base year 1966 in ascending order reflect what the 1998 coverage limit would be using: 1) a consumer price
index; 2) a home price index; and 3) an income index.
1934 1950 1966 1969 1974 1980

46
reduce a deposit insurance fund’s reserve ratioexcessively, below whatever level isdetermined to be appropriate.
Simplification
Simplifying the deposit insurance rules offersanother means of adjusting the balance betweenthe goals of deposit insurance and the need tolimit moral hazard and the risk to taxpayers andthe insurance funds. The current complexitiesof the deposit insurance laws make thecoverage limit much greater than $100,000 inpractice. Simplifying them could alter theeffective coverage limit.
Simplification is a desirable goal for its ownsake. Over the last few years, the FDIC hasadopted several rule changes to simplify theinsurance rules. Nevertheless, the rules remaincomplex and bankers devote substantialresources toward training their staffs andproviding information to the public about thecoverage rules. Despite the banks' efforts, anumber of surveys done by public interestgroups and others have revealed that bankpersonnel often misunderstand the rules andprovide erroneous advice to their customers.22
When banks fail, depositors sometimes claimthat bank personnel misinformed them aboutthe extent of insurance coverage and that theerroneous information caused them to end upwith uninsured funds.
A major simplification could significantlyexpand or contract the overall level ofcoverage. In fact, some simplificationproposals could have potentially greater effecton the BIF and SAIF reserve ratios than simplyincreasing nominal coverage to $200,000. As aresult, combining certain kinds of depositinsurance simplification with an increase in thenominal coverage limit would moderate theoverall increase in the total amount of insureddeposits.
22 Cummings (1997); Farleigh (1998); Wiant (1998).
The most straightforward option would be tosimplify the rules to eliminate the separateinsurance coverage that is currently providedfor accounts held in separate rights andcapacities. Under this approach, a depositorwould be entitled to a particular level ofcoverage (such as $100,000) for his or herinterests in all accounts at a single FDIC-insured institution. It is reasonable to expectthat those who are less financially sophisticatedmight benefit disproportionately from suchsimplification. Accounts would be aggregatedand there would be no separate insurancecoverage provided for joint accounts, trustaccounts, employee benefit accounts, or thelike. Although this approach would eliminatethe need to have separate requirements fordifferent types of accounts, it would still benecessary to have rules allocating interests inparticular types of accounts to particular parties(e.g., in the case of a trust account, the amountthat would be allocated for deposit insurancepurposes to each trust beneficiary).Implementing this approach alone would likelyreduce the total amount of insured deposits.Thus, it would likely moderate any increase ininsured deposits when combined with a highercoverage limit.
Additional Coverage for Municipal andOther Public Deposits
Another option is to extend deposit insurancecoverage for municipal and other publicdeposits. Proponents of this option argue that itwould allow smaller banks to compete moreeffectively for public deposits and that it wouldreduce administrative burden for all insuredinstitutions. Under current state laws, mostbanks are required to collateralize thesedeposits, which entails continuous reporting toeach public entity, management of the assetsserving as collateral, and associatedadministrative expenses.
Depending upon the amount of expandedcoverage, this option could result in a large

47
increase in insured deposits. As of the end of1999, commercial banks held approximately$152.4 billion in public deposits, of whichapproximately $109.1 billion were uninsuredand secured. Thrifts held approximately $4.6billion uninsured, secured, public deposits, butthe total amount of public deposits they held isnot known. If public deposits became fullyinsured, the increase in insured deposits wouldbe at least $113.7 billion, which would reducethe combined reserve ratio of the BIF and theSAIF from 1.38 percent to 1.32 percent (basedupon March 31, 2000, data).
The actual effect on the BIF and SAIF reserveratios could be somewhat greater. There arealmost certainly additional uninsured publicdeposits that are unsecured. The FDIC cannotestimate the amount of additional deposits thatmight be attracted if public deposits becamefully insured, but the amount could besubstantial. According to the Federal ReserveBoard's flow-of-funds data, state and localgovernments currently hold over $1 trillion infinancial assets.
Some have suggested that full FDIC insurancefor public sector deposits would not change therisk exposure of the insurance funds, becausethese deposits currently are secured by bankassets and already stand ahead of the FDIC inthe priority of receivership claims. There ishowever, a difference between collateralizeddeposits and insured deposits. The requirementto pledge assets for security places a limit onthe amount of public funds that couldpotentially be attracted by insured institutions,while 100 percent FDIC coverage for suchfunds would not. The two cases are moresimilar to the extent that additional FDICcoverage is less than 100 percent, and explicitlylimited in some fashion.
Converting municipal and other public depositsfrom secured deposits to insured deposits couldincrease risk by increasing moral hazard.When an institution borrows from a publicentity on a secured basis, as through a secured
deposit, it must invest the principal amount ofthe loan in collateral acceptable to the publicentity. The public entity monitors the risktaken by the institution with respect to theamount of the security. When an institutionborrows instead through fully insured deposits,there is no incentive to monitor the riskbehavior of the institution.
Insuring public deposits may also create a kindof moral hazard for the public entity. Becausethe entity will no longer need to concern itselfwith the security of its deposit, non-economicfactors may influence the entity's depositdecision.
Finally, although coverage of public depositsmight allow the banking industry as a whole toattract more public deposits, it is not clear thatlocal institutions will be able to competeeffectively for local deposits in today'senvironment of interstate banking, especially ifhigher coverage leads to a marked bidding upof interest rates.
To address this concern, one option would beto continue to provide higher coverage only for"in-market" municipal deposits that banksacquire. The total current coverage limit for in-state public deposits is $200,000 ($100,000 intime and savings deposits and $100,000 indemand deposits). The limit for out-of-statepublic deposits is $100,000. The difference incoverage limits historically between public andprivate sector deposits has been even larger.From 1974 to 1980, the limit on public sectordeposits was two-and-a-half times the limit forprivate deposits. Raising the explicit coveragelimit for in-state deposits of public units insteadof providing full coverage for such depositsalso would address concerns regarding moralhazard and the possible impact on the fundreserve ratio.

48
Optional Excess Coverage
Another alternative is optional coverage fordeposits in excess of the insurance limit, so-called “excess” insurance. This kind ofcoverage could be either public or private.
Existing Private Excess Insurance
Private excess insurance already exists. In theevent of the failure of an insured depositoryinstitution, depositors covered by excessinsurance would be paid by the excessinsurance carrier, which would then have aclaim against the FDIC receivership for theamount it paid out to depositors.
A small number of private insurance companieshave offered this type of insurance over thepast decade. These companies generally limitcoverage to $5 to $25 million per institution(i.e., on a particular bond). Some limit thedepository institutions that may apply for theinsurance and at least one retains the right tocancel on 30 days notice. Premiums forcoverage range from approximately 10 cents to25 cents per $100 of deposits. The insurancecompanies bill the institutions, whichsometimes pass the charge on to the depositor.
The advantage of private excess insurance isthat to the extent it contributes to the goals ofdeposit insurance, it does so without increasingrisks to taxpayers or to the deposit insurancefunds. Institutions use excess coverageprimarily to retain large individual accounts,although some use it to secure municipal andother public funds when applicable lawpermits. The insurers that offer private excessinsurance describe demand as minimal tomoderate, though some have stated thatdemand is growing. The number of depositoryinstitutions currently purchasing excesscoverage is unknown. Among the some 300institutions represented at FDIC outreachmeetings in recent weeks, approximately one in
ten indicated that they had purchased excesscoverage. Survey information would be usefulto get a clearer picture of the demand for thiscoverage.
FDIC Excess Insurance
FDIC-issued excess insurance. Given thescarcity of data from the private market forexcess insurance, it is not clear whetheroptional excess insurance offered by the FDICwould fill an existing need. A key issue in thisregard would be how to price the excesscoverage and set limits to protect taxpayers andthe insurance funds. One method would be toset the premium by formula. Presumably, thiswould involve a surcharge above the premiumscharged for $100,000 per account. To obtainextra coverage, an institution would need toprovide extra protection for the funds and thetaxpayers in the form of higher premiums perdollar of excess coverage. This would involvea judgmental decision as to how muchadditional premium is enough.
FDIC-backed private excess insurance.Another option for excess insurance would beto continue to allow private insurers to issueexcess insurance, but to create an FDICguarantee of the insurance. This option wouldprovide the guarantee of the federalgovernment but retain a role for the market insetting the price. The FDIC would require theright to review the terms of the contracts andthe condition of the insurer. The FDIC alsopresumably would have the right to refuse toguarantee private insurance if these wereunacceptable. There would remain the issuesof how to price the FDIC's guarantee of privateexcess insurance and the amount of FDICresources that would be needed to properlyoversee this area.
Coinsurance. Another possible means ofreducing the moral hazard that would resultfrom FDIC-issued excess insurance would beto institute coinsurance for deposits greater

49
than $100,000. Although it was neverimplemented, the initial permanent plan forfederal deposit insurance, adopted as part of theBanking Act of 1933, provided for coinsuranceof deposits above $10,000. The plan providedfor full FDIC protection of the first $10,000 ofeach depositor, 75 percent coverage of the next
$40,000 of deposits, and 50 percent coverageof all deposits in excess of $50,000. At least 16other countries have coinsurance features intheir deposit insurance systems, andcoinsurance has been applied extensively inother insurance markets.

50
V. NEXT STEPS
The purpose of this paper has been to frame theissues confronted by the federal depositinsurance system and to begin the discussion ofoptions for addressing those issues. The readershould keep in mind the possibility ofcombining the various options outlined in thepaper. For example, a package of options thatwould move the deposit insurance systemtowards a mutual approach with greaterprivate-sector elements might include explicituse of market information in risk-based pricing,bank claims on past premiums apportionedalong the lines of a mutual fund, and coveragelimits that adjust regularly over time. Adifferent package might allow for better use ofsupervisory and non-public information inpricing risk, management of the insurancefunds within a range rather than to a targetratio, and a deliberative process for adjustingcoverage limits. Many other packages ofoptions can be envisioned.
The next steps in the deposit insurance reviewinvolve additional analysis and discussion inlight of feedback on the options paper, with thegoal of developing concrete proposals. TheFDIC is conducting an in-depth study of theissues outlined in the options paper and, in thecoming months, will work with scholars,market participants and other outside experts
to pursue several topics in more detail. Theseinclude:
- the expected-loss approach to pricingand the best use of supervisory, marketand reported information;
- the possible roles for reinsurance orother loss-sharing contracts for pricediscovery;
- operational features of a mutual system;- estimation of the FDIC’s loss
distribution for analyzing fundadequacy;
- the effects of raising coverage limits,including any impact on fund exposure;
- the operation of the current market forexcess coverage; and
- related topics outlined in the optionspaper.
The FDIC welcomes any additionalsuggestions for topics to be included in thestudy.
For an overview of the FDIC’s depositinsurance initiative and process going forward,including information on responding to theInternet survey or providing other comments onthe options paper, please refer to pages 7 and 8of the paper.
51
REFERENCES
Cummings, Deidre. "Don't Bank on It"(report, MASSPIRG Education Fund,September 1997).
Demirguc-Kunt, Asli. “Deposit-InstitutionFailures: A Review of the EmpiricalLiterature,” Federal Reserve Bank ofCleveland Economic Review 27 (March1991).
Ely, Bert. “Comments on Reform Proposals:Examining the Role of the FederalGovernment,” Confidence for the Future:An FDIC Symposium, FDIC (January 29,1998).
Farleigh, Angie. "Don't Bank on It" (report,CALPIRG, February 1998).
Federal Deposit Insurance Corporation.History of the Eighties—Lessons for theFuture: An Examination of the BankingCrises of the 1980s and Early 1990s, FDIC(1997).
Feldman, Ron. “When should the FDIC actlike a Private Insurance Company? When itcomes to Pricing, not Reserves,” TheRegion, Federal Reserve Bank ofMinneapolis (September 1998).
Flannery, Mark J. “Comments on Striking aBalance Within the Current Framework,”Confidence for the Future: An FDICSymposium, FDIC (January 29, 1998).
Gajewski, Gregory R. “Assessing the Riskof Bank Failure,” Proceedings of the FederalReserve Bank of Chicago Conference on
Bank Structure and Competition (May1989).
Golembe, Carter. The Regulation of BankSize: Historical Foundations and FutureProspects, Association of Bank HoldingCompanies (May 1, 1984).
Hanc, George. “Deposit Insurance Reform:State of the Debate,” FDIC Banking Review12, No.3 (1999).
Jones, David and John Mingo. “IndustryPractices in Credit Risk Modeling andInternal Capital Allocations: Implicationsfor a Models-Based Regulatory CapitalStandard,” Federal Reserve Bank of NewYork Economic Policy Review (October1998).
Hendershott, Robert and Edward J. Kane,“The Federal Deposit Insurance Fund thatDidn’t Put a Bite on U.S. Taxpayers,”Journal of Banking and Finance 10(September 1996).
Keeley, Michael C. “Deposit Insurance,Risk and Market Power in Banking,”American Economic Review 30, No. 5(1990).
Konstas, Panos. “The Bank Insurance Fund:Trends, Initiatives, and the Road Ahead,”FDIC Banking Review 5, No.2 (Fall/Winter1992).
Nuxoll, Daniel A. “Internal Risk-Management Models as a Basis for CapitalRequirements,” FDIC Banking Review 12,No.1 (1999).

52
O’Keefe, John and Jack Reidhill. “OffsiteSurveillance Systems,” History of theEighties—Lessons for the Future: AnExamination of the Banking Crises of the1980s and Early 1990s, FDIC (1997).
Oshinsky, Robert. “Effects of BankConsolidation on the Bank Insurance Fund,”FDIC Working Paper Series 99-3 (1999).
Shaffer, Sherrill. “Deposit InsurancePricing: The Hidden Burden of PremiumRate Volatility,” The Cato Journal 17, No. 1(Spring/Summer 1997).
Sheehan, Kevin. “Capitalization of the BankInsurance Fund,” FDIC Working PaperSeries 98-1 (1998).
Stern, Gary H. “Managing Moral HazardWith Market Signals: How RegulationShould Change With Banking,” The Region,
Federal Reserve Bank of Minneapolis (June1999).
United States Department of the Treasury.Credit Unions, Report to the Congress(December 1997).
Wall Larry. “Taking Note of the DepositInsurance Fund: A Plan for the FDIC toIssue Capital Notes,” Federal Reserve Bankof Atlanta Economic Review (First quarter1997).
Wiant, Ben. "Don't Bank on It" (report,CALPIRG, February 1998).
Whalen, Gary and James Thomson. “UsingFinancial Data to Identify Changes in BankCondition,” Federal Reserve Bank ofCleveland Economic Review (second quarter1989).

Attachment A
53
Attachment A
THE BIF AND SAIF SHOULD BE MERGED
After many years of persistent attempts,Congress succeeded in modernizing many ofthe laws governing the financial servicesindustry in the United States through passageof the Gramm-Leach-Bliley Act of 1999(GLBA). In many ways, the legislation isforward-looking, creating new opportunitiesthat will benefit the financial services industry,the U.S. economy and consumers well into thenew century. GLBA also updated some laws toreflect the current marketplace, eliminatingobsolete statutes that had been chipped awayby subsequent legislative or regulatorymeasures or bypassed in whole or in part byinnovation. Some of these laws, notably theGlass-Steagall Act, had lingered since the1930s. However, there is one relic of thestatutory framework established after the GreatDepression that GLBA did not address—theexistence of separate deposit insurance fundsfor banks and thrifts.
A Combined Fund Would Be Stronger andMore Efficient
A merger of BIF and SAIF would ensure thatthe risks to the deposit insurance system are asdiversified as possible. The more concentratedthe risks—by numbers of institutions, bygeography, by types of products—the moreconcentrated are the dangers and the greater isthe likelihood that trouble in a single institutionor in a small group of institutions wouldseriously impact a fund. FDIC-insuredinstitutions are encouraged to diversify, and thesame principle applies to the insurance fund.
With ongoing consolidation in the industry andthe rise of the “megabank,” the FDIC’s risk isincreasingly located in a few large institutions.From June 1990 to March 2000, the share of
SAIF-insured deposits held by the three largestinstitutions rose from 8.7 percent to 15.0percent. The BIF had a larger increase inconcentration during this period, with the shareof its three largest insured institutions risingfrom 5.0 percent to 14.0 percent. In acombined insured-deposit base, the threelargest institutions would hold only 12.7percent. A combined deposit insurance fund,with a balance of $40 billion and a reserve ratioof 1.38 percent, would be better equipped thaneither fund alone to address the increasedconcentration of the industry. A recent paperby an FDIC economist shows that, on the basisof historical data, a combined fund would havea lower probability of insolvency than eitherfund individually. (Oshinsky, Robert,“Merging the BIF and the SAIF: Would aMerger Improve the Funds’ Viability?”Federal Deposit Insurance Corporation,Division of Research and Statistics. WorkingPaper Series 99-4.) This translates to betterprotection for taxpayers.
A combined fund also would be more efficientthan the present structure. In 1995 and 1996,the BIF had recapitalized and the FDIC couldlower its assessment rates substantially, whilethe SAIF remained undercapitalized and wasrequired to maintain higher rates. Thus,identical products were available at differentprices. When such a price disparity exists,consumers—in this case, banks and thrifts thatpay deposit insurance assessments—naturallygravitate to the lower price. Despitemoratoriums, exit and entrance fees, and banson deposit shifting, market forces ultimatelyprevailed. Institutions wasted time and moneytrying to circumvent restrictions that prohibitedthem from purchasing deposit insurance at thelowest price. The DIFA led to the eliminationof the disparity in deposit insurance assessment

Attachment A
54
rates that then existed between the BIF and theSAIF, but as long as there are two depositinsurance funds, whose assessment rates aredetermined independently, the prospect of apremium differential exists. A merged fundwould guarantee that such a disparity wouldnot recur in the future. It would have a singleassessment rate schedule whose rates would beset solely on the basis of the risks thatinstitutions pose to the single fund.
The FDIC has examined the mechanics ofmerging the funds, and has found that there areno significant obstacles to or expenses in such amerger. Indeed, a merger of the funds wouldresult in lower costs and regulatory burden forapproximately 842 institutions that hold bothBIF- and SAIF-insured deposits (Oakardeposits) that must be tracked and assessedseparately. Although these costs may not belarge in absolute dollars, they representunnecessary expenditures.
The Timing for a Merger Is Optimal
The arguments for a merger of the BIF and theSAIF are persuasive and the timing is optimal.Changes in the bank and thrift industries inrecent years—and in the larger financialservices industry—have been substantial.Many of the statutory differences between bankand thrift charters have been narrowed,bringing them into keener competition with oneanother. And in areas where differencesremain, such as portfolio composition, riskdiversity favors fund merger. In the 1930s,when the FDIC and the FSLIC wereestablished, savings and loans were, in general,mutual institutions that primarily offeredsavings accounts and home mortgages forconsumers. Because their charters werelimited, savings and loans were not allowed tooffer checking accounts, consumer loans, orcommercial loans. Indeed, their loans werevirtually all long-term, fixed-rate residentialmortgages. Commercial banks, on the other
hand, served mostly commercial customers.More than two-thirds of bank deposits weredemand deposits and banks made very fewresidential mortgages.
Over time, the distinctions between banks’ andthrifts’ powers have become blurred. Each hasencroached substantially on what was once theother's domain. Both offer essentially anidentical array of deposit accounts. In addition,in the aftermath of the Riegle-Neal InterstateBanking and Branching Efficiency Act of1994, both banks and thrifts can branchnationwide. While banks and thrifts still arequite different in their asset composition, fromthe point of view of the insured depositor, thereis virtually no difference between the servicesthey offer.
In 1996, the DIFA provided for a merger of thefunds on January 1, 1999, if there were nosavings association in existence on that date. Itwas thought at the time that a new charter thatwas common both to banks and thrifts wouldbe developed, and the thrift charter would beeliminated. This did not occur. However,GLBA addressed what some believed to be aninequity in federal law that had permitted thecombination of banking and commerce throughunitary savings and loan holding companies.Such combinations were prohibited to bankholding companies. GLBA bans new unitarythrift holding companies from engaging incommercial activities or affiliating withcommercial entities. Thus, while there remainseparate charters, elimination of the unitarythrift holding company put to rest a significantimpetus for conditioning merger of the fundson the merger of the thrift and bank charters.
The composition of who holds SAIF-insureddeposits has changed as well. The name"Savings Association Insurance Fund"connotes a fund that insures deposits at savingsassociations. When it was established in 1989,this was indeed the case. Virtually all SAIF-insured deposits were held by SAIF-member

Attachment A
55
savings associations. However, over the lastdecade, this changed dramatically. As ofMarch 31, 2000, commercial banks (40percent) and state-chartered savings banks (8percent) held over 47 percent of all depositsinsured by the SAIF. Indeed, 27 of the 50largest holders of SAIF-insured deposits areBIF members, including First Union NationalBank (ranked second) and Bank of America,N.A. (ranked third). The name "SavingsAssociation Insurance Fund” has become amisnomer. The SAIF has become a true hybridfund.
The current health of the bank and thriftindustries and of the insurance funds alsoindicate that now is an ideal time to merge thefunds. Despite recent indications of deteri-orating credit quality, the condition of the bankand thrift industries reflects the currentfavorable economic environment, with high,
broad-based profitability, sound balance sheetsand low numbers of failures. With low levelsof assets from failed institutions, both funds arehighly liquid, with the preponderance of thefunds’ assets invested in interest-bearing U.S.government securities. As of March 31, 2000,the reserve ratio of the BIF was 1.35 percent,and that of the SAIF was 1.44 percent. Acombined fund would have a reserve ratio of1.38 percent, causing only moderate dilution ofthe SAIF. While favorable conditions haveexisted for several years, economic historyindicates such conditions do not persistindefinitely. History also tells us that, whenthere exists a perception of disparity in thequality of one of the funds, the notion ofmerging them becomes controversial. Now isan excellent time to merge the funds, ratherthan when the industry or one or both of thefunds come under stress.

Attachment B-1
56
Attachment B
CDIC-LIKE SCORING SYSTEMS
B-1. The CDIC System
Table B-1.1
Table B-1.2
Table B-1.3
Criteria or FactorsMaximum
Score
Capital Quantitative:Capital Adequacy 20 -Assets to Capital Multiple -Tier 1 Risk-Based Capital Ratio -Total Risk-Based Capital RatioOther Quantitative: -Return on Risk-Weighted Assets 5 -Mean Adjusted Net Income Volatility 5 -Volatility Adjusted Net Income 5 -Efficiency Ratio 5 -Net Impaired Assets (Including Net Unrealized Losses on Securities) to Total Capital 5 -Aggregate Counterparty Asset Concentration Ratio 5 -Real Estate Asset Concentration 5 -Aggregate Industry Sector Asset Concentration 5
Sub-total: Quantitative Score 60Qualitative: -Examiner's Rating 25 -Extent of Adherence to CDIC Standards 10 -Other Information 5
Sub-total: Qualitative Score 40Total Score 100
Summary of Criteria or Factors and Scores
Premium Category 2000 Premium Year 1999 Premium Year1 76 752 20 243 5 84 1 2
Total 104 109
Number of Member Institutions
Results of the First Two Years of the CDICS t
Premium Category Total ScorePremium Rate per 1% of Insured Deposits
1 Total Score>=80 1/24th
2 Total Score>=65 but <80 1/12th
3 Total Score>=50 but <65 1/6th
4 Total Score<50 1/3rd*
*As a transition measure, for the first two years of the system, the Category 4 rate is the
same as Category 3, i.e., 1/6th of 1% of insured deposits.
Premium Categories and Rates
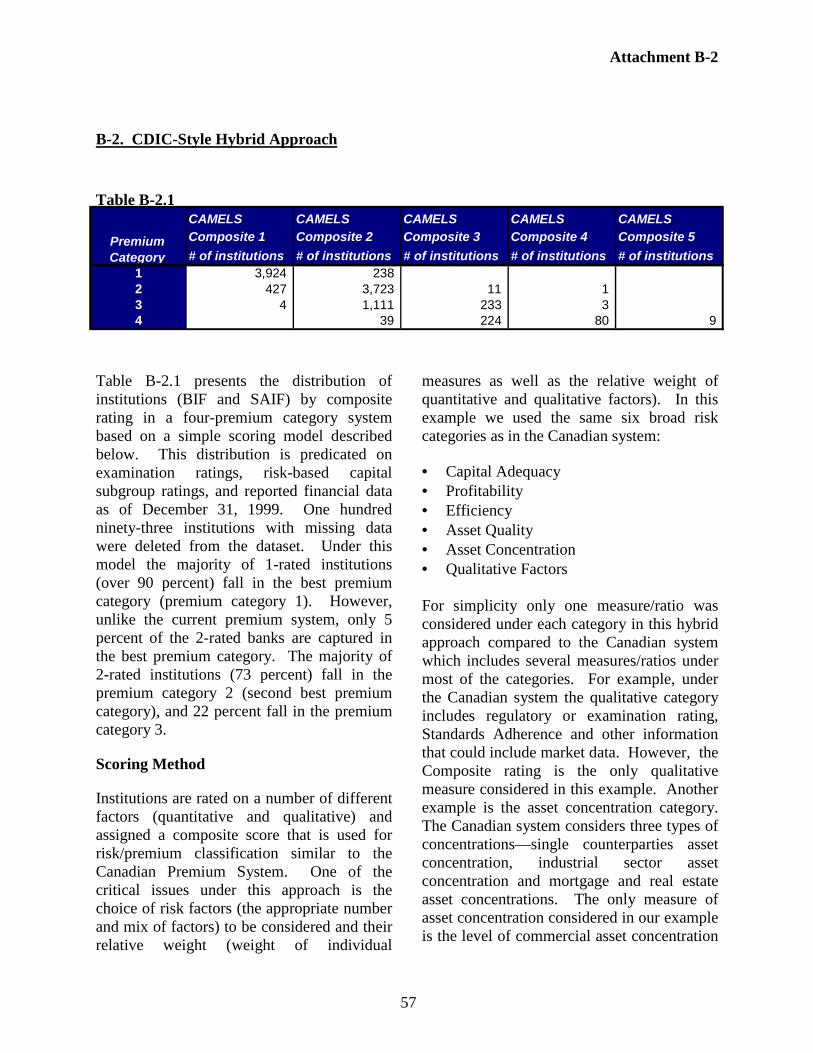
Attachment B-2
57
B-2. CDIC-Style Hybrid Approach
Table B-2.1
Table B-2.1 presents the distribution ofinstitutions (BIF and SAIF) by compositerating in a four-premium category systembased on a simple scoring model describedbelow. This distribution is predicated onexamination ratings, risk-based capitalsubgroup ratings, and reported financial dataas of December 31, 1999. One hundredninety-three institutions with missing datawere deleted from the dataset. Under thismodel the majority of 1-rated institutions(over 90 percent) fall in the best premiumcategory (premium category 1). However,unlike the current premium system, only 5percent of the 2-rated banks are captured inthe best premium category. The majority of2-rated institutions (73 percent) fall in thepremium category 2 (second best premiumcategory), and 22 percent fall in the premiumcategory 3.
Scoring Method
Institutions are rated on a number of differentfactors (quantitative and qualitative) andassigned a composite score that is used forrisk/premium classification similar to theCanadian Premium System. One of thecritical issues under this approach is thechoice of risk factors (the appropriate numberand mix of factors) to be considered and theirrelative weight (weight of individual
measures as well as the relative weight ofquantitative and qualitative factors). In thisexample we used the same six broad riskcategories as in the Canadian system:
• Capital Adequacy• Profitability• Efficiency• Asset Quality• Asset Concentration• Qualitative Factors
For simplicity only one measure/ratio wasconsidered under each category in this hybridapproach compared to the Canadian systemwhich includes several measures/ratios undermost of the categories. For example, underthe Canadian system the qualitative categoryincludes regulatory or examination rating,Standards Adherence and other informationthat could include market data. However, theComposite rating is the only qualitativemeasure considered in this example. Anotherexample is the asset concentration category.The Canadian system considers three types ofconcentrations—single counterparties assetconcentration, industrial sector assetconcentration and mortgage and real estateasset concentrations. The only measure ofasset concentration considered in our exampleis the level of commercial asset concentration
CAMELS CAMELS CAMELS CAMELS CAMELSComposite 1 Composite 2 Composite 3 Composite 4 Composite 5
# of institutions # of institutions # of institutions # of institutions # of institutions1 3,924 238 2 427 3,723 11 1 3 4 1,111 233 3 4 39 224 80 9
Premium Category

Attachment B-2
58
as measured by the ratio of commercial loansplus commercial mortgages plus constructionloans plus multi-family loans to total capital.
Although the specific measures/ratios usedfor each of the six categories in this hybridapproach are different from those used in the
Canadian system, the relative weightsassigned to the six broad categories are thesame as the Canadian system, i.e., thequalitative category has a total weight of 40percent under both models. Thefactors/measures and scoring system used inthis example are summarized in Table B-2.2.
Table B-2.2
Capital Adequacy 20
-Capital Subgroup=1 20 -Capital Subgroup=2 13 -Capital Subgroup=3 0Profitability 15
-Return on Risk-Weighted Assets>=1.15 15 -Return on Risk-Weighted Assets>=0.75 but <1.15 9 -Return on Risk-Weighted Assets<0.75 0 (including negative)
Efficiency 5
-Efficiency Ratio<=60% 5 -Efficiency Ratio>60% but <=80% 3 -Efficiency Ratio>80% 0Asset Quality 5
-90+ Days Past Due and Nonaccrual to 5 Total Capital<20% -90+ Days Past Due and Nonaccrual to 3 Total Capital>=20% but <40% -90+ Days Past Due and Nonaccrual to 0 Total Capital>=40%Asset Concentration 15
-Commercial Concentration to 15 Total Capital<25% -Commercial Concentration to 9 Total Capital>=25% but <50% -Commercial Concentration to 0 Total Capital>50%Qualitative Factor 40
-Composite Rating=1 40 -Composite Rating=2 29 -Composite Rating=3 18 -Composite Rating=4 6 -Composite Rating=5 0Total Score 100
Factors / MeasuresRange ofScores
MaximumScore
Factors / Measures and Corresponding Scores

Attachment B-2
59
Establishing the appropriate number ofrisk/premium categories and thresholds forpremium classification are critical decisionsthat require extensive analysis. However, forillustrative purposes, we adopted the
Canadian system’s four-category class-ification and the related scores. The premiumcategories and related scores are shown inTable B-1.2 (see page 56).

Attachment C
60
Attachment C
OVERVIEW OF THE RISK-BASED PREMIUM SYSTEM
The FDIC uses a risk-based premium systemthat assesses higher rates on thoseinstitutions that pose greater risks to the BIFor the SAIF. In order to assess premiums onindividual institutions, the FDIC places eachinstitution in one of nine risk categoriesusing a two-step process based first oncapital ratios (the capital group assignment)and then on other relevant information (thesupervisory subgroup assignment).
Capital group assignments are made inaccordance with section 327.4(a)(1) of theFDIC's Rules and Regulations, using themethod agreed upon by the FederalFinancial Institutions Examination Council(FFIEC) Surveillance Task Force forcalculating capital ratios. The method usesdata reported in an institution's Report ofIncome and Condition (Call Report), Reportof Assets and Liabilities of U.S. Branchesand Agencies of Foreign Banks, or ThriftFinancial Report.
Capital Group Descriptions
Group 1 - "Well Capitalized." Total Risk-Based Capital Ratio equal to or greater than10 percent, and Tier 1 Risk-Based CapitalRatio equal to or greater than 6 percent, andTier 1 Leverage Capital Ratio equal to orgreater than 5 percent.
Group 2 - "Adequately Capitalized." NotWell Capitalized and Total Risk-BasedCapital Ratio equal to or greater than 8percent, and Tier 1 Risk-Based Capital Ratioequal to or greater than 4 percent, and Tier 1Leverage Capital Ratio equal to or greaterthan 4 percent.
Group 3 - "Undercapitalized." Neither WellCapitalized nor Adequately Capitalized.Supervisory subgroup assignments formembers of the BIF and the SAIF are madein accordance with section 327.4(a)(2) of theFDIC's Rules and Regulations, whichprovides as follows:
...each institution will be assignedto one of three subgroups based onthe Corporation's consideration ofsupervisory evaluations providedby the institution's primary federalregulator. The supervisoryevaluations include the results ofexamination findings by theprimary federal regulator, as wellas other information the primaryfederal regulator determines to berelevant. In addition, theCorporation will take intoconsideration such otherinformation (such as stateexamination findings, ifappropriate) as it determines to berelevant to the institution'sfinancial condition and the riskposed to the BIF or SAIF.
Supervisory Subgroup Descriptions
Subgroup A - This subgroup consists offinancially sound institutions with only afew minor weaknesses and generallycorresponds to the primary federalregulator's composite rating of "1" or "2."
Subgroup B - This subgroup consists ofinstitutions that demonstrate weaknesseswhich, if not corrected, could result insignificant deterioration of the institutionand increased risk of loss to the BIF orSAIF. This subgroup assignment generallycorresponds to the primary federalregulator's composite rating of "3."

Attachment C
61
Subgroup C - This subgroup consists ofinstitutions that pose a substantialprobability of loss to the BIF or the SAIFunless effective corrective action is taken.This subgroup assignment generallycorresponds to the primary federalregulator's composite rating of "4" or "5."
The FDIC Board of Directors (Board)reviews premium rates semiannually. As ofJanuary 1, 1993, when the risk-basedassessment system was introduced, eachbank and thrift paid an annual assessmentrate of between 23 and 31 cents per $100 ofassessable deposits. After the BIF reachedthe DRR of 1.25 percent at the end of May1995, the Board approved a reduction inassessment rates for BIF members to a rangeof between 4 and 31 cents per $100 ofassessable deposits. In November 1995, the
Board approved a new assessment ratestructure for the BIF, with a range ofbetween 0 and 27 cents per $100 ofassessable deposits, effective January 1,1996.
The DIFA provided for the capitalization ofthe SAIF at the target DRR of 1.25 percentby means of a one-time special assessmenton SAIF-member institutions. In December1996, the Board lowered SAIF assessmentrates to a range of between 0 and 27 centsper $100 in assessable deposits, which isidentical to the rate schedule previouslyapproved for BIF members. The new rateswere effective October 1, 1996, for Sasserand BIF-member Oakar institutions, andeffective on January 1, 1997, for all otherSAIF-insured institutions.

Attachment D-1
62
Attachment D
DIFFERENTIATING AMONG A-RATED INSTITUTIONS
D-1. Using Prompt Corrective ActionCapital Ratios to Distinguish the Risk ofInstitutions within a Capital Subgroup
How much a financial institution pays fordeposit insurance is a function of both itsexamination ratings and the adequacy of itscapital. Using CAMELS composite scoresand the four Prompt Corrective Action(PCA) capital ratios, the FDIC places eachof the institutions it insures into one of thenine cells constituting the three-by-threeRisk Related Premium (RRP) matrix.23
Together, these two dimensions capture boththe judgement of bank supervisors as to aninstitution’s overall safety and soundnessand the reality that, if all else fails, morecapital is better then less.
Refining the RRP Matrix
Because the matrix is two-dimensional,there are also two ways of conceptualizinghow it may be further refined to yield amore continuous and accurate measure ofthe risk that insured institutions pose to theFDIC. The first is to consider howSupervisory Subgroups might be morefinely divided. This could be accomplishedby expanding the number of subgroups fromthree to five—one for each of the fiveCAMELS composite scores. It could alsobe accomplished by breaking up the existingsubgroups using some criteria thateffectively discriminate among the differentrisk profiles found in financial institutionshaving identical Supervisory Subgroup
23 The four PCA capital measures are: 1) theLeverage ratio; 2) the Tier One Capital ratio; 3) theTotal Capital ratio; and 4) the Tangible Capital ratio.
classifications. A discussion of how thismight be implemented appears in attachmentD-2.
The second way is to consider how theCapital Groups might be subdivided todistinguish among institutions according tothe size of their capital cushion. In practice,this second approach is not dissimilar to thefirst. Conceptually, however, there are twoimportant distinctions. First, recognizingdifferences among institutions in CapitalGroups—rather than in SupervisorySubgroups—respects the independentpurpose of CAMELS ratings. Second, theCapital Subgroup is more direct and lesssubjective—that is, it depends directly uponthe value of and interplay among just fourmeasurable PCA capital ratios.
The Appeal of Capital-Based Refinement
Ideally, the criteria used to refine theexisting RRP matrix should individually orjointly have certain characteristics. First,their relationship to the risk that a specificinstitution poses to the deposit insurancefunds should be demonstrable. Second, theyalso should be widely dispersed within thecells of the current matrix. This means thatthere should be a sufficient range of valuesso that some differentiation of institutionsbased upon the criteria is possible. Finally,it follows from the first characteristic thatthe criteria should also be discrete acrosscells so that little or no overlap of valuesexists. If not, then the usefulness of theexisting classification scheme becomes opento question.

Attachment D-1
63
The four PCA capital measures that underliethe Capital Group rating meet these criteria.The relationship between more capital andless failure has long been accepted asaxiomatic by bank supervisors, and a bodyof confirming research exists. Furthermore,as Table D-1.1 shows, the wide spread inratio values in the most heavily populatedRRP cell provides considerable opportunityfor subdividing the very groups for whichsuch subdivision would be most useful.Finally, there is little overlap in valuesacross Capital Groups—from 1.8 percent to6.8 percent of institutions depending on theratio—not surprising since by definition aninstitution’s ratios determine its capitalgroup assignment.
Replacing Disincentives with Incentives
While linking deposit insurance pricing to amore granular assessment of capitaladequacy is attractive on practical grounds,it has appeal on behavioral grounds as well.Under the current premium system, a bankor thrift will pay more for failing to meet aparticular capital threshold. Once aninstitution meets the regulatory definition ofwell-capitalized, however, it cannot pay lessno matter how much additional capital itholds.
Table D-1.1
Therefore, there are incentives for managingcapital to clear thresholds as closely aspossible with the strength of the incentivedependent upon the severity of depositinsurance mispricing. At present, more thannine institutions out of ten find themselvesin this situation—with the lowest possibledeposit insurance premium and without theincentive of lower premiums to becomebetter capitalized. For those already havingexcess capital with respect to the PCAthreshold, they also are without incentive tomaintain it. In short, the FDIC is not onlyunable to price based on actual risk but issimilarly unable to provide insuredinstitutions with a realistic and defensiblechoice between the costs of insuring theirrisk and the costs of reducing it.
Expanding the Framework
While this discussion has so far relied uponthe general rule that more capital is alwaysbetter than less, there is at least oneweakness in this approach to pricing.Although holding more capital doesgenerally mean a lower risk of failure, thedegree of additional safety achieved at themargin is likely to diminish beyond somelevel—possibly a very low level if the timehorizon over which the risk is being
PCA Ratio
95th Percentile (%)
5th Percentile (%) Spread in Pctg. Points
Leverage Ratio 18.7 6.6 12.1Tier One Capital Ratio 37.6 9.3 28.3Total Capital Ratio 39.0 10.5 28.4Tangible Capital Ratio 18.7 6.6 12.1
Spreads Between the 99th and 1st Percentile Values for 1A-Rated Financial Institutions for Four PCA Ratios
Note: The 1A Risk Related Premuim matrix cell contains 9,188 financial institutions in Capital Group 1 and Supervisory Subgroup A. A rating of 1A means that an institution is well-capitalized for PCA purposes and has a CAMELS composite rating of either 1 or 2.

Attachment D-1
64
measured is short. Thus, a bank holding halfof its assets in capital may not besignificantly safer than one holding half thatamount. If true, then the wide range ofcapital ratios that exist within the best RRPcell may not, when translated into aprobability of failure, vary enough todifferentiate among institutions asmeaningfully as the widely dispersed rawratios would suggest.
A possible response is to price eachinstitution’s risk not only as a function of its
capital level but also of the volatility of itsincome statement. In other words, the rawcapital measures can be enhanced by anoptions-type analysis that embeds thevolatility of capital consumption within thecalculation of how long existing capital islikely to last. This opens the door to theextension of capital adequacy pricing toinclude modern financial methods, butretains the direct link to capital adequacymeasurement to which the regulators and thelegislators have grown accustomed.

Attachment D-2
65
D-2. Peer Group Comparisons
Table D-2.1 contains examples of howinstitutions in the "A" insurance categorymight be classified under an expanded depositinsurance matrix, where the currentsupervisory subgroups are further divided intoplus and minus categories. Classifications aremade using troubled assets to total assets,mean operating income for the previous threeyears, and the volume of risk-weighted assetsto total assets. The two tables in thisattachment show the distribution based uponpeer group comparisons.
The calculation includes all FDIC-insuredinstitutions. Only those institutions thatlacked the necessary financial or supervisorydata were removed from the dataset. Therisk-based capital group and supervisorysubgroup classifications are based on datareported at year end, and as such do notnecessarily correspond with the actual capitaland supervisory subgroup rating which aninstitution received for the particular semi-annual period.
For the peer group comparison, institutionsare ranked into deciles based on their values
for each of the three ratios. Institutionshaving the best values are placed in the firstdecile, while institutions with the worstvalues are placed in the last decile. Aninstitution falling into the top three deciles onany two of the ratios, and scoring within thetop five deciles on the third ratio, was placedinto the plus category. Likewise, aninstitution falling in the bottom three decileson any two of the ratios, and within thebottom five deciles on the third ratio wasplaced in the minus catogory. Institutionsmeeting neither of these criteria remained inthe "A" subgroup.
Most institutions remain in the "A" insurancesubgroup under this hypothetical pricingmatrix. Of those institutions reclassified intoeither the plus or minus category, in mostyears a greater number moved down into theminus category rather than upward into theplus category. However, the selection ofreported financial information used in theseexamples represents only one possible setwhich might be used to reclassify institutionsfor insurance purposes, and many otherstructures and types of data could be tested.
Table D-2.1
Capital Group A+ A A- Total
1 1,707 5,241 2,323 9,2712 10 107 71 1883 1 4 2 7
Total 9,466
Capital Group A+ A A- Total
1 18.0% 55.4% 24.5% 97.9%2 0.1% 1.1% 0.8% 2.0%3 0.0% 0.0% 0.0% 0.1%
Total 100.0%
Percentage of Institutions
Supervisory Subgroup
Distribution of Banks under Revised Rate Matrix as of 12/31/99
Number of Institutions
Hypothetical Distribution of "A" Rated Insured Institutions Based on Peer Group Comparisons
Distribution of Banks under Revised Rate Matrix as of 12/31/99
Supervisory Subgroup

Attachment D-3
66
D-3. Historical Benchmarks
The following tables contain examples of howinstitutions in the "A" insurance categorymight be classified under an expanded depositinsurance matrix, where the currentsupervisory subgroups are further divided intoplus and minus categories. Classifications inthis attachment are made using the samefinancial ratios as in Attachment D-2, exceptthat classifications are based on thresholdlevels rather than peer comparisons. Thetable below shows the total number andpercentage of institutions in each category.
For "A" rated institutions, the plus categorywas assigned to any institution having a "1"CAMELS rating, having a troubled asset ratioof less than 1 percent, mean operating incomegreater than 1 percent, and risk-weightedassets generally less than 80 percent,depending on institution size. The minuscategory was assigned to institutions having a"2" CAMELS rating and a troubled asset ratiogreater than 3 percent, or mean operatingincome less than 0.80 percent, or risk-weighted assets greater than 80 percent. Allother institutions rated CAMELS "1" or "2"which did not meet either criteria remained inthe "A" category.
Table D-3.1
Capital Group A+ A A- Total1 2,297 4,839 3,525 10,6612 2 31 97 1303 0 0 4 4
Total 10,795
Capital Group A+ A A- Total1 21.3% 44.8% 32.7% 98.8%2 0.0% 0.3% 0.9% 1.2%3 0.0% 0.0% 0.0% 0.0%
Total 1
Distribution of "A" Rated Banks Under Revised Rate Matrix as of 12/31/99
Percentage of Institutions
Distribution of "A" Rated Banks Under Revised Rate Matrix as of 12/31/99
Supervisory Subgroup
Supervisory Subgroup
Number of Institutions
Hypothetical Distribution of "A" Rated Insured Institutions Based on Threshold Financial Ratio Levels

Attachment E-1
67
Attachment E
EXPECTED LOSS PRICING
E-1. Incorporating Credit Rating AgencyInformation in Deposit Insurance Pricing
Efforts to refine the FDIC’s deposit insurancepricing system center on more effectivelydifferentiating among insured institutionsbased on the risk they pose to the insurancefunds. Some industry observers havesuggested using credit agency ratings andhistorical corporate bond default rates toproject estimated losses in insuredinstitutions. These projections in turn couldbe converted to deposit insurance assessmentrates for banks in each of the various creditrating categories. The use of historical lossdata in calculating these rates would provideat least some degree of actuarial rigor insetting premiums.
The following tables provide an example ofhow credit rating information and FDIChistorical loss data might be combined toderive assessment rates. Historical defaultdata are drawn from the Moody’s andStandard & Poor’s (S&P) annual corporatebond default studies published in 2000.
Average three-year corporate default rates foreach letter rating are divided by three toderive a one-year default rate. This rate isthen multiplied by the loss rate on thedisposition of failed bank assets experiencedby the FDIC over the period from 1986through 1999 for banks with more than $5billion in assets. In order to restate the lossrate in terms of domestic deposits (rather thantotal assets), the expected loss rate is dividedby the ratio of total assets to domesticdeposits for each size category. The rate canthen be expressed in cents per $100 ofdeposits, the same unit used by the FDIC forstating deposit insurance assessment rates.
It should be noted that the default rates aredrawn from all industries, not just thefinancial sector. Ideally, an assessmentscheme relying on credit rating agency datawould utilize data reflecting defaultexperience among financial institutions only.
The three-year rate is used to ensure asufficient volume of default data; one-yeardefault rates are simply too low to be usefulfor this exercise, particularly in the severalhighest rating categories. Also dividing bythree yields approximately the constantannual payment that would equate expectedrevenue and expected loss over three years.There is no single correct horizon, as there isa trade-off between premium stability andfund stability. A five-minute horizon wouldensure that premiums cover every loss butwould cause extreme premium volatility andwould not be forward-looking. An infinitehorizon would result in a fixed premium, butwould cause extreme volatility in the fund.
Certain patterns in both the S&P andMoody’s data are immediately apparent.Projected assessment rates are zero for thehighest-rated categories and remain relativelylow through the range of investment qualityratings (that is, through BBB- for S&P andBaa3 for Moody’s.) Rates escalate sharplythrough the speculative grades, to a maximumof 120 basis points for S&P’s CCC ratingsand 124 basis points for Moody’s Caa-Cratings. Both of these maximum rates aresignificantly higher than the maximum ratecharged banks under the current risk-relatedpremium matrix. However, at present,relatively few bank holding companies holddebt rated lower than investment grade; few ifany banks would therefore be subject toextremely high premiums. In any case, it

Attachment E-1
68
seems likely that regulators would place amaximum limit on premium levels to ensurethat assessments in themselves would notfatally undermine the viability of weak banks.
One problematic feature of both the S&P andMoody’s data sets is that increases inhistorical default rates for the top few ratingcategories are not strictly consistent withdecreases in credit ratings. For example,S&P’s three-year default rate on AA- rateddebt is 0.30 percent compared to 0.13 percentfor lower quality A+ rated debt. Similarly,Moody’s historical default rate for the A1category is 0.33 percent, while debt rated A2
has a default rate of 0.14 percent. Clearly, adeposit insurance pricing scheme could not betied directly to an historical default rateschedule if such a system would result inbetter-rated banks paying higher premiumsthan more poorly-rated institutions.
Moreover, when compared to premiumsderived under alternative approaches in thisattachment, the low assessment rates for theinvestment grades in Table E-1.1 raise thequestion whether a pure credit-ratingapproach is sufficiently forward-looking ormay be overly biased in favor of large banks.
Table E-1.1
Annual AssessmentLoss Rate 3-Year 1-Year Expected Expected Loss Per $10 Billion
Credit On Assets Default Default 1-Year as a Percentage of Assessment Of Assessable Rating (>$5 billion) Rate Rate Loss Rate Domestic Deposits Rate (bp) (thousands)
Aaa 8.00% 0.00% 0.00% 0.00% 0.00% 0.0 0Aa1 8.00% 0.00% 0.00% 0.00% 0.00% 0.0 0Aa2 8.00% 0.06% 0.02% 0.00% 0.00% 0.2 217 Aa3 8.00% 0.19% 0.06% 0.01% 0.01% 0.7 686 A1 8.00% 0.33% 0.11% 0.01% 0.01% 1.2 1,191 A2 8.00% 0.14% 0.05% 0.00% 0.01% 0.5 505 A3 8.00% 0.25% 0.08% 0.01% 0.01% 0.9 902 Baa1 8.00% 0.52% 0.17% 0.01% 0.02% 1.9 1,877 Baa2 8.00% 0.60% 0.20% 0.02% 0.02% 2.2 2,166 Baa3 8.00% 1.34% 0.45% 0.04% 0.05% 4.8 4,837
Ba1 8.00% 3.86% 1.29% 0.10% 0.14% 13.9 13,932 Ba2 8.00% 5.05% 1.68% 0.13% 0.18% 18.2 18,227 Ba3 8.00% 11.89% 3.96% 0.32% 0.43% 42.9 42,915 B1 8.00% 14.81% 4.94% 0.39% 0.53% 53.5 53,455 B2 8.00% 20.28% 6.76% 0.54% 0.73% 73.2 73,198 B3 8.00% 27.27% 9.09% 0.73% 0.98% 98.4 98,427 Caa1-C 8.00% 34.23% 11.41% 0.91% 1.24% 123.5 123,548
Annual AssessmentLoss Rate 3-Year 1-Year Expected Expected Loss Per $10 Billion
Credit On Assets Default Default 1-Year as a Percentage of Assessment Of Assessable Rating (>$5 billion) Rate Rate Loss Rate Domestic Deposits Rate (bp) (thousands)
AAA 8.00% 0.04% 0.01% 0.00% 0.00% 0.1 144AA+ 8.00% 0.00% 0.00% 0.00% 0.00% 0.0 0AA 8.00% 0.00% 0.00% 0.00% 0.00% 0.0 0AA- 8.00% 0.30% 0.10% 0.01% 0.01% 1.1 1,083A+ 8.00% 0.13% 0.04% 0.00% 0.00% 0.5 469A 8.00% 0.17% 0.06% 0.00% 0.01% 0.6 614A- 8.00% 0.27% 0.09% 0.01% 0.01% 1.0 975BBB+ 8.00% 0.54% 0.18% 0.01% 0.02% 1.9 1,949BBB 8.00% 0.80% 0.27% 0.02% 0.03% 2.9 2,887BBB- 8.00% 1.01% 0.34% 0.03% 0.04% 3.6 3,645
BB+ 8.00% 3.03% 1.01% 0.08% 0.11% 10.9 10,936BB 8.00% 4.32% 1.44% 0.12% 0.16% 15.6 15,592BB- 8.00% 6.71% 2.24% 0.18% 0.24% 24.2 24,219B+ 8.00% 11.10% 3.70% 0.30% 0.40% 40.1 40,064B 8.00% 21.48% 7.16% 0.57% 0.78% 77.5 77,529B- 8.00% 22.68% 7.56% 0.60% 0.82% 81.9 81,860CCC 8.00% 33.35% 11.12% 0.89% 1.20% 120.4 120,372
Su
b-I
nve
stm
ent
Gra
de
Inve
stm
ent
Gra
de
Su
b-I
nve
stm
ent
Gra
de
Assessment Rates Derived From Historical Default Rates and Losses on Assets
Moody's Credit Ratings
Standard and Poor's Credit Ratings
Inve
stm
ent
Gra
de

Attachment E-1
69
Examples:
AnnualDomestic Assessment Assessment
Moody's Credit Deposits Rate AmountBank Rating (millions) (bp) (thousands)A Aa2 5,402 0.22 117B Aa3 39,595 0.69 2,715C A1 132,285 1.19 15,756D A2 19,390 0.51 980E A3 3,961 0.90 357F B1 3,737 53.45 19,977

Attachment E-2
70
E-2. Using Default Risk Premiums onSubordinated Debt To Estimate BankingOrganization Expected Loss
Risk premiums on banking companyunsecured, subordinated debt overcomparable maturity Treasury securities, withno call features or liquidity premiums, areconsidered the reflection of the market’sassessment of the likelihood of default overthe maturity of the debt. For example, theyield to maturity of a three-year maturity, Baarated, bank subordinated debt might carry aspecific premium over a three-year maturityTreasury security of 2.0 percent. Thispremium will represent investors’ views as tothe minimum required yield over the defaultrisk-free yield that ought to be offered tocompensate them for the default risk they areundertaking. Assuming that investors behaveas if they are risk neutral and price all debtover time on an expectations basis, thelikelihood of default over a given period canbe derived from the yield spread observed inthe market.24
Using these assumptions, the future value ofone dollar invested for one year at the zero-coupon, default risk-free debt yield factor of(1+y) will be equal to the expected futurevalue of a zero-coupon, default risky securitywith the same maturity yielding a value of(1+k). The expected value of the defaultrisky security is the likelihood of notdefaulting over the year (p) times the yieldfactor of (1+k). Taking the default risky bondas worthless if it defaults, the equilibrium is:
24 In practice, zero coupon yields can be found forTreasury securities from the Treasury STRIPS marketor from forward yields derived from the Treasurycurve. However, for banking company subordinateddebt things become more difficult because there arefew traded zero corporate securities of multiple year orshort-term maturities. Therefore, other means ofestimating zero coupon yields of longer maturities (3year) must be used.
(1+y) = p(1+k)
Since there are only two possibilities—survival or default—the likelihood of defaultis one minus the likelihood of not defaulting(1-p) and can be derived from the aboverelationship as:
( ) ( )( )k
yp
++−=−
1
111
and the spread (k-y) is:
(k-y) = (1-p)(1+k)
Table E-2.1 (see next page) shows variousaverage one-year probabilities of default asderived from three-year maturity, zero couponyields and spreads for various Treasuryyields.25 The range is large, from 0.28percent to 2.83 percent.
Assuming that if a bank defaults on itssubordinated debt it will also fail, thelikelihood of default on its subordinated debtover the next year is also the likelihood thatthe bank will fail. The expected loss to theFDIC based on bank assets can be calculatedby multiplying the likelihood of default(Table E-2.1) by the expected loss givendefault for the bank. These latter values areestimated from historical loss ratesexperienced by the FDIC for banks of
25 This approach has been used in the banking industryin loan and bond pricing as described in publishedstudies. For example, see A. Ginzberg, K. Maloneyand R. Wilner, “Risk Rating Migration and Valuationof Floating Rate Debt,” Working Paper, Citicorp,March 1994; R. Litterman and T. Iben, “CorporateBond Valuation and the Term Structure of CreditSpreads,” Journal of Portfolio Management,November 1989, p. 52-64 (in reference to GoldmanSachs); and A. Saunders, Credit Risk Measurement:New Approaches to Value at Risk and OtherParadigms, John Wiley & Sons, Inc., New York, NY,1999, p. 67-81.

Attachment E-2
71
different sizes (Table E-2.2, column 2). Thecomputed expected loss to the FDIC, as aratio to bank assets, for hypothetical spreadsare given in Table E-2.2 in terms of basispoints. The 3 percent Treasury yield wasused for this example; using higher Treasuryyields would tend to decrease these valuesslightly.
These results indicate that for bankingorganizations with substantial risk premiums(3 percent), based on a three year cumulativelikelihood of default, the expected loss rateranges widely from 22.6 basis points to 68.9basis points. Banking organizations withmore moderate risk premiums (1.1 percent)
have expected loss rates of 8.5 basis points to25.4 basis points, still a significant sizedifferential. For the banks that are theprimary issuers of subordinated debt, thosewith assets greater than $5 billion, the lossrates on assets vary from 2.3 basis points to22.6 basis points. It is interesting to note thatthis range is very similar to the range ofhistorical average premiums, from a low of 3basis points to 23 basis points, that have beencharged since 1933. Of interest also is thatthe largest value for the riskiest banks is 67.9basis points, only slightly greater than theestimated 62 basis points banks would havehad to pay in 1991 if the BIF were operatedon a strict pay-as-you-go system.
Table E-2.1
Table E-2.2
3-year TreasuryYield (%) 0.3 0.5 0.7 0.9 1.1 1.3 1.5 1.7 1.9 2.1 2.3 2.5 3.0
3.0 0.29 0.48 0.68 0.87 1.06 1.25 1.44 1.62 1.81 2.00 2.18 2.37 2.833.5 0.29 0.48 0.67 0.86 1.05 1.24 1.43 1.62 1.80 1.99 2.17 2.36 2.824.0 0.29 0.48 0.67 0.86 1.05 1.23 1.42 1.61 1.79 1.98 2.16 2.35 2.804.5 0.29 0.48 0.67 0.85 1.04 1.23 1.42 1.60 1.79 1.97 2.15 2.34 2.795.0 0.28 0.47 0.66 0.85 1.04 1.22 1.41 1.59 1.78 1.96 2.14 2.33 2.785.5 0.28 0.47 0.66 0.85 1.03 1.22 1.40 1.59 1.77 1.95 2.13 2.31 2.766.0 0.28 0.47 0.66 0.84 1.03 1.21 1.40 1.58 1.76 1.94 2.12 2.30 2.756.5 0.28 0.47 0.65 0.84 1.02 1.21 1.39 1.57 1.75 1.93 2.11 2.29 2.747.0 0.28 0.47 0.65 0.83 1.02 1.20 1.38 1.56 1.74 1.92 2.10 2.28 2.737.5 0.28 0.46 0.65 0.83 1.01 1.19 1.38 1.56 1.74 1.92 2.09 2.27 2.718.0 0.28 0.46 0.64 0.83 1.01 1.19 1.37 1.55 1.73 1.91 2.09 2.26 2.70
Spread over 3-Year Maturity Treasury Zero-Coupon Securities (%)
Average 1-Year Likelihood of Default from the Cumulative 3-Year Likelihood Using Risk-Neutral Pricing (%)
Loss Rate Institution on Assets
Size (Assets) (%) 0.3 0.5 0.7 0.9 1.1 1.3 1.5 1.7 1.9 2.1 2.3 2.5 3.0$1 - $5 billion 12.0 3.5 5.8 8.1 10.4 12.7 15.0 17.2 19.5 21.7 24.0 26.2 28.4 34.0
>$5 billion 8.0 2.3 3.9 5.4 6.9 8.5 10.0 11.5 13.0 14.5 16.0 17.5 19.0 22.6
Spread over 3-Year Maturity Treasury Zero-Coupon Securities (%)
Expected Loss as a Percent of Assets Based on the Average 1-Year Likelihood of Default Using Risk-Neutral Pricing and Historical Rates of Losses
Given Default by Bank Asset Size (Basis Points of Assets)

Attachment E-3
72
E-3. Proportion of Insurance Loss Borneby the FDIC
The third item that influences the FDIC’s lossis the proportion of the loss that is borne bythe FDIC. This is determined by the structureof the bank’s liabilities and the amount ofbank capital at failure. The NationalDepositor Preference statute in the OmnibusBudget Reconciliation Act of 1993 governsthe priority of the claims of creditors if a bankfails. The statute requires that creditors bepaid in the following order:
1. Secured claims (up to the value of thecollateral)
2. Administrative expenses of thereceivership
3. Domestic deposit liabilities4. General creditor claims (including
unsecured borrowing and foreigndeposits)
5. Subordinated claims6. Cross-guarantee claims (if any)7. Stockholders
The volume of claims at each level can have aprofound effect on the FDIC’s cost if a bankfails. For example, assume three banks withidentical assets but different liabilities andcapital (Table E-3.1).
Table E-3.1
If we assume further that each bank’s assetsdeclined in value to $85 million, and therewere no other changes, these banks wouldfail. The cost would be borne in the reverse
order of the list above, as shown in Table E-3.2.
Table E-3.2
Thus, the amount of bank capital,subordinated claims and unsecured claimsdirectly reduces the cost borne by the FDICand the uninsured depositors on a dollar-for-dollar basis. The failure of Bank C, withstrong capital plus some subordinated debt,costs the FDIC nothing, whereas the FDICbears a large portion of the loss for the othertwo banks.
More generally, bank capital reduces theFDIC’s losses at failure. In addition, banksthat carry substantive amounts ofsubordinated debt and unsecured claims—provided that they do not flee the bank priorto failure—will be less costly to the FDICthan banks with similar assets but with fewersuch liabilities. Conversely, the quantity ofsecured claims (or unsecured claims thatwould exit the bank prior to failure) has nomitigating effect on the FDIC’s loss.26 ThusBank B costs the FDIC the same as Bank A,even though Bank B has fewer insureddeposits.
In fact, under the current assessment scheme,the FDIC’s risk exposure is much higher forBank B than for Bank A or Bank C. Bank Cwould have the lowest assessment ratebecause of its stronger capital position. TheFDIC’s risk exposure would be the same forBank A and Bank B, but Bank B’sassessments would be 44 percent lower than
26 Except in the rare cases when losses exceed the sumof domestic deposits and all creditor classes paid afterdomestic deposits.
Bank A Bank B Bank CTotal Assets $100 $100 $100Liabilities: Secured claims 2 42 2 Domestic deposits 90 50 83 Unsecured claims 2 2 2 Subordinated claims 0 0 3 Total Liabilities 94 94 90Capital 6 6 10
Balance Sheet for Three Example Banks(Dollars in Millions)
Loss % Total Loss % Total Loss % TotalStockholders 6 40% 6 40% 10 67%Subordinated claimants 0 0% 0 0% 3 20%Unsecured claimants 2 13% 2 13% 2 13%FDIC/unsinsured depositors 7 47% 7 47% 0 0% Total Losses 15 100% 15 100% 15 100%
Loss Distribution If Three Example Banks Failed(Dollars in Millions)
Bank A Bank B Bank C

Attachment E-3
73
Bank A because it held fewer domesticdeposits.
This also has implications at the fund level.The DRR is based upon domestic deposits,regardless of the composition of depositoryinstitutions’ balance sheets. Thus, if thebanking industry as a whole increases its useof secured borrowing, the BIF and the SAIFare exposed to higher levels of risk. If theindustry’s capital levels increase, the BIF andthe SAIF are exposed to less risk. Theseinfluences are not incorporated in the fundingrequirements for BIF and SAIF, leaving theFDIC vulnerable to significant changes in riskexposure.
Through most of the FDIC’s history, over 90percent of FDIC-insured banks’ liabilitieswere domestic deposits; therefore,distinctions unrelated to capital (which isalready part of the risk matrix) mattered little.However, by the 1970s, banks were beginning
to rely on other funding sources, and by 1990,domestic deposits made up only 74 percent oftotal liabilities of BIF-insured institutions. Asof year-end 1999, domestic deposits weredown to 60 percent of total liabilities for BIF-insured institutions. Even so, only 27 percentof FDIC-insured institutions had domesticdeposits of less than 90 percent of totalliabilities. Large institutions are more likelyto rely on non-deposit sources of funds. As ofDecember 1999, the average FDIC-insuredinstitution with assets over $1 billion held 72percent of total liabilities in domesticdeposits, whereas the average institutionunder $1 billion held 93 percent. Thrifts arealso more likely to rely on non-depositsources of funds. As of year-end 1999, therewere 398 thrifts, or 29 percent of SAIFmembers, with domestic deposits of less than80 percent of total liabilities; 716 BIFmembers (8 percent of all BIF members) helddomestic deposits in amounts less than 80percent of liabilities.

Attachment F-1
74
Attachment F
SIMULATIONS
F-1. Steady Premium System
The following table illustrates the differencebetween a steady premium system and actualfund performance since 1982. Table F-1.1(left side) simulates a steady premium of 8.33basis points for the period 1982 to 1999. (TheFDIC’s historical flat assessment rate of 8.33basis points actually remained in effect until1980.) Table F-1.1 (right side) shows whatactually occurred.
In actuality, premiums varied from .08 basispoints to 24.4 basis points, much more than inthe steady premium simulation. The steadypremium simulation and the actual reserveratio reached similar negative lows (-0.57percent and -0.36 percent, respectively), butthe BIF actually recapitalized in 1995, whilein the steady premium simulation the BIF hadreached only a 1.04 percent reserve ratio by1999.
A complete description of the simulations andmethodology is set forth in Attachment F-2.
Table F-1.1
Assessment Assessment Net Fund Reserve Effective Assessment Loss Fund Reserve
Scheme (bp) Revenue Income Balance Ratio Rate (bp) Revenue Provisions Balance Ratio1982 8.33 1,015 1,527 13,774 1.21% 7.7 1,013 126 13,771 1.21%1983 8.33 1,116 1,727 15,501 1.22% 7.1 1,051 675 15,429 1.22%1984 8.33 1,224 997 16,498 1.19% 8.3 1,322 1,633 16,529 1.19%1985 8.33 1,412 1,405 17,902 1.19% 8.3 1,433 1,569 17,957 1.19%1986 8.33 1,545 326 18,228 1.12% 8.3 1,517 2,869 18,253 1.12%1987 8.33 1,695 48 18,276 1.10% 8.3 1,696 2,997 18,302 1.10%1988 8.33 1,739 (4,276) 14,000 0.80% 8.3 1,773 6,298 14,061 0.80%1989 8.33 1,852 (886) 13,114 0.70% 8.3 1,885 3,811 13,210 0.70%1990 8.33 1,993 (10,064) 3,050 0.16% 12.0 2,855 12,133 4,044 0.21%1991 8.33 2,055 (14,292) (11,242) -0.57% 21.3 5,160 15,476 (7,028) -0.36%1992 8.33 2,030 3,470 (7,773) -0.40% 23.0 5,588 (2,260) (101) -0.01%1993 8.33 2,018 9,359 1,587 0.08% 24.4 5,784 (7,677) 13,122 0.69%1994 8.33 2,022 5,038 6,625 0.35% 23.6 5,591 (2,873) 21,848 1.15%1995 8.33 1,972 2,642 9,266 0.47% 12.4 2,907 (33) 25,454 1.30%1996 8.33 2,064 3,453 12,720 0.63% 0.24 73 (325) 26,854 1.34%1997 8.33 2,200 3,682 16,401 0.80% 0.08 25 (504) 28,293 1.38%1998 8.33 2,317 3,674 20,075 0.94% 0.08 22 (38) 29,612 1.38%1999 8.33 2,488 2,324 22,400 1.04% 0.11 33 1,169 29,414 1.36%
Average 8.33 1,820 9.90 2,207Total 32,758 39,727
BIF Simulation Results: Risk-Related Assessments BIF Actual Results
(Dollars in millions)
Bank Insurance Fund, 1982 - 1999

Attachment F-2
75
F-2. Simulation of Risk-RelatedPremiums, 1982 to 1999
The FDIC constructed a spreadsheet-basedmodel to simulate the effects on the BIF ifrisk-related premiums had been in effect forthe entire period of 1982 through 1999. Risk-related premiums actually were implementedat the beginning of 1993. In the BIF’sexperience, bank failures and insurance lossesaccelerated through the 1980s and early1990s, driving the BIF balance to a negative$7 billion at year-end 1991. The FDIC’shistorical flat assessment rate of 8.3 basispoints remained in effect until 1990, when aseries of increases eventually raised the rateto 23 basis points for 1992. In 1993, risk-related premiums ranged from 23 to 31 basispoints, falling to 4 to 31 basis points in 1995when the BIF was recapitalized, and then to 0to 27 basis points since the beginning of1996.
The model generally operates under today’sassessment statutes, barring the FDIC fromassessing 1A-rated institutions if the BIFreserve ratio is at or above the DRR of 1.25percent, and requiring a minimum assessmentrate of 23 basis points if the reserve ratio fallsbelow 1.25 percent.
The major assumptions and caveats aresummarized below, followed by a discussionof the model’s results.
Assumptions
Assessment ratings. In years prior to 1993,when risk-related premiums wereimplemented, assessment ratings weredetermined using the most recent examinationcomposite rating for the supervisory subgroupand the examination rating for the capitalcomponent for the capital category. In each
case, exam ratings of 1 and 2 are in category1, 3s are in category 2, and 4s and 5s are incategory 3. The decision to use the examcapital rating was based on an analysis of thedistribution of capital ratings in the risk-related premium matrix when it was firstimplemented on January 1, 1993. Rather thanimposing current capital standardsretroactively, the use of historicalexamination ratings provides contemporarystandards for prior years. The model showssomewhat more lower-rated institutions forthe years 1982 to 1992 than there actuallywere in 1993 through 1999, but this, at leastin part, reflects the relative health of theindustry during the two time periods.
Assessment rates. Under current assessmentauthority, the FDIC can raise rates to amaximum range of 9 to 36 basis pointswithout a rulemaking. This rate matrix isshown in Table F-2.1. The highest rate evercharged to 1A institutions was 23 basispoints, which is also the statutory minimumwhen the fund faces an actual or projectedshortfall below the DRR (1.25 percent). Themaximum rate range used in the model is 23to 36 basis points, as seen in Table F-2.2.
Table F-2.1
Table F-2.2
Capital
Category A B C1 9 12 262 12 19 333 19 33 36
Supervisory Subgroup
Highest Rate Schedule Under Existing Assessment Authority
CapitalCategory A B C
1 23 24 312 24 28 353 28 35 36
Supervisory Subgroup
Highest Rate ScheduleUsed in the Simulation

Attachment F-2
76
Table F-2.2 preserves the same proportionalincreases for each cell as in Table F-2.1,rounded to the nearest basis point. Forexample, in Table F-2.1 the increase from 1Ato 1B is 3/17ths of the increase from 1A to1C. This proportional increase was applied inTable F-2.2. Intermediate schedules (10 to36, 11 to 36, etc.) were calculated in thismanner, which is necessary because theoverall spread, from 1A to 3C, compressesfrom 27 basis points in Table F-2.1 to 13basis points in Table F-2.2.
Income statement. The FDIC’s operatingexpenses, loss provisions and other income(from sources other than assessments andinvestment earnings) are unadjusted.Investment earnings are adjusted to reflectchanges in the size of the portfolio ifsimulated assessment revenue is greater thanor less than actual assessment revenue. Theportfolio yield is the average annual yield offive-year U.S Treasury securities.
Miscellaneous. The model is based on annualand year-end data. Annual assessmentrevenue is based on the prior year-endassessment base. Assessments actually werecollected semiannually prior to 1995 andquarterly thereafter. Insured branches offoreign banks (IBAs), which currently hold$1.3 billion in BIF-insured deposits, wereexcluded from the model because of missingdata in earlier time periods.
Caveats
When risk-related premiums are in effect,incentives to avoid higher premiums canaffect institution behavior. Applyingstandards retroactively is likely to overstateassessment revenue because many institutionslikely would have acted as necessary to meet
higher standards in order to reduce theirassessments.
If some banks had raised their capital to meetassessment standards, fewer failures mayhave resulted. On the other hand, if banks didnot raise capital and were charged higherpremiums, more failures could have resulted.This model makes no attempt to measurethese dynamic, offsetting effects. Rather, it isassumed that banks would not make changesto reduce their assessments and that changesin assessments would not affect BIF losses.
The FDIC’s average investment portfolioyield would be expected to vary due toliquidity needs and portfolio balance, but noadjustments were made to reflect this in themodel.
Summary of Results
Subject to the assumptions and caveatsdiscussed above, the model shows that hadrisk-related premiums been applied for theentire period 1982 to 1999, the collection ofsubstantially higher assessment revenueswould have started in 1986 rather than 1990,and BIF insolvency would have been avoided.In the simulation, the BIF reserve ratiobottoms out at positive 0.35 percent in 1991,and recapitalization essentially is achieved byyear-end 1993. In actuality, the BIF reserveratio reached a low of negative 0.36 percentin 1991, and the fund was not recapitalizeduntil 1995.
By law, the FDIC was limited to chargingassessment rates of 8.3 basis points through1989 and 12 basis points in 1990. The FDICused its discretion to increase the rate to 19.5basis points at the beginning of 1991, themaximum permissible increase, and again to23 basis points at mid-year 1991, where itremained through 1992. Risk-related

Attachment F-2
77
premiums, ranging from 23 to 31 basis points,were implemented in 1993. In the simulation,maximum rates (23 to 36 basis points) werecharged earlier, from 1988 through 1992, asthe industry and the insurance fund weredeteriorating. BIF rates actually did not reach23 basis points until 1991, the year the fundbecame insolvent.
In the model’s 18-year span, total assessmentrevenue was $41.5 billion and the weighted-average annual assessment rate was 10.33basis points. In the BIF’s actual experienceduring this period, assessment revenue totaled$39.7 billion and the weighted averageassessment rate was 9.90 basis points. With ahigher maximum assessment rate of 36 basispoints, the model’s annual assessmentrevenue peaked at $6.4 billion in 1992,compared to an actual peak of $5.8 billion in1993, when a maximum rate of 31 basispoints was in effect. The model’s higherassessment revenue also is attributable togreater numbers of institutions in the higherrate categories from 1982 to 1992 than in lateryears, when actual risk-based incentives werein place.
In the model, the reserve ratio jumps from1.24 percent to 1.42 percent in 1994 because
Table F-2.3
the fund essentially had been recapitalized inthe preceding year but the BIF had asubstantial reversal of loss reserves—$2.9billion—in 1994. In the model, premiumswere set at the minimum range of 0 to 27basis points for 1994, but the negative lossprovision greatly boosted net income andcaused the overcapitalization. In actuality,the BIF’s largest recoveries of loss reserveswere completed prior to the fund’srecapitalization in 1995. In both thesimulated and actual results, post-recapitalization increases in the reserve ratioswere attributable to high investment earningsand low insurance losses.
In maintaining the reserve ratio at 1.25percent in the years 1982 through 1987, themodel shows considerable volatility inassessment rates, as one would expect in a“pay-as-you-go” assessment scheme. In mostother years of the simulation, rates were at themaximum or minimum permitted levels.
Simulation results and actual results aresummarized in Table F-2.3. It is important toreiterate that it was assumed that (1)institutions would not have behaveddifferently in years before the actualimplementation of risk-related premiums in
Assessment Effective Assessment Net Fund Reserve Effective Assessment Loss Fund Reserve
Schedule (bp) Rate (bp) Revenue Income Balance Ratio Rate (bp) Revenue Provisions Balance Ratio
1982 11 - 36 11.7 1,494 2,037 14,283 1.26% 7.7 1,013 126 13,771 1.21%1983 5 - 32 6.8 956 1,558 15,841 1.25% 7.1 1,051 675 15,429 1.22%1984 10 - 36 12.5 1,979 1,798 17,639 1.27% 8.3 1,322 1,633 16,529 1.19%1985 4 - 31 7.1 1,255 1,240 18,879 1.26% 8.3 1,433 1,569 17,957 1.19%1986 13 - 36 15.4 2,988 1,821 20,700 1.27% 8.3 1,517 2,869 18,253 1.12%1987 5 - 32 8.3 1,707 60 20,760 1.25% 8.3 1,696 2,997 18,302 1.10%1988 23 - 36 23.8 5,129 (743) 20,017 1.14% 8.3 1,773 6,298 14,061 0.80%1989 23 - 36 23.5 5,415 2,828 22,846 1.22% 8.3 1,885 3,811 13,210 0.70%1990 23 - 36 24.0 5,830 (6,066) 16,780 0.87% 12.0 2,855 12,133 4,044 0.21%1991 23 - 36 25.8 6,326 (9,864) 6,917 0.35% 21.3 5,160 15,476 (7,028) -0.36%1992 23 - 36 26.3 6,390 7,964 14,881 0.76% 23.0 5,588 (2,260) (101) -0.01%1993 2 - 29 5.9 1,427 8,753 23,634 1.24% 24.4 5,784 (7,677) 13,122 0.69%1994 0 - 27 1.4 331 3,291 26,925 1.42% 23.6 5,591 (2,873) 21,848 1.15%1995 0 - 27 0.5 118 727 27,652 1.42% 12.4 2,907 (33) 25,454 1.30%1996 0 - 27 0.20 52 1,379 29,032 1.45% 0.24 73 (325) 26,854 1.34%1997 0 - 27 0.09 24 1,438 30,470 1.48% 0.08 25 (504) 28,293 1.38%1998 0 - 27 0.07 19 1,317 31,787 1.48% 0.08 22 (38) 29,612 1.38%1999 0 - 27 0.10 30 (201) 31,585 1.46% 0.11 33 1,169 29,414 1.36%
10.33 2,304 9.90 2,207.08 41,470 39,727.45
Average
Total
Simulation Results: Risk-Related Assessment Scheme Actual Results
Bank Insurance Fund, 1982 - 1999(Dollars in millions)

Attachment F-2
78
1993, and (2) changes in assessments did notcause more or fewer failures in any givenyear. Table F-2.4 presents simulation resultsfor the same time period for a flat-rate
Table F-2.4
premium of 8.33 basis points. It shows thefund reaching a deeper deficit in 1991(negative 0.57 percent) and failing torecapitalize by the end of 1999.
Assessment Assessment Net Fund Reserve Effective Assessment Loss Fund Reserve
Rate (bp) Revenue Income Balance Ratio Rate (bp) Revenue Provisions Balance Ratio
1982 8.33 1,015 1,527 13,774 1.21% 7.7 1,013 126 13,771 1.21%1983 8.33 1,116 1,727 15,501 1.22% 7.1 1,051 675 15,429 1.22%1984 8.33 1,224 997 16,498 1.19% 8.3 1,322 1,633 16,529 1.19%1985 8.33 1,412 1,405 17,902 1.19% 8.3 1,433 1,569 17,957 1.19%1986 8.33 1,545 326 18,228 1.12% 8.3 1,517 2,869 18,253 1.12%1987 8.33 1,695 48 18,276 1.10% 8.3 1,696 2,997 18,302 1.10%1988 8.33 1,739 (4,276) 14,000 0.80% 8.3 1,773 6,298 14,061 0.80%1989 8.33 1,852 (886) 13,114 0.70% 8.3 1,885 3,811 13,210 0.70%1990 8.33 1,993 (10,064) 3,050 0.16% 12.0 2,855 12,133 4,044 0.21%1991 8.33 2,055 (14,292) (11,242) -0.57% 21.3 5,160 15,476 (7,028) -0.36%1992 8.33 2,030 3,470 (7,773) -0.40% 23.0 5,588 (2,260) (101) -0.01%1993 8.33 2,018 9,359 1,587 0.08% 24.4 5,784 (7,677) 13,122 0.69%1994 8.33 2,022 5,038 6,625 0.35% 23.6 5,591 (2,873) 21,848 1.15%1995 8.33 1,972 2,642 9,266 0.47% 12.4 2,907 (33) 25,454 1.30%1996 8.33 2,064 3,453 12,720 0.63% 0.24 73 (325) 26,854 1.34%1997 8.33 2,200 3,682 16,401 0.80% 0.08 25 (504) 28,293 1.38%1998 8.33 2,317 3,674 20,075 0.94% 0.08 22 (38) 29,612 1.38%1999 8.33 2,488 2,324 22,400 1.04% 0.11 33 1,169 29,414 1.36%
Average 8.33 1,820 9.90 2,207
Total 32,758 39,727
Actual ResultsSimulation Results: Steady Premium
Bank Insurance Fund, 1982 - 1999(Dollars in millions)

Attachment F-3
79
F-3. Optimal Fund Size and PremiumAdjustment Simulations
This attachment provides a summary andrecommendations of a more extensive,ongoing analysis that explores mechanismsfor moderating premium volatility bytolerating larger swings in the reserve ratio.
The foundation used in this analysis todevelop a minimum optimal fund size(MOFS) is taken from the contingent claimsmodeling of Robert Merton. This approachprovides a natural methodology to determinethe size a fund or risk capital ought to be inorder to provide support for expected lossesto the FDIC arising from bank failures.Conceptually, the MOFS is the presentdiscounted value of the expected losses to theFDIC in perpetuity—this is the actuarially fairvalue of the losses indefinitely. Assumingthat the rate of growth of deposits, rate ofreturn on investments in Treasury securities,and long-run expected loss rate are constantin perpetuity, a simple relationship for aMOFS rate can be derived. Representative
Table F-3.1
values for MOFS are presented in Table F-3.1 for a variety of deposit growth rates andexpected loss rates.
The MOFS presents a conceptual solution tothe problem of fund size, but does not addresshow the FDIC should manage the fund andpremium assessments from year to year, asbank failures and attendant losses ebb andflow. To address this problem, the studyprovides a Monte Carlo analysis of the fundbalance relative to domestic deposits. Itassumes a constant premium on deposits of8.33 basis points, a constant ratio of expensesto domestic deposits, a 6 percent return oninvestments, a lognormal distribution for thelosses to total deposits using the mean andstandard deviation based on observationsfrom 1980 to 1999, and a normal distributionfor the domestic deposit growth rate assuminga 2 percent average and standard deviation.
Two adjustment rules were simulated: thefirst with a 23 basis points cap and the secondwith a 15 basis points cap with both having a4 basis points floor. In both cases, premium
Premium
(bp) -2.0 -1.0 0.0 1.0 2.0 3.0 4.0 5.0
1 0.12 0.14 0.17 0.20 0.26 0.34 0.52 1.052 0.25 0.28 0.33 0.40 0.51 0.69 1.04 2.103 0.37 0.42 0.50 0.61 0.77 1.03 1.56 3.154 0.49 0.57 0.67 0.81 1.02 1.37 2.08 4.205 0.61 0.71 0.83 1.01 1.28 1.72 2.60 5.256 0.74 0.85 1.00 1.21 1.53 2.06 3.12 6.307 0.86 0.99 1.17 1.41 1.79 2.40 3.64 7.358 0.98 1.13 1.33 1.62 2.04 2.75 4.16 8.409 1.10 1.27 1.50 1.82 2.30 3.09 4.68 9.4510 1.23 1.41 1.67 2.02 2.55 3.43 5.20 10.5011 1.35 1.56 1.83 2.22 2.81 3.78 5.72 11.5512 1.47 1.70 2.00 2.42 3.06 4.12 6.24 12.6013 1.59 1.84 2.17 2.63 3.32 4.46 6.76 13.65
Note: The BIF ratio of domestic deposits as of March 31, 2000, was 96 basis points, or .96 percent.
Deposit Growth Rate (%)
MOFS per Domestic Deposits (%)( 6 percent risk-free rate)

Attachment F-3
80
adjustments will not take place unless thefund balance relative to domestic deposits is± 21 basis points from the fund target of 100basis points (near the 1999 value) and willmove by only ± 11 basis points for a singlechange. Premiums can go no lower than 4basis points when the fund balance is lessthan 11 basis points from the target. If thefund balance is within the ± 11 basis pointsrange, the premium will revert to its initialvalue of 8.33 basis points. For eachsimulation, there were 300 runs of 120periods (years).
The results for the 23 basis point rule are that,over 300 simulations of 125 periods each,premiums average 7 basis points to 8.21 basispoints. In addition, premium changes are notfrequent and tend to be clustered when thereare large changes in the fund balance due tolosses. Furthermore, under this rule the fundbalance never falls below or reaches zero.(Chart F-3.1 shows a typical simulationoutcome.)
Chart F-3.1
For this rule, the adjustment properties of thefund balance are asymmetric. That is, whenthe fund is below the target the adjustment ismore rapid than when it is above.Additionally, the fund at times, for the 90percent of the simulations that show a stablefund balance over 60 periods (years), will riseto large values in the neighborhood of 250basis points of domestic deposits. Thisasymmetric behavior strongly suggests that,without a zero premium or rebate system, thefund balance will need to be allowed tomigrate to comparatively high levels such as250 basis points of domestic depositsbecause, as the simulations show, lowpremiums combined with possible seriousdistress in the banking system, will tend tobring the fund balance back to the target.However, by following this approach, as thisrule does, it may take years for the fund toreturn to the target level when it exceeds it bysignificant amounts.
Fund Balance Monte Carlo Simulation with 23 bp Maximum PremiumS im u lat e d F und B alanc e pe r D o l lar o f D o m e s t ic D e po s it s
L im it s P lac e d o n P re m ium s and A djus t m e nt R at e s t o t he T arge t F und( de c im al)
0.000
0.005
0.010
0.015
0.020
0.025
0.030
0.035
0.040
0 10 20 30 40 50 60 70 80 90 100 110 120 130
Period
De
cim
al

Attachment F-3
81
The second rule sets the maximum premiumat 15 basis points, while maintaining theminimum at 4 basis points and the sameadjustment process as for the first rule. Atypical result is shown in Chart F-3.2.Generally, the results of the over 300simulations of 125 periods each are thatpremiums average much closer to the initial8.33 basis points and do not as frequentlyreach as low as 4 basis points than with thefirst rule. In addition, premium changes aremore frequent than for the 23 basis pointsmaximum rule and tend to be clustered whenthere are large changes in the fund balancedue to losses. Like the first rule, the fundbalance never falls below or reaches zero.
Compared with the first rule, the adjustmentproperties of the fund balance with the 15basis point maximum premium are lessasymmetric. As expected, when the fund isbelow the target for the 15 basis pointsmaximum rule it adjusts less rapidly thanwhen it is above, but at a much slower rate
Chart F-3.2
than for the 23 basis points maximum rule.Additionally, the fund, for 93 percent of thesimulations, shows a stable fund balance over60 periods (years) that will rise to values ofabout 180 basis points, much less than the250 basis points values reached under the firstrule. Like the first rule, this asymmetricbehavior strongly suggests that, without azero premium or rebate system, the fundbalance will need to be allowed to migrate tocomparatively high levels such as 180 basispoints of domestic deposits. As thesimulations show, low premiums, combinedwith possible serious distress in the bankingsystem, will tend to bring the fund balanceback toward the target. However, byfollowing this approach, as the rule does, itmay take years for the fund to return to thetarget level when it exceeds it by significantamounts.
Based on these simulations and the analysisof a single premium adjustment rule, a long-run strategy to manage the BIF, with positivepremiums and without large and/or frequent
Fund Balance Monte Carlo Simulation with 15 bp Maximum PremiumS im u lat e d F und B alanc e pe r D o llar o f D o m e s t ic D e po s it s
L im it s P lac e d o n P re m ium s and A djus t m e nt R at e s t o t he T arge t F und( de c im al)
0.000
0.005
0.010
0.015
0.020
0.025
0.030
0.035
0.040
0 10 20 30 40 50 60 70 80 90 100 110 120 130
Period
De
cim
al

Attachment F-3
82
changes in premiums, is to let the fundbalance rise or fall without regard to size.The asymmetry of the fund balanceadjustments of the proposed rule is due to theability to charge 23 basis points when thefund falls severely below the target. Oneoption is to reduce this upper limit to somesmaller value such as 15 basis points. Asshown by the simulations, this option slowsthe return of the fund to its long-run averagewhen it falls below the target compared to the23 basis points maximum rule, reduces theburden on banks when the fund is “under-capitalized,” and reduces the number ofperiods the fund is over twice the target
balance. In any event, the results of thisMonte Carlo analysis are suggestive of moreexperiments that might be conducted to betterunderstand the effects on the fund ofalternative premium adjustment rules so as tochoose the one that may best fit the manyeconomic and political constraints. Withoutquestion, however, these results clearlydemonstrate that, based on the most recenttwenty years of loss experience, a rule can beestablished that can always charge positivepremiums, avoid a negative or zero fundbalance, and avoid frequent or large premiumchanges.

Attachment G
83
Attachment G
EFFECT OF A COVERAGE LIMIT INCREASE TO $200,000ON BANKS OF DIFFERENT ASSET SIZES
An increase in coverage from $100,000 to$200,000, in order to reflect consumer priceinflation since 1980, would affect financialinstitutions differently, depending on thenumber and amount of uninsured depositsheld. Doubling insurance coverage would notincrease insured deposits initially by morethan $400 billion. This $400 billion amountis an upper bound. It assumes no balancesexceeding $100,000 are currently insured andthat deposits are evenly distributed acrossaccounts greater than $100,000, thusmaximizing the potential effect. The bestestimate of the impact of doubling coverage isthat it would increase insured deposits by$270 billion, as reported in the options paper.The $400 billion upper bound is used in whatfollows only because it is more amenable toanalysis.
The $400 billion upper bound is obtainedfrom March 31, 2000, bank Call Reports. On
Chart G-1.1
a bank-by-bank basis, uninsured depositamounts were divided by the number of largedeposit accounts to produce an averageuninsured amount per account per bank. Ifthe average uninsured amount was over$100,000 (meaning the average large accountbalance was over $200,000), it was assumedthat an increase in the coverage limit to$200,000 would increase insured deposits by$100,000 multiplied by the number of suchaccounts. There were 3.5 million suchaccounts. For banks where the averageuninsured amount was under $100,000(meaning the average large account balancewas between $100,000 and $200,000), theaverage uninsured amount per account wasused. It was assumed that an increase in thecoverage limit to $200,000 would increaseinsured deposits by the average uninsuredamount per account times the number of suchaccounts at these banks. There wereapproximately one million such accounts.
������������������������������������������������������������������������������������������������������������������������������������������������������
�����������������������������������������������������������������������������������������������������������������������
������������������������������������������������������������
����������������������������������������������������������������������������������������������������������������������������������������������������������������������������������������������������������������
Upper Bound Analysis of Increased CoverageA m o unt o f In s u re d D e po s it s by Ins t i t u t io n A s s e t S ize ,
B as e d o n an In c re as e in C o v e rage f ro m $ 100,000 t o $ 200,000
-
200,000
400,000
600,000
800,000
1,000,000
1,200,000
1,400,000
1,600,000
Under $1 B illion $1B illion to $10 B illion $10 B illion to $20 B illion Over $20 B illion
Total Assets
$ o
f In
su
red
De
po
sit
s(i
n M
illio
ns
)
Insured Deposits as ofMarch 31, 2000������
������ Insured Deposits w ithCoverage Increased to$200,000

Attachment G
84
For illustrative purposes, if we use the $400billion upper bound, and the averageuninsured amounts per account per bank, wecan calculate the impact of an increase incoverage on banks of different asset sizes.Applying the average to all accountsobviously is a potential source of error but,again, the intent is only to illustrate the upperextreme, and not to estimate the real impact.
Chart G-1.1 (see previous page) shows thelevel of insured deposits for banks and thriftsbroken down by asset size. The chartcompares insured deposit levels as of March31, 2000, with the amount that would beinsured if the doubling of the coverage levelresulted in a $400 billion increase in insureddeposits under the above assumptions. Basedon an absolute dollar amount, banks with totalassets over $20 billion would receive thelargest increase in insured deposits, but notthe largest percentage increase.
Chart G-1.2 illustrates the relative impact ofan increase in coverage on financialinstitutions by asset size. The chart showsthat small banks would receive a
disproportionate share of the benefits of anincrease in coverage limits. Banks with totalassets under $1 billion hold 17 percent ofuninsured deposits as of March 31, 2000, butwould receive 27 percent of the additionalinsurance coverage in this "upper bound"exercise. Conversely, banks with total assetsover $20 billion hold 55 percent of uninsureddeposits, but would receive only 45 percent ofthe additional coverage amount. Thisdifference in the effects of higher insurancecoverage is a function of the composition ofthese banks’ deposits. Smaller banks, ingeneral, have lower average balances perlarge account, which means more of theaccounts, relatively speaking, will benefitfrom increased coverage. Large banks havemuch higher average balances in their largeaccounts, so there are proportionately feweraccounts that are receiving an increasedbenefit.
This analysis suggests that small banks willbe more favorably affected than large banksby an increase in the coverage limit, at least inthe near term.
Chart G-1.2
�������������������������������������������������������������������������������������������
�������������������������������������������������������������������������������������
������������������������������������������������
������������������������������������������������������������������������������������������������������������������������������������������������������
Upper Bound Analysis of Increased CoverageS m all B anks Wo u ld R e c e iv e a D is pro po rt io nat e S hare o f t h e Inc re as e in Ins ure d
D e po s it s *
-
10.0
20.0
30.0
40.0
50.0
60.0
Under $1 B illion $1B illion to $10 B illion $10 B illion to $20 B illion Over $20 B illion
Asset Size
Pe
rce
nt
Percent of Uninsured DepositsHeld, as of March 31, 2000����
���� Percent of Additional CoverageReceived
*Based on an Increase in Coverage from $100,000 to $200,000