FEDERAL DEBT: MARKET STRUCTURE AND ECONOMIC USES … (Federal Debt Market... · FEDERAL DEBT:...
49
FEDERAL DEBT: MARKET STRUCTURE AND ECONOMIC USES FOR U. S. TREASURY DEBT SECURITIES Chairman Jim Saxton (R-NJ) Joint Economic Committee United States Congress August 2001 Joint Economic Committee 1537 Longworth House Office Building Washington, DC 20515 Phone: 202-226-3234 Fax: 202-226-3950 Executive Summary This study provides an overview of federal debt – its history, its composition, its management, its economic uses, and a discussion of recent trends. The Continental Congress began issuing debt securities in 1776, and the United States has had outstanding debt ever since. The first Secretary of the Treasury Alexander Hamilton established sound goals and principles for debt management that transformed U.S. government debt from highly speculative and illiquid securities into the world’s safest and most liquid investment. Because of Hamilton’s visionary leadership, Treasuries developed a unique set of characteristics – default risk-free, a seamless yield curve, high liquidity, a deeply integrated market, and extremely low bid-ask spreads – that let Treasuries perform many economic functions other than financing past federal budget deficits. For example, the Federal Reserve uses Treasuries to conduct U.S. monetary policy. Foreign central banks hold Treasuries as a store of value and a means to intervene in foreign exchange markets. Treasuries are the premier “safe haven” investment during economic turbulence. Wall Street uses the Treasury yield curve as the default risk-free pricing benchmark, while Washington indexes its loans to students and farmers to Treasury yields. Treasuries collateralize approximately four-fifths of the transactions in the $2.5 trillion a day repurchase agreement (repo) market. Portfolio managers employ Treasuries for interest rate hedging or speculation and for improving risk-return trade-off in their portfolios. As a regulatory tool, the Pension Benefit Guaranty Corporation (PBGC) utilizes the 30-year Treasury bond yield to determine the funding adequacy of private defined-benefit pension plans, the payout amount if an employee leaves an employer sponsoring a defined-benefit pension plan before the normal retirement age, and the insurance premiums that sponsoring employers pay to the PBGC. As of March 31, 2001, the U.S. government had a gross debt of $5.8 trillion, of which $3.4 trillion or 59.5 percent was net debt held by the public and $2.3 trillion or 40.5 percent was held in intragovernmental accounts. Economists consider net debt rather than gross debt as the proper measure for federal debt. By March 31, 2001, budget surpluses beginning in fiscal year 1998 have reduced the net debt to GDP ratio to 33.5 percent. Consequently, the gross issuance of Treasury notes and bonds fell by 54 percent from 1996 to 2000. As the supply of Treasuries shrinks, the characteristics that made Treasuries the ideal financial instruments for so many economic functions are deteriorating. Little research has been published to date on the economic consequences of federal net debt reduction. Yet, during the next few years, the sharp decline in the supply of Treasuries may compel the Federal Reserve System, international official entities, and market participants to find substitutes that are, by definition, inferior in some way to Treasuries. Given the importance of Treasuries to the U.S. economy, and the projected reduction in federal net debt during the next decade, the following questions face U.S. policymakers: • What are the opportunity costs for federal debt reduction? Which provides greater benefits to the U.S. economy: a larger tax cut or a faster reduction in net debt? • Could excessive federal debt reduction decrease the efficiency of the American financial market and increase systemic risk? • Could excessive federal debt reduction hamper the Federal Reserve System’s execution of monetary policy? Will substituting other securities for Treasuries have unintended negative economic consequences? G-01 Dirksen Senate Office Building Washington, DC 20510 Phone: 202-224-5171 Fax: 202-224-0240 Internet Address: http://www.house.gov/jec
Transcript of FEDERAL DEBT: MARKET STRUCTURE AND ECONOMIC USES … (Federal Debt Market... · FEDERAL DEBT:...
FEDERAL DEBT: MARKET STRUCTURE AND ECONOMIC USES FOR U. S. TREASURY
DEBT SECURITIES
Chairman Jim Saxton (R-NJ)Joint Economic Committee
United States Congress
August 2001
Joint Economic Committee1537 Longworth House Office BuildingWashington, DC 20515Phone: 202-226-3234Fax: 202-226-3950
Executive SummaryThis study provides an overview of federal debt – its history, its composition, its management, its economic uses, and a
discussion of recent trends.The Continental Congress began issuing debt securities in 1776, and the United States has had outstanding debt ever since.
The first Secretary of the Treasury Alexander Hamilton established sound goals and principles for debt management that transformed U.S. government debt from highly speculative and illiquid securities into the world’s safest and most liquid investment. Because of Hamilton’s visionary leadership, Treasuries developed a unique set of characteristics – default risk-free, a seamless yield curve, high liquidity, a deeply integrated market, and extremely low bid-ask spreads – that let Treasuries perform many economic functions other than financing past federal budget deficits. For example, the Federal Reserve uses Treasuries to conduct U.S. monetary policy. Foreign central banks hold Treasuries as a store of value and a means to intervene in foreign exchange markets. Treasuries are the premier “safe haven” investment during economic turbulence. Wall Street uses the Treasury yield curve as the default risk-free pricing benchmark, while Washington indexes its loans to students and farmers to Treasury yields. Treasuries collateralize approximately four-fifths of the transactions in the $2.5 trillion a day repurchase agreement (repo) market. Portfolio managers employ Treasuries for interest rate hedging or speculation and for improving risk-return trade-off in their portfolios. As a regulatory tool, the Pension Benefit Guaranty Corporation (PBGC) utilizes the 30-year Treasury bond yield to determine the funding adequacy of private defined-benefit pension plans, the payout amount if an employee leaves an employer sponsoring a defined-benefit pension plan before the normal retirement age, and the insurance premiums that sponsoring employers pay to the PBGC.
As of March 31, 2001, the U.S. government had a gross debt of $5.8 trillion, of which $3.4 trillion or 59.5 percent was net debtheld by the public and $2.3 trillion or 40.5 percent was held in intragovernmental accounts. Economists consider net debt rather than gross debt as the proper measure for federal debt. By March 31, 2001, budget surpluses beginning in fiscal year 1998 have reduced the net debt to GDP ratio to 33.5 percent. Consequently, the gross issuance of Treasury notes and bonds fell by 54 percent from 1996 to 2000. As the supply of Treasuries shrinks, the characteristics that made Treasuries the ideal financial instruments for so many economic functions are deteriorating.
Little research has been published to date on the economic consequences of federal net debt reduction. Yet, during the next few years, the sharp decline in the supply of Treasuries may compel the Federal Reserve System, international official entities, and market participants to find substitutes that are, by definition, inferior in some way to Treasuries. Given the importance of Treasuries to the U.S. economy, and the projected reduction in federal net debt during the next decade, the following questions face U.S. policymakers:
• What are the opportunity costs for federal debt reduction? Which provides greater benefits to the U.S. economy: a larger tax cut or a faster reduction in net debt?
• Could excessive federal debt reduction decrease the efficiency of the American financial market and increase systemic risk?• Could excessive federal debt reduction hamper the Federal Reserve System’s execution of monetary policy? Will
substituting other securities for Treasuries have unintended negative economic consequences?
G-01 Dirksen Senate Office BuildingWashington, DC 20510Phone: 202-224-5171Fax: 202-224-0240Internet Address:
http://www.house.gov/jec

FEDERAL DEBT: MARKET STRUCTURE AND ECONOMIC USES FOR U.S. TREASURY
DEBT SECURITIES
Table of Contents
I. Introduction ......................................................................................1
A. New Fiscal Era ................................................................................................................... 1 B. Proper Definition of Federal Debt ..................................................................................... 2 C. Historical Background........................................................................................................ 3 D. Market and Economic Uses for Treasuries ........................................................................ 4 E. Lines of Inquiry ................................................................................................................... 5
II. U.S. Department of the Treasury Applies Hamilton’s Goals and Principles for Debt Management .....................................................6
III. Market for Treasuries .......................................................................9
A. Debt and Deficit ................................................................................................................ 11 B. Strips and Taxes on Treasuries......................................................................................... 13 C. Primary Market................................................................................................................. 14 D. Secondary Market ............................................................................................................. 16
IV. Economic Uses for Treasuries .......................................................17
A. Unique Characteristics ..................................................................................................... 17 B. Monetary Use.................................................................................................................... 20 C. International Uses............................................................................................................. 22 D. Benchmark Pricing ........................................................................................................... 23 E. Portfolio Management ...................................................................................................... 25 F. Regulatory Uses ................................................................................................................ 30
V. Recent Developments.....................................................................35
A. Primary Market Shrinkage ............................................................................................... 35 B. Secondary Market Disturbance ........................................................................................ 36
VI. Prospects.........................................................................................41
VII. Conclusion......................................................................................42
Appendix .................................................................................................44
References ...............................................................................................46

FEDERAL DEBT: MARKET STRUCTURE AND ECONOMIC USES FOR U.S. TREASURY
DEBT SECURITIES
A national debt, if it is not excessive, will be to us a national blessing. —Alexander Hamilton, first Secretary of the Treasury,
Letter to Robert Morris, April 30, 1791
The public debt is a public curse.
—James Madison, fourth President of the United States Letter to Henry Lee, April 13, 1790
I. Introduction
A. New Fiscal Era
At midnight on October 1, 1997, the United States passed from one fiscal era into another. For 58 of the previous 66 fiscal years, the U.S. government had run budget deficits. The last previous federal budget surplus had occurred in fiscal year 1969.1 Indeed, budget deficits had become so pervasive during the intervening fiscal years that many Americans doubted whether the federal budget would ever be balanced again. Yet far more quickly than some optimists had dared to hope, the deficit era yielded to the surplus era. The U.S. government ran a budget surplus of $69 billion or 0.8 percent of gross domestic product (GDP) in fiscal year 1998, $125 billion or 1.4 percent of GDP in fiscal year 1999, and $236 billion or 2.4 percent of GDP in fiscal year 2000.2 In January 2001, the Congressional Budget Office (CBO) estimated a $281 billion budget surplus for the current fiscal year 2001 and projected $5.6 trillion of cumulative budget surpluses for fiscal years 2002-11.3 After the CBO made this projection, the Economic Growth and Tax Relief Reconciliation Act of 2001 was enacted. Using static methods, the Joint Committee on Taxation projected that this Act would reduce federal revenues by $1.349 trillion during fiscal years 2001-11.4 Nevertheless, anticipated surpluses even after this tax reduction are so large that a substantial amount of federal net debt could still be retired in little more than a decade.
Because chronic federal budget deficits and federal debt accumulation were a part of the American landscape for so long, little research has yet been published on the economic consequences of large, recurring federal surpluses and the rapid reduction of federal debt. 1 Executive Office of the President, Office of Management and Budget, Budget of the United States, Fiscal Year 2002, Historical Tables, vol. 4 (Washington, D.C.: Government Printing Office, 2001), 4:21-22. 2 Budget Historical Tables, 4:21-24. 3 U.S. Congress, Congressional Budget Office, The Budget and Economic Outlook: Fiscal Years 2002-2011 (Washington, D.C.: Government Printing Office, 2001), 2. 4 U.S. Congress, Joint Committee on Taxation, Estimated Budget Effects of the Conference Agreement for H.R.1836. (May 26, 2001).
PAGE 2 A JOINT ECONOMIC COMMITTEE STUDY
Through this and subsequent studies, the Joint Economic Committee seeks to examine the market structure and economic uses for U.S. Treasury debt securities (Treasuries) and inform U.S. policymakers about the likely economic consequences of federal debt reduction.
B. Proper Definition of Federal Debt
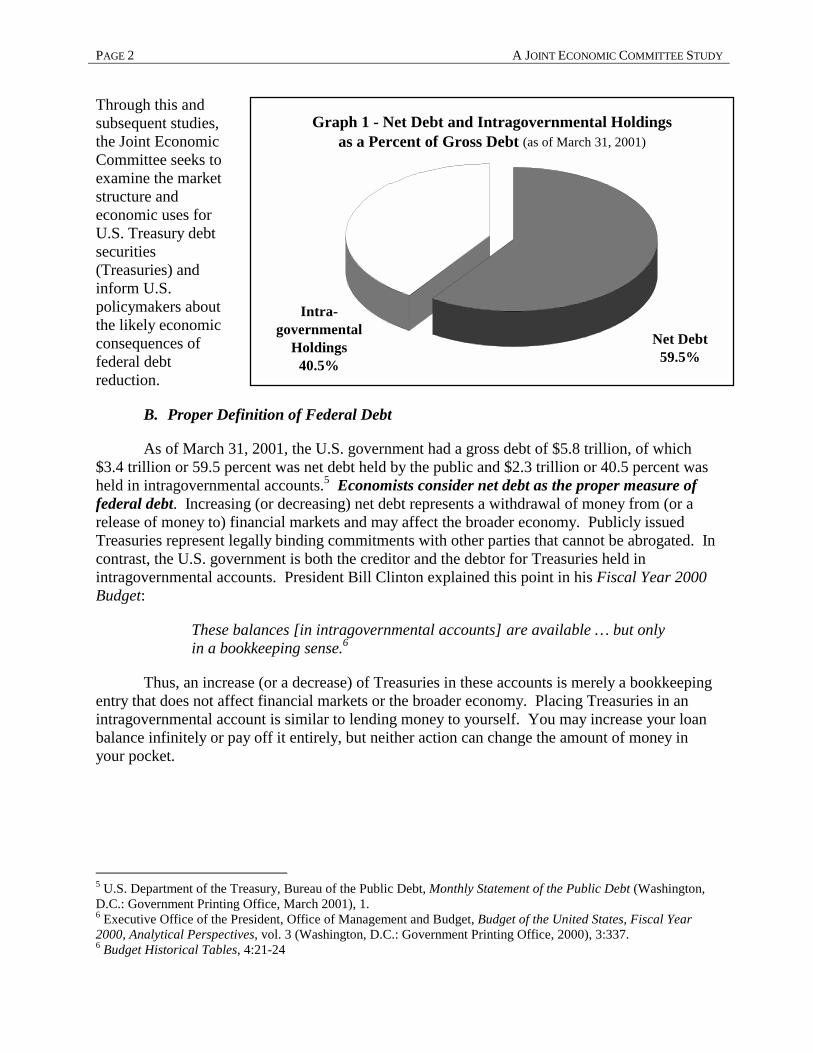
As of March 31, 2001, the U.S. government had a gross debt of $5.8 trillion, of which $3.4 trillion or 59.5 percent was net debt held by the public and $2.3 trillion or 40.5 percent was held in intragovernmental accounts.5 Economists consider net debt as the proper measure of federal debt. Increasing (or decreasing) net debt represents a withdrawal of money from (or a release of money to) financial markets and may affect the broader economy. Publicly issued Treasuries represent legally binding commitments with other parties that cannot be abrogated. In contrast, the U.S. government is both the creditor and the debtor for Treasuries held in intragovernmental accounts. President Bill Clinton explained this point in his Fiscal Year 2000 Budget:
These balances [in intragovernmental accounts] are available … but only in a bookkeeping sense.6
Thus, an increase (or a decrease) of Treasuries in these accounts is merely a bookkeeping entry that does not affect financial markets or the broader economy. Placing Treasuries in an intragovernmental account is similar to lending money to yourself. You may increase your loan balance infinitely or pay off it entirely, but neither action can change the amount of money in your pocket.
5 U.S. Department of the Treasury, Bureau of the Public Debt, Monthly Statement of the Public Debt (Washington, D.C.: Government Printing Office, March 2001), 1. 6 Executive Office of the President, Office of Management and Budget, Budget of the United States, Fiscal Year 2000, Analytical Perspectives, vol. 3 (Washington, D.C.: Government Printing Office, 2000), 3:337. 6 Budget Historical Tables, 4:21-24
Graph 1 - Net Debt and Intragovernmental Holdingsas a Percent of Gross Debt (as of March 31, 2001)
Net Debt59.5%
Intra-governmental
Holdings40.5%

FEDERAL DEBT PAGE 3
C. Historical Background
The Continental Congress began issuing debt securities in 1776, and the United States has had debt securities outstanding in global financial markets ever since.7 After the Continental Congress failed to service U.S. Revolutionary War debts fully and promptly, the first Secretary of the Treasury Alexander Hamilton restored U.S. credibility in global financial markets by establishing sound principles and goals for debt management that transformed U.S. debt from a highly speculative and illiquid security into the safest and most liquid investment in the world.
Prior to the Great Depression, federal net debt rose sharply to finance wars and gradually declined afterward both in nominal dollars and as a percentage of national income. The Great Depression was the first peacetime period of sustained federal budget deficits. As a result, net debt had risen to $42.8 billion (nominal dollars) or 44.2 percent of GDP by the end of fiscal year 1940.8 World War II financing hiked net debt to $241.9 billion (nominal dollars) or 108.6 percent of GDP by the end of fiscal year 1946.9 Through fiscal year 1974, net debt rose slightly to $343.7 billion (nominal dollars), but the net debt to GDP ratio fell to 23.8 percent, the lowest
7 For a brief time in 1836, the U.S. Department of the Treasury actually had funds available to pay off the entire net debt. However, some creditors were unwilling to redeem their Treasuries prior to maturity. Other Treasuries may have been lost or destroyed. Therefore, the U.S. government was never “out of debt” in 1836. The economic depression that began in 1837 sent the federal budget back into deficit, causing net debt to rise once again. 8 Budget Historical Tables, 4:116. 9 Budget Historical Tables, 4:116.
Graph 2 - Federal (Deficit) Surplus as a Percent of GDP
-35.0%
-30.0%
-25.0%
-20.0%
-15.0%
-10.0%
-5.0%
0.0%
5.0%
10.0%19
4019
4119
4219
4319
4419
4519
4619
4719
4819
4919
5019
5119
5219
5319
5419
5519
5619
5719
5819
5919
6019
6119
6219
6319
6419
6519
6619
6719
6819
6919
7019
7119
7219
7319
7419
7519
76 TQ19
7719
7819
7919
8019
8119
8219
8319
8419
8519
8619
8719
8819
8919
9019
9119
9219
9319
9419
9519
9619
9719
9819
9920
00
Fiscal Year
Perc
ent o
f GD
P
PAGE 4 A JOINT ECONOMIC COMMITTEE STUDY
ratio since before World War I.10 Large peacetime budget deficits from the mid-1970s through the mid-1990s drove both nominal net debt and the net debt to GDP ratio substantially higher. Net debt peaked at $3.773 trillion (nominal dollars) at the end of fiscal year 1998, while the net debt to GDP ratio topped out at 49.5 percent at the end of fiscal year 1993.11
D. Market and Economic Uses for Treasuries
Because of Hamilton’s visionary leadership, Treasuries became deeply woven into the economic fabric of America and indeed the world. Newly issued Treasuries are auctioned through the primary market, dominated by 25 primary dealers, and subsequently trade over the counter in the secondary market. As of March 31, 2001, $3.0 trillion of marketable Treasuries – bills, notes, and bonds – were outstanding.12 During 2000, the daily trading volume of Treasuries averaged $208.9 billion, far exceeded the average daily trading volume of federal agency debt securities, federal agency mortgage-backed securities, state and local government securities, and NYSE-listed corporate bonds combined.13
The unique characteristics of Treasuries – default risk-free status, a seamless yield curve, high liquidity, a deeply integrated market, and extremely low bid-ask spreads – allow Treasuries to perform many vital economic functions other than financing federal budget deficits. For example:
• The Federal Reserve System uses Treasuries for its open market operations to execute U.S. monetary policy and as collateral for U.S. currency in circulation.14
• Foreign currency boards hold Treasuries as reserves for their dollar-linked currencies. Foreign central banks and governments use Treasuries as a store of value and a vehicle to intervene in foreign exchange markets.
• International private investors are attracted to Treasuries as the premier “safe haven” investment during times of economic turbulence.
10 Budget Historical Tables, 4:116. 11 Budget Historical Tables, 4:116-7. 12 Monthly Statement of the Public Debt, 1. 13 Federal Reserve Bank of New York, Securities Report Division, Total Primary Dealer Transactions Volume in U.S. Government and Federal Agency Securities Market Share, February 1, 2001; Bond Market Association, Research Quarterly (February 2001): 5; and New York Stock Exchange, The Year 2000 in Review (New York: New York Stock Exchange, 2001), 92. Found online at http://www.nyse.com/pdfs/09_BONDS.pdf. 14 The Federal Reserve System seeks to balance the supply of money with the demand for money to achieve a stable price level over time. The Federal Reserve System expands the supply of money by purchasing Treasuries or other permissible debt securities. Its purchases increase the reserves held by banks that, in turn, make loans, expanding the money supply by a multiple of the increase in reserves. The Federal Reserve System may also expand the money supply temporarily through short-term transactions called repurchase agreements (repos). Conversely, the Federal Reserve System contracts the supply of money by selling Treasuries or other permissible debt securities and letting the process work in reserve. The Federal Reserve System may also contract the money supply temporarily through reverse repos (i.e., taking the opposite side of a repo transaction). The purchase and sale of Treasuries or other permissible debt securities and the use of repos and reverse repos by the Federal Reserve System to conduct monetary policy is known as open market operations.
FEDERAL DEBT PAGE 5
• Both Wall Street and Washington use Treasury yields as default risk-free pricing benchmarks. Investment bankers price other debt securities in relations to Treasury yields. The U.S. government indexes interest rates on its direct loans to farmers and college students to Treasury yields. Likewise, untold millions of American homeowners have variable rate mortgage loans indexed to Treasury yields.
• Treasuries are indispensable to the smooth operation of financial markets. Treasuries collateralize approximately four-fifths of the transactions in the $2.5 trillion a day repurchase agreement (repo) market. Most interest rate hedging and speculation strategies employ Treasuries, Treasury futures, or options on Treasury futures. Treasuries allow investors to achieve superior risk-return trade-offs in their portfolios than would be possible without Treasuries.
• Treasuries are also employed as regulatory tools. Capital adequacy regulations encourage banking organizations to hold Treasuries. The Employee Retirement Security Act (ERISA) compels the Pension Benefit Guaranty Corporation (PBGC) to use the 30-year Treasury bond yield to determine the funding adequacy of private employer-sponsored defined-benefit pension plans, the payout amount if an employee leaves an employer sponsoring a defined-benefit pension plan before the normal retirement age, and the insurance premiums that sponsoring employers pay to the PBGC.
E. Lines of Inquiry By September 30, 2000, budget surpluses beginning in fiscal year 1998 have reduced both nominal net debt and the net debt to GDP ratio to $3.410 trillion (nominal dollars) and 34.7 percent, respectively.15 Consequently, the gross issuance of Treasury notes and bonds fell by 54 percent.16 Over the next decade, the sharp decline in the supply of Treasuries may compel the Federal Reserve System, international official entities, and market participants to find substitutes for Treasuries. Given the importance of Treasuries to the U.S. economy and the projected reduction of federal net debt during the next decade, the following questions will face U.S. policymakers:
15 Budget Historical Tables, 4:117. 16 Bond Market Association, Short- & Long-Term Issuance of U.S. Treasury Securities 1980-2000. Found online at http://www.bondmarkets.com/Research/TSYISSTLS.shtml.
Despite the clear advantages of paying down federal debt, I recognize that doing
so has some potential adverse consequences even before the difficulties
associated with government accumulation of private sector assets arise. The
Treasury market serves a number of useful purposes.
Alan Greenspan
Chairman of the Board of Governors of the
Federal Reserve System, Speech before the
Bond Market Association April 27, 2001
PAGE 6 A JOINT ECONOMIC COMMITTEE STUDY
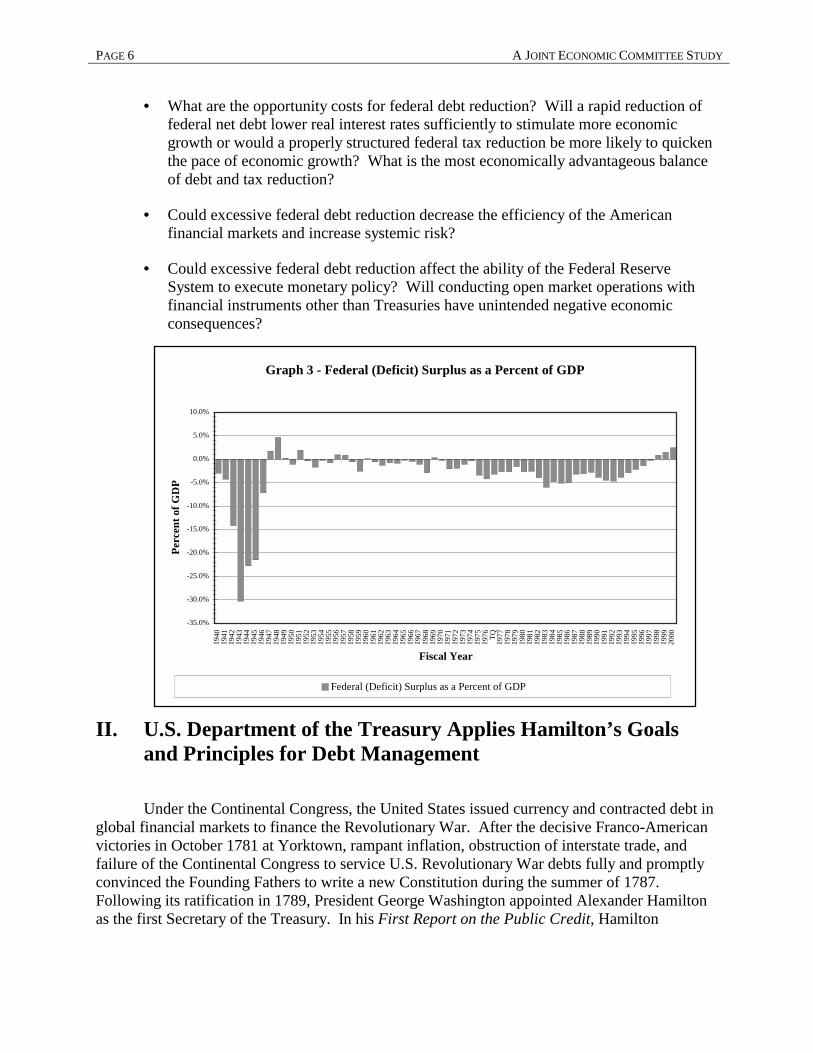
Graph 3 - Federal (Deficit) Surplus as a Percent of GDP
-35.0%
-30.0%
-25.0%
-20.0%
-15.0%
-10.0%
-5.0%
0.0%
5.0%
10.0%
1940
1941
1942
1943
1944
1945
1946
1947
1948
1949
1950
1951
1952
1953
1954
1955
1956
1957
1958
1959
1960
1961
1962
1963
1964
1965
1966
1967
1968
1969
1970
1971
1972
1973
1974
1975
1976 TQ
1977
1978
1979
1980
1981
1982
1983
1984
1985
1986
1987
1988
1989
1990
1991
1992
1993
1994
1995
1996
1997
1998
1999
2000
Fiscal Year
Perc
ent o
f GD
P
Federal (Deficit) Surplus as a Percent of GDP
• What are the opportunity costs for federal debt reduction? Will a rapid reduction of federal net debt lower real interest rates sufficiently to stimulate more economic growth or would a properly structured federal tax reduction be more likely to quicken the pace of economic growth? What is the most economically advantageous balance of debt and tax reduction?
• Could excessive federal debt reduction decrease the efficiency of the American financial markets and increase systemic risk?
• Could excessive federal debt reduction affect the ability of the Federal Reserve System to execute monetary policy? Will conducting open market operations with financial instruments other than Treasuries have unintended negative economic consequences?
II. U.S. Department of the Treasury Applies Hamilton’s Goals and Principles for Debt Management
Under the Continental Congress, the United States issued currency and contracted debt in global financial markets to finance the Revolutionary War. After the decisive Franco-American victories in October 1781 at Yorktown, rampant inflation, obstruction of interstate trade, and failure of the Continental Congress to service U.S. Revolutionary War debts fully and promptly convinced the Founding Fathers to write a new Constitution during the summer of 1787. Following its ratification in 1789, President George Washington appointed Alexander Hamilton as the first Secretary of the Treasury. In his First Report on the Public Credit, Hamilton
FEDERAL DEBT PAGE 7
established three policy goals for federal debt management that still guide the U.S. Department of the Treasury today:
(1) Achieving the lowest possible debt service cost,
(2) Ensuring access to unlimited credit in times of war or emergencies, and
(3) Promoting efficient capital markets.
Regarding the first two goals, Hamilton observed:
And as, on one hand, the necessity for borrowing in particular emergencies cannot be doubted, so, on the other hand, it is equally evident that, to be able to borrow upon good terms, it is essential that the credit of the nation should be well established.
For, when the credit of a country is in any degree questionable, it never fails to give an extravagant premium, in one shape or another, upon all the loans it has occasion to make. Nor does the evil end here; the same disadvantage must be sustained on whatever is to be bought on terms of future payment.
From this constant necessity of borrowing and buying dear, it is easy to conceive how immensely the expenses of a nation, in a course of time, will be augmented by an unsound state of public credit.17
Regarding the goal of promoting efficient capital markets, Hamilton noted:
The interest of money will be lowered by it … This circumstance will enable both the public and individuals to borrow on easier and cheaper terms.18
Congress approved Hamilton’s plan, known as assumption and funding.19 Hamilton expressly endorsed two of the five principles that still guide debt management at the Department of the Treasury and implicitly embraced the other three:
(1) Maintaining risk-free status,
(2) Unitary financing,
(3) Promoting market liquidity,
(4) Consistent and predictable issue, and
17 Alexander Hamilton, “First Report on the Public Credit,” in The Works of Alexander Hamilton, vol. 2, ed. Henry Cabot Lodge (New York: Haskell House Publishers Ltd., 1971), 2:228-29. 18 Hamilton, 2:233. 19 Forrest McDonald, Alexander Hamilton: A Biography (New York: W. W. Norton & Company, 1979), 163-188.
PAGE 8 A JOINT ECONOMIC COMMITTEE STUDY
(5) Financing across the yield curve.20
First, by insisting that Treasuries become “as good as gold,” Hamilton enshrined Treasuries as the world’s premier default risk-free financial asset:
It is a well-known fact, that in countries in which the national debt is properly funded, and an object of established confidence, it answers most of the purposes of money. Transfers of … public debt are there equivalent to payment in species.21
Second, by assuming the Revolutionary War debts incurred by the states, Hamilton also established the principle of unitary finance for federal responsibilities:
If all the public creditors receive their dues from one source, distributed with an equal hand, their interest will be the same. And, having the same interests, they will unite in support of the fiscal arrangements of the Government.22
The three remaining principles flow from Hamiltonian practice. A large market of dealers aggressively bidding for each new issue of Treasuries minimizes the U.S. government’s interest outlays. Financial services firms must make large commitments of their capital and human resources to deal in Treasuries. To justify their investments, the volume of Treasuries issued must be large enough for financial institutions to enjoy economies of scale in dealing. Issuing large quantities of Treasuries at predictable intervals guarantees that many dealers will aggressively bid on each Treasury issue. Intense competition among dealers channels the benefits from economies of scale through lower interest outlays to U.S. taxpayers.23
The liquidity of Treasuries also contributes to lower interest outlays. Because of their default risk-free characteristic, Treasuries can substitute for money as both a store of value and a medium of exchange. Unlike other debt securities, Treasuries are traded in all market conditions. Moreover, the trading volume is so large that no single trade, whatever its size, can much influence the market price of Treasuries. This liquidity characteristic attracts arbitragers, hedgers, and speculators who must be able to open and close large positions in a security quickly and without disturbing its price to Treasury market.24
20 Michael J. Paulus, Deputy Assistant Secretary for Federal Finance, U.S. Department of the Treasury, interview by author, Washington, D.C., April 11, 2000. 21 Hamilton, 2:233. 22 Hamilton, 2:246. 23 Paulus interview. 24 Paulus interview.
FEDERAL DEBT PAGE 9
Table 1 – Marketable vs. Non-Marketable Debt
Marketable debt – Marketable debt securities include all Treasuries that can be traded after their initial purchase. Virtually all of marketable debt is public debt. As of March 31, 2001, marketable debt was $3.018 trillion or 29.5 percent of GDP, of which $3.002 trillion or 99.5 percent was net debt and $15.5 billion or 0.5 percent was in intragovernmental holdings. The principal types of marketable public debt are bills, fixed-principal notes, fixed-principal bonds, inflation-indexed notes, and inflation-indexed bonds.
Non-marketable debt – Non-marketable debt securities include all Treasuries that cannot be traded after their initial purchase. As of March 31, 2001, non-marketable debt was $2.756 trillion or 26.9 percent of GDP, of which $432.6 billion or 15.7 percent was net debt and $2.323 trillion or 84.3 percent was in intragovernmental holdings.1 The two principal types of non-marketable net debt held by others are savings bonds and state and local government series bonds (Slugs). Other types of non-marketable net debt are domestic series bonds, foreign series bonds, and Rural Electrification Administration (REA) series bonds.
Sources: Monthly Statement of the Public Debt and Gross Domestic Product. The foreign series bonds were issued to foreign governments on several occasions between 1988 and 1993 to assist them in restructuring their existing obligations under so-called Brady plans. The proceeds of zeroes were pledged to pay the principal amount of bonds that were issued by the foreign governments. Rural Electrification Administration (REA) series bonds are issued to rural electric and telephone cooperatives as an investment instrument for unexpected loan proceeds from the Rural Electrification Administration.
Finally, the Department of the Treasury issues Treasuries in a variety of maturities from 13 weeks to 30 years. This practice is known as financing across the yield curve. Concentrating Treasuries in any one segment of the yield curve would expose U.S. taxpayers to unnecessary interest rate-risk. For example, suppose the Department of the Treasury chose to roll over all of its maturing debt in the form of short-term Treasury bills. If later short-term interest rates rose sharply, then U.S. taxpayers would bear the costs of higher interest outlays. Conversely, suppose the Department of the Treasury chose to roll over all of its maturing debt in 30-year Treasury bonds. If long-term interest rates subsequently fell, then the Department of the Treasury would have locked U.S. taxpayers into paying above-market coupon rates and unnecessarily increasing interest outlays. To minimize such exposure to interest rate risk over the years, the Department of the Treasury purposefully issues a balanced portfolio of short-, medium-, and long-term Treasuries.25
III. Market for Treasuries The U.S. government has had debt securities outstanding since America’s founding in 1776. Prior to the Great Depression, federal net debt rose sharply to finance wars and gradually declined afterward both in nominal dollars and as a percentage of national income. The Great Depression was the first peacetime period of sustained federal budget deficits. As a result, net
25 Paulus interview.
PAGE 10 A JOINT ECONOMIC COMMITTEE STUDY
debt had risen to $42.8 billion (nominal dollars) or 44.2 percent of GDP by the end of fiscal year 1940.26
As seen in Graphs 2 and 3, World War II financing hiked net debt to $241.9 billion (nominal dollars) or 108.6 percent of GDP by the end of fiscal year 1946.27 Budget surpluses in four of the five fiscal years between 1947 and 1951 caused net debt to decline to $214.3 billion (nominal dollars). During these years, economic growth drove the net debt to GDP ratio down to 66.8 percent.28 Through fiscal year 1974, net debt rose slightly to $343.7 billion (nominal dollars), but economic growth caused the net debt to GDP ratio to fall to 23.8 percent, the lowest ratio since before World War I.29
Large peacetime budget deficits from the mid-1970s through the mid-1990s drove both nominal net debt and the net debt to GDP ratio substantially higher. Net debt peaked at $3.773 trillion (nominal dollars) at the end of fiscal year 1998, while the net debt to GDP ratio topped out at 49.5 percent at the end of fiscal year 1993.30 Budget surpluses beginning in fiscal year 1998 have reduced both nominal net debt and the net
26 Budget Historical Tables, 4:116. 27 Budget Historical Tables, 4:116. 28 Budget Historical Tables, 4:116. 29 Budget Historical Tables, 4:116. 30 Budget Historical Tables, 4:116-7.
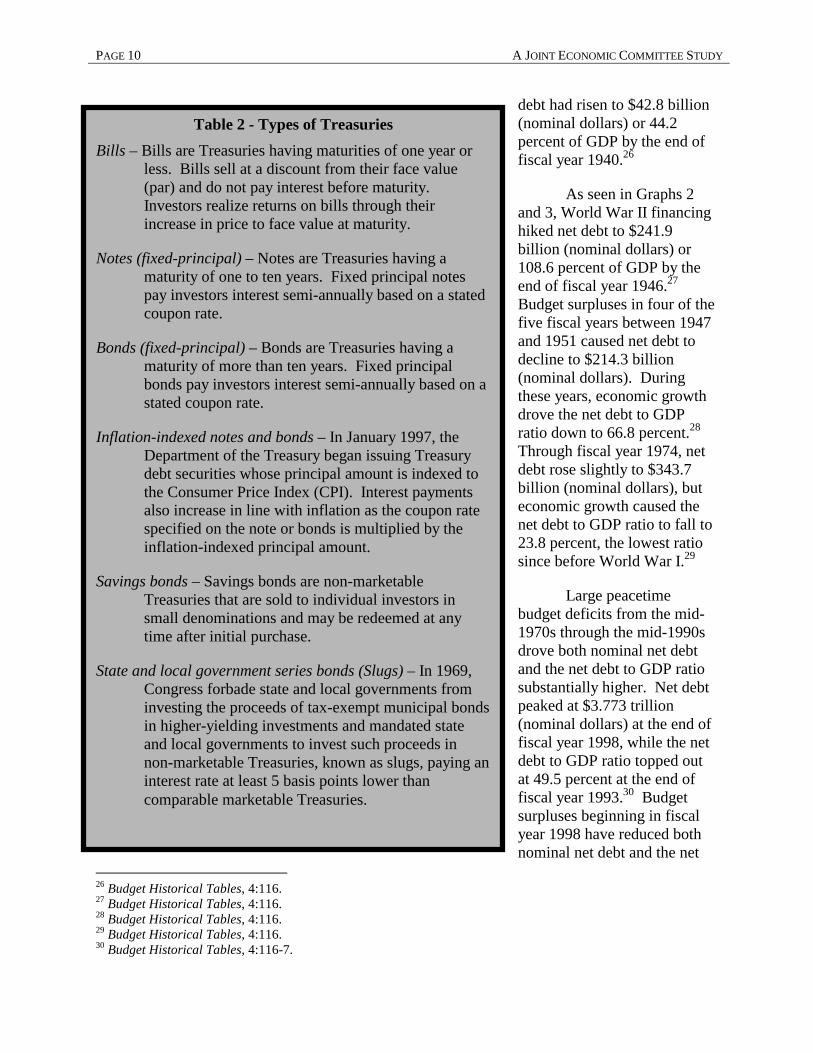
Table 2 - Types of Treasuries Bills – Bills are Treasuries having maturities of one year or
less. Bills sell at a discount from their face value (par) and do not pay interest before maturity. Investors realize returns on bills through their increase in price to face value at maturity.
Notes (fixed-principal) – Notes are Treasuries having a maturity of one to ten years. Fixed principal notes pay investors interest semi-annually based on a stated coupon rate.
Bonds (fixed-principal) – Bonds are Treasuries having a maturity of more than ten years. Fixed principal bonds pay investors interest semi-annually based on a stated coupon rate.
Inflation-indexed notes and bonds – In January 1997, the Department of the Treasury began issuing Treasury debt securities whose principal amount is indexed to the Consumer Price Index (CPI). Interest payments also increase in line with inflation as the coupon rate specified on the note or bonds is multiplied by the inflation-indexed principal amount.
Savings bonds – Savings bonds are non-marketable Treasuries that are sold to individual investors in small denominations and may be redeemed at any time after initial purchase.
State and local government series bonds (Slugs) – In 1969, Congress forbade state and local governments from investing the proceeds of tax-exempt municipal bonds in higher-yielding investments and mandated state and local governments to invest such proceeds in non-marketable Treasuries, known as slugs, paying an interest rate at least 5 basis points lower than comparable marketable Treasuries.

FEDERAL DEBT PAGE 11
debt to GDP ratio to $3.410 trillion (nominal dollars) and 34.7 percent, respectively, at the end of fiscal year 2000.31
A. Debt and Deficit
There is often great confusion about what the terms such as “debt” and “deficit” mean. For clarity, key terms used in this series of studies are defined as follows:
Gross debt – The gross debt of the United States is sum of (1) the face value of all Treasuries except savings bonds plus (2) the initial purchase price and accrued interest of savings bonds. The gross debt includes both Treasuries owned by the U.S. government (intragovernmental holdings) and Treasuries owned by others (net debt). As of March 31, 2001, gross debt was $5.774 trillion or 56.4 percent of GDP, of which intragovernmental holdings were $2.339 trillion or 40.5 percent of gross debt or 22.8 percent of GDP and net debt was $3.435 trillion or 59.5 percent of gross debt or 33.5 percent of GDP (See Graphs 1 and 4 and Table 3).32
Net or public debt – The net debt of the United States is the sum of (1) the face value of all Treasuries except savings bonds that are not owned by the U.S government plus (2) the initial purchase price and accrued interest of savings bonds. Net debt is also referred to as public debt. Owners of net debt include the Federal Reserve System, international financial institutions such as the International Monetary Fund or the World Bank, foreign governments, foreign currency boards, foreign central banks, financial services and other firms, mutual funds, pension funds, and individuals. Economists consider net debt as the proper measure of federal debt. Increasing (or decreasing) net debt represents a withdrawal of money from (or a release of money to) financial markets and may affect the broader economy. Publicly issued Treasuries represent legally binding commitments with other parties that cannot be abrogated. In contrast, the U.S. government is both the debtor and the creditor for Treasuries held in intragovernmental accounts. President Bill Clinton explained this point in his Fiscal Year 2000 Budget:
31 Budget Historical Tables, 4:117. 32 Monthly Statement of the Public Debt, 1. The debt to GDP is derived from preliminary GDP figures from U.S. Department of Commerce, Bureau of Economic Analysis, Gross Domestic Product: First Quarter 2001 (Advance) news release, April 27, 2001.
Graph 4 - Net Debt and Intragovernmental Holdings as a Percent of GDP
(as of March 31, 2001)
22.8%
33.5%
0.0%5.0%
10.0%15.0%20.0%25.0%30.0%35.0%40.0%
Net Debt IntragovernmentHoldings
Perc
ent o
f GD
P
PAGE 12 A JOINT ECONOMIC COMMITTEE STUDY
These balances [in intragovernmental accounts] are available … but only in a bookkeeping sense.33
Thus, an increase (or a decrease) of Treasuries in these accounts is merely a bookkeeping entry that does not affect financial markets or the broader economy. Placing Treasuries in an intragovernmental account is similar to lending money to yourself. You may increase your loan balance infinitely or pay off it entirely, but neither action can change the amount of money in your pocket. Henceforth, federal debt refers to net debt unless otherwise indicated (See Charts 5 and 6 and Table 3).
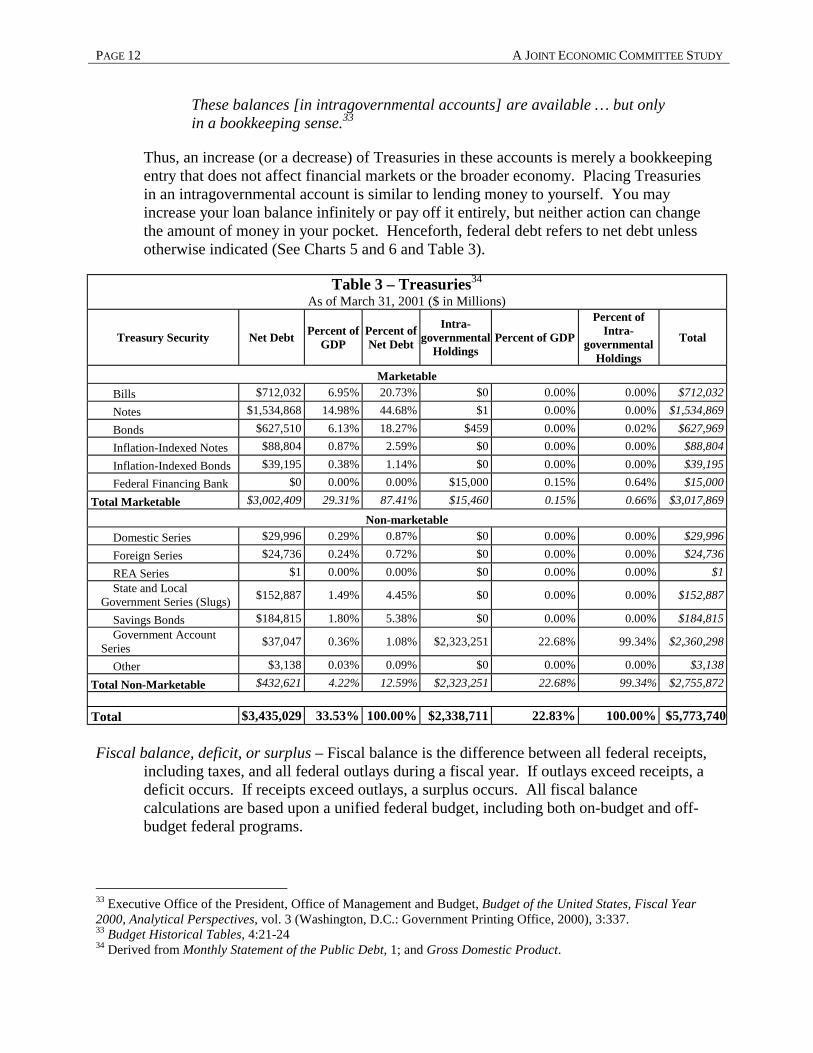
Table 3 – Treasuries34 As of March 31, 2001 ($ in Millions)
Treasury Security Net Debt Percent of GDP
Percent of Net Debt
Intra- governmental
Holdings Percent of GDP
Percent of Intra-
governmental Holdings
Total
Marketable Bills $712,032 6.95% 20.73% $0 0.00% 0.00% $712,032 Notes $1,534,868 14.98% 44.68% $1 0.00% 0.00% $1,534,869 Bonds $627,510 6.13% 18.27% $459 0.00% 0.02% $627,969 Inflation-Indexed Notes $88,804 0.87% 2.59% $0 0.00% 0.00% $88,804 Inflation-Indexed Bonds $39,195 0.38% 1.14% $0 0.00% 0.00% $39,195 Federal Financing Bank $0 0.00% 0.00% $15,000 0.15% 0.64% $15,000
Total Marketable $3,002,409 29.31% 87.41% $15,460 0.15% 0.66% $3,017,869 Non-marketable
Domestic Series $29,996 0.29% 0.87% $0 0.00% 0.00% $29,996 Foreign Series $24,736 0.24% 0.72% $0 0.00% 0.00% $24,736 REA Series $1 0.00% 0.00% $0 0.00% 0.00% $1 State and Local
Government Series (Slugs) $152,887 1.49% 4.45% $0 0.00% 0.00% $152,887
Savings Bonds $184,815 1.80% 5.38% $0 0.00% 0.00% $184,815 Government Account
Series $37,047 0.36% 1.08% $2,323,251 22.68% 99.34% $2,360,298
Other $3,138 0.03% 0.09% $0 0.00% 0.00% $3,138
Total Non-Marketable $432,621 4.22% 12.59% $2,323,251 22.68% 99.34% $2,755,872
Total $3,435,029 33.53% 100.00% $2,338,711 22.83% 100.00% $5,773,740
Fiscal balance, deficit, or surplus – Fiscal balance is the difference between all federal receipts, including taxes, and all federal outlays during a fiscal year. If outlays exceed receipts, a deficit occurs. If receipts exceed outlays, a surplus occurs. All fiscal balance calculations are based upon a unified federal budget, including both on-budget and off-budget federal programs.
33 Executive Office of the President, Office of Management and Budget, Budget of the United States, Fiscal Year 2000, Analytical Perspectives, vol. 3 (Washington, D.C.: Government Printing Office, 2000), 3:337. 33 Budget Historical Tables, 4:21-24 34 Derived from Monthly Statement of the Public Debt, 1; and Gross Domestic Product.

FEDERAL DEBT PAGE 13
B. Strips and Taxes on Treasuries
Separate Trading of Registered Interest and Principal of Securities (Strips). In January 1985, the Department of the Treasury introduced Separate Trading of Registered Interest and Principal of Securities (Strips) program, allowing investors to hold the principal and coupon payments of fixed- and inflation adjusted-principal notes and bonds as separate and independently tradable securities. A Treasury stripped of its coupon payments is known as a zero. Zeroes sell at a deep discount because there are no coupon interest payments. As seen in Table 4, approximately $179.7 billion of Treasuries, most of which were bonds, were held as strips on March 31, 2001.36 The strips market is characterized by heavy churning – stripping and reconstituting strips – each month. In March 2001, almost $16.9 billion were reconstituted (See Table 4).37
Tax treatment of Treasuries. Owners of bills pay federal income taxes on the
appreciation of bills to maturity, which the Internal Revenue Code regards as interest income. Owners of fixed-principal notes and bonds pay federal income taxes on coupon payments. Owners of inflation-indexed note and bond owners pay federal income taxes on both coupon payments and annual increases in the face value of their notes or bonds due to inflation indexing. Owners of zeroes pay federal income taxes on the implicit interest that is earned each year even though they do not receive coupon payments. Owners of savings bonds may defer federal income taxes on saving bond interest until such bonds are redeemed. For low- and moderate-income owners of savings bonds, interest income may be exempt from federal income taxes if bond proceeds are used for certain educational expenditures. Owners of notes and bonds may also be subject to federal capital gains taxes on resale prior to maturity. All Treasuries are exempt from state and local income taxes.
35 Monthly Statement of the Public Debt, table 5. 36 Monthly Statement of the Public Debt, table 5. 37 Monthly Statement of the Public Debt, table 5.
Table 4 – Strips As of March 31, 2001 (in millions) 35
Title Unstripped Stripped Total Notes $1,465,137 $33,887 $1,499,024 Bonds $374,005 $145,584 $519,590 Inflation-Indexed Notes $88,695 $108 $88,804 Inflation-Indexed Bonds $39,089 $106 $39,195 Total $1,966,927 $179,686 $2,146,613
PAGE 14 A JOINT ECONOMIC COMMITTEE STUDY
C. Primary Market
Acting as the fiscal agent for the Department of the Treasury, the Federal Reserve System auctions newly issued Treasuries at regular intervals. This auction process is known as the primary market. Though the Securities and Exchanges Commission licenses more than 2,000 brokers and dealers to operate in the government securities market, a small number of primary dealers dominates the primary market.38
The Federal Reserve Bank of New York selects primary dealers as the financial services firms through which the Federal Reserve System buys or sells Treasuries or other securities when conducting open market operations. Primary dealers must be active participants in both Federal Reserve open market operations and Treasury auctions. Primary dealers must provide timely debt market information to the Federal Reserve Bank of New York.39 Currently, there are 25 primary dealers, down from a peak of 46 in 1988.40
38 Dominique Dupont and Brian Sack, “The Treasury Securities Market: Overview and Recent Developments,” Federal Reserve Bulletin (December 1999): 787. 39Dupont and Sack: 787. 40 Federal Reserve Bank of New York, List of Primary Government Securities Dealers Reporting to the Securities Division of Federal Reserve Bank of New York (May 23, 2001). Found online at: www.ny.frb.org/pihome/news/opnmktops/2001/an01523.html. The primary dealers are: ABN AMRO Incorporated, BMO Nesbitt Burns Corp., BNP Paribas Securities Corp., Banc of America, Securities LLC, Banc One Capital Markets, Inc., Barclays Capital Inc., Bear, Stearns & Co., Inc., CIBC, World Markets Corp., Credit Suisse First Boston Corporation, Daiwa Securities America Inc., Deutsche , Bank Securities Inc., Dresdner Kleinwort Benson North America LLC., Fuji Securities Inc., Goldman, Sachs & Co., Greenwich Capital Markets, Inc., HSBC Securities (USA), Inc., J.P. Morgan Securities, Inc., Lehman Brothers Inc., Merrill Lynch Government Securities
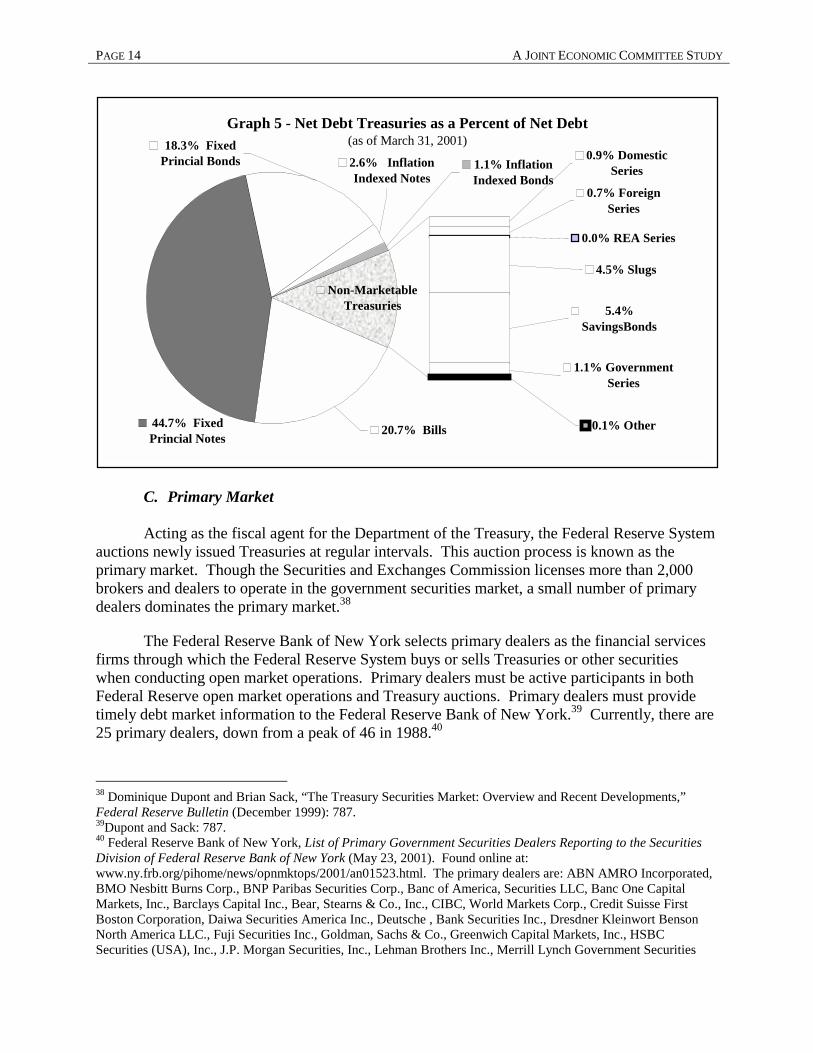
Graph 5 - Net Debt Treasuries as a Percent of Net Debt(as of March 31, 2001)
Non-MarketableTreasuries
18.3% Fixed Princial Bonds
44.7% Fixed Princial Notes
0.7% Foreign Series
0.9% Domestic Series
5.4% SavingsBonds
1.1% Government Series
0.1% Other
4.5% Slugs
1.1% Inflation Indexed Bonds
0.0% REA Series
2.6% Inflation Indexed Notes
20.7% Bills
FEDERAL DEBT PAGE 15
To foster liquidity, the Department of the Treasury issues Treasuries at regularly scheduled auctions. After an auction is announced but before it occurs, investors begin trading the yet-to-be issued Treasuries in the when-issued market. Transactions in when-issued market are commitments to exchange funds and securities on the auction day. The when-issued market promotes the efficient distribution of securities on the auction day and provides investors with information about the price the Department of the Treasury is likely to receive at the upcoming auction.41
On the auction day, Federal Reserve Banks and the Bureau of the Public Debt in the Department of the Treasury receive bids for the issue. Anyone may bid for their own account, but only registered government securities brokers and dealers may bid for their customers. There are two types of bids: competitive and non-competitive. Competitive bidders specify both a quantity of the securities sought and a yield. If the yield is within the range accepted at the auction, the bidder is awarded the entire quantity sought. Non-competitive bidders specify only the amount sought and agree to accept the yield determined by the auction. Because of size limits, non-competitive bids account for a small portion of each auction. Competitive bids must be submitted by noon; and non-competitive bids, by 1 p.m. (New York time). Competitive bids are then accepted in ascending order of their yield until the quantity accepted equals the quantity offered. The highest yield on an accepted bid is known as the stop-out yield. Each successful
Inc., Morgan Stanley & Co. Incorporated, Nomura Securities International, Inc., SG Cowen Securities Corporation, Salomon Smith Barney, Inc., USB Warburg LLC., Zions First National Bank. 41 Dupont and Sack: 787.
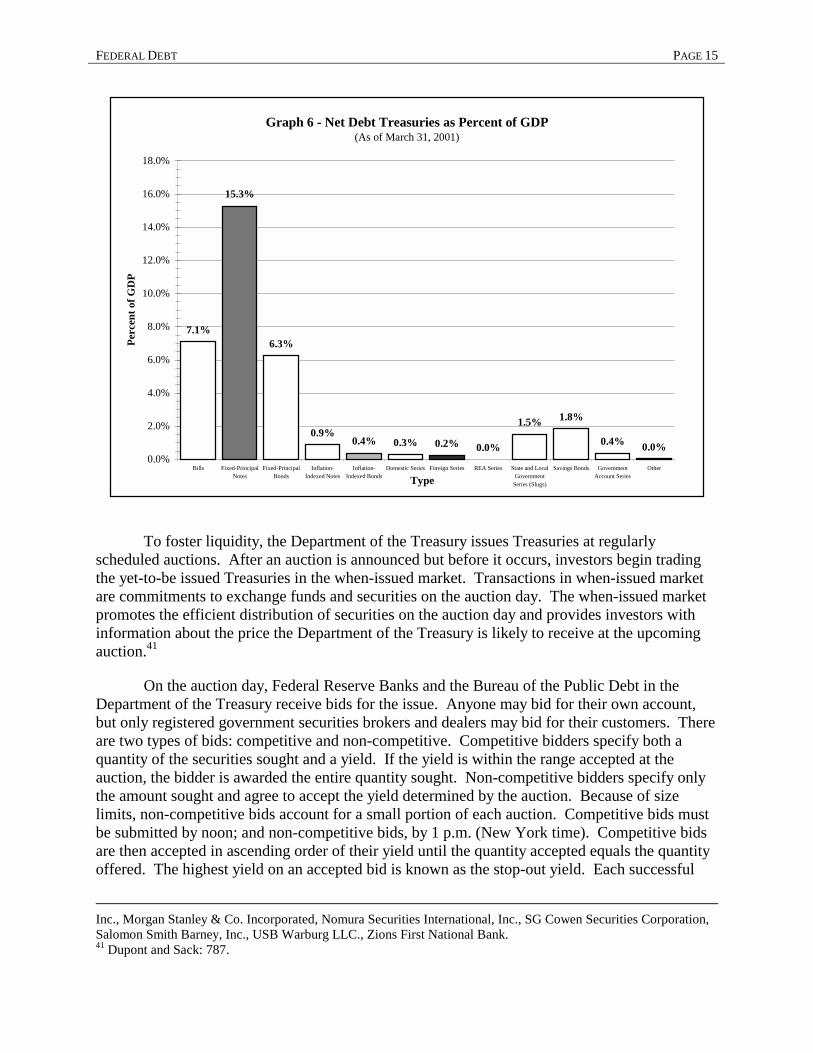
Graph 6 - Net Debt Treasuries as Percent of GDP(As of March 31, 2001)
7.1%
15.3%
6.3%
0.9%0.4% 0.3% 0.2% 0.0%
1.5% 1.8%
0.4% 0.0%0.0%
2.0%
4.0%
6.0%
8.0%
10.0%
12.0%
14.0%
16.0%
18.0%
Bills Fixed-PrincipalNotes
Fixed-PrincipalBonds
Inflation-Indexed Notes
Inflation-Indexed Bonds
Domestic Series Foreign Series REA Series State and LocalGovernment
Series (Slugs)
Savings Bonds GovernmentAccount Series
Other
Type
Perc
ent o
f GD
P
PAGE 16 A JOINT ECONOMIC COMMITTEE STUDY
competitive and non-competitive bidder is then awarded securities at the price corresponding to the stop-out yield. The results are usually announced about 1:30 p.m. (New York time).42
Instead of new issues, the Department of the Treasury may elect to add to the size of an existing issue. This is known as re-opening. The Department of the Treasury re-opens existing issues to increase their liquidity and make them more attractive to investors. The Department of the Treasury has regularly re-opened 26-week and 52-week bills. During every fourth week, the 26-week bill is a re-opening an earlier 52-week bill; and every 13-week bill is a re-opening of an earlier 26-week bill. Since the Department of the Treasury cannot change the coupon rate on a re-opened issue, the Internal Revenue Service’s Original Issue Discount (OID) rule imposes practical limits upon Treasury’s ability to re-open Treasury notes and bonds. The OID rule requires taxpayers (1) to count any discount from the face value of any note or bond with a maturity of 1 year or more that is equal to or greater than 0.25 percent of face value per full year of remaining maturity as interest income and (2) to amortize such income over the remaining maturity of the note or bond.43 Only in February 2000, alternating auctions between newly issued 5-year and 10-year Treasury notes and 30-year Treasury bonds and re-openings of the most recent issue began.44
D. Secondary Market After Treasuries are issued, they trade in the over-the-counter market. This is referred to as the secondary market (or cash market when used in contrast with the futures market). Primary dealers “make markets” in Treasuries by standing ready to buy or sell securities at specified prices. Dealers buy Treasuries from customers at a bid price and sell Treasuries to other customers at a slightly higher offer price, earning the difference known as the bid-offer spread. 45
In addition to trading directly with customers, dealers also trade Treasuries among themselves through six interdealer networks. Trades are executed electronically by “hitting” a bid price and “taking” an offer price. Interdealer networks allow dealers to gather market information and execute trades anonymously. Trading occurs almost around the clock beginning in Tokyo at 7:30 p.m. (New York time), continuing overnight in London, and ending the following day in New York at 5:30 p.m.46
In the secondary market, bills are priced in terms of a discount rate, which is the difference between the face value and the market price as a percentage of the face value, scaled to an annual rate assuming a 360-day year. Notes and bonds are priced in terms of “clean price,” which excludes accrued interest, expressed in U.S. dollars. When a Treasury note or bond is sold, the purchaser must pay the clean price plus the accrued interest. However, the financial press often reports Treasuries in terms of yield to maturity rather than price. The yield on a
42 Dupont and Sack: 787-88. 43 U.S. Department of the Treasury, Internal Revenue Service, Discount on Debt Instruments. Found online at http://www.irs.gov/prod/forms_pubs/pubs/p5500103.htm; and Dupont and Sack: 788. 44 Michael J. Fleming, “The Benchmark U.S. Treasury Market: Recent Performance and Possible Alternative,” Federal Reserve Bank of New York Policy Review 6 (April 2000): 131. 45 Dupont and Sack: 789-90. 46 Dupont and Sack: 789-90.
FEDERAL DEBT PAGE 17
Treasury is the constant interest rate at which the discounted value of future coupon and principal payments equals the current market price of the Treasury.47
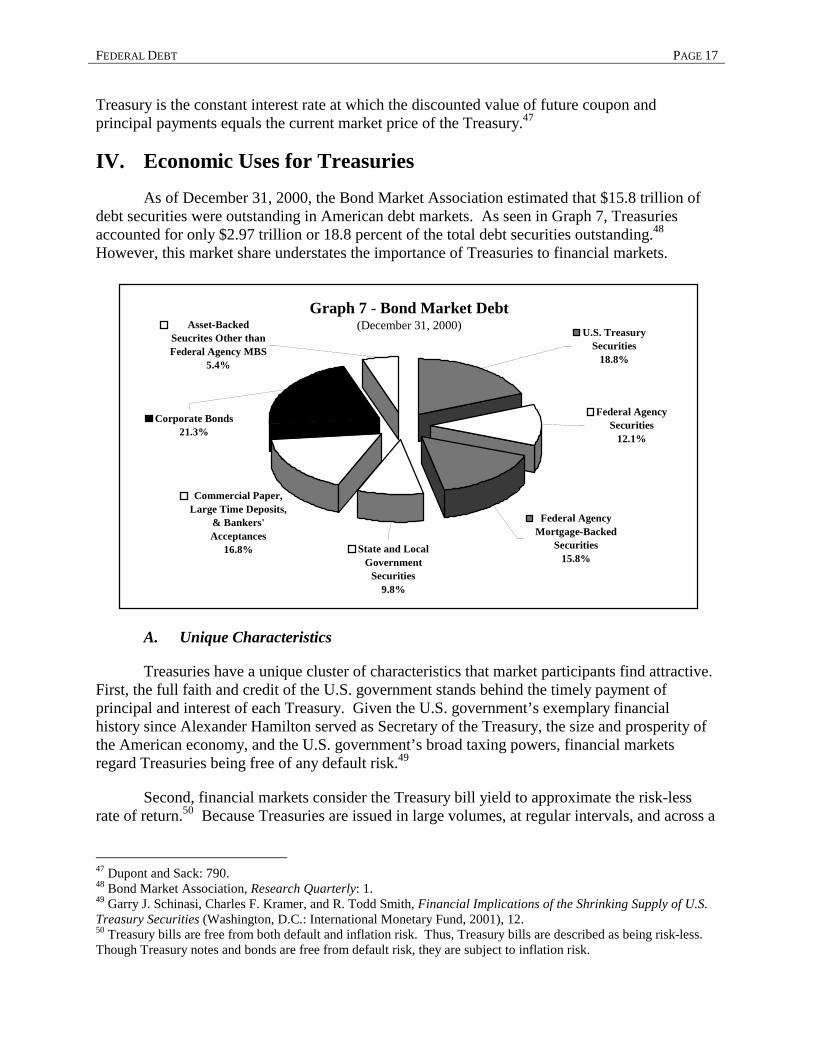
IV. Economic Uses for Treasuries As of December 31, 2000, the Bond Market Association estimated that $15.8 trillion of debt securities were outstanding in American debt markets. As seen in Graph 7, Treasuries accounted for only $2.97 trillion or 18.8 percent of the total debt securities outstanding.48 However, this market share understates the importance of Treasuries to financial markets.
A. Unique Characteristics
Treasuries have a unique cluster of characteristics that market participants find attractive. First, the full faith and credit of the U.S. government stands behind the timely payment of principal and interest of each Treasury. Given the U.S. government’s exemplary financial history since Alexander Hamilton served as Secretary of the Treasury, the size and prosperity of the American economy, and the U.S. government’s broad taxing powers, financial markets regard Treasuries being free of any default risk.49
Second, financial markets consider the Treasury bill yield to approximate the risk-less rate of return.50 Because Treasuries are issued in large volumes, at regular intervals, and across a
47 Dupont and Sack: 790. 48 Bond Market Association, Research Quarterly: 1. 49 Garry J. Schinasi, Charles F. Kramer, and R. Todd Smith, Financial Implications of the Shrinking Supply of U.S. Treasury Securities (Washington, D.C.: International Monetary Fund, 2001), 12. 50 Treasury bills are free from both default and inflation risk. Thus, Treasury bills are described as being risk-less. Though Treasury notes and bonds are free from default risk, they are subject to inflation risk.
Graph 7 - Bond Market Debt(December 31, 2000)
Commercial Paper, Large Time Deposits,
& Bankers' Acceptances
16.8%
Corporate Bonds21.3%
Asset-Backed Seucrites Other than Federal Agency MBS
5.4%
State and Local Government
Securities9.8%
Federal Agency Mortgage-Backed
Securities15.8%
Federal Agency Securities
12.1%
U.S. Treasury Securities
18.8%
PAGE 18 A JOINT ECONOMIC COMMITTEE STUDY
wide range of maturities, the yield curve for Treasuries is both broad and deep. Thus, financial markets use Treasury yields along the maturity curve to create a default-risk free yield curve.51
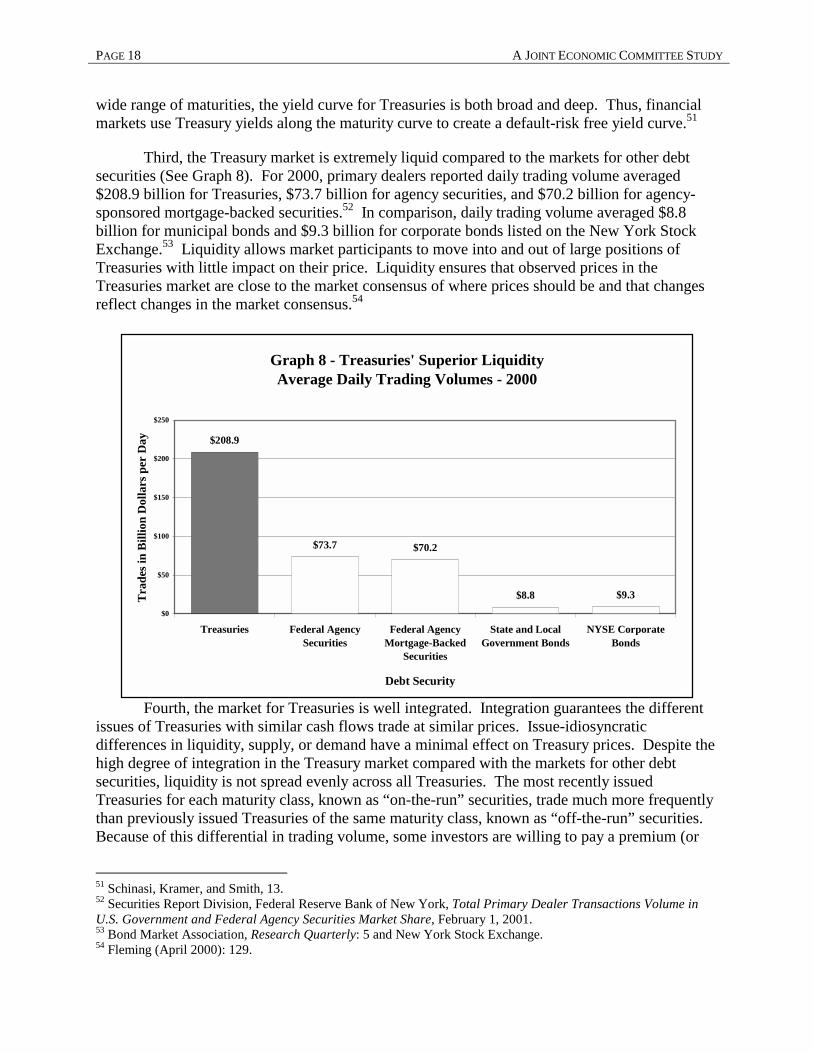
Third, the Treasury market is extremely liquid compared to the markets for other debt securities (See Graph 8). For 2000, primary dealers reported daily trading volume averaged $208.9 billion for Treasuries, $73.7 billion for agency securities, and $70.2 billion for agency-sponsored mortgage-backed securities.52 In comparison, daily trading volume averaged $8.8 billion for municipal bonds and $9.3 billion for corporate bonds listed on the New York Stock Exchange.53 Liquidity allows market participants to move into and out of large positions of Treasuries with little impact on their price. Liquidity ensures that observed prices in the Treasuries market are close to the market consensus of where prices should be and that changes reflect changes in the market consensus.54
Fourth, the market for Treasuries is well integrated. Integration guarantees the different issues of Treasuries with similar cash flows trade at similar prices. Issue-idiosyncratic differences in liquidity, supply, or demand have a minimal effect on Treasury prices. Despite the high degree of integration in the Treasury market compared with the markets for other debt securities, liquidity is not spread evenly across all Treasuries. The most recently issued Treasuries for each maturity class, known as “on-the-run” securities, trade much more frequently than previously issued Treasuries of the same maturity class, known as “off-the-run” securities. Because of this differential in trading volume, some investors are willing to pay a premium (or
51 Schinasi, Kramer, and Smith, 13. 52 Securities Report Division, Federal Reserve Bank of New York, Total Primary Dealer Transactions Volume in U.S. Government and Federal Agency Securities Market Share, February 1, 2001. 53 Bond Market Association, Research Quarterly: 5 and New York Stock Exchange. 54 Fleming (April 2000): 129.
Graph 8 - Treasuries' Superior LiquidityAverage Daily Trading Volumes - 2000
$208.9
$73.7 $70.2
$8.8 $9.3$0
$50
$100
$150
$200
$250
Treasuries Federal AgencySecurities
Federal AgencyMortgage-Backed
Securities
State and LocalGovernment Bonds
NYSE CorporateBonds
Debt Security
Trad
es in
Bill
ion
Dol
lars
per
Day
FEDERAL DEBT PAGE 19
accept a lower yield) to hold on-the-run Treasuries. Nevertheless, this liquidity premium has remained relatively small until recently.55
Fifth, large trading volume and intense competition among primary dealers minimize the bid-ask spread for Treasuries. Bid-offer spreads are reported to be 16 cents per $1000 in face value for fixed-principal Treasuries and 16 cents to 63 cents per $1000 in face vale for inflation-indexed Treasuries compared to an average of $1.33 per $1000 for investment grade corporate bonds and $1.91 per $1000 for high-yield corporate bonds.56
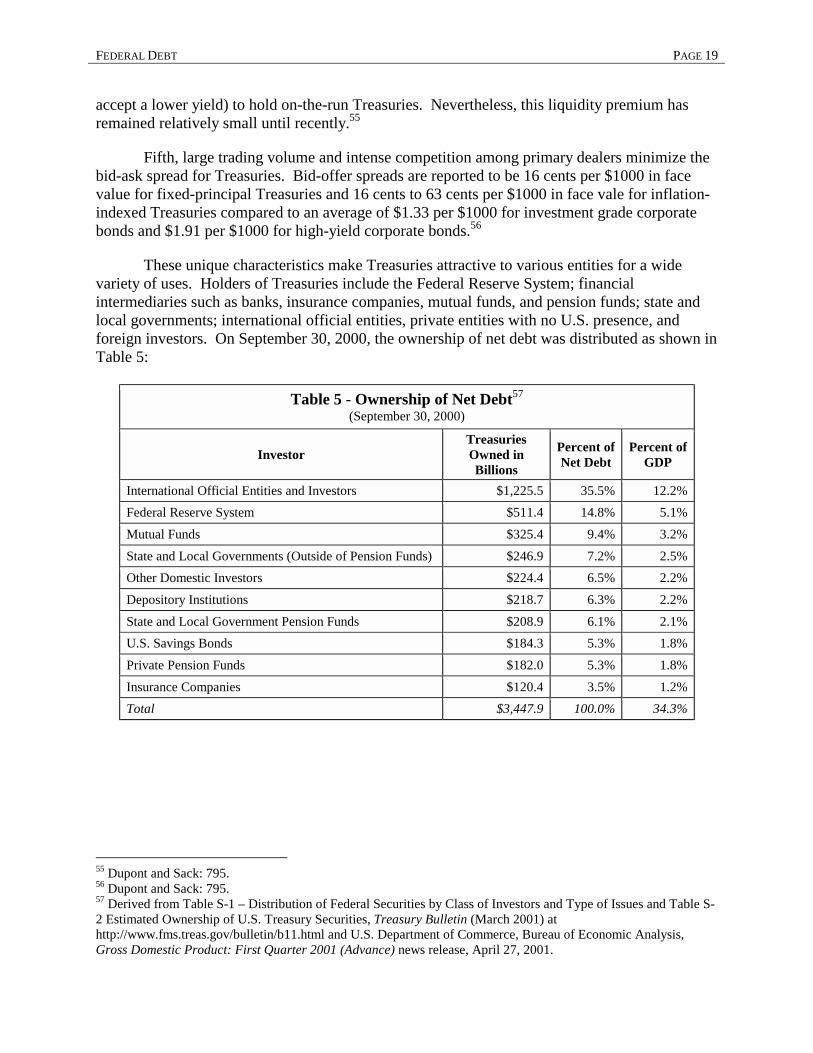
These unique characteristics make Treasuries attractive to various entities for a wide variety of uses. Holders of Treasuries include the Federal Reserve System; financial intermediaries such as banks, insurance companies, mutual funds, and pension funds; state and local governments; international official entities, private entities with no U.S. presence, and foreign investors. On September 30, 2000, the ownership of net debt was distributed as shown in Table 5:
Table 5 - Ownership of Net Debt57 (September 30, 2000)
Investor Treasuries Owned in Billions
Percent of Net Debt
Percent of GDP
International Official Entities and Investors $1,225.5 35.5% 12.2% Federal Reserve System $511.4 14.8% 5.1%
Mutual Funds $325.4 9.4% 3.2%
State and Local Governments (Outside of Pension Funds) $246.9 7.2% 2.5% Other Domestic Investors $224.4 6.5% 2.2%
Depository Institutions $218.7 6.3% 2.2%
State and Local Government Pension Funds $208.9 6.1% 2.1% U.S. Savings Bonds $184.3 5.3% 1.8%
Private Pension Funds $182.0 5.3% 1.8%
Insurance Companies $120.4 3.5% 1.2% Total $3,447.9 100.0% 34.3%
55 Dupont and Sack: 795. 56 Dupont and Sack: 795. 57 Derived from Table S-1 – Distribution of Federal Securities by Class of Investors and Type of Issues and Table S-2 Estimated Ownership of U.S. Treasury Securities, Treasury Bulletin (March 2001) at http://www.fms.treas.gov/bulletin/b11.html and U.S. Department of Commerce, Bureau of Economic Analysis, Gross Domestic Product: First Quarter 2001 (Advance) news release, April 27, 2001.
PAGE 20 A JOINT ECONOMIC COMMITTEE STUDY
B. Monetary Use
Excluding intragovernmental holdings, the Federal Reserve System is the largest single owner of Treasuries, possessing about $511.4 billion as of September 30, 2000. This amounts to 15.7 percent of net debt or 5.1 percent of GDP.58
While a central bank could technically buy or sell any asset to conduct open market operations, practical considerations limit the choice of assets to monetize. Central banks must be able to trade large quantities of monetized assets quickly and efficiently. To facilitate trading, monetized assets must have uniform characteristics, be easily portable, and be imperious to deterioration, obsolescence, or spoilage. These requirements eliminate tangible goods other than precious metals and leave intangible securities as the most likely instruments for open market operations.
Monetized assets should not have significant idiosyncratic default risk. Nor should monetized assets involve the central bank in an express or implicit allocation of credit or other resources. Idiosyncratic default risk and credit allocation considerations eliminate corporate debt and equity securities as instruments for open market operations. Monetized assets should not be subject to foreign exchange risk, eliminating most foreign government debt securities as instruments for open market operations.
Monetized assets should trade in large and liquid markets. The market for a monetized asset should be so deep that its purchase or sale by a central bank does not produce a significant idiosyncratic movement in the price of the monetized asset. Thus, idiosyncratic default risk, credit allocation, and liquidity risk eliminate municipal bonds as instruments for open market operations.
58 Derived from U.S. Department of the Treasury, “Table S-1 – Distribution of Federal Securities by Class of Investors and Type of Issues” and “Table S-2 Estimated Ownership of U.S. Treasury Securities,” Treasury Bulletin (March 2001). Found online at http://www.fms.treas.gov/bulletin/b11.html; and U.S. Department of Commerce, Bureau of Economic Analysis, Gross Domestic Product: First Quarter 2001 (Advance) news release, April 27, 2001.
FEDERAL DEBT PAGE 21
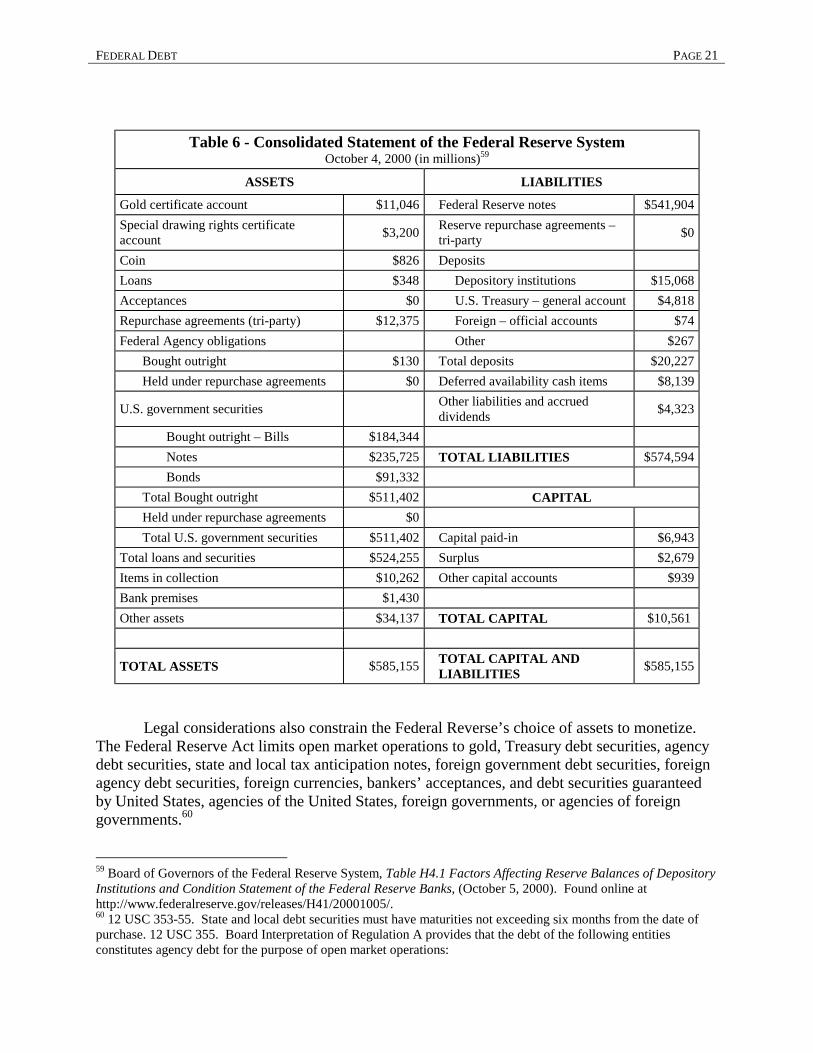
Table 6 - Consolidated Statement of the Federal Reserve System October 4, 2000 (in millions)59
ASSETS LIABILITIES
Gold certificate account $11,046 Federal Reserve notes $541,904 Special drawing rights certificate account $3,200 Reserve repurchase agreements –
tri-party $0
Coin $826 Deposits Loans $348 Depository institutions $15,068 Acceptances $0 U.S. Treasury – general account $4,818 Repurchase agreements (tri-party) $12,375 Foreign – official accounts $74 Federal Agency obligations Other $267
Bought outright $130 Total deposits $20,227 Held under repurchase agreements $0 Deferred availability cash items $8,139
U.S. government securities Other liabilities and accrued dividends $4,323
Bought outright – Bills $184,344 Notes $235,725 TOTAL LIABILITIES $574,594 Bonds $91,332
Total Bought outright $511,402 CAPITAL Held under repurchase agreements $0 Total U.S. government securities $511,402 Capital paid-in $6,943
Total loans and securities $524,255 Surplus $2,679 Items in collection $10,262 Other capital accounts $939 Bank premises $1,430 Other assets $34,137 TOTAL CAPITAL $10,561
TOTAL ASSETS $585,155 TOTAL CAPITAL AND LIABILITIES $585,155
Legal considerations also constrain the Federal Reverse’s choice of assets to monetize. The Federal Reserve Act limits open market operations to gold, Treasury debt securities, agency debt securities, state and local tax anticipation notes, foreign government debt securities, foreign agency debt securities, foreign currencies, bankers’ acceptances, and debt securities guaranteed by United States, agencies of the United States, foreign governments, or agencies of foreign governments.60
59 Board of Governors of the Federal Reserve System, Table H4.1 Factors Affecting Reserve Balances of Depository Institutions and Condition Statement of the Federal Reserve Banks, (October 5, 2000). Found online at http://www.federalreserve.gov/releases/H41/20001005/. 60 12 USC 353-55. State and local debt securities must have maturities not exceeding six months from the date of purchase. 12 USC 355. Board Interpretation of Regulation A provides that the debt of the following entities constitutes agency debt for the purpose of open market operations:
PAGE 22 A JOINT ECONOMIC COMMITTEE STUDY
Among the possible assets, Treasuries are ideal assets for the Federal Reserve to monetize. Treasuries are the world’s premier default risk-free assets, the market for Treasury is extremely liquid, and using Treasuries avoids any credit allocation problems. As may be seen from Table 6, Treasuries constitute about 89 percent of the assets of the Federal Reserve System.
C. International Uses
International holdings of Treasuries are substantial. As of September 30, 2000, total international holdings of Treasuries were $1,225.5 billion, amounting to 35.5 percent of net debt or 12.2 percent of GDP.61 The Federal Reserve System is the custodian for most of the Treasuries owned by foreign governments and central banks. On September 30, 2000, the Federal Reserve System held $611.6 billion of Treasuries in custody for foreign governments and central banks on September 30, 2000. Therefore, approximately one-half of all international holding of Treasuries are official; the remainder are privately held.
Foreign countries with currency board systems tied to the U.S. dollar such as Argentina hold Treasuries as collateral for their currencies. Other foreign countries and their central banks hold Treasuries as a store of value and a means to intervene in foreign exchange markets. On the other hand, private international entities without a U.S. presence or foreign individuals are attracted to Treasuries primarily for its status as the premier “safe haven” investment during times of economic turbulence.
1. Federal Intermediate Credit Bank debentures 2. Federal Home Loan Bank Board notes and bonds 3. Federal Land Bank bonds 4. Bank for Cooperatives debentures 5. Federal National Mortgage Association notes, debentures, and guaranteed certificates of participation 6. Obligations of or fully guaranteed by the Government National Mortgage Association 7. Merchant Marine bonds 8. Export-Import Bank notes and guaranteed participation certificates 9. Farmers Home Administration insured notes 10. Notes fully guaranteed as to principal by the Small Business Administration 11. Federal Housing Administration debentures 12. District of Columbia Armory Board bonds 13. Tennessee Valley Authority bonds and notes 14. Bonds and notes of local urban renewal or public housing agencies fully supported as to principal and
interest by the full faith and credit of the United States pursuant to section 302 of the Housing Act of 1961 15. Commodity Credit Corporation certificates of participation in a price-support loan pool 16. Federal Home Loan Mortgage Corporation notes, debentures, and guaranteed certificates of participation 17. U.S. Postal Service obligations 18. Participation certificates evidencing undivided interest in purchase contracts entered into by the General
Services Administration 19. Obligations entered into by the Secretary of Health, Education, and Welfare under the Public Health
Service Act, as amended by the Medical Facilities Construction and Modernization Amendments of 1970 20. Obligations guaranteed by the Overseas Private Investment Corporation pursuant to the provisions of the
Foreign Assistance Act of 1961, as amended. 61 Derived from U.S. Department of the Treasury, “Table S-1 – Distribution of Federal Securities by Class of Investors and Type of Issues” and “Table S-2 Estimated Ownership of U.S. Treasury Securities,” Treasury Bulletin (March 2001) at http://www.fms.treas.gov/bulletin/b11.html and U.S. Department of Commerce, Bureau of Economic Analysis, Gross Domestic Product: First Quarter 2001 (Advance) news release, April 27, 2001.
FEDERAL DEBT PAGE 23
A recent study suggests the demand for Treasuries among international official entities may be far more inelastic than the demand from other global investors. International official entities appear insensitive to changes in the Treasury yields. For them, the high liquidity and default risk-free status of Treasuries are far more important characteristics than their yield. Therefore, international official entities are likely to hold their Treasuries as long as possible even if yields plummet.62
D. Benchmark Pricing
Because Treasuries possess all of the necessary characteristics, financial markets use Treasuries as a tool to price other debt securities. Financial markets regard Treasuries as free from default risk. Treasuries are regularly issued along the entire yield curve with maturities ranging from 13 weeks to 30 years. The supply of Treasuries is large, and the Treasury market is extremely liquid and well integrated, making large idiosyncratic price movements of Treasuries at any maturity rare. Utilizing these characteristics, securities underwriters and brokers employ Treasury yields to construct a highly reliable default risk-free yield curve along the entire range of maturities. The default-risk yields are then used as a guide for evaluating the price of other dollar-denominated debt securities that bear default risk. Consequently, Treasuries are the benchmark debt security in financial markets. When other dollar-denominated fixed-rate debt securities are sold, they are typically quoted in relation to Treasuries of a similar maturity.63
Treasury yields are not only used to price debt securities. The interest rates on a large number of loans to American individuals and firms are tied to the Treasury yields. For example:
• Agricultural loans. The Farm Service Agency (FSA) makes variable interest rate operating and ownership loans to farmers who are temporarily unable to obtain private credit on commercial terms. Operating loans to ordinary farmers for 1 and 7 years are tied to the 5-year Treasury constant maturity yield plus not more than 1 percent.64 Ownership loans to ordinary farmers for up to 40 years are tied to the 25-year Treasury constant maturity yield plus not more than 1 percent.65 The initial interest rate on operating and ownership loans to low income, limited resource farmers are currently fixed at 5 percent, but are reviewed periodically.66 If a low
62 Vincent Reinhart and Brian Sack, “The Economic Consequences of Disappearing Government Debt,” Brookings Papers on Economic Activities, 2 (Fall 2000): 195-97. 63 Michael J. Fleming, “Financial Market Implications of Federal Debt Paydown,” Brookings Papers on Economic Activities (Fall 2000): 225. 64 7 USC 1946(a)(1). Specifically, the law provides “The interest rates on such loans … shall be determined by the Secretary, but not in excess of the current average market yield on outstanding marketable obligations of the United States with remaining periods to maturity comparable to the average maturities of such loans, plus an additional charge not to exceed 1 per centum.” Typically, the FSA sets the plus factor at 0.5 percent. 65 7 USC 1927(a)(2). Specifically, the law provided “[T]he interest rates on loans under this subchapter shall be as determined by the Secretary, but not in excess of the current average market yield on the outstanding marketable obligations of the United States with remaining period to maturity comparable to the average maturity of such loans, plus not to exceed 1 per centum, as determined by the Secretary, and adjusted to the nearest one-eighth of 1 per centum.” Typically, the FSA sets the plus factor at 0.5 percent. 66 7 USC 1927(a)(3)(B), 7 USC 1934(b), and 7USC1946(a)(2). The initial interest rate on loans to low income, limited resource farmers must be greater than 5 percent but not more than one-half of the average yield on Treasuries with a 5-year maturity plus 1 percent
PAGE 24 A JOINT ECONOMIC COMMITTEE STUDY
income, limited resource farmer’s economic circumstances improve, then his or her loan rate will be increased to the comparable ordinary loan rate. As of September 30, 2000, the FSA had outstanding $2.273 billion of ordinary ownership loans, $1.943 billion of ordinary operating loans, $1.476 billion of limited resource ownership loans, and $901 million of limited resource operating loans.67
• Student loans. Federal student loans are primarily made through the Federal Family Education Loan (FFEL)68 and William D. Ford Direct Loan (DL) program.69 Stafford loans70 under the FFEL and DL programs disbursed on or after October 1, 1992, have a variable interest rate indexed to the 13-week Treasury bill yield.71 PLUS loans72 under the FFEL and DL programs disbursed on or after July 1, 1987, but before October 1, 1998, have a variable interest rate indexed to the 1-year constant maturity Treasury yield.73 PLUS loans distributed on or after October 1, 1998, have a variable interest rate indexed to the 13-week Treasury bill yield.74 On September 30, 2000, $209.6 billion of federal student loans were outstanding. Though the precise amount of outstanding student loans tied to Treasury yields is unknown, the dramatic increase in student borrowing since the passage of the Higher Education Amendments of 1992 and the Student Loan Reform Act of 1993 and the common usage of a 10-year repayment plan suggest the most outstanding student loans have interest rates tied to Treasury yields.75
67 Congressional Research Service. 68 Under the Federal Family Education Loan program (formerly known as the Guaranteed Student Loan (GSL) program), the U.S. government guarantees loans extended by private lenders to college students or their parents to pay for education expenses. 69 Under the William D. Ford Direct Loan program, the U.S. government extends loans directly to college students or their parents to pay for education expenses. 70 Stafford loans under either the FFEL or DL programs are made to college students. 71 Section 427A(k)(1) of the Higher Education Act of 1965 provides “the applicable rate of interest shall, during any 12-month period beginning on July 1 and ending on June 20, be determined on the preceding June 1 and be equal to – (A) the bond equivalent rate of the 91-day Treasury bills auctioned at the final auction held prior to June 1; plus (B) 2.3 percent, except that such rate shall not exceed 8.25 percent.” 72 PLUS loans under either the FFEL or DL programs are made to the parents of college students. 73 These loans initially had an interest rate indexed to the 52-week Treasury bill yield, but the Consolidated Appropriations Act for Fiscal Year 2001 (P.L. 106-554) amended the index to the 1-year constant maturity Treasury yield. Section 427A(c)(4) of the Higher Education Act of 1965 now reads, “For any 12-month period beginning on July 1 of 2001 or any succeeding year, the rate determined under this subparagraph is determined on the preceding June 26 and is equal to – (I) the weekly average 1-year constant maturity Treasury yield, as published by the Board of Governors of the Federal Reserve System, for the last calendar week ending on or before June 26; plus (II) 3.25 percent.” 74 U.S. Department of Education.
Federal Direct and Guaranteed Student Loans Outstanding – September 30, 2000 – in billions FFEL $ 166.1 DL $ 57.7 Subtotal outstanding $ 223.8 Less uncollectable loans $ 14.2 Total outstanding $ 209.6 75 Congressional Research Service.
FEDERAL DEBT PAGE 25
• Adjustable rate home mortgage loans. Adjustable rate home mortgage loans use a variety of indices tied to 6-month certificates of deposit, Treasuries with maturities of 6 months to 5 years, the Eleventh Federal Reserve District cost of funds, or 1- or 6-month London Interbank Offer Rates (LIBOR). The number of adjustable rate home mortgage loans is substantial. Between 12 percent and 39 percent of all home mortgage loans made each year during the last decade were adjustable rate. While anecdotal evidence suggests that many variable rate home mortgage loans are tied to Treasury yields, precise data breaking down the number or outstanding balances of adjustable rate home mortgage loans by indices are not available.76
E. Portfolio Management
Market participants use Treasuries to perform a variety of portfolio management functions – hedging interest rate risk on other dollar-denominated debt securities, funding long-term investments, speculating on the future direction of interest rates, and optimizing the risk-return balance in their portfolios. To perform all these functions, Treasuries not only must have a liquid cash market but active repo, futures, and options markets as well.
Repurchase Agreements. Repurchase agreements (repos) are, in effect, short-term loans secured by safe liquid collateral. In a repo transaction, a borrower simultaneously agrees to sell a particular debt security to a lender and to buy the same security back from the lender at a specified price on a future date, often the next day. A borrower “repos out” the security, temporarily exchanging it for money from the lender. The repo rate is based upon the difference between the current price and the agreed-upon price in the repo. Because repos are fully collateralized, repo rates are lower than rates for unsecured federal funds lending among banks. A reserve repo is the other side of a repo transaction. A lender “reverses in” a security, agreeing to sell it back to the borrower on a future date at an agreed upon price.77
Most repos involving Treasuries occur at the general Treasury collateral repo rate. Because banking organizations can use either the federal funds or repo markets for overnight financing, the general Treasury collateral repo rate tracks closely, but just below the federal fund rate. However, if the demand for a particular Treasury is very high or the supply of such security is limited, the repo rate for such security can fall below the general Treasury collateral repo rate. Such security is said to be “on special.” In other words, the lender is so desirous of reversing in a particular Treasury that the lender is willing to let the borrower, who owns such security, benefit from a “special” interest rate below the general Treasury collateral repo rate.78
76 Congressional Research Service. 77 Dupont and Sack: 797-98. 78 Dupont and Sack: 797-98.
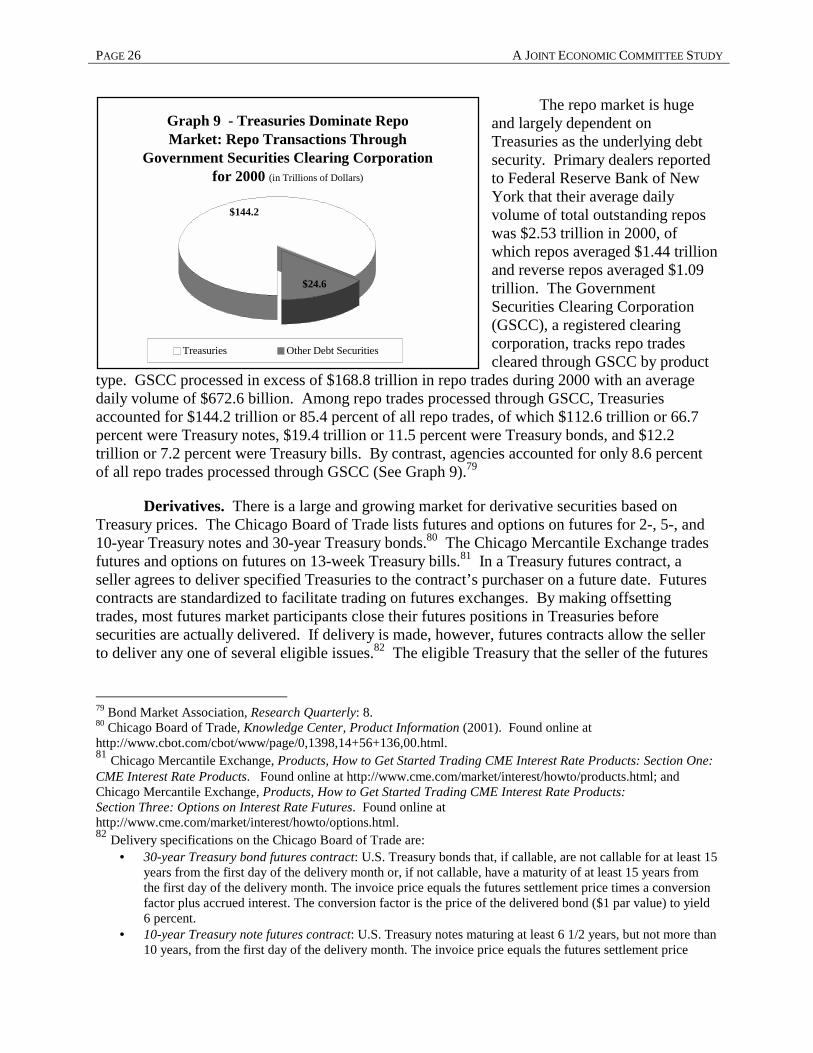
PAGE 26 A JOINT ECONOMIC COMMITTEE STUDY
The repo market is huge and largely dependent on Treasuries as the underlying debt security. Primary dealers reported to Federal Reserve Bank of New York that their average daily volume of total outstanding repos was $2.53 trillion in 2000, of which repos averaged $1.44 trillion and reverse repos averaged $1.09 trillion. The Government Securities Clearing Corporation (GSCC), a registered clearing corporation, tracks repo trades cleared through GSCC by product
type. GSCC processed in excess of $168.8 trillion in repo trades during 2000 with an average daily volume of $672.6 billion. Among repo trades processed through GSCC, Treasuries accounted for $144.2 trillion or 85.4 percent of all repo trades, of which $112.6 trillion or 66.7 percent were Treasury notes, $19.4 trillion or 11.5 percent were Treasury bonds, and $12.2 trillion or 7.2 percent were Treasury bills. By contrast, agencies accounted for only 8.6 percent of all repo trades processed through GSCC (See Graph 9).79
Derivatives. There is a large and growing market for derivative securities based on Treasury prices. The Chicago Board of Trade lists futures and options on futures for 2-, 5-, and 10-year Treasury notes and 30-year Treasury bonds.80 The Chicago Mercantile Exchange trades futures and options on futures on 13-week Treasury bills.81 In a Treasury futures contract, a seller agrees to deliver specified Treasuries to the contract’s purchaser on a future date. Futures contracts are standardized to facilitate trading on futures exchanges. By making offsetting trades, most futures market participants close their futures positions in Treasuries before securities are actually delivered. If delivery is made, however, futures contracts allow the seller to deliver any one of several eligible issues.82 The eligible Treasury that the seller of the futures
79 Bond Market Association, Research Quarterly: 8. 80 Chicago Board of Trade, Knowledge Center, Product Information (2001). Found online at http://www.cbot.com/cbot/www/page/0,1398,14+56+136,00.html. 81 Chicago Mercantile Exchange, Products, How to Get Started Trading CME Interest Rate Products: Section One: CME Interest Rate Products. Found online at http://www.cme.com/market/interest/howto/products.html; and Chicago Mercantile Exchange, Products, How to Get Started Trading CME Interest Rate Products: Section Three: Options on Interest Rate Futures. Found online at http://www.cme.com/market/interest/howto/options.html. 82 Delivery specifications on the Chicago Board of Trade are:
• 30-year Treasury bond futures contract: U.S. Treasury bonds that, if callable, are not callable for at least 15 years from the first day of the delivery month or, if not callable, have a maturity of at least 15 years from the first day of the delivery month. The invoice price equals the futures settlement price times a conversion factor plus accrued interest. The conversion factor is the price of the delivered bond ($1 par value) to yield 6 percent.
• 10-year Treasury note futures contract: U.S. Treasury notes maturing at least 6 1/2 years, but not more than 10 years, from the first day of the delivery month. The invoice price equals the futures settlement price
Graph 9 - Treasuries Dominate Repo Market: Repo Transactions Through
Government Securities Clearing Corporation for 2000 (in Trillions of Dollars)
$24.6
$144.2
Treasuries Other Debt Securities
FEDERAL DEBT PAGE 27
contract can buy at the lowest cost for delivery to the purchaser of the futures contract is known as the “cheapest to deliver.”83 The “cheapest to deliver” status can warp the yield curve of Treasuries. Market participants actively trade the “cheapest to deliver” Treasury to hedge their futures position, making the “cheapest to delivery” Treasury far more liquid than similar Treasuries. Higher liquidity and the need of some hedgers to purchase the “cheapest to deliver” Treasury to deliver into futures contracts often causes the “cheapest to deliver” Treasury to trade at a premium to similar Treasuries, distorting the yield curve.84
There are two types of options contracts on Treasury futures: calls and puts. In call options, sellers (also known as writers) grant the right, but not the obligation, to purchasers (also known as holders) to buy the underlying Treasury futures contract at a strike price for a period of time specified in the call option contract. Sellers are obligated to assume the corresponding short futures position if buyers exercise their call options. Because of the asymmetric risk of call options (i.e., purchasers have only their premiums at risk if the futures price remains below the strike price while sellers must be able to deliver into the underlying futures contract no matter how high the futures price rises above the strike price), call option purchasers pay sellers a premium. Options market participants describe buyers of call options as taking “long positions” and sellers as taking “short positions.” When the futures price rises above the strike price, call options are described as “in the money.” Conversely, call options are described as “out of the money” when the futures price remains below the strike price (See Appendix - Graph A1 for buying a call option and Graph A2 for selling a call option).85
In put options, sellers (writers) grant the right, but not the obligation to purchasers (holders) to assume a short position in the underlying Treasury futures contract at a strike price for a period of time specified in the put option contract. Sellers are obligated to assume the corresponding long futures position if buyers excise their put options. Because of the asymmetric risk of put options (i.e., purchasers have only their premiums at risk if the futures price remains above the strike price while sellers must be able to buy the underlying futures contract no matter how low the futures price falls below the strike price), put option purchasers pay sellers a premium. Options market participants describe sellers of put options as taking “long positions” and buyers of put options as taking “short positions.” When the futures price
times a conversion factor plus accrued interest. The conversion factor is the price of the delivered note ($1 par value) to yield 6 percent.
• 5-year Treasury note futures contract: U.S. Treasury notes that have an original maturity of not more than 5 years and 3 months and a remaining maturity of not less than 4 years and 3 months as of the first day of the delivery month. The 5-year Treasury note issued after the last trading day of the contract month will not be eligible for delivery into that month's contract. The invoice price equals the futures settlement price times a conversion factor plus accrued interest. The conversion factor is the price of the delivered note ($1 par value) to yield 6 percent.
• 2-year Treasury note futures contract: U.S. Treasury notes that have an original maturity of not more than 5 years and 3 months and a remaining maturity of not less than 1 year and 9 months from the first day of the delivery month but not more than 2 years from the last day of the delivery month. The invoice price equals the futures settlement price times a conversion factor plus accrued interest. The conversion factor is the price of the delivered note ($1 par value) to yield 6 percent.
83 Dupont and Sack: 798-800. 84 Dupont and Sack: 800. 85Chicago Board of Trade, An Introduction to Options on Financial Futures (Chicago: Chicago Board of Trade, 1998), 7-13. Found online at http://www.cbot.com/cbot/www/page/0,1398,14+60+145,00.html
PAGE 28 A JOINT ECONOMIC COMMITTEE STUDY
falls below the strike price, put options are described as “in the money.” Conversely, put options are described as “out of the money” when the futures price remains above the strike price (See Appendix - Graph A3 for buying a put option and Graph A4 for selling a put option). 86
The futures and options markets for Treasuries dwarfs the futures and options markets for U.S. agency debt securities. During December 2000, primary dealers entered into futures contracts on Treasuries averaging $17.649 billion a day, compared to futures contracts on agencies averaging $325 million a day.87 On December 31, 2000, the number of futures contracts (open positions) at the Chicago Board of Trade was 405,409 for 30-year Treasury bonds, 527,613 for 10-year Treasury notes, 358,012 for 5-year Treasury notes, and 81,232 for 2-year Treasury notes with each contract based upon $100,000 of Treasuries. In contrast, the Chicago Board of Trade reported year-end open futures positions of only 45,642 for 10-year agency notes.88 During December 2000, primary dealers reported that they entered into options contracts on Treasury futures averaging $5.491 billion a day compared to options contracts on agency futures averaging $14 million a day.89 On December 31, 2000, the Chicago Board of Trade had open positions for options on Treasury futures of 447,690 for 30-year Treasury bonds, 605,817 for 10-year Treasury notes, 185,008 for 5-year Treasury notes, and 725 for 2-year Treasury notes. In contrast, the Chicago Board of Trade reported year-end open options positions of only 14,782 for 10-year agency notes. 90
Hedging. Market participants use Treasuries to hedge their interest rate risk positions in other fixed-income securities. Financial services firms often own federal agency securities, federal agency mortgage-backed securities, municipal bonds, and corporate bonds because of their issuing and market-making functions. Owning debt securities is described as taking a “long position.” Portfolio strategies drive other market participants to take “long positions” in various debt securities. To minimize their interest rate risk exposure, market participants take “short positions” in Treasuries by selling Treasuries in the cash market that participants do not own but instead borrowing such Treasuries in the repo market with the intention of purchasing them later in the cash market.91
Alternatively, market participants with long positions in other bonds can use Treasury derivatives to hedge their interest rate-risk. One way would be to sell Treasury futures at the Chicago Board of Trade, taking a short position in the futures market. Other ways to hedge interest rate-risk would be to buy put options or sell call options on Treasury futures at the Chicago Board of Trade.
Treasuries have several characteristics that make them ideal hedging instruments. First, the liquidity of Treasuries allows individuals and firms to change the composition of their holdings of Treasuries rapidly to maintain the proper hedges for their portfolios without
86 CBOT, Introduction to Options, 7-13. 87 Board of Governors of the Federal Reserve System, “Table 1.42 U.S. Government Securities Dealers Transactions,” Federal Reserve Bulletin (April 2001): A28. 88 Chicago Board of Trade, Market Information, Volume, Historical (April 20, 2001), 1. Found online at http://www.cbot.com/cbot/www/page/0,1398,13+45+131,00.html. 89 Federal Reserve, “Table 1.42 U.S. Government Securities Dealers Transactions” (April 2001). 90 CBOT, Historical. 91 Dupont and Sack: 795-97.
FEDERAL DEBT PAGE 29
influencing the market for Treasuries. Second, an active repo market and the low cost of executing Treasury trades minimize the cost for hedgers to establish proper positions with Treasuries. Third, the default risk-free characteristic of Treasuries eliminates any need for hedgers to manage credit risk.92
Position funding. Portfolio managers that have made long-term investments in Treasuries may fund their position by reserving out Treasuries in the repo market. Because Treasuries or other liquid debt securities collateralize repurchase agreements, the repo rate is consistently below the federal funds rate. In 2000, for example, the average repo rate was 6.16 percent, compared to the average federal funds rate of 6.24 percent.93 Thus, low repo rates allow portfolio managers to finance their long-term Treasury holdings through repurchase agreements.
Speculation. For other investors, Treasuries and their derivatives provide a convenient means to speculate on the future direction of interest rates. If speculators believe that long-term interest rates are likely to decline, they may buy $10 million of 30-year Treasury bonds in the cash market, paying only $1 million down out of their accounts and repoing out $9 million of bonds to cover the remainder of their purchases. By borrowing $9 million through the repo market, speculators may leverage their potential returns on their investment by a factor of 10 or more.94
Treasury derivatives allow speculators to achieve the same outcome. For example, speculators can buy Treasury futures on the Chicago Board of Trade, hoping the price of Treasuries in the cash market at the time for delivery will rise above the futures price that they paid. Speculators may buy call options on 30-year Treasury bonds, hoping that the bond price increases by more than the option strike price during the term of the option. Speculators may also sell put options on 30-year Treasury bonds, hoping to pocket the premium.95
Conversely, if speculators believe long-term interest rates are likely to rise, they may short sell $10 million of 30-year Treasury bonds in the cash market, covering their position temporarily by reversing-in the bonds in the repo market until they are ready or must buy the bonds sold short in the cash market. The speculators profit if bond prices fall between when the bonds are sold short and when they are delivered.96
Treasury derivatives can also be used to bet that interest rates will rise in the future. Speculators can sell Treasury futures at the Chicago Board of Trade, hoping the price of Treasuries in the cash market at the time for delivery has fallen below the futures price received by sellers. Alternatively at the Chicago Board of Trade, speculators may buy put options on Treasury futures, hoping that the futures price falls below the strike price during the term of the option. Speculators may also sell call options on Treasury futures, hoping to pocket the premium.97
92 Dupont and Sack: 795-97. 93 Derived from “Credit Market Report” in Wall Street Journal for each business day in 2000. 94 Harold A. Kelly, Jr., Oz Capital, interview with author, New York, NY, April 25, 2001. 95 Kelly interview. 96 Kelly interview. 97 Kelly interview.
PAGE 30 A JOINT ECONOMIC COMMITTEE STUDY
Risk-Return Optimization. The unique default-risk free status of Treasuries allows investors to optimize the risk-return trade-offs in their portfolio. Without Treasuries, neither large low-risk investors nor high-risk investors who engage in short-selling can achieve their desired portfolio mix. Small, low-risk investors can substitute Federal Deposit Insurance Corporation (FDIC) insured deposits for Treasuries as risk-free assets, but large investors need Treasuries to achieve their desired low-risk profile because of FDIC coverage limits. Some high-risk investors may achieve their desired portfolio by buying risky assets directly; others may sell Treasuries short to invest in various assets. Because repo, futures, and options markets for other debt securities are far smaller than for Treasuries, the short-selling investment strategy becomes far more costly and difficult to execute as the supply of Treasuries shrinks.
A Federal Reserve staff study examined the effect that the removal of Treasuries as an investment option would have on the portfolios of investors. Using the capital-asset pricing model to compare the efficient portfolio risk-return frontier with Treasuries and without Treasuries, this study found that a nearly 1 percent rise in overall wealth would be required to compensate all investors for the loss of Treasuries out of the pool of investment assets. However, high-risk investors who engage in short-selling would require a 5.5 percent increase in their wealth to be compensated for the loss of Treasuries.98
F. Regulatory Uses
Banking Organizations. Commercial banks own a large amount of Treasuries. As of September 30, 2000, domestic banking organizations held $218.7 billion of Treasuries, amounting to 6.3 percent of net debt or 2.2 percent of GDP.
Federal capital adequacy regulations give banking organizations a strong incentive to hold Treasuries. In 1988, the Basel Committee on Banking Supervision of the Bank of International Settlements (BIS) reached the Basel Capital Accord to make regulatory capital requirements more sensitive to differences in risk profiles among banking organizations, factor off-balance-sheet exposures into the assessment of capital adequacy, and harmonize capital adequacy regulations for banking organizations among BIS countries.99 This Accord defines minimum capital adequacy for banks in terms of the risk-based assets to capital ratio. Under the Accord, bank supervisors in each BIS country calculate a bank’s capital adequacy ratio by adding common stockholders’ equity to certain other items, assigning a risk weight to all of a bank’s assets and off-balance-sheet items, summing these weights to calculate a bank’s risk-
98 Antulio N. Bomfim, “Optimal Portfolio Allocation in a World Without Treasury Securities,” Finance and Economic Discussion Series, Divisions of Research and Statistics and Monetary Affairs, Board of Governors of the Federal Reserve System (January 2001). This paper focuses narrowly on the risk-return characteristics of optimal investment portfolios and on how different types of investors might value such characteristics. In particular, the paper abstracts away from consideration of other channels through which an eventual elimination of the U.S. government’s debt would have beneficial effects on those same investors. 99 Established in 1930, the Bank for International Settlements (BIS) is an international organization as a forum for international monetary and financial cooperation among member central banks. The BIS established the Basel Committee for Banking Supervision in 1974. The Committee is composed of representatives from the central bank and the principal agency responsible for banking supervision in Belgium, Canada, France, Germany, Italy, Japan, Luxembourg, the Netherlands, Spain, Sweden, Switzerland, United Kingdom and United States. Thus, officials from the Board of Governors of the Federal Reserve System and the Office of the Comptroller of the Currency represent the United States at the Committee.
FEDERAL DEBT PAGE 31
based assets, and dividing a bank’s capital by its risk-based assets. Following the adoption of the Accord, the appropriate regulatory authorities (i.e., the Board of Governors of the Federal Reserve System, the Office of Comptroller of the Currency, and the Office of Thrift Supervision) subsequently implemented the risk-based capital standards for bank holding companies, commercial banks, and savings banks in the United States.
Under the Accord, claims against or guaranteed by the full faith and credit of the United States or the central government of an Organization for Economic Cooperation and Development (OECD) member-country are given a zero weight.100 In contrast, claims on other U.S. depository institutions and OECD banks, claims on or guaranteed by the full faith and credit of U.S. state and local governments or subsidiary governments in other OECD countries, claims on or guaranteed by the official multilateral lending institutions or regional development banks, claims on or guaranteed by U.S. government-sponsored agencies, and mortgage-backed securities issued by U.S. government-sponsored agencies are given a 20 percent weight. Performing loans secured by first mortgages on single-family residences and revenue bonds of U.S. state and local governments and subsidiary governments in other OECD countries are given a 50 percent weight. All other claims, including all loans to private individuals or firms, are given a 100 percent weight.101
At the margin, the zero risk rating granted to Treasuries allows banks to finance their acquisition of Treasuries entirely with debt. In contrast, the 100 percent risk rating granted to private sector loans means that a bank must add at least $8 in new equity or other qualified capital to its balance sheet for every $100 in new loans. Since a bank’s cost of raising capital through new equity issues or retained earnings is usually much higher than its cost of raising funds through deposits, risk-based capital standards are said to lower a bank’s cost of holding Treasuries relative to other assets. Thus, the risk-based capital standards encourage banks to own Treasuries.
In addition to this regulatory incentive, Treasuries also play an important role in liquidity management for banks. Most of the depositors’ claims on banks are payable on demand or within a relatively short time while most loans have much longer durations. Such maturity imbalances make banks vulnerable to large and unexpected withdrawals that may leave banks short of cash. Because Treasuries are extremely liquid, bank managers use Treasuries as a liquidity cushion, selling or repoing out Treasuries when large and unexpected cash outflows occur.
Pension Funds. Pension funds also own a significant amount of Treasuries. As of September 30, 2000, private pension funds held $182.0 billion of Treasuries or 5.3 percent of net debt or 1.3 percent of GDP, while state and local government pension funds held $208.9 billion
100 There are 30 OECD member-countries: Australia, Austria, Belgium, Canada, Czech Republic, Denmark, Finland, France, Germany, Greece, Hungary, Iceland, Ireland, Italy, Japan, Luxembourg, Mexico, Netherlands, New Zealand, Norway, Poland, Portugal, Slovak Republic, South Korea, Spain, Sweden, Switzerland, Turkey, United Kingdom, United States. 101 This presentation of risk ratings for on-balance-sheet items is greatly simplified. The complete risk ratings for on-balance-sheet and off-balance-sheet items may be found in Federal Reserve Regulations H and Y. 12 CFR 208 and 12 CFR 225.
PAGE 32 A JOINT ECONOMIC COMMITTEE STUDY
or 6.1 percent of net debt or 2.1 percent of GDP.102 Pension fund managers find Treasuries an attractive fixed-income investment for two reasons. First, Treasuries are interest-earning assets that can be easily liquidated to meet immediate payout needs. These characteristics help pension funds optimize their cash flow management. Second, unlike corporate bonds that are usually callable after five years or mortgage-backed securities that are subject to prepayment, Treasury bonds have fixed maturities. This characteristic allows pension fund managers to use Treasuries to balance long-term assets and liabilities more precisely than is possible with other debt securities.
For private pension funds, Treasuries are employed as a regulatory tool. The Employee Retirement Income Security Act (ERISA) mandates that the Pension Benefit Guaranty Corporation (PBGC) use the 30-year Treasury bond yield to determine the funding adequacy private employer-sponsored defined-benefit pension plans, the size of lump-sum payouts from such plans if workers leave their employers before the regular retirement age, and the additional insurance premiums that employers sponsoring under-funded defined-benefit pension plans must pay to the PBGC.
As discussed in section V of this study, Treasury yields began to diverge from their historic relationships with the yields on other taxable debt securities (or converge with yields on tax-exempt state and local debt securities) after the federal budget went into surplus in fiscal year 1998. Further federal debt reduction will make Treasuries increasingly scarce. Their yields will fall, exacerbating the divergence between the yields on Treasuries and other taxable debt securities (or the convergence of yields on Treasuries and tax-exempt state and local debt securities). Through ERISA, Congress mandated that PBGC use the 30-year Treasury bond yield for regulatory purposes, assuming a stable relationship between the yields on Treasuries and other debt securities. Diverging yields between Treasuries and other taxable long-term bonds may have significant, negative, and unintended consequences on employers sponsoring defined-benefit pension plans and their employees. For example:
• Minimum Funding Standards. ERISA requires all defined benefit plans sponsored by private employers to meet minimum funding standards. Under ERISA, the PBGC determines a plan’s funding adequacy by comparing the current value of its assets to the prevent value of its pension liabilities. The ideal discount rate to use to determine present value would be the average rate of return that pension fund managers would be expected to earn on a diversified portfolio of assets. Because of calculation difficulties, Congress chose instead to specify a market-determined long-term interest rate for determining present value – specifically a 4-year weighted average of the 30-year Treasury bond yields.103 As
102 Derived from Table S-1 – Distribution of Federal Securities by Class of Investors and Type of Issues and Table S-2 Estimated Ownership of U.S. Treasury Securities, Treasury Bulletin (March 2001) at http://www.fms.treas.gov/bulletin/b11.html and U.S. Department of Commerce, Bureau of Economic Analysis, Gross Domestic Product: First Quarter 2001 (Advance) news release, April 27, 2001. 103 Employee Retirement Income Security Act, Section 302(b)(5)(B)(ii)(I) found at 29 USC 1082(b)(5)(B)(ii)(I), and Internal Revenue Code, Section 412(b)(5)(B)(ii)(I) found at 26 USC 412(b)(5)(B)(ii)(I) set the permissible range for a discount rate at 10 percent above or below the weighted average interest rate on 30-year Treasury bonds during the 4-year period ending on the last day before the beginning of the plan year. The Secretary of Labor has the authority to lower the permissible discount rate to 80 percent of the 4-year weighted average interest rate on 30-Treasury year
FEDERAL DEBT PAGE 33
the discount rate falls, of course, the present value of a plan’s future pension liabilities rise. The legally mandated discount rate is a tolerable approximation so long as the differences between yields on 30-year Treasuries and other taxable long-term bonds remain relatively stable. If these yields diverge because of the scarcity of Treasuries, the ERISA standard will begin to overstate the liabilities of defined-benefit pension plans and cause some of these plans that are adequately funded in purely economic terms to be labeled as under-funded legally. Under ERISA, employers that sponsor under-funded defined-benefit pension plans must make additional contributions to amortize their plan’s unfunded liabilities. So federal debt reduction may inadvertently cause some employers to make additional contributions to defined-benefits pension plans that may not be economically justified.
• Lump-Sum Payouts. ERISA allows employees who leave their employers prior to the normal retirement age and have vested rights of $5,000 or greater in their employer’s defined-benefit pension plans to freeze their status in such plan until they reach the normal retirement age or to receive a lump-sum payout. ERISA specifies the amount of such lump-sum payouts as the present value of the expected annuity payments that an employee would receive if he or she retired at the normal retirement age.104 ERISA mandates that employers must use the 30-year Treasury bond yield in the month prior to the payout as the discount rate to determine present value.105 Although the 30-year Treasury bond yield is not economically ideal, it works tolerably well as the discount rate so long as the differences between the yields on 30-year Treasuries and other taxable long-term bonds remains relatively stable. However, if these yields diverge, then several unintended consequences may occur. Congress intended that the present value of the expected annuity payments under a defined-benefit pension plan and a payout be equal so that a departing employee would be indifferent between the two. If there is a significant divergence between the expected return of return on a well diversified asset portfolio and the 30-year Treasury bond yield, then legally mandated payout amount would become larger than an economically neutral payout amount. Employers would payout more than is economically justified to departing employees, and departing employees could invest their payout in well diversified mutual funds, earn a market rate of return, and end their career with a significantly higher annuity than they would if they had elected to freeze their position in the defined benefit plan. Consequently, federal debt reduction may cause more employees to take lump-sum payouts from defined benefit pension plans when leaving an employer before the normal retirement age.
bonds. IRS Notice 88-73, which implements these sections, provides that the discount rate will the weighted average of the 30-year Treasury constant maturity yields for the 48 months preceding the first day of the plan year with each month weighted as follows: most recent 12 months, 4; second most recent 12 months, 3; third most recent 12 months, 2; and fourth most recent 12 months, 1. 104 Married employees are required to take joint and survivor annuity payments unless the spouse agrees in writing to a waiver. 105 Employee Retirement Income Security Act, Section 205(g)(3)(ii)(II) found at 29 USC 1055(g)(3)(ii)(II), and Internal Revenue Code, Section 417(e)(3)(ii)(II) found at 26 USC 417(e)(3)(ii)(II).
PAGE 34 A JOINT ECONOMIC COMMITTEE STUDY
• Cash Balance Plans. A number of employers have changed their defined benefit pension plans to resemble defined contribution plans. These “hybrid” plans are known as cash balance plans. Traditionally, annuities under defined-benefit pension plans are based on the multiplication of the number of years of service times the highest average compensation over the last few years of employment times a factor (usually 1.5 percent to 2.0 percent). Under cash balance plans, employers create a notional account for each employee. Employers make periodic contributions into the notional accounts based on employee compensation and credit these accounts with notional interest payments, mimicking a defined contribution pension plan. Despite these similarities to a defined-contribution plan, ERISA classifies cash balance pension plans as defined-benefit pensions plans. Unlike defined-contribution pension plans in which each employee owns the assets in his or her account, an employer sponsoring a cash balance pension plan owns all of the assets in trust for its employees. Therefore, sponsoring employers must meet all ERISA mandates for defined-benefit pension plans, including the payout requirements for employees who leave their employer prior to the normal retirement age. Under IRS regulatory guidance, employers sponsoring a cash balance pension must project the account balances of departing employees forward to the plan’s normal retirement age using the plan’s notional interest rate and then discount this amount back to the present using the 30-year Treasury bond yield.106 Thus, the amount of a payout may be higher or lower than the balance on an employee’s notional account. If the rate at which employers credit notional accounts is higher than the 30-year Treasury bond yield, then payout amounts will be greater than the balances in the notional accounts. Employers describe this situation as being “whipsawed.” To avoid being whipsawed, employers limit the interest rate used to credit notion accounts to the 30-year Treasury bond yield or a short-term interest rate such as the Treasury bill yield that is likely to be lower than the 30-year Treasury bond yield. Thus, ERISA effectively caps the interest rate with which employers credit notional accounts in cash balance pension plans significantly below the rate of return earned by a well-diversified asset portfolio, placing cash balance plan participants at a disadvantage to participants in defined-contribution pension plans. A scarcity-induced divergence between the 30-year Treasury bond yield and other taxable long-term interest rates will exacerbate this disadvantage.
• PBGC Premium Rates. Under ERISA, all private employers sponsoring defined-benefit pension plans must pay insurance premiums to the PBGC. All sponsoring employers pay a flat-rate per capita premium of $19 a year. In addition, all sponsoring employers with under funded plans pay an additional variable rate premium equal to 0.9 percent of the amount of under-funding. ERISA mandates that sponsoring employers use the 30-year Treasury bond yield in the calendar month before the premium year begins, times 85 percent as the discount rate to determine the present value of future pension liabilities and thus
106 26 CFR 1.411(a), 26 CFR 1.417(e), and IRS Notice 96-8.
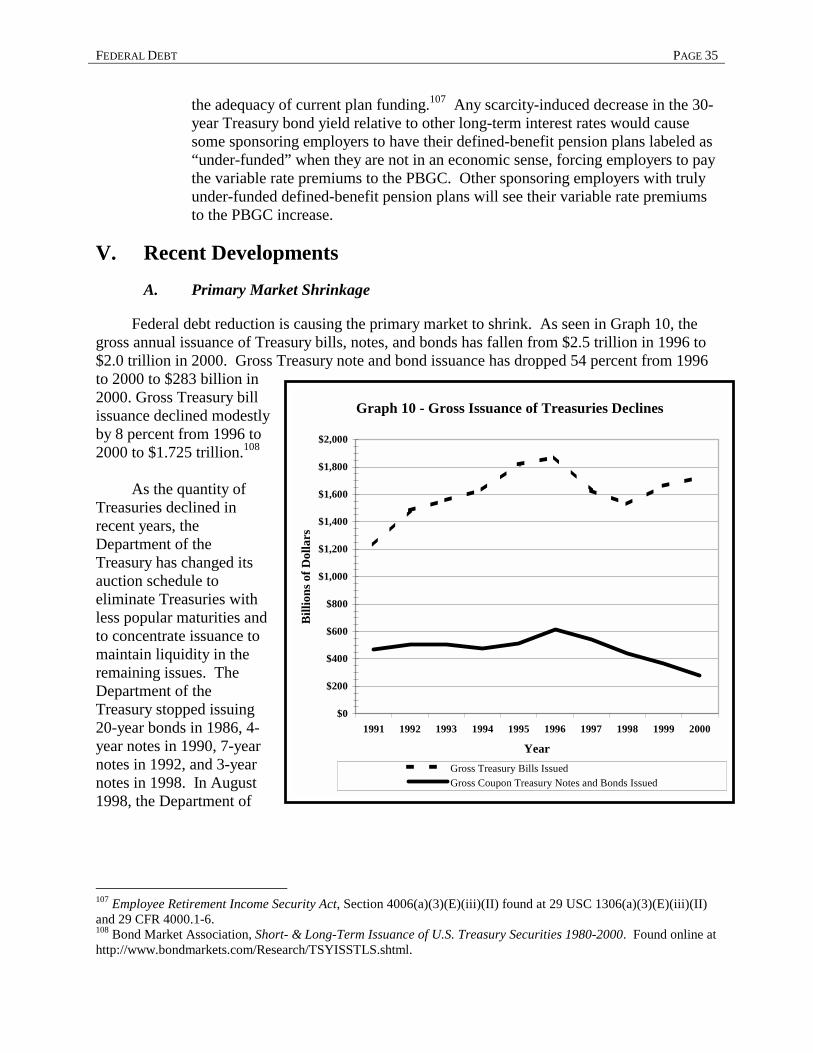
FEDERAL DEBT PAGE 35
the adequacy of current plan funding.107 Any scarcity-induced decrease in the 30-year Treasury bond yield relative to other long-term interest rates would cause some sponsoring employers to have their defined-benefit pension plans labeled as “under-funded” when they are not in an economic sense, forcing employers to pay the variable rate premiums to the PBGC. Other sponsoring employers with truly under-funded defined-benefit pension plans will see their variable rate premiums to the PBGC increase.
V. Recent Developments A. Primary Market Shrinkage
Federal debt reduction is causing the primary market to shrink. As seen in Graph 10, the gross annual issuance of Treasury bills, notes, and bonds has fallen from $2.5 trillion in 1996 to $2.0 trillion in 2000. Gross Treasury note and bond issuance has dropped 54 percent from 1996 to 2000 to $283 billion in 2000. Gross Treasury bill issuance declined modestly by 8 percent from 1996 to 2000 to $1.725 trillion.108
As the quantity of
Treasuries declined in recent years, the Department of the Treasury has changed its auction schedule to eliminate Treasuries with less popular maturities and to concentrate issuance to maintain liquidity in the remaining issues. The Department of the Treasury stopped issuing 20-year bonds in 1986, 4-year notes in 1990, 7-year notes in 1992, and 3-year notes in 1998. In August 1998, the Department of
107 Employee Retirement Income Security Act, Section 4006(a)(3)(E)(iii)(II) found at 29 USC 1306(a)(3)(E)(iii)(II) and 29 CFR 4000.1-6. 108 Bond Market Association, Short- & Long-Term Issuance of U.S. Treasury Securities 1980-2000. Found online at http://www.bondmarkets.com/Research/TSYISSTLS.shtml.
Graph 10 - Gross Issuance of Treasuries Declines
$0
$200
$400
$600
$800
$1,000
$1,200
$1,400
$1,600
$1,800
$2,000
1991 1992 1993 1994 1995 1996 1997 1998 1999 2000
Year
Bill
ions
of D
olla
rs
Gross Treasury Bills IssuedGross Coupon Treasury Notes and Bonds Issued
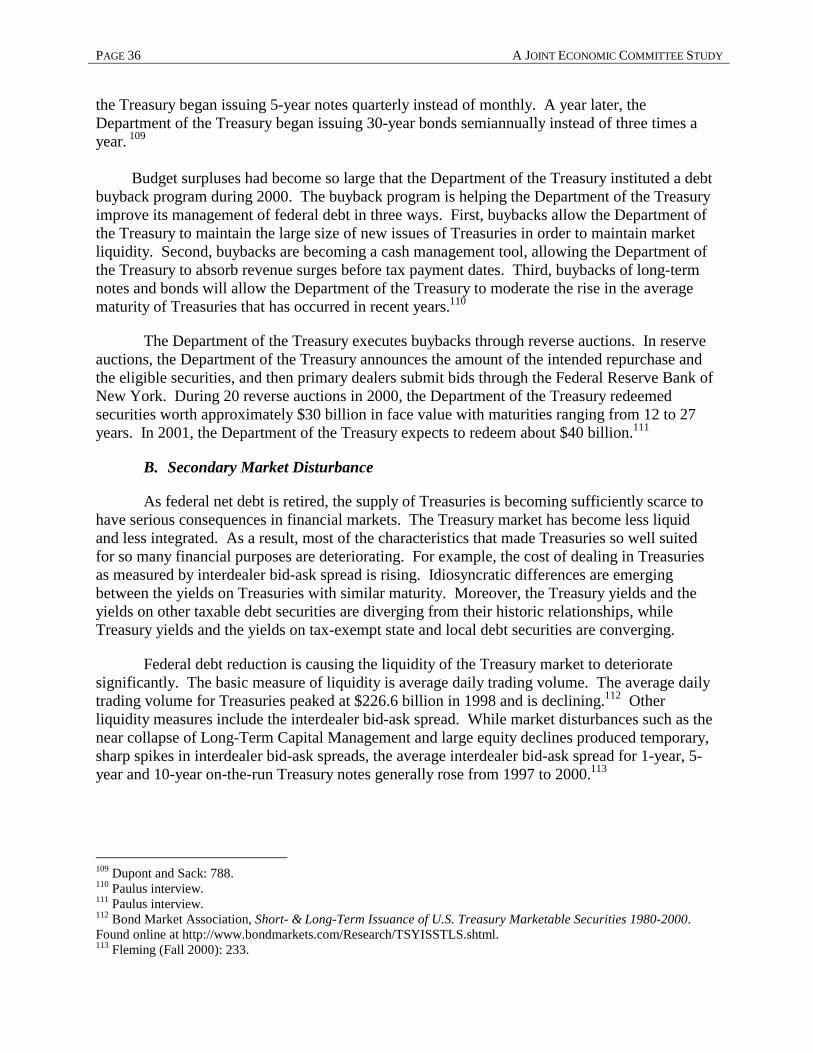
PAGE 36 A JOINT ECONOMIC COMMITTEE STUDY
the Treasury began issuing 5-year notes quarterly instead of monthly. A year later, the Department of the Treasury began issuing 30-year bonds semiannually instead of three times a year. 109
Budget surpluses had become so large that the Department of the Treasury instituted a debt
buyback program during 2000. The buyback program is helping the Department of the Treasury improve its management of federal debt in three ways. First, buybacks allow the Department of the Treasury to maintain the large size of new issues of Treasuries in order to maintain market liquidity. Second, buybacks are becoming a cash management tool, allowing the Department of the Treasury to absorb revenue surges before tax payment dates. Third, buybacks of long-term notes and bonds will allow the Department of the Treasury to moderate the rise in the average maturity of Treasuries that has occurred in recent years.110
The Department of the Treasury executes buybacks through reverse auctions. In reserve auctions, the Department of the Treasury announces the amount of the intended repurchase and the eligible securities, and then primary dealers submit bids through the Federal Reserve Bank of New York. During 20 reverse auctions in 2000, the Department of the Treasury redeemed securities worth approximately $30 billion in face value with maturities ranging from 12 to 27 years. In 2001, the Department of the Treasury expects to redeem about $40 billion.111
B. Secondary Market Disturbance
As federal net debt is retired, the supply of Treasuries is becoming sufficiently scarce to have serious consequences in financial markets. The Treasury market has become less liquid and less integrated. As a result, most of the characteristics that made Treasuries so well suited for so many financial purposes are deteriorating. For example, the cost of dealing in Treasuries as measured by interdealer bid-ask spread is rising. Idiosyncratic differences are emerging between the yields on Treasuries with similar maturity. Moreover, the Treasury yields and the yields on other taxable debt securities are diverging from their historic relationships, while Treasury yields and the yields on tax-exempt state and local debt securities are converging.
Federal debt reduction is causing the liquidity of the Treasury market to deteriorate significantly. The basic measure of liquidity is average daily trading volume. The average daily trading volume for Treasuries peaked at $226.6 billion in 1998 and is declining.112 Other liquidity measures include the interdealer bid-ask spread. While market disturbances such as the near collapse of Long-Term Capital Management and large equity declines produced temporary, sharp spikes in interdealer bid-ask spreads, the average interdealer bid-ask spread for 1-year, 5-year and 10-year on-the-run Treasury notes generally rose from 1997 to 2000.113
109 Dupont and Sack: 788. 110 Paulus interview. 111 Paulus interview. 112 Bond Market Association, Short- & Long-Term Issuance of U.S. Treasury Marketable Securities 1980-2000. Found online at http://www.bondmarkets.com/Research/TSYISSTLS.shtml. 113 Fleming (Fall 2000): 233.

FEDERAL DEBT PAGE 37
Federal debt reduction is disturbing the historical relationships between the yields on Treasuries and the yield on other securities that made Treasuries useful as a pricing benchmark and a regulatory tool. As Treasuries become increasingly scarce, the spread between their yields and the yields on other taxable debt securities is growing. Graph 11 shows the growing difference between the 30-year Treasury bond yield and Moody’s yield indices for seasoned Aaa-, Aa-, A-, and Baa-rated corporate bonds. Also reflecting the growing scarcity of Treasuries, Graph 12 displays the narrowing difference between yields on taxable 20-year constant maturity Treasuries and tax-exempt 20-year municipal bonds in Moody’s composite index.114
114 Other factors such as the business cycle may influence the magnitude of these changes.
Graph 11 - Federal Net Debt Reduction Alters Yield Relationship with Corporate Bonds
0
50
100
150
200
250
300Ja
n-97
Apr
-97
Jul-9
7
Oct
-97
Jan-
98
Apr
-98
Jul-9
8
Oct
-98
Jan-
99
Apr
-99
Jul-9
9
Oct
-99
Jan-
00
Apr
-00
Jul-0
0
Oct
-00
Jan-
01
Apr
-01
Month
Bas
is P
oint
s ove
r 30
-Yea
r T
reas
ury
Bon
d Y
ield
Moody's Corporate Bond Yield, Aaa (% p.a.) less 30-Year Treasury Bond Yield at Constant Maturity (% p.a.)Moody's Corporate Bond Yield, Aa (% p.a.) less 30-Year Treasury Bond Yield at Constant Maturity (% p.a.)Moody's Corporate Bond Yield, A (% p.a.) less 30-Year Treasury Bond Yield at Constant Maturity (% p.a.)Moody's Corporate Bond Yield, Baa (% p.a.) less 30-Year Treasury Bond Yield at Constant Maturity (% p.a.)
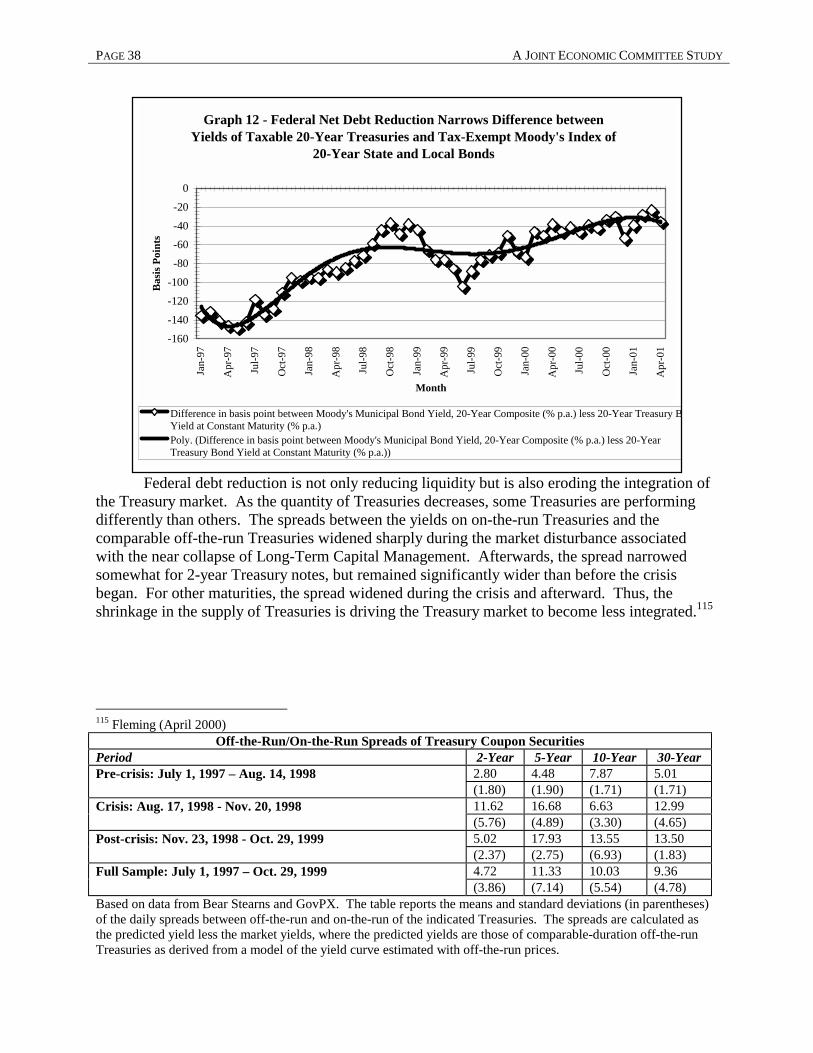
PAGE 38 A JOINT ECONOMIC COMMITTEE STUDY
Federal debt reduction is not only reducing liquidity but is also eroding the integration of the Treasury market. As the quantity of Treasuries decreases, some Treasuries are performing differently than others. The spreads between the yields on on-the-run Treasuries and the comparable off-the-run Treasuries widened sharply during the market disturbance associated with the near collapse of Long-Term Capital Management. Afterwards, the spread narrowed somewhat for 2-year Treasury notes, but remained significantly wider than before the crisis began. For other maturities, the spread widened during the crisis and afterward. Thus, the shrinkage in the supply of Treasuries is driving the Treasury market to become less integrated.115
115 Fleming (April 2000)
Off-the-Run/On-the-Run Spreads of Treasury Coupon Securities Period 2-Year 5-Year 10-Year 30-Year
2.80 4.48 7.87 5.01 Pre-crisis: July 1, 1997 – Aug. 14, 1998 (1.80) (1.90) (1.71) (1.71) 11.62 16.68 6.63 12.99 Crisis: Aug. 17, 1998 - Nov. 20, 1998 (5.76) (4.89) (3.30) (4.65) 5.02 17.93 13.55 13.50 Post-crisis: Nov. 23, 1998 - Oct. 29, 1999 (2.37) (2.75) (6.93) (1.83) 4.72 11.33 10.03 9.36 Full Sample: July 1, 1997 – Oct. 29, 1999 (3.86) (7.14) (5.54) (4.78)
Based on data from Bear Stearns and GovPX. The table reports the means and standard deviations (in parentheses) of the daily spreads between off-the-run and on-the-run of the indicated Treasuries. The spreads are calculated as the predicted yield less the market yields, where the predicted yields are those of comparable-duration off-the-run Treasuries as derived from a model of the yield curve estimated with off-the-run prices.
Graph 12 - Federal Net Debt Reduction Narrows Difference between Yields of Taxable 20-Year Treasuries and Tax-Exempt Moody's Index of
20-Year State and Local Bonds
-160
-140
-120
-100
-80
-60
-40
-20
0Ja
n-97
Apr
-97
Jul-9
7
Oct
-97
Jan-
98
Apr
-98
Jul-9
8
Oct
-98
Jan-
99
Apr
-99
Jul-9
9
Oct
-99
Jan-
00
Apr
-00
Jul-0
0
Oct
-00
Jan-
01
Apr
-01
Month
Bas
is P
oint
s
Difference in basis point between Moody's Municipal Bond Yield, 20-Year Composite (% p.a.) less 20-Year Treasury BYield at Constant Maturity (% p.a.)Poly. (Difference in basis point between Moody's Municipal Bond Yield, 20-Year Composite (% p.a.) less 20-YearTreasury Bond Yield at Constant Maturity (% p.a.))
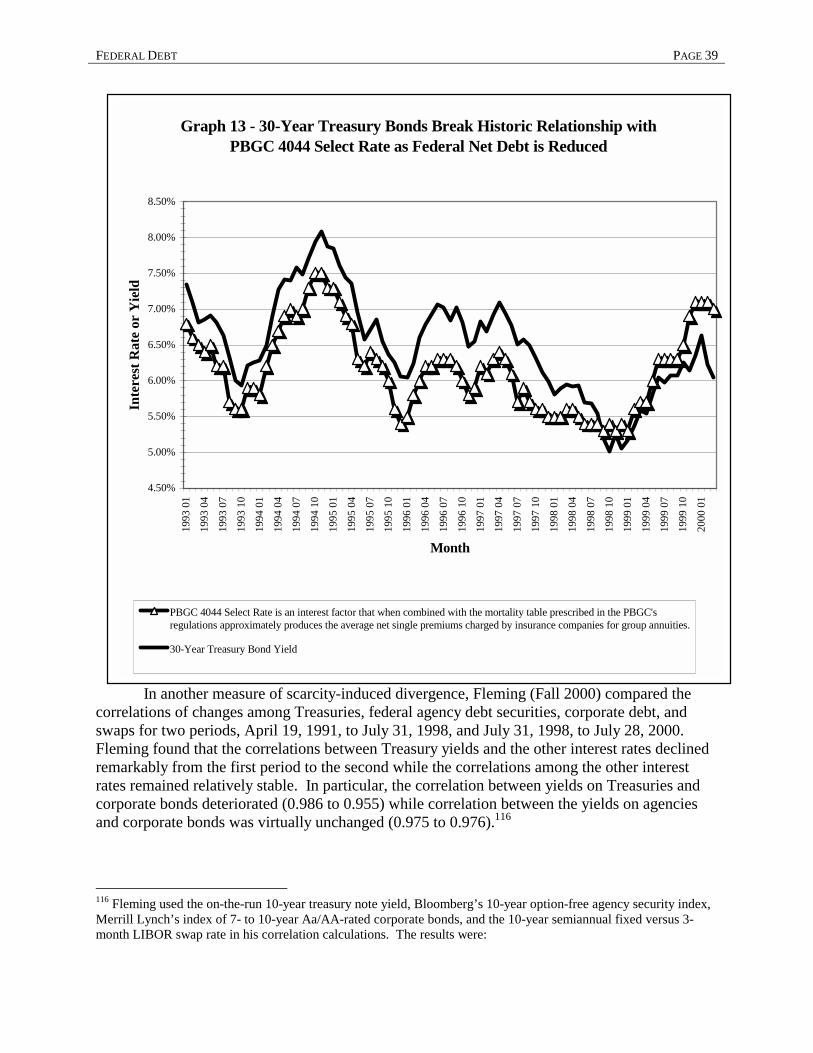
FEDERAL DEBT PAGE 39
In another measure of scarcity-induced divergence, Fleming (Fall 2000) compared the correlations of changes among Treasuries, federal agency debt securities, corporate debt, and swaps for two periods, April 19, 1991, to July 31, 1998, and July 31, 1998, to July 28, 2000. Fleming found that the correlations between Treasury yields and the other interest rates declined remarkably from the first period to the second while the correlations among the other interest rates remained relatively stable. In particular, the correlation between yields on Treasuries and corporate bonds deteriorated (0.986 to 0.955) while correlation between the yields on agencies and corporate bonds was virtually unchanged (0.975 to 0.976).116
116 Fleming used the on-the-run 10-year treasury note yield, Bloomberg’s 10-year option-free agency security index, Merrill Lynch’s index of 7- to 10-year Aa/AA-rated corporate bonds, and the 10-year semiannual fixed versus 3-month LIBOR swap rate in his correlation calculations. The results were:
Graph 13 - 30-Year Treasury Bonds Break Historic Relationship with PBGC 4044 Select Rate as Federal Net Debt is Reduced
4.50%
5.00%
5.50%
6.00%
6.50%
7.00%
7.50%
8.00%
8.50% 1
993
01
199
3 04
199
3 07
199
3 10
199
4 01
199
4 04
199
4 07
199
4 10
199
5 01
199
5 04
199
5 07
199
5 10
199
6 01
199
6 04
199
6 07
199
6 10
199
7 01
199
7 04
199
7 07
199
7 10
199
8 01
199
8 04
199
8 07
199
8 10
199
9 01
199
9 04
199
9 07
199
9 10
200
0 01
Month
Inte
rest
Rat
e or
Yie
ld
PBGC 4044 Select Rate is an interest factor that when combined with the mortality table prescribed in the PBGC'sregulations approximately produces the average net single premiums charged by insurance companies for group annuities.
30-Year Treasury Bond Yield
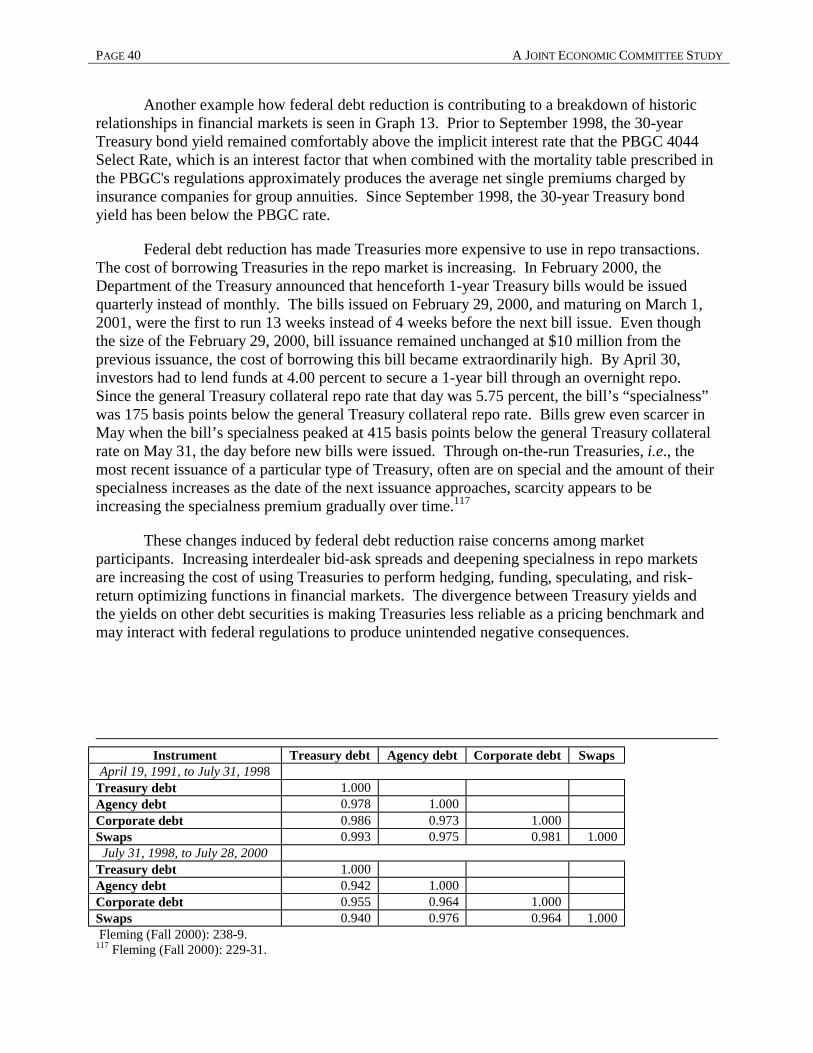
PAGE 40 A JOINT ECONOMIC COMMITTEE STUDY
Another example how federal debt reduction is contributing to a breakdown of historic relationships in financial markets is seen in Graph 13. Prior to September 1998, the 30-year Treasury bond yield remained comfortably above the implicit interest rate that the PBGC 4044 Select Rate, which is an interest factor that when combined with the mortality table prescribed in the PBGC's regulations approximately produces the average net single premiums charged by insurance companies for group annuities. Since September 1998, the 30-year Treasury bond yield has been below the PBGC rate.
Federal debt reduction has made Treasuries more expensive to use in repo transactions. The cost of borrowing Treasuries in the repo market is increasing. In February 2000, the Department of the Treasury announced that henceforth 1-year Treasury bills would be issued quarterly instead of monthly. The bills issued on February 29, 2000, and maturing on March 1, 2001, were the first to run 13 weeks instead of 4 weeks before the next bill issue. Even though the size of the February 29, 2000, bill issuance remained unchanged at $10 million from the previous issuance, the cost of borrowing this bill became extraordinarily high. By April 30, investors had to lend funds at 4.00 percent to secure a 1-year bill through an overnight repo. Since the general Treasury collateral repo rate that day was 5.75 percent, the bill’s “specialness” was 175 basis points below the general Treasury collateral repo rate. Bills grew even scarcer in May when the bill’s specialness peaked at 415 basis points below the general Treasury collateral rate on May 31, the day before new bills were issued. Through on-the-run Treasuries, i.e., the most recent issuance of a particular type of Treasury, often are on special and the amount of their specialness increases as the date of the next issuance approaches, scarcity appears to be increasing the specialness premium gradually over time.117
These changes induced by federal debt reduction raise concerns among market participants. Increasing interdealer bid-ask spreads and deepening specialness in repo markets are increasing the cost of using Treasuries to perform hedging, funding, speculating, and risk-return optimizing functions in financial markets. The divergence between Treasury yields and the yields on other debt securities is making Treasuries less reliable as a pricing benchmark and may interact with federal regulations to produce unintended negative consequences.
Instrument Treasury debt Agency debt Corporate debt Swaps
April 19, 1991, to July 31, 1998 Treasury debt 1.000 Agency debt 0.978 1.000 Corporate debt 0.986 0.973 1.000 Swaps 0.993 0.975 0.981 1.000 July 31, 1998, to July 28, 2000
Treasury debt 1.000 Agency debt 0.942 1.000 Corporate debt 0.955 0.964 1.000 Swaps 0.940 0.976 0.964 1.000 Fleming (Fall 2000): 238-9. 117 Fleming (Fall 2000): 229-31.
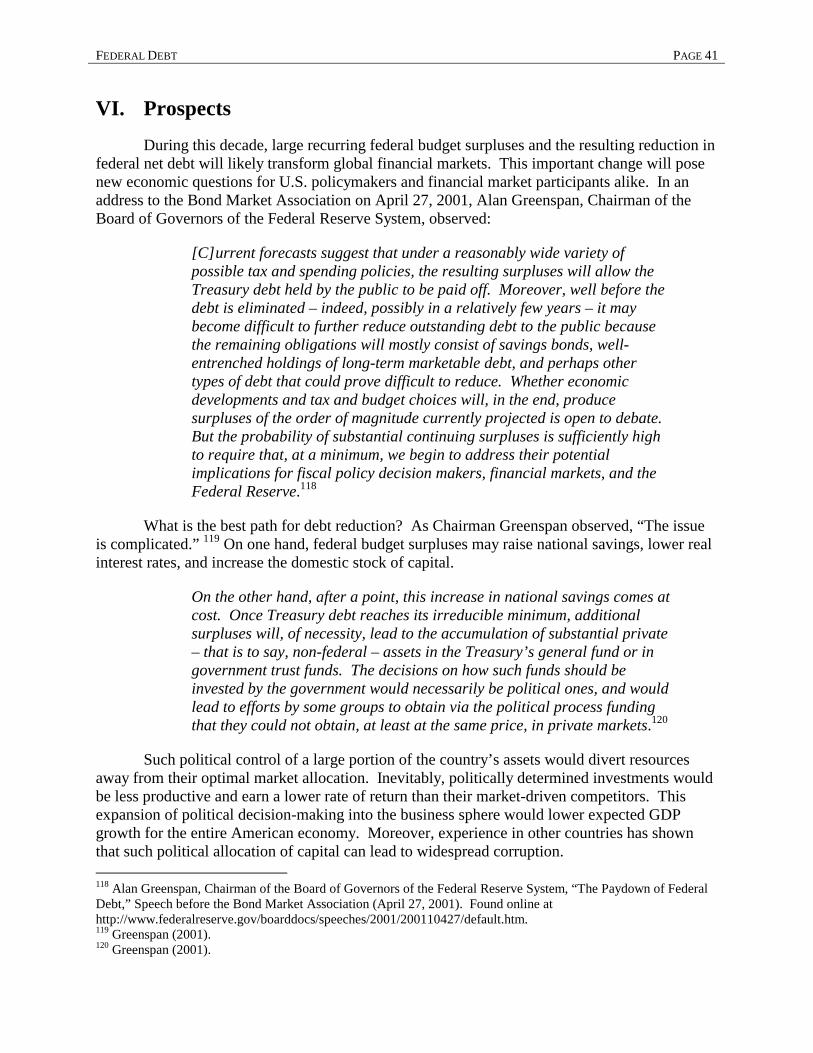
FEDERAL DEBT PAGE 41
VI. Prospects During this decade, large recurring federal budget surpluses and the resulting reduction in
federal net debt will likely transform global financial markets. This important change will pose new economic questions for U.S. policymakers and financial market participants alike. In an address to the Bond Market Association on April 27, 2001, Alan Greenspan, Chairman of the Board of Governors of the Federal Reserve System, observed:
[C]urrent forecasts suggest that under a reasonably wide variety of possible tax and spending policies, the resulting surpluses will allow the Treasury debt held by the public to be paid off. Moreover, well before the debt is eliminated – indeed, possibly in a relatively few years – it may become difficult to further reduce outstanding debt to the public because the remaining obligations will mostly consist of savings bonds, well-entrenched holdings of long-term marketable debt, and perhaps other types of debt that could prove difficult to reduce. Whether economic developments and tax and budget choices will, in the end, produce surpluses of the order of magnitude currently projected is open to debate. But the probability of substantial continuing surpluses is sufficiently high to require that, at a minimum, we begin to address their potential implications for fiscal policy decision makers, financial markets, and the Federal Reserve.118
What is the best path for debt reduction? As Chairman Greenspan observed, “The issue is complicated.” 119 On one hand, federal budget surpluses may raise national savings, lower real interest rates, and increase the domestic stock of capital.
On the other hand, after a point, this increase in national savings comes at cost. Once Treasury debt reaches its irreducible minimum, additional surpluses will, of necessity, lead to the accumulation of substantial private – that is to say, non-federal – assets in the Treasury’s general fund or in government trust funds. The decisions on how such funds should be invested by the government would necessarily be political ones, and would lead to efforts by some groups to obtain via the political process funding that they could not obtain, at least at the same price, in private markets.120
Such political control of a large portion of the country’s assets would divert resources away from their optimal market allocation. Inevitably, politically determined investments would be less productive and earn a lower rate of return than their market-driven competitors. This expansion of political decision-making into the business sphere would lower expected GDP growth for the entire American economy. Moreover, experience in other countries has shown that such political allocation of capital can lead to widespread corruption. 118 Alan Greenspan, Chairman of the Board of Governors of the Federal Reserve System, “The Paydown of Federal Debt,” Speech before the Bond Market Association (April 27, 2001). Found online at http://www.federalreserve.gov/boarddocs/speeches/2001/200110427/default.htm. 119 Greenspan (2001). 120 Greenspan (2001).

PAGE 42 A JOINT ECONOMIC COMMITTEE STUDY
Turning to the implications for global financial markets, Greenspan noted, “[T]he elimination of Treasury debt does remove something of economic value, and it will require that significant adjustments be made by market participants.”121 Financial market participants can and will make adjustments to adapt to the rapid reduction and elimination of federal net debt. However, such adjustments are not costless and involve some credit risk.
This additional credit risk may increase systemic risk during an economic disturbance. Financial markets face a fundamental difficulty in finding a substitute for Treasury bills, which essentially function as money. All inside moneys (such as bank deposits) are the liabilities of profit-maximizing private firms, and their creation is tied to such firms’ acquisition of assets whose value and liquidity are necessarily subject to risk. Unlike outside money (such as Federal Reserve notes and Treasury bills), inside moneys are always vulnerable to a confidence crisis.
In past crises, primary dealers could accommodate a “flight to quality” with Treasuries on hand or borrowing Treasuries from the Federal Reserve. Thus, high denomination balances of inside money could be converted into Treasuries without the destructive reversal of the monetary multiplier. In the future, a flight to quality will likely concentrate inside money into a few, giant “too big to fail” financial institutions. Albert M. Wojnilower predicts, “Those few institutions whose ‘too big to fail’ [status] is conferred are likely to grow inordinately huge and powerful.”122
Finally, the disappearance of Treasuries will profoundly affect the Federal Reserve and its conduct of U.S. monetary policy. “The Federal Reserve will have to find alternative assets that still provide substantial liquidity and minimize the distortions to the private allocation of capital.”123 In the short-run, the Federal Reserve has established limits on the fraction of individual Treasury issues that it will hold and has begun to conduct repurchase agreements with agency mortgage backed securities as well as Treasury and agency debt. The Federal Reserve is currently reviewing its options for the long-run. One option may be “to expand the discount window by auctioning such credit to financially sound depository institutions.”124 Another option may be to seek legislation to expand the permissible assets for the Federal Reserve’s portfolio.
VII. Conclusion Since 1776, the United States has been borrowing from global financial markets. After
the Continental Congress failed to service U.S. Revolutionary War debts fully and promptly, the first Secretary of the Treasury Alexander Hamilton restored U.S. credibility by establishing sound goals and principles for the management of U.S. government debt that made U.S. Treasury securities the safest and most liquid investment in the world.
Treasuries do far more than finance federal budget deficits. Unique characteristics allow Treasuries and Treasury derivatives to perform many other economic functions. These include: a 121 Greenspan (2001). 122 Albert M. Wojnilower, “Life Without Treasury Securities,” Business Economics (October 2000): 14. 123 Greenspan (2001). 124 Greenspan (2001).
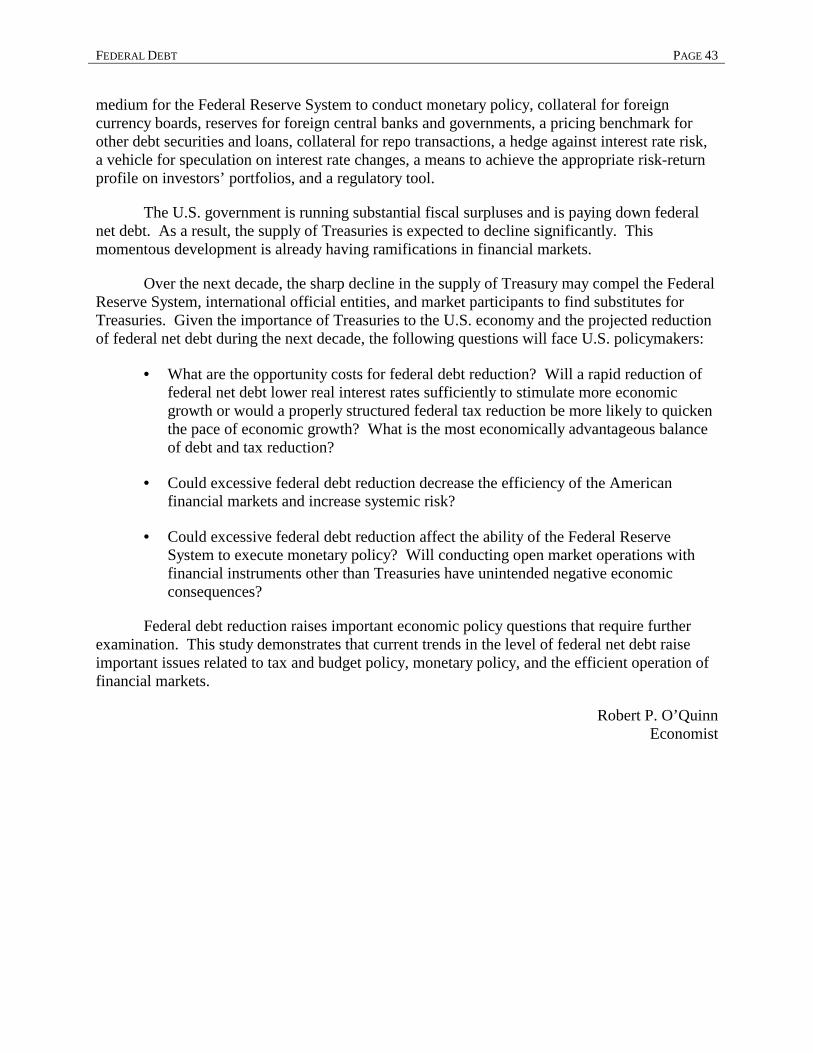
FEDERAL DEBT PAGE 43
medium for the Federal Reserve System to conduct monetary policy, collateral for foreign currency boards, reserves for foreign central banks and governments, a pricing benchmark for other debt securities and loans, collateral for repo transactions, a hedge against interest rate risk, a vehicle for speculation on interest rate changes, a means to achieve the appropriate risk-return profile on investors’ portfolios, and a regulatory tool.
The U.S. government is running substantial fiscal surpluses and is paying down federal net debt. As a result, the supply of Treasuries is expected to decline significantly. This momentous development is already having ramifications in financial markets.
Over the next decade, the sharp decline in the supply of Treasury may compel the Federal Reserve System, international official entities, and market participants to find substitutes for Treasuries. Given the importance of Treasuries to the U.S. economy and the projected reduction of federal net debt during the next decade, the following questions will face U.S. policymakers:
• What are the opportunity costs for federal debt reduction? Will a rapid reduction of federal net debt lower real interest rates sufficiently to stimulate more economic growth or would a properly structured federal tax reduction be more likely to quicken the pace of economic growth? What is the most economically advantageous balance of debt and tax reduction?
• Could excessive federal debt reduction decrease the efficiency of the American financial markets and increase systemic risk?
• Could excessive federal debt reduction affect the ability of the Federal Reserve System to execute monetary policy? Will conducting open market operations with financial instruments other than Treasuries have unintended negative economic consequences?
Federal debt reduction raises important economic policy questions that require further examination. This study demonstrates that current trends in the level of federal net debt raise important issues related to tax and budget policy, monetary policy, and the efficient operation of financial markets.
Robert P. O’Quinn Economist
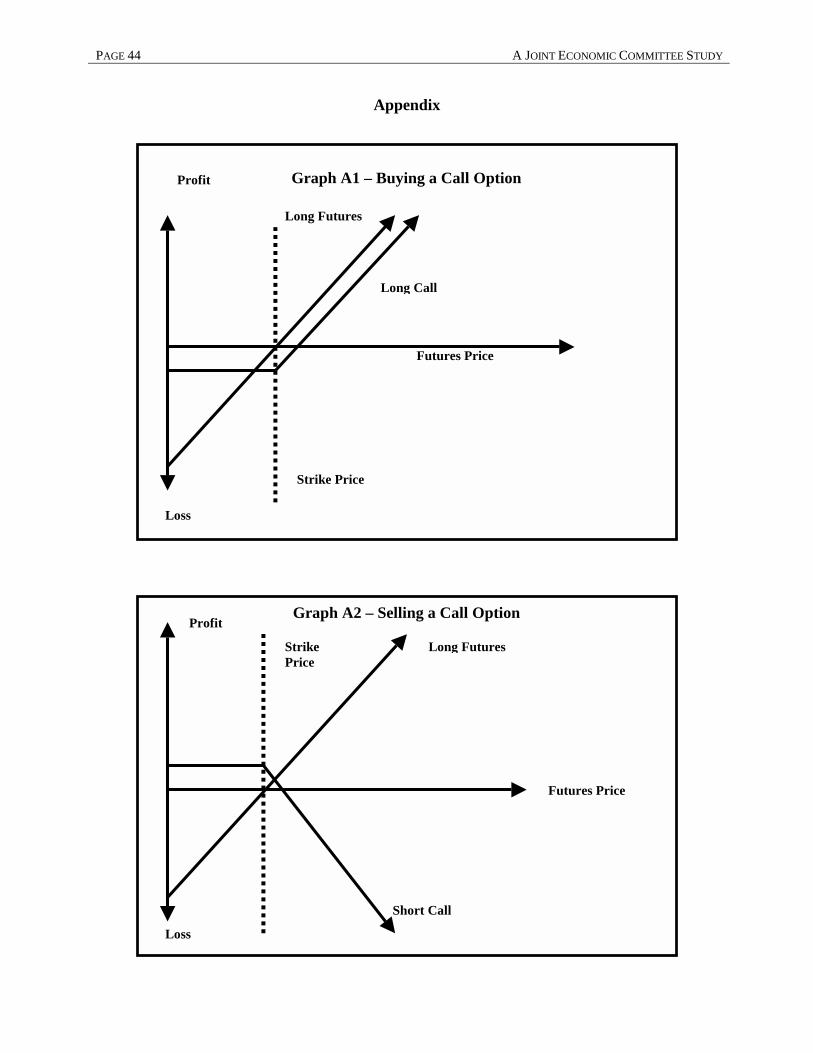
PAGE 44 A JOINT ECONOMIC COMMITTEE STUDY
Appendix
Graph A1 – Buying a Call Option
Profit
Loss
Long Futures
Futures Price
Long Call
Strike Price
Graph A2 – Selling a Call Option
Strike Price
Loss
Long Futures
Futures Price
Short Call
Strike Price
Profit
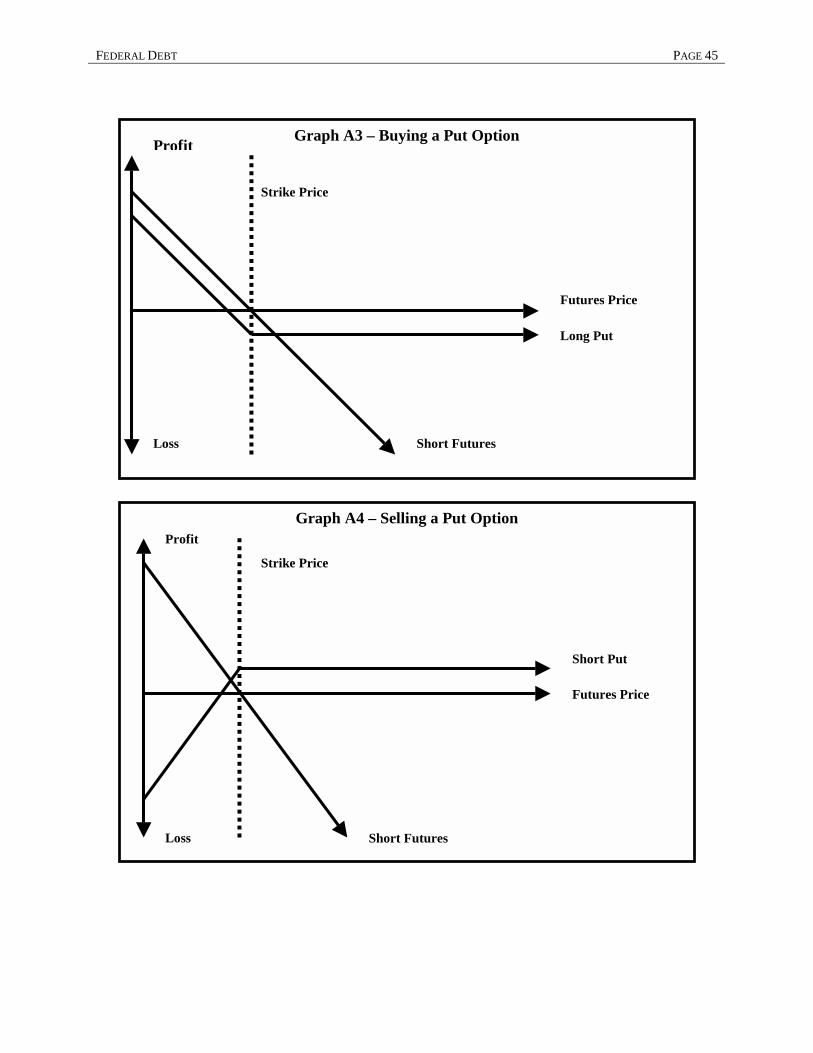
FEDERAL DEBT PAGE 45
Graph A3 – Buying a Put Option Profit
Loss Short Futures
Futures Price
Long Put
Strike Price
Graph A4 – Selling a Put Option Profit
Loss Short Futures
Futures Price
Short Put
Strike Price

PAGE 46 A JOINT ECONOMIC COMMITTEE STUDY
References
Bomfim, Antulio N. Optimal Portfolio Allocation in a World Without Treasury Securities. Finance and Economic Discussion Series. Washington, D.C.: Divisions of Research & Statistics and Monetary Affairs, Board of Governors of the Federal Reserve System, January 2001.
Board of Governors of the Federal Reserve System. Report H.4.1. Factors Affecting Reserve Balances of Depository Institutions and Condition State of Federal Reserve Banks. October 5, 2000. Found online at http://www.federalreserve.gov/releases/H41/20001005/.
Board of Governors of the Federal Reserve System, “Table 1.42 U.S. Government Securities Dealers Transactions,” Federal Reserve Bulletin (April 2001): A28.
Bond Market Association. Average Daily Trading Volume of U.S. Treasury Securities 1980-2000. Found online at http://www.bondmarkets.com/Research/tsytrad.shtml.
Bond Market Association. Research Quarterly. Washington, D.C.: Bond Market Association, February 2001.
Bond Market Association. Short- & Long-Term Issuance of U.S. Treasury Securities 1980-2000. Found online at http://www.bondmarkets.com/Research/TSYISSTLS.shtml.
Chicago Board of Trade. Action in the Marketplace. Chicago: Chicago Board of Trade, 2000. Found online at http://www.cbot.com/cbot/www/page/0,1398,14+60+142,00.html.
Chicago Board of Trade. An Introduction to Options on Financial Futures. Chicago: Chicago Board of Trade, 1998. Found online at http://www.cbot.com/cbot/www/page/0,1398,14+60+145,00.html.
Chicago Board of Trade, Knowledge Center, Product Information. Found online at http://www.cbot.com/cbot/www/page/0,1398,14+56+136,00.html.
Chicago Board of Trade. Market Information, Volume, Historical. April 20, 2001. Found online at http://www.cbot.com/cbot/www/page/0,1398,13+45+131,00.html.
Chicago Mercantile Exchange. Products, How to Get Started Trading CME Interest Rate Products: Section One: CME Interest Rate Products. Found online at http://www.cme.com/market/interest/howto/products.html.
Chicago Mercantile Exchange. Products, How to Get Started Trading CME Interest Rate Products: Section Three: Options on Interest Rate Futures. Found online at http://www.cme.com/market/interest/howto/options.html.
Dupont, Dominique and Brian Sack. “The Treasury Securities Market: Overview and Recent Developments.” Federal Reserve Bulletin (December 1999): 785-806.
Executive Office of the President, Office of Management and Budget. Budget of the United States, Fiscal Year 2000, Analytical Perspectives, vol. 3. Washington, D.C.: Government Printing Office, 2000.
Executive Office of the President, Office of Management and Budget. Budget of the United States, Fiscal Year 2002, Historical Tables, vol. 4. Washington, D.C.: Government Printing Office, 2001.
Federal Reserve Bank of New York. List of Primary Government Securities Dealers Reporting to the Securities Division of Federal Reserve Bank of New York. May 23, 2001. Found online at: www.ny.frb.org/pihome/news/opnmktops/2001/an01523.html.
Federal Reserve Bank of New York. Total Primary Dealer Transactions Volume in U.S. Government and Federal Agency Securities Market Share. February 1, 2001.
Fleming, Michael J. “The Benchmark U.S. Treasury Market: Recent Performance and Possible Alternatives.” Federal Reserve Bank of New York Economic Policy Review (April 2000): 129-145.
Fleming, Michael J. “Financial Market Implications of the Federal Debt Paydown.” Brookings Papers on Economic Activity, 2 (Fall 2000): 221 - 251.
Greenspan, Alan, Chairman of the Board of Governors of the Federal Reserve System. “The Paydown of Federal Debt.” Speech before the Bond Market Association (April 27, 2001). Found online at http://www.federalreserve.gov/boarddocs/speeches/2001/200110427/default.htm.
FEDERAL DEBT PAGE 47
Hamilton, Alexander. “First Report on the Public Credit” in The Works of Alexander Hamilton, Vol. 2. Edited by Henry Cabot Lodge. New York: Haskell House Publishers Ltd., 1971.
Kelly, Harold A., Jr., Oz Capital. Interview with author. New York, NY, April 25, 2001.
McDonald, Forrest. Alexander Hamilton: A Biography. New York: W. W. Norton & Company, 1979.
New York Stock Exchange. The Year 2000 in Review. New York: New York Stock Exchange, 2001. Found online at http://www.nyse.com/pdfs/09_BONDS.pdf.
Paulus, Michael J., Deputy Assistant Secretary for Federal Finance, U.S. Department of the Treasury. Interview with author. Washington, D.C., April 11, 2001.
Reinhart, Vincent and Brian Sack. “The Economic Consequences of Disappearing Government Debt.” Brookings Papers on Economic Activity, 2: (Fall 2000): 163-200.
Schinasi, Garry J., Charles F. Kramer, and R. Todd Smith. Financial Implication of the Shrinking Supply of U.S. Treasury Securities. Washington, D.C.: International Monetary Fund, March 20, 2000.
U.S. Congress, Congressional Budget Office. The Budget and Economic Outlook: Fiscal Years 2002-2011. Washington, D.C.: Government Printing Office, 2001.
U.S. Congress, Joint Committee on Taxation. Estimated Budget Effects of the Conference Agreement for H.R.1836. May 26, 2001.
U.S. Department of Commerce, Bureau of Economic Analysis. Gross Domestic Product: First Quarter (Advance) news release. April 27, 2001.
U.S. Department of the Treasury, “Table S-1 – Distribution of Federal Securities by Class of Investors and Type of Issues” and “Table S-2 – Estimated Ownership of U.S. Treasury Securities,” Treasury Bulletin (March 2001). Found online at http://www.fms.treas.gov/bulletin/b11.html.
U.S. Department of the Treasury, Bureau of the Public Debt. Monthly Statement of the Public Debt. Government Printing Office: Washington, D.C., various dates.
U.S. Department of the Treasury, Internal Revenue Service. Discount on Debt Instruments. Found online at http://www.irs.gov/prod/forms_pubs/pubs/p5500103.htm.
Wojnilower, Albert M. “Life Without Treasury Securities.” Business Economics (October 2000): 10-15.