Federal Bureau of Prisons BOP Hiring and Staffing Report ...
23
1 Federal Bureau of Prisons BOP Hiring and Staffing Report FY 2020 3 rd Quarter Report Legislative Summary The Senate Report (S. Rept. 116-127) accompanying the Consolidated Appropriations Act, 2020 (P. L. 116-93) states, “The Committee directs BOP to submit quarterly hiring and staffing reports, including corrections officer-to-inmate ratios from Pay Period 26–2016 to the present for the OPM position classification standard Correctional Officer Series GS–0007, broken out by region; institution, to include an additional subset for each facility within an institutional complex; and security level no later than 90 days after enactment of this act. For further transparency, this data is also directed to be published on BOP’s website. BOP previously notified the Committee that it does not currently record staffing by shift [morning watch, day watch, evening watch], but is directed to start recording this data and include these metrics in this report by the end of the fiscal year. For any institution with a staffing ratio greater than 15:1, or an incident involving deadly force in any such report, BOP shall provide a separate, detailed explanation of the role staffing may or may not have played in the incident along with a corrective plan to ensure it will not happen again.” The following information is provided to address the Committee’s request for the Third Quarter of FY 2020. Report During the third quarter of FY 2020, there were five institutions with an inmate-to-correctional officer ratio greater than 15:1. Please see separate explanations below the table of inmate-to- correctional officer ratios. The BOP has made the hiring of additional Correctional Officers a systemwide priority, and progress is already evident. At the end of the second quarter of FY 2020, there were ten institutions with an inmate-to-correctional officer ratio greater than 15:1. As of June 30, 2020, all ten of those institutions have improved their staffing ratio: Federal Prison Camp (FPC) Alderson, Federal Correctional Institution (FCI) Bastrop, FPC Bryan, FCI Elkton, Federal Correctional Complex Lompoc, FPC Montgomery, FPC Pensacola, FCI Seagoville, FCI Sheridan, and FPC Yankton. Of those, five institutions had a staffing ratio lower than 15:1 at the end of the third quarter: FCI Bastrop, FPC Pensacola, FCI Seagoville, FCI Sheridan, and FPC Yankton. There are zero institutions that have a staffing ratio greater than 15:1 at the end of the third quarter that did not at the end of the second quarter. A search of all Report of Incidents revealed there was no use of deadly force from April 1, 2020, to June 30, 2020. The BOP will publish this data on its website: https://www.bop.gov/.
Transcript of Federal Bureau of Prisons BOP Hiring and Staffing Report ...

1
Federal Bureau of Prisons BOP Hiring and Staffing Report
FY 2020 3rd Quarter Report
Legislative Summary
The Senate Report (S. Rept. 116-127) accompanying the Consolidated Appropriations Act, 2020 (P. L. 116-93) states, “The Committee directs BOP to submit quarterly hiring and staffing reports, including corrections officer-to-inmate ratios from Pay Period 26–2016 to the present for the OPM position classification standard Correctional Officer Series GS–0007, broken out by region; institution, to include an additional subset for each facility within an institutional complex; and security level no later than 90 days after enactment of this act. For further transparency, this data is also directed to be published on BOP’s website. BOP previously notified the Committee that it does not currently record staffing by shift [morning watch, day watch, evening watch], but is directed to start recording this data and include these metrics in this report by the end of the fiscal year. For any institution with a staffing ratio greater than 15:1, or an incident involving deadly force in any such report, BOP shall provide a separate, detailed explanation of the role staffing may or may not have played in the incident along with a corrective plan to ensure it will not happen again.”
The following information is provided to address the Committee’s request for the Third Quarter of FY 2020.
Report
During the third quarter of FY 2020, there were five institutions with an inmate-to-correctional officer ratio greater than 15:1. Please see separate explanations below the table of inmate-to-correctional officer ratios.
The BOP has made the hiring of additional Correctional Officers a systemwide priority, and progress is already evident. At the end of the second quarter of FY 2020, there were ten institutions with an inmate-to-correctional officer ratio greater than 15:1. As of June 30, 2020, all ten of those institutions have improved their staffing ratio: Federal Prison Camp (FPC) Alderson, Federal Correctional Institution (FCI) Bastrop, FPC Bryan, FCI Elkton, Federal Correctional Complex Lompoc, FPC Montgomery, FPC Pensacola, FCI Seagoville, FCI Sheridan, and FPC Yankton. Of those, five institutions had a staffing ratio lower than 15:1 at the end of the third quarter: FCI Bastrop, FPC Pensacola, FCI Seagoville, FCI Sheridan, and FPC Yankton. There are zero institutions that have a staffing ratio greater than 15:1 at the end of the third quarter that did not at the end of the second quarter.
A search of all Report of Incidents revealed there was no use of deadly force from April 1, 2020, to June 30, 2020.
The BOP will publish this data on its website: https://www.bop.gov/.

2
FY 2016 (as of September 30, 2016)
REGION SECURITY LEVEL INSTITUTION INMATE TO CORRECTIONAL
OFFICERS RATIO MID-ATLANTIC
MINIMUM ALDERSON 19.7 MORGANTOWN 14.8 LOW ASHLAND 10.2 MEDIUM BECKLEY 12.6 CUMBERLAND 10.1 GILMER 9.9 MANCHESTER 8.8 MCDOWELL 9.7 MEMPHIS 9.4 HIGH BIG SANDY 5.5 LEE COUNTY 5.9 MCCREARY 6.3 COMPLEX BUTNER 8.2 HAZELTON 8.3 PETERSBERG 10.9 MEDICAL LEXINGTON 8.2 NORTH CENTRAL MINIMUM DULUTH 18.7 YANKTON 16.3 LOW ENGLEWOOD 7.8 MILAN 11.3 SANDSTONE 11.8 WASECA 9.7 MEDIUM GREENVILLE 10.9 LEAVENWORTH 11.4 MARION 9.6 OXFORD 7.9 PEKIN 10.9 HIGH *THOMSON N/A COMPLEX FLORENCE 4.7 TERRE HAUTE 6.9 MEDICAL ROCHESTER 5.0 SPRINGFIELD 4.9 DETENTION CHICAGO 5.8

3
REGION SECURITY LEVEL INSTITUTION INMATE TO CORRECTIONAL
OFFICERS RATIO NORTHEAST LOW DANBURY 9.0 ELKTON 14.0 FORT DIX 18.7 LORETTO 9.4 MEDIUM BERLIN 8.3 FAIRTON 9.0 MCKEAN 9.6 OTISVILLE 5.8 RAY BROOK 5.8 SCHUYLKILL 11.1 HIGH CANAAN 5.5 LEWISBURG 5.3 COMPLEX ALLENWOOD 7.2 MEDICAL DEVENS 5.3 DETENTION BROOKLYN 6.4 NEW YORK 6.4 PHILADELPHIA 6.6 SOUTH CENTRAL MINIMUM BRYAN 20.8 LOW BASTROP 15.0 BIG SPRING 14.3 FORT WORTH 13.8 LA TUNA 8.1 SEAGOVILLE 14.7 TEXARKANA 11.9 MEDIUM EL RENO 9.0 THREE RIVERS 10.5 COMPLEX BEAUMONT 11.6 FORREST CITY 13.9 OAKDALE 10.0 POLLOCK 7.3 MEDICAL CARSWELL 10.7 DETENTION HOUSTON 7.9 ADMIN OKLAHOMA CITY 10.6

4
REGION SECURITY LEVEL
INSTITUTION
INMATE TO CORRECTIONAL OFFICERS RATIO
SOUTHEAST MINIMUM MONTGOMERY 19.2 PENSACOLA 20.0 LOW ALICEVILLE 10.8 MIAMI FCI 14.2 TALLAHASSEE 8.4 MEDIUM ATLANTA 9.8 BENNETTSVILLE 9.7 EDGEFIELD 11.8 ESTILL 9.2 JESUP 9.2 MARIANNA 9.4 TALLADEGA 8.3 WILLIAMSBURG 10.9 COMPLEX COLEMAN 9.1 YAZOO CITY 10.0 DETENTION GUAYNABO 8.4 MIAMI FDC 8.3 WESTERN LOW DUBLIN 11.6 SAFFORD 9.6 TERMINAL ISLAND 9.4 MEDIUM HERLONG 7.9 MENDOTA 6.5 PHOENIX 9.6 SHERIDAN 10.4 HIGH ATWATER 5.0 COMPLEX LOMPOC 12.5 TUCSON 6.3 VICTORVILLE 7.5 DETENTION HONOLULU 3.8 LOS ANGELES 6.1 SAN DIEGO 8.0 SEATAC 4.5

5
FY 2017 (as of September 30, 2017)
REGION SECURITY LEVEL INSTITUTION INMATE TO CORRECTIONAL
OFFICERS RATIO MID-ATLANTIC
MINIMUM ALDERSON 19.1 MORGANTOWN 17.2 LOW ASHLAND 11.1 MEDIUM BECKLEY 11.9 CUMBERLAND 10.0 GILMER 10.1 MANCHESTER 8.5 MCDOWELL 7.6 MEMPHIS 9.6 HIGH BIG SANDY 5.4 LEE COUNTY 5.9 MCCREARY 6.3 COMPLEX BUTNER 8.4 HAZELTON 8.2 PETERSBERG 11.4 MEDICAL LEXINGTON 8.8 NORTH CENTRAL MINIMUM DULUTH 22.1 YANKTON 17.5 LOW ENGLEWOOD 9.2 MILAN 11.9 SANDSTONE 12.2 WASECA 8.4 MEDIUM GREENVILLE 12.5 LEAVENWORTH 12.3 MARION 10.3 OXFORD 8.9 PEKIN 9.7 HIGH *THOMSON N/A COMPLEX FLORENCE 5.4 TERRE HAUTE 6.9 MEDICAL ROCHESTER 5.3 SPRINGFIELD 4.9 DETENTION CHICAGO 6.8

6
REGION SECURITY LEVEL INSTITUTION INMATE TO CORRECTIONAL
OFFICERS RATIO NORTHEAST LOW DANBURY 9.9 ELKTON 15.3 FORT DIX 20.1 LORETTO 9.8 MEDIUM BERLIN 8.5 FAIRTON 8.2 MCKEAN 9.6 OTISVILLE 5.2 RAY BROOK 6.3 SCHUYLKILL 12.2 HIGH CANAAN 5.2 LEWISBURG 4.2 COMPLEX ALLENWOOD 7.3 MEDICAL DEVENS 5.3 DETENTION BROOKLYN 7.3 NEW YORK 6.3 PHILADELPHIA 8.0 SOUTH CENTRAL MINIMUM BRYAN 25.1 LOW BASTROP 15.8 BIG SPRING 13.5 FORT WORTH 14.1 LA TUNA 10.9 SEAGOVILLE 15.1 TEXARKANA 11.8 MEDIUM EL RENO 9.5 THREE RIVERS 11.7 COMPLEX BEAUMONT 11.7 FORREST CITY 14.2 OAKDALE 10.0 POLLOCK 7.2 MEDICAL CARSWELL 11.4 DETENTION HOUSTON 6.7 ADMIN OKLAHOMA CITY 11.3

7
REGION SECURITY LEVEL
INSTITUTION
INMATE TO CORRECTIONAL OFFICERS RATIO
SOUTHEAST MINIMUM MONTGOMERY 21.5 PENSACOLA 19.2 LOW ALICEVILLE 11.6 MIAMI FCI 12.2 TALLAHASSEE 7.3 MEDIUM ATLANTA 9.8 BENNETTSVILLE 9.7 EDGEFIELD 11.9 ESTILL 10.1 JESUP 9.9 MARIANNA 9.3 TALLADEGA 9.2 WILLIAMSBURG 10.1 COMPLEX COLEMAN 8.9 YAZOO CITY 13.7 DETENTION **GUAYNABO N/A MIAMI FDC 10.1 WESTERN LOW DUBLIN 13.3 SAFFORD 10.6 TERMINAL ISLAND 9.5 MEDIUM HERLONG 7.9 MENDOTA 6.5 PHOENIX 10.2 SHERIDAN 12.3 HIGH ATWATER 5.5 COMPLEX LOMPOC 12.1 TUCSON 6.2 VICTORVILLE 7.9 DETENTION HONOLULU 3.9 LOS ANGELES 12.1 SAN DIEGO 7.8 SEATAC 6.2

8
FY 2018 (as of September 30, 2018)
REGION SECURITY LEVEL INSTITUTION INMATE TO CORRECTIONAL
OFFICERS RATIO MID-ATLANTIC
MINIMUM ALDERSON 21.3 MORGANTOWN 18.6 LOW ASHLAND 11.3 MEDIUM BECKLEY 13.0 CUMBERLAND 10.4 GILMER 11.3 MANCHESTER 9.0 MCDOWELL 9.4 MEMPHIS 11.1 HIGH BIG SANDY 5.6 LEE COUNTY 5.7 MCCREARY 6.4 COMPLEX BUTNER 8.6 HAZELTON 8.7 PETERSBERG 10.8 MEDICAL LEXINGTON 9.0 NORTH CENTRAL MINIMUM DULUTH 21.7 YANKTON 19.8 LOW ENGLEWOOD 9.0 MILAN 11.8 SANDSTONE 12.1 WASECA 8.9 MEDIUM GREENVILLE 12.3 LEAVENWORTH 11.9 MARION 10.4 OXFORD 8.4 PEKIN 10.1 HIGH *THOMSON N/A COMPLEX FLORENCE 4.9 TERRE HAUTE 7.4 MEDICAL ROCHESTER 5.9 SPRINGFIELD 5.0 DETENTION CHICAGO 7.4

9
REGION SECURITY LEVEL INSTITUTION INMATE TO CORRECTIONAL
OFFICERS RATIO NORTHEAST LOW DANBURY 9.7 ELKTON 16.9 FORT DIX 21.7 LORETTO 10.6 MEDIUM BERLIN 10.5 FAIRTON 8.5 MCKEAN 10.3 OTISVILLE 7.4 RAY BROOK 7.1 SCHUYLKILL 11.8 HIGH CANAAN 5.9 LEWISBURG 5.4 COMPLEX ALLENWOOD 7.8 MEDICAL DEVENS 6.3 DETENTION BROOKLYN 7.8 NEW YORK 6.6 PHILADELPHIA 8.7 SOUTH CENTRAL MINIMUM BRYAN 24.2 LOW BASTROP 15.7 BIG SPRING 16.7 FORT WORTH 15.8 LA TUNA 8.0 SEAGOVILLE 16.7 TEXARKANA 12.1 MEDIUM EL RENO 9.8 THREE RIVERS 12.2 COMPLEX BEAUMONT 12.5 FORREST CITY 13.7 OAKDALE 10.2 POLLOCK 8.0 MEDICAL CARSWELL 12.3 DETENTION HOUSTON 6.8 ADMIN OKLAHOMA CITY 11.9

10
REGION SECURITY LEVEL
INSTITUTION
INMATE TO CORRECTIONAL OFFICERS RATIO
SOUTHEAST MINIMUM MONTGOMERY 24.7 PENSACOLA 20.2 LOW ALICEVILLE 13.1 MIAMI FCI 14.6 TALLAHASSEE 7.6 MEDIUM ATLANTA 10.4 BENNETTSVILLE 10.6 EDGEFIELD 13.7 ESTILL 11.2 JESUP 10.9 MARIANNA 8.8 TALLADEGA 9.5 WILLIAMSBURG 10.3 COMPLEX COLEMAN 10.0 YAZOO CITY 11.0 DETENTION GUAYNABO 10.0 MIAMI FDC 9.3 WESTERN LOW DUBLIN 16.1 SAFFORD 11.8 TERMINAL ISLAND 10.1 MEDIUM HERLONG 10.4 MENDOTA 8.1 PHOENIX 10.8 SHERIDAN 12.7 HIGH ATWATER 6.0 COMPLEX LOMPOC 15.7 TUCSON 7.3 VICTORVILLE 6.9 DETENTION HONOLULU 4.7 LOS ANGELES 6.9 SAN DIEGO 8.0 SEATAC 6.4

11
FY 2019 (as of September 28, 2019)
REGION SECURITY LEVEL INSTITUTION INMATE TO CORRECTIONAL
OFFICERS RATIO MID-ATLANTIC
MINIMUM ALDERSON 18.7 MORGANTOWN 16.2 LOW ASHLAND 10.7 MEDIUM BECKLEY 12.8 CUMBERLAND 11.8 GILMER 12.4 MANCHESTER 8.4 MCDOWELL 10.1 MEMPHIS 9.6 HIGH BIG SANDY 5.9 LEE COUNTY 6.3 MCCREARY 6.3 COMPLEX BUTNER 9.4 HAZELTON 6.9 PETERSBERG 12.1 MEDICAL LEXINGTON 9.2 NORTH CENTRAL MINIMUM DULUTH 15.0 YANKTON 14.9 LOW ENGLEWOOD 9.7 MILAN 13.3 SANDSTONE 12.5 WASECA MEDIUM GREENVILLE 13.5 LEAVENWORTH 11.8 MARION 11.2 OXFORD 9.1 PEKIN 11.8 HIGH *THOMSON N/A COMPLEX FLORENCE 5.3 TERRE HAUTE 7.4 MEDICAL ROCHESTER 5.7 SPRINGFIELD 4.6 DETENTION CHICAGO 6.8

12
REGION SECURITY LEVEL INSTITUTION INMATE TO CORRECTIONAL
OFFICERS RATIO NORTHEAST LOW DANBURY 8.3 ELKTON 16.1 FORT DIX 18.2 LORETTO 9.9 MEDIUM BERLIN 7.9 FAIRTON 9.2 MCKEAN 9.1 OTISVILLE 6.5 RAY BROOK 6.1 SCHUYLKILL 11.1 HIGH CANAAN 6.0 LEWISBURG 3.7 COMPLEX ALLENWOOD 8.1 MEDICAL DEVENS 5.8 DETENTION BROOKLYN 7.4 NEW YORK 7.4 PHILADELPHIA 8.5 SOUTH CENTRAL MINIMUM BRYAN 23.8 LOW BASTROP 15.8 BIG SPRING 13.5 FORT WORTH 13.6 LA TUNA 8.7 SEAGOVILLE 16.2 TEXARKANA 11.8 MEDIUM EL RENO 10.1 THREE RIVERS 12.6 COMPLEX BEAUMONT 12.2 FORREST CITY 13.2 OAKDALE 9.2 POLLOCK 7.9 MEDICAL CARSWELL 12.5 DETENTION HOUSTON 6.8 ADMIN OKLAHOMA CITY 8.3

13
REGION SECURITY LEVEL
INSTITUTION
INMATE TO CORRECTIONAL OFFICERS RATIO
SOUTHEAST MINIMUM MONTGOMERY 24.7 PENSACOLA 20.0 LOW ALICEVILLE 13.9 MIAMI FCI 12.3 TALLAHASSEE 7.6 MEDIUM ATLANTA 10.3 BENNETTSVILLE 10.7 EDGEFIELD 14.7 ESTILL 11.6 JESUP 11.2 **MARIANNA N/A TALLADEGA 10.0 WILLIAMSBURG 10.3 COMPLEX COLEMAN 10.0 YAZOO CITY 12.2 DETENTION GUAYNABO 10.3 MIAMI FDC 7.5 WESTERN LOW DUBLIN 16.2 SAFFORD 11.5 TERMINAL ISLAND 11.2 MEDIUM HERLONG 9.4 MENDOTA 9.9 PHOENIX 10.7 SHERIDAN 14.1 HIGH ATWATER 5.8 COMPLEX LOMPOC 17.2 TUCSON 5.5 VICTORVILLE 9.6 DETENTION HONOLULU 4.8 LOS ANGELES 17.2 SAN DIEGO 9.6 SEATAC 8.2

14
1st Quarter FY 2020 (as of December 8, 2019)
REGION SECURITY LEVEL INSTITUTION INMATE TO CORRECTIONAL
OFFICERS RATIO MID-ATLANTIC
MINIMUM ALDERSON 18.9 MORGANTOWN 15.0 LOW ASHLAND 10.5 MEDIUM BECKLEY 11.4 CUMBERLAND 10.9 GILMER 12.4 MANCHESTER 8.5 MCDOWELL 10.3 MEMPHIS 10.2 HIGH BIG SANDY 6.0 LEE COUNTY 6.4 MCCREARY 6.6 COMPLEX BUTNER 9.0 HAZELTON 7.3 PETERSBERG 11.9 MEDICAL LEXINGTON 8.5 NORTH CENTRAL MINIMUM DULUTH 14.1 YANKTON 15.6 LOW ENGLEWOOD 10.1 MILAN 11.2 SANDSTONE 12.9 WASECA 8.3 MEDIUM GREENVILLE 12.8 LEAVENWORTH 12.0 MARION 11.2 OXFORD 8.9 PEKIN 10.7 HIGH THOMSON 4.4 COMPLEX FLORENCE 5.3 TERRE HAUTE 7.2 MEDICAL ROCHESTER 5.8 SPRINGFIELD 4.6 DETENTION CHICAGO 6.8

15
REGION SECURITY LEVEL INSTITUTION INMATE TO CORRECTIONAL
OFFICERS RATIO NORTHEAST LOW DANBURY 8.4 ELKTON 15.8 FORT DIX 16.2 LORETTO 9.3 MEDIUM BERLIN 8.0 FAIRTON 9.1 MCKEAN 7.3 OTISVILLE 5.5 RAY BROOK 5.8 SCHUYLKILL 10.2 HIGH CANAAN 5.6 LEWISBURG 2.3 COMPLEX ALLENWOOD 7.7 MEDICAL DEVENS 5.4 DETENTION BROOKLYN 7.7 NEW YORK 7.6 PHILADELPHIA 7.5 SOUTH CENTRAL MINIMUM BRYAN 23.3 LOW BASTROP 14.9 BIG SPRING 13.6 FORT WORTH 13.6 LA TUNA 5.5 SEAGOVILLE 15.4 TEXARKANA 12.8 MEDIUM EL RENO 10.5 THREE RIVERS 11.1 COMPLEX BEAUMONT 11.8 FORREST CITY 13.4 OAKDALE 8.8 POLLOCK 8.0 MEDICAL CARSWELL 12.1 DETENTION HOUSTON 6.5 ADMIN OKLAHOMA CITY 7.9

16
REGION SECURITY LEVEL
INSTITUTION
INMATE TO CORRECTIONAL OFFICERS RATIO
SOUTHEAST MINIMUM MONTGOMERY 23.0 PENSACOLA 17.4 LOW ALICEVILLE 12.8 MIAMI FCI 12.3 TALLAHASSEE 7.1 MEDIUM ATLANTA 10.4 BENNETTSVILLE 9.6 EDGEFIELD 14.7 ESTILL 10.8 JESUP 10.9 **MARIANNA N/A TALLADEGA 8.9 WILLIAMSBURG 10.5 COMPLEX COLEMAN 9.3 YAZOO CITY 11.4 DETENTION GUAYNABO 8.8 MIAMI FDC 8.3 WESTERN LOW DUBLIN 16.1 SAFFORD 10.1 TERMINAL ISLAND 10.4 MEDIUM HERLONG 10.4 MENDOTA 9.1 PHOENIX 11.4 SHERIDAN 14.3 HIGH ATWATER 5.4 COMPLEX LOMPOC 17.0 TUCSON 5.6 VICTORVILLE 9.9 DETENTION HONOLULU 4.8 LOS ANGELES 6.2 SAN DIEGO 8.7 SEATAC 8.3

17
2nd Quarter FY 2020 (as of March 29, 2020)
REGION SECURITY LEVEL INSTITUTION INMATE TO CORRECTIONAL
OFFICERS RATIO MID-ATLANTIC
MINIMUM ALDERSON 19.3 MORGANTOWN 14.1 LOW ASHLAND 11.1 MEDIUM BECKLEY 12.3 CUMBERLAND 11.2 GILMER 11.9 MANCHESTER 8.4 MCDOWELL 9.9 MEMPHIS 10.5 HIGH BIG SANDY 6.3 LEE COUNTY 6.0 MCCREARY 6.3 COMPLEX BUTNER 9.3 HAZELTON 7.7 PETERSBERG 12.2 MEDICAL LEXINGTON 8.8 NORTH CENTRAL MINIMUM DULUTH 13.9 YANKTON 15.2 LOW ENGLEWOOD 10.3 MILAN 11.4 SANDSTONE 13.0 WASECA 8.9 MEDIUM GREENVILLE 12.0 LEAVENWORTH 12.6 MARION 11.0 OXFORD 9.4 PEKIN 12.0 HIGH THOMSON 5.3 COMPLEX FLORENCE 5.5 TERRE HAUTE 7.1 MEDICAL ROCHESTER 6.0 SPRINGFIELD 4.5 DETENTION CHICAGO 6.4

18
REGION SECURITY LEVEL INSTITUTION INMATE TO CORRECTIONAL
OFFICERS RATIO NORTHEAST LOW DANBURY 8.8 ELKTON 15.4 FORT DIX 13.8 LORETTO 9.3 MEDIUM BERLIN 8.3 FAIRTON 8.5 MCKEAN 6.9 OTISVILLE 5.6 RAY BROOK 5.5 SCHUYLKILL 10.2 HIGH CANAAN 5.6 LEWISBURG 2.6 COMPLEX ALLENWOOD 7.6 MEDICAL DEVENS 5.6 DETENTION BROOKLYN 8.3 NEW YORK 7.4 PHILADELPHIA 8.8 SOUTH CENTRAL MINIMUM BRYAN 23.4 LOW BASTROP 15.9 BIG SPRING 14.0 FORT WORTH 14.6 LA TUNA 6.5 SEAGOVILLE 15.2 TEXARKANA 11.1 MEDIUM EL RENO 10.6 THREE RIVERS 11.9 COMPLEX BEAUMONT 12.2 FORREST CITY 14.5 OAKDALE 8.0 POLLOCK 8.4 MEDICAL CARSWELL 12.5 DETENTION HOUSTON 7.1 ADMIN OKLAHOMA CITY 9.9
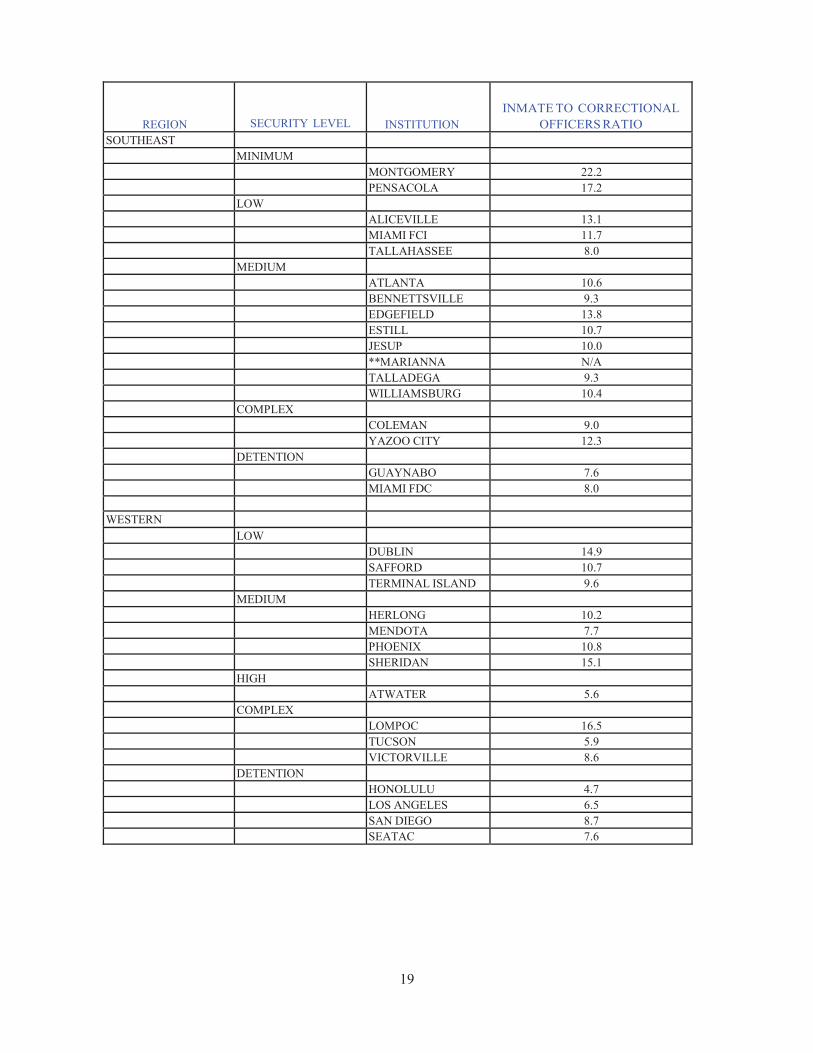
19
REGION SECURITY LEVEL
INSTITUTION
INMATE TO CORRECTIONAL OFFICERS RATIO
SOUTHEAST MINIMUM MONTGOMERY 22.2 PENSACOLA 17.2 LOW ALICEVILLE 13.1 MIAMI FCI 11.7 TALLAHASSEE 8.0 MEDIUM ATLANTA 10.6 BENNETTSVILLE 9.3 EDGEFIELD 13.8 ESTILL 10.7 JESUP 10.0 **MARIANNA N/A TALLADEGA 9.3 WILLIAMSBURG 10.4 COMPLEX COLEMAN 9.0 YAZOO CITY 12.3 DETENTION GUAYNABO 7.6 MIAMI FDC 8.0 WESTERN LOW DUBLIN 14.9 SAFFORD 10.7 TERMINAL ISLAND 9.6 MEDIUM HERLONG 10.2 MENDOTA 7.7 PHOENIX 10.8 SHERIDAN 15.1 HIGH ATWATER 5.6 COMPLEX LOMPOC 16.5 TUCSON 5.9 VICTORVILLE 8.6 DETENTION HONOLULU 4.7 LOS ANGELES 6.5 SAN DIEGO 8.7 SEATAC 7.6
20
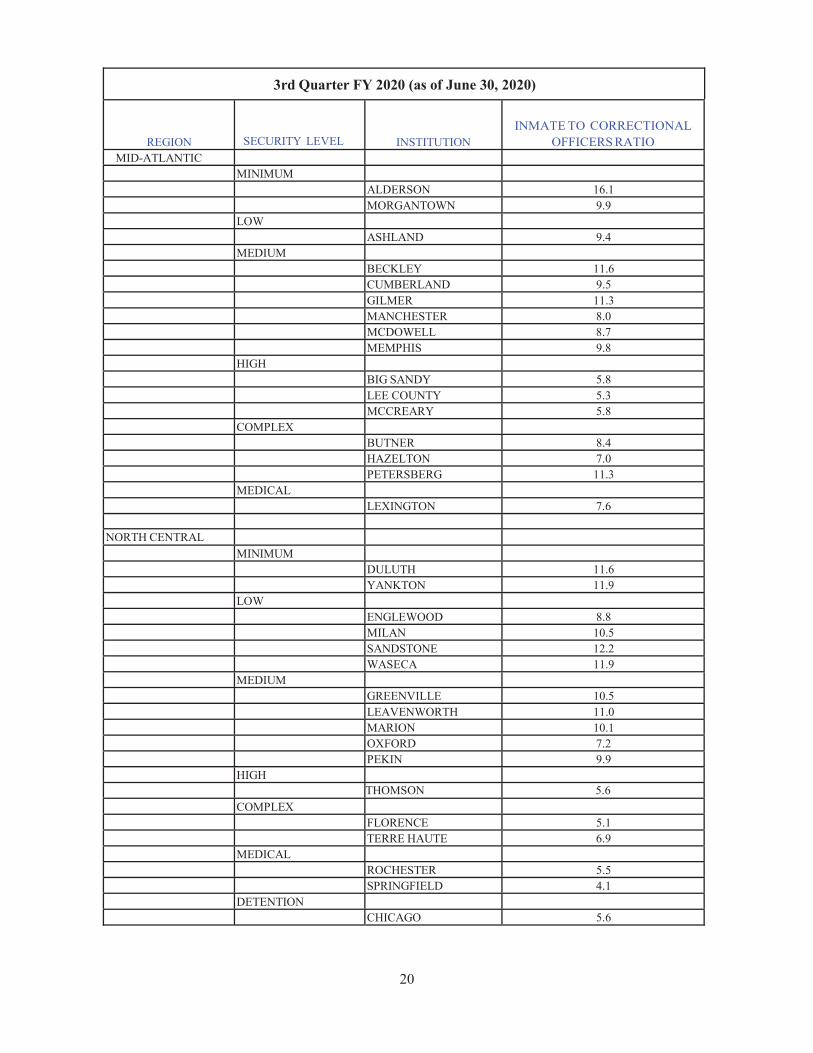
3rd Quarter FY 2020 (as of June 30, 2020)
REGION SECURITY LEVEL INSTITUTION INMATE TO CORRECTIONAL
OFFICERS RATIO MID-ATLANTIC
MINIMUM ALDERSON 16.1 MORGANTOWN 9.9 LOW ASHLAND 9.4 MEDIUM BECKLEY 11.6 CUMBERLAND 9.5 GILMER 11.3 MANCHESTER 8.0 MCDOWELL 8.7 MEMPHIS 9.8 HIGH BIG SANDY 5.8 LEE COUNTY 5.3 MCCREARY 5.8 COMPLEX BUTNER 8.4 HAZELTON 7.0 PETERSBERG 11.3 MEDICAL LEXINGTON 7.6 NORTH CENTRAL MINIMUM DULUTH 11.6 YANKTON 11.9 LOW ENGLEWOOD 8.8 MILAN 10.5 SANDSTONE 12.2 WASECA 11.9 MEDIUM GREENVILLE 10.5 LEAVENWORTH 11.0 MARION 10.1 OXFORD 7.2 PEKIN 9.9 HIGH THOMSON 5.6 COMPLEX FLORENCE 5.1 TERRE HAUTE 6.9 MEDICAL ROCHESTER 5.5 SPRINGFIELD 4.1 DETENTION CHICAGO 5.6

21
REGION SECURITY LEVEL INSTITUTION INMATE TO CORRECTIONAL
OFFICERS RATIO NORTHEAST LOW DANBURY 7.0 ELKTON 15.1 FORT DIX 12.5 LORETTO 8.7 MEDIUM BERLIN 7.4 FAIRTON 7.8 MCKEAN 6.4 OTISVILLE 5.3 RAY BROOK 5.2 SCHUYLKILL 9.4 HIGH CANAAN 5.0 LEWISBURG 6.5 COMPLEX ALLENWOOD 7.0 MEDICAL DEVENS 5.2 DETENTION BROOKLYN 7.1 NEW YORK 7.5 PHILADELPHIA 9.0 SOUTH CENTRAL MINIMUM BRYAN 18.0 LOW BASTROP 13.4 BIG SPRING 13.2 FORT WORTH 13.2 LA TUNA 5.2 SEAGOVILLE 14.3 TEXARKANA 9.6 MEDIUM EL RENO 9.2 THREE RIVERS 10.3 COMPLEX BEAUMONT 11.1 FORREST CITY 13.2 OAKDALE 7.5 POLLOCK 7.9 MEDICAL CARSWELL 10.5 DETENTION HOUSTON 4.0 ADMIN OKLAHOMA CITY 8.2

22
REGION SECURITY LEVEL
INSTITUTION
INMATE TO CORRECTIONAL OFFICERS RATIO
SOUTHEAST MINIMUM MONTGOMERY 16.3 PENSACOLA 10.0 LOW ALICEVILLE 11.8 MIAMI FCI 9.6 TALLAHASSEE 7.8 MEDIUM ATLANTA 9.1 BENNETTSVILLE 8.9 EDGEFIELD 11.3 **ESTILL N/A JESUP 8.5 ***MARIANNA N/A TALLADEGA 7.6 WILLIAMSBURG 9.9 COMPLEX COLEMAN 8.4 YAZOO CITY 12.5 DETENTION GUAYNABO 7.2 MIAMI FDC 8.2 WESTERN LOW DUBLIN 12.6 SAFFORD 9.5 TERMINAL ISLAND 8.0 MEDIUM HERLONG 8.6 MENDOTA 7.7 PHOENIX 8.8 SHERIDAN 13.7 HIGH ATWATER 5.4 COMPLEX LOMPOC 15.6 TUCSON 5.3 VICTORVILLE 6.8 DETENTION HONOLULU 3.6 LOS ANGELES 5.6 SAN DIEGO 7.1 SEATAC 6.4
*Facility not yet fully activated. **Inmates relocated to other BOP facilities due to damages sustained during a tornado. ***Inmates relocated to other BOP facilities due to damages sustained during a hurricane.

23
Facilities with Inmate-to-Correctional Officer Ratio Over 15:1
As required by the Senate reporting requirement, below is an accounting of institutions with a staffing ratio greater than 15:1 during the third quarter of FY 2020. For all institutions listed below, the BOP continually recruits and is actively hiring throughout the BOP. The BOP has offered a 5% retention incentive to staff eligible to retire in an effort to retain staff. Additionally, the BOP offers recruitment and relocation incentives and has contracted with Accenture to market and brand the BOP in an effort to attract more candidates.
The Federal Prison Camp (FPC) Alderson, West Virginia, a minimum security institution, was staffed at an inmate to correctional officer ratio of 16.1:1.
The Federal Prison Camp (FPC) Bryan, Texas, a minimum security institution, was
staffed at 18.0:1.
The Federal Correctional Institution (FCI) Elkton, Ohio, a low security institution, was staffed at 15.1:1.
The Federal Correctional Complex (FCC), Lompoc, California, a complex with medium
security, low security, and minimum security institutions, was staffed at 15.6:1.
The Federal Prison Camp (FPC) Montgomery (Maxwell AFB), AL, a minimum security institution, was staffed at 16.3:1.