February 21, 2011 - University of Utah
100
February 21, 2011
Transcript of February 21, 2011 - University of Utah
February 21, 2011

©2011 Micron Technology, Inc. | 2February 21, 2011
Safe HarborDuring the course of this meeting, we may make projections or other
forward-looking statements regarding future events or the future financial
performance of the Company and the industry. We wish to caution you that
such statements are predictions and that actual events or results may differ
materially. We refer you to the documents the Company files on a
consolidated basis from time to time with Securities and Exchange
Commission, specifically the Company’s most recent Form 10-K and Form
10-Q. These documents contain and identify important factors that could
cause the actual results for the Company on a consolidated basis to differ
materially from those contained in our projections or forward-looking
statements. These certain factors can be found at
http://www.micron.com/certainfactors. Although we believe that the
expectations reflected in the forward-looking statements are reasonable, we
cannot guarantee future results, levels of activity, performance or
achievements. We are under no duty to update any of the forward-looking
statements after the date of the presentation to conform these statements
to actual results.

©2011 Micron Technology, Inc. All rights reserved. Products are warranted only to meet Micron‟s production data sheet specifications. Information, products, and/or specifications are subject to change without notice. All information is provided on an “AS IS” basis without warranties of any kind. Dates are estimates only. Drawings are not to scale. Micron and the Micron logo are trademarks of Micron Technology, Inc. All other trademarks are the property of their respective owners.
©2011 Micron Technology, Inc. | 3
Steve Appleton
Chairman and CEO
2011 Micron Winter Analyst Conference
February 21, 2011

©2011 Micron Technology, Inc. | 4
Micron Evolution
February 21, 2011
► Decrease in Long Term DRAM Annual Bit Growth to < 50% year
► First Bankruptcy and Liquidation of a DRAM Company in History
► Customer Consolidation in Computing
► Government Subsidized Companies
2005
IMFTAll NOR Resources to NAND
2001
Photobit(Aptina)
2002
Toshiba DRAM
2008
MeiYa / Inotera
2006
FY2006Revenue $5.3BIncome $408ME.P.S. $0.57
Lexar
2010
Numonyx
FY2010Revenue $8.4BIncome $1.85BCash Flow $3.0BE.P.S. $1.85
► Recognized Need for Strategic Shift
► Leverage Technology Expertise
► Pursue Efficient Capital Deployment (cheap assets with scale & partnerships)
► Product Portfolio Expansion

©2011 Micron Technology, Inc. | 5February 21, 2011
33% 34%40%
27%
5%6%
10%
24%
26%26%
20%15%
23% 18%15%
15%
9% 11% 11% 17%
4% 5% 4% 2%
0%
10%
20%
30%
40%
50%
60%
70%
80%
90%
100%
FY08 FY09 FY10 FY11
AIMM
Networking
& Storage
Server
Consumer
Mobile
Personal
Systems
Includes DRAM, NAND, and NOR; NOR does not include purchase accounting adjustments
Application Revenue Diversification

©2011 Micron Technology, Inc. | 6February 21, 2011
Segment Revenue Diversification
77%
65%
54%50%
57%
47%
6%
23%
35%39%
34%
31%
5%
19%
17%12% 11% 11%
4% 3%
0%
20%
40%
60%
80%
100%
FY 2006 FY 2007 FY 2008 FY 2009 FY 2010 FQ1 2011
% o
f M
icro
n T
ota
l R
eve
nu
es
DRAM NAND NOR Imager
©2011 Micron Technology, Inc. | 7
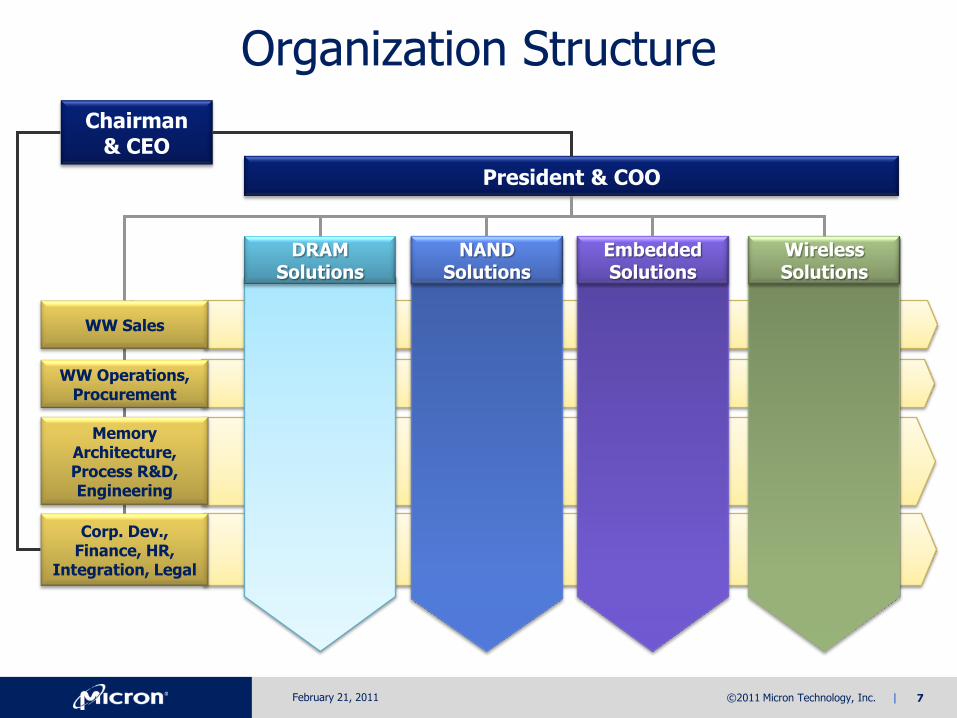
Organization Structure
WW Operations,Procurement
WW Sales
Memory Architecture,Process R&D, Engineering
Chairman& CEO
DRAM Solutions
NAND Solutions
Embedded Solutions
Wireless Solutions
President & COO
Corp. Dev., Finance, HR,
Integration, Legal
February 21, 2011

February 21, 2011

©2011 Micron Technology, Inc. | 9
DRAM Solutions Group
Brian ShirleyVice President
February 21, 2011

©2011 Micron Technology, Inc. | 10
►Cloud computing and virtualization driving need for more cores
►Further drives DRAM density, performance needs, and power concerns
► Intel’s Romley launchin 2H’11
Server
DRAM Solutions Group - DSG
February 21, 2011
►High-end routers running past traditional DRAM limits
►Customer premise equipment market exploding (CPE)
►Exploding demand from Storage market
Networking & Storage
►Visual enhancements are driving increased DRAM needs
►New game console planning underway with unparalleled speed needs
►Speed requirements increasing to 2Gbps +…
Graphics
►PC’s converted to DDR3 and up to 4GB
►Tablets using DDR2 today, soon DDR3 and early DDR4 due to power
►Sandy Bridge integrates GPU on to CPU, pushing up main memory needs
Personal Computing

©2011 Micron Technology, Inc. | 11
►Cloud computing and virtualization driving need for more cores
►Further drives DRAM density, performance needs, and power concerns
► Intel’s Romley launchin 2H’11
Server
DRAM Solutions Group - DSG
February 21, 2011
►High-end routers running past traditional DRAM limits
►Customer premise equipment market exploding (CPE)
►Exploding demand from Storage market
Networking & Storage
►Visual enhancements are driving increased DRAM needs
►New game console planning underway with unparalleled speed needs
►Speed requirements increasing to 2Gbps +…
Graphics
►PC’s converted to DDR3 and up to 4GB
►Tablets using DDR2 today, soon DDR3 and early DDR4 due to power
►Sandy Bridge integrates GPU on to CPU, pushing up main memory needs
Personal Computing
Increasing need for high density, high speed, low power DRAM solutions:
Micron’s DRAM portfolio drives the world’s infrastructure

©2011 Micron Technology, Inc. | 12
2011 Tablet shipments projected to grow 3x
Projected to out-ship desktops by 2014
Utilize a wide range of DRAM
Power is Key for Tablets
Leading in New Applications: Tablets
February 21, 2011
Mil
lio
ns S
yste
ms S
hip
pe
d
Source: Gartner 4Q‟10; Micron Market Research
Tablet Shipment Growth One of the Hottest Items at CES 2011
MB
/S
yste
m
0
600
1,200
1,800
2,400
3,000
0
50
100
150
200
250
2010 2011 2012 2013 2014
Tablet Systems Shipped Tablet Memory Content

©2011 Micron Technology, Inc. | 13
DDR4 introduction expected in 2012
▶ Main interest in power sensitive applications
Key improvements over DDR3
▶ Higher Bandwidth: Up to 3.2 Gbps
▶ Power Consumption: 1.2V drives big improvement
▶ High Density: 128Gb in single-stack, single-load
Ideal Memory for variety of applications
▶ Server ideal due to power & performance benefits
▶ Tablet PC benefit from low voltage
▶ Fast introduction in Notebooks expected
Micron fully committed to DDR4 introduction
▶ Driving JEDEC standardization
▶ Early development of DDR4 with introduction in 1H‟2012
Leading with New Interfaces: DDR4
February 21, 2011
Source: Gartner 4Q‟10
…optimized for power and performance
DDR4 Market Introduction The next major standard
0%
20%
40%
60%
80%
100%
2009 2010 2011 2012 2013 2014
SDR DDR DDR2 DDR3 DDR4
Potential DDR4 Lead Applications
Notebooks
‣Further power saving due to 1.2V
‣Performance increase to address future applications
Tablet PCs
‣Ideal application to use low power features
‣Fast adoption due to variety of controller vendors
Servers
‣Best solution for high density DIMMs
‣Significant power reduction

©2011 Micron Technology, Inc. | 14
Leading with New Technology: 3x nm
• Key features:‣ High speed operation up to 1866 Gbps DDR3 and 2400 Gbps DDR4‣ Fully 1.50V and 1.35V compatible DDR3 and 1.20V on DDR4‣ Technology and circuit design related power improvements for best-in-class power
• First samples available now
Improved Performance, Power-efficiency and Cost
• High-performance 1Gb, 2Gb and 4Gb DDR3 products for broad range of applications across all market segments
• Further power reductions and functionality down to 1.2V
• ~50% more 4Gb chips per wafer versus 42nm
• Enabling standard module densities of up to 64GB
• Lead Technology for DDR4 Introduction
Key Features and Portfolio Roll-out
February 21, 2011

©2011 Micron Technology, Inc. | 15
Leading with New Form Factors: LRDIMM
February 21, 2011
► IT, virtualization, and datacenters need for higher density
► Standard DIMMS limit scaling of capacity and performance
► Micron‟s new LRDIMM technology delivers a high performance, cost effective solution to address today‟s IT system challenges
► Broad Standard and VLP Portfolio
► Module Densities up to 64GB
► Samples available now
512GB 768GB800 Mbps
Roll-out of Portfolio
1333 Mbps
Higher-density modules at improved performance
Roll-out of Portfolio
Fully Populated System
Micron LRDIMMStandard DIMM
Happening Now
50% Higher System Capacity
67% Higher Bandwidth

©2011 Micron Technology, Inc. | 16
Leading with New Products: RLDRAM3
The best low-latency DRAM gets better
• Unprecedented performance for high-end networking
• Comparable to SRAM access time at superior costand density
• Easy transition path from RL2 platforms
• High interest of customers and key enablers
Extended success of RLDRAM2 with RLDRAM3
• Improved performance:
‣ random access time down to 10ns write and 2.5ns read
‣ doubled sustainable bandwidth of 2133 Gbps
‣ power-efficiency and high memory density
• Memory densities of 576Mb and 1.1Gb
• Samples available mid 2011, production in 2H 2011
• 2nd source partner identified
February 21, 2011

©2011 Micron Technology, Inc. | 17
Leading with New Innovations
• Evolutionary DRAM roadmaps hit limitations of bandwidth and power efficiency
• Micron introduces a new class of memory: Hybrid Memory Cube
• Unique combination of DRAMs on Logic smashes through the wall
• How did we do it?► Micron-designed logic controller
► High speed link to CPU
► Massively parallel “Through Silicon Via” connection to DRAM
• Unparalleled performance: ► Up to 20X the bandwidth of a full DDR3 DIMM
► Using a 10th of the power per bit
► Occupying an 8th of the space of an RDIMM
• Targeting high performance computing and networking, eventually migrating into computing and consumer
TSV connections
Revolutionary Approach to Break Through the “Memory Wall”
Key Features and Roll-Out
Full silicon prototypes in siliconTODAY
February 21, 2011

©2011 Micron Technology, Inc. | 18
Hybrid Memory Cube Prototype
18 February 21, 2011

©2011 Micron Technology, Inc. | 19
DRAM Solutions Group
February 21, 2011
► Focus on segments driven by exploding bandwidth and computing needs
► Broad product portfolio focused on optimal solutions across performance, power, and density
► Leadership in next generation solutions, driving enhanced margin opportunities

February 21, 2011

©2011 Micron Technology, Inc. | 21
NAND Solutions Group
Glen HawkVice President
February 21, 2011

©2011 Micron Technology, Inc. | 22
Embedded, AIMM'
PC/Comp (Non-SSD)
Mobile
DSC/VIDEO
USB
MP3/PMP
SSD
Tablets
0%
10%
20%
30%
40%
50%
60%
70%
80%
90%
100%
2007 2008 2009 2010 2011 2012 2013 2014
GB
(M
)
February 21, 2011
Source: Gartner 4Q10; Cards included in Mobile and DSC
2010 – 2014 NAND
Bit CAGR
71%
140%
118%
46%
59%
36%
97%
85%
NAND Market Diversity

©2011 Micron Technology, Inc. | 23
Embedded, AIMM'
PC/Comp (Non-SSD)
Mobile
DSC/VIDEO
USB
MP3/PMP
SSD
Tablets
0%
10%
20%
30%
40%
50%
60%
70%
80%
90%
100%
2007 2008 2009 2010 2011 2012 2013 2014
GB
(M
)
February 21, 2011
Source: Gartner 4Q10; Cards included in Mobile and DSC
Micron‟s Business Units focused on NAND
Wireless Solutions Group
Embedded Solutions Group
NAND Solutions Group
SSDs $2.5B market in 2011 going to $7B+ in 2014
©2011 Micron Technology, Inc. | 24
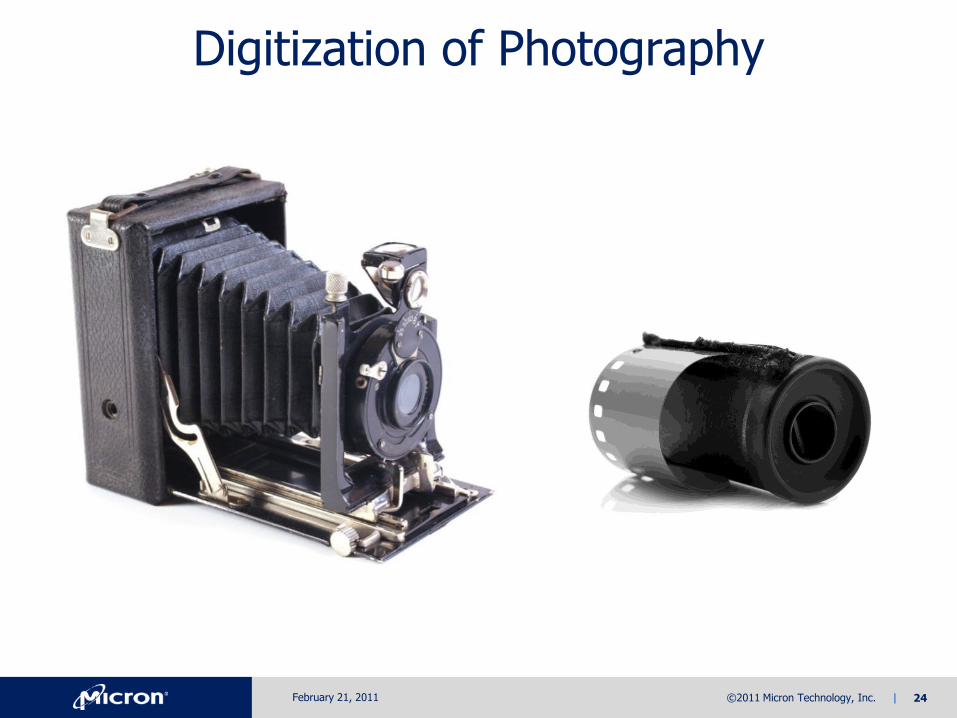
Digitization of Photography
February 21, 2011

©2011 Micron Technology, Inc. | 25
Digitization of Photography
February 21, 2011
©2011 Micron Technology, Inc. | 26
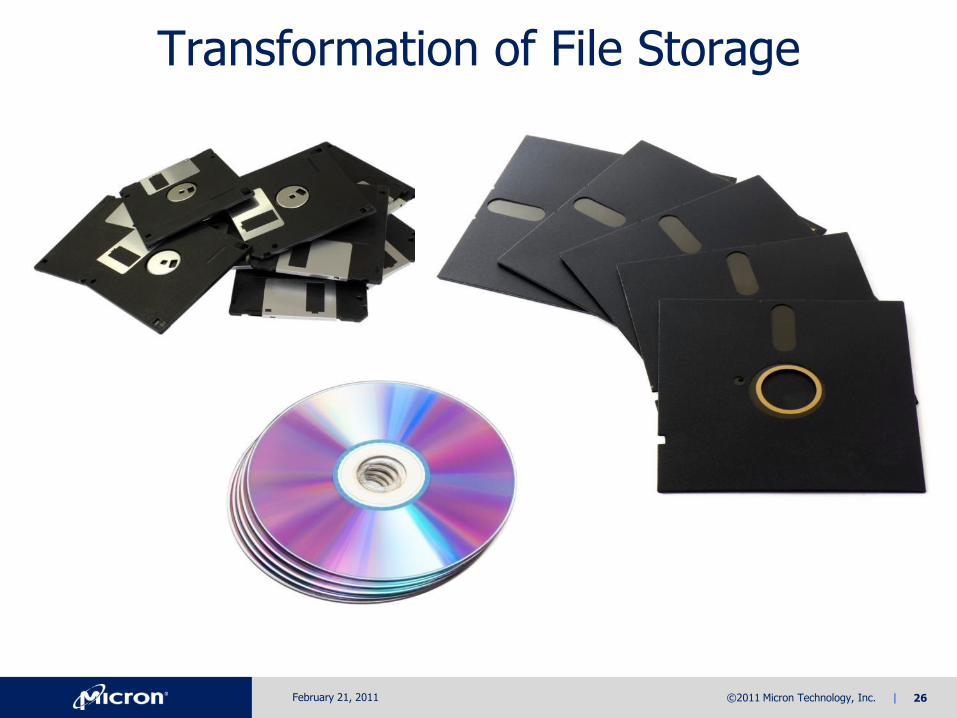
Transformation of File Storage
February 21, 2011

©2011 Micron Technology, Inc. | 27
Transformation of File Storage
February 21, 2011

©2011 Micron Technology, Inc. | 28
Revolution of Music
February 21, 2011

©2011 Micron Technology, Inc. | 29
Revolution of Music
February 21, 2011
©2011 Micron Technology, Inc. | 30
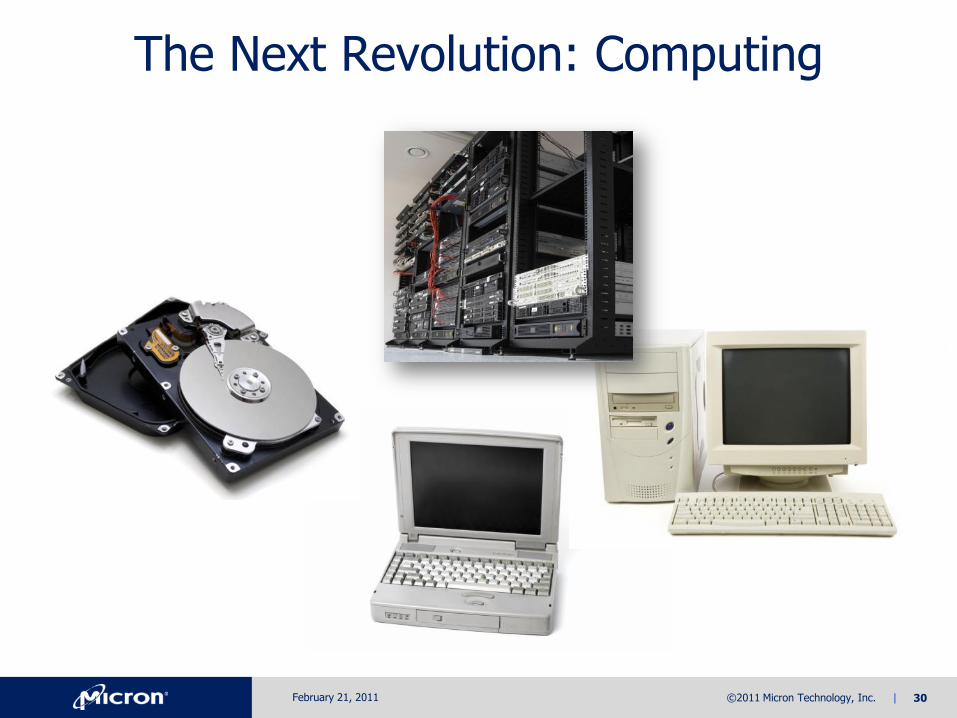
The Next Revolution: Computing
February 21, 2011

©2011 Micron Technology, Inc. | 31
The Next Revolution: Computing
Micron ReadlSSDTM
C400 for ClientP300 for Enterprise
February 21, 2011

©2011 Micron Technology, Inc. | 32
Embedded, AIMM'
PC/Comp (Non-SSD)
Mobile
DSC/VIDEO
USB
MP3/PMP
SSD
Tablets
0.0
20.0
40.0
60.0
80.0
100.0
120.0
2007 2008 2009 2010 2011 2012 2013 2014
GB
(M
)
2010 – 2014 Total NANDBit CAGR:
78%
NAND in New Applications
February 21, 2011
Source: Gartner 4Q10; Cards included in Mobile and DSC
2010 – 2014 NAND
Bit CAGR
71%
140%
118%
46%
59%
36%
97%
85%

©2011 Micron Technology, Inc. | 33
Enterprise Commands Significant ASP Upside
February 21, 2011
0
1,000
2,000
3,000
4,000
5,000
6,000
7,000
8,000
2009 2010 2011 2012 2013 2014
1G
B E
U S
SD
Sh
ipm
en
ts (
M)
Enterprise PC
$0.0
$0.5
$1.0
$1.5
$2.0
$2.5
$3.0
$3.5
2009 2010 2011 2012 2013 2014
SS
D R
eve
nu
e (
$B
)
Enterprise PC
Source: IDC 3Q10
$21.93
$14.76
$8.41
$5.29
$3.32$2.26$2.47
$1.53$1.07 $0.86 $0.63 $0.47
$0
$5
$10
$15
$20
$25
2009 2010 2011 2012 2013 2014
1G
B E
U S
SD
AS
P
Enterprise SSD PC SSD

©2011 Micron Technology, Inc. | 34
10
20
30
40
50
60
C1Q07 C1Q08 C1Q09 C1Q10
Pro
ce
ss N
od
e (
nm
)
Volume Production Dates
Company A Micron Company B Company C
3x nm
5x nm
2x nm
Data based on publically available information
NAND Silicon Leadership
February 21, 2011

©2011 Micron Technology, Inc. | 35
NAND System Solution Leadership
Enterprise SSD Accolades – P300Client SSD Accolades – C300/C400
“All in all, the P300 deserves a strong look when trying to improve server performance.”
“…delivering 44,000 IOPS for random reads and 16,000 IOPS for random writes to target demanding enterprise applications.”
“…enterprise SSD suppliers lacking a fab partnership, who buy flash chips on the general market, may be at a disadvantage…”
“Dubbed RealSSD P300, this new series comes out of the gates with SATA 6Gbps support -- a first ever for the enterprise market…”
“Memory & Storage: Micron Technology C300 and P300 solid-state drives.”
February 21, 2011

©2011 Micron Technology, Inc. | 36
Enterprise HDD and SSD Revenue
February 21, 2011
Sources: iSuppli 4Q10; IDC 3Q10; Micron Market Research
$0.05
$0.16
$0.39
$0.49
$0.00
$0.35
$0.70
$2.00
$6.00
2009 2010 2014
En
terp
rise
Re
ve
nu
e (
$B
)
$4.80$2.5 - $3.1
$5.13
$6.08
$5.2 $5.8
$8.0-9.0
Enterprise SSD (NAND Producers) Enterprise SSD (3rd Parties) Enterprise HDD
©2011 Micron Technology, Inc. | 37
NAND Solutions Group
February 21, 2011
► Business unit dedicated to the rapidly growing NAND data storage market
► Exploiting technology leadership, from Silicon to Systems
► Targeting incremental margin opportunities in premium segments, as a complete storage system provider

February 21, 2011

©2011 Micron Technology, Inc. | 39February 21, 2011
Wireless Solutions Group
Mario LicciardelloVice President

©2011 Micron Technology, Inc. | 40
Market Dynamics
February 21, 2011
Segmentation Technology Trends
SmartPhone & Premium ASP >$150 Growth accelerator for both NAND and DRAM (LPDDR1LPDDR2)
Entry ASP < 150$High Volume, long term market for NOR/PSRAM & Growth Driver for PCM & Low Density LPDDR2
Source: iSuppli 4Q10; Flash memory forecast 2012 and beyond and DRAM forecast from Micron WSG Q4 2010
0
200
400
600
800
1,000
1,200
2009 2010 2011 2012 2013 2014
Un
its (
M)
Smart Phone Non Smart Phone
0
200
400
600
800
1,000
1,200
1,400
1,600
1,800
Fla
sh
DR
AM
Fla
sh
DR
AM
Fla
sh
DR
AM
Fla
sh
DR
AM
Fla
sh
DR
AM
Fla
sh
DR
AM
2009 2010 2011 2012 2013 2014
Un
its (
M)
NOR PCM NAND mDRAM pSRAM

©2011 Micron Technology, Inc. | 41
Mobile Memory Market
Source: Isuppli Q4 2010
Source: iSuppli, 4Q10
11$B
6$B
2$B1$B
NAND
NOR
pSRAM
mDRAM
$0.0
$2.0
$4.0
$6.0
$8.0
$10.0
$12.0
$14.0
$16.0
$18.0
$20.0
2009 2010 2011 2012
Mo
bil
e M
em
ory
Re
ve
nu
e (
$B
) DRAM Market sustained
LPDDR1 LPDDR2 LPDDR3 / Wide I/O
Density Growth per Handset 128Mb8Gb
NAND Market strong growth
Density (GB) growing faster than litho migration
NOR + PCM Market stable
PCM compensating NOR Market erosion starting early 2012
PSRAM Market declining
Strongly associated to low Density NOR
PSRAMLPDDR
February 21, 2011

©2011 Micron Technology, Inc. | 42
• Micron memory present in more than
550 million phones in 2010
• Key memory supplier of all top leading phone manufacturers
• Well positioned to capitalize on SmartPhone market growth
• Full range of optimized Memory Solutions
• Driving and committed to next generation standards
Leading Wireless Memory Supplier
February 21, 2011

©2011 Micron Technology, Inc. | 43
Micron Addresses All Mobile Market Sub-Segments
February 21, 2011
Smart PhonesEntry / Connectivity Media Tablet
• NOR+ PSRAM MCP
• NOR +LPDDR MCP
• OneNAND + LPDDR MCP
• NAND + LPDDR MCP
• PCM+LPDDR2MCP*
• NAND + LP DDR MCP
• e.MMC + LP DDR2 MCP
• e.MMC Discrete
• LP DDR1/LP DDR2 PoP
• LP DDR3*
• Wide I/O*
• e.MMC Discrete
• LP DDR1
• LP DDR2
• LP DDR3*
• Wide I/O*
*In Design and/or Development

©2011 Micron Technology, Inc. | 44
Industry‟s Most Advanced Mobile Memory Solutions
1Gb 2Gb 256Mb 1Gb 512MB - 2GB (SLC)
Mobile DRAM DiscreteLPDDR1 or LPDDR2
(POP)
e.MMC 4.41 Discrete(BGA)
e.MMC4.41 + LPDDR1/2
SLC NAND + LPDDR1/2
34 / 25 nmNAND (SLC)
50 / 42 nmMobile DRAM
(LPDDR1 or LPDDR2)
25 nme.MMC4.41
NAND MCP
Packaging Options
32 Mb 256Mb 16Mb 128Mb PSRAM
65 / 45 nmNOR
65 / 45 nmNOR
50 nm
Mobile RAM
NOR + PSRAM
NOR MCP
Packaging Options
128Mb 512Mb LPDDR NOR + LPDDR512 Mb 1Gb
2Gb 4Gb4Gb 16Gb 4GB - 32GB (MLC)
February 21, 2011
©2011 Micron Technology, Inc. | 45
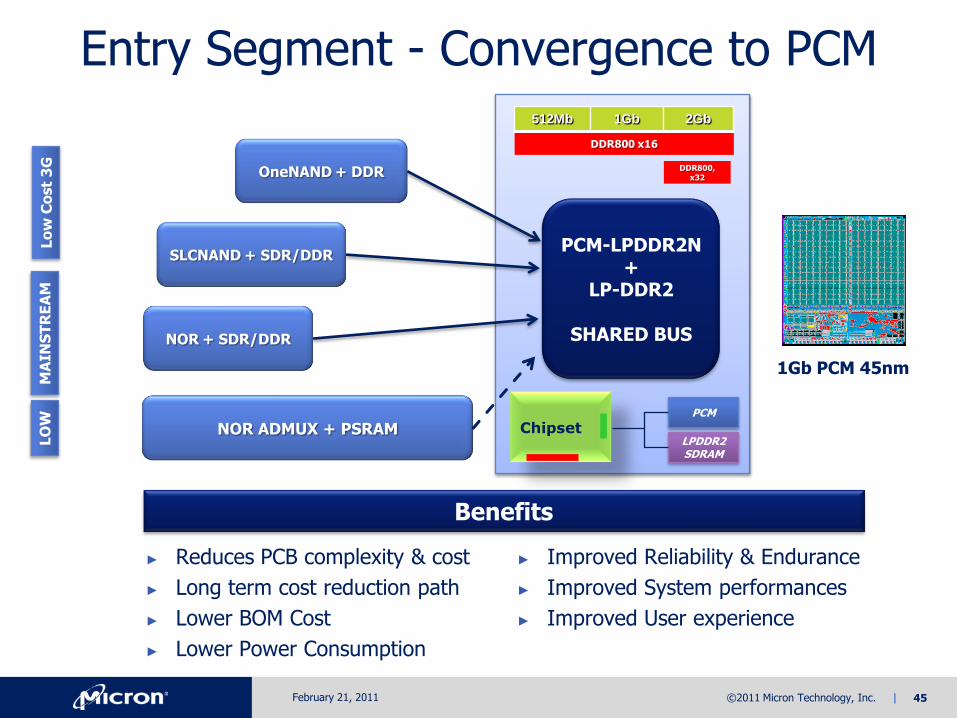
► Reduces PCB complexity & cost
► Long term cost reduction path
► Lower BOM Cost
► Lower Power Consumption
Entry Segment - Convergence to PCM
ChipsetPCM
LPDDR2SDRAM
NOR ADMUX + PSRAM
LO
WM
AIN
ST
RE
AM
Lo
w C
ost
3G
NOR + SDR/DDR
SLCNAND + SDR/DDR
OneNAND + DDR
DDR800 x16
DDR800, x32
512Mb 1Gb 2Gb
► Improved Reliability & Endurance
► Improved System performances
► Improved User experience
PCM-LPDDR2N+
LP-DDR2
SHARED BUS
1Gb PCM 45nm
Benefits
February 21, 2011

©2011 Micron Technology, Inc. | 46
Smart Phone‟s Dependence on NAND Leverages Micron‟s Strengths
Category / 2011 needs
Density
Raw NAND LP-DRAM e.MMC
High-end Smartphone 4-16Gb 4Gb+ 16-64GB
Low-end Smartphone 4Gb 2Gb 4-16GB
Feature Phone 1-2Gb 512-1Gb 2-8GB
February 21, 2011

©2011 Micron Technology, Inc. | 47
• Strong Market Reaction
▶ Expected 57Mu Tablet in „11, > 100Mu expected in 2012
• Total Convergence between Computing & Consumer in Mobile Environment
▶ Connectivity & Mobility are the Key success factors
Tablets, the Next Major Opportunity
• Mobile BOM fully supported by Micron‟s Memory Portfolio:
▶ LPDDR1/2: 4Gb+ LPDDR3 , Wide I/O
▶ e.MMC: 32GB+ UFS
▶ System Memory for 3G+ modem NAND / NOR PCM
0
100
200
300
400
500
600
700
800
900
PC
Wir
ele
ss
PC
Wir
ele
ss
PC
Wir
ele
ss
PC
Wir
ele
ss
PC
Wir
ele
ss
PC
Wir
ele
ss
PC
Wir
ele
ss
2008 2009 2010 2011 2012 2013 2014
Un
it S
hip
me
nts
(M
)
Desktop PC Mobile PC Smartphone Tablet
Source: iSuppli, 4Q10
February 21, 2011

©2011 Micron Technology, Inc. | 48
Wireless Solutions Group
February 21, 2011
►Industry‟s broadest portfolio of DRAM, NAND, and NOR products to address the wireless market
►Targeting growth and market share opportunities in smart phones and tablets
►Focusing on technology leadership, customer satisfaction, and execution excellence for margin optimization across the spectrum of wireless markets

February 21, 2011

©2011 Micron Technology, Inc. | 50
Embedded Solutions Group
Tom EbyVice President
February 21, 2011

©2011 Micron Technology, Inc. | 51
The Embedded Memory Market
Sources: iSuppli, Micron Market Research
Technology Diversity
Customer Diversity
2011
$9.5B Opportunity
*IMM: Industrial, Medical, Mil/Aero
Segment Diversity
ConsumerNetworking
IMM*
Automotive
PC (NOR)
DRAM NAND
NOR
3000+ Customers
Top 50 Customers
February 21, 2011

©2011 Micron Technology, Inc. | 52
Need for Leading Edge Technology AND Longevity
ESG Outlook
Normalized to 300mm wafers
Ramp Next Node
Leading Edge ProductsInitial Ramp• DSG: PC • NSG: Storage, Removable, PMP
Mainstream Products• ESG: Consumer, PC • DSG: Server, Networking• NSG: Storage, SSD• WSG: Smart Phones
Legacy ProductsLong Lifecycles• ESG: Automotive, IMM, Networking
2011 2012 2013
Micron estimates
K W
afe
rs
Leading Lithos
Legacy Lithos
February 21, 2011

©2011 Micron Technology, Inc. | 53
Micron‟s Competitive Advantage inthe Embedded Markets
February 21, 2011
Competitor Ranking
Product Line Breadth
Segment Focus
Leading Edge Technology
Longevity
Cost

©2011 Micron Technology, Inc. | 54
Embedded Applications
February 21, 2011
$0
$1,300
2011 2012 2013
$M
Infotainment Other Automotive Segments
$0
$2,500
2011 2012 2013
$M
Medical Mil/Aero Industrial
Networking: Wireless Data Drives Bit Growth Consumer: Explosive NAND/DRAM Bit Growth
Automotive: Infotainment Drives Growth IMM: $2B Market, New Focus for Micron
0
90
2011 2012 2013
Mil
lio
ns o
f M
B
DRAM NAND NOR
Sources: iSuppli, Infonetics, Micron Market Research
0
1,600
2011 2012 2013
Mil
lio
ns o
f M
B
NAND DRAM NOR

©2011 Micron Technology, Inc. | 55
Micron‟s Strategy to Win in Embedded
February 21, 2011
Product Breadth

©2011 Micron Technology, Inc. | 56
Micron‟s Strategy to Win in Embedded
February 21, 2011
Technology Leadership

©2011 Micron Technology, Inc. | 57
Micron‟s Strategy to Win in Embedded
Stability
February 21, 2011

©2011 Micron Technology, Inc. | 58
Micron‟s Strategy to Win in Embedded
February 21, 2011
Trusted Memory Advisor

©2011 Micron Technology, Inc. | 59
Embedded Solutions Group
February 21, 2011
► Targeting growth opportunities in this high-margin segment addressing a large and diverse customer base
► Broad product portfolio and technology leadership across DRAM, NAND, and NOR
► Strong customer support capabilities with supply stability and world-class service for direct and indirect sales

February 21, 2011

©2011 Micron Technology, Inc. | 61
Efficient Operating Model
Mark DurcanPresident and COO
February 21, 2011

©2011 Micron Technology, Inc. | 62
Organization Structure
Chairman& CEO
DRAM Solutions
NAND Solutions
Embedded Solutions
Wireless Solutions
President & COO
Corp. Dev., Finance, HR,
Integration, Legal
February 21, 2011
WW Operations,Procurement
WW Sales
Memory Architecture,Process R&D, Engineering

©2011 Micron Technology, Inc. | 63
Efficient and Effective Partnerships
MP MASK
February 21, 2011

©2011 Micron Technology, Inc. | 64
Global Scale, Resources, and Capital
February 21, 2011
Idaho
Utah
Texas
Minnesota
Virginia
Puerto Rico
Scotland
England Switzerland
Italy
Singapore
India
China
Taiwan
S. Korea
Japan
China
Idaho Utah Virginia Puerto Rico Italy Singapore Japan
Taiwan
ColoradoCalifornia
Israel
Malaysia
Israel Singapore MalaysiaItalyCalifornia
Philippines

©2011 Micron Technology, Inc. | 65
IM Flash Singapore
February 21, 2011

©2011 Micron Technology, Inc. | 66
20 nm
25 nm
-
20,000
40,000
60,000
80,000
100,000
120,000
Wa
fer
Ou
ts
Pe
r M
on
th (
30
0m
m E
U)
Additional capacity is dependant on market
conditions
Today 1Q ‘11
IM Flash Singapore Update
Source: Micron LPI WW02
2010 2012
February 21, 2011

©2011 Micron Technology, Inc. | 67
25nm NAND Prime Die Wafer MapIMFS 97% Yield 25nm Wafer
February 21, 2011

©2011 Micron Technology, Inc. | 68
2x nm
3x nm
42 nm
50 nm
Trench
-
20,000
40,000
60,000
80,000
100,000
120,000
140,000
Wa
fer
Sta
rt P
er
Mo
nth
Today 1Q11
Inotera Update
Source: Company Data
2010 2012
February 21, 2011

©2011 Micron Technology, Inc. | 69
Manassas Fab
February 21, 2011

©2011 Micron Technology, Inc. | 70
MTV Capacity
3x nm (DRAM)
50 nm (DRAM)
70 nm (DRAM)
20 nm (NAND)25 nm (NAND)
34 nm (NAND)
-
10,000
20,000
30,000
40,000
50,000
60,000
70,000
80,000
Wa
fer
Ou
ts P
er
Mo
nth
(3
00
mm
EU
)
Today 1Q ‘11
2010 2012
200mm includes DRAM and NOR 200mm Capacity
February 21, 2011

©2011 Micron Technology, Inc. | 71
200mm
IMFT
MTV
TECH
Inotera
IMFS
IMFS (based on market)
-
50,000
100,000
150,000
200,000
250,000
300,000
350,000
400,000
450,000
Wa
fer
Ou
ts P
er
Mo
nth
(3
00
mm
EU
)
Today 1Q ’11
Micron Fab Capacity
February 21, 2011
2010 2012
200mm includes DRAM and NOR 200mm Capacity
©2011 Micron Technology, Inc. | 72
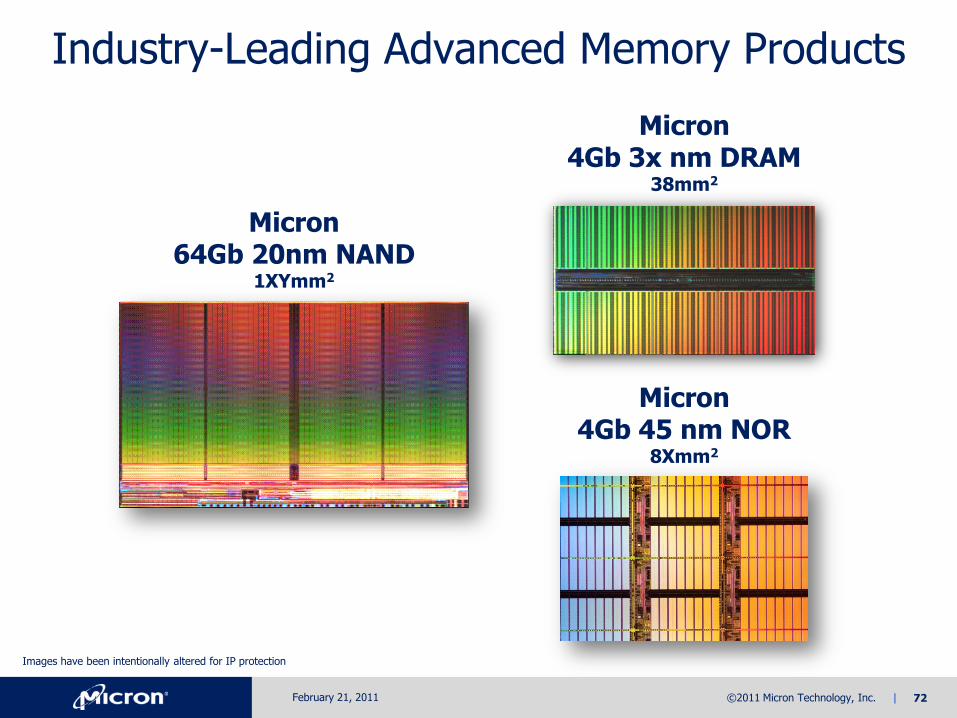
Industry-Leading Advanced Memory Products
February 21, 2011
Images have been intentionally altered for IP protection
Micron 4Gb 3x nm DRAM
38mm2
Micron 64Gb 20nm NAND
1XYmm2
Micron 4Gb 45 nm NOR
8Xmm2

©2011 Micron Technology, Inc. | 73
Emerging Memory Strategy
February 21, 2011
• A very large number of emerging memory technologies with different strengths (table below)
• Careful evaluation, strategic partnerships, and internal evaluations to achieve successful positioning
NAND PCM PCMS MVO CBRAM STT-RAM FeRAM MRAM Molecular
DataRetention
Bit Density(Cost)
Endurance
PowerPer Bit
Manufac-turability
Low Medium High Extreme
RISK

©2011 Micron Technology, Inc. | 74
Micron Global Sales Channels
OEM DistributionRetail
MicronSales Channels
E-commerce
• Optimized to support four business units
• Support diverse and differentiated businesses
• Covering the full spectrum of available sales channels
February 21, 2011
©2011 Micron Technology, Inc. | 75
Operations
February 21, 2011
► Scaling and technology development through partnerships
► Cost reduction runway
► Advanced technology leadership
► Sales channels optimized to support diverse and differentiated businesses

February 21, 2011

©2011 Micron Technology, Inc. | 77
Financial Strengthand Leverage
Ron FosterCFO
February 21, 2011
©2011 Micron Technology, Inc. | 78
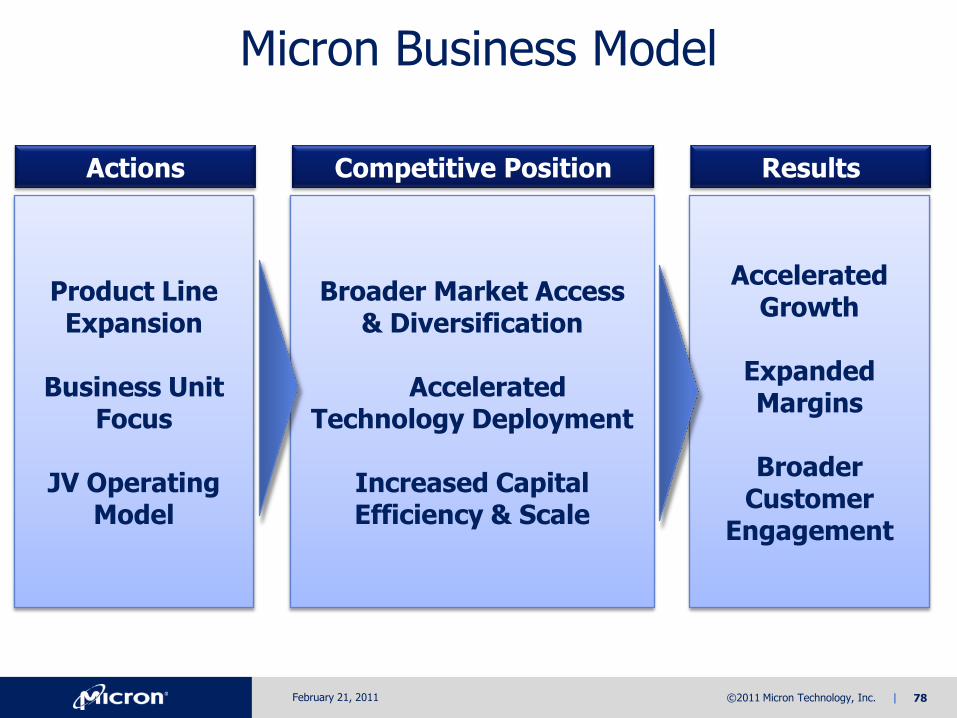
Product Line Expansion
Business Unit Focus
JV Operating Model
Broader Market Access & Diversification
Accelerated Technology Deployment
Increased Capital Efficiency & Scale
Accelerated Growth
Expanded Margins
Broader Customer
Engagement
Actions Competitive Position Results
Micron Business Model
February 21, 2011

©2011 Micron Technology, Inc. | 79
Micron‟s Business Unit Structure
February 21, 2011
EmbeddedSolutions
Group
DRAM Solutions
Group
WirelessSolutions
Group
NAND Solutions
Group
DRAM only
High-volumeDRAM sold to:
• PC
• ConsumerElectronics
• Networking
• Server
DRAM, NAND, NOR
Sold to:
• Automotive
• Industrial
• Networking
• Server
NOR, NAND to:• Consumer
Electronics
• Networking
• PC, Server
NAND only
High-volume NAND sold to:
• Data Storage
• Personal Music Players
• Foundry salesto Intel (IMFT)
DRAM, NAND, NOR
Sold to:
• Mobile
Business Units by Market

©2011 Micron Technology, Inc. | 80
FQ1‟11 by Business Unit
February 21, 2011
40%
22%
23%
12%
3%
Revenue
(Estimate)

©2011 Micron Technology, Inc. | 81
Manufacturing and Technology JVs
February 21, 2011
OwnershipOutput Share
Output Share
NAND Micron Micron Intel
51% 51% 49%
78%2 78%1 22%1
DRAM Micron Micron Nanya
30% 50%3 50%
1 With delay of 12 months following change in ownership 2As of December 2010 3Not tied to Ownership

©2011 Micron Technology, Inc. | 82February 21, 2011
Joint Venture StrategyLeverage through Scale and Shared Investment
* DRAM partner funding includes $84M for royalties and other R&D services recorded as 2010 revenue
$624M
$104M
$135M
DRAM Partner Funding*
NAND Partner Funding
Micron R&D
R&D 2010

©2011 Micron Technology, Inc. | 83
Micron87%
Canon10%
HP3%
TECH Buyout
Micron100%
Small Impact to P&L (Minority Interest)
Q1 ‘10 Q2 ‘10 Q3 ‘10 Q4 ‘10 2010 Q1 ‘11
$(2) $14 $21 $17 $50 $17
February 21, 2011
Balance Sheet Impact
Assets Equity
Cash $(159)
Non-controlling Interest $224
Additional Paid in Capital $(65)
Total $M $(159) $159

©2011 Micron Technology, Inc. | 84
15%
35%
42%
56% 57%
60%
66%
82%
0%
10%
20%
30%
40%
50%
60%
70%
80%
90%
MicronFQ1-11
WinbondCQ4-10
HynixCQ4-10
ElpidaCQ4-10
InoteraCQ4-10
PowerchipCQ3-10
NanyaCQ3-10
ProMOSCQ3-10
De
bt
to C
ap
ita
lDebt to Capital Ratio
(Most Recent Quarter)Debt to Capital = (LT Debt + Current Portion of LT Debt + ST Borrowings) / (LT Debt + Current Portion of LT Debt + ST Borrowings + Balance Sheet Equity + Minority Interest)
Source: Company Data, Micron Market Research
February 21, 2011

©2011 Micron Technology, Inc. | 85
$595
-$510
-$1,771 -$1,825 -$1,856
-$2,077
-$3,190 -$3,215
-$3,500
-$3,000
-$2,500
-$2,000
-$1,500
-$1,000
-$500
$0
$500
$1,000
MicronFQ1-11
WinbondCQ4-10
PowerchipCQ3-10
ProMOSCQ3-10
NanyaCQ3-10
InoteraCQ4-10
ElpidaCQ4-10
HynixCQ4-10
Mil
lio
ns o
f U
S$
Net Cash Position(Most Recent Quarter)
Source: Company Data, Micron Market Research
Net Cash = Gross Cash - (Long-term Debt + Short-term Borrowings + Current Portion of LT Debt)
February 21, 2011

©2011 Micron Technology, Inc. | 86
5.2x
1.3x
0.9x
0.6x
0.3x 0.2x 0.2x 0.1x0.0x
1.0x
2.0x
3.0x
4.0x
5.0x
6.0x
MicronFQ1-11
ElpidaCQ4-10
HynixCQ4-10
WinbondCQ3-10
InoteraCQ4-10
NanyaCQ3-10
PowerchipCQ3-10
ProMOSCQ3-10
Ca
sh
to
Sh
ort
-te
rm D
eb
tCash to Short-Term Debt
(Most Recent Quarter)
Source: Company Data, Micron Market Research
Cash to ST Debt = Cash / (Short-term Borrowings + Current Portion of LT Debt)
Note: Short-term debt includes lease obligations
February 21, 2011

©2011 Micron Technology, Inc. | 87
Revenue by GeographyMicron FY‟10 Sales Revenue
EuropeAsia1 Americas2
Source: Micron Technology, Inc. 2010 Form 10-K1 – Asia includes China, Asia Pacific, Malaysia, and Taiwan2 – Americas includes United States and Other
February 21, 2011

©2011 Micron Technology, Inc. | 88
Micron‟s Total Wafer Production by Geography
February 21, 2011
00%
00%
00%
00%
Americas37%
Europe3%Japan
4%
Asia/Pac56%
CY2012FCY2008

©2011 Micron Technology, Inc. | 89
FY2011 CapEx Guidance
February 21, 2011
DRAM
NAND
NOR&
Other
$2.4B - $2.9B

©2011 Micron Technology, Inc. | 90
Financial Strength and Leverage
February 21, 2011
► Cost and growth leverage with partnership models and increasingly low-cost manufacturing base
► Capital deployment focused on high growth NAND market with positive P&L implications going forward
► Strong financial position versus competitors

February 21, 2011

©2011 Micron Technology, Inc. | 92
Memory Leadership
Steve Appleton
Chairman and CEO
February 21, 2011

©2011 Micron Technology, Inc. | 93
DRAM vs NAND Market Development
February 21, 2011
Source: Gartner 4Q10
$0
$5
$10
$15
$20
$25
$30
1 2 3 4 5 6 7 8 9 10 11 12 13 14
$B
Year
DRAM Revenue: 1981-1994 NAND Revenue: 1998-2011E

©2011 Micron Technology, Inc. | 94February 21, 2011
Memory Industry CapEx
3,870
7,730
15,862
18,877
12,962
6,583 6,229
11,486
6,533
4,3686,066
11,527 11,669
16,395
21,843
11,752
5,351
13,332
9,970
696
5,371
8,707
11,783
7,177
2,669
7,111
9,638
632
1,856
2,165
1,950
1,490
317
706 716
$0
$5,000
$10,000
$15,000
$20,000
$25,000
$30,000
$35,000
$40,000
1993 1994 1995 1996 1997 1998 1999 2000 2001 2002 2003 2004 2005 2006 2007 2008 2009 2010 2011
NOR
NAND
DRAM
Mil
lio
ns o
f $
US
Source: Gartner 4Q10

©2011 Micron Technology, Inc. | 95February 21, 2011
Forecasts Point to Technology as the Main DRAM Industry Supply Growth Driver
Sources: Gartner, IDC, iSuppli, Merrill Lynch, and Credit Suisse from 2006-2008; Average of Gartner, IDC, and iSuppli 2009-2010, Micron Forecast, Finance Strategy Group – drivers split
1% 3%
-7% -8%
14%
0%2%
26%
46%
20%
-6%
0%
2%5%
25%
37%
50%
36%
31%49% 41%
52%
87%
63%
22%
46%
50%48%
-30%
-10%
10%
30%
50%
70%
90%
2006 2007 2008 2009 2010 2011 2012
DR
AM
Bit
Su
pp
ly G
row
th
Utilization Capacity Technology Supply Growth

©2011 Micron Technology, Inc. | 96February 21, 2011
Forecasts see Technology as the Main NAND Industry Supply Growth Driver
2% -1% -5% 0% 6% 0% 1%
86%
64%
32%
-4%
8% 12%24%
125%
111%
103%
43%
56%71%
55%
213%
174%
130%
40%
70%
82% 80%
-50%
0%
50%
100%
150%
200%
250%
2006 2007 2008 2009 2010 2011 2012
NA
ND
Bit
Su
pp
ly G
row
th
Utilization Capacity Technology Supply Growth
Sources: Gartner, IDC, iSuppli, Merrill Lynch, and Credit Suisse from 2006-2008; Average of Gartner, IDC, and iSuppli 2009-2012, Finance Strategy Group – drivers split

©2011 Micron Technology, Inc. | 97
1%
1%
2%
2%
3%
4%
10%
11%
16%
17%
35%
0% 10% 20% 30% 40%
Macronix
ProMOS
Winbond
Spansion
Nanya
PSC
Elpida
Toshiba/SanDisk
Micron
Hynix
Samsung
Last Twelve Months Memory Revenue (% of Group Total)
Today‟s Memory Industry
DRAM NAND NOR
Single Memory Developers
DRAM + NAND Developers
ProducersJV Producers
DRAM + NAND + NOR Developers
Note: Micron includes Numonyx revenue and NAND sold to Intel from IM Flash; data from FQ2‟10 – FQ1‟11Competitors data from CQ1‟10 – CQ4‟10Source: Company Data, Micron Market Research Estimates
February 21, 2011

February 21, 2011
©2011 Micron Technology, Inc. | 99
Q&A
February 21, 2011