February 2018 - egcsa.com · Fluoranthene µg/L 0.01 33% 0.01 66 10.4 38% 0.029 0.33 0.142 ......
24
February 2018 Jack Faulk Water Permits Division U.S. Environmental Protection Agency
Transcript of February 2018 - egcsa.com · Fluoranthene µg/L 0.01 33% 0.01 66 10.4 38% 0.029 0.33 0.142 ......

February 2018
Jack FaulkWater Permits DivisionU.S. Environmental Protection Agency
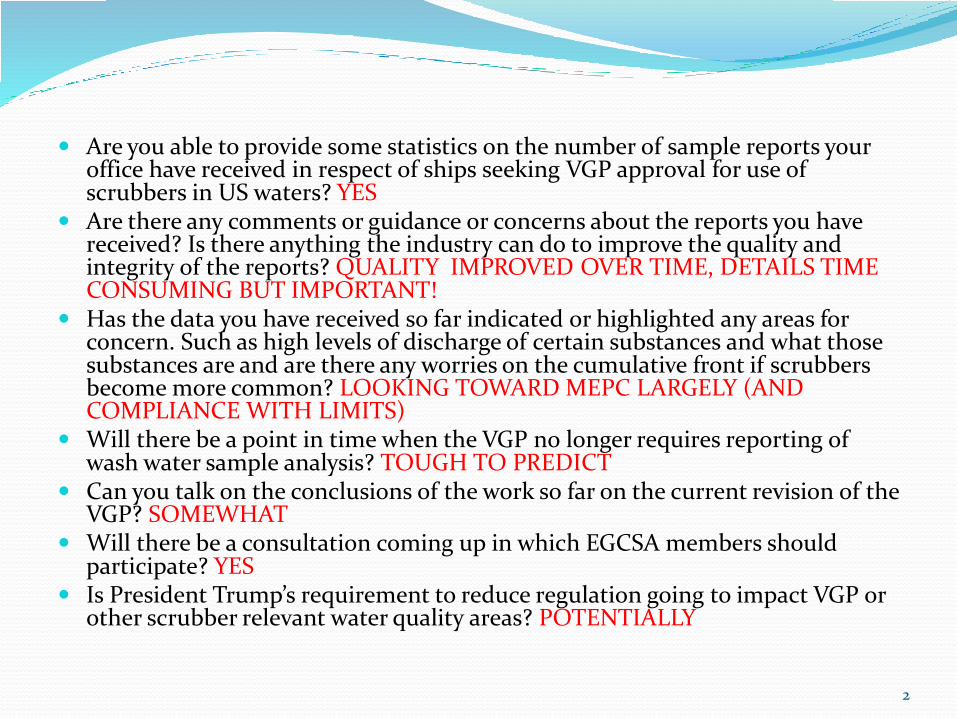
Are you able to provide some statistics on the number of sample reports your office have received in respect of ships seeking VGP approval for use of scrubbers in US waters? YES
Are there any comments or guidance or concerns about the reports you have received? Is there anything the industry can do to improve the quality and integrity of the reports? QUALITY IMPROVED OVER TIME, DETAILS TIME CONSUMING BUT IMPORTANT!
Has the data you have received so far indicated or highlighted any areas for concern. Such as high levels of discharge of certain substances and what those substances are and are there any worries on the cumulative front if scrubbers become more common? LOOKING TOWARD MEPC LARGELY (AND COMPLIANCE WITH LIMITS)
Will there be a point in time when the VGP no longer requires reporting of wash water sample analysis? TOUGH TO PREDICT
Can you talk on the conclusions of the work so far on the current revision of the VGP? SOMEWHAT
Will there be a consultation coming up in which EGCSA members should participate? YES
Is President Trump’s requirement to reduce regulation going to impact VGP or other scrubber relevant water quality areas? POTENTIALLY
2

Background:
History▪ Oct 1972: Clean Water Act became law.
▪ Sep 2006: US District Court revokes EPA regulation that exempts discharges incidental to the normal operation of a vessel (DINOVs) from permitting.
▪ Jul 2008: US Appeals Court (9th Cir) upholds decision.
▪ Dec 2008: EPA finalizes first VGP (5-yr. term) for vessels greater than 79 feet in length.
▪ Dec 2013: Second VGP in effect (thru Dec 2018).
3

▪ EPA – Implement and administer the VGP
▪ USCG – Inspect vessels for compliance with the VGP
▪ EPA – Enforce (and limited inspections for) the VGP
Background:
Implementation and Enforcement
4

Background:
Key 2013 VGP Requirements▪ Permit Coverage
▪ > 300 GT or with capacity to hold or discharge > 8 m3 of ballast water - submit a Notice of Intent (NOI).
▪ Effluent Limitations - numeric and/or best management practices for 27 discharges
▪ Discharge Monitoring for 4 discharge types
▪ Inspections - routine visual and annual
▪ Reporting (electronic) and recordkeeping
▪ Add’l State-specific reqmts. (CWA §401)
5
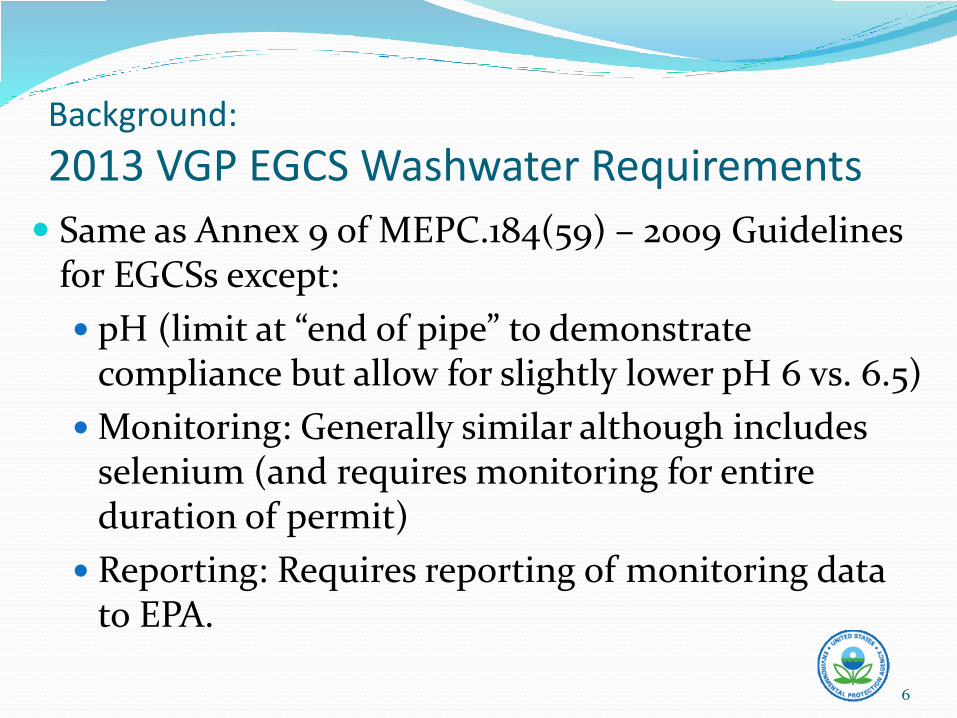
Background:
2013 VGP EGCS Washwater Requirements
Same as Annex 9 of MEPC.184(59) – 2009 Guidelines for EGCSs except:
pH (limit at “end of pipe” to demonstrate compliance but allow for slightly lower pH 6 vs. 6.5)
Monitoring: Generally similar although includes selenium (and requires monitoring for entire duration of permit)
Reporting: Requires reporting of monitoring data to EPA.
6

Statistics:
VGP Annual Report Data (2014-17)
2014 2015 2016 Total Unique 2017*UpdatedTotal*
Annual Reports 42,834 43,323 42,185 TBD
Operated in US Waters 35,383 35,669 34,890 TBD
Operate an EGCS 143 206 256 436 27 492
Discharge Washwater in US 31 66 82 148 13 163
EGCS Washwater Data 1 21 52 59 19 61
7
* Data as of 2/20/18

Statistics:
Vessels Operating in US with EGCS
8
Vessel Type
NumberVessels
w/ EGCS
Discharging EGCS
Washwater
Vessels Monitoring Washwater
Total “Years” Monitoring Washwater
Number Companies
Tanker 279 125 5 6 2
Cruise Ship 83 27 24 37 3
Bulk Carrier 48 7 7 14 2
Container Ship 40 0 0 0 0RORO 5 3 3 5 2
General Cargo Ship 22 14 14 39 1
Other 15 0 0 0 0
* Data as of 2/20/18

EGCS Reporting:
pH Monitoring Continuous pH Monitoring
pH less than 6 ~70% of months monitored
Avg. pH less than 6 ~41% of months (2015), 18% (2016)
Avg. pH less than 5.5 ~24% of months (2015), 9% (2016)
pH Grab Sampling (Analytical Monitoring) 81 samples out of 116 had pH value < 6.0
58 samples < 5.0, 46 samples < 4.0
(Unable to identify length of time below discharge limit and if inlet/outlet diff. < 2.0)
9

EGCS Reporting:
TurbidityContinuous Monitoring 95 out of 120 monitored systems exceeded the limit of 25
NTU/FNU at least one time in a calendar year 21 out of 120 monitored systems exceeded the limit for values
averaged for the month 6 out of 120 systems had the minimum monthly value exceed the
limit
Turbidity Probe at time of Sample Collection 12 out of 395 samples exceeded limit)
(Unable to identify where inlet/outlet difference may be responsible for exceedance - i.e., no inlet monitoring required to be reported)
10

PAH Analytical Monitoring (2015)
11
Inlet Post Scrubber Discharge
Analyte Units
Maximum
Detected
Value
% of
Samples
with Detects
Minimum
Detected
Value
Maximum
Detected
Value
Mean
Detected
Value
% of
Samples
with Detects
Minimum
Detected
Value
Maximum
Detected
Value
Mean
Detected
Value
Acenaphthylene µg/L 0.01 21% 0.008 2 0.303 24% 0.01 0.06 0.0204
Acenaphthene µg/L 0.01 27% 0.039 2.9 0.46 29% 0.02 0.078 0.0592
Anthracene µg/L 0.01 30% 0.003 3.8 0.689 38% 0.01 0.29 0.0713
Benz[a]anthracene µg/L 0.01 27% 0.01 17 3.95 29% 0.01 0.24 0.0543
Benzo[ghi]perylene µg/L 0.01 21% 0.01 4.9 0.831 29% 0.003 0.33 0.114
Benzo[a]pyrene µg/L 0.01 24% 0.01 6.5 0.955 19% 0.004 0.01 0.007
Benzo[b]fluoranthene +
benzo[k]fluoranthene µg/L 0.01 30% 0.01 23.2 3.27 24% 0.009 0.12 0.0316
Chrysene µg/L 0.01 52% 0.02 54 6.74 38% 0.01 0.42 0.114
Dibenz[a,h]anthracene µg/L 0.01 12% 0.01 0.021 0.0155 19% 0.002 0.01 0.006
Fluoranthene µg/L 0.01 33% 0.01 66 10.4 38% 0.029 0.33 0.142
Fluorene µg/L 0.01 79% 0.13 19 2.1 48% 0.06 0.52 0.252
Indeno[1,2,3,c,d]pyrene µg/L 0.01 18% 0.01 3.2 0.643 19% 0.002 0.01 0.006
Naphthalene µg/L 0.03 85% 0.278 11.9 2.93 57% 0.17 1.07 0.49
Phenanthrene µg/L 0.02 100% 0.517 250 23.6 86% 0.24 3.5 1.17
Pyrene µg/L 0.01 45% 0.033 100 22.8 48% 0.025 1.2 0.289

Metals Analytical Monitoring (2015)Inlet Post Scrubber Discharge
Analyte Units
Maximum
Detected
Value
% of
Samples
with Detects
Minimum
Detected
Value
Maximum
Detected
Value
Mean
Detected
Value
% of
Samples
with Detects
Minimum
Detected
Value
Maximum
Detected
Value
Mean
Detected
Value
Arsenic, Total µg/L 64 33% 0.002 1,000 132 16% 0.003 4 1.34
Arsenic, Dissolved µg/L 51 18% 0.002 55 11.5 33% 0.003 55 17.4
Cadmium, Total µg/L 0.5 3% 0.5 0.5 0.5 5% 0.5 0.5 0.5
Cadmium, Dissolved µg/L 0.5 9% 0.05 0.5 0.2 14% 0.05 0.5 0.2
Chromium, Total µg/L 6 21% 0.011 600 161 32% 0.002 15 6.83
Chromium, Dissolved µg/L 6 24% 0.011 30 10.9 33% 0.002 10 4.35
Copper, Total µg/L 247 33% 0.006 1,700 188 42% 0.009 2,310 316
Copper, Dissolved µg/L 114 30% 0.006 32.9 12.3 48% 0.009 118 27.3
Lead, Total µg/L 28 13% 0.001 22 10.8 21% 0.001 12 3.75
Lead, Dissolved µg/L 2.23 21% 0.001 12 3.71 29% 0.001 12 2.67
Nickel, Total µg/L 20 97% 0.041 27,700 2,490 68% 0.053 3,800 1,190
Nickel, Dissolved µg/L 2 91% 0.041 5,300 749 62% 0.053 2,700 953
Selenium, Total µg/L 190 69% 6 218 118 59% 5 193 91.5
Selenium, Dissolved µg/L 197 69% 6 213 119 59% 5 216 118
Thallium, Total µg/L 21 69% 13 231 30.4 59% 12 29 18.1
Thallium, Dissolved µg/L 20 69% 12 109 25.8 59% 11 27 18.6
Vanadium, Total µg/L 5 77% 0.15 57,600 7,070 61% 0.23 10,000 4,630
Vanadium, Dissolved µg/L 5 76% 0.15 20,400 3,210 67% 0.23 8,700 3,090
Zinc, Total µg/L 1,120 40% 0.014 7,000 1,220 39% 0.041 445 127
Zinc, Dissolved µg/L 960 52% 0.014 2,000 307 48% 0.041 170 60.1
12

EGCS Reporting:
Vessel EGCS Basic Information
13

EGCS Reporting:
Vessel EGCS Continuous Monitoring
14

EGCS Reporting:
Vessel EGCS Analytical Monitoring
15

Challenges Compliance expected 100% of time, challenge for
continuous monitoring (calibration, startup and shutdown, change in engine loads, maintenance, and cleaning)
pH limit particularly challenging in certain situations (e.g., where high levels of lower pH ambient fresh water)
Not straight comparison to a numeric limit (e.g., inlet, periodic elevated levels, T/MWh consideration, etc.)
16

Reporting Challenges
A great deal of data must be submitted, with precision of transcribing data critical
Reporting noncompliance in annual reports
Continuous monitoring data reported difficult to assess actual variability, difficult to calculate averages, difficult to assess compliance based on reported data
Flow data not adequately captured in report (e.g., to account for any seawater mixing)
17

Water Quality Concerns:
Evaluating EGCS Discharges Significant increase in systems since 2008 and 2013
Gathering data for future analysis, not a simple evaluation
Considering IMO MEPC efforts
Studies demonstrating environmental impacts and benefits of EGCS are helpful to any future discussions
18

VGP Update:
Development of 2018 VGP
Current VGP expires - December 18, 2018
Publish Draft Permit – Spring 2018?
Public Comment Period ~ 45-60 days
Publish Final Permit – Fall 2018
Permit Effective Date – December 19, 2018
19

VGP Update:
2018 VGP Development Considerations
Existing 2013 VGP/Annual Report Data
2nd Circuit Court Decision (ballast water)
Best Available Technology/Studies
Permit Clarity and Streamlining
Input from Stakeholders
Endangered Species Act Consultation
State Certifications
20

VGP Update:
2018 VGP EGCS Considerations Reference Section 10 (EGCS Washwater) in the 2015
Guidelines for Exhaust Gas Cleaning Systems (the “EGCS Guidelines”) (MEPC.259(68)) with few exceptions: Meet same pH limit as 2013 VGP except as may
otherwise be determined to be best available technology in certain instances.
Allow for limited exceedance of pH limit associated with startup, fuel switchover, equipment calibration, etc.
Continue monitoring EGCS washwater, both to characterize discharge and assess compliance.
Consider appropriate data to submit to EPA.
21

VGP Update:
Draft Legislation (S.168/HR.1154)
Commercial Vessel Incidental Discharge Act (cVIDA/VIDA)
Consolidates ballast water regulations with USCG
Codifies 2013 VGP for all non-ballast water discharges, except state requirements, for at least 2 years until USCG issues new regulations
Exempts permanently small vessels and commercial fishing vessels
Requires states to petition the USCG to impose more stringent requirements or to enforce USCG requirements
22

EPA NPDES VGP Webpagehttps://www.epa.gov/npdes/vessels-vgp
23
Email Support
General VGP:
eReporting:
https://ofmpub.epa.gov/apex/vgpenoi/f?p=vgp:Search
VGP Report Search: