
February 1, 2015 with charts
19
Jeanette Schwarz Young, CFP ® , CMT, M.S. Jordan Young, CMT 83 Highwood Terrace Weehawken, New Jersey 07086 www.OptnQueen.com January 18, 2015 The Option Queen Letter By the Option Royals We are entering a very strange economic condition where most of the central banks in the globe, except the US of course, are making extreme efforts to deflate their currencies and increase liquidity in their markets by printing money. True, the US started this campaign and now has ended it… well so far at least… The termination of QE is causing our currency to gain strength in the global market and, by the way, killing our exports and competitive advantage. This in turn will kill multinationals exports and expose currency risks that are not hedged. Then there is the collapse in crude oil. While this had an immediate positive impact on the average consumers spending power by lowering the price of gasoline, the lasting legacy may be the death of an industry that helped move the US economy out of the depths of recessiion. Crude oil’s decline has already created fallout in Texas, Louisiana and California, just to name three states feeling the cutbacks in the oil industry due to the depressed price of crude. The poor souls who work in the oil patch are losing their jobs and the associated industries that supply their needs are going to shutter their exposure to that industry. Countless manufacturers of industrial equipment, piping and a vast array of other supplies utilized by this industry to will feel the trickle down effects of lower crude prices. We care…..a lot or need to start caring. Do not make light of this. The result is, believe it or not, good for gold and bad for platinum, which today is cheaper than gold. This is a message of recession not growth. As to interest rate hikes in the USA; some members of the FOMC are talking their book by indicating that the FOMC will ratchet interest rates higher by mid-year. Our question to those voting members of the FOMC is: with our currency as strong as it is, can we afford to do that? Remember the lag in the data from the oil- patch slow down hasn’t hit yet. It is also a fact that even with cheaper gasoline the average income earner in the USA is still having trouble staying ahead of bills and costs associated with a reasonable existence. Differences in yields say US vs. German are huge but let us rethink the differences. The five year German Bund yields -0.054% and the five year US Treasury yields 1.155%. Everybody should be buying US Treasury’s and selling the Bund….except for one small detail….the currency differential.
-
Upload
scutify -
Category
Economy & Finance
-
view
747 -
download
2
Transcript of February 1, 2015 with charts
Jeanette Schwarz Young, CFP®, CMT, M.S.
Jordan Young, CMT
83 Highwood Terrace
Weehawken, New Jersey 07086
www.OptnQueen.com
January 18, 2015
The Option Queen Letter
By the Option Royals
We are entering a very strange economic condition where most of the central banks in the globe,
except the US of course, are making extreme efforts to deflate their currencies and increase
liquidity in their markets by printing money. True, the US started this campaign and now has
ended it… well so far at least… The termination of QE is causing our currency to gain strength
in the global market and, by the way, killing our exports and competitive advantage. This in turn
will kill multinationals exports and expose currency risks that are not hedged. Then there is the
collapse in crude oil. While this had an immediate positive impact on the average consumers
spending power by lowering the price of gasoline, the lasting legacy may be the death of an
industry that helped move the US economy out of the depths of recessiion. Crude oil’s decline
has already created fallout in Texas, Louisiana and California, just to name three states feeling
the cutbacks in the oil industry due to the depressed price of crude. The poor souls who work in
the oil patch are losing their jobs and the associated industries that supply their needs are going
to shutter their exposure to that industry. Countless manufacturers of industrial equipment,
piping and a vast array of other supplies utilized by this industry to will feel the trickle down
effects of lower crude prices. We care…..a lot or need to start caring. Do not make light of this.
The result is, believe it or not, good for gold and bad for platinum, which today is cheaper than
gold. This is a message of recession not growth. As to interest rate hikes in the USA; some
members of the FOMC are talking their book by indicating that the FOMC will ratchet interest
rates higher by mid-year. Our question to those voting members of the FOMC is: with our
currency as strong as it is, can we afford to do that? Remember the lag in the data from the oil-
patch slow down hasn’t hit yet. It is also a fact that even with cheaper gasoline the average
income earner in the USA is still having trouble staying ahead of bills and costs associated with a
reasonable existence.
Differences in yields say US vs. German are huge but let us rethink the differences. The five
year German Bund yields -0.054% and the five year US Treasury yields 1.155%. Everybody
should be buying US Treasury’s and selling the Bund….except for one small detail….the
currency differential.
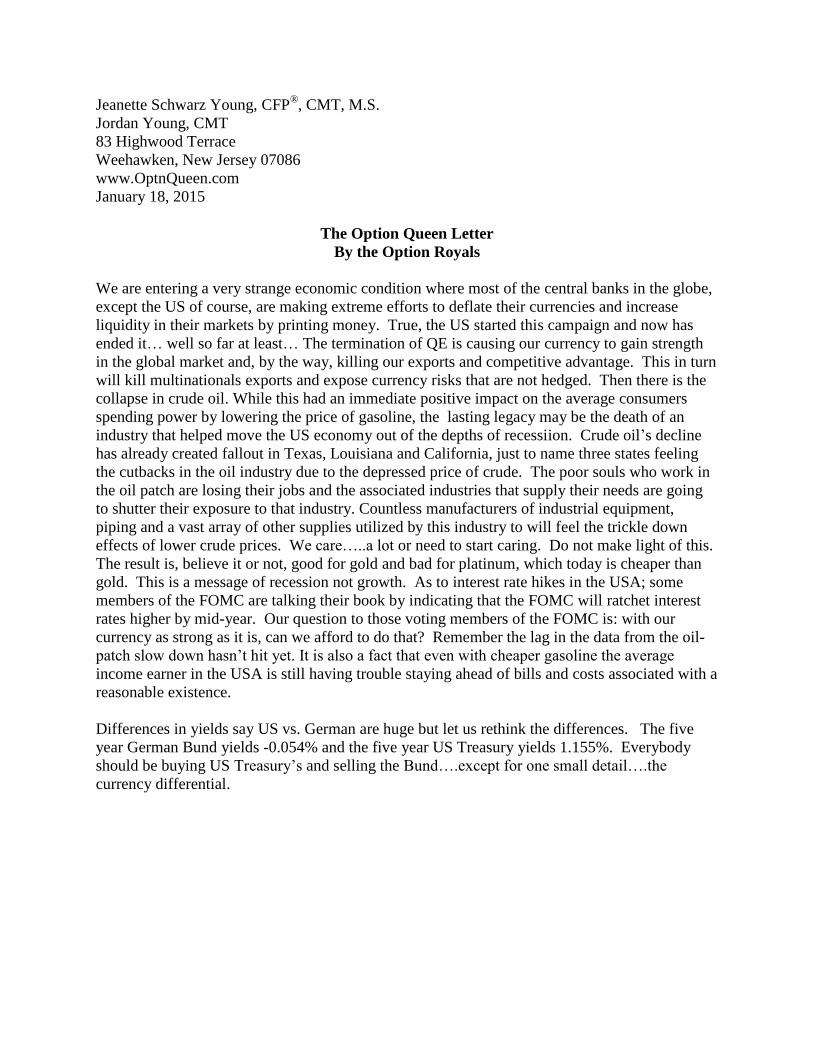
Here is the good news regarding the S&P 500 in the Friday session….it did not expand the range
to the downside and printed a higher low and a slightly higher high than was seen in the previous
session, the bad news is that the market retreated 28.75 handles (points) and closed the session
near the lows. We are inside the Ichimoku Clouds for the daily time-frame but remain above the
clouds for both the weekly and the monthly time-frames. The 5-period exponential moving
average is 2011.44. The top of the Bollinger Band is 2065.75 and the low was seen at 1979.07.
The Bollinger Bands have contracted and it looks as though we will get a violent move out of
that contraction. The market seems to be coiling getting narrower but staying within a trading
range established between December 16, 2014 and December 30, 2014. All the indicators that
we follow herein are issuing a continued sell-signal with more room to the downside. The most
frequently traded price in the Friday session was 2002.50 but the highest volume price was
2001.00 and that was achieved by only a slight margin. The daily 1% by 3-box point and figure
chart has a downside target of 1794.71. The chart looks as though this index is consolidating.
We have both internal upside and downside trendlines. The 60 minute 0.1% by 3-box chart is
more ominous and has a new downtrend line and a downside target of 1953.18. Clearly this
index has overhead supply which could cause some difficulty for the bulls. This is clearly shows
on the charts, no matter which way you look at them. (Supply can be defined as those who
bought the index at higher levels who are looking to “get even” on any resumption to the upside.)


Although the NASDAQ 100 closed down 42.75 in the Friday session there was a failed push to
the upside which left a higher low and a higher high on the chart. All the indicators that we
follow herein continue to point to lower levels. The Bollinger Bands are flattening. The 5-
period exponential moving average is 4177.14. The top of the Bollinger Band is 4284.66 and the
lower edge is seen at 4073.26. We are inside the Ichimoku Clouds for the daily time-frame but
remain above the clouds for both the weekly and the monthly time-frames. This market is in a
trading range of the outlier at 4038.25 and the actually support at 4066 and the resistance of
4286.25 and 4326 and the actual recent high seen in November of 4343.25. Unless we break
decisively above 4286.25 or below 4066, there seems to be little reason to expect to see a
breakout or breakdown. We could remain in this range for an extended time. The most
frequently traded price in the Friday session was 4188; however, the highest volume was seen at
4170. The daily 1% by 3-box point and figure chart shows us that this market is consolidating.
We have internal uptrend lines and the chart looks positive…..well so far. The 60 minute 0.1%
by 3-box tells a different story. The market violated the uptrend line and looks as though it could
push lower in the future.


Although the Russell 2000 is clearly in a downtrend, it stopped at 1160.70 on the downside
which happens to be an old horizontal line. The Russell 2000 made a lower low and a lower

high on the day and lost 27.10 handles (points) for the day. The stochastic indicator and the RSI
are both pointing lower. The 5-period exponential moving average is 1177.97. The top of the
Bollinger Band is 1203.24 and the lower edge is seen at 1148.89. Of all the financial indices that
we follow, this one looks the worst. That said, it should be noted that should the market turn
around and rally, this index will likely outperform the others on the upside. The most frequently
traded price was 1171.50 and the high volume price was 1168.50 accounting for 10.2% of the
day’s volume. Remember the Russell takes no prisoners each handle (point) lost or gained is
$100, which is double that of the S&P 500 so, tread carefully!


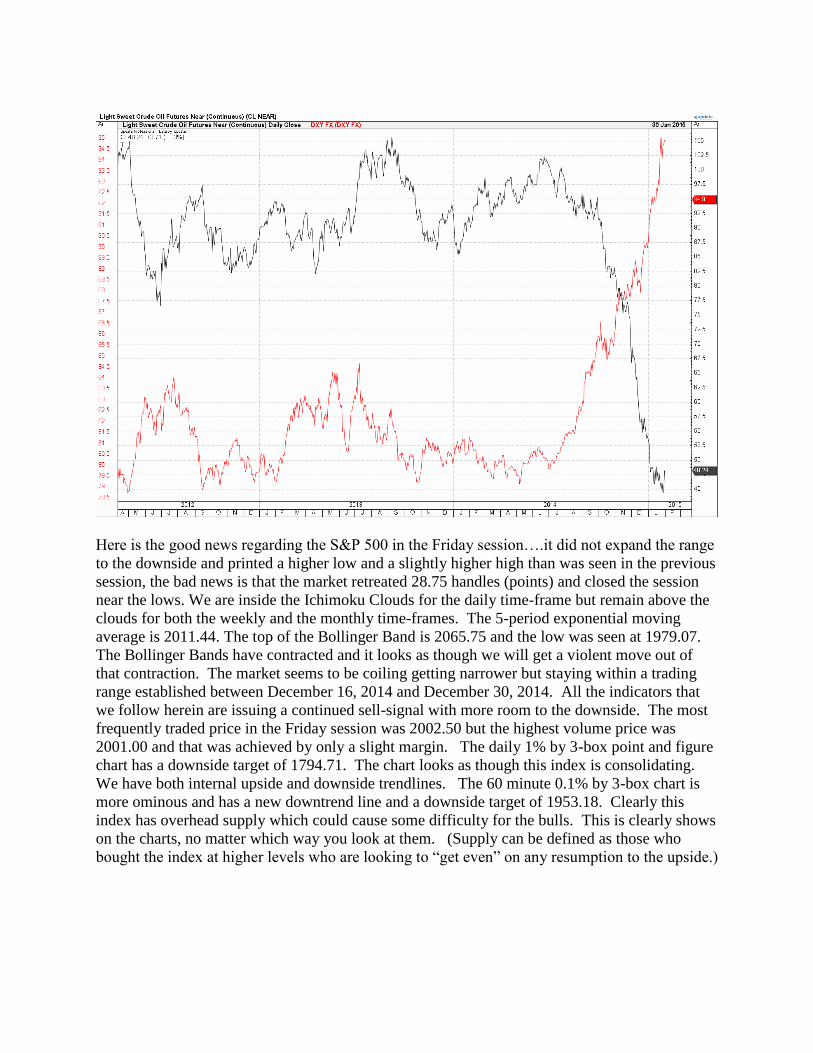
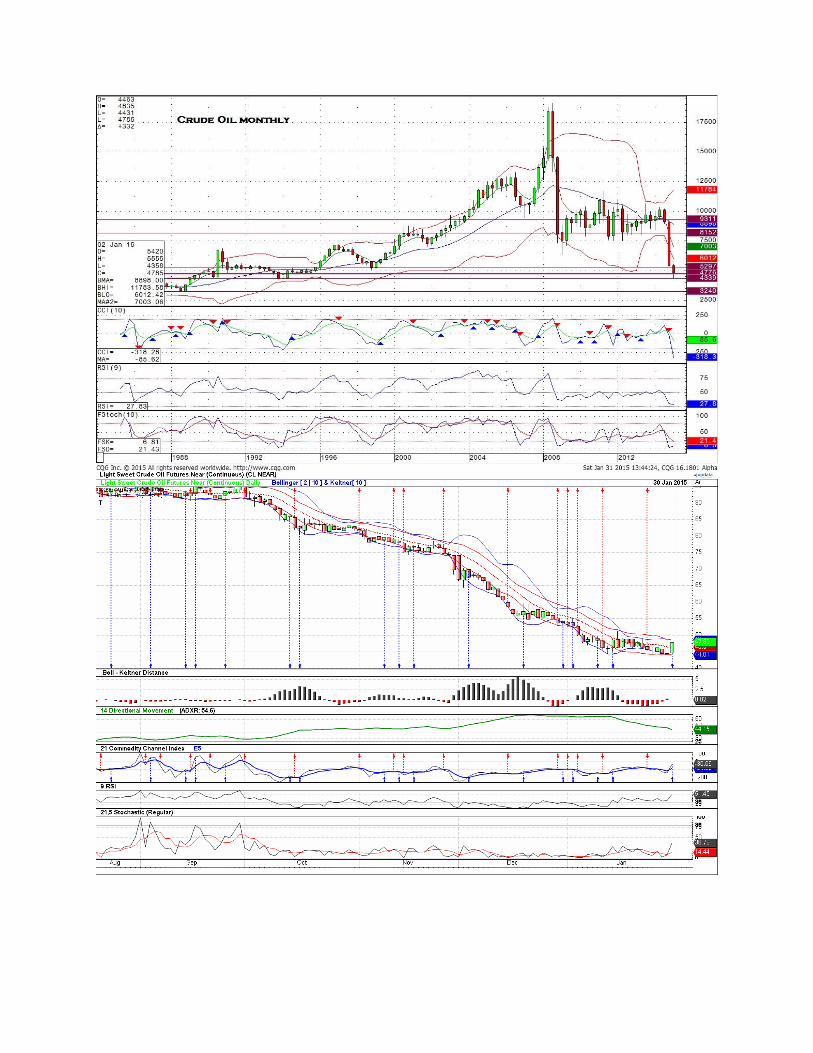
Crude oil rallied 3.32 in the Friday session. Was it an oversold bounce along with portfolio end
of month adjustments or something more serious? We believe that the end of the month and the
lack of follow through on the downside was the stimulus that caused this reaction. Remember
one day does not change a trend and we need at least two days of advances to believe this action
will be more than a “dead cat bounce.” The last two candlesticks on the daily chart are bullish.
On Thursday, we had a doji candlestick and a rejection of a new annual low and then on Friday a
very bullish candlestick expanding the range and closing the day near the highs of the day. The
5-period exponential moving average is 46.05. The top of the Bollinger Band is 51.78 and the
lower edge is seen at 43.22. The Bollinger Bands are contracting at the moment. The most
frequently traded price was 44.40 to 44.60. The market action left a bimodal Market Profile
curve for the day and has some thin prints between the two levels. These levels can be viewed as
fast action levels. The 32.40 level printed in 1988 still looms out there as a definite possible for
a crack to the downside. To find this level, we had to look at a quarterly continuation chart of
crude oil. We are below the Ichimoku Clouds for all time-frames under investigation. Here is a
good one, both the US Dollar Index and crude oil rallied in the Friday session…..that is not the
usual behavior unless we saw portfolios in adjustment and positions closed out in crude. The 60
minute 0.2% by 3-box point and figure chart has an upside target of 52.15. That would be
enough to scare the shorts out of their positions and likely propel the market higher. The daily
1% by 3-box point and figure chart is also positive. The upside target is 57.39. Something tells
us that it wasn’t a reversal of fortunes in crude. We remain skeptical until proven otherwise.


Gold rallied in the Friday session adding 27.80 dollars and closing at 1283.70. Again was this
end of month adjustments or something more serious? The candlestick left on the chart was
inside that printed in the Thursday session. Both the stochastic indicator and the RSI are
pointing higher. Our own indicator has not issued a buy-signal but could do so in the next
session or perhaps two. With central banks uniformly debasing their currencies by printing
money we understand the flight to gold as a currency. Technically, gold remains in a downtrend
with the down trendline at 1287.97. We need to see that number removed as well as the 1309
number which has capped the advance in gold. We are above the Ichimoku Clouds for the daily
time-frame but remain below the clouds for both the weekly and the monthly time-frames. The
5-period exponential moving average is 1279.71. The top of the Bollinger Band is 1326.71 and
the lower edge is seen at 1183.18. The most frequently traded price was 1261.0 but the heaviest
volume was seen at 1264 which accounted for 10% of the day’s volume. The 60 minute 0.2% 3-
box point and figure chart looks good. The 1% by 3-box daily point and figure chart looks pretty
good. We would rather be long than short gold, but to be happier, we need to see a two-day
close above the downtrend line.


After setting a new high the US Dollar index took the remainder of the week to back and fill,
closing the Friday session at 95.05. The 5-period exponential moving average is 94.84, the 20-
period simple moving average is 93.47 and the index is currently above both. The Bollinger
bands have been steady; the upper band is at 95.90 and the lower band is 91.31. Our own
indicator is currently pointing lower as is the RSI. Support continues to lie at 94.40 with 94 flat
acting as the safety net below. Above, the next upside target continues to be 97.36. The 30
minute .05 x 3 point and figure chart really shows how this index has consolidated in the past
week. There are currently two upside targets, 95.55 (which has been activated) and 96.20 (which
is not yet activated). There is one downside target of 93.65. All things being considered, the
index may consolidate a bit more, perhaps moving back towards 94 flat, but, in the end, will
likely continue its move to the upside.

Risk Trading Futures, Options on Futures, and retail off-exchange foreign currency transactions
involves substantial risk of loss and is not suitable for all investors. You should carefully
consider whether trading is suitable for you in light of your circumstances, knowledge, and
financial resources. You may lose all or more of your initial investment.


